Rockaway Beach, OR Map & Demographics
Rockaway Beach Map
Rockaway Beach Overview
$38,434
PER CAPITA INCOME
$70,313
AVG FAMILY INCOME
$47,788
AVG HOUSEHOLD INCOME
30.5%
WAGE / INCOME GAP [ % ]
69.5¢/ $1
WAGE / INCOME GAP [ $ ]
0.54
INEQUALITY / GINI INDEX
1,393
TOTAL POPULATION
666
MALE POPULATION
727
FEMALE POPULATION
91.61
MALES / 100 FEMALES
109.16
FEMALES / 100 MALES
50.0
MEDIAN AGE
3.2
AVG FAMILY SIZE
2.2
AVG HOUSEHOLD SIZE
567
LABOR FORCE [ PEOPLE ]
47.6%
PERCENT IN LABOR FORCE
6.9%
UNEMPLOYMENT RATE
Rockaway Beach Zip Codes
Income in Rockaway Beach
Income Overview in Rockaway Beach
Per Capita Income in Rockaway Beach is $38,434, while median incomes of families and households are $70,313 and $47,788 respectively.
| Characteristic | Number | Measure |
| Per Capita Income | 1,393 | $38,434 |
| Median Family Income | 317 | $70,313 |
| Mean Family Income | 317 | $123,993 |
| Median Household Income | 621 | $47,788 |
| Mean Household Income | 621 | $84,300 |
| Income Deficit | 317 | $0 |
| Wage / Income Gap (%) | 1,393 | 30.49% |
| Wage / Income Gap ($) | 1,393 | 69.51¢ per $1 |
| Gini / Inequality Index | 1,393 | 0.54 |
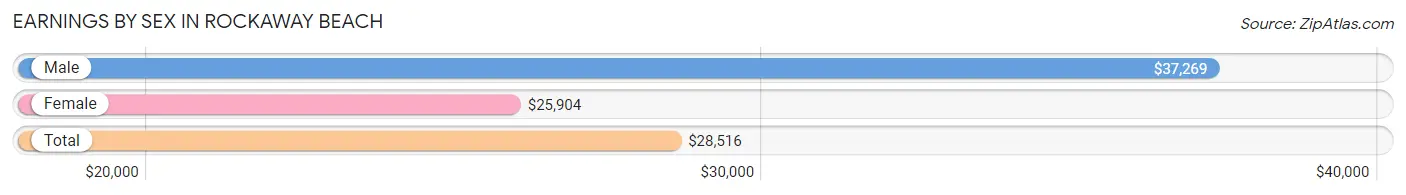
Earnings by Sex in Rockaway Beach
Average Earnings in Rockaway Beach are $28,516, $37,269 for men and $25,904 for women, a difference of 30.5%.
| Sex | Number | Average Earnings |
| Male | 303 (46.5%) | $37,269 |
| Female | 348 (53.5%) | $25,904 |
| Total | 651 (100.0%) | $28,516 |
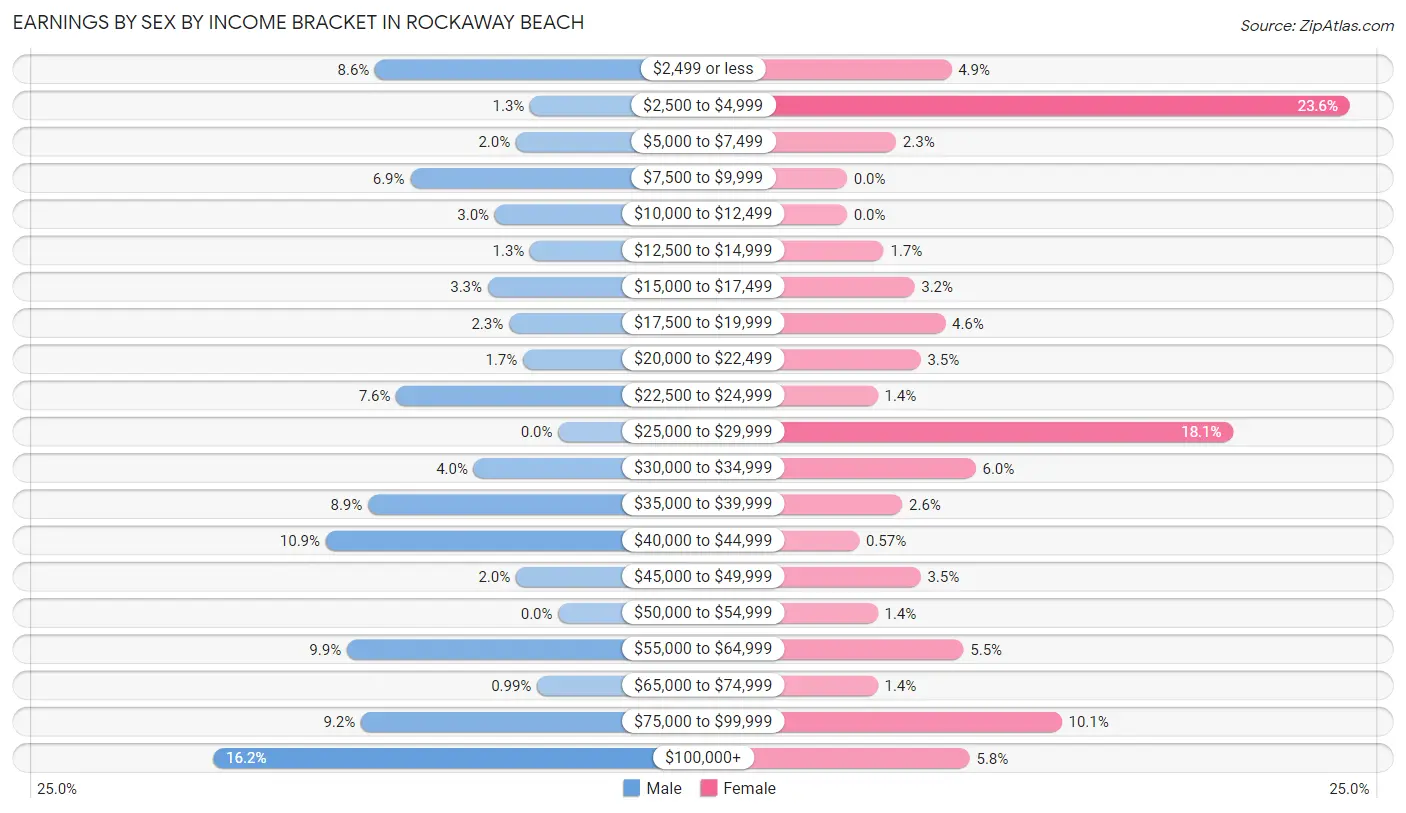
Earnings by Sex by Income Bracket in Rockaway Beach
The most common earnings brackets in Rockaway Beach are $100,000+ for men (49 | 16.2%) and $2,500 to $4,999 for women (82 | 23.6%).
| Income | Male | Female |
| $2,499 or less | 26 (8.6%) | 17 (4.9%) |
| $2,500 to $4,999 | 4 (1.3%) | 82 (23.6%) |
| $5,000 to $7,499 | 6 (2.0%) | 8 (2.3%) |
| $7,500 to $9,999 | 21 (6.9%) | 0 (0.0%) |
| $10,000 to $12,499 | 9 (3.0%) | 0 (0.0%) |
| $12,500 to $14,999 | 4 (1.3%) | 6 (1.7%) |
| $15,000 to $17,499 | 10 (3.3%) | 11 (3.2%) |
| $17,500 to $19,999 | 7 (2.3%) | 16 (4.6%) |
| $20,000 to $22,499 | 5 (1.7%) | 12 (3.5%) |
| $22,500 to $24,999 | 23 (7.6%) | 5 (1.4%) |
| $25,000 to $29,999 | 0 (0.0%) | 63 (18.1%) |
| $30,000 to $34,999 | 12 (4.0%) | 21 (6.0%) |
| $35,000 to $39,999 | 27 (8.9%) | 9 (2.6%) |
| $40,000 to $44,999 | 33 (10.9%) | 2 (0.6%) |
| $45,000 to $49,999 | 6 (2.0%) | 12 (3.5%) |
| $50,000 to $54,999 | 0 (0.0%) | 5 (1.4%) |
| $55,000 to $64,999 | 30 (9.9%) | 19 (5.5%) |
| $65,000 to $74,999 | 3 (1.0%) | 5 (1.4%) |
| $75,000 to $99,999 | 28 (9.2%) | 35 (10.1%) |
| $100,000+ | 49 (16.2%) | 20 (5.8%) |
| Total | 303 (100.0%) | 348 (100.0%) |
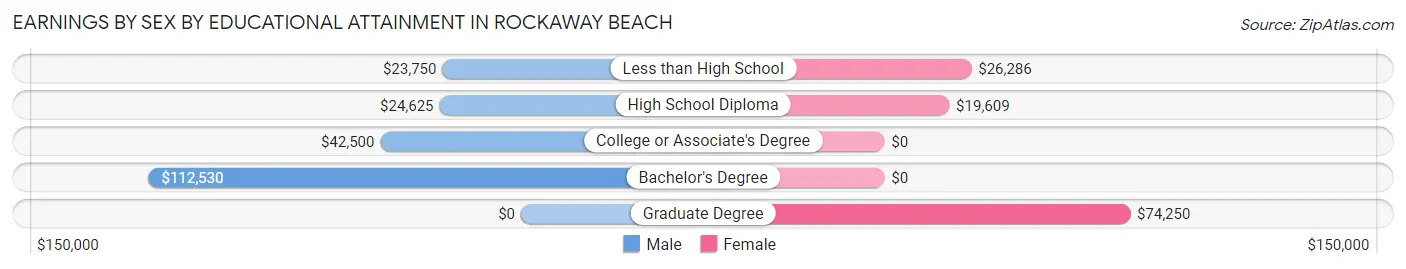
Earnings by Sex by Educational Attainment in Rockaway Beach
Average earnings in Rockaway Beach are $40,221 for men and $32,875 for women, a difference of 18.3%. Men with an educational attainment of bachelor's degree enjoy the highest average annual earnings of $112,530, while those with less than high school education earn the least with $23,750. Women with an educational attainment of graduate degree earn the most with the average annual earnings of $74,250, while those with high school diploma education have the smallest earnings of $19,609.
| Educational Attainment | Male Income | Female Income |
| Less than High School | $23,750 | $26,286 |
| High School Diploma | $24,625 | $19,609 |
| College or Associate's Degree | $42,500 | $0 |
| Bachelor's Degree | $112,530 | $0 |
| Graduate Degree | - | - |
| Total | $40,221 | $32,875 |
Family Income in Rockaway Beach
Family Income Brackets in Rockaway Beach
According to the Rockaway Beach family income data, there are 55 families falling into the $50,000 to $74,999 income range, which is the most common income bracket and makes up 17.3% of all families. Conversely, the $10,000 to $14,999 income bracket is the least frequent group with only 5 families (1.6%) belonging to this category.
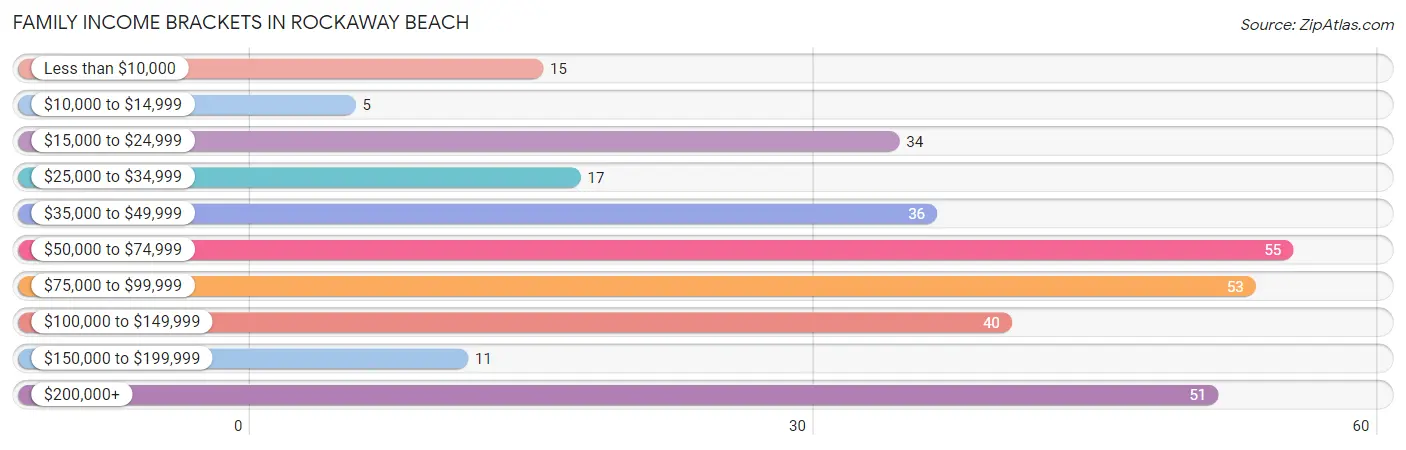
| Income Bracket | # Families | % Families |
| Less than $10,000 | 15 | 4.7% |
| $10,000 to $14,999 | 5 | 1.6% |
| $15,000 to $24,999 | 34 | 10.7% |
| $25,000 to $34,999 | 17 | 5.4% |
| $35,000 to $49,999 | 36 | 11.4% |
| $50,000 to $74,999 | 55 | 17.4% |
| $75,000 to $99,999 | 53 | 16.7% |
| $100,000 to $149,999 | 40 | 12.6% |
| $150,000 to $199,999 | 11 | 3.5% |
| $200,000+ | 51 | 16.1% |
Family Income by Famaliy Size in Rockaway Beach
4-person families (67 | 21.1%) account for the highest median family income in Rockaway Beach with $250,001 per family, while 4-person families (67 | 21.1%) have the highest median income of $62,500 per family member.
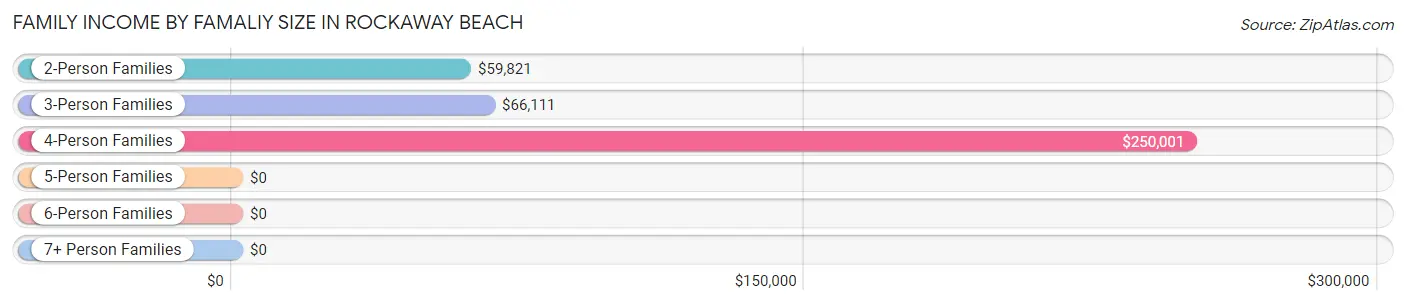
| Income Bracket | # Families | Median Income |
| 2-Person Families | 157 (49.5%) | $59,821 |
| 3-Person Families | 68 (21.4%) | $66,111 |
| 4-Person Families | 67 (21.1%) | $250,001 |
| 5-Person Families | 9 (2.8%) | $0 |
| 6-Person Families | 13 (4.1%) | $0 |
| 7+ Person Families | 3 (0.9%) | $0 |
| Total | 317 (100.0%) | $70,313 |
Family Income by Number of Earners in Rockaway Beach
The median family income in Rockaway Beach is $70,313, with families comprising 3+ earners (64) having the highest median family income of $250,001, while families with no earners (69) have the lowest median family income of $37,321, accounting for 20.2% and 21.8% of families, respectively.
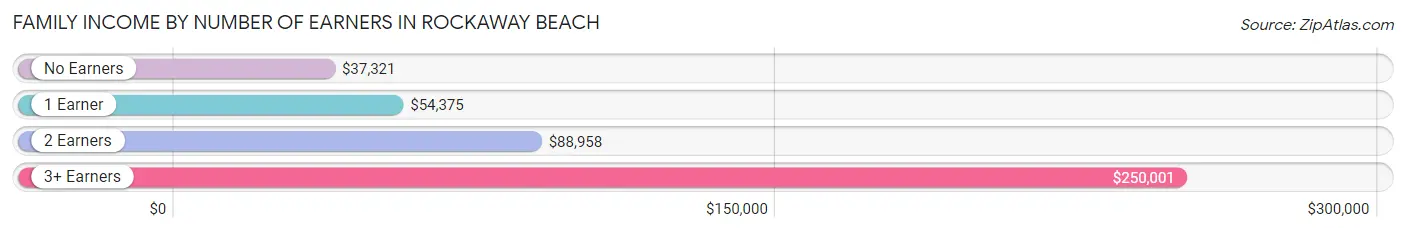
| Number of Earners | # Families | Median Income |
| No Earners | 69 (21.8%) | $37,321 |
| 1 Earner | 97 (30.6%) | $54,375 |
| 2 Earners | 87 (27.4%) | $88,958 |
| 3+ Earners | 64 (20.2%) | $250,001 |
| Total | 317 (100.0%) | $70,313 |
Household Income in Rockaway Beach
Household Income Brackets in Rockaway Beach
With 99 households falling in the category, the $75,000 to $99,999 income range is the most frequent in Rockaway Beach, accounting for 15.9% of all households. In contrast, only 17 households (2.7%) fall into the $150,000 to $199,999 income bracket, making it the least populous group.
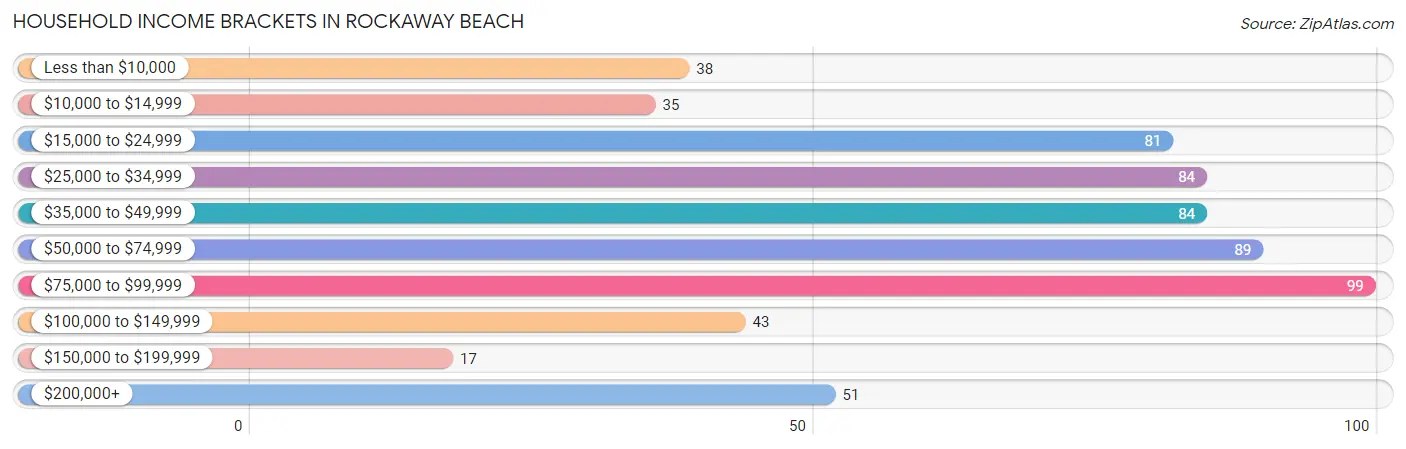
| Income Bracket | # Households | % Households |
| Less than $10,000 | 38 | 6.1% |
| $10,000 to $14,999 | 35 | 5.6% |
| $15,000 to $24,999 | 81 | 13.0% |
| $25,000 to $34,999 | 84 | 13.5% |
| $35,000 to $49,999 | 84 | 13.5% |
| $50,000 to $74,999 | 89 | 14.3% |
| $75,000 to $99,999 | 99 | 15.9% |
| $100,000 to $149,999 | 43 | 6.9% |
| $150,000 to $199,999 | 17 | 2.7% |
| $200,000+ | 51 | 8.2% |
Household Income by Householder Age in Rockaway Beach
The median household income in Rockaway Beach is $47,788, with the highest median household income of $81,364 found in the 45 to 64 years age bracket for the primary householder. A total of 256 households (41.2%) fall into this category. Meanwhile, the 15 to 24 years age bracket for the primary householder has the lowest median household income of $0, with 13 households (2.1%) in this group.
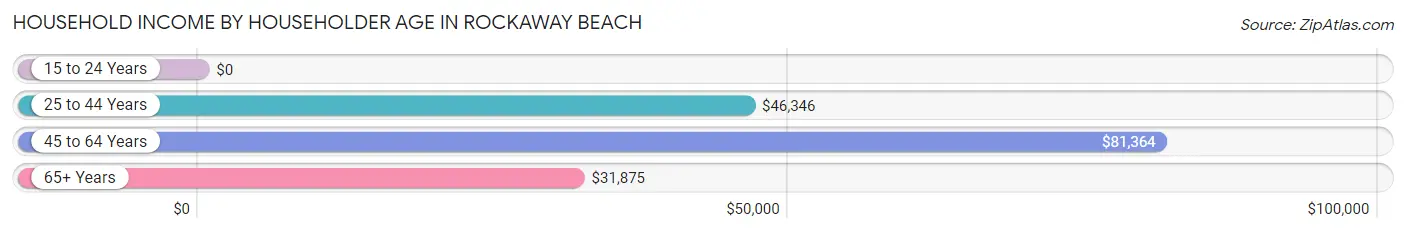
| Income Bracket | # Households | Median Income |
| 15 to 24 Years | 13 (2.1%) | $0 |
| 25 to 44 Years | 88 (14.2%) | $46,346 |
| 45 to 64 Years | 256 (41.2%) | $81,364 |
| 65+ Years | 264 (42.5%) | $31,875 |
| Total | 621 (100.0%) | $47,788 |
Poverty in Rockaway Beach
Income Below Poverty by Sex and Age in Rockaway Beach
With 8.3% poverty level for males and 7.6% for females among the residents of Rockaway Beach, 65 to 74 year old males and 75 year old and over females are the most vulnerable to poverty, with 22 males (21.4%) and 15 females (20.0%) in their respective age groups living below the poverty level.
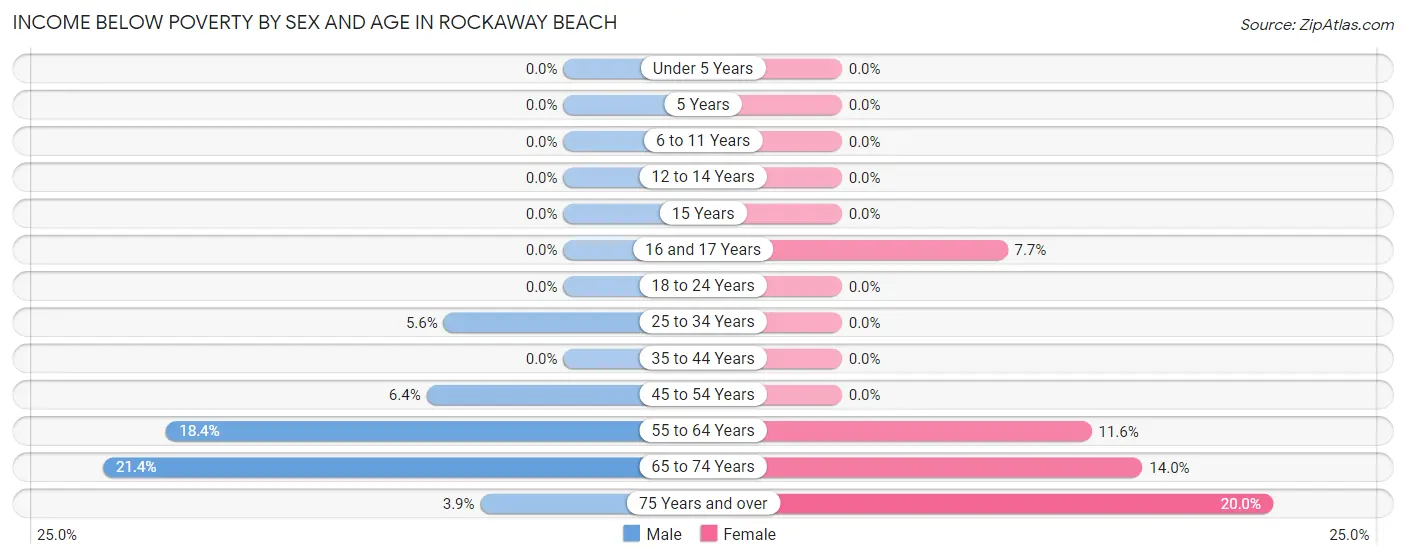
| Age Bracket | Male | Female |
| Under 5 Years | 0 (0.0%) | 0 (0.0%) |
| 5 Years | 0 (0.0%) | 0 (0.0%) |
| 6 to 11 Years | 0 (0.0%) | 0 (0.0%) |
| 12 to 14 Years | 0 (0.0%) | 0 (0.0%) |
| 15 Years | 0 (0.0%) | 0 (0.0%) |
| 16 and 17 Years | 0 (0.0%) | 6 (7.7%) |
| 18 to 24 Years | 0 (0.0%) | 0 (0.0%) |
| 25 to 34 Years | 3 (5.6%) | 0 (0.0%) |
| 35 to 44 Years | 0 (0.0%) | 0 (0.0%) |
| 45 to 54 Years | 8 (6.4%) | 0 (0.0%) |
| 55 to 64 Years | 21 (18.4%) | 16 (11.6%) |
| 65 to 74 Years | 22 (21.4%) | 18 (14.0%) |
| 75 Years and over | 1 (3.8%) | 15 (20.0%) |
| Total | 55 (8.3%) | 55 (7.6%) |
Income Above Poverty by Sex and Age in Rockaway Beach
According to the poverty statistics in Rockaway Beach, males aged under 5 years and females aged under 5 years are the age groups that are most secure financially, with 100.0% of males and 100.0% of females in these age groups living above the poverty line.
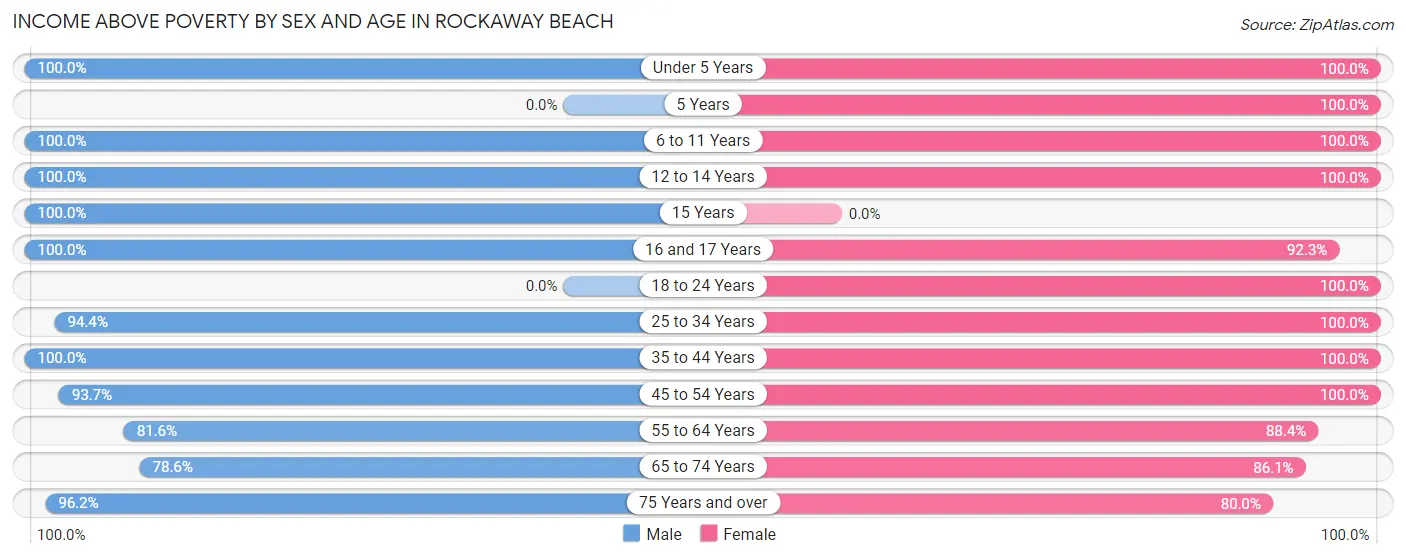
| Age Bracket | Male | Female |
| Under 5 Years | 6 (100.0%) | 13 (100.0%) |
| 5 Years | 0 (0.0%) | 2 (100.0%) |
| 6 to 11 Years | 50 (100.0%) | 4 (100.0%) |
| 12 to 14 Years | 8 (100.0%) | 22 (100.0%) |
| 15 Years | 94 (100.0%) | 0 (0.0%) |
| 16 and 17 Years | 8 (100.0%) | 72 (92.3%) |
| 18 to 24 Years | 0 (0.0%) | 51 (100.0%) |
| 25 to 34 Years | 51 (94.4%) | 30 (100.0%) |
| 35 to 44 Years | 74 (100.0%) | 88 (100.0%) |
| 45 to 54 Years | 118 (93.6%) | 97 (100.0%) |
| 55 to 64 Years | 93 (81.6%) | 122 (88.4%) |
| 65 to 74 Years | 81 (78.6%) | 111 (86.1%) |
| 75 Years and over | 25 (96.2%) | 60 (80.0%) |
| Total | 608 (91.7%) | 672 (92.4%) |
Income Below Poverty Among Married-Couple Families in Rockaway Beach
The poverty statistics for married-couple families in Rockaway Beach show that 5.2% or 13 of the total 249 families live below the poverty line. Families with no children have the highest poverty rate of 8.0%, comprising of 13 families. On the other hand, families with 1 or 2 children have the lowest poverty rate of 0.0%, which includes 0 families.
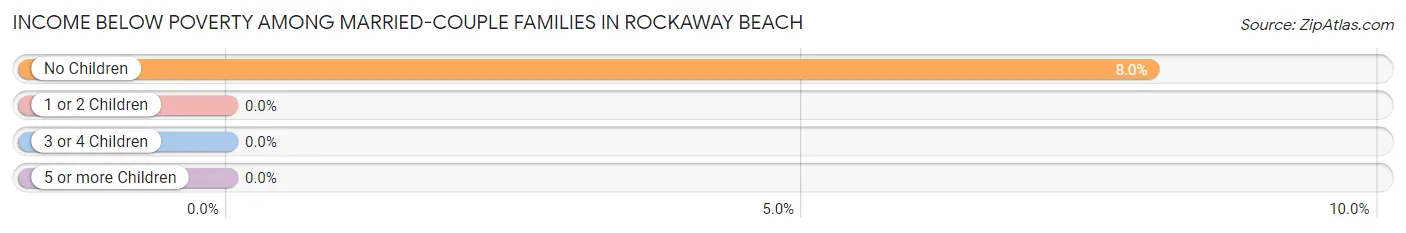
| Children | Above Poverty | Below Poverty |
| No Children | 149 (92.0%) | 13 (8.0%) |
| 1 or 2 Children | 71 (100.0%) | 0 (0.0%) |
| 3 or 4 Children | 13 (100.0%) | 0 (0.0%) |
| 5 or more Children | 3 (100.0%) | 0 (0.0%) |
| Total | 236 (94.8%) | 13 (5.2%) |
Income Below Poverty Among Single-Parent Households in Rockaway Beach
According to the poverty data in Rockaway Beach, 23.1% or 9 single-father households and 6.9% or 2 single-mother households are living below the poverty line. Among single-father households, those with no children have the highest poverty rate, with 9 households (56.2%) experiencing poverty. Likewise, among single-mother households, those with no children have the highest poverty rate, with 2 households (7.4%) falling below the poverty line.
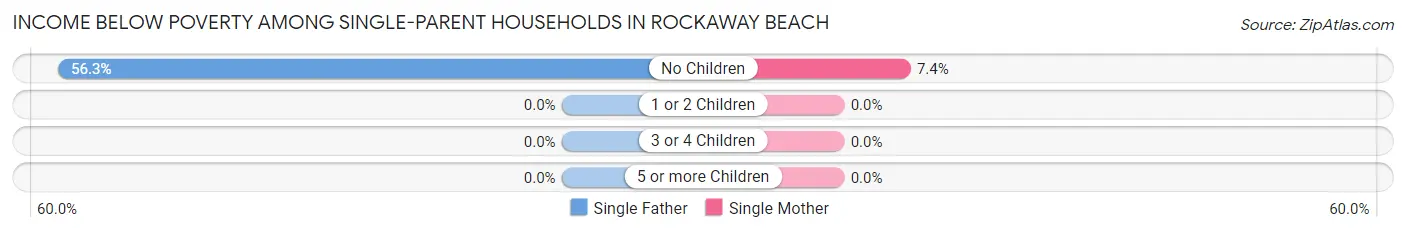
| Children | Single Father | Single Mother |
| No Children | 9 (56.2%) | 2 (7.4%) |
| 1 or 2 Children | 0 (0.0%) | 0 (0.0%) |
| 3 or 4 Children | 0 (0.0%) | 0 (0.0%) |
| 5 or more Children | 0 (0.0%) | 0 (0.0%) |
| Total | 9 (23.1%) | 2 (6.9%) |
Income Below Poverty Among Married-Couple vs Single-Parent Households in Rockaway Beach
The poverty data for Rockaway Beach shows that 13 of the married-couple family households (5.2%) and 11 of the single-parent households (16.2%) are living below the poverty level. Within the married-couple family households, those with no children have the highest poverty rate, with 13 households (8.0%) falling below the poverty line. Among the single-parent households, those with no children have the highest poverty rate, with 11 household (25.6%) living below poverty.
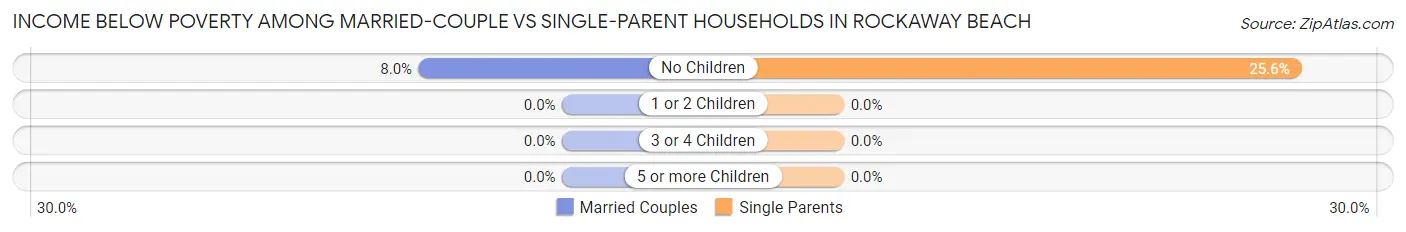
| Children | Married-Couple Families | Single-Parent Households |
| No Children | 13 (8.0%) | 11 (25.6%) |
| 1 or 2 Children | 0 (0.0%) | 0 (0.0%) |
| 3 or 4 Children | 0 (0.0%) | 0 (0.0%) |
| 5 or more Children | 0 (0.0%) | 0 (0.0%) |
| Total | 13 (5.2%) | 11 (16.2%) |
Race in Rockaway Beach
The most populous races in Rockaway Beach are White / Caucasian (1,321 | 94.8%), Two or more Races (32 | 2.3%), and Asian (17 | 1.2%).
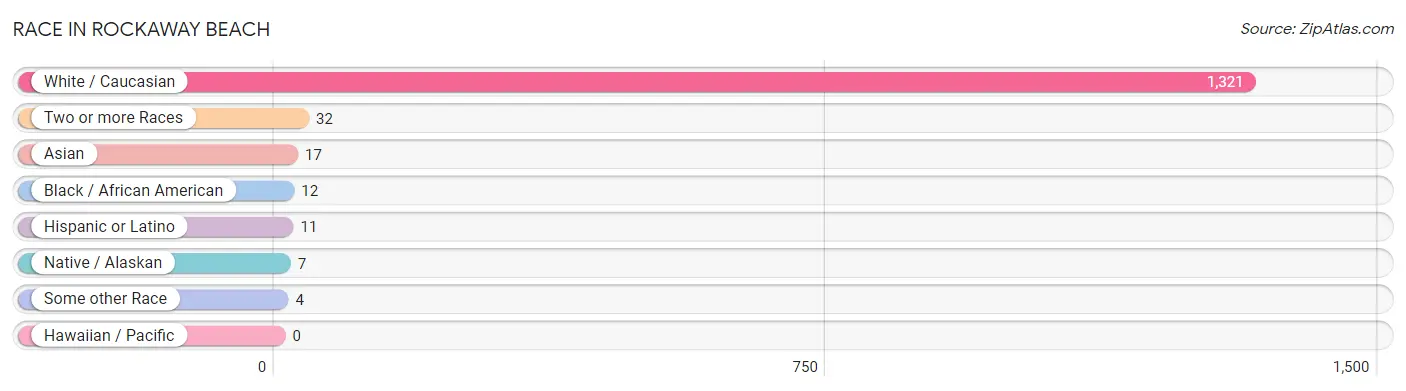
| Race | # Population | % Population |
| Asian | 17 | 1.2% |
| Black / African American | 12 | 0.9% |
| Hawaiian / Pacific | 0 | 0.0% |
| Hispanic or Latino | 11 | 0.8% |
| Native / Alaskan | 7 | 0.5% |
| White / Caucasian | 1,321 | 94.8% |
| Two or more Races | 32 | 2.3% |
| Some other Race | 4 | 0.3% |
| Total | 1,393 | 100.0% |
Ancestry in Rockaway Beach
The most populous ancestries reported in Rockaway Beach are German (301 | 21.6%), English (217 | 15.6%), Irish (174 | 12.5%), American (72 | 5.2%), and Italian (68 | 4.9%), together accounting for 59.7% of all Rockaway Beach residents.
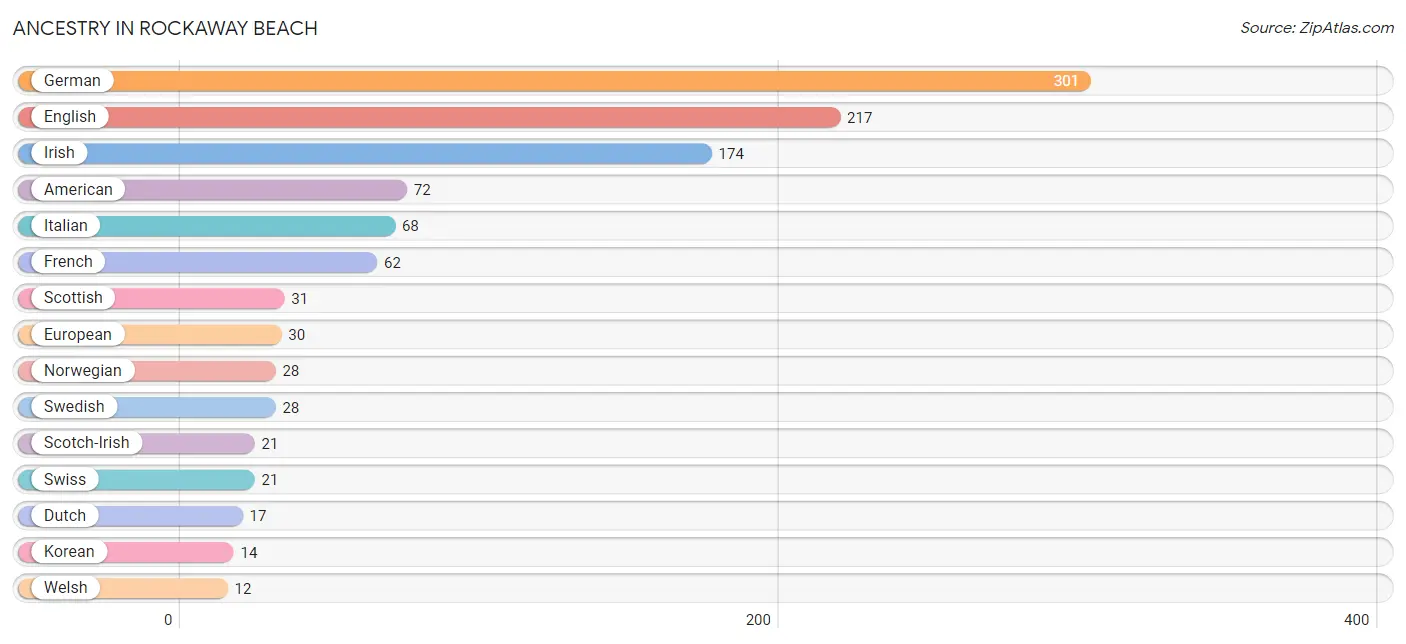
| Ancestry | # Population | % Population |
| Alaskan Athabascan | 5 | 0.4% |
| American | 72 | 5.2% |
| Austrian | 1 | 0.1% |
| Canadian | 10 | 0.7% |
| Chippewa | 7 | 0.5% |
| Comanche | 2 | 0.1% |
| Croatian | 3 | 0.2% |
| Czech | 3 | 0.2% |
| Dutch | 17 | 1.2% |
| English | 217 | 15.6% |
| European | 30 | 2.1% |
| Finnish | 8 | 0.6% |
| French | 62 | 4.4% |
| French Canadian | 2 | 0.1% |
| German | 301 | 21.6% |
| Hungarian | 5 | 0.4% |
| Indian (Asian) | 5 | 0.4% |
| Irish | 174 | 12.5% |
| Italian | 68 | 4.9% |
| Korean | 14 | 1.0% |
| Norwegian | 28 | 2.0% |
| Pakistani | 3 | 0.2% |
| Polish | 1 | 0.1% |
| Romanian | 6 | 0.4% |
| Scandinavian | 3 | 0.2% |
| Scotch-Irish | 21 | 1.5% |
| Scottish | 31 | 2.2% |
| Spaniard | 4 | 0.3% |
| Swedish | 28 | 2.0% |
| Swiss | 21 | 1.5% |
| Ukrainian | 1 | 0.1% |
| Welsh | 12 | 0.9% | View All 32 Rows |
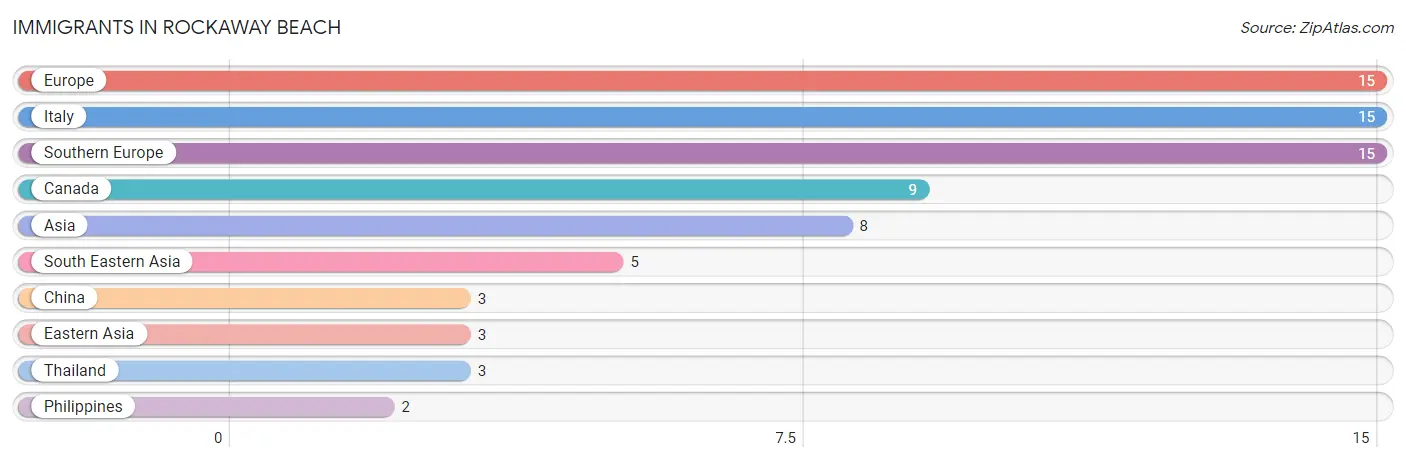
Immigrants in Rockaway Beach
The most numerous immigrant groups reported in Rockaway Beach came from Europe (15 | 1.1%), Italy (15 | 1.1%), Southern Europe (15 | 1.1%), Canada (9 | 0.6%), and Asia (8 | 0.6%), together accounting for 4.5% of all Rockaway Beach residents.
| Immigration Origin | # Population | % Population |
| Asia | 8 | 0.6% |
| Canada | 9 | 0.6% |
| China | 3 | 0.2% |
| Eastern Asia | 3 | 0.2% |
| Europe | 15 | 1.1% |
| Italy | 15 | 1.1% |
| Philippines | 2 | 0.1% |
| South Eastern Asia | 5 | 0.4% |
| Southern Europe | 15 | 1.1% |
| Thailand | 3 | 0.2% | View All 10 Rows |
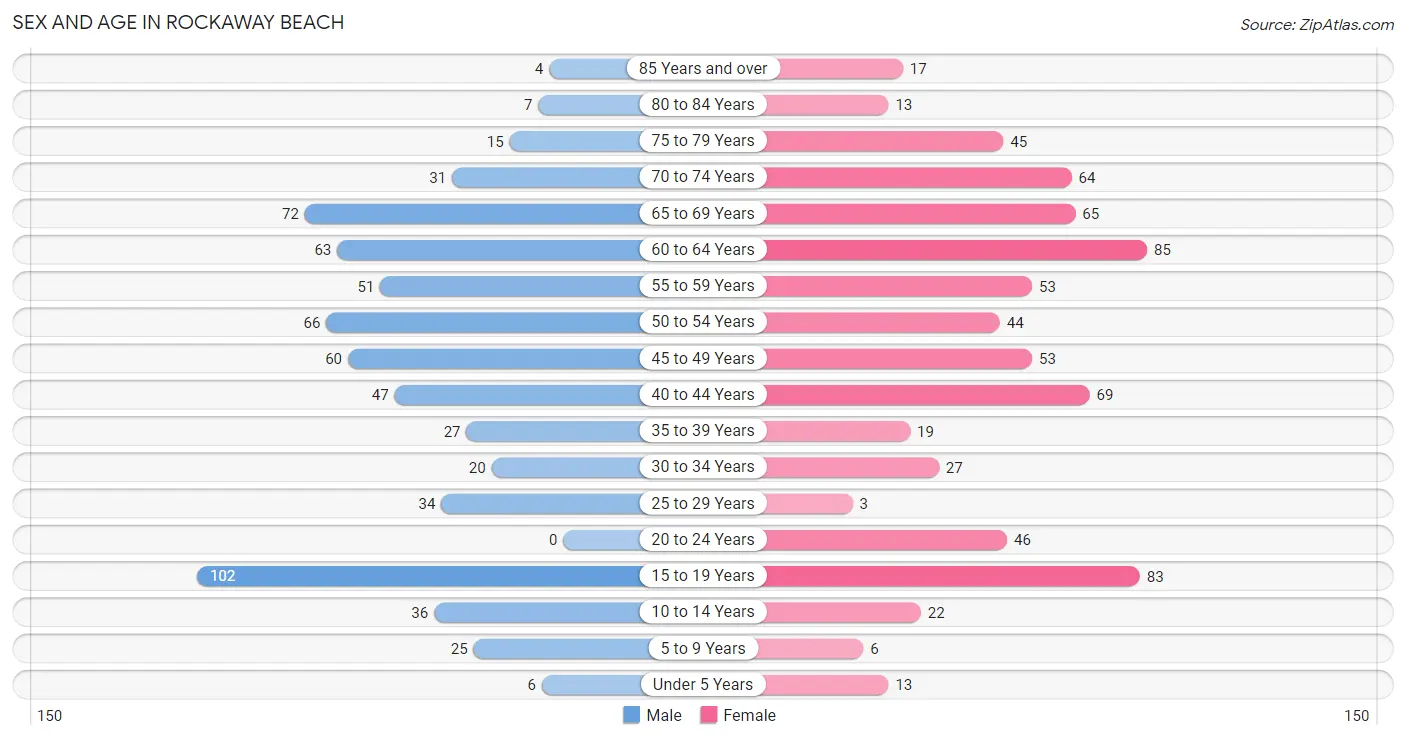
Sex and Age in Rockaway Beach
Sex and Age in Rockaway Beach
The most populous age groups in Rockaway Beach are 15 to 19 Years (102 | 15.3%) for men and 60 to 64 Years (85 | 11.7%) for women.
| Age Bracket | Male | Female |
| Under 5 Years | 6 (0.9%) | 13 (1.8%) |
| 5 to 9 Years | 25 (3.7%) | 6 (0.8%) |
| 10 to 14 Years | 36 (5.4%) | 22 (3.0%) |
| 15 to 19 Years | 102 (15.3%) | 83 (11.4%) |
| 20 to 24 Years | 0 (0.0%) | 46 (6.3%) |
| 25 to 29 Years | 34 (5.1%) | 3 (0.4%) |
| 30 to 34 Years | 20 (3.0%) | 27 (3.7%) |
| 35 to 39 Years | 27 (4.1%) | 19 (2.6%) |
| 40 to 44 Years | 47 (7.1%) | 69 (9.5%) |
| 45 to 49 Years | 60 (9.0%) | 53 (7.3%) |
| 50 to 54 Years | 66 (9.9%) | 44 (6.0%) |
| 55 to 59 Years | 51 (7.7%) | 53 (7.3%) |
| 60 to 64 Years | 63 (9.5%) | 85 (11.7%) |
| 65 to 69 Years | 72 (10.8%) | 65 (8.9%) |
| 70 to 74 Years | 31 (4.6%) | 64 (8.8%) |
| 75 to 79 Years | 15 (2.2%) | 45 (6.2%) |
| 80 to 84 Years | 7 (1.1%) | 13 (1.8%) |
| 85 Years and over | 4 (0.6%) | 17 (2.3%) |
| Total | 666 (100.0%) | 727 (100.0%) |
Families and Households in Rockaway Beach
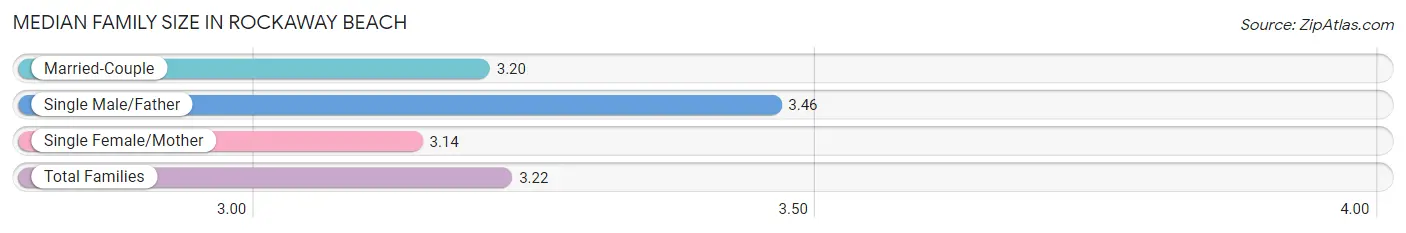
Median Family Size in Rockaway Beach
The median family size in Rockaway Beach is 3.22 persons per family, with single male/father families (39 | 12.3%) accounting for the largest median family size of 3.46 persons per family. On the other hand, single female/mother families (29 | 9.1%) represent the smallest median family size with 3.14 persons per family.
| Family Type | # Families | Family Size |
| Married-Couple | 249 (78.5%) | 3.20 |
| Single Male/Father | 39 (12.3%) | 3.46 |
| Single Female/Mother | 29 (9.1%) | 3.14 |
| Total Families | 317 (100.0%) | 3.22 |
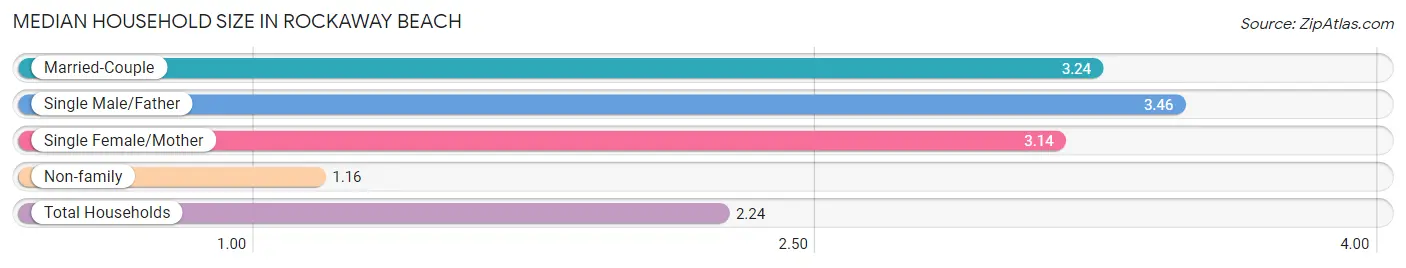
Median Household Size in Rockaway Beach
The median household size in Rockaway Beach is 2.24 persons per household, with single male/father households (39 | 6.3%) accounting for the largest median household size of 3.46 persons per household. non-family households (304 | 48.9%) represent the smallest median household size with 1.16 persons per household.
| Household Type | # Households | Household Size |
| Married-Couple | 249 (40.1%) | 3.24 |
| Single Male/Father | 39 (6.3%) | 3.46 |
| Single Female/Mother | 29 (4.7%) | 3.14 |
| Non-family | 304 (48.9%) | 1.16 |
| Total Households | 621 (100.0%) | 2.24 |
Household Size by Marriage Status in Rockaway Beach
Out of a total of 621 households in Rockaway Beach, 317 (51.0%) are family households, while 304 (48.9%) are nonfamily households. The most numerous type of family households are 2-person households, comprising 157, and the most common type of nonfamily households are 1-person households, comprising 268.
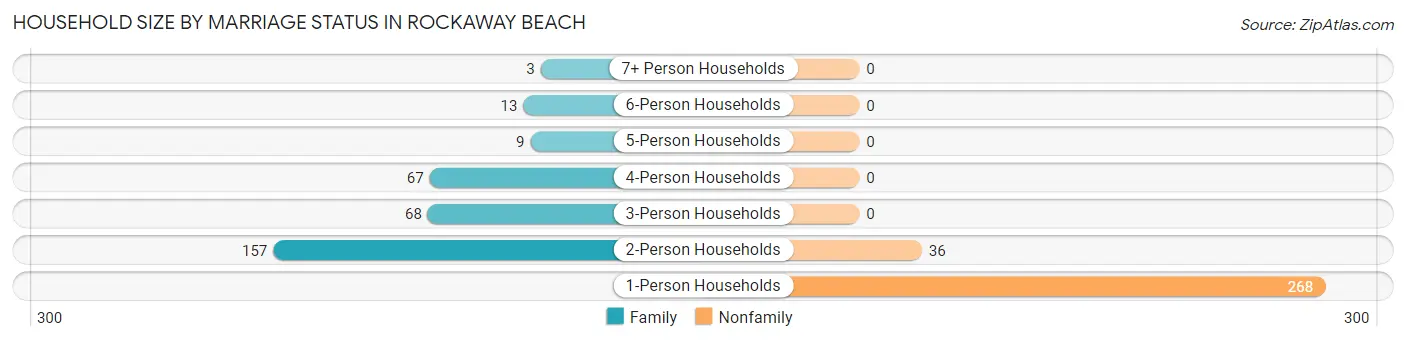
| Household Size | Family Households | Nonfamily Households |
| 1-Person Households | - | 268 (43.2%) |
| 2-Person Households | 157 (25.3%) | 36 (5.8%) |
| 3-Person Households | 68 (11.0%) | 0 (0.0%) |
| 4-Person Households | 67 (10.8%) | 0 (0.0%) |
| 5-Person Households | 9 (1.5%) | 0 (0.0%) |
| 6-Person Households | 13 (2.1%) | 0 (0.0%) |
| 7+ Person Households | 3 (0.5%) | 0 (0.0%) |
| Total | 317 (51.0%) | 304 (48.9%) |
Female Fertility in Rockaway Beach
Fertility by Age in Rockaway Beach
| Age Bracket | Women with Births | Births / 1,000 Women |
| 15 to 19 years | 0 (0.0%) | 0.0 |
| 20 to 34 years | 0 (0.0%) | 0.0 |
| 35 to 50 years | 0 (0.0%) | 0.0 |
| Total | 0 (0.0%) | 0.0 |
Fertility by Age by Marriage Status in Rockaway Beach
| Age Bracket | Married | Unmarried |
| 15 to 19 years | 0 (0.0%) | 0 (0.0%) |
| 20 to 34 years | 0 (0.0%) | 0 (0.0%) |
| 35 to 50 years | 0 (0.0%) | 0 (0.0%) |
| Total | 0 (0.0%) | 0 (0.0%) |
Fertility by Education in Rockaway Beach
| Educational Attainment | Women with Births | Births / 1,000 Women |
| Less than High School | 0 (0.0%) | 0.0 |
| High School Diploma | 0 (0.0%) | 0.0 |
| College or Associate's Degree | 0 (0.0%) | 0.0 |
| Bachelor's Degree | 0 (0.0%) | 0.0 |
| Graduate Degree | 0 (0.0%) | 0.0 |
| Total | 0 (0.0%) | 0.0 |
Fertility by Education by Marriage Status in Rockaway Beach
| Educational Attainment | Married | Unmarried |
| Less than High School | 0 (0.0%) | 0 (0.0%) |
| High School Diploma | 0 (0.0%) | 0 (0.0%) |
| College or Associate's Degree | 0 (0.0%) | 0 (0.0%) |
| Bachelor's Degree | 0 (0.0%) | 0 (0.0%) |
| Graduate Degree | 0 (0.0%) | 0 (0.0%) |
| Total | 0 (0.0%) | 0 (0.0%) |
Employment Characteristics in Rockaway Beach
Employment by Class of Employer in Rockaway Beach
Among the 525 employed individuals in Rockaway Beach, private company employees (308 | 58.7%), self-employed (not incorporated) (69 | 13.1%), and not-for-profit organizations (65 | 12.4%) make up the most common classes of employment.
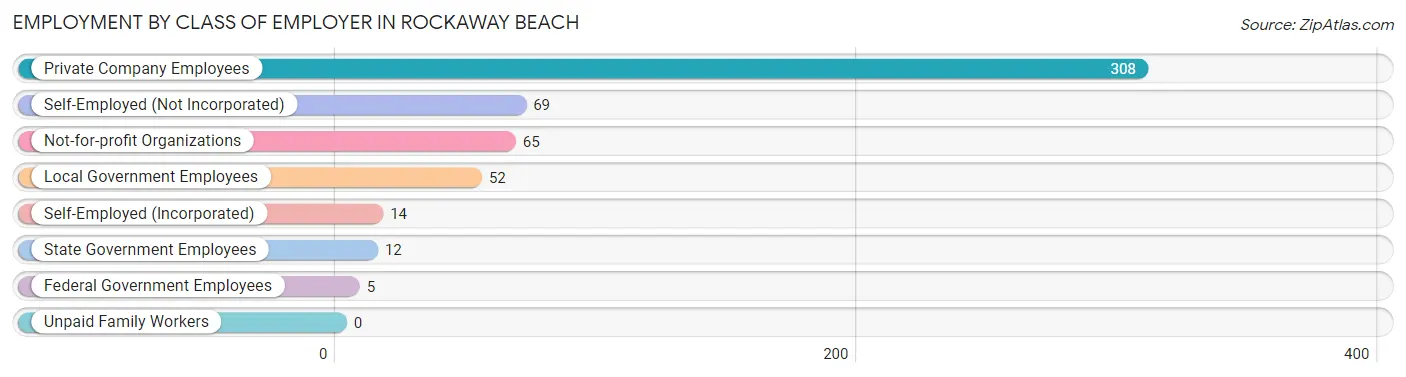
| Employer Class | # Employees | % Employees |
| Private Company Employees | 308 | 58.7% |
| Self-Employed (Incorporated) | 14 | 2.7% |
| Self-Employed (Not Incorporated) | 69 | 13.1% |
| Not-for-profit Organizations | 65 | 12.4% |
| Local Government Employees | 52 | 9.9% |
| State Government Employees | 12 | 2.3% |
| Federal Government Employees | 5 | 0.9% |
| Unpaid Family Workers | 0 | 0.0% |
| Total | 525 | 100.0% |
Employment Status by Age in Rockaway Beach
According to the labor force statistics for Rockaway Beach, out of the total population over 16 years of age (1,191), 47.6% or 567 individuals are in the labor force, with 6.9% or 39 of them unemployed. The age group with the highest labor force participation rate is 45 to 54 years, with 77.6% or 173 individuals in the labor force. Within the labor force, the 65 to 74 years age range has the highest percentage of unemployed individuals, with 31.1% or 23 of them being unemployed.
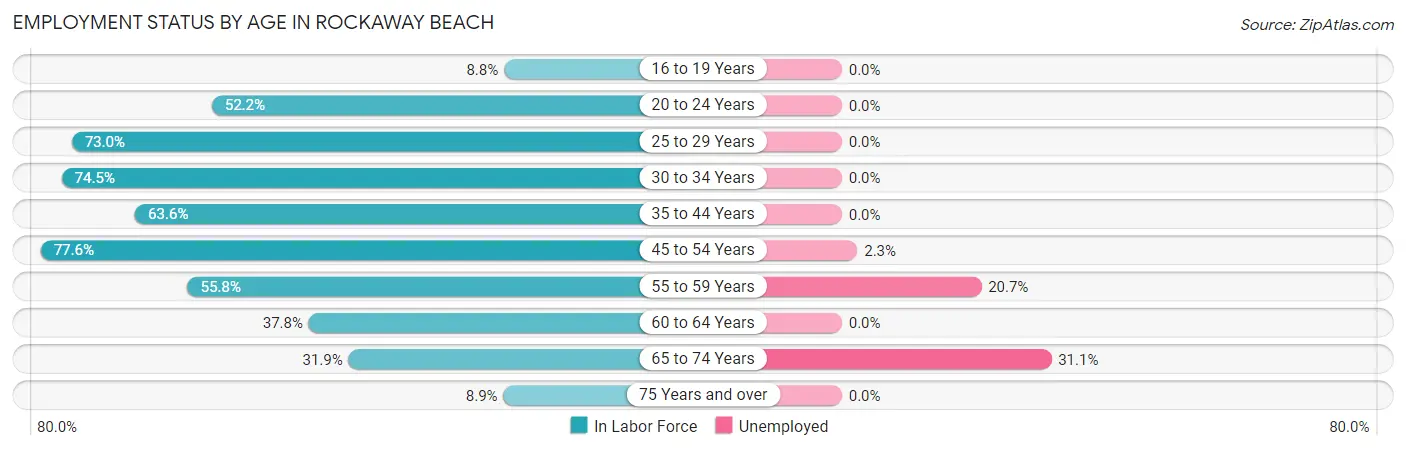
| Age Bracket | In Labor Force | Unemployed |
| 16 to 19 Years | 8 (8.8%) | 0 (0.0%) |
| 20 to 24 Years | 24 (52.2%) | 0 (0.0%) |
| 25 to 29 Years | 27 (73.0%) | 0 (0.0%) |
| 30 to 34 Years | 35 (74.5%) | 0 (0.0%) |
| 35 to 44 Years | 103 (63.6%) | 0 (0.0%) |
| 45 to 54 Years | 173 (77.6%) | 4 (2.3%) |
| 55 to 59 Years | 58 (55.8%) | 12 (20.7%) |
| 60 to 64 Years | 56 (37.8%) | 0 (0.0%) |
| 65 to 74 Years | 74 (31.9%) | 23 (31.1%) |
| 75 Years and over | 9 (8.9%) | 0 (0.0%) |
| Total | 567 (47.6%) | 39 (6.9%) |
Employment Status by Educational Attainment in Rockaway Beach
According to labor force statistics for Rockaway Beach, 62.7% of individuals (452) out of the total population between 25 and 64 years of age (721) are in the labor force, with 3.6% or 16 of them being unemployed. The group with the highest labor force participation rate are those with the educational attainment of bachelor's degree or higher, with 80.7% or 142 individuals in the labor force. Within the labor force, individuals with college / associate degree education have the highest percentage of unemployment, with 8.8% or 16 of them being unemployed.
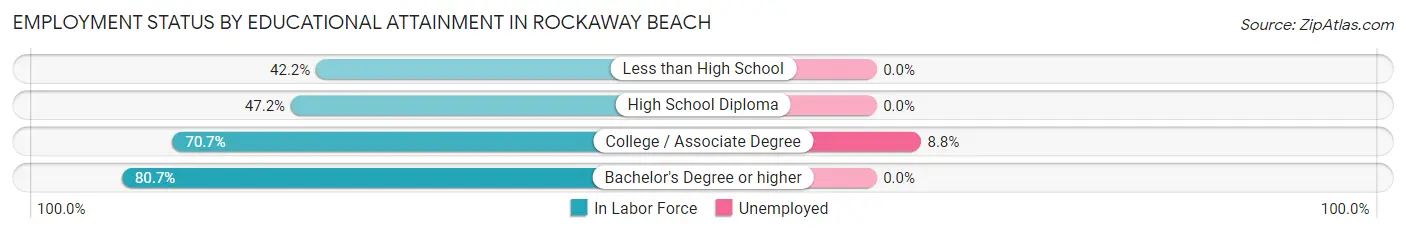
| Educational Attainment | In Labor Force | Unemployed |
| Less than High School | 62 (42.2%) | 0 (0.0%) |
| High School Diploma | 67 (47.2%) | 0 (0.0%) |
| College / Associate Degree | 181 (70.7%) | 23 (8.8%) |
| Bachelor's Degree or higher | 142 (80.7%) | 0 (0.0%) |
| Total | 452 (62.7%) | 26 (3.6%) |
Employment Occupations by Sex in Rockaway Beach
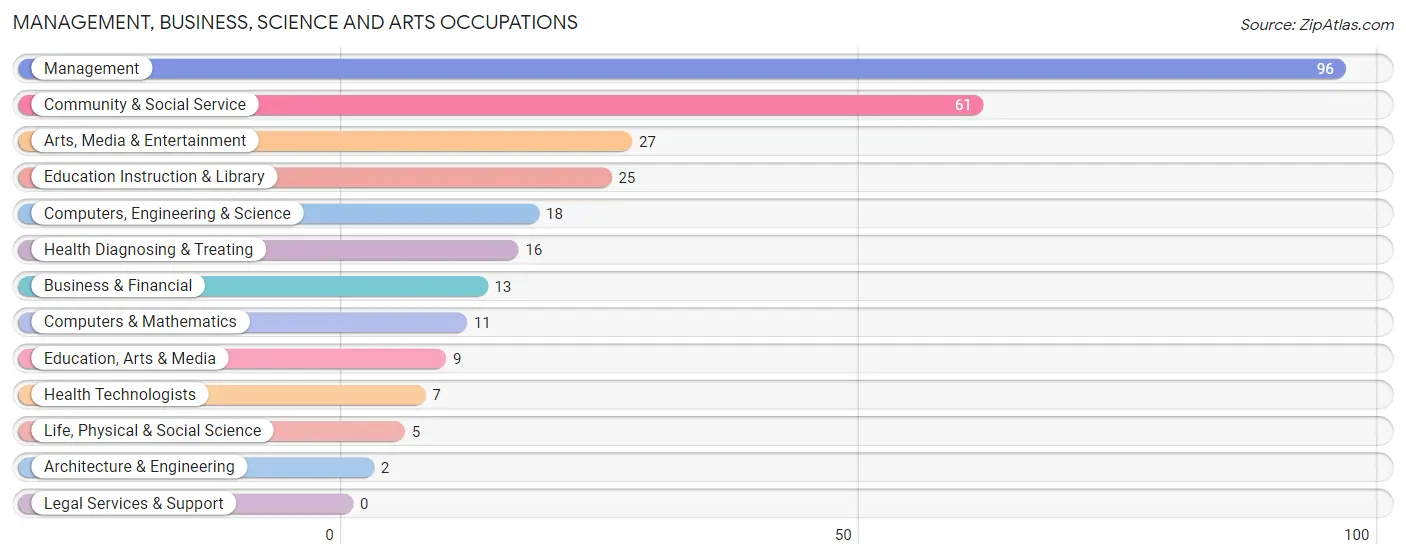
Management, Business, Science and Arts Occupations
The most common Management, Business, Science and Arts occupations in Rockaway Beach are Management (96 | 18.3%), Community & Social Service (61 | 11.6%), Arts, Media & Entertainment (27 | 5.1%), Education Instruction & Library (25 | 4.8%), and Computers, Engineering & Science (18 | 3.4%).
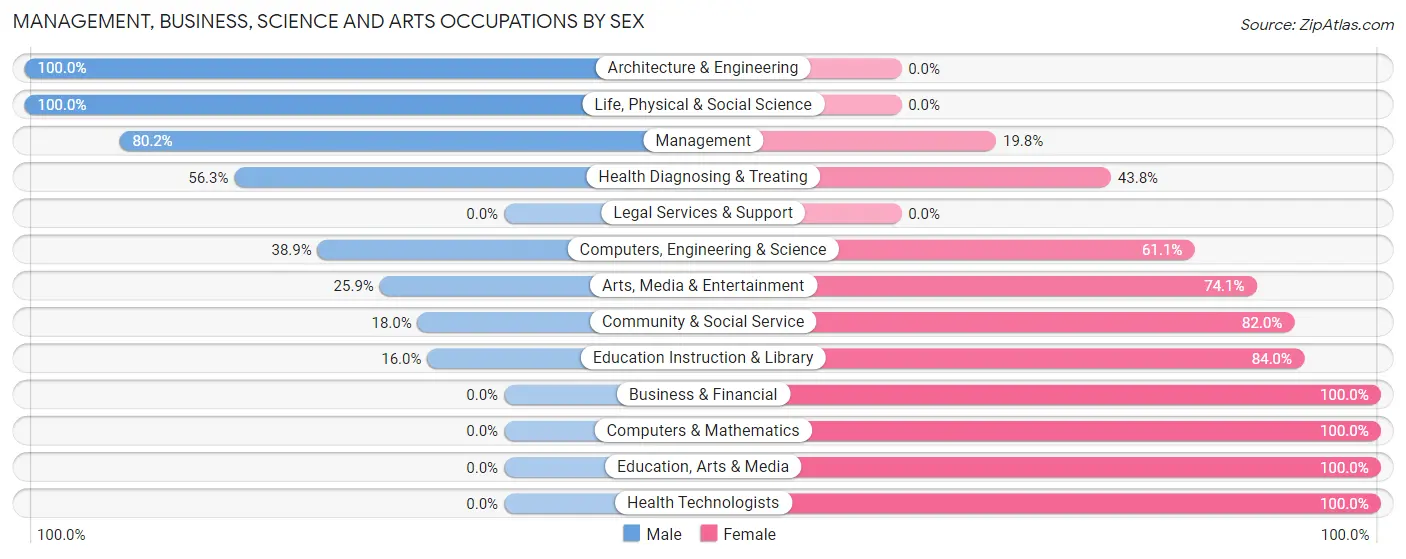
Management, Business, Science and Arts Occupations by Sex
Within the Management, Business, Science and Arts occupations in Rockaway Beach, the most male-oriented occupations are Architecture & Engineering (100.0%), Life, Physical & Social Science (100.0%), and Management (80.2%), while the most female-oriented occupations are Business & Financial (100.0%), Computers & Mathematics (100.0%), and Education, Arts & Media (100.0%).
| Occupation | Male | Female |
| Management | 77 (80.2%) | 19 (19.8%) |
| Business & Financial | 0 (0.0%) | 13 (100.0%) |
| Computers, Engineering & Science | 7 (38.9%) | 11 (61.1%) |
| Computers & Mathematics | 0 (0.0%) | 11 (100.0%) |
| Architecture & Engineering | 2 (100.0%) | 0 (0.0%) |
| Life, Physical & Social Science | 5 (100.0%) | 0 (0.0%) |
| Community & Social Service | 11 (18.0%) | 50 (82.0%) |
| Education, Arts & Media | 0 (0.0%) | 9 (100.0%) |
| Legal Services & Support | 0 (0.0%) | 0 (0.0%) |
| Education Instruction & Library | 4 (16.0%) | 21 (84.0%) |
| Arts, Media & Entertainment | 7 (25.9%) | 20 (74.1%) |
| Health Diagnosing & Treating | 9 (56.2%) | 7 (43.8%) |
| Health Technologists | 0 (0.0%) | 7 (100.0%) |
| Total (Category) | 104 (51.0%) | 100 (49.0%) |
| Total (Overall) | 265 (50.5%) | 260 (49.5%) |
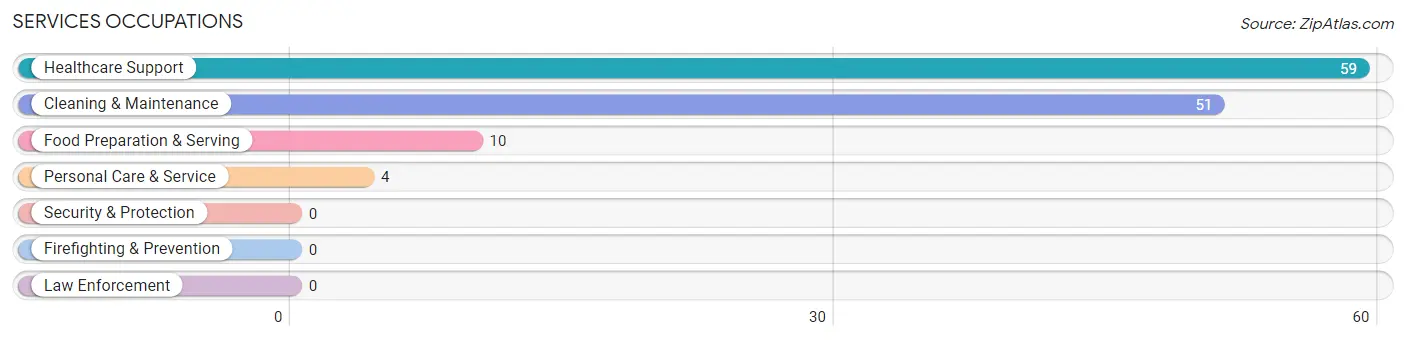
Services Occupations
The most common Services occupations in Rockaway Beach are Healthcare Support (59 | 11.2%), Cleaning & Maintenance (51 | 9.7%), Food Preparation & Serving (10 | 1.9%), and Personal Care & Service (4 | 0.8%).
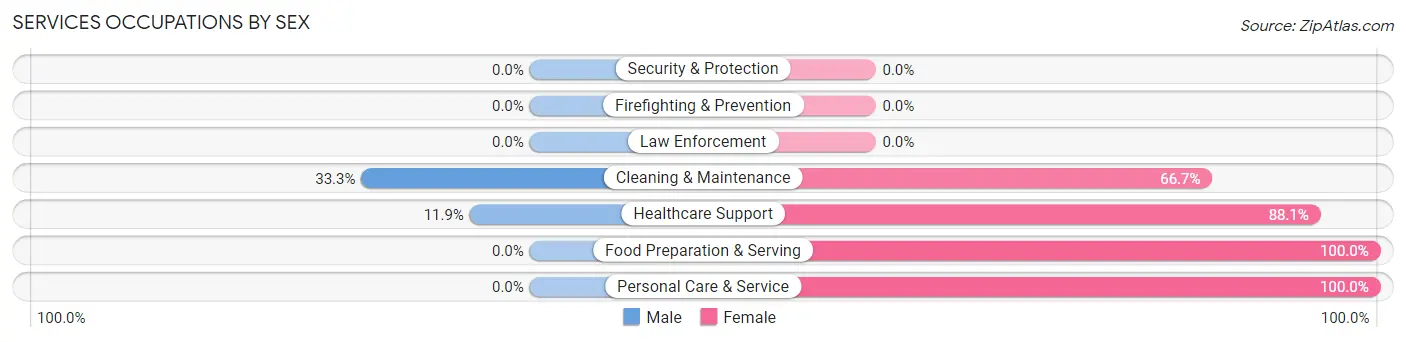
Services Occupations by Sex
Within the Services occupations in Rockaway Beach, the most male-oriented occupations are Cleaning & Maintenance (33.3%), and Healthcare Support (11.9%), while the most female-oriented occupations are Food Preparation & Serving (100.0%), Personal Care & Service (100.0%), and Healthcare Support (88.1%).
| Occupation | Male | Female |
| Healthcare Support | 7 (11.9%) | 52 (88.1%) |
| Security & Protection | 0 (0.0%) | 0 (0.0%) |
| Firefighting & Prevention | 0 (0.0%) | 0 (0.0%) |
| Law Enforcement | 0 (0.0%) | 0 (0.0%) |
| Food Preparation & Serving | 0 (0.0%) | 10 (100.0%) |
| Cleaning & Maintenance | 17 (33.3%) | 34 (66.7%) |
| Personal Care & Service | 0 (0.0%) | 4 (100.0%) |
| Total (Category) | 24 (19.4%) | 100 (80.6%) |
| Total (Overall) | 265 (50.5%) | 260 (49.5%) |
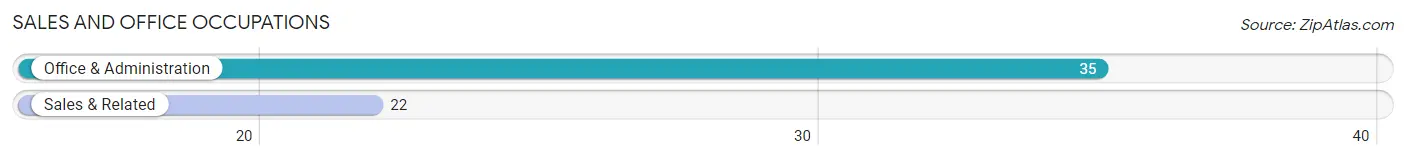
Sales and Office Occupations
The most common Sales and Office occupations in Rockaway Beach are Office & Administration (35 | 6.7%), and Sales & Related (22 | 4.2%).
Sales and Office Occupations by Sex
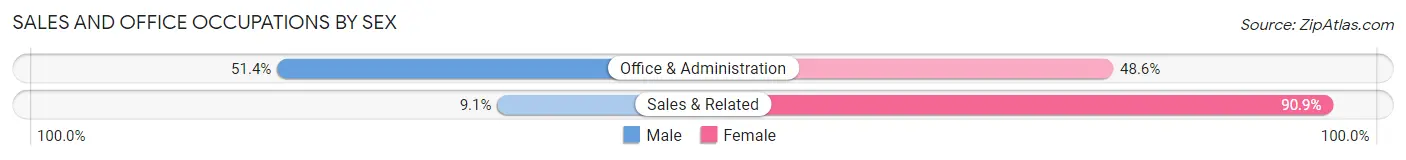
| Occupation | Male | Female |
| Sales & Related | 2 (9.1%) | 20 (90.9%) |
| Office & Administration | 18 (51.4%) | 17 (48.6%) |
| Total (Category) | 20 (35.1%) | 37 (64.9%) |
| Total (Overall) | 265 (50.5%) | 260 (49.5%) |
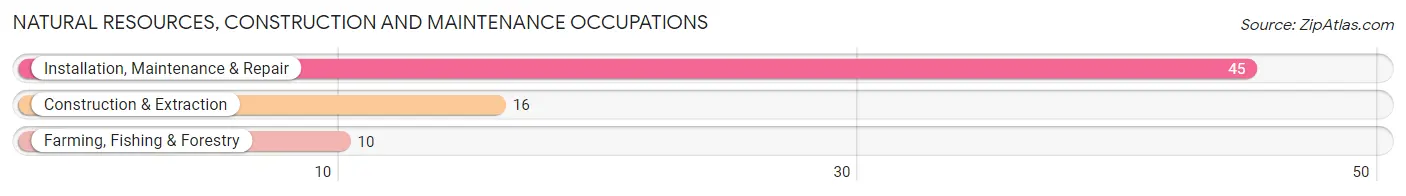
Natural Resources, Construction and Maintenance Occupations
The most common Natural Resources, Construction and Maintenance occupations in Rockaway Beach are Installation, Maintenance & Repair (45 | 8.6%), Construction & Extraction (16 | 3.0%), and Farming, Fishing & Forestry (10 | 1.9%).
Natural Resources, Construction and Maintenance Occupations by Sex
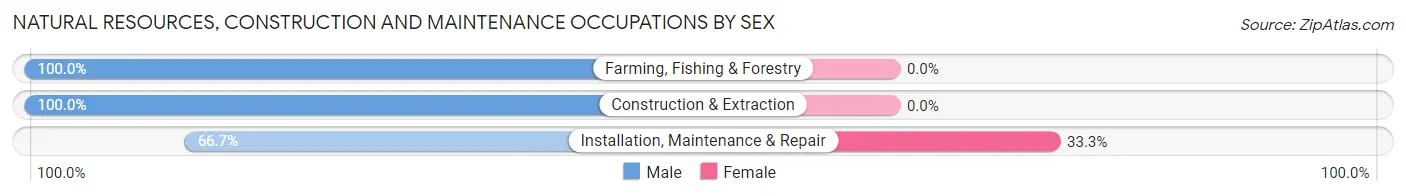
| Occupation | Male | Female |
| Farming, Fishing & Forestry | 10 (100.0%) | 0 (0.0%) |
| Construction & Extraction | 16 (100.0%) | 0 (0.0%) |
| Installation, Maintenance & Repair | 30 (66.7%) | 15 (33.3%) |
| Total (Category) | 56 (78.9%) | 15 (21.1%) |
| Total (Overall) | 265 (50.5%) | 260 (49.5%) |
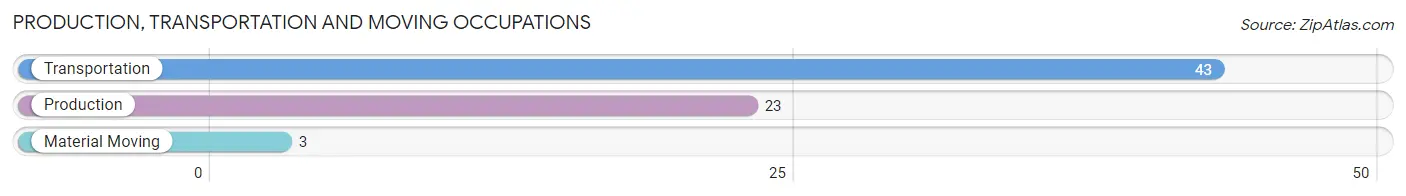
Production, Transportation and Moving Occupations
The most common Production, Transportation and Moving occupations in Rockaway Beach are Transportation (43 | 8.2%), Production (23 | 4.4%), and Material Moving (3 | 0.6%).
Production, Transportation and Moving Occupations by Sex
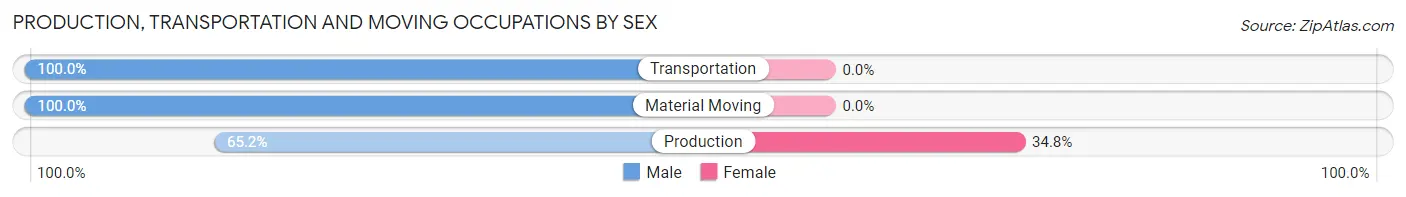
| Occupation | Male | Female |
| Production | 15 (65.2%) | 8 (34.8%) |
| Transportation | 43 (100.0%) | 0 (0.0%) |
| Material Moving | 3 (100.0%) | 0 (0.0%) |
| Total (Category) | 61 (88.4%) | 8 (11.6%) |
| Total (Overall) | 265 (50.5%) | 260 (49.5%) |
Employment Industries by Sex in Rockaway Beach
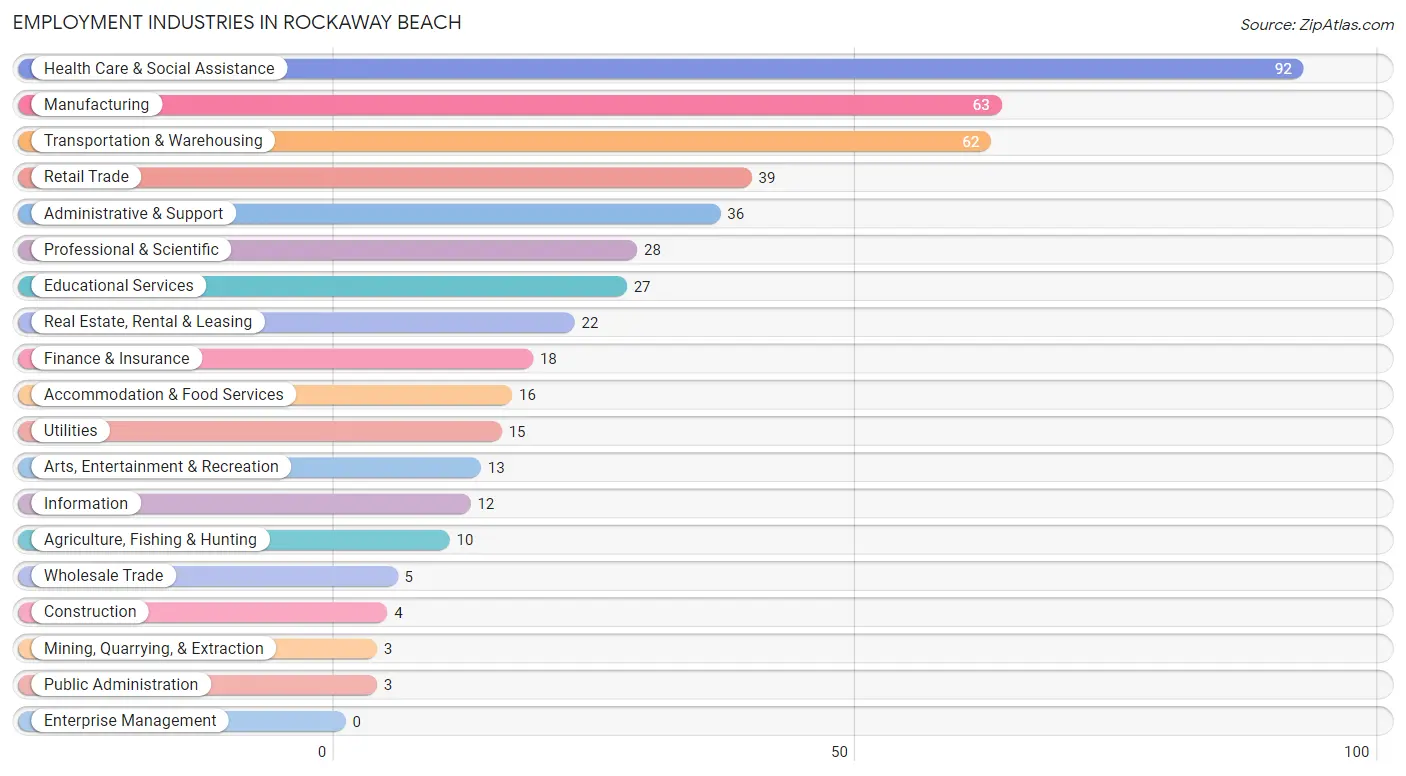
Employment Industries in Rockaway Beach
The major employment industries in Rockaway Beach include Health Care & Social Assistance (92 | 17.5%), Manufacturing (63 | 12.0%), Transportation & Warehousing (62 | 11.8%), Retail Trade (39 | 7.4%), and Administrative & Support (36 | 6.9%).
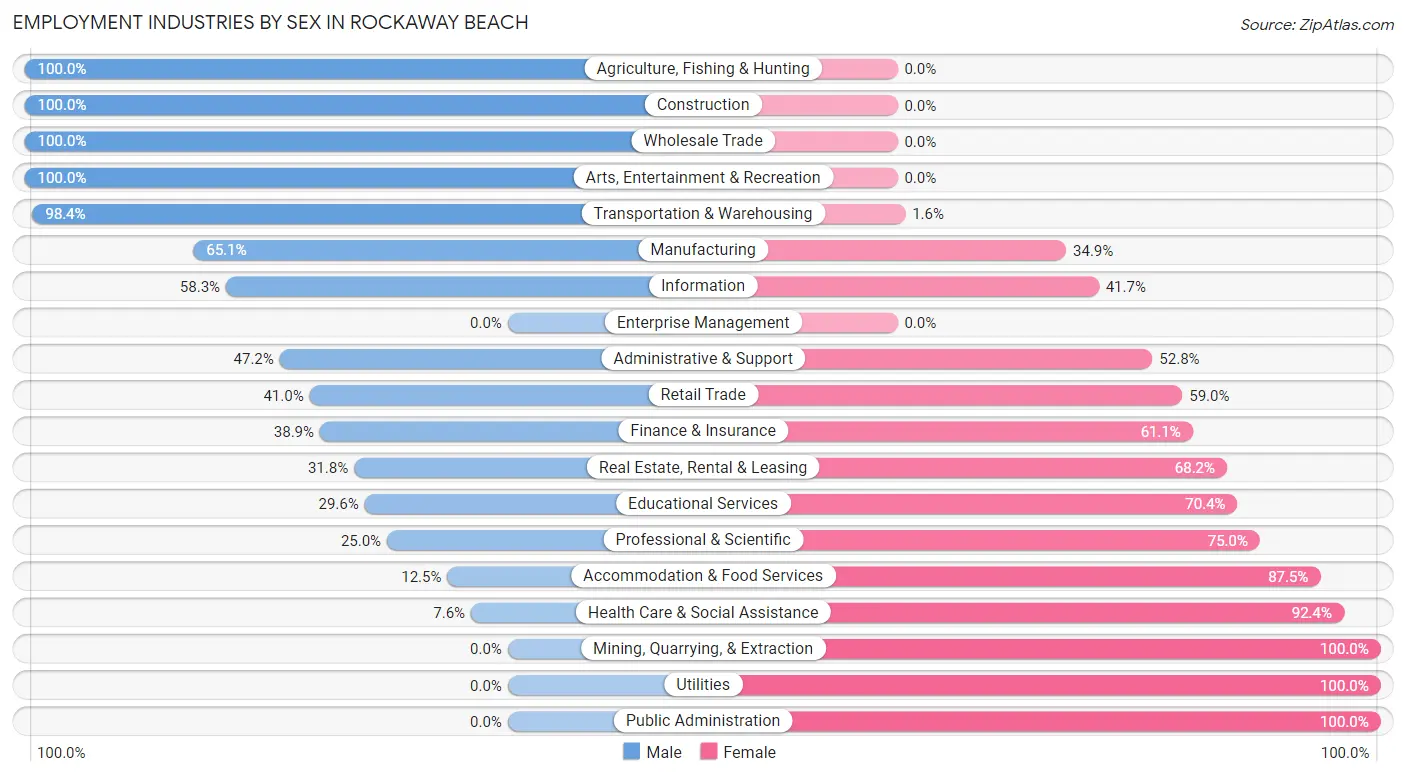
Employment Industries by Sex in Rockaway Beach
The Rockaway Beach industries that see more men than women are Agriculture, Fishing & Hunting (100.0%), Construction (100.0%), and Wholesale Trade (100.0%), whereas the industries that tend to have a higher number of women are Mining, Quarrying, & Extraction (100.0%), Utilities (100.0%), and Public Administration (100.0%).
| Industry | Male | Female |
| Agriculture, Fishing & Hunting | 10 (100.0%) | 0 (0.0%) |
| Mining, Quarrying, & Extraction | 0 (0.0%) | 3 (100.0%) |
| Construction | 4 (100.0%) | 0 (0.0%) |
| Manufacturing | 41 (65.1%) | 22 (34.9%) |
| Wholesale Trade | 5 (100.0%) | 0 (0.0%) |
| Retail Trade | 16 (41.0%) | 23 (59.0%) |
| Transportation & Warehousing | 61 (98.4%) | 1 (1.6%) |
| Utilities | 0 (0.0%) | 15 (100.0%) |
| Information | 7 (58.3%) | 5 (41.7%) |
| Finance & Insurance | 7 (38.9%) | 11 (61.1%) |
| Real Estate, Rental & Leasing | 7 (31.8%) | 15 (68.2%) |
| Professional & Scientific | 7 (25.0%) | 21 (75.0%) |
| Enterprise Management | 0 (0.0%) | 0 (0.0%) |
| Administrative & Support | 17 (47.2%) | 19 (52.8%) |
| Educational Services | 8 (29.6%) | 19 (70.4%) |
| Health Care & Social Assistance | 7 (7.6%) | 85 (92.4%) |
| Arts, Entertainment & Recreation | 13 (100.0%) | 0 (0.0%) |
| Accommodation & Food Services | 2 (12.5%) | 14 (87.5%) |
| Public Administration | 0 (0.0%) | 3 (100.0%) |
| Total | 265 (50.5%) | 260 (49.5%) |
Education in Rockaway Beach
School Enrollment in Rockaway Beach
The most common levels of schooling among the 322 students in Rockaway Beach are high school (177 | 55.0%), middle school (50 | 15.5%), and college / undergraduate (30 | 9.3%).
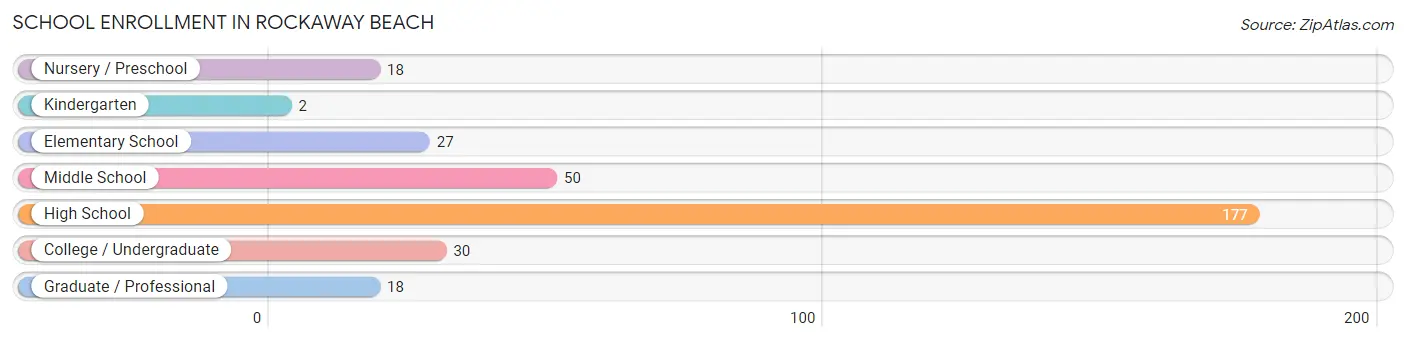
| School Level | # Students | % Students |
| Nursery / Preschool | 18 | 5.6% |
| Kindergarten | 2 | 0.6% |
| Elementary School | 27 | 8.4% |
| Middle School | 50 | 15.5% |
| High School | 177 | 55.0% |
| College / Undergraduate | 30 | 9.3% |
| Graduate / Professional | 18 | 5.6% |
| Total | 322 | 100.0% |
School Enrollment by Age by Funding Source in Rockaway Beach
Out of a total of 322 students who are enrolled in schools in Rockaway Beach, 108 (33.5%) attend a private institution, while the remaining 214 (66.5%) are enrolled in public schools. The age group of 20 to 24 year olds has the highest likelihood of being enrolled in private schools, with 9 (100.0% in the age bracket) enrolled. Conversely, the age group of 5 to 9 year old has the lowest likelihood of being enrolled in a private school, with 29 (100.0% in the age bracket) attending a public institution.
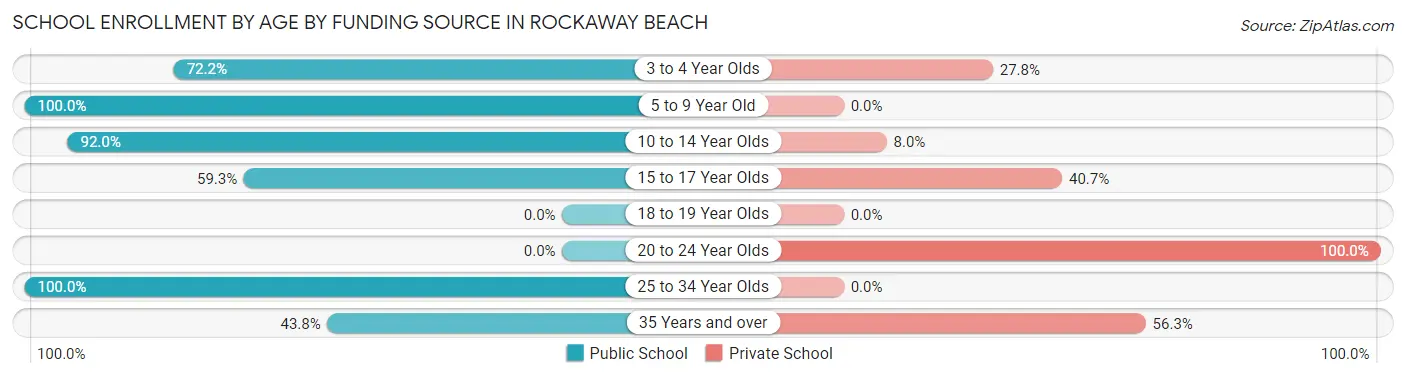
| Age Bracket | Public School | Private School |
| 3 to 4 Year Olds | 13 (72.2%) | 5 (27.8%) |
| 5 to 9 Year Old | 29 (100.0%) | 0 (0.0%) |
| 10 to 14 Year Olds | 46 (92.0%) | 4 (8.0%) |
| 15 to 17 Year Olds | 105 (59.3%) | 72 (40.7%) |
| 18 to 19 Year Olds | 0 (0.0%) | 0 (0.0%) |
| 20 to 24 Year Olds | 0 (0.0%) | 9 (100.0%) |
| 25 to 34 Year Olds | 7 (100.0%) | 0 (0.0%) |
| 35 Years and over | 14 (43.8%) | 18 (56.2%) |
| Total | 214 (66.5%) | 108 (33.5%) |
Educational Attainment by Field of Study in Rockaway Beach
Business (94 | 40.3%), social sciences (33 | 14.2%), visual & performing arts (17 | 7.3%), engineering (16 | 6.9%), and liberal arts & history (14 | 6.0%) are the most common fields of study among 233 individuals in Rockaway Beach who have obtained a bachelor's degree or higher.
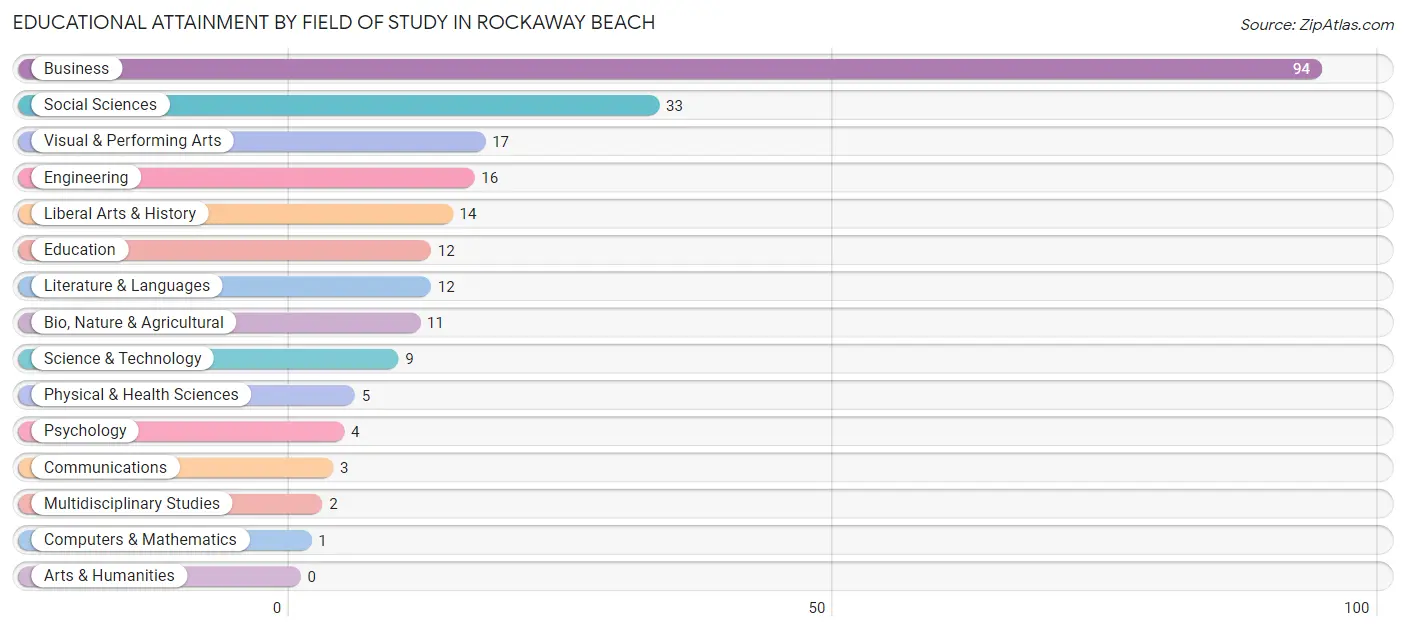
| Field of Study | # Graduates | % Graduates |
| Computers & Mathematics | 1 | 0.4% |
| Bio, Nature & Agricultural | 11 | 4.7% |
| Physical & Health Sciences | 5 | 2.1% |
| Psychology | 4 | 1.7% |
| Social Sciences | 33 | 14.2% |
| Engineering | 16 | 6.9% |
| Multidisciplinary Studies | 2 | 0.9% |
| Science & Technology | 9 | 3.9% |
| Business | 94 | 40.3% |
| Education | 12 | 5.1% |
| Literature & Languages | 12 | 5.1% |
| Liberal Arts & History | 14 | 6.0% |
| Visual & Performing Arts | 17 | 7.3% |
| Communications | 3 | 1.3% |
| Arts & Humanities | 0 | 0.0% |
| Total | 233 | 100.0% |
Transportation & Commute in Rockaway Beach
Vehicle Availability by Sex in Rockaway Beach
The most prevalent vehicle ownership categories in Rockaway Beach are males with 3 vehicles (119, accounting for 45.4%) and females with 3 vehicles (113, making up 45.3%).
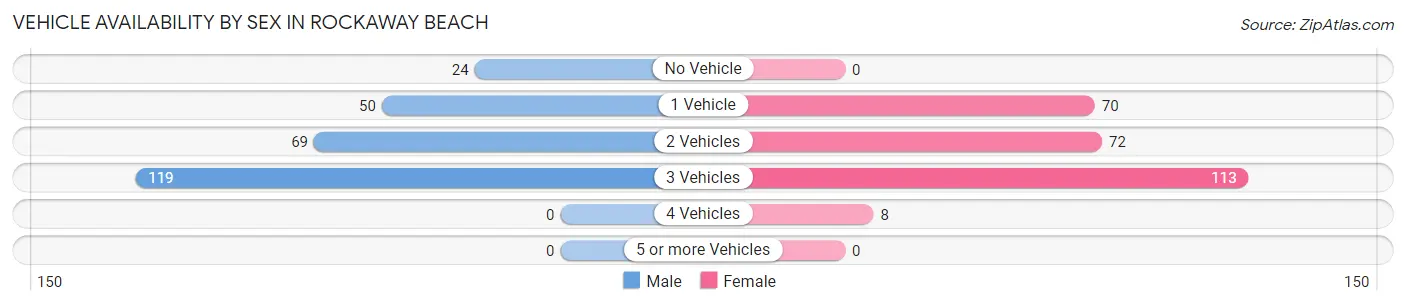
| Vehicles Available | Male | Female |
| No Vehicle | 24 (9.2%) | 0 (0.0%) |
| 1 Vehicle | 50 (19.1%) | 70 (26.6%) |
| 2 Vehicles | 69 (26.3%) | 72 (27.4%) |
| 3 Vehicles | 119 (45.4%) | 113 (43.0%) |
| 4 Vehicles | 0 (0.0%) | 8 (3.0%) |
| 5 or more Vehicles | 0 (0.0%) | 0 (0.0%) |
| Total | 262 (100.0%) | 263 (100.0%) |
Commute Time in Rockaway Beach
The most frequently occuring commute durations in Rockaway Beach are 5 to 9 minutes (102 commuters, 25.6%), 15 to 19 minutes (60 commuters, 15.1%), and 20 to 24 minutes (49 commuters, 12.3%).
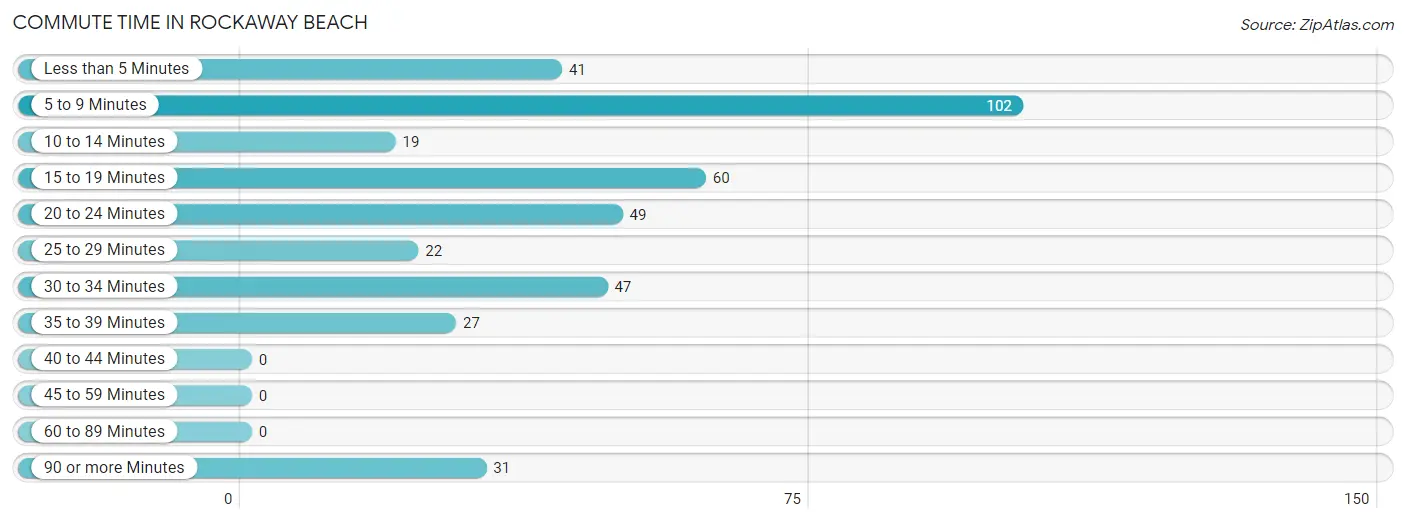
| Commute Time | # Commuters | % Commuters |
| Less than 5 Minutes | 41 | 10.3% |
| 5 to 9 Minutes | 102 | 25.6% |
| 10 to 14 Minutes | 19 | 4.8% |
| 15 to 19 Minutes | 60 | 15.1% |
| 20 to 24 Minutes | 49 | 12.3% |
| 25 to 29 Minutes | 22 | 5.5% |
| 30 to 34 Minutes | 47 | 11.8% |
| 35 to 39 Minutes | 27 | 6.8% |
| 40 to 44 Minutes | 0 | 0.0% |
| 45 to 59 Minutes | 0 | 0.0% |
| 60 to 89 Minutes | 0 | 0.0% |
| 90 or more Minutes | 31 | 7.8% |
Commute Time by Sex in Rockaway Beach
The most common commute times in Rockaway Beach are 5 to 9 minutes (91 commuters, 40.6%) for males and 20 to 24 minutes (38 commuters, 21.8%) for females.
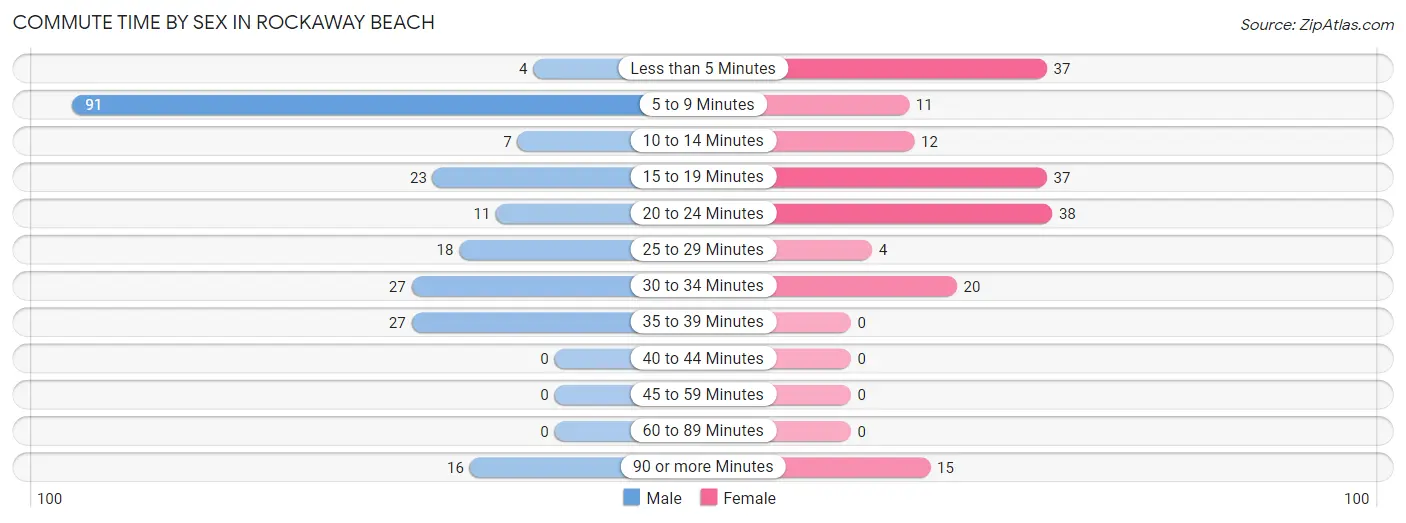
| Commute Time | Male | Female |
| Less than 5 Minutes | 4 (1.8%) | 37 (21.3%) |
| 5 to 9 Minutes | 91 (40.6%) | 11 (6.3%) |
| 10 to 14 Minutes | 7 (3.1%) | 12 (6.9%) |
| 15 to 19 Minutes | 23 (10.3%) | 37 (21.3%) |
| 20 to 24 Minutes | 11 (4.9%) | 38 (21.8%) |
| 25 to 29 Minutes | 18 (8.0%) | 4 (2.3%) |
| 30 to 34 Minutes | 27 (12.0%) | 20 (11.5%) |
| 35 to 39 Minutes | 27 (12.0%) | 0 (0.0%) |
| 40 to 44 Minutes | 0 (0.0%) | 0 (0.0%) |
| 45 to 59 Minutes | 0 (0.0%) | 0 (0.0%) |
| 60 to 89 Minutes | 0 (0.0%) | 0 (0.0%) |
| 90 or more Minutes | 16 (7.1%) | 15 (8.6%) |
Time of Departure to Work by Sex in Rockaway Beach
The most frequent times of departure to work in Rockaway Beach are 8:00 AM to 8:29 AM (65, 29.0%) for males and 5:30 AM to 5:59 AM (57, 32.8%) for females.
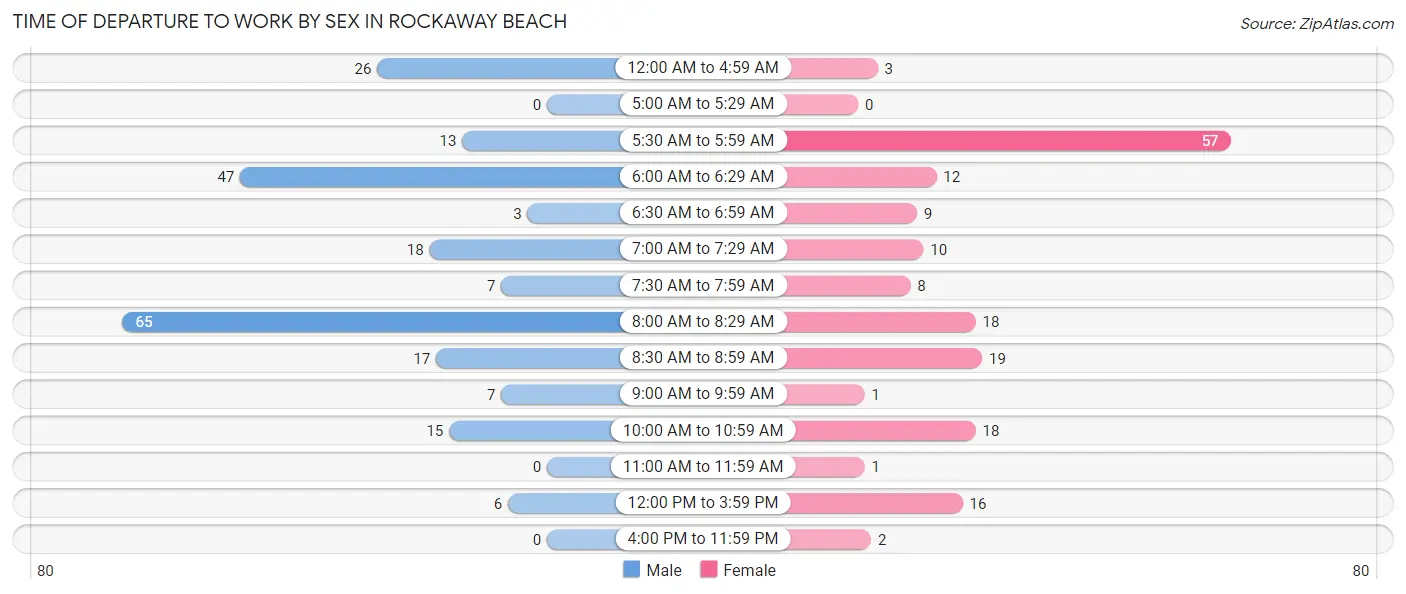
| Time of Departure | Male | Female |
| 12:00 AM to 4:59 AM | 26 (11.6%) | 3 (1.7%) |
| 5:00 AM to 5:29 AM | 0 (0.0%) | 0 (0.0%) |
| 5:30 AM to 5:59 AM | 13 (5.8%) | 57 (32.8%) |
| 6:00 AM to 6:29 AM | 47 (21.0%) | 12 (6.9%) |
| 6:30 AM to 6:59 AM | 3 (1.3%) | 9 (5.2%) |
| 7:00 AM to 7:29 AM | 18 (8.0%) | 10 (5.8%) |
| 7:30 AM to 7:59 AM | 7 (3.1%) | 8 (4.6%) |
| 8:00 AM to 8:29 AM | 65 (29.0%) | 18 (10.3%) |
| 8:30 AM to 8:59 AM | 17 (7.6%) | 19 (10.9%) |
| 9:00 AM to 9:59 AM | 7 (3.1%) | 1 (0.6%) |
| 10:00 AM to 10:59 AM | 15 (6.7%) | 18 (10.3%) |
| 11:00 AM to 11:59 AM | 0 (0.0%) | 1 (0.6%) |
| 12:00 PM to 3:59 PM | 6 (2.7%) | 16 (9.2%) |
| 4:00 PM to 11:59 PM | 0 (0.0%) | 2 (1.1%) |
| Total | 224 (100.0%) | 174 (100.0%) |
Housing Occupancy in Rockaway Beach
Occupancy by Ownership in Rockaway Beach
Of the total 621 dwellings in Rockaway Beach, owner-occupied units account for 452 (72.8%), while renter-occupied units make up 169 (27.2%).
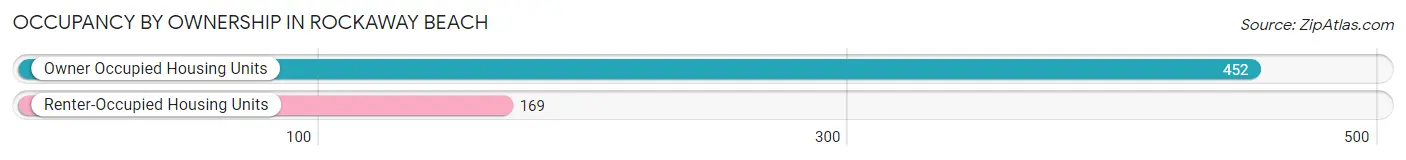
| Occupancy | # Housing Units | % Housing Units |
| Owner Occupied Housing Units | 452 | 72.8% |
| Renter-Occupied Housing Units | 169 | 27.2% |
| Total Occupied Housing Units | 621 | 100.0% |
Occupancy by Household Size in Rockaway Beach
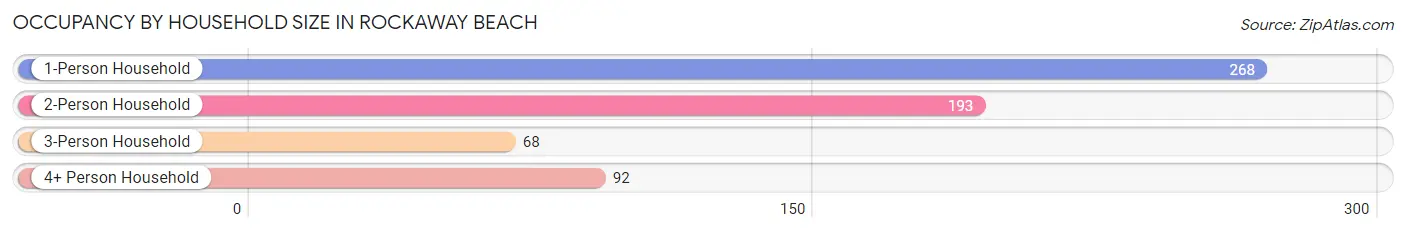
| Household Size | # Housing Units | % Housing Units |
| 1-Person Household | 268 | 43.2% |
| 2-Person Household | 193 | 31.1% |
| 3-Person Household | 68 | 11.0% |
| 4+ Person Household | 92 | 14.8% |
| Total Housing Units | 621 | 100.0% |
Occupancy by Ownership by Household Size in Rockaway Beach
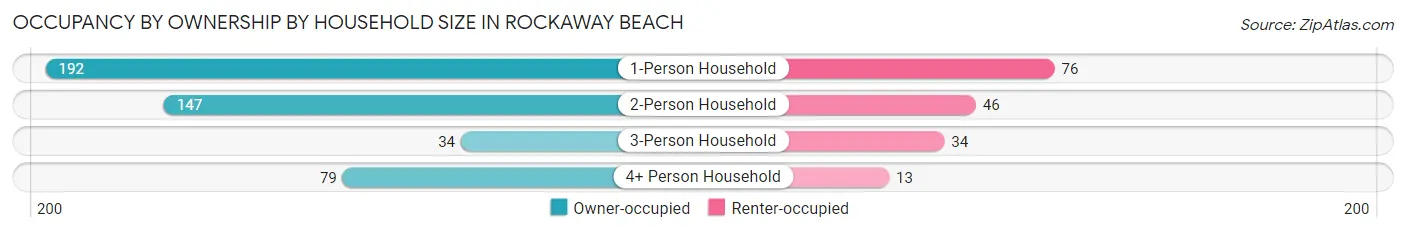
| Household Size | Owner-occupied | Renter-occupied |
| 1-Person Household | 192 (71.6%) | 76 (28.4%) |
| 2-Person Household | 147 (76.2%) | 46 (23.8%) |
| 3-Person Household | 34 (50.0%) | 34 (50.0%) |
| 4+ Person Household | 79 (85.9%) | 13 (14.1%) |
| Total Housing Units | 452 (72.8%) | 169 (27.2%) |
Occupancy by Educational Attainment in Rockaway Beach
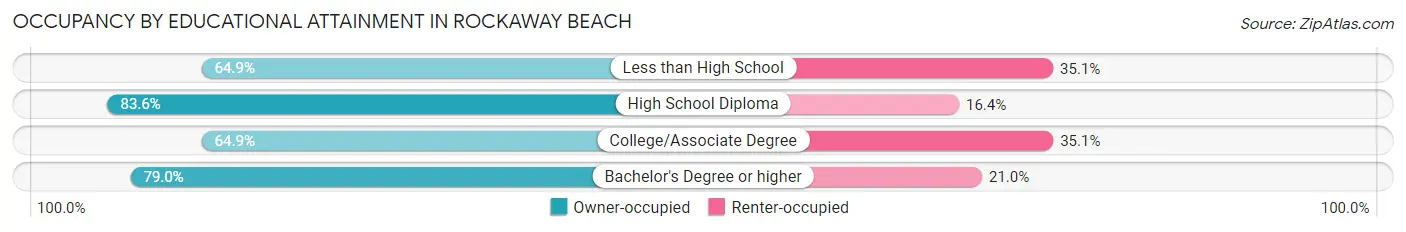
| Household Size | Owner-occupied | Renter-occupied |
| Less than High School | 37 (64.9%) | 20 (35.1%) |
| High School Diploma | 117 (83.6%) | 23 (16.4%) |
| College/Associate Degree | 170 (64.9%) | 92 (35.1%) |
| Bachelor's Degree or higher | 128 (79.0%) | 34 (21.0%) |
Occupancy by Age of Householder in Rockaway Beach
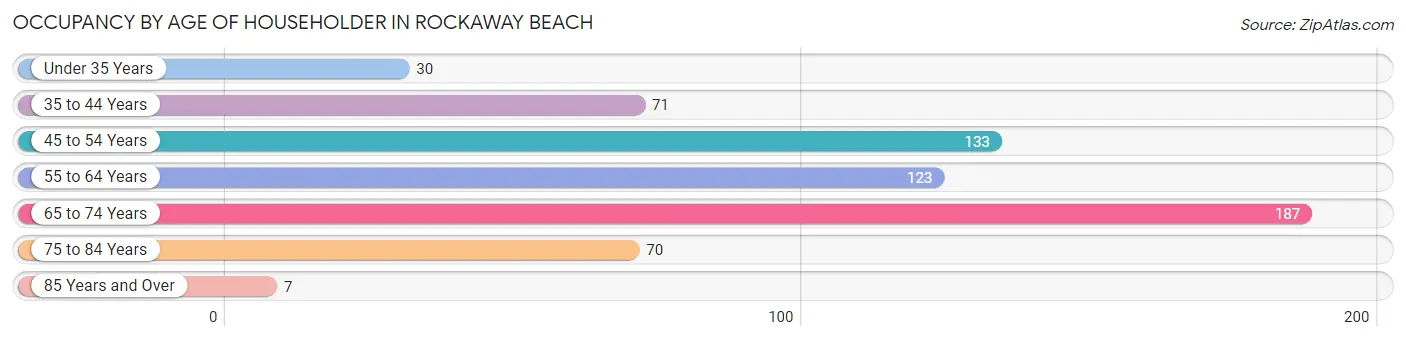
| Age Bracket | # Households | % Households |
| Under 35 Years | 30 | 4.8% |
| 35 to 44 Years | 71 | 11.4% |
| 45 to 54 Years | 133 | 21.4% |
| 55 to 64 Years | 123 | 19.8% |
| 65 to 74 Years | 187 | 30.1% |
| 75 to 84 Years | 70 | 11.3% |
| 85 Years and Over | 7 | 1.1% |
| Total | 621 | 100.0% |
Housing Finances in Rockaway Beach
Median Income by Occupancy in Rockaway Beach
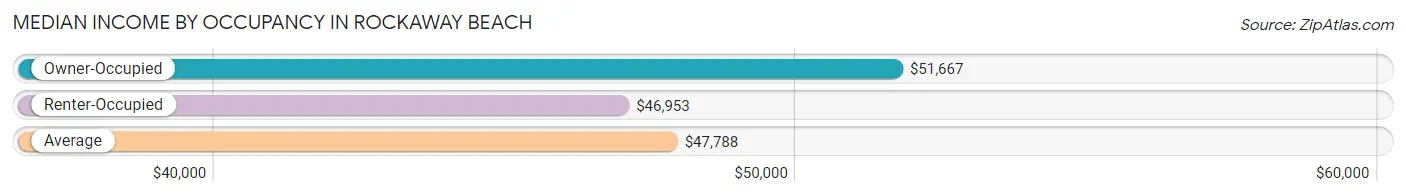
| Occupancy Type | # Households | Median Income |
| Owner-Occupied | 452 (72.8%) | $51,667 |
| Renter-Occupied | 169 (27.2%) | $46,953 |
| Average | 621 (100.0%) | $47,788 |
Occupancy by Householder Income Bracket in Rockaway Beach
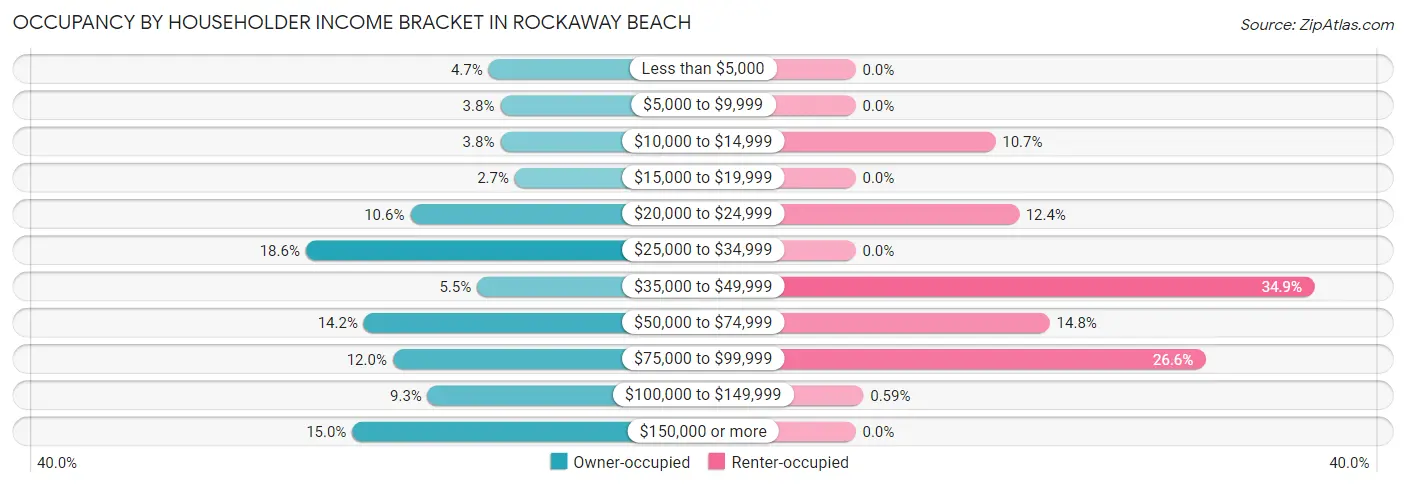
| Income Bracket | Owner-occupied | Renter-occupied |
| Less than $5,000 | 21 (4.6%) | 0 (0.0%) |
| $5,000 to $9,999 | 17 (3.8%) | 0 (0.0%) |
| $10,000 to $14,999 | 17 (3.8%) | 18 (10.6%) |
| $15,000 to $19,999 | 12 (2.6%) | 0 (0.0%) |
| $20,000 to $24,999 | 48 (10.6%) | 21 (12.4%) |
| $25,000 to $34,999 | 84 (18.6%) | 0 (0.0%) |
| $35,000 to $49,999 | 25 (5.5%) | 59 (34.9%) |
| $50,000 to $74,999 | 64 (14.2%) | 25 (14.8%) |
| $75,000 to $99,999 | 54 (11.9%) | 45 (26.6%) |
| $100,000 to $149,999 | 42 (9.3%) | 1 (0.6%) |
| $150,000 or more | 68 (15.0%) | 0 (0.0%) |
| Total | 452 (100.0%) | 169 (100.0%) |
Monthly Housing Cost Tiers in Rockaway Beach
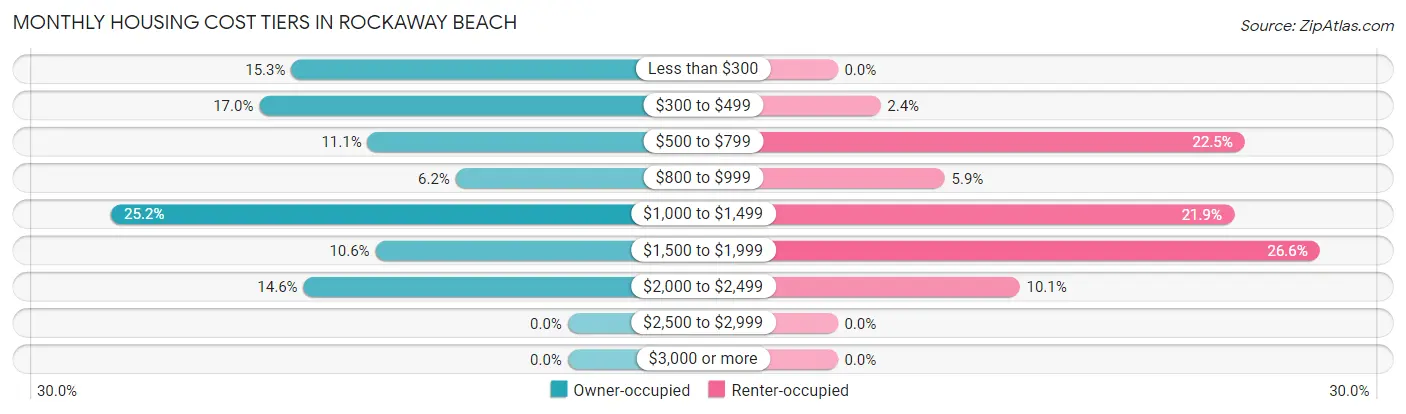
| Monthly Cost | Owner-occupied | Renter-occupied |
| Less than $300 | 69 (15.3%) | 0 (0.0%) |
| $300 to $499 | 77 (17.0%) | 4 (2.4%) |
| $500 to $799 | 50 (11.1%) | 38 (22.5%) |
| $800 to $999 | 28 (6.2%) | 10 (5.9%) |
| $1,000 to $1,499 | 114 (25.2%) | 37 (21.9%) |
| $1,500 to $1,999 | 48 (10.6%) | 45 (26.6%) |
| $2,000 to $2,499 | 66 (14.6%) | 17 (10.1%) |
| $2,500 to $2,999 | 0 (0.0%) | 0 (0.0%) |
| $3,000 or more | 0 (0.0%) | 0 (0.0%) |
| Total | 452 (100.0%) | 169 (100.0%) |
Physical Housing Characteristics in Rockaway Beach
Housing Structures in Rockaway Beach
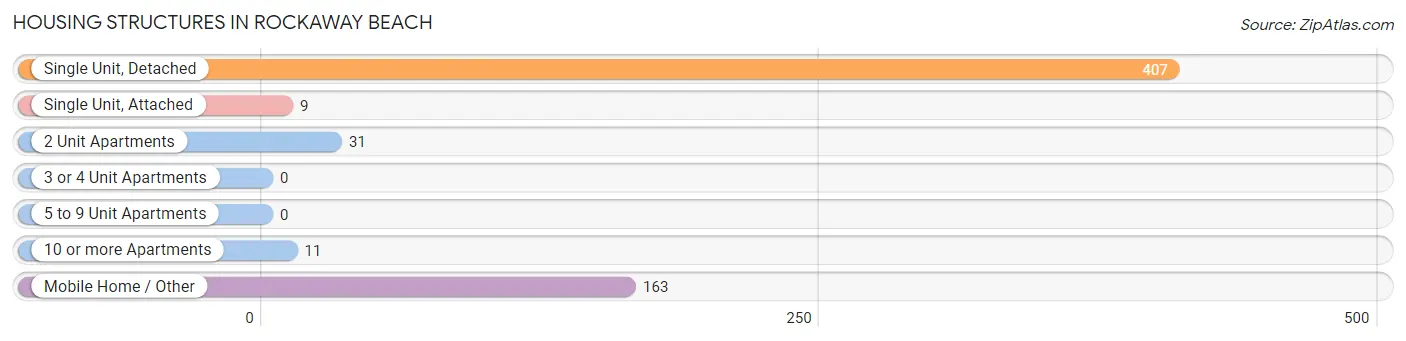
| Structure Type | # Housing Units | % Housing Units |
| Single Unit, Detached | 407 | 65.5% |
| Single Unit, Attached | 9 | 1.5% |
| 2 Unit Apartments | 31 | 5.0% |
| 3 or 4 Unit Apartments | 0 | 0.0% |
| 5 to 9 Unit Apartments | 0 | 0.0% |
| 10 or more Apartments | 11 | 1.8% |
| Mobile Home / Other | 163 | 26.3% |
| Total | 621 | 100.0% |
Housing Structures by Occupancy in Rockaway Beach
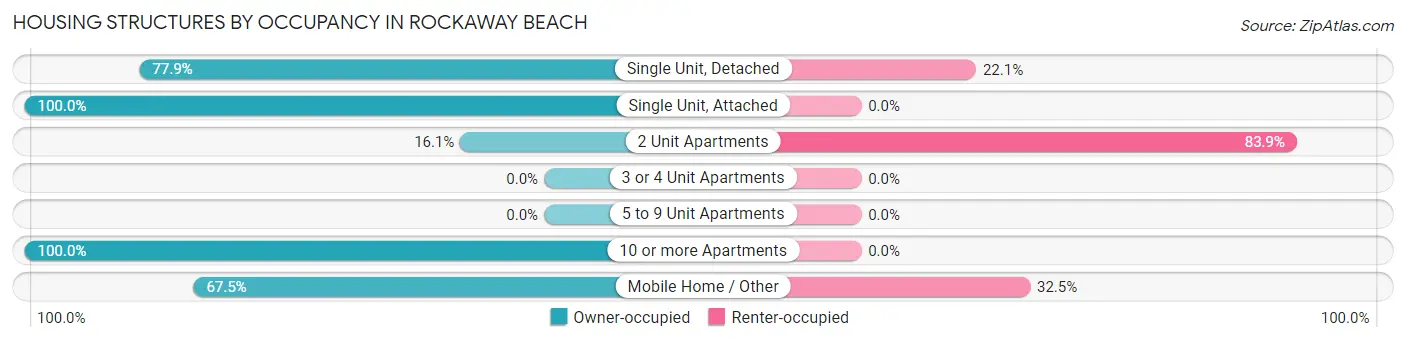
| Structure Type | Owner-occupied | Renter-occupied |
| Single Unit, Detached | 317 (77.9%) | 90 (22.1%) |
| Single Unit, Attached | 9 (100.0%) | 0 (0.0%) |
| 2 Unit Apartments | 5 (16.1%) | 26 (83.9%) |
| 3 or 4 Unit Apartments | 0 (0.0%) | 0 (0.0%) |
| 5 to 9 Unit Apartments | 0 (0.0%) | 0 (0.0%) |
| 10 or more Apartments | 11 (100.0%) | 0 (0.0%) |
| Mobile Home / Other | 110 (67.5%) | 53 (32.5%) |
| Total | 452 (72.8%) | 169 (27.2%) |
Housing Structures by Number of Rooms in Rockaway Beach
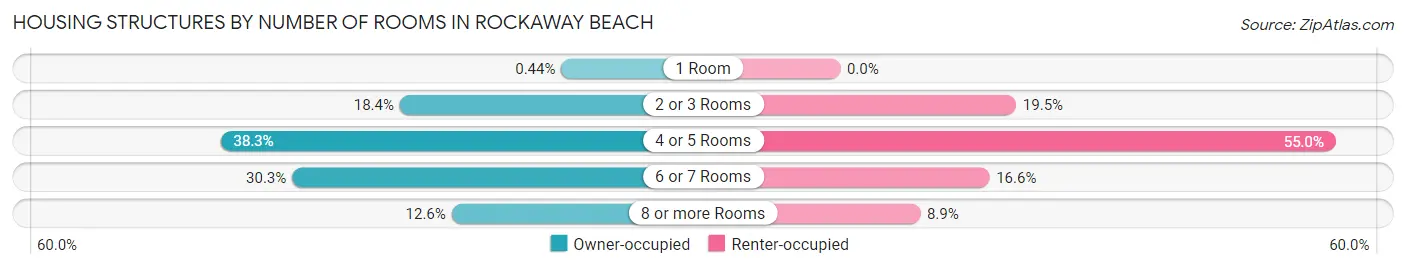
| Number of Rooms | Owner-occupied | Renter-occupied |
| 1 Room | 2 (0.4%) | 0 (0.0%) |
| 2 or 3 Rooms | 83 (18.4%) | 33 (19.5%) |
| 4 or 5 Rooms | 173 (38.3%) | 93 (55.0%) |
| 6 or 7 Rooms | 137 (30.3%) | 28 (16.6%) |
| 8 or more Rooms | 57 (12.6%) | 15 (8.9%) |
| Total | 452 (100.0%) | 169 (100.0%) |
Housing Structure by Heating Type in Rockaway Beach
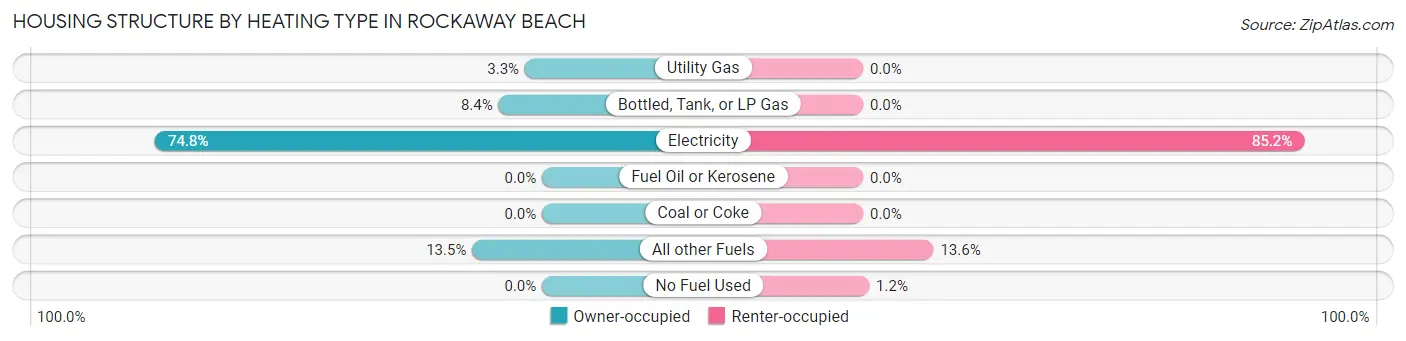
| Heating Type | Owner-occupied | Renter-occupied |
| Utility Gas | 15 (3.3%) | 0 (0.0%) |
| Bottled, Tank, or LP Gas | 38 (8.4%) | 0 (0.0%) |
| Electricity | 338 (74.8%) | 144 (85.2%) |
| Fuel Oil or Kerosene | 0 (0.0%) | 0 (0.0%) |
| Coal or Coke | 0 (0.0%) | 0 (0.0%) |
| All other Fuels | 61 (13.5%) | 23 (13.6%) |
| No Fuel Used | 0 (0.0%) | 2 (1.2%) |
| Total | 452 (100.0%) | 169 (100.0%) |
Household Vehicle Usage in Rockaway Beach
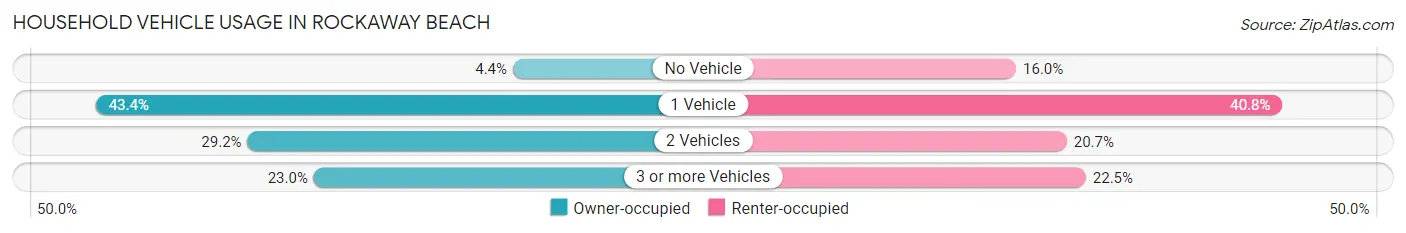
| Vehicles per Household | Owner-occupied | Renter-occupied |
| No Vehicle | 20 (4.4%) | 27 (16.0%) |
| 1 Vehicle | 196 (43.4%) | 69 (40.8%) |
| 2 Vehicles | 132 (29.2%) | 35 (20.7%) |
| 3 or more Vehicles | 104 (23.0%) | 38 (22.5%) |
| Total | 452 (100.0%) | 169 (100.0%) |
Real Estate & Mortgages in Rockaway Beach
Real Estate and Mortgage Overview in Rockaway Beach
| Characteristic | Without Mortgage | With Mortgage |
| Housing Units | 206 | 246 |
| Median Property Value | $255,300 | $343,200 |
| Median Household Income | $31,176 | $60 |
| Monthly Housing Costs | $409 | $0 |
| Real Estate Taxes | $1,382 | $10 |
Property Value by Mortgage Status in Rockaway Beach
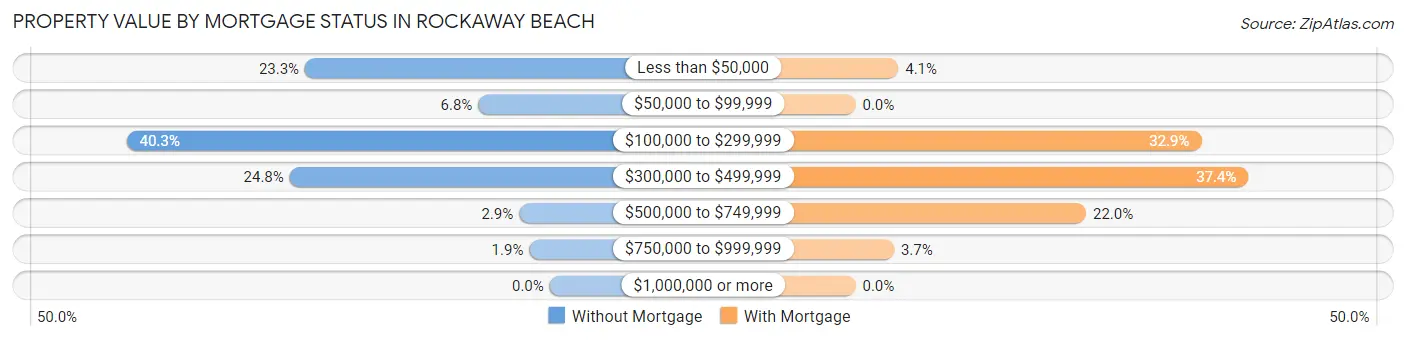
| Property Value | Without Mortgage | With Mortgage |
| Less than $50,000 | 48 (23.3%) | 10 (4.1%) |
| $50,000 to $99,999 | 14 (6.8%) | 0 (0.0%) |
| $100,000 to $299,999 | 83 (40.3%) | 81 (32.9%) |
| $300,000 to $499,999 | 51 (24.8%) | 92 (37.4%) |
| $500,000 to $749,999 | 6 (2.9%) | 54 (22.0%) |
| $750,000 to $999,999 | 4 (1.9%) | 9 (3.7%) |
| $1,000,000 or more | 0 (0.0%) | 0 (0.0%) |
| Total | 206 (100.0%) | 246 (100.0%) |
Household Income by Mortgage Status in Rockaway Beach
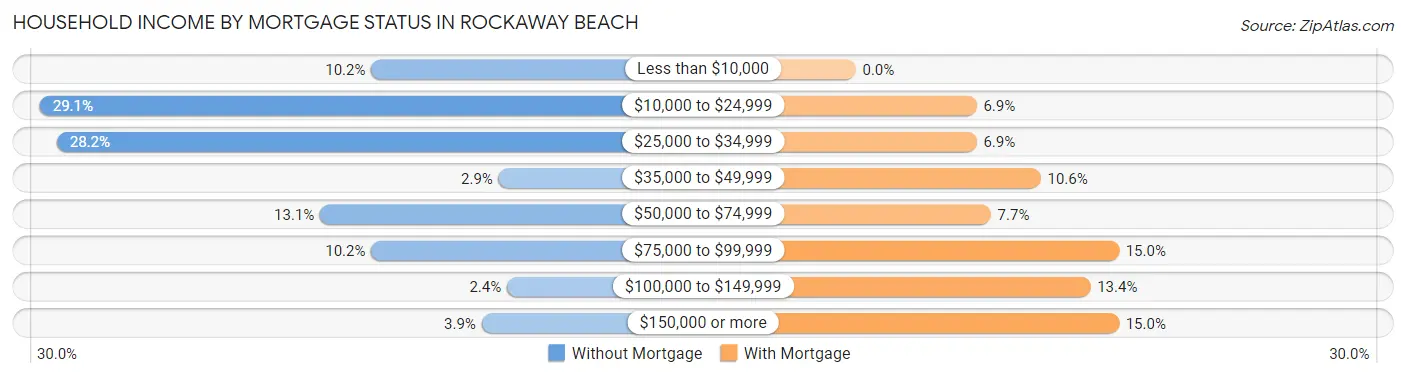
| Household Income | Without Mortgage | With Mortgage |
| Less than $10,000 | 21 (10.2%) | 0 (0.0%) |
| $10,000 to $24,999 | 60 (29.1%) | 17 (6.9%) |
| $25,000 to $34,999 | 58 (28.2%) | 17 (6.9%) |
| $35,000 to $49,999 | 6 (2.9%) | 26 (10.6%) |
| $50,000 to $74,999 | 27 (13.1%) | 19 (7.7%) |
| $75,000 to $99,999 | 21 (10.2%) | 37 (15.0%) |
| $100,000 to $149,999 | 5 (2.4%) | 33 (13.4%) |
| $150,000 or more | 8 (3.9%) | 37 (15.0%) |
| Total | 206 (100.0%) | 246 (100.0%) |
Property Value to Household Income Ratio in Rockaway Beach
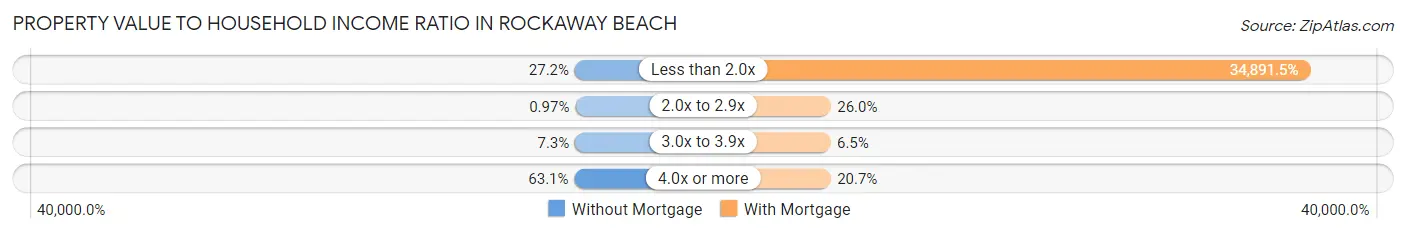
| Value-to-Income Ratio | Without Mortgage | With Mortgage |
| Less than 2.0x | 56 (27.2%) | 85,833 (34,891.5%) |
| 2.0x to 2.9x | 2 (1.0%) | 64 (26.0%) |
| 3.0x to 3.9x | 15 (7.3%) | 16 (6.5%) |
| 4.0x or more | 130 (63.1%) | 51 (20.7%) |
| Total | 206 (100.0%) | 246 (100.0%) |
Real Estate Taxes by Mortgage Status in Rockaway Beach
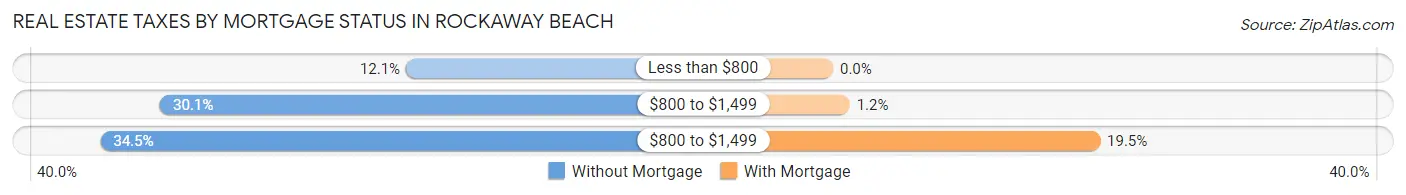
| Property Taxes | Without Mortgage | With Mortgage |
| Less than $800 | 25 (12.1%) | 0 (0.0%) |
| $800 to $1,499 | 62 (30.1%) | 3 (1.2%) |
| $800 to $1,499 | 71 (34.5%) | 48 (19.5%) |
| Total | 206 (100.0%) | 246 (100.0%) |
Health & Disability in Rockaway Beach
Health Insurance Coverage by Age in Rockaway Beach
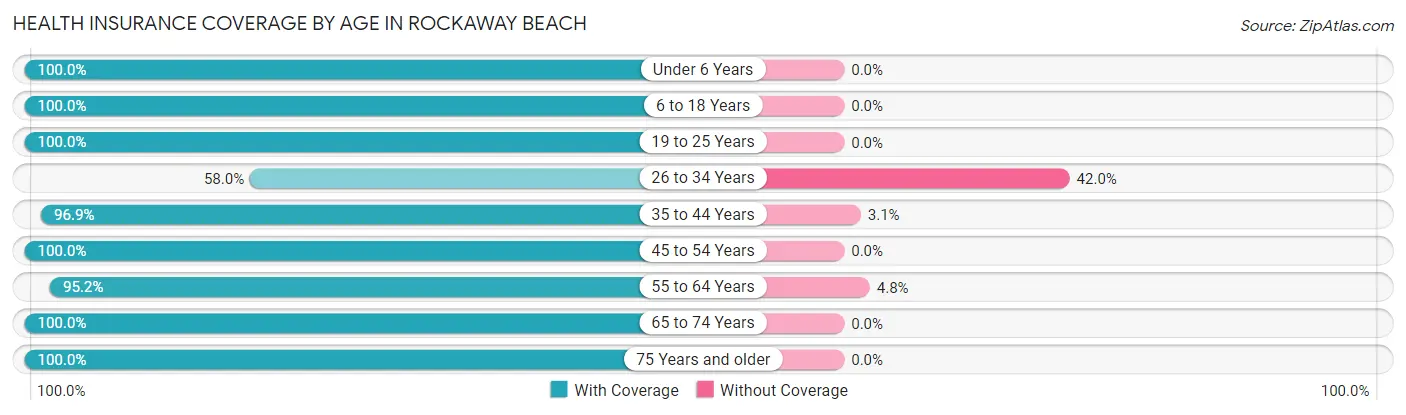
| Age Bracket | With Coverage | Without Coverage |
| Under 6 Years | 21 (100.0%) | 0 (0.0%) |
| 6 to 18 Years | 267 (100.0%) | 0 (0.0%) |
| 19 to 25 Years | 63 (100.0%) | 0 (0.0%) |
| 26 to 34 Years | 40 (58.0%) | 29 (42.0%) |
| 35 to 44 Years | 157 (96.9%) | 5 (3.1%) |
| 45 to 54 Years | 223 (100.0%) | 0 (0.0%) |
| 55 to 64 Years | 240 (95.2%) | 12 (4.8%) |
| 65 to 74 Years | 232 (100.0%) | 0 (0.0%) |
| 75 Years and older | 101 (100.0%) | 0 (0.0%) |
| Total | 1,344 (96.7%) | 46 (3.3%) |
Health Insurance Coverage by Citizenship Status in Rockaway Beach
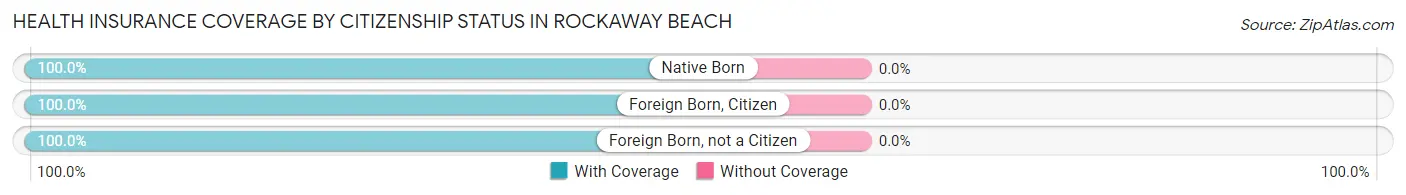
| Citizenship Status | With Coverage | Without Coverage |
| Native Born | 21 (100.0%) | 0 (0.0%) |
| Foreign Born, Citizen | 267 (100.0%) | 0 (0.0%) |
| Foreign Born, not a Citizen | 63 (100.0%) | 0 (0.0%) |
Health Insurance Coverage by Household Income in Rockaway Beach
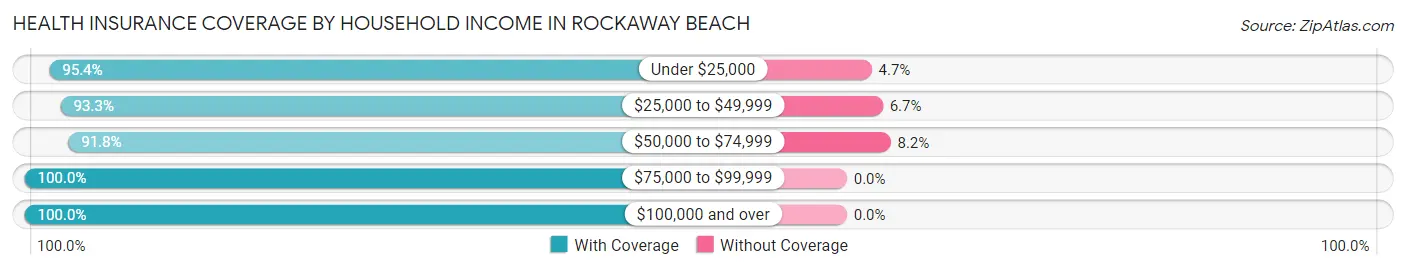
| Household Income | With Coverage | Without Coverage |
| Under $25,000 | 205 (95.4%) | 10 (4.6%) |
| $25,000 to $49,999 | 305 (93.3%) | 22 (6.7%) |
| $50,000 to $74,999 | 157 (91.8%) | 14 (8.2%) |
| $75,000 to $99,999 | 235 (100.0%) | 0 (0.0%) |
| $100,000 and over | 437 (100.0%) | 0 (0.0%) |
Public vs Private Health Insurance Coverage by Age in Rockaway Beach
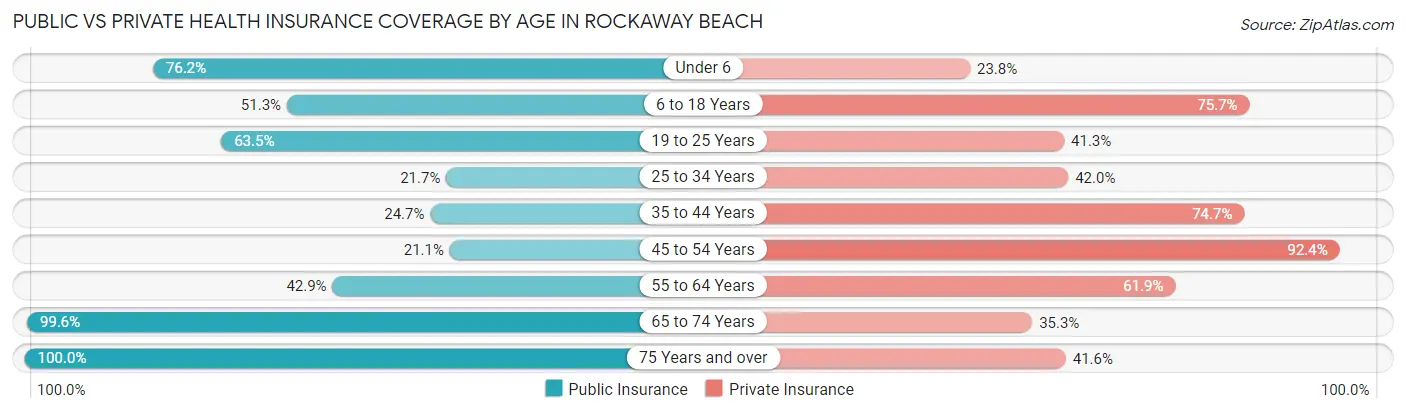
| Age Bracket | Public Insurance | Private Insurance |
| Under 6 | 16 (76.2%) | 5 (23.8%) |
| 6 to 18 Years | 137 (51.3%) | 202 (75.7%) |
| 19 to 25 Years | 40 (63.5%) | 26 (41.3%) |
| 25 to 34 Years | 15 (21.7%) | 29 (42.0%) |
| 35 to 44 Years | 40 (24.7%) | 121 (74.7%) |
| 45 to 54 Years | 47 (21.1%) | 206 (92.4%) |
| 55 to 64 Years | 108 (42.9%) | 156 (61.9%) |
| 65 to 74 Years | 231 (99.6%) | 82 (35.3%) |
| 75 Years and over | 101 (100.0%) | 42 (41.6%) |
| Total | 735 (52.9%) | 869 (62.5%) |
Disability Status by Sex by Age in Rockaway Beach
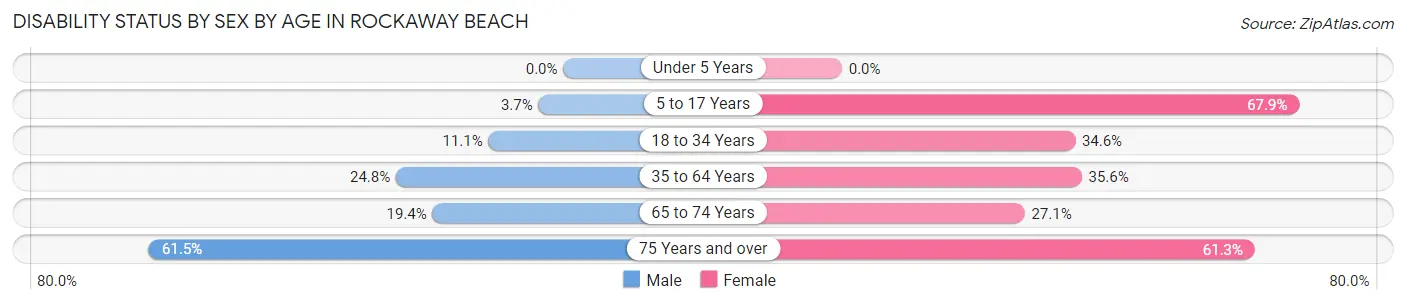
| Age Bracket | Male | Female |
| Under 5 Years | 0 (0.0%) | 0 (0.0%) |
| 5 to 17 Years | 6 (3.7%) | 72 (67.9%) |
| 18 to 34 Years | 6 (11.1%) | 27 (34.6%) |
| 35 to 64 Years | 78 (24.8%) | 115 (35.6%) |
| 65 to 74 Years | 20 (19.4%) | 35 (27.1%) |
| 75 Years and over | 16 (61.5%) | 46 (61.3%) |
Disability Class by Sex by Age in Rockaway Beach
Disability Class: Hearing Difficulty
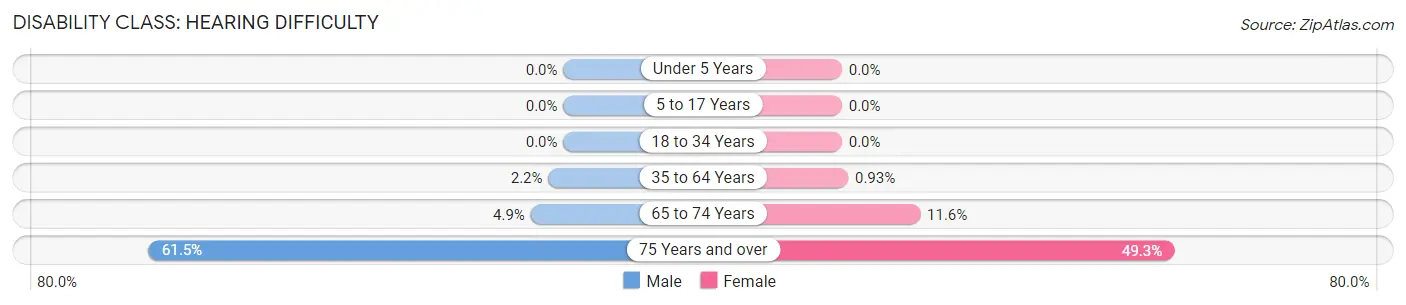
| Age Bracket | Male | Female |
| Under 5 Years | 0 (0.0%) | 0 (0.0%) |
| 5 to 17 Years | 0 (0.0%) | 0 (0.0%) |
| 18 to 34 Years | 0 (0.0%) | 0 (0.0%) |
| 35 to 64 Years | 7 (2.2%) | 3 (0.9%) |
| 65 to 74 Years | 5 (4.9%) | 15 (11.6%) |
| 75 Years and over | 16 (61.5%) | 37 (49.3%) |
Disability Class: Vision Difficulty
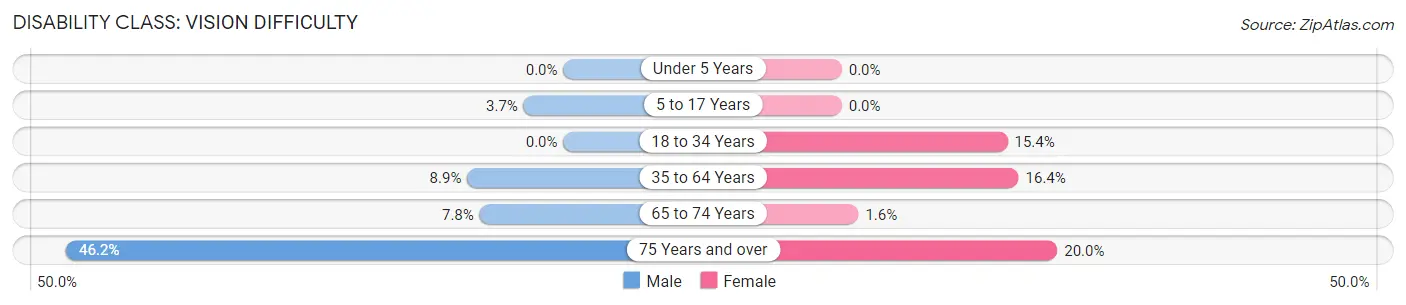
| Age Bracket | Male | Female |
| Under 5 Years | 0 (0.0%) | 0 (0.0%) |
| 5 to 17 Years | 6 (3.7%) | 0 (0.0%) |
| 18 to 34 Years | 0 (0.0%) | 12 (15.4%) |
| 35 to 64 Years | 28 (8.9%) | 53 (16.4%) |
| 65 to 74 Years | 8 (7.8%) | 2 (1.5%) |
| 75 Years and over | 12 (46.2%) | 15 (20.0%) |
Disability Class: Cognitive Difficulty
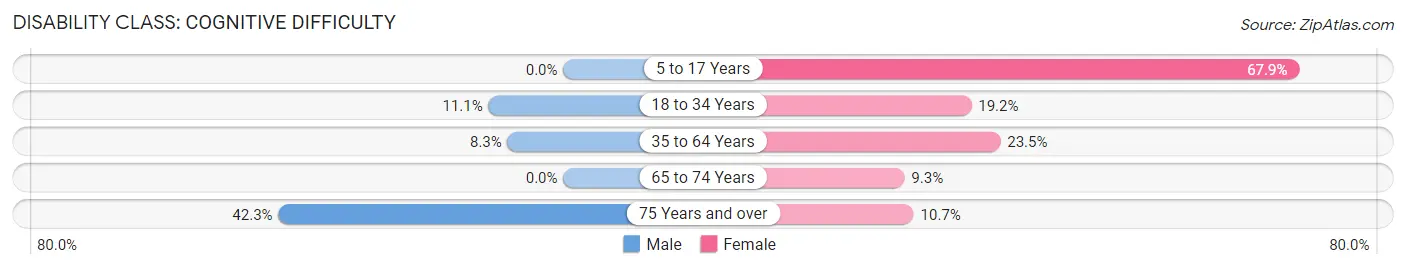
| Age Bracket | Male | Female |
| 5 to 17 Years | 0 (0.0%) | 72 (67.9%) |
| 18 to 34 Years | 6 (11.1%) | 15 (19.2%) |
| 35 to 64 Years | 26 (8.3%) | 76 (23.5%) |
| 65 to 74 Years | 0 (0.0%) | 12 (9.3%) |
| 75 Years and over | 11 (42.3%) | 8 (10.7%) |
Disability Class: Ambulatory Difficulty
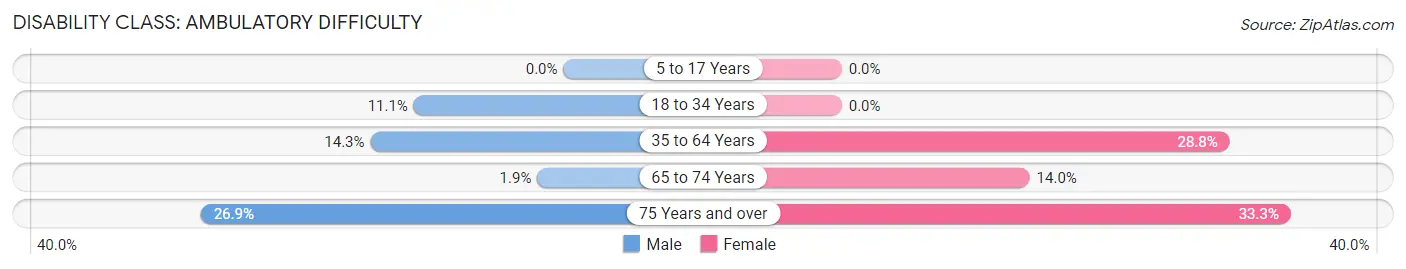
| Age Bracket | Male | Female |
| 5 to 17 Years | 0 (0.0%) | 0 (0.0%) |
| 18 to 34 Years | 6 (11.1%) | 0 (0.0%) |
| 35 to 64 Years | 45 (14.3%) | 93 (28.8%) |
| 65 to 74 Years | 2 (1.9%) | 18 (14.0%) |
| 75 Years and over | 7 (26.9%) | 25 (33.3%) |
Disability Class: Self-Care Difficulty
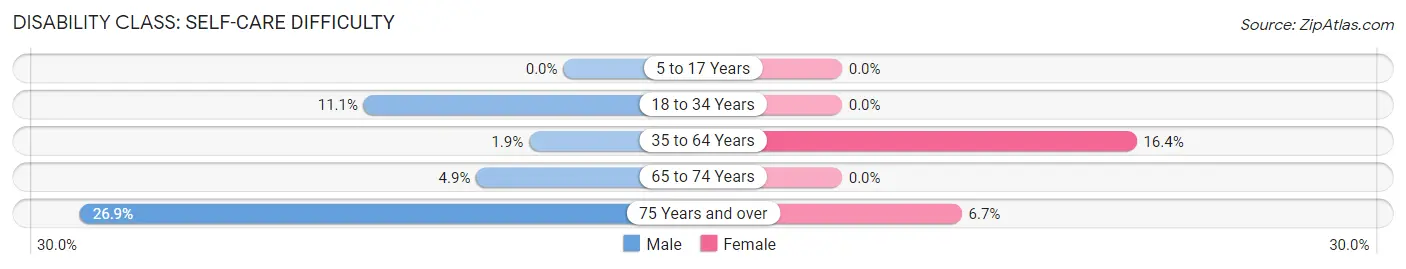
| Age Bracket | Male | Female |
| 5 to 17 Years | 0 (0.0%) | 0 (0.0%) |
| 18 to 34 Years | 6 (11.1%) | 0 (0.0%) |
| 35 to 64 Years | 6 (1.9%) | 53 (16.4%) |
| 65 to 74 Years | 5 (4.9%) | 0 (0.0%) |
| 75 Years and over | 7 (26.9%) | 5 (6.7%) |
Technology Access in Rockaway Beach
Computing Device Access in Rockaway Beach
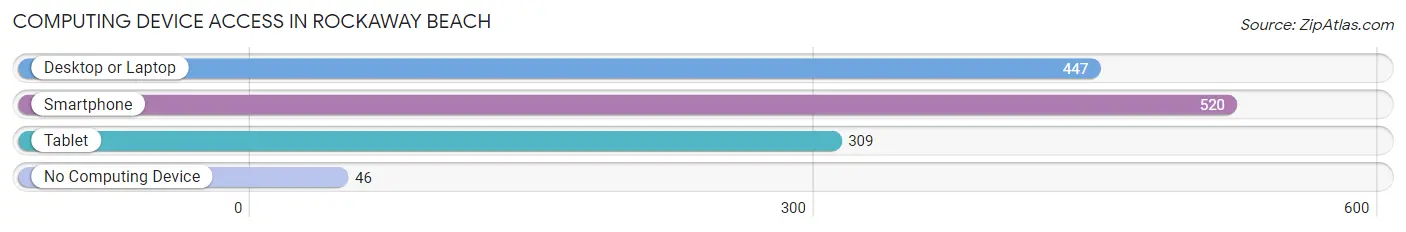
| Device Type | # Households | % Households |
| Desktop or Laptop | 447 | 72.0% |
| Smartphone | 520 | 83.7% |
| Tablet | 309 | 49.8% |
| No Computing Device | 46 | 7.4% |
| Total | 621 | 100.0% |
Internet Access in Rockaway Beach
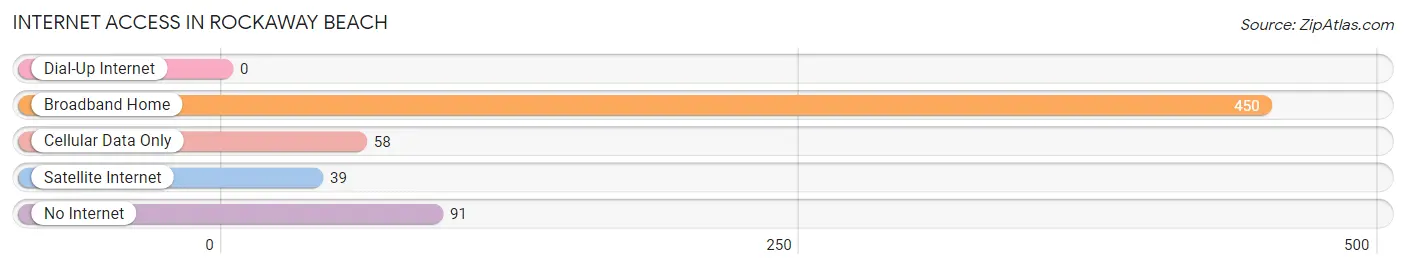
| Internet Type | # Households | % Households |
| Dial-Up Internet | 0 | 0.0% |
| Broadband Home | 450 | 72.5% |
| Cellular Data Only | 58 | 9.3% |
| Satellite Internet | 39 | 6.3% |
| No Internet | 91 | 14.6% |
| Total | 621 | 100.0% |
Rockaway Beach Summary
Introduction
Rockaway Beach is a small coastal town located in Tillamook County, Oregon. It is situated on the Pacific Ocean, approximately 70 miles west of Portland. The town is known for its beautiful beaches, fishing, and outdoor activities. It is a popular tourist destination, with many visitors coming to enjoy the scenery and activities.
History
Rockaway Beach was first settled in the late 1800s by a group of settlers from the Midwest. The town was originally called “Rockaway”, but the name was changed to “Rockaway Beach” in the early 1900s. The town was incorporated in 1913.
The town was originally a fishing and logging community, with the main industry being the harvesting of timber. The timber industry was the main source of income for the town until the 1950s, when the industry began to decline. In the 1960s, the town began to focus more on tourism, and the economy shifted to accommodate the influx of visitors.
Geography
Rockaway Beach is located on the Pacific Ocean, approximately 70 miles west of Portland. The town is situated on a peninsula, with the Nehalem Bay to the north and the Pacific Ocean to the south. The town is surrounded by lush forests and is home to several state parks, including Nehalem Bay State Park and Rockaway Beach State Park.
The town has a mild climate, with temperatures ranging from the mid-50s in the winter to the mid-70s in the summer. The town receives an average of 40 inches of rain per year, with most of the rain falling in the winter months.
Economy
The economy of Rockaway Beach is largely based on tourism. The town is home to several hotels, restaurants, and other businesses that cater to visitors. The town also has a thriving fishing industry, with many of the local businesses specializing in seafood.
The town is also home to several small businesses, including a grocery store, a hardware store, and a few other retail stores. The town also has a few small manufacturing businesses, such as a boat-building company.
Demographics
As of the 2010 census, the population of Rockaway Beach was 1,323. The town is predominantly white, with the majority of the population being of European descent. The town also has a small Hispanic population, as well as a few African American and Native American residents.
The median household income in Rockaway Beach is $41,250, and the median home value is $219,000. The town has a low unemployment rate, with only 4.2% of the population being unemployed.
Conclusion
Rockaway Beach is a small coastal town located in Tillamook County, Oregon. It is known for its beautiful beaches, fishing, and outdoor activities, and is a popular tourist destination. The town has a mild climate and is home to several state parks. The economy of Rockaway Beach is largely based on tourism, with many of the local businesses catering to visitors. The town has a predominantly white population, with the majority of the population being of European descent. The median household income in Rockaway Beach is $41,250, and the median home value is $219,000.
Common Questions
What is Per Capita Income in Rockaway Beach?
Per Capita income in Rockaway Beach is $38,434.
What is the Median Family Income in Rockaway Beach?
Median Family Income in Rockaway Beach is $70,313.
What is the Median Household income in Rockaway Beach?
Median Household Income in Rockaway Beach is $47,788.
What is Income or Wage Gap in Rockaway Beach?
Income or Wage Gap in Rockaway Beach is 30.5%.
Women in Rockaway Beach earn 69.5 cents for every dollar earned by a man.
What is Inequality or Gini Index in Rockaway Beach?
Inequality or Gini Index in Rockaway Beach is 0.54.
What is the Total Population of Rockaway Beach?
Total Population of Rockaway Beach is 1,393.
What is the Total Male Population of Rockaway Beach?
Total Male Population of Rockaway Beach is 666.
What is the Total Female Population of Rockaway Beach?
Total Female Population of Rockaway Beach is 727.
What is the Ratio of Males per 100 Females in Rockaway Beach?
There are 91.61 Males per 100 Females in Rockaway Beach.
What is the Ratio of Females per 100 Males in Rockaway Beach?
There are 109.16 Females per 100 Males in Rockaway Beach.
What is the Median Population Age in Rockaway Beach?
Median Population Age in Rockaway Beach is 50.0 Years.
What is the Average Family Size in Rockaway Beach
Average Family Size in Rockaway Beach is 3.2 People.
What is the Average Household Size in Rockaway Beach
Average Household Size in Rockaway Beach is 2.2 People.
How Large is the Labor Force in Rockaway Beach?
There are 567 People in the Labor Forcein in Rockaway Beach.
What is the Percentage of People in the Labor Force in Rockaway Beach?
47.6% of People are in the Labor Force in Rockaway Beach.
What is the Unemployment Rate in Rockaway Beach?
Unemployment Rate in Rockaway Beach is 6.9%.