Cedar Hills, OR Map & Demographics
Cedar Hills Map
Cedar Hills Overview
$50,345
PER CAPITA INCOME
$116,071
AVG FAMILY INCOME
$103,544
AVG HOUSEHOLD INCOME
38.1%
WAGE / INCOME GAP [ % ]
61.9¢/ $1
WAGE / INCOME GAP [ $ ]
0.39
INEQUALITY / GINI INDEX
9,076
TOTAL POPULATION
4,331
MALE POPULATION
4,745
FEMALE POPULATION
91.28
MALES / 100 FEMALES
109.56
FEMALES / 100 MALES
38.4
MEDIAN AGE
3.1
AVG FAMILY SIZE
2.5
AVG HOUSEHOLD SIZE
5,202
LABOR FORCE [ PEOPLE ]
72.5%
PERCENT IN LABOR FORCE
4.5%
UNEMPLOYMENT RATE
Income in Cedar Hills
Income Overview in Cedar Hills
Per Capita Income in Cedar Hills is $50,345, while median incomes of families and households are $116,071 and $103,544 respectively.
| Characteristic | Number | Measure |
| Per Capita Income | 9,076 | $50,345 |
| Median Family Income | 2,228 | $116,071 |
| Mean Family Income | 2,228 | $148,779 |
| Median Household Income | 3,699 | $103,544 |
| Mean Household Income | 3,699 | $124,999 |
| Income Deficit | 2,228 | $0 |
| Wage / Income Gap (%) | 9,076 | 38.12% |
| Wage / Income Gap ($) | 9,076 | 61.88¢ per $1 |
| Gini / Inequality Index | 9,076 | 0.39 |
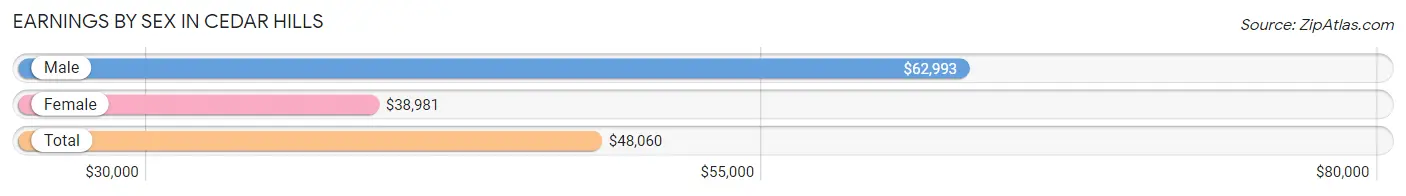
Earnings by Sex in Cedar Hills
Average Earnings in Cedar Hills are $48,060, $62,993 for men and $38,981 for women, a difference of 38.1%.
| Sex | Number | Average Earnings |
| Male | 2,807 (52.7%) | $62,993 |
| Female | 2,518 (47.3%) | $38,981 |
| Total | 5,325 (100.0%) | $48,060 |
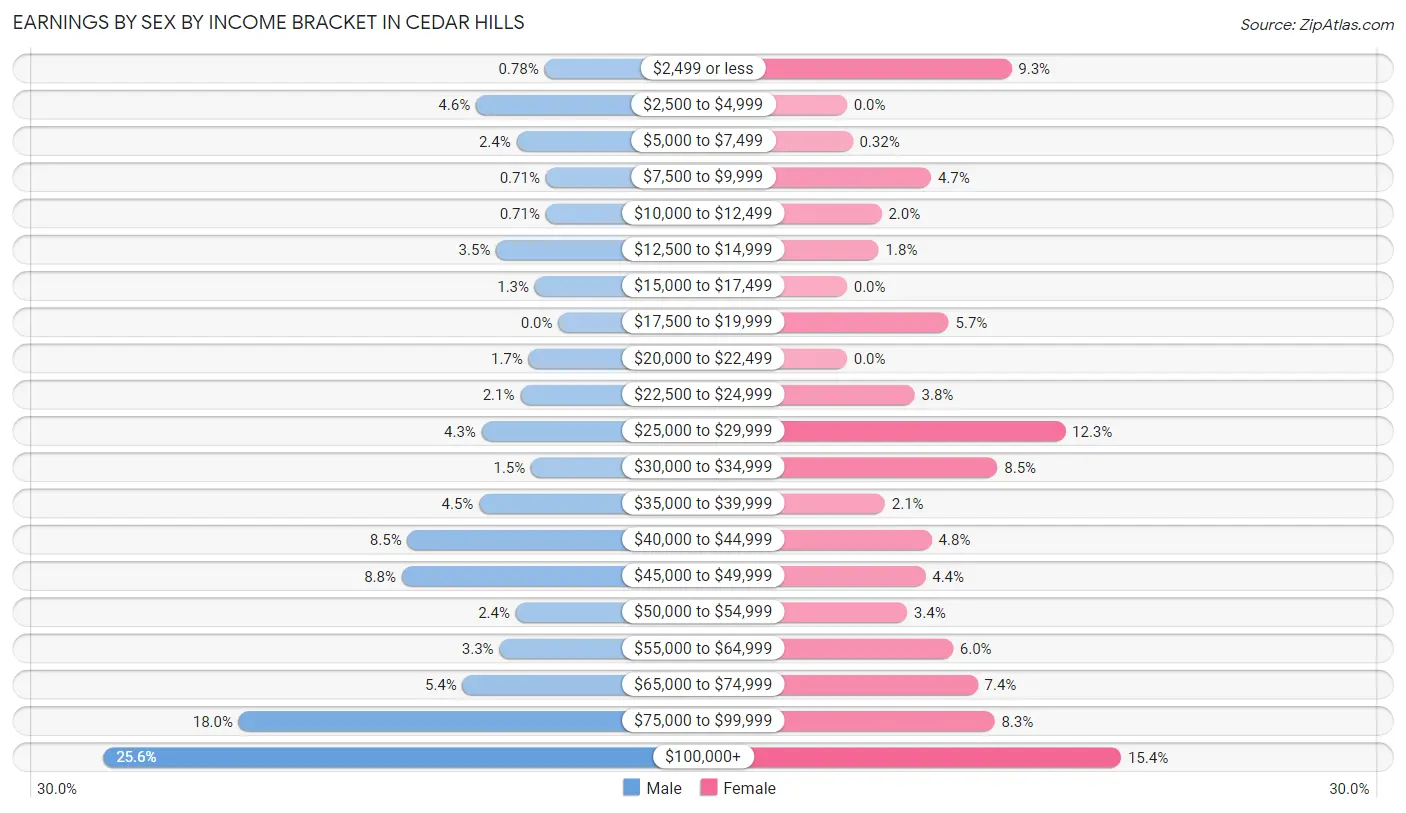
Earnings by Sex by Income Bracket in Cedar Hills
The most common earnings brackets in Cedar Hills are $100,000+ for men (718 | 25.6%) and $100,000+ for women (388 | 15.4%).
| Income | Male | Female |
| $2,499 or less | 22 (0.8%) | 233 (9.2%) |
| $2,500 to $4,999 | 130 (4.6%) | 0 (0.0%) |
| $5,000 to $7,499 | 66 (2.4%) | 8 (0.3%) |
| $7,500 to $9,999 | 20 (0.7%) | 119 (4.7%) |
| $10,000 to $12,499 | 20 (0.7%) | 49 (1.9%) |
| $12,500 to $14,999 | 98 (3.5%) | 45 (1.8%) |
| $15,000 to $17,499 | 37 (1.3%) | 0 (0.0%) |
| $17,500 to $19,999 | 0 (0.0%) | 144 (5.7%) |
| $20,000 to $22,499 | 47 (1.7%) | 0 (0.0%) |
| $22,500 to $24,999 | 60 (2.1%) | 96 (3.8%) |
| $25,000 to $29,999 | 121 (4.3%) | 309 (12.3%) |
| $30,000 to $34,999 | 43 (1.5%) | 213 (8.5%) |
| $35,000 to $39,999 | 125 (4.4%) | 54 (2.1%) |
| $40,000 to $44,999 | 238 (8.5%) | 120 (4.8%) |
| $45,000 to $49,999 | 247 (8.8%) | 111 (4.4%) |
| $50,000 to $54,999 | 67 (2.4%) | 85 (3.4%) |
| $55,000 to $64,999 | 93 (3.3%) | 150 (6.0%) |
| $65,000 to $74,999 | 151 (5.4%) | 185 (7.3%) |
| $75,000 to $99,999 | 504 (18.0%) | 209 (8.3%) |
| $100,000+ | 718 (25.6%) | 388 (15.4%) |
| Total | 2,807 (100.0%) | 2,518 (100.0%) |
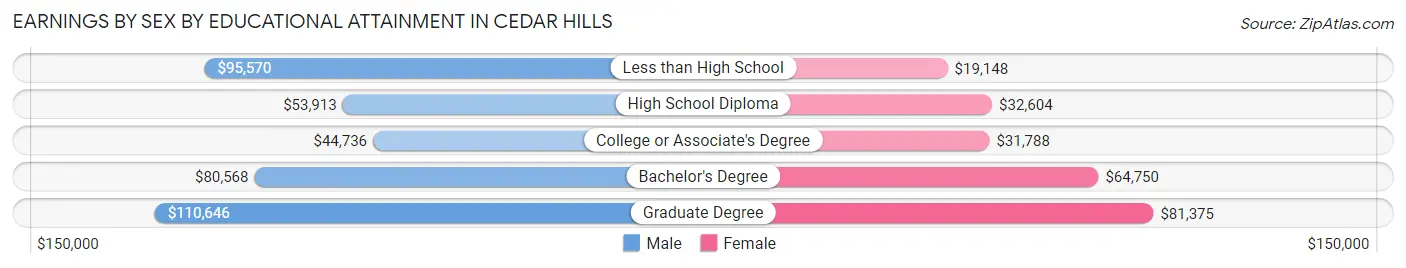
Earnings by Sex by Educational Attainment in Cedar Hills
Average earnings in Cedar Hills are $70,633 for men and $46,932 for women, a difference of 33.6%. Men with an educational attainment of graduate degree enjoy the highest average annual earnings of $110,646, while those with college or associate's degree education earn the least with $44,736. Women with an educational attainment of graduate degree earn the most with the average annual earnings of $81,375, while those with less than high school education have the smallest earnings of $19,148.
| Educational Attainment | Male Income | Female Income |
| Less than High School | $95,570 | $19,148 |
| High School Diploma | $53,913 | $32,604 |
| College or Associate's Degree | $44,736 | $31,788 |
| Bachelor's Degree | $80,568 | $64,750 |
| Graduate Degree | $110,646 | $81,375 |
| Total | $70,633 | $46,932 |
Family Income in Cedar Hills
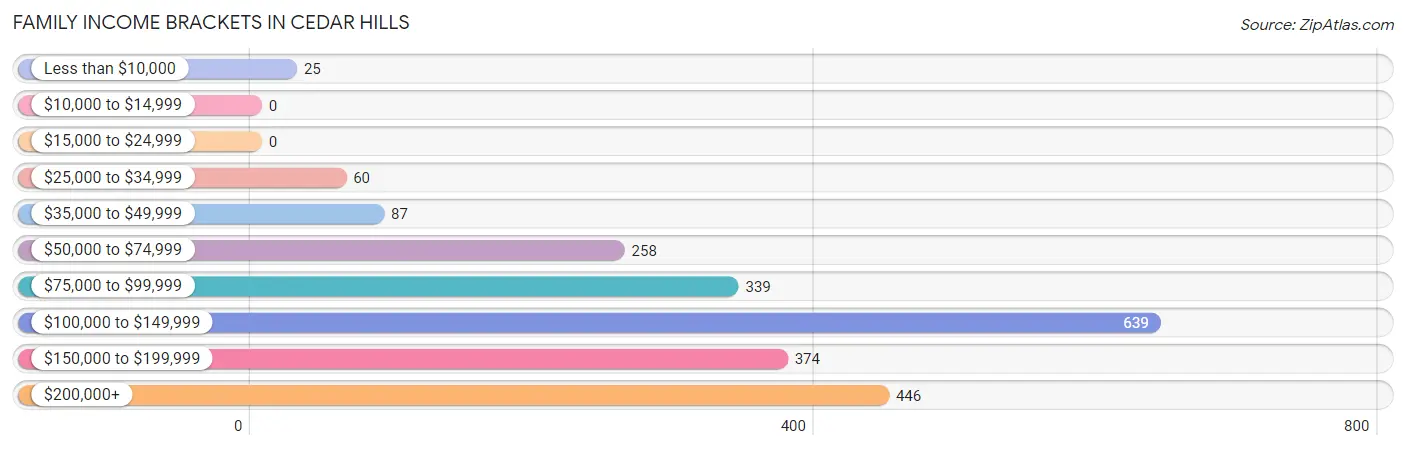
Family Income Brackets in Cedar Hills
According to the Cedar Hills family income data, there are 639 families falling into the $100,000 to $149,999 income range, which is the most common income bracket and makes up 28.7% of all families.
| Income Bracket | # Families | % Families |
| Less than $10,000 | 25 | 1.1% |
| $10,000 to $14,999 | 0 | 0.0% |
| $15,000 to $24,999 | 0 | 0.0% |
| $25,000 to $34,999 | 60 | 2.7% |
| $35,000 to $49,999 | 87 | 3.9% |
| $50,000 to $74,999 | 258 | 11.6% |
| $75,000 to $99,999 | 339 | 15.2% |
| $100,000 to $149,999 | 639 | 28.7% |
| $150,000 to $199,999 | 374 | 16.8% |
| $200,000+ | 446 | 20.0% |
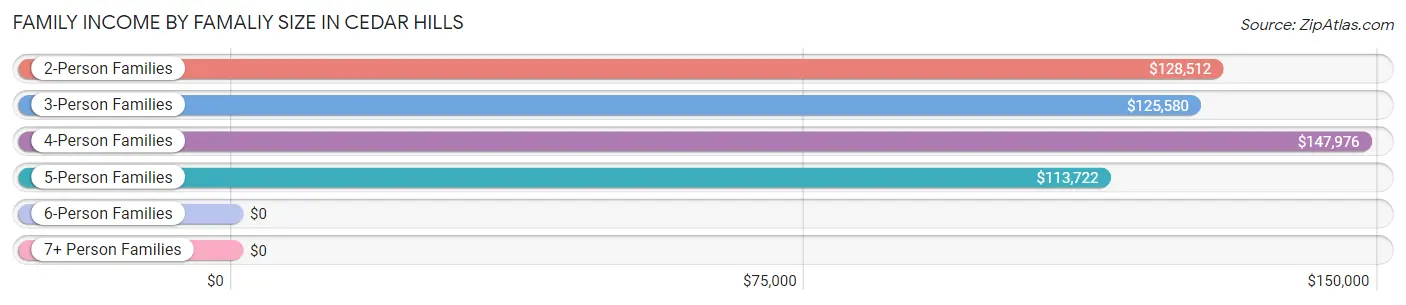
Family Income by Famaliy Size in Cedar Hills
4-person families (478 | 21.4%) account for the highest median family income in Cedar Hills with $147,976 per family, while 2-person families (933 | 41.9%) have the highest median income of $64,256 per family member.
| Income Bracket | # Families | Median Income |
| 2-Person Families | 933 (41.9%) | $128,512 |
| 3-Person Families | 429 (19.3%) | $125,580 |
| 4-Person Families | 478 (21.4%) | $147,976 |
| 5-Person Families | 316 (14.2%) | $113,722 |
| 6-Person Families | 72 (3.2%) | $0 |
| 7+ Person Families | 0 (0.0%) | $0 |
| Total | 2,228 (100.0%) | $116,071 |
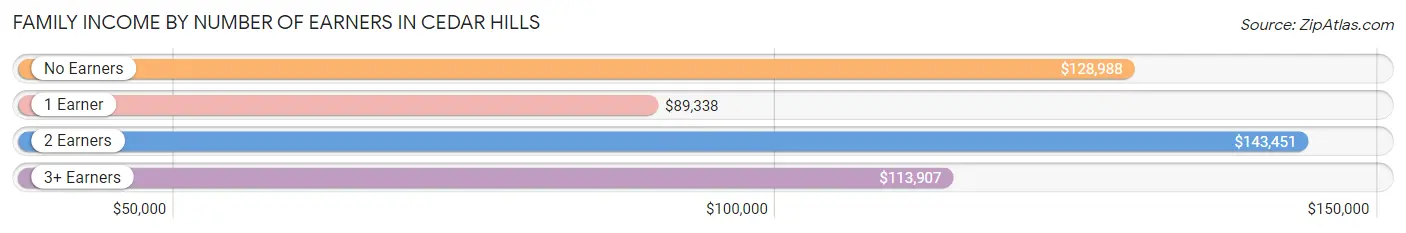
Family Income by Number of Earners in Cedar Hills
The median family income in Cedar Hills is $116,071, with families comprising 2 earners (1,189) having the highest median family income of $143,451, while families with 1 earner (534) have the lowest median family income of $89,338, accounting for 53.4% and 24.0% of families, respectively.
| Number of Earners | # Families | Median Income |
| No Earners | 217 (9.7%) | $128,988 |
| 1 Earner | 534 (24.0%) | $89,338 |
| 2 Earners | 1,189 (53.4%) | $143,451 |
| 3+ Earners | 288 (12.9%) | $113,907 |
| Total | 2,228 (100.0%) | $116,071 |
Household Income in Cedar Hills
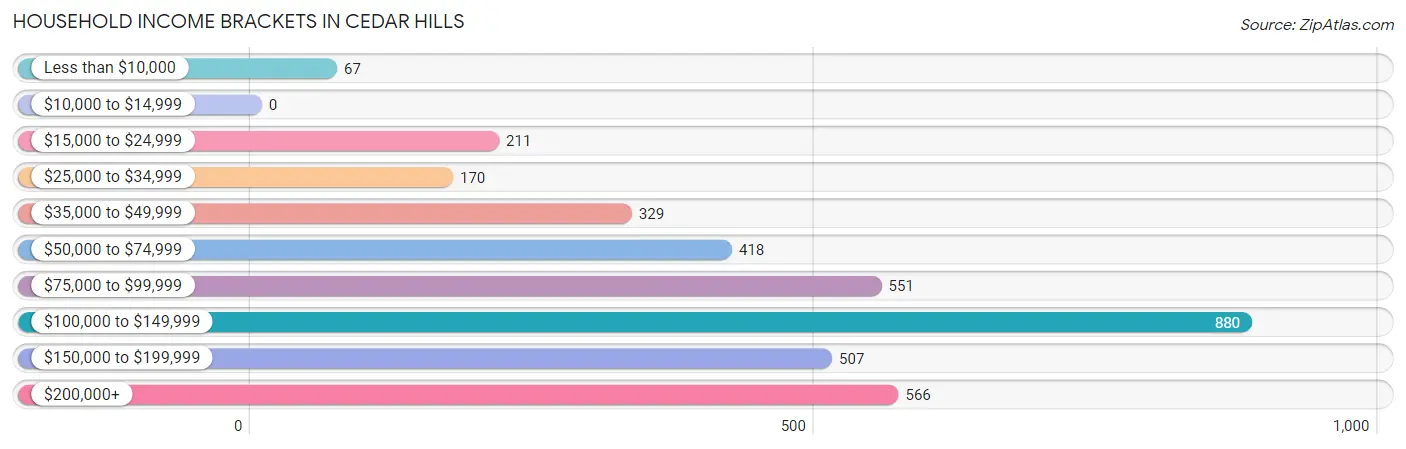
Household Income Brackets in Cedar Hills
With 880 households falling in the category, the $100,000 to $149,999 income range is the most frequent in Cedar Hills, accounting for 23.8% of all households.
| Income Bracket | # Households | % Households |
| Less than $10,000 | 67 | 1.8% |
| $10,000 to $14,999 | 0 | 0.0% |
| $15,000 to $24,999 | 211 | 5.7% |
| $25,000 to $34,999 | 170 | 4.6% |
| $35,000 to $49,999 | 329 | 8.9% |
| $50,000 to $74,999 | 418 | 11.3% |
| $75,000 to $99,999 | 551 | 14.9% |
| $100,000 to $149,999 | 880 | 23.8% |
| $150,000 to $199,999 | 507 | 13.7% |
| $200,000+ | 566 | 15.3% |
Household Income by Householder Age in Cedar Hills
The median household income in Cedar Hills is $103,544, with the highest median household income of $114,417 found in the 45 to 64 years age bracket for the primary householder. A total of 1,033 households (27.9%) fall into this category. Meanwhile, the 15 to 24 years age bracket for the primary householder has the lowest median household income of $0, with 41 households (1.1%) in this group.
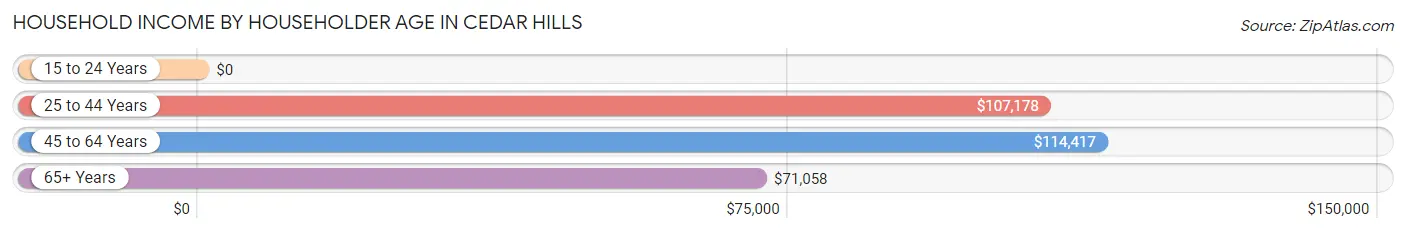
| Income Bracket | # Households | Median Income |
| 15 to 24 Years | 41 (1.1%) | $0 |
| 25 to 44 Years | 1,498 (40.5%) | $107,178 |
| 45 to 64 Years | 1,033 (27.9%) | $114,417 |
| 65+ Years | 1,127 (30.5%) | $71,058 |
| Total | 3,699 (100.0%) | $103,544 |
Poverty in Cedar Hills
Income Below Poverty by Sex and Age in Cedar Hills
With 2.3% poverty level for males and 4.2% for females among the residents of Cedar Hills, 45 to 54 year old males and 18 to 24 year old females are the most vulnerable to poverty, with 56 males (11.0%) and 38 females (11.4%) in their respective age groups living below the poverty level.

| Age Bracket | Male | Female |
| Under 5 Years | 0 (0.0%) | 0 (0.0%) |
| 5 Years | 0 (0.0%) | 0 (0.0%) |
| 6 to 11 Years | 0 (0.0%) | 17 (4.0%) |
| 12 to 14 Years | 0 (0.0%) | 17 (6.8%) |
| 15 Years | 0 (0.0%) | 0 (0.0%) |
| 16 and 17 Years | 0 (0.0%) | 0 (0.0%) |
| 18 to 24 Years | 0 (0.0%) | 38 (11.4%) |
| 25 to 34 Years | 31 (4.5%) | 32 (4.6%) |
| 35 to 44 Years | 0 (0.0%) | 6 (0.9%) |
| 45 to 54 Years | 56 (11.0%) | 55 (9.2%) |
| 55 to 64 Years | 12 (2.8%) | 5 (1.3%) |
| 65 to 74 Years | 0 (0.0%) | 29 (6.9%) |
| 75 Years and over | 0 (0.0%) | 0 (0.0%) |
| Total | 99 (2.3%) | 199 (4.2%) |
Income Above Poverty by Sex and Age in Cedar Hills
According to the poverty statistics in Cedar Hills, males aged under 5 years and females aged under 5 years are the age groups that are most secure financially, with 100.0% of males and 100.0% of females in these age groups living above the poverty line.
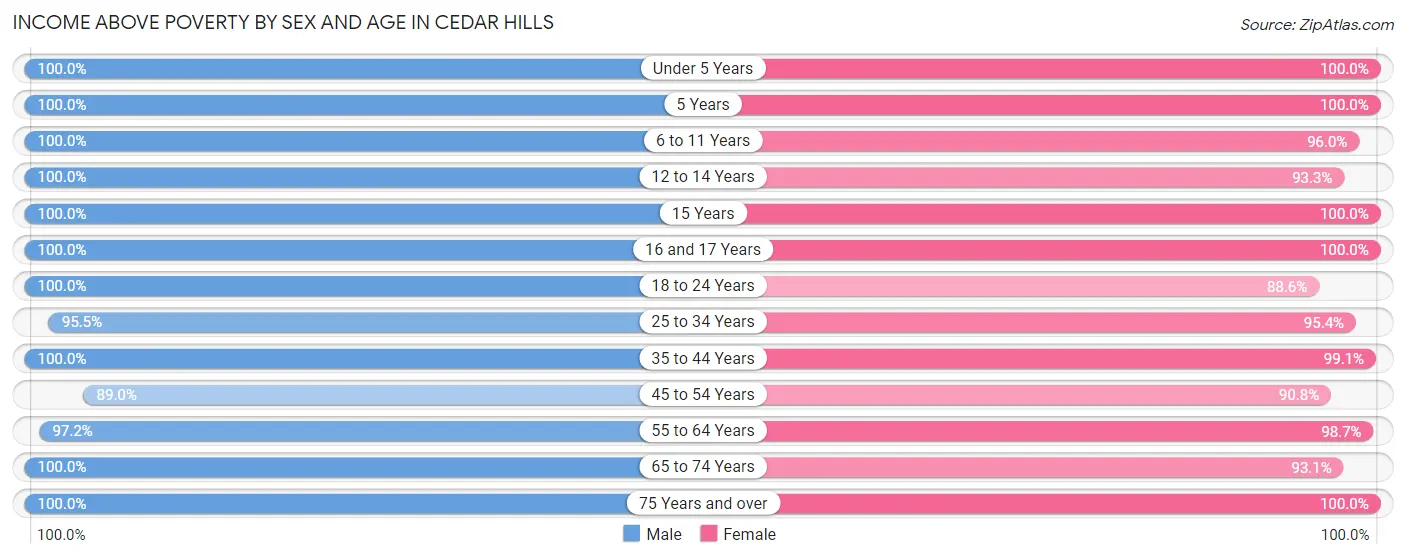
| Age Bracket | Male | Female |
| Under 5 Years | 219 (100.0%) | 407 (100.0%) |
| 5 Years | 61 (100.0%) | 35 (100.0%) |
| 6 to 11 Years | 287 (100.0%) | 411 (96.0%) |
| 12 to 14 Years | 168 (100.0%) | 235 (93.2%) |
| 15 Years | 10 (100.0%) | 34 (100.0%) |
| 16 and 17 Years | 160 (100.0%) | 96 (100.0%) |
| 18 to 24 Years | 185 (100.0%) | 295 (88.6%) |
| 25 to 34 Years | 658 (95.5%) | 667 (95.4%) |
| 35 to 44 Years | 838 (100.0%) | 686 (99.1%) |
| 45 to 54 Years | 455 (89.0%) | 543 (90.8%) |
| 55 to 64 Years | 423 (97.2%) | 373 (98.7%) |
| 65 to 74 Years | 424 (100.0%) | 393 (93.1%) |
| 75 Years and over | 344 (100.0%) | 371 (100.0%) |
| Total | 4,232 (97.7%) | 4,546 (95.8%) |
Income Below Poverty Among Married-Couple Families in Cedar Hills
The poverty statistics for married-couple families in Cedar Hills show that 1.0% or 18 of the total 1,871 families live below the poverty line. Families with 1 or 2 children have the highest poverty rate of 2.1%, comprising of 18 families. On the other hand, families with no children have the lowest poverty rate of 0.0%, which includes 0 families.
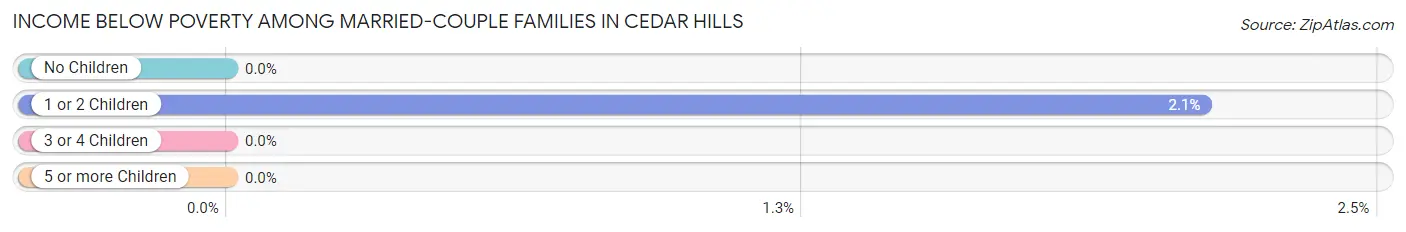
| Children | Above Poverty | Below Poverty |
| No Children | 877 (100.0%) | 0 (0.0%) |
| 1 or 2 Children | 833 (97.9%) | 18 (2.1%) |
| 3 or 4 Children | 143 (100.0%) | 0 (0.0%) |
| 5 or more Children | 0 (0.0%) | 0 (0.0%) |
| Total | 1,853 (99.0%) | 18 (1.0%) |
Income Below Poverty Among Single-Parent Households in Cedar Hills
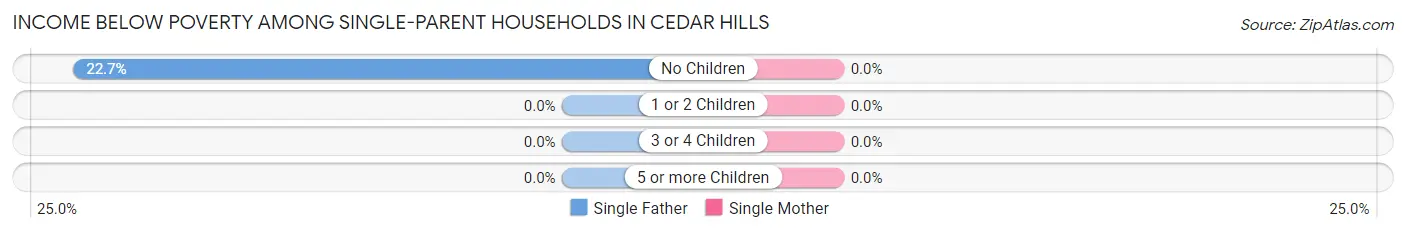
| Children | Single Father | Single Mother |
| No Children | 25 (22.7%) | 0 (0.0%) |
| 1 or 2 Children | 0 (0.0%) | 0 (0.0%) |
| 3 or 4 Children | 0 (0.0%) | 0 (0.0%) |
| 5 or more Children | 0 (0.0%) | 0 (0.0%) |
| Total | 25 (16.1%) | 0 (0.0%) |
Income Below Poverty Among Married-Couple vs Single-Parent Households in Cedar Hills
The poverty data for Cedar Hills shows that 18 of the married-couple family households (1.0%) and 25 of the single-parent households (7.0%) are living below the poverty level. Within the married-couple family households, those with 1 or 2 children have the highest poverty rate, with 18 households (2.1%) falling below the poverty line. Among the single-parent households, those with no children have the highest poverty rate, with 25 household (14.9%) living below poverty.
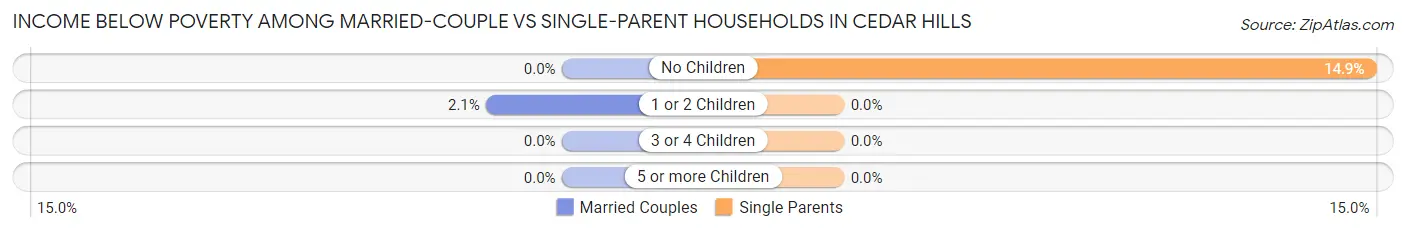
| Children | Married-Couple Families | Single-Parent Households |
| No Children | 0 (0.0%) | 25 (14.9%) |
| 1 or 2 Children | 18 (2.1%) | 0 (0.0%) |
| 3 or 4 Children | 0 (0.0%) | 0 (0.0%) |
| 5 or more Children | 0 (0.0%) | 0 (0.0%) |
| Total | 18 (1.0%) | 25 (7.0%) |
Race in Cedar Hills
The most populous races in Cedar Hills are White / Caucasian (6,535 | 72.0%), Hispanic or Latino (1,960 | 21.6%), and Two or more Races (1,232 | 13.6%).
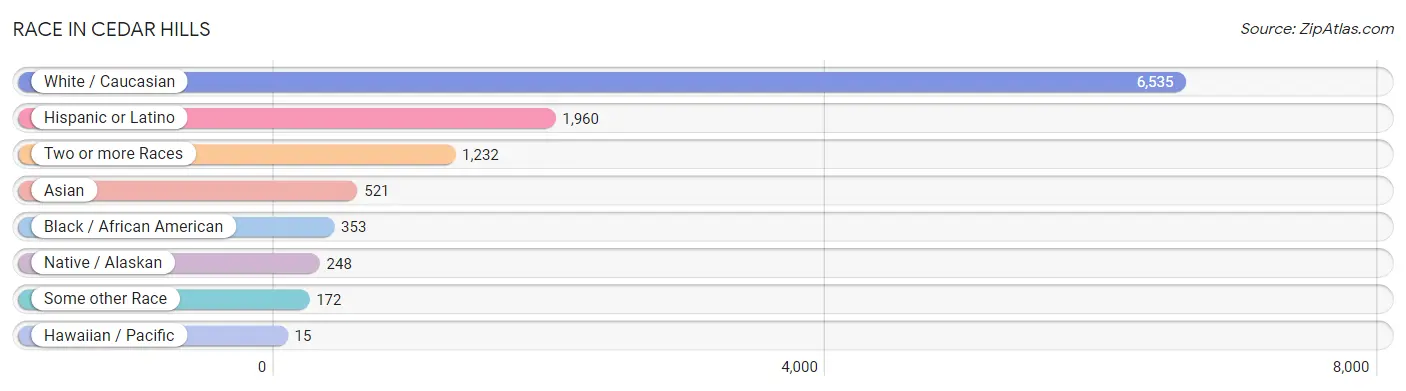
| Race | # Population | % Population |
| Asian | 521 | 5.7% |
| Black / African American | 353 | 3.9% |
| Hawaiian / Pacific | 15 | 0.2% |
| Hispanic or Latino | 1,960 | 21.6% |
| Native / Alaskan | 248 | 2.7% |
| White / Caucasian | 6,535 | 72.0% |
| Two or more Races | 1,232 | 13.6% |
| Some other Race | 172 | 1.9% |
| Total | 9,076 | 100.0% |
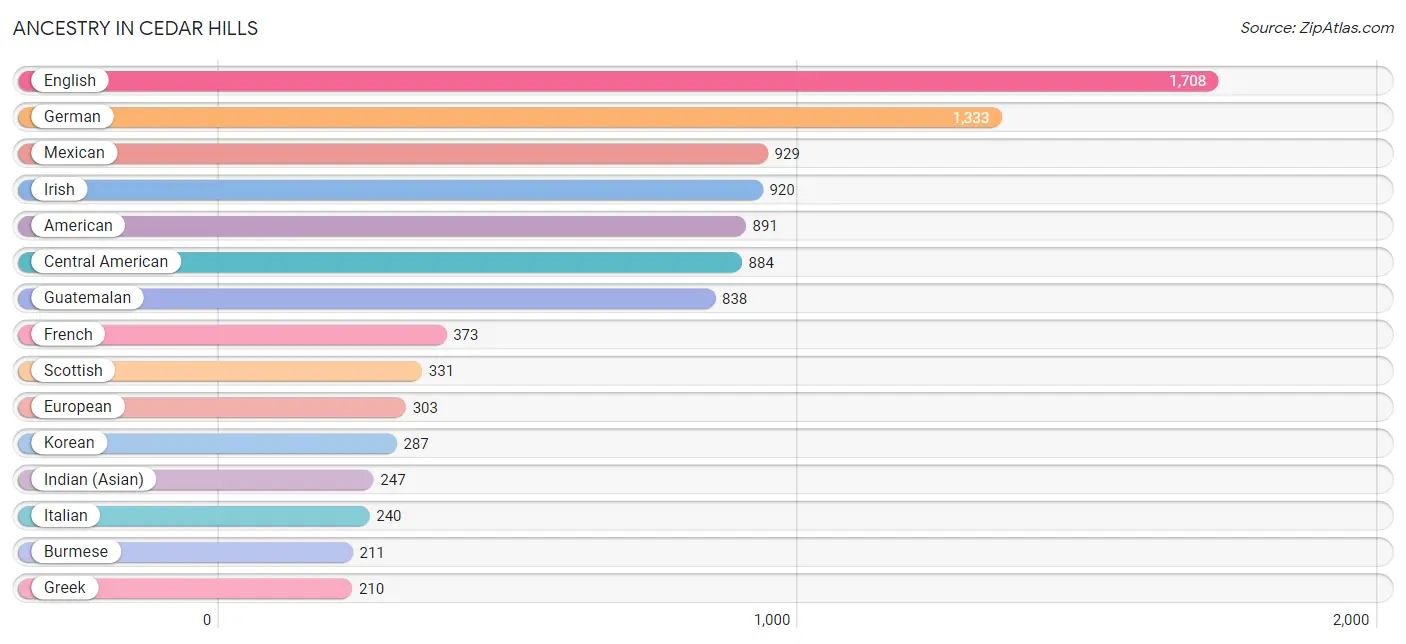
Ancestry in Cedar Hills
The most populous ancestries reported in Cedar Hills are English (1,708 | 18.8%), German (1,333 | 14.7%), Mexican (929 | 10.2%), Irish (920 | 10.1%), and American (891 | 9.8%), together accounting for 63.7% of all Cedar Hills residents.
| Ancestry | # Population | % Population |
| African | 26 | 0.3% |
| American | 891 | 9.8% |
| Arab | 170 | 1.9% |
| Armenian | 23 | 0.3% |
| Austrian | 64 | 0.7% |
| Bhutanese | 130 | 1.4% |
| Blackfeet | 19 | 0.2% |
| British | 186 | 2.1% |
| Burmese | 211 | 2.3% |
| Cambodian | 69 | 0.8% |
| Central American | 884 | 9.7% |
| Central American Indian | 30 | 0.3% |
| Cherokee | 28 | 0.3% |
| Chinese | 30 | 0.3% |
| Cuban | 16 | 0.2% |
| Czech | 17 | 0.2% |
| Czechoslovakian | 44 | 0.5% |
| Danish | 56 | 0.6% |
| Dutch | 38 | 0.4% |
| Eastern European | 75 | 0.8% |
| English | 1,708 | 18.8% |
| European | 303 | 3.3% |
| Finnish | 52 | 0.6% |
| French | 373 | 4.1% |
| French Canadian | 46 | 0.5% |
| German | 1,333 | 14.7% |
| Ghanaian | 65 | 0.7% |
| Greek | 210 | 2.3% |
| Guamanian / Chamorro | 15 | 0.2% |
| Guatemalan | 838 | 9.2% |
| Hungarian | 11 | 0.1% |
| Indian (Asian) | 247 | 2.7% |
| Iranian | 4 | 0.0% |
| Iraqi | 37 | 0.4% |
| Irish | 920 | 10.1% |
| Italian | 240 | 2.6% |
| Korean | 287 | 3.2% |
| Lebanese | 133 | 1.5% |
| Macedonian | 45 | 0.5% |
| Mexican | 929 | 10.2% |
| Mexican American Indian | 79 | 0.9% |
| Native Hawaiian | 36 | 0.4% |
| Navajo | 24 | 0.3% |
| Northern European | 82 | 0.9% |
| Norwegian | 170 | 1.9% |
| Pakistani | 1 | 0.0% |
| Panamanian | 46 | 0.5% |
| Peruvian | 36 | 0.4% |
| Polish | 47 | 0.5% |
| Portuguese | 125 | 1.4% |
| Puerto Rican | 28 | 0.3% |
| Romanian | 5 | 0.1% |
| Russian | 187 | 2.1% |
| Scandinavian | 40 | 0.4% |
| Scotch-Irish | 181 | 2.0% |
| Scottish | 331 | 3.6% |
| Slavic | 12 | 0.1% |
| South American | 36 | 0.4% |
| Spaniard | 21 | 0.2% |
| Spanish | 46 | 0.5% |
| Sri Lankan | 59 | 0.6% |
| Subsaharan African | 118 | 1.3% |
| Swedish | 94 | 1.0% |
| Thai | 202 | 2.2% |
| Welsh | 210 | 2.3% |
| Yaqui | 30 | 0.3% | View All 66 Rows |
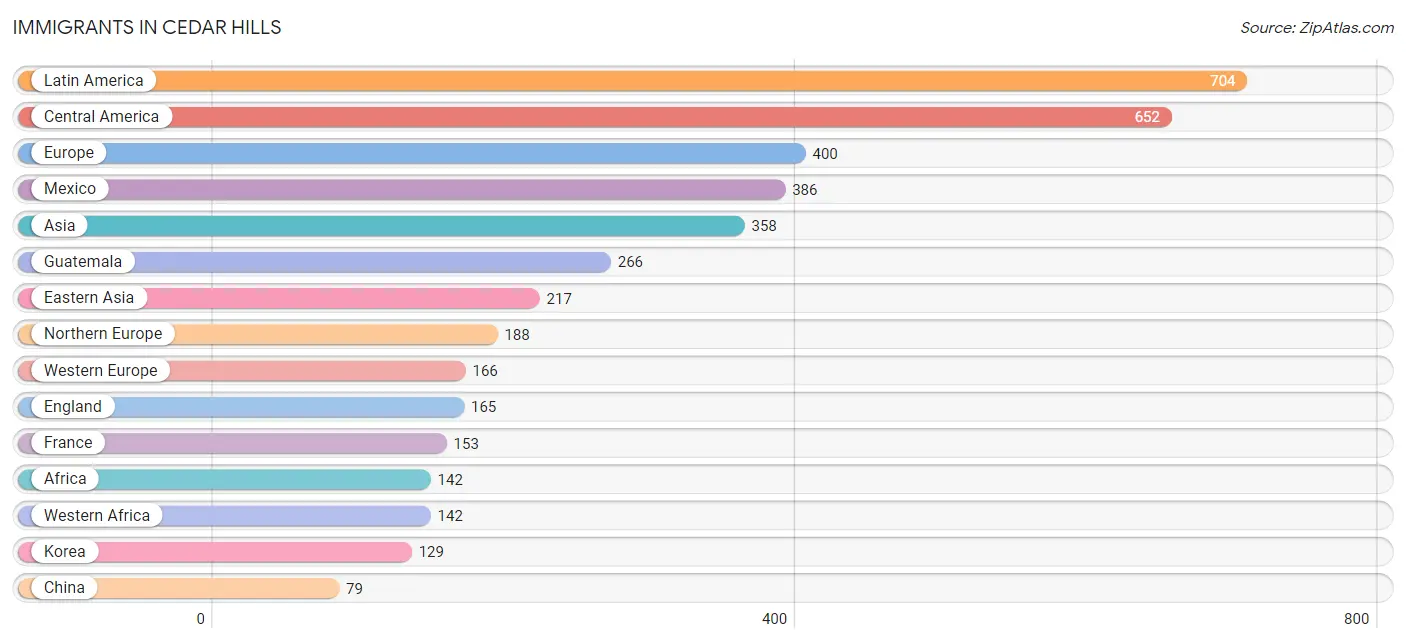
Immigrants in Cedar Hills
The most numerous immigrant groups reported in Cedar Hills came from Latin America (704 | 7.8%), Central America (652 | 7.2%), Europe (400 | 4.4%), Mexico (386 | 4.3%), and Asia (358 | 3.9%), together accounting for 27.5% of all Cedar Hills residents.
| Immigration Origin | # Population | % Population |
| Africa | 142 | 1.6% |
| Asia | 358 | 3.9% |
| Canada | 28 | 0.3% |
| Caribbean | 16 | 0.2% |
| Central America | 652 | 7.2% |
| China | 79 | 0.9% |
| Cuba | 16 | 0.2% |
| Eastern Asia | 217 | 2.4% |
| Eastern Europe | 46 | 0.5% |
| England | 165 | 1.8% |
| Europe | 400 | 4.4% |
| France | 153 | 1.7% |
| Germany | 13 | 0.1% |
| Ghana | 49 | 0.5% |
| Guatemala | 266 | 2.9% |
| Iran | 4 | 0.0% |
| Iraq | 30 | 0.3% |
| Japan | 9 | 0.1% |
| Korea | 129 | 1.4% |
| Latin America | 704 | 7.8% |
| Lebanon | 48 | 0.5% |
| Mexico | 386 | 4.3% |
| Northern Europe | 188 | 2.1% |
| Peru | 36 | 0.4% |
| Philippines | 37 | 0.4% |
| Russia | 16 | 0.2% |
| South America | 36 | 0.4% |
| South Central Asia | 4 | 0.0% |
| South Eastern Asia | 59 | 0.6% |
| Thailand | 1 | 0.0% |
| Vietnam | 21 | 0.2% |
| Western Africa | 142 | 1.6% |
| Western Asia | 78 | 0.9% |
| Western Europe | 166 | 1.8% | View All 34 Rows |
Sex and Age in Cedar Hills
Sex and Age in Cedar Hills
The most populous age groups in Cedar Hills are 40 to 44 Years (461 | 10.6%) for men and Under 5 Years (407 | 8.6%) for women.
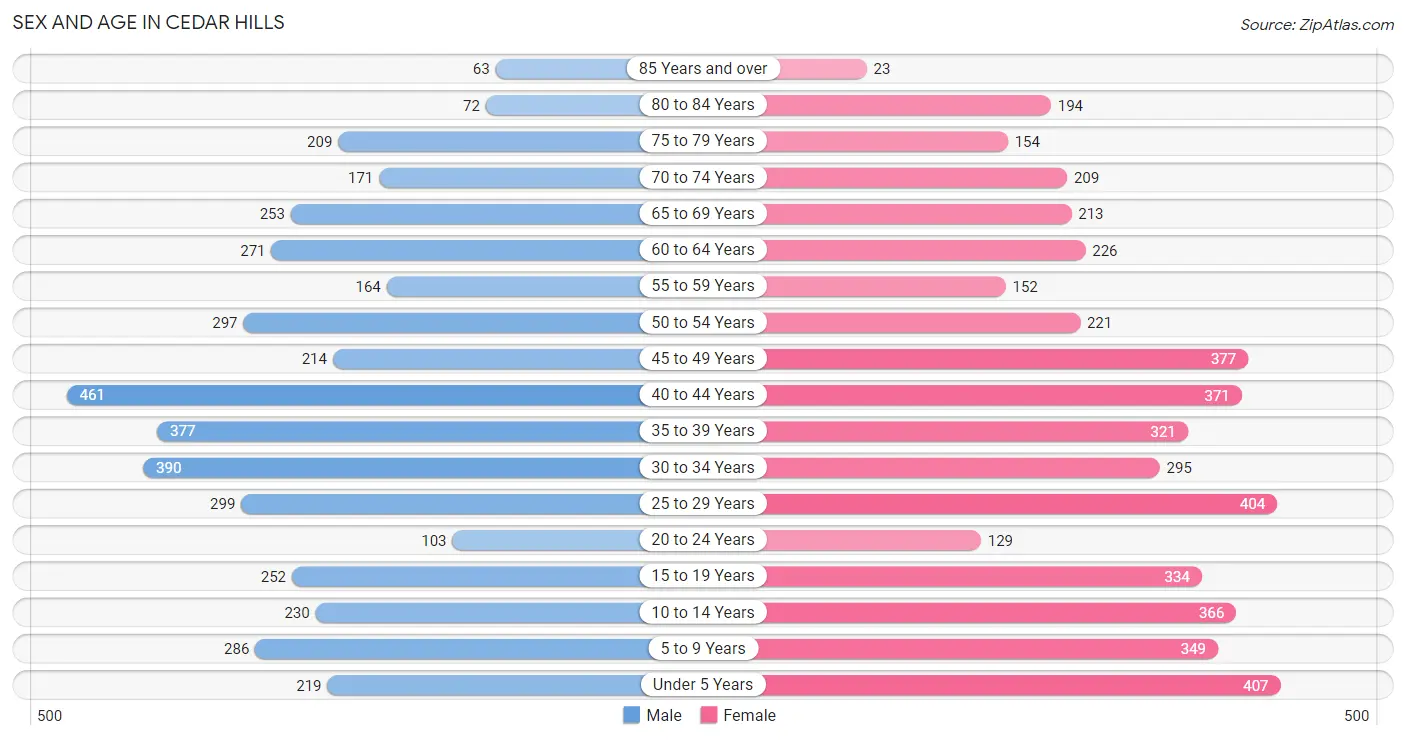
| Age Bracket | Male | Female |
| Under 5 Years | 219 (5.1%) | 407 (8.6%) |
| 5 to 9 Years | 286 (6.6%) | 349 (7.4%) |
| 10 to 14 Years | 230 (5.3%) | 366 (7.7%) |
| 15 to 19 Years | 252 (5.8%) | 334 (7.0%) |
| 20 to 24 Years | 103 (2.4%) | 129 (2.7%) |
| 25 to 29 Years | 299 (6.9%) | 404 (8.5%) |
| 30 to 34 Years | 390 (9.0%) | 295 (6.2%) |
| 35 to 39 Years | 377 (8.7%) | 321 (6.8%) |
| 40 to 44 Years | 461 (10.6%) | 371 (7.8%) |
| 45 to 49 Years | 214 (4.9%) | 377 (8.0%) |
| 50 to 54 Years | 297 (6.9%) | 221 (4.7%) |
| 55 to 59 Years | 164 (3.8%) | 152 (3.2%) |
| 60 to 64 Years | 271 (6.3%) | 226 (4.8%) |
| 65 to 69 Years | 253 (5.8%) | 213 (4.5%) |
| 70 to 74 Years | 171 (4.0%) | 209 (4.4%) |
| 75 to 79 Years | 209 (4.8%) | 154 (3.3%) |
| 80 to 84 Years | 72 (1.7%) | 194 (4.1%) |
| 85 Years and over | 63 (1.5%) | 23 (0.5%) |
| Total | 4,331 (100.0%) | 4,745 (100.0%) |
Families and Households in Cedar Hills
Median Family Size in Cedar Hills
The median family size in Cedar Hills is 3.13 persons per family, with married-couple families (1,871 | 84.0%) accounting for the largest median family size of 3.19 persons per family. On the other hand, single male/father families (155 | 7.0%) represent the smallest median family size with 2.54 persons per family.
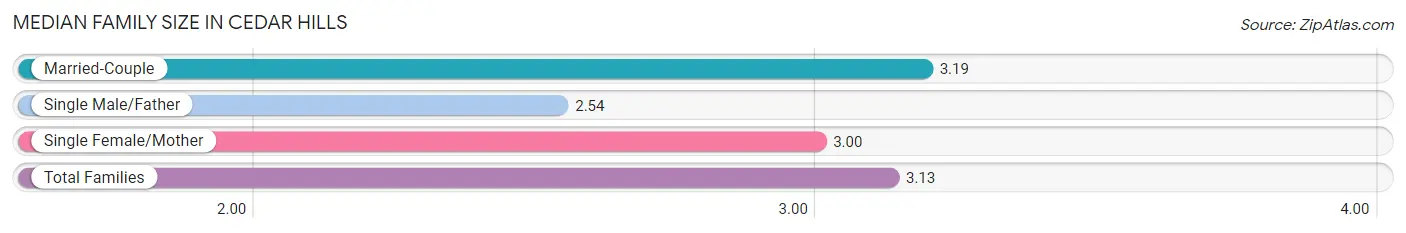
| Family Type | # Families | Family Size |
| Married-Couple | 1,871 (84.0%) | 3.19 |
| Single Male/Father | 155 (7.0%) | 2.54 |
| Single Female/Mother | 202 (9.1%) | 3.00 |
| Total Families | 2,228 (100.0%) | 3.13 |
Median Household Size in Cedar Hills
The median household size in Cedar Hills is 2.45 persons per household, with married-couple households (1,871 | 50.6%) accounting for the largest median household size of 3.23 persons per household. non-family households (1,471 | 39.8%) represent the smallest median household size with 1.32 persons per household.
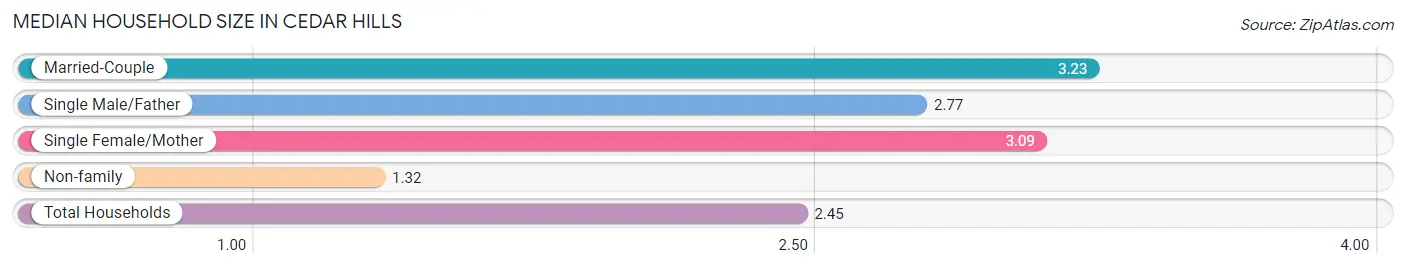
| Household Type | # Households | Household Size |
| Married-Couple | 1,871 (50.6%) | 3.23 |
| Single Male/Father | 155 (4.2%) | 2.77 |
| Single Female/Mother | 202 (5.5%) | 3.09 |
| Non-family | 1,471 (39.8%) | 1.32 |
| Total Households | 3,699 (100.0%) | 2.45 |
Household Size by Marriage Status in Cedar Hills
Out of a total of 3,699 households in Cedar Hills, 2,228 (60.2%) are family households, while 1,471 (39.8%) are nonfamily households. The most numerous type of family households are 2-person households, comprising 907, and the most common type of nonfamily households are 1-person households, comprising 1,028.
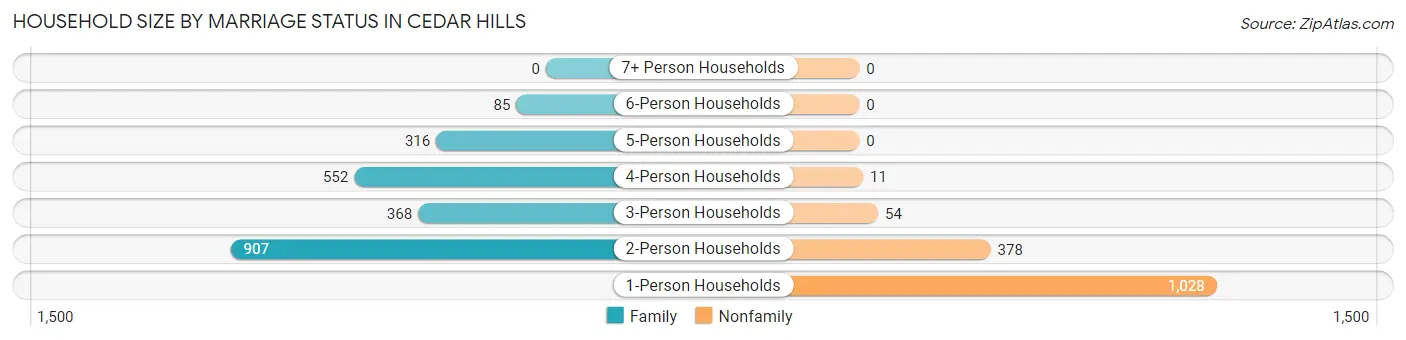
| Household Size | Family Households | Nonfamily Households |
| 1-Person Households | - | 1,028 (27.8%) |
| 2-Person Households | 907 (24.5%) | 378 (10.2%) |
| 3-Person Households | 368 (10.0%) | 54 (1.5%) |
| 4-Person Households | 552 (14.9%) | 11 (0.3%) |
| 5-Person Households | 316 (8.5%) | 0 (0.0%) |
| 6-Person Households | 85 (2.3%) | 0 (0.0%) |
| 7+ Person Households | 0 (0.0%) | 0 (0.0%) |
| Total | 2,228 (60.2%) | 1,471 (39.8%) |
Female Fertility in Cedar Hills
Fertility by Age in Cedar Hills
Average fertility rate in Cedar Hills is 45.0 births per 1,000 women. Women in the age bracket of 20 to 34 years have the highest fertility rate with 59.0 births per 1,000 women. Women in the age bracket of 35 to 50 years acount for 52.9% of all women with births.
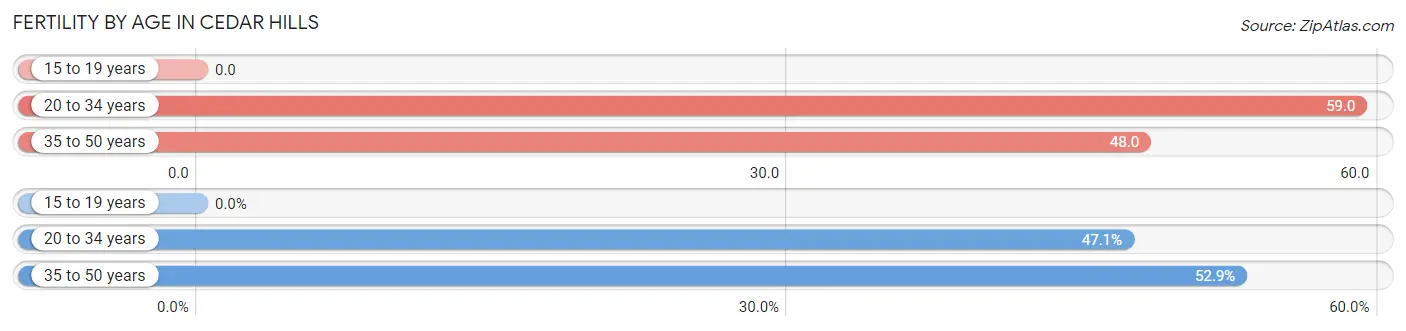
| Age Bracket | Women with Births | Births / 1,000 Women |
| 15 to 19 years | 0 (0.0%) | 0.0 |
| 20 to 34 years | 49 (47.1%) | 59.0 |
| 35 to 50 years | 55 (52.9%) | 48.0 |
| Total | 104 (100.0%) | 45.0 |
Fertility by Age by Marriage Status in Cedar Hills
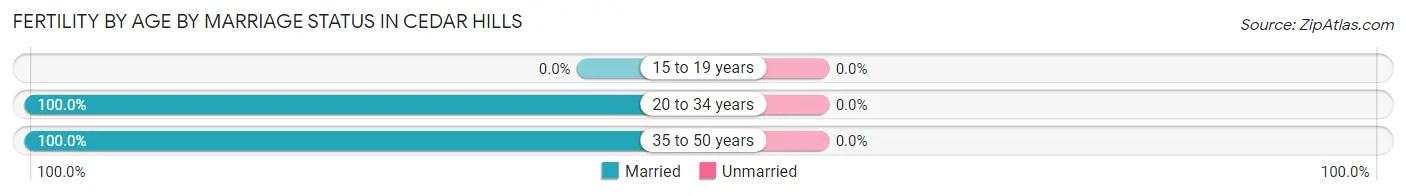
| Age Bracket | Married | Unmarried |
| 15 to 19 years | 0 (0.0%) | 0 (0.0%) |
| 20 to 34 years | 49 (100.0%) | 0 (0.0%) |
| 35 to 50 years | 55 (100.0%) | 0 (0.0%) |
| Total | 104 (100.0%) | 0 (0.0%) |
Fertility by Education in Cedar Hills
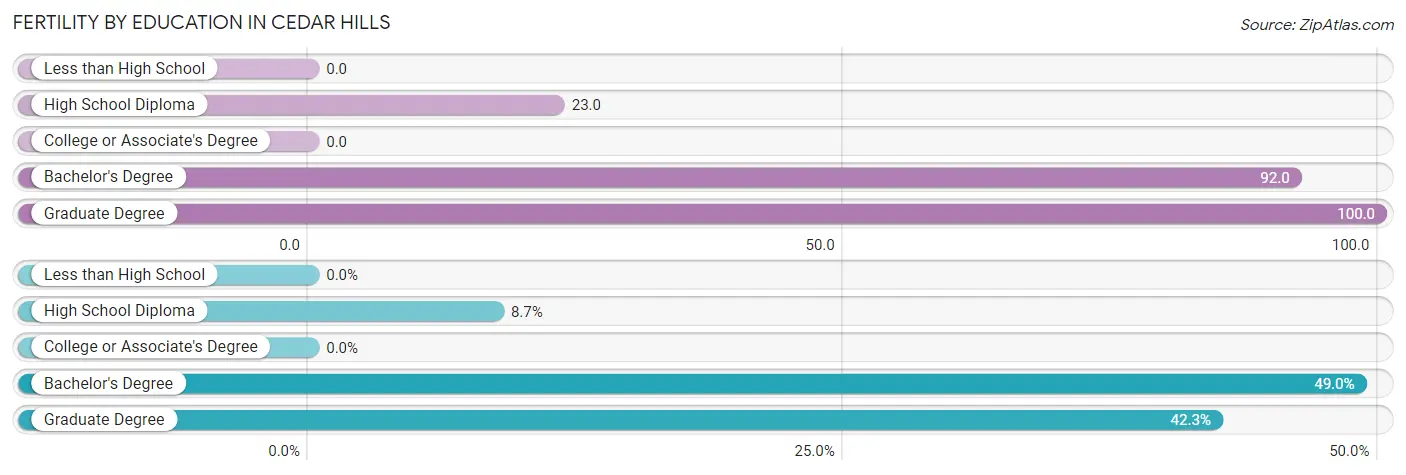
| Educational Attainment | Women with Births | Births / 1,000 Women |
| Less than High School | 0 (0.0%) | 0.0 |
| High School Diploma | 9 (8.6%) | 23.0 |
| College or Associate's Degree | 0 (0.0%) | 0.0 |
| Bachelor's Degree | 51 (49.0%) | 92.0 |
| Graduate Degree | 44 (42.3%) | 100.0 |
| Total | 104 (100.0%) | 45.0 |
Fertility by Education by Marriage Status in Cedar Hills
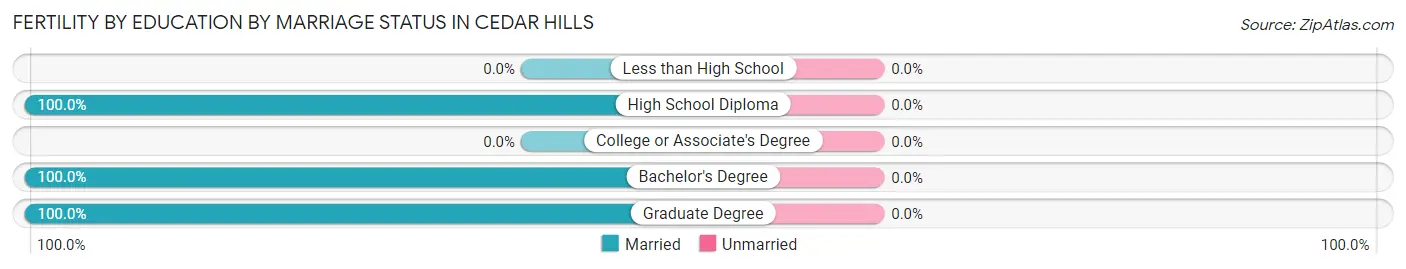
| Educational Attainment | Married | Unmarried |
| Less than High School | 0 (0.0%) | 0 (0.0%) |
| High School Diploma | 9 (100.0%) | 0 (0.0%) |
| College or Associate's Degree | 0 (0.0%) | 0 (0.0%) |
| Bachelor's Degree | 51 (100.0%) | 0 (0.0%) |
| Graduate Degree | 44 (100.0%) | 0 (0.0%) |
| Total | 104 (100.0%) | 0 (0.0%) |
Employment Characteristics in Cedar Hills
Employment by Class of Employer in Cedar Hills
Among the 4,920 employed individuals in Cedar Hills, private company employees (3,105 | 63.1%), self-employed (not incorporated) (572 | 11.6%), and not-for-profit organizations (481 | 9.8%) make up the most common classes of employment.
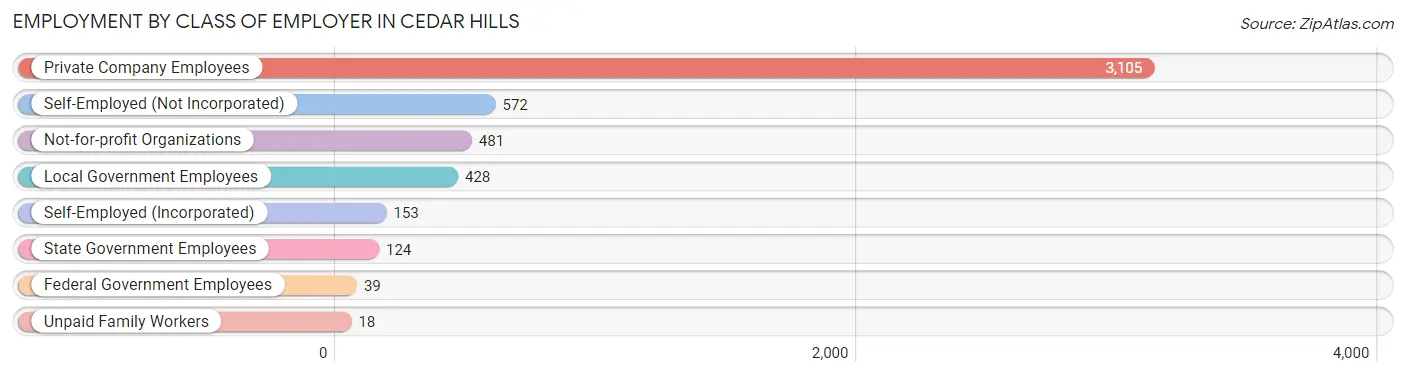
| Employer Class | # Employees | % Employees |
| Private Company Employees | 3,105 | 63.1% |
| Self-Employed (Incorporated) | 153 | 3.1% |
| Self-Employed (Not Incorporated) | 572 | 11.6% |
| Not-for-profit Organizations | 481 | 9.8% |
| Local Government Employees | 428 | 8.7% |
| State Government Employees | 124 | 2.5% |
| Federal Government Employees | 39 | 0.8% |
| Unpaid Family Workers | 18 | 0.4% |
| Total | 4,920 | 100.0% |
Employment Status by Age in Cedar Hills
According to the labor force statistics for Cedar Hills, out of the total population over 16 years of age (7,175), 72.5% or 5,202 individuals are in the labor force, with 4.5% or 234 of them unemployed. The age group with the highest labor force participation rate is 35 to 44 years, with 94.1% or 1,440 individuals in the labor force. Within the labor force, the 16 to 19 years age range has the highest percentage of unemployed individuals, with 24.0% or 70 of them being unemployed.
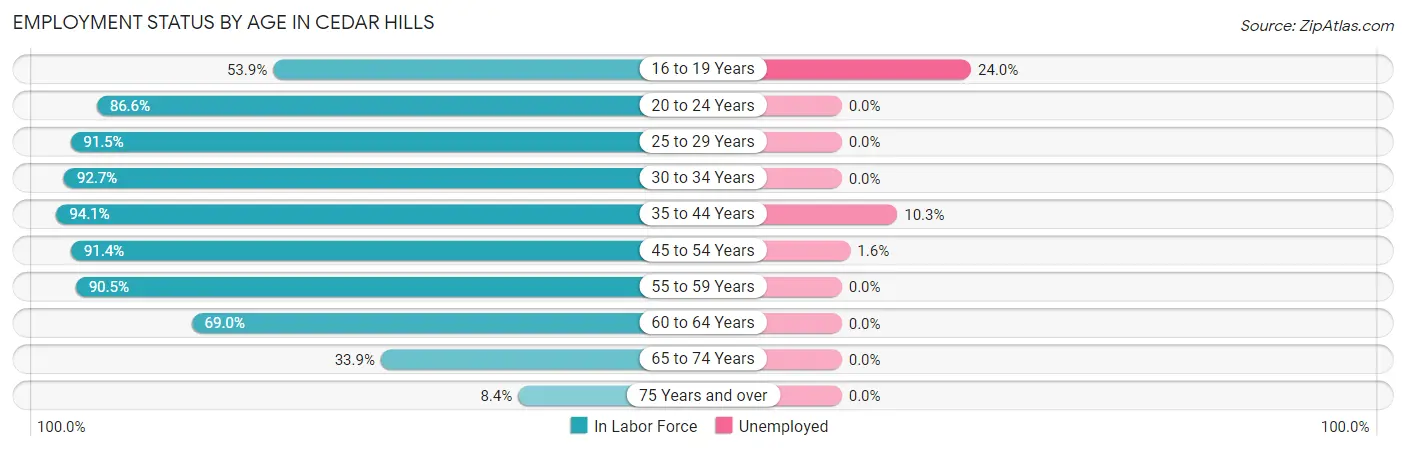
| Age Bracket | In Labor Force | Unemployed |
| 16 to 19 Years | 292 (53.9%) | 70 (24.0%) |
| 20 to 24 Years | 201 (86.6%) | 0 (0.0%) |
| 25 to 29 Years | 643 (91.5%) | 0 (0.0%) |
| 30 to 34 Years | 635 (92.7%) | 0 (0.0%) |
| 35 to 44 Years | 1,440 (94.1%) | 148 (10.3%) |
| 45 to 54 Years | 1,014 (91.4%) | 16 (1.6%) |
| 55 to 59 Years | 286 (90.5%) | 0 (0.0%) |
| 60 to 64 Years | 343 (69.0%) | 0 (0.0%) |
| 65 to 74 Years | 287 (33.9%) | 0 (0.0%) |
| 75 Years and over | 60 (8.4%) | 0 (0.0%) |
| Total | 5,202 (72.5%) | 234 (4.5%) |
Employment Status by Educational Attainment in Cedar Hills
According to labor force statistics for Cedar Hills, 90.1% of individuals (4,361) out of the total population between 25 and 64 years of age (4,840) are in the labor force, with 3.8% or 166 of them being unemployed. The group with the highest labor force participation rate are those with the educational attainment of less than high school, with 93.6% or 481 individuals in the labor force. Within the labor force, individuals with college / associate degree education have the highest percentage of unemployment, with 7.6% or 93 of them being unemployed.
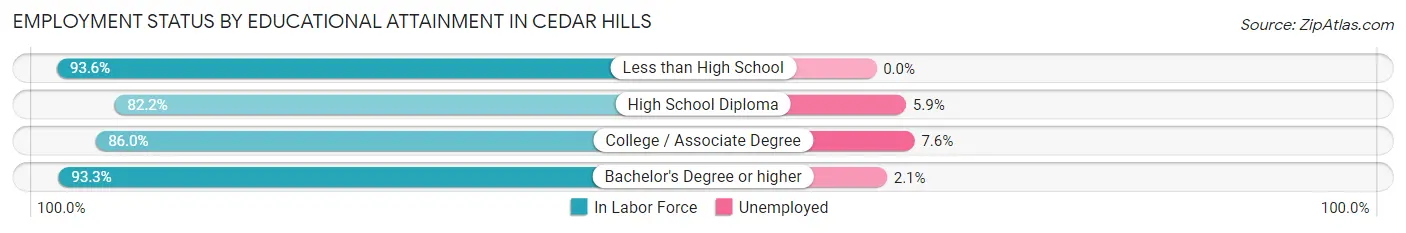
| Educational Attainment | In Labor Force | Unemployed |
| Less than High School | 481 (93.6%) | 0 (0.0%) |
| High School Diploma | 387 (82.2%) | 28 (5.9%) |
| College / Associate Degree | 1,225 (86.0%) | 108 (7.6%) |
| Bachelor's Degree or higher | 2,268 (93.3%) | 51 (2.1%) |
| Total | 4,361 (90.1%) | 184 (3.8%) |
Employment Occupations by Sex in Cedar Hills
Management, Business, Science and Arts Occupations
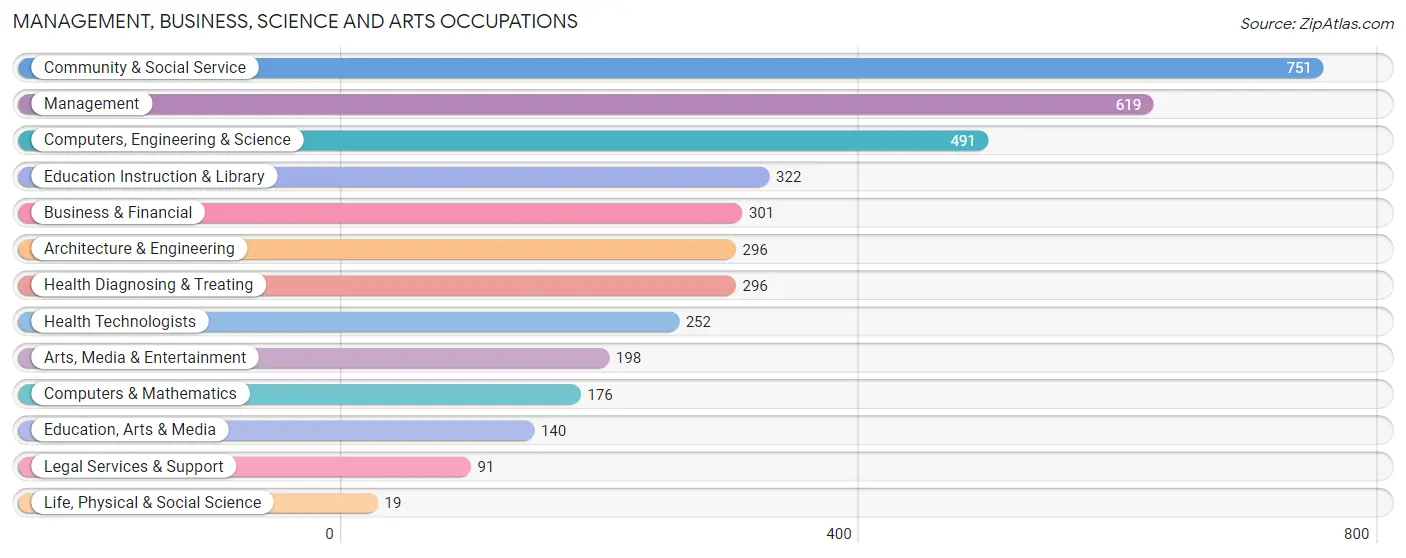
The most common Management, Business, Science and Arts occupations in Cedar Hills are Community & Social Service (751 | 15.1%), Management (619 | 12.5%), Computers, Engineering & Science (491 | 9.9%), Education Instruction & Library (322 | 6.5%), and Business & Financial (301 | 6.1%).
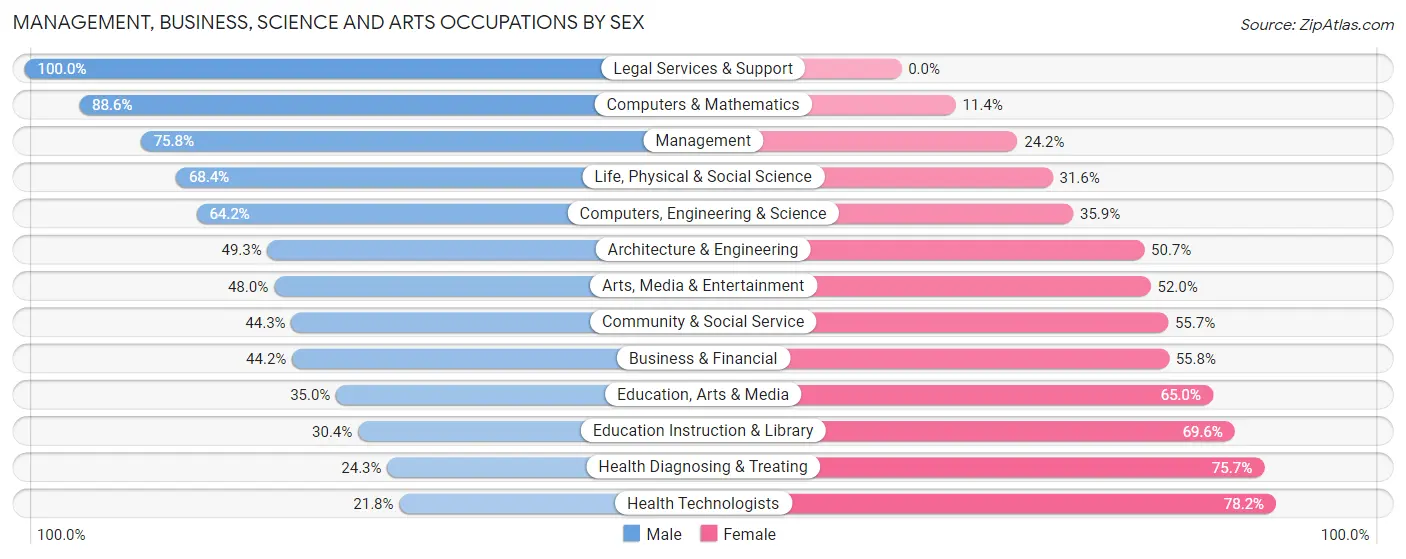
Management, Business, Science and Arts Occupations by Sex
Within the Management, Business, Science and Arts occupations in Cedar Hills, the most male-oriented occupations are Legal Services & Support (100.0%), Computers & Mathematics (88.6%), and Management (75.8%), while the most female-oriented occupations are Health Technologists (78.2%), Health Diagnosing & Treating (75.7%), and Education Instruction & Library (69.6%).
| Occupation | Male | Female |
| Management | 469 (75.8%) | 150 (24.2%) |
| Business & Financial | 133 (44.2%) | 168 (55.8%) |
| Computers, Engineering & Science | 315 (64.1%) | 176 (35.8%) |
| Computers & Mathematics | 156 (88.6%) | 20 (11.4%) |
| Architecture & Engineering | 146 (49.3%) | 150 (50.7%) |
| Life, Physical & Social Science | 13 (68.4%) | 6 (31.6%) |
| Community & Social Service | 333 (44.3%) | 418 (55.7%) |
| Education, Arts & Media | 49 (35.0%) | 91 (65.0%) |
| Legal Services & Support | 91 (100.0%) | 0 (0.0%) |
| Education Instruction & Library | 98 (30.4%) | 224 (69.6%) |
| Arts, Media & Entertainment | 95 (48.0%) | 103 (52.0%) |
| Health Diagnosing & Treating | 72 (24.3%) | 224 (75.7%) |
| Health Technologists | 55 (21.8%) | 197 (78.2%) |
| Total (Category) | 1,322 (53.8%) | 1,136 (46.2%) |
| Total (Overall) | 2,665 (53.6%) | 2,302 (46.4%) |
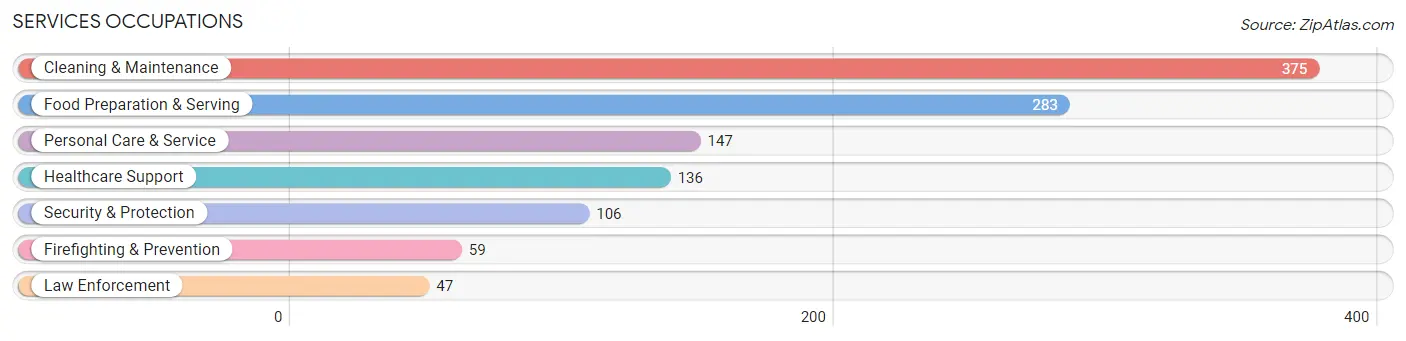
Services Occupations
The most common Services occupations in Cedar Hills are Cleaning & Maintenance (375 | 7.5%), Food Preparation & Serving (283 | 5.7%), Personal Care & Service (147 | 3.0%), Healthcare Support (136 | 2.7%), and Security & Protection (106 | 2.1%).
Services Occupations by Sex
Within the Services occupations in Cedar Hills, the most male-oriented occupations are Law Enforcement (100.0%), Security & Protection (81.1%), and Firefighting & Prevention (66.1%), while the most female-oriented occupations are Personal Care & Service (85.7%), Healthcare Support (70.6%), and Cleaning & Maintenance (46.1%).
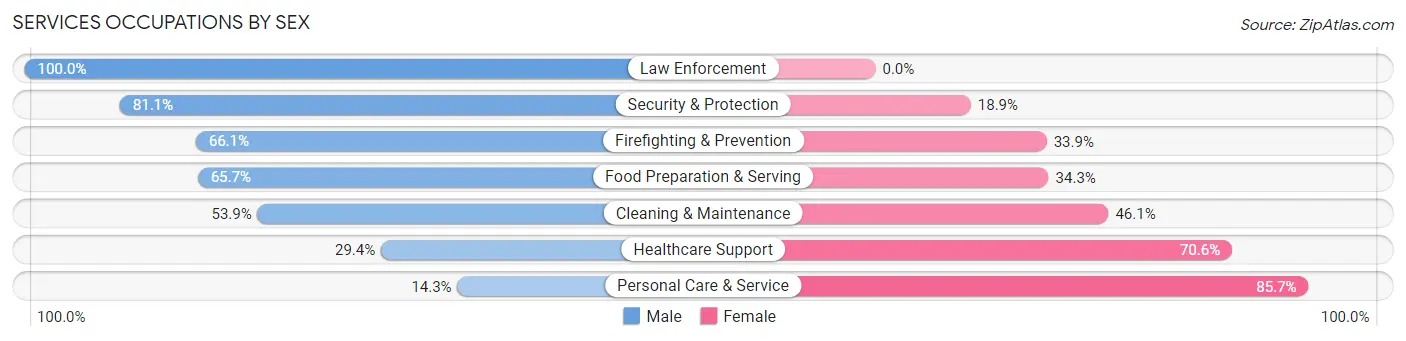
| Occupation | Male | Female |
| Healthcare Support | 40 (29.4%) | 96 (70.6%) |
| Security & Protection | 86 (81.1%) | 20 (18.9%) |
| Firefighting & Prevention | 39 (66.1%) | 20 (33.9%) |
| Law Enforcement | 47 (100.0%) | 0 (0.0%) |
| Food Preparation & Serving | 186 (65.7%) | 97 (34.3%) |
| Cleaning & Maintenance | 202 (53.9%) | 173 (46.1%) |
| Personal Care & Service | 21 (14.3%) | 126 (85.7%) |
| Total (Category) | 535 (51.1%) | 512 (48.9%) |
| Total (Overall) | 2,665 (53.6%) | 2,302 (46.4%) |
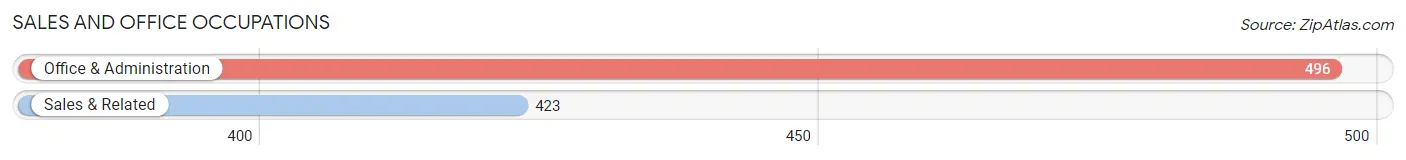
Sales and Office Occupations
The most common Sales and Office occupations in Cedar Hills are Office & Administration (496 | 10.0%), and Sales & Related (423 | 8.5%).
Sales and Office Occupations by Sex
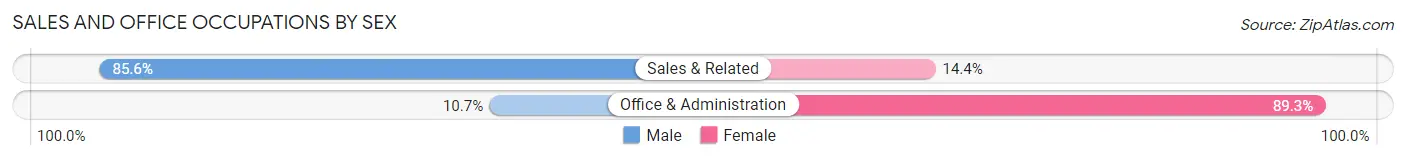
| Occupation | Male | Female |
| Sales & Related | 362 (85.6%) | 61 (14.4%) |
| Office & Administration | 53 (10.7%) | 443 (89.3%) |
| Total (Category) | 415 (45.2%) | 504 (54.8%) |
| Total (Overall) | 2,665 (53.6%) | 2,302 (46.4%) |
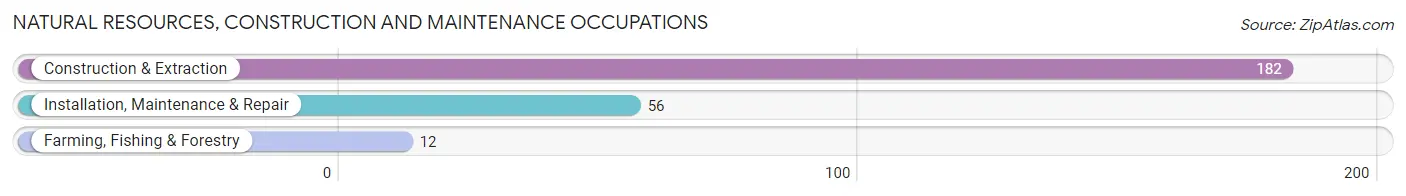
Natural Resources, Construction and Maintenance Occupations
The most common Natural Resources, Construction and Maintenance occupations in Cedar Hills are Construction & Extraction (182 | 3.7%), Installation, Maintenance & Repair (56 | 1.1%), and Farming, Fishing & Forestry (12 | 0.2%).
Natural Resources, Construction and Maintenance Occupations by Sex
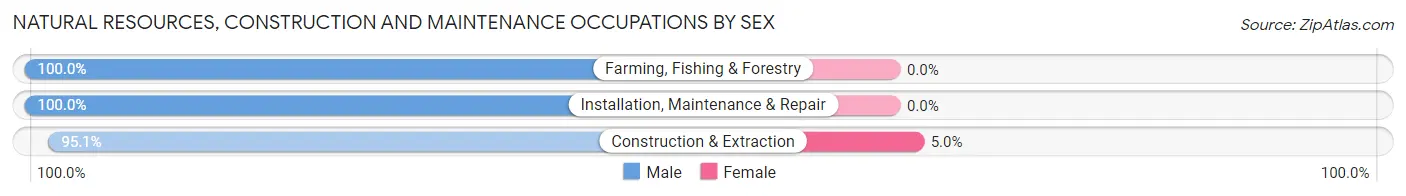
| Occupation | Male | Female |
| Farming, Fishing & Forestry | 12 (100.0%) | 0 (0.0%) |
| Construction & Extraction | 173 (95.1%) | 9 (5.0%) |
| Installation, Maintenance & Repair | 56 (100.0%) | 0 (0.0%) |
| Total (Category) | 241 (96.4%) | 9 (3.6%) |
| Total (Overall) | 2,665 (53.6%) | 2,302 (46.4%) |
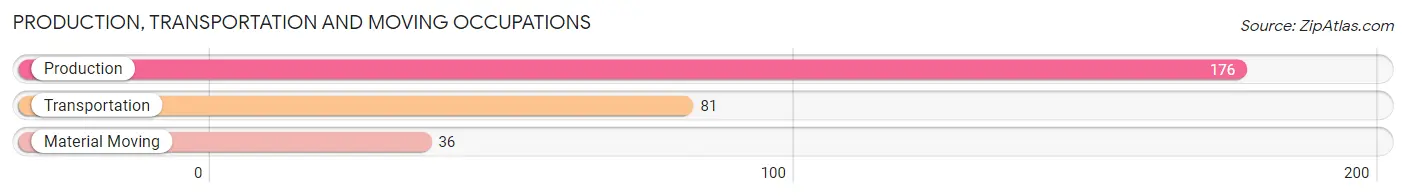
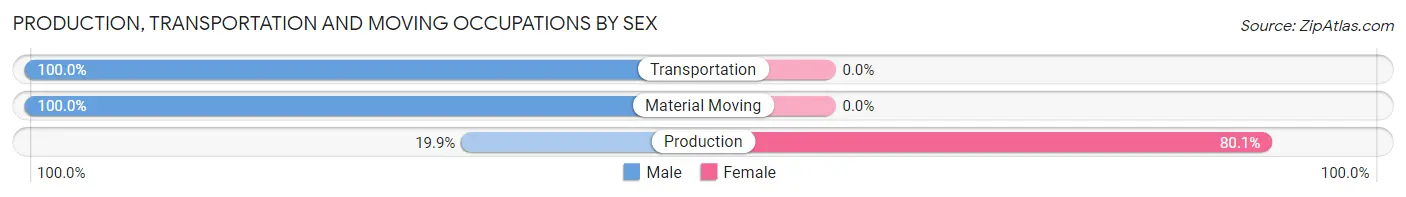
Production, Transportation and Moving Occupations
The most common Production, Transportation and Moving occupations in Cedar Hills are Production (176 | 3.5%), Transportation (81 | 1.6%), and Material Moving (36 | 0.7%).
Production, Transportation and Moving Occupations by Sex
| Occupation | Male | Female |
| Production | 35 (19.9%) | 141 (80.1%) |
| Transportation | 81 (100.0%) | 0 (0.0%) |
| Material Moving | 36 (100.0%) | 0 (0.0%) |
| Total (Category) | 152 (51.9%) | 141 (48.1%) |
| Total (Overall) | 2,665 (53.6%) | 2,302 (46.4%) |
Employment Industries by Sex in Cedar Hills
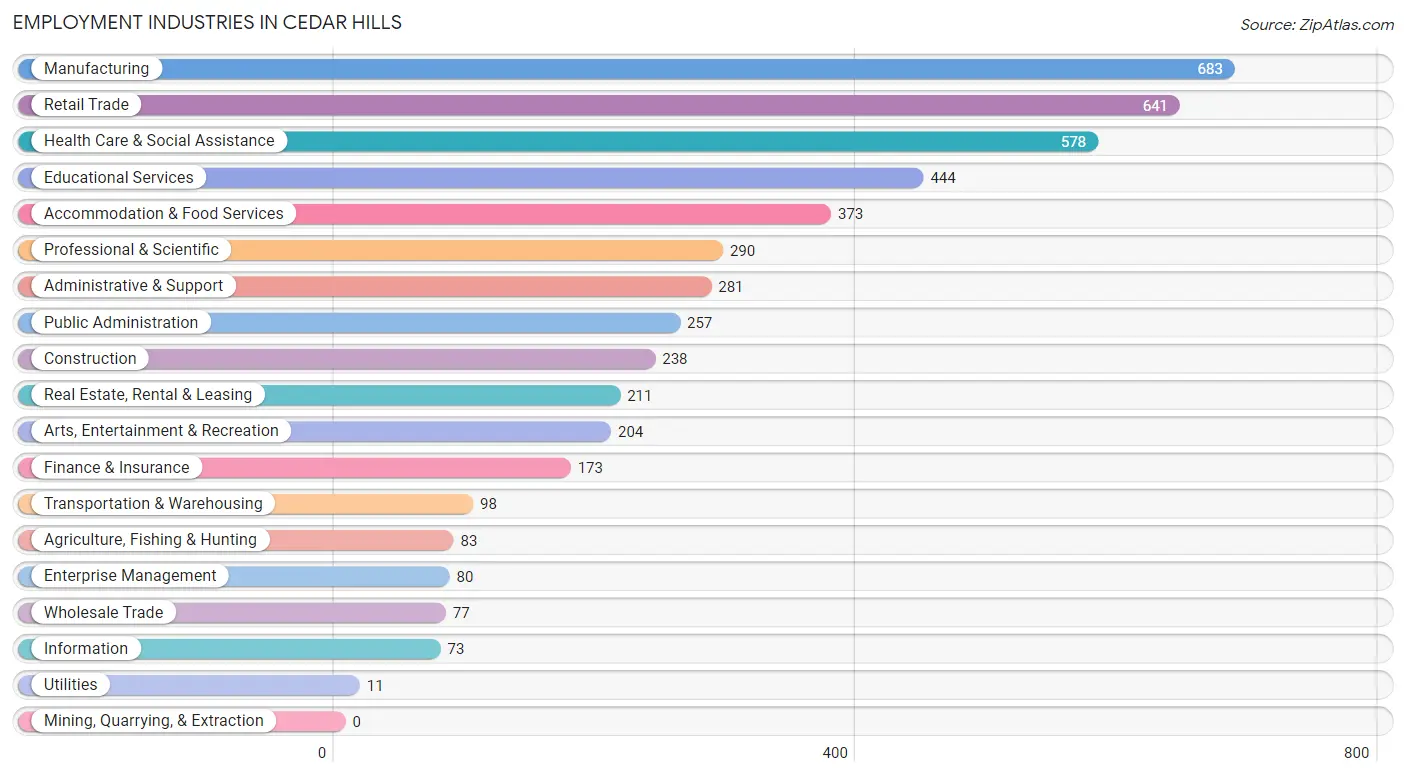
Employment Industries in Cedar Hills
The major employment industries in Cedar Hills include Manufacturing (683 | 13.8%), Retail Trade (641 | 12.9%), Health Care & Social Assistance (578 | 11.6%), Educational Services (444 | 8.9%), and Accommodation & Food Services (373 | 7.5%).
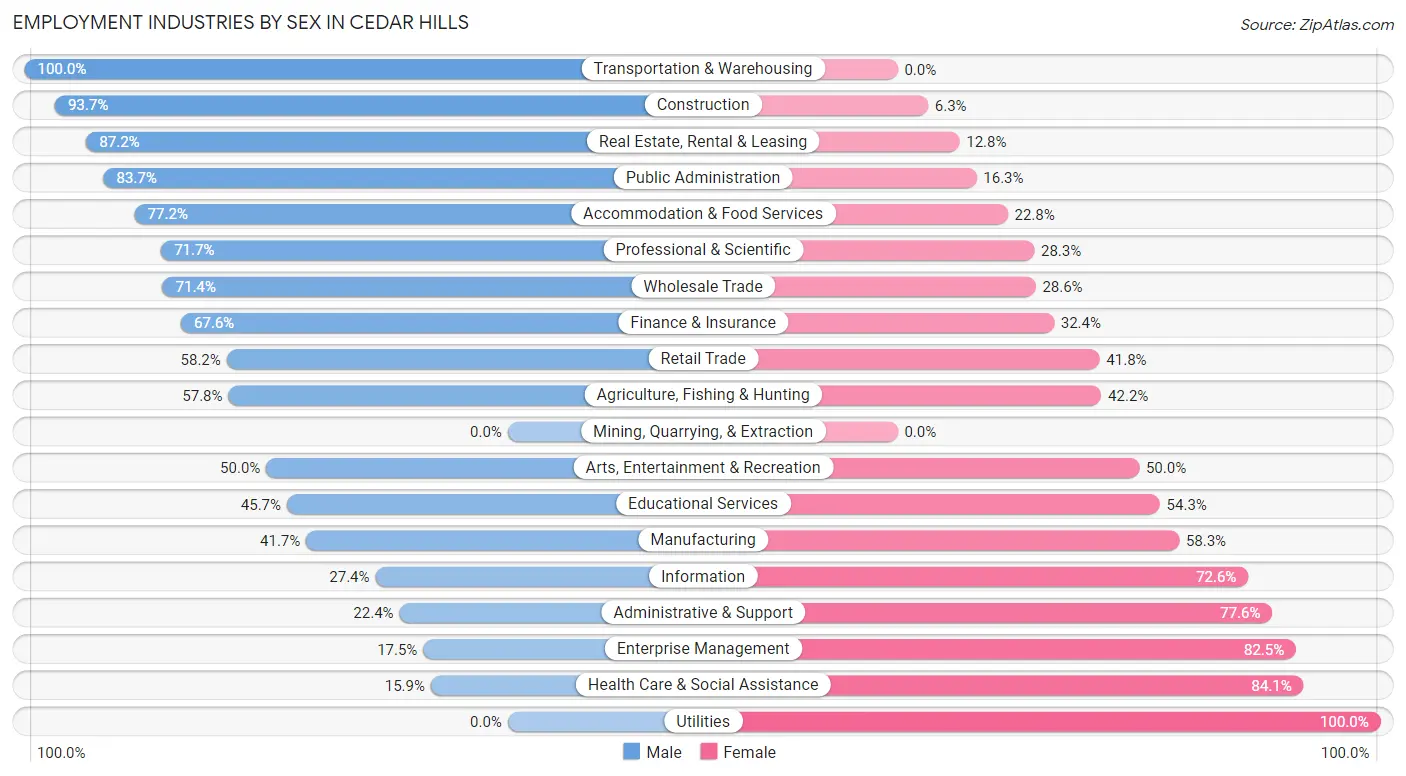
Employment Industries by Sex in Cedar Hills
The Cedar Hills industries that see more men than women are Transportation & Warehousing (100.0%), Construction (93.7%), and Real Estate, Rental & Leasing (87.2%), whereas the industries that tend to have a higher number of women are Utilities (100.0%), Health Care & Social Assistance (84.1%), and Enterprise Management (82.5%).
| Industry | Male | Female |
| Agriculture, Fishing & Hunting | 48 (57.8%) | 35 (42.2%) |
| Mining, Quarrying, & Extraction | 0 (0.0%) | 0 (0.0%) |
| Construction | 223 (93.7%) | 15 (6.3%) |
| Manufacturing | 285 (41.7%) | 398 (58.3%) |
| Wholesale Trade | 55 (71.4%) | 22 (28.6%) |
| Retail Trade | 373 (58.2%) | 268 (41.8%) |
| Transportation & Warehousing | 98 (100.0%) | 0 (0.0%) |
| Utilities | 0 (0.0%) | 11 (100.0%) |
| Information | 20 (27.4%) | 53 (72.6%) |
| Finance & Insurance | 117 (67.6%) | 56 (32.4%) |
| Real Estate, Rental & Leasing | 184 (87.2%) | 27 (12.8%) |
| Professional & Scientific | 208 (71.7%) | 82 (28.3%) |
| Enterprise Management | 14 (17.5%) | 66 (82.5%) |
| Administrative & Support | 63 (22.4%) | 218 (77.6%) |
| Educational Services | 203 (45.7%) | 241 (54.3%) |
| Health Care & Social Assistance | 92 (15.9%) | 486 (84.1%) |
| Arts, Entertainment & Recreation | 102 (50.0%) | 102 (50.0%) |
| Accommodation & Food Services | 288 (77.2%) | 85 (22.8%) |
| Public Administration | 215 (83.7%) | 42 (16.3%) |
| Total | 2,665 (53.6%) | 2,302 (46.4%) |
Education in Cedar Hills
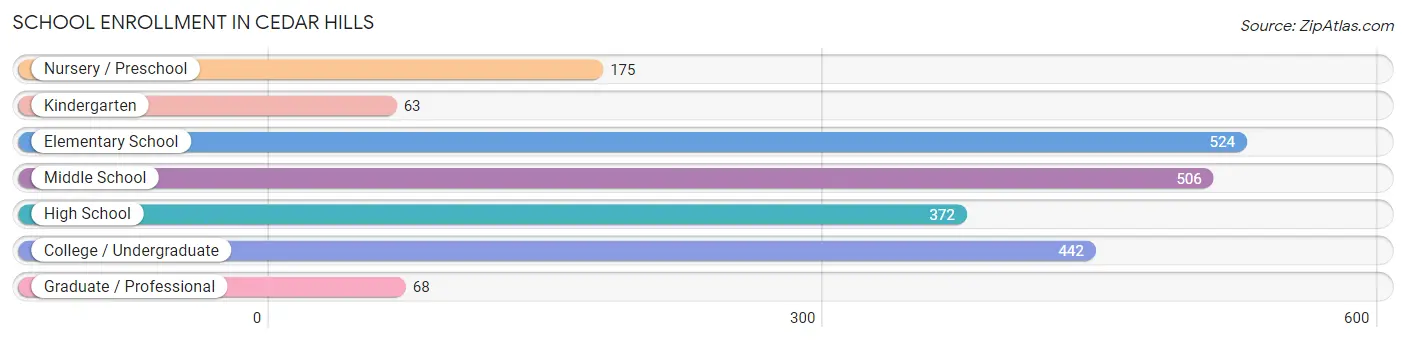
School Enrollment in Cedar Hills
The most common levels of schooling among the 2,150 students in Cedar Hills are elementary school (524 | 24.4%), middle school (506 | 23.5%), and college / undergraduate (442 | 20.6%).
| School Level | # Students | % Students |
| Nursery / Preschool | 175 | 8.1% |
| Kindergarten | 63 | 2.9% |
| Elementary School | 524 | 24.4% |
| Middle School | 506 | 23.5% |
| High School | 372 | 17.3% |
| College / Undergraduate | 442 | 20.6% |
| Graduate / Professional | 68 | 3.2% |
| Total | 2,150 | 100.0% |
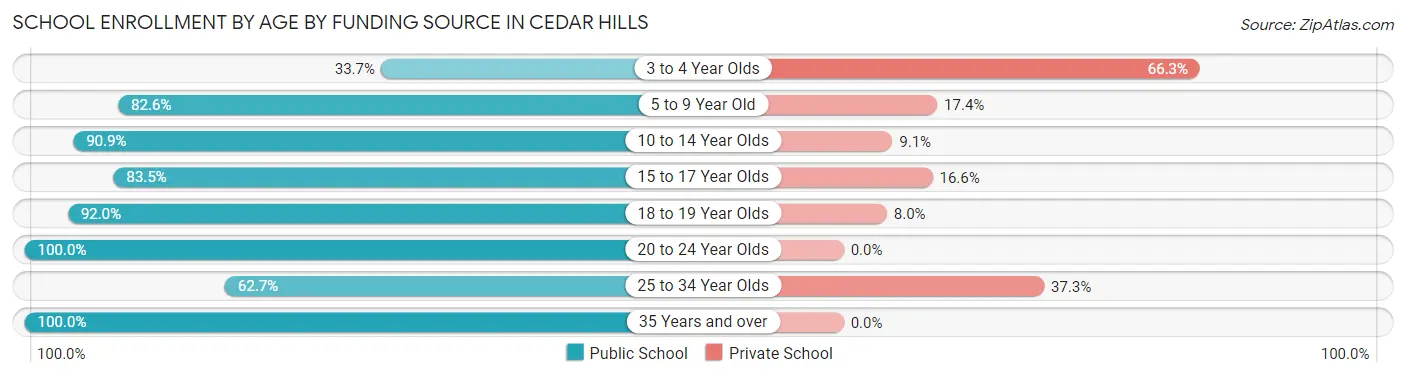
School Enrollment by Age by Funding Source in Cedar Hills
Out of a total of 2,150 students who are enrolled in schools in Cedar Hills, 374 (17.4%) attend a private institution, while the remaining 1,776 (82.6%) are enrolled in public schools. The age group of 3 to 4 year olds has the highest likelihood of being enrolled in private schools, with 67 (66.3% in the age bracket) enrolled. Conversely, the age group of 20 to 24 year olds has the lowest likelihood of being enrolled in a private school, with 45 (100.0% in the age bracket) attending a public institution.
| Age Bracket | Public School | Private School |
| 3 to 4 Year Olds | 34 (33.7%) | 67 (66.3%) |
| 5 to 9 Year Old | 503 (82.6%) | 106 (17.4%) |
| 10 to 14 Year Olds | 542 (90.9%) | 54 (9.1%) |
| 15 to 17 Year Olds | 232 (83.5%) | 46 (16.6%) |
| 18 to 19 Year Olds | 263 (92.0%) | 23 (8.0%) |
| 20 to 24 Year Olds | 45 (100.0%) | 0 (0.0%) |
| 25 to 34 Year Olds | 131 (62.7%) | 78 (37.3%) |
| 35 Years and over | 26 (100.0%) | 0 (0.0%) |
| Total | 1,776 (82.6%) | 374 (17.4%) |
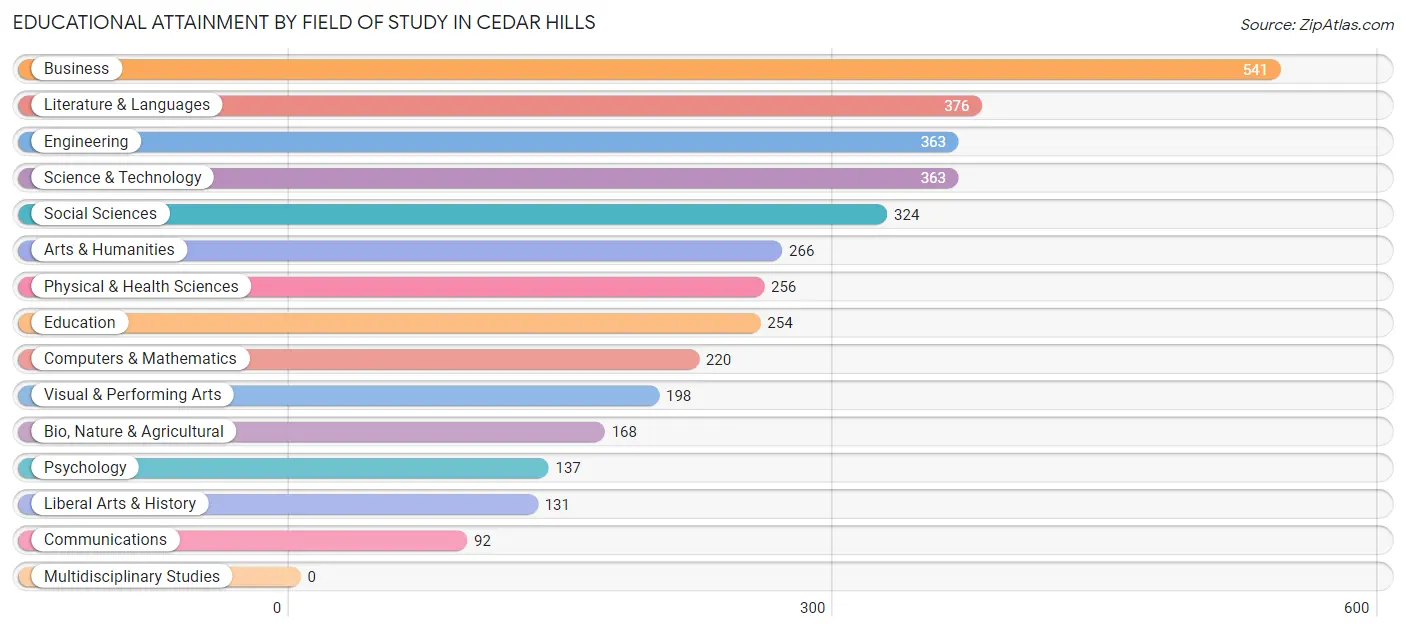
Educational Attainment by Field of Study in Cedar Hills
Business (541 | 14.7%), literature & languages (376 | 10.2%), engineering (363 | 9.8%), science & technology (363 | 9.8%), and social sciences (324 | 8.8%) are the most common fields of study among 3,689 individuals in Cedar Hills who have obtained a bachelor's degree or higher.
| Field of Study | # Graduates | % Graduates |
| Computers & Mathematics | 220 | 6.0% |
| Bio, Nature & Agricultural | 168 | 4.5% |
| Physical & Health Sciences | 256 | 6.9% |
| Psychology | 137 | 3.7% |
| Social Sciences | 324 | 8.8% |
| Engineering | 363 | 9.8% |
| Multidisciplinary Studies | 0 | 0.0% |
| Science & Technology | 363 | 9.8% |
| Business | 541 | 14.7% |
| Education | 254 | 6.9% |
| Literature & Languages | 376 | 10.2% |
| Liberal Arts & History | 131 | 3.5% |
| Visual & Performing Arts | 198 | 5.4% |
| Communications | 92 | 2.5% |
| Arts & Humanities | 266 | 7.2% |
| Total | 3,689 | 100.0% |
Transportation & Commute in Cedar Hills
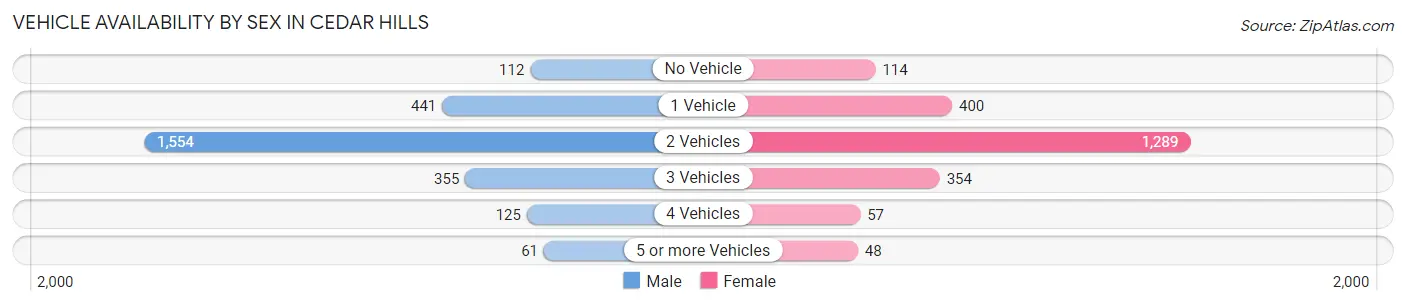
Vehicle Availability by Sex in Cedar Hills
The most prevalent vehicle ownership categories in Cedar Hills are males with 2 vehicles (1,554, accounting for 58.7%) and females with 2 vehicles (1,289, making up 68.7%).
| Vehicles Available | Male | Female |
| No Vehicle | 112 (4.2%) | 114 (5.0%) |
| 1 Vehicle | 441 (16.7%) | 400 (17.7%) |
| 2 Vehicles | 1,554 (58.7%) | 1,289 (57.0%) |
| 3 Vehicles | 355 (13.4%) | 354 (15.7%) |
| 4 Vehicles | 125 (4.7%) | 57 (2.5%) |
| 5 or more Vehicles | 61 (2.3%) | 48 (2.1%) |
| Total | 2,648 (100.0%) | 2,262 (100.0%) |
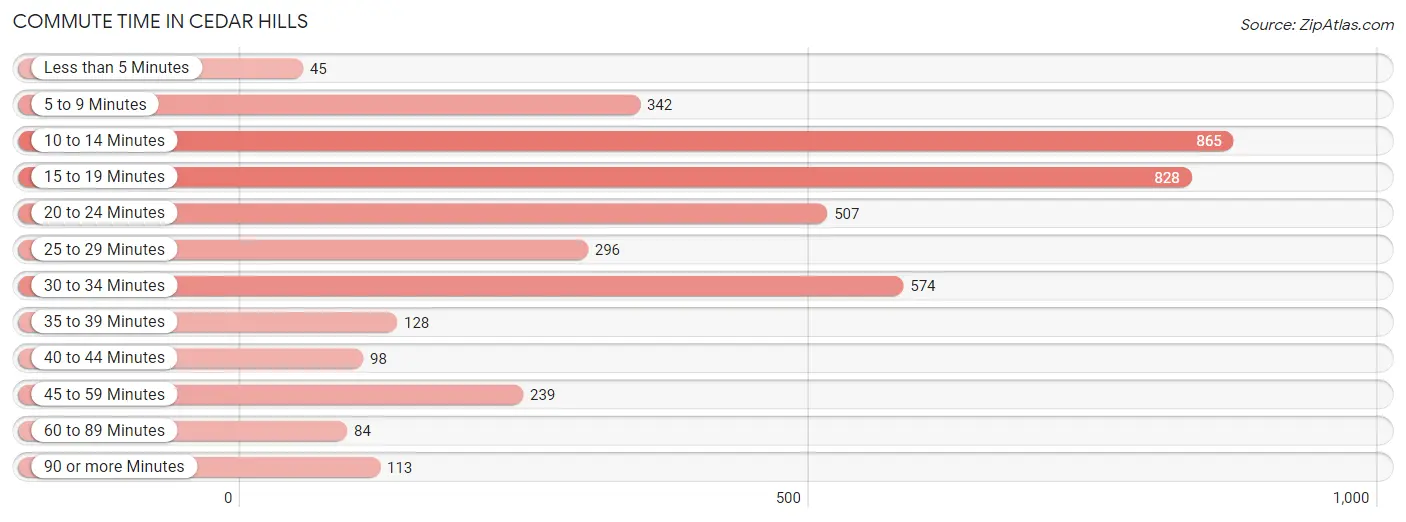
Commute Time in Cedar Hills
The most frequently occuring commute durations in Cedar Hills are 10 to 14 minutes (865 commuters, 21.0%), 15 to 19 minutes (828 commuters, 20.1%), and 30 to 34 minutes (574 commuters, 13.9%).
| Commute Time | # Commuters | % Commuters |
| Less than 5 Minutes | 45 | 1.1% |
| 5 to 9 Minutes | 342 | 8.3% |
| 10 to 14 Minutes | 865 | 21.0% |
| 15 to 19 Minutes | 828 | 20.1% |
| 20 to 24 Minutes | 507 | 12.3% |
| 25 to 29 Minutes | 296 | 7.2% |
| 30 to 34 Minutes | 574 | 13.9% |
| 35 to 39 Minutes | 128 | 3.1% |
| 40 to 44 Minutes | 98 | 2.4% |
| 45 to 59 Minutes | 239 | 5.8% |
| 60 to 89 Minutes | 84 | 2.0% |
| 90 or more Minutes | 113 | 2.7% |
Commute Time by Sex in Cedar Hills
The most common commute times in Cedar Hills are 15 to 19 minutes (445 commuters, 19.9%) for males and 10 to 14 minutes (572 commuters, 30.4%) for females.
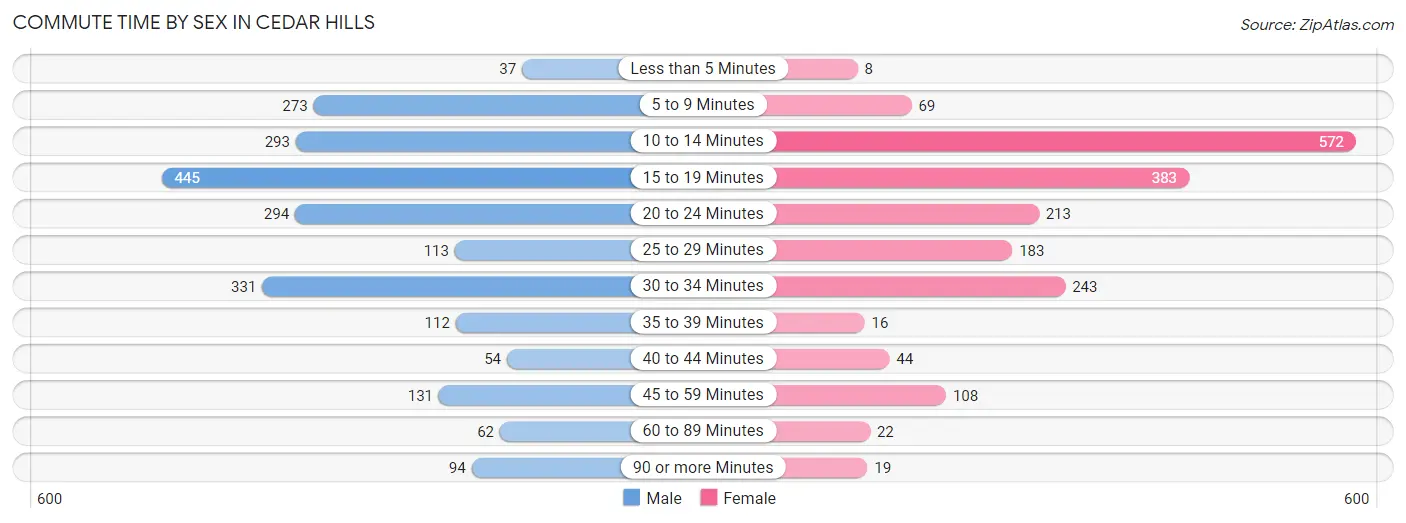
| Commute Time | Male | Female |
| Less than 5 Minutes | 37 (1.7%) | 8 (0.4%) |
| 5 to 9 Minutes | 273 (12.2%) | 69 (3.7%) |
| 10 to 14 Minutes | 293 (13.1%) | 572 (30.4%) |
| 15 to 19 Minutes | 445 (19.9%) | 383 (20.4%) |
| 20 to 24 Minutes | 294 (13.1%) | 213 (11.3%) |
| 25 to 29 Minutes | 113 (5.1%) | 183 (9.7%) |
| 30 to 34 Minutes | 331 (14.8%) | 243 (12.9%) |
| 35 to 39 Minutes | 112 (5.0%) | 16 (0.9%) |
| 40 to 44 Minutes | 54 (2.4%) | 44 (2.3%) |
| 45 to 59 Minutes | 131 (5.9%) | 108 (5.7%) |
| 60 to 89 Minutes | 62 (2.8%) | 22 (1.2%) |
| 90 or more Minutes | 94 (4.2%) | 19 (1.0%) |
Time of Departure to Work by Sex in Cedar Hills
The most frequent times of departure to work in Cedar Hills are 7:00 AM to 7:29 AM (439, 19.6%) for males and 7:00 AM to 7:29 AM (458, 24.4%) for females.
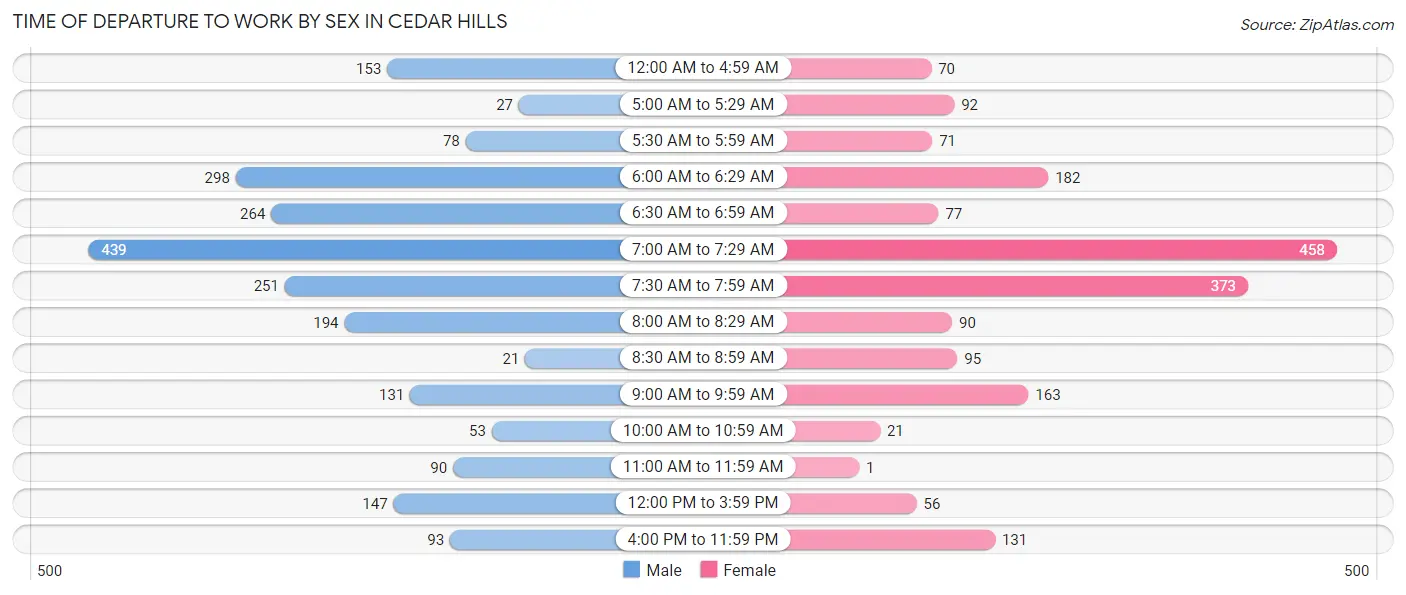
| Time of Departure | Male | Female |
| 12:00 AM to 4:59 AM | 153 (6.8%) | 70 (3.7%) |
| 5:00 AM to 5:29 AM | 27 (1.2%) | 92 (4.9%) |
| 5:30 AM to 5:59 AM | 78 (3.5%) | 71 (3.8%) |
| 6:00 AM to 6:29 AM | 298 (13.3%) | 182 (9.7%) |
| 6:30 AM to 6:59 AM | 264 (11.8%) | 77 (4.1%) |
| 7:00 AM to 7:29 AM | 439 (19.6%) | 458 (24.4%) |
| 7:30 AM to 7:59 AM | 251 (11.2%) | 373 (19.8%) |
| 8:00 AM to 8:29 AM | 194 (8.7%) | 90 (4.8%) |
| 8:30 AM to 8:59 AM | 21 (0.9%) | 95 (5.1%) |
| 9:00 AM to 9:59 AM | 131 (5.9%) | 163 (8.7%) |
| 10:00 AM to 10:59 AM | 53 (2.4%) | 21 (1.1%) |
| 11:00 AM to 11:59 AM | 90 (4.0%) | 1 (0.1%) |
| 12:00 PM to 3:59 PM | 147 (6.6%) | 56 (3.0%) |
| 4:00 PM to 11:59 PM | 93 (4.2%) | 131 (7.0%) |
| Total | 2,239 (100.0%) | 1,880 (100.0%) |
Housing Occupancy in Cedar Hills
Occupancy by Ownership in Cedar Hills
Of the total 3,699 dwellings in Cedar Hills, owner-occupied units account for 2,169 (58.6%), while renter-occupied units make up 1,530 (41.4%).
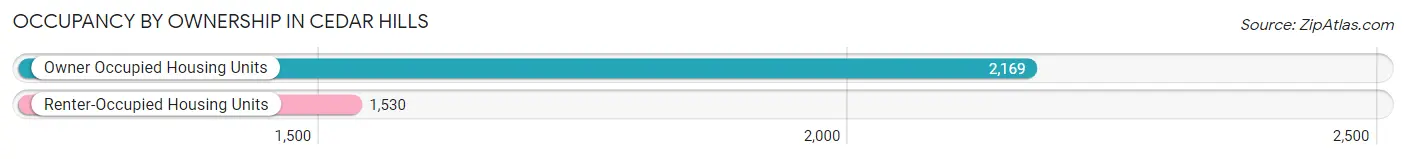
| Occupancy | # Housing Units | % Housing Units |
| Owner Occupied Housing Units | 2,169 | 58.6% |
| Renter-Occupied Housing Units | 1,530 | 41.4% |
| Total Occupied Housing Units | 3,699 | 100.0% |
Occupancy by Household Size in Cedar Hills
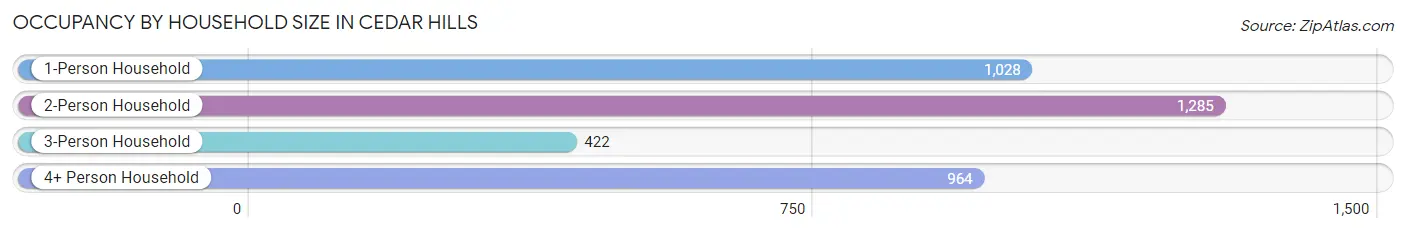
| Household Size | # Housing Units | % Housing Units |
| 1-Person Household | 1,028 | 27.8% |
| 2-Person Household | 1,285 | 34.7% |
| 3-Person Household | 422 | 11.4% |
| 4+ Person Household | 964 | 26.1% |
| Total Housing Units | 3,699 | 100.0% |
Occupancy by Ownership by Household Size in Cedar Hills
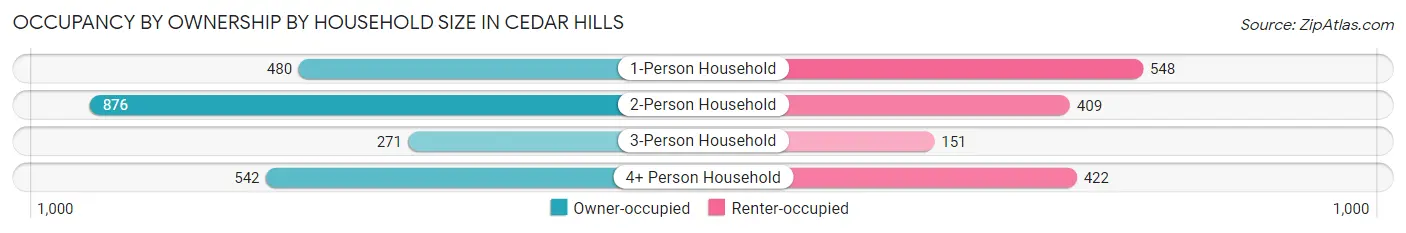
| Household Size | Owner-occupied | Renter-occupied |
| 1-Person Household | 480 (46.7%) | 548 (53.3%) |
| 2-Person Household | 876 (68.2%) | 409 (31.8%) |
| 3-Person Household | 271 (64.2%) | 151 (35.8%) |
| 4+ Person Household | 542 (56.2%) | 422 (43.8%) |
| Total Housing Units | 2,169 (58.6%) | 1,530 (41.4%) |
Occupancy by Educational Attainment in Cedar Hills
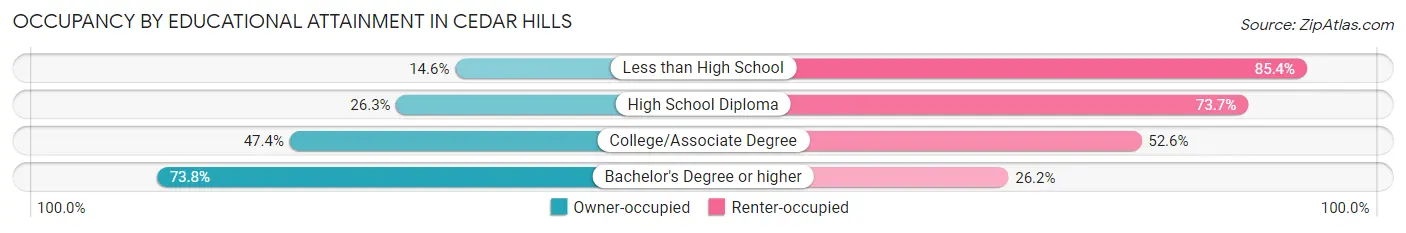
| Household Size | Owner-occupied | Renter-occupied |
| Less than High School | 37 (14.6%) | 216 (85.4%) |
| High School Diploma | 77 (26.3%) | 216 (73.7%) |
| College/Associate Degree | 489 (47.4%) | 542 (52.6%) |
| Bachelor's Degree or higher | 1,566 (73.8%) | 556 (26.2%) |
Occupancy by Age of Householder in Cedar Hills
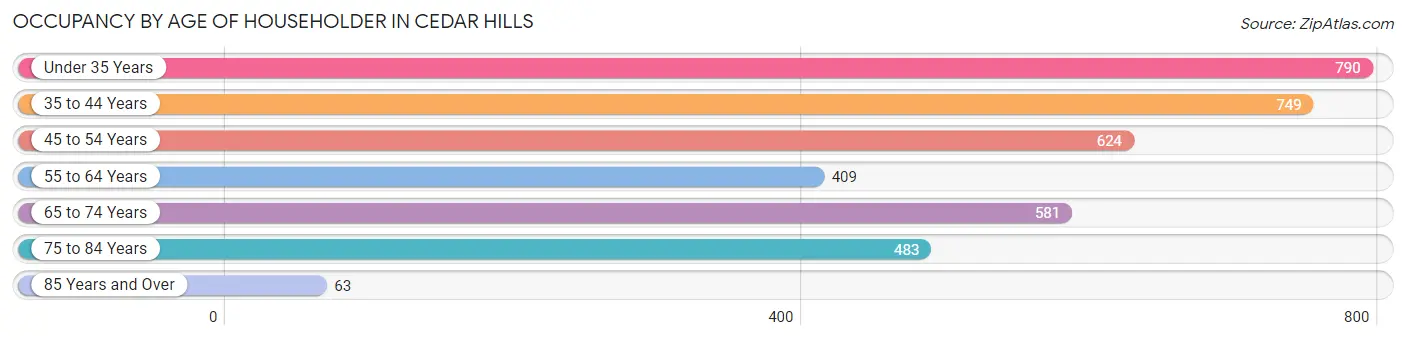
| Age Bracket | # Households | % Households |
| Under 35 Years | 790 | 21.4% |
| 35 to 44 Years | 749 | 20.3% |
| 45 to 54 Years | 624 | 16.9% |
| 55 to 64 Years | 409 | 11.1% |
| 65 to 74 Years | 581 | 15.7% |
| 75 to 84 Years | 483 | 13.1% |
| 85 Years and Over | 63 | 1.7% |
| Total | 3,699 | 100.0% |
Housing Finances in Cedar Hills
Median Income by Occupancy in Cedar Hills
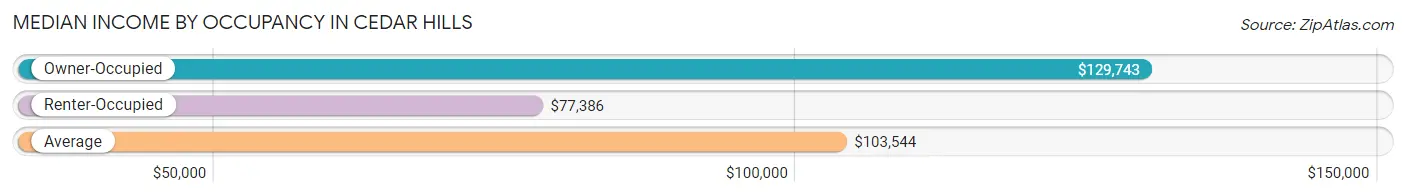
| Occupancy Type | # Households | Median Income |
| Owner-Occupied | 2,169 (58.6%) | $129,743 |
| Renter-Occupied | 1,530 (41.4%) | $77,386 |
| Average | 3,699 (100.0%) | $103,544 |
Occupancy by Householder Income Bracket in Cedar Hills
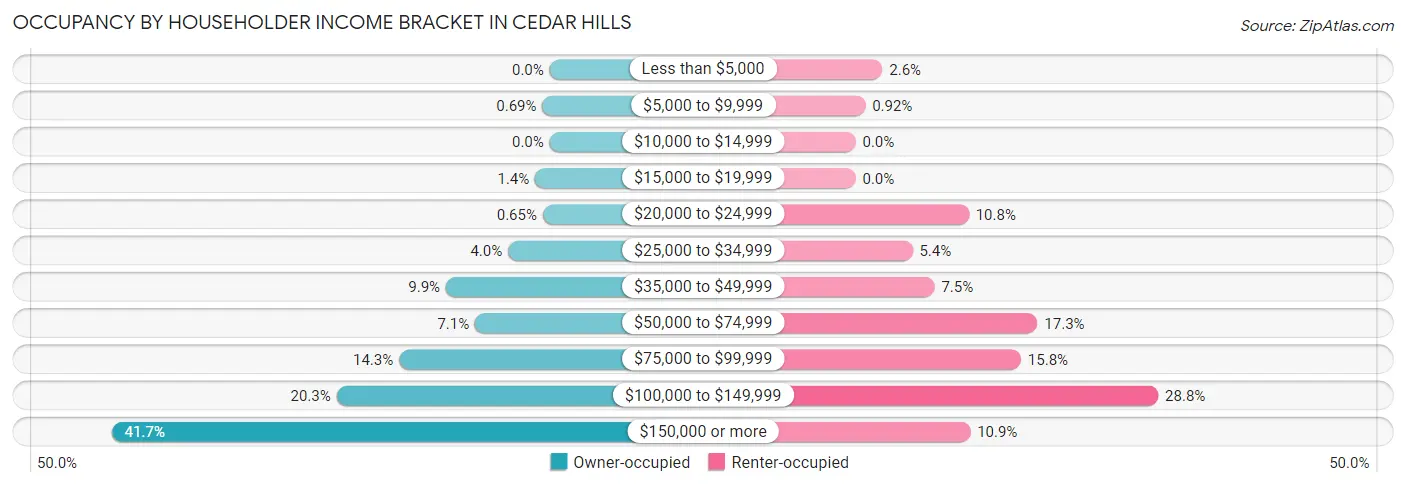
| Income Bracket | Owner-occupied | Renter-occupied |
| Less than $5,000 | 0 (0.0%) | 39 (2.5%) |
| $5,000 to $9,999 | 15 (0.7%) | 14 (0.9%) |
| $10,000 to $14,999 | 0 (0.0%) | 0 (0.0%) |
| $15,000 to $19,999 | 30 (1.4%) | 0 (0.0%) |
| $20,000 to $24,999 | 14 (0.6%) | 165 (10.8%) |
| $25,000 to $34,999 | 86 (4.0%) | 83 (5.4%) |
| $35,000 to $49,999 | 214 (9.9%) | 115 (7.5%) |
| $50,000 to $74,999 | 154 (7.1%) | 265 (17.3%) |
| $75,000 to $99,999 | 311 (14.3%) | 241 (15.8%) |
| $100,000 to $149,999 | 440 (20.3%) | 441 (28.8%) |
| $150,000 or more | 905 (41.7%) | 167 (10.9%) |
| Total | 2,169 (100.0%) | 1,530 (100.0%) |
Monthly Housing Cost Tiers in Cedar Hills
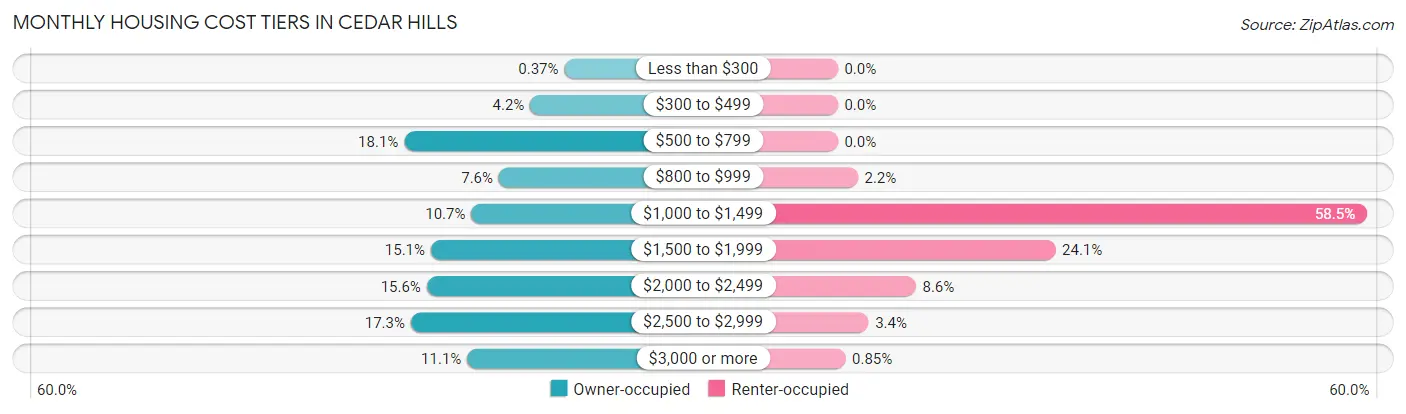
| Monthly Cost | Owner-occupied | Renter-occupied |
| Less than $300 | 8 (0.4%) | 0 (0.0%) |
| $300 to $499 | 90 (4.2%) | 0 (0.0%) |
| $500 to $799 | 392 (18.1%) | 0 (0.0%) |
| $800 to $999 | 165 (7.6%) | 34 (2.2%) |
| $1,000 to $1,499 | 231 (10.6%) | 895 (58.5%) |
| $1,500 to $1,999 | 328 (15.1%) | 368 (24.0%) |
| $2,000 to $2,499 | 338 (15.6%) | 132 (8.6%) |
| $2,500 to $2,999 | 376 (17.3%) | 52 (3.4%) |
| $3,000 or more | 241 (11.1%) | 13 (0.9%) |
| Total | 2,169 (100.0%) | 1,530 (100.0%) |
Physical Housing Characteristics in Cedar Hills
Housing Structures in Cedar Hills
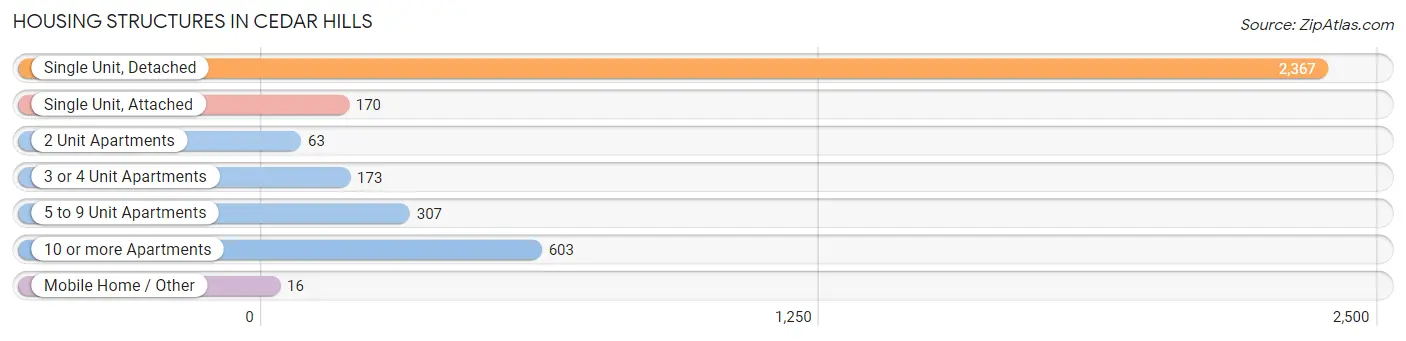
| Structure Type | # Housing Units | % Housing Units |
| Single Unit, Detached | 2,367 | 64.0% |
| Single Unit, Attached | 170 | 4.6% |
| 2 Unit Apartments | 63 | 1.7% |
| 3 or 4 Unit Apartments | 173 | 4.7% |
| 5 to 9 Unit Apartments | 307 | 8.3% |
| 10 or more Apartments | 603 | 16.3% |
| Mobile Home / Other | 16 | 0.4% |
| Total | 3,699 | 100.0% |
Housing Structures by Occupancy in Cedar Hills
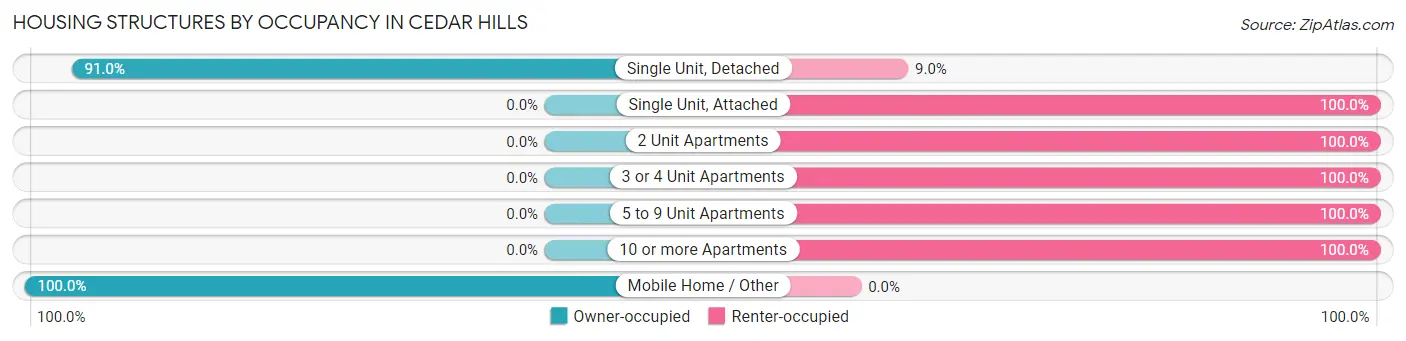
| Structure Type | Owner-occupied | Renter-occupied |
| Single Unit, Detached | 2,153 (91.0%) | 214 (9.0%) |
| Single Unit, Attached | 0 (0.0%) | 170 (100.0%) |
| 2 Unit Apartments | 0 (0.0%) | 63 (100.0%) |
| 3 or 4 Unit Apartments | 0 (0.0%) | 173 (100.0%) |
| 5 to 9 Unit Apartments | 0 (0.0%) | 307 (100.0%) |
| 10 or more Apartments | 0 (0.0%) | 603 (100.0%) |
| Mobile Home / Other | 16 (100.0%) | 0 (0.0%) |
| Total | 2,169 (58.6%) | 1,530 (41.4%) |
Housing Structures by Number of Rooms in Cedar Hills
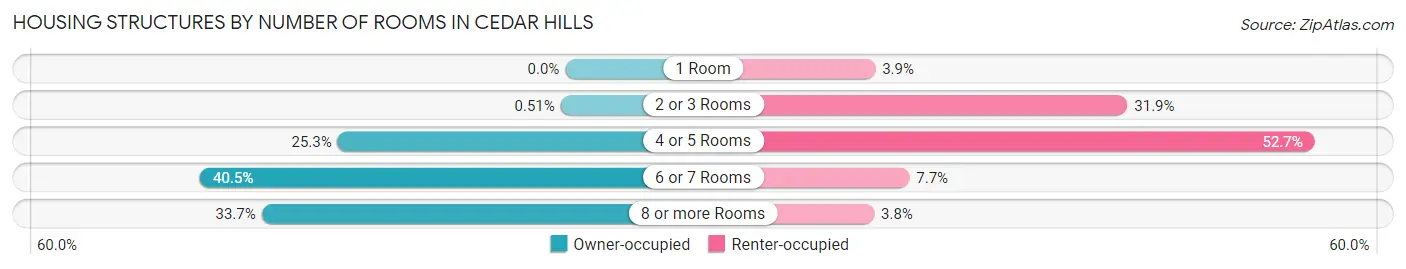
| Number of Rooms | Owner-occupied | Renter-occupied |
| 1 Room | 0 (0.0%) | 60 (3.9%) |
| 2 or 3 Rooms | 11 (0.5%) | 488 (31.9%) |
| 4 or 5 Rooms | 548 (25.3%) | 806 (52.7%) |
| 6 or 7 Rooms | 879 (40.5%) | 118 (7.7%) |
| 8 or more Rooms | 731 (33.7%) | 58 (3.8%) |
| Total | 2,169 (100.0%) | 1,530 (100.0%) |
Housing Structure by Heating Type in Cedar Hills
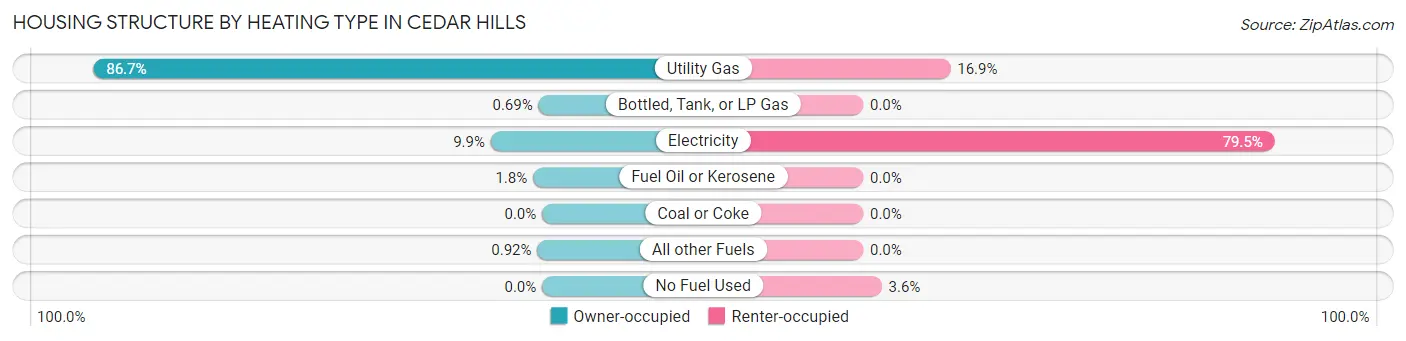
| Heating Type | Owner-occupied | Renter-occupied |
| Utility Gas | 1,881 (86.7%) | 258 (16.9%) |
| Bottled, Tank, or LP Gas | 15 (0.7%) | 0 (0.0%) |
| Electricity | 215 (9.9%) | 1,217 (79.5%) |
| Fuel Oil or Kerosene | 38 (1.8%) | 0 (0.0%) |
| Coal or Coke | 0 (0.0%) | 0 (0.0%) |
| All other Fuels | 20 (0.9%) | 0 (0.0%) |
| No Fuel Used | 0 (0.0%) | 55 (3.6%) |
| Total | 2,169 (100.0%) | 1,530 (100.0%) |
Household Vehicle Usage in Cedar Hills
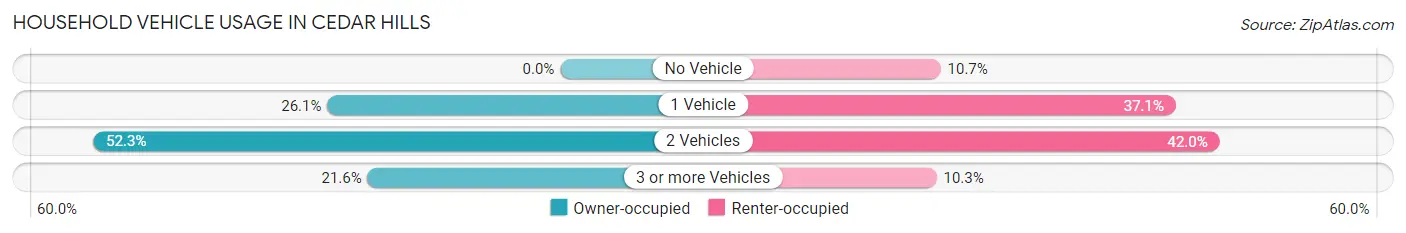
| Vehicles per Household | Owner-occupied | Renter-occupied |
| No Vehicle | 0 (0.0%) | 164 (10.7%) |
| 1 Vehicle | 566 (26.1%) | 567 (37.1%) |
| 2 Vehicles | 1,135 (52.3%) | 642 (42.0%) |
| 3 or more Vehicles | 468 (21.6%) | 157 (10.3%) |
| Total | 2,169 (100.0%) | 1,530 (100.0%) |
Real Estate & Mortgages in Cedar Hills
Real Estate and Mortgage Overview in Cedar Hills
| Characteristic | Without Mortgage | With Mortgage |
| Housing Units | 663 | 1,506 |
| Median Property Value | $527,700 | $563,600 |
| Median Household Income | $89,297 | $681 |
| Monthly Housing Costs | $671 | $241 |
| Real Estate Taxes | $4,193 | $0 |
Property Value by Mortgage Status in Cedar Hills
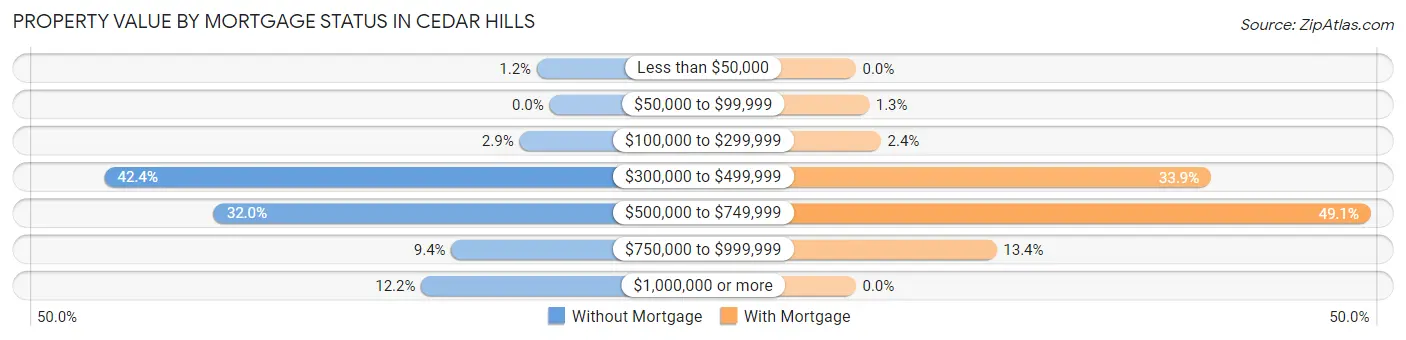
| Property Value | Without Mortgage | With Mortgage |
| Less than $50,000 | 8 (1.2%) | 0 (0.0%) |
| $50,000 to $99,999 | 0 (0.0%) | 19 (1.3%) |
| $100,000 to $299,999 | 19 (2.9%) | 36 (2.4%) |
| $300,000 to $499,999 | 281 (42.4%) | 510 (33.9%) |
| $500,000 to $749,999 | 212 (32.0%) | 739 (49.1%) |
| $750,000 to $999,999 | 62 (9.3%) | 202 (13.4%) |
| $1,000,000 or more | 81 (12.2%) | 0 (0.0%) |
| Total | 663 (100.0%) | 1,506 (100.0%) |
Household Income by Mortgage Status in Cedar Hills
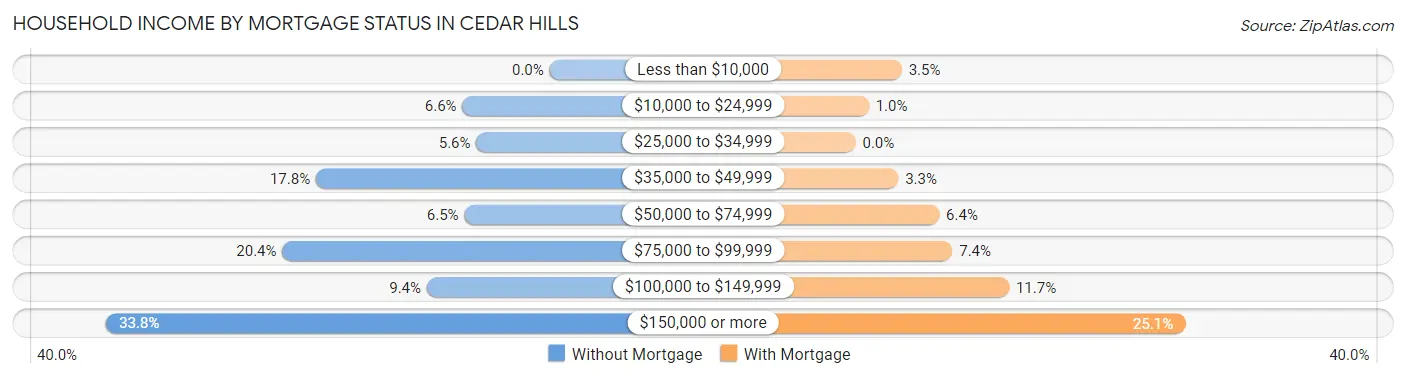
| Household Income | Without Mortgage | With Mortgage |
| Less than $10,000 | 0 (0.0%) | 53 (3.5%) |
| $10,000 to $24,999 | 44 (6.6%) | 15 (1.0%) |
| $25,000 to $34,999 | 37 (5.6%) | 0 (0.0%) |
| $35,000 to $49,999 | 118 (17.8%) | 49 (3.3%) |
| $50,000 to $74,999 | 43 (6.5%) | 96 (6.4%) |
| $75,000 to $99,999 | 135 (20.4%) | 111 (7.4%) |
| $100,000 to $149,999 | 62 (9.3%) | 176 (11.7%) |
| $150,000 or more | 224 (33.8%) | 378 (25.1%) |
| Total | 663 (100.0%) | 1,506 (100.0%) |
Property Value to Household Income Ratio in Cedar Hills
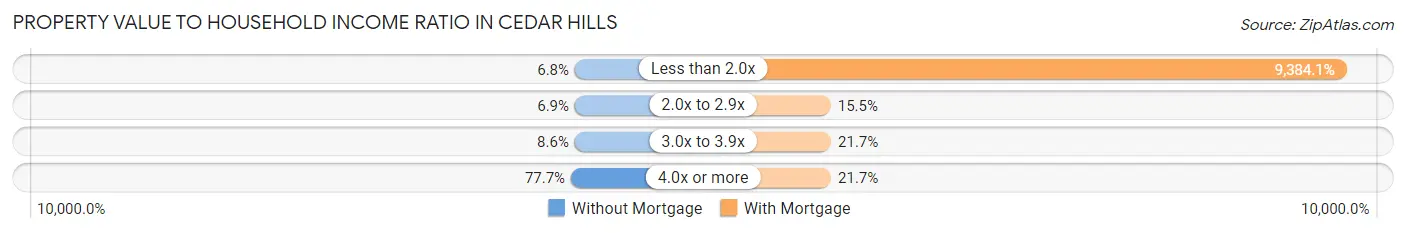
| Value-to-Income Ratio | Without Mortgage | With Mortgage |
| Less than 2.0x | 45 (6.8%) | 141,324 (9,384.1%) |
| 2.0x to 2.9x | 46 (6.9%) | 234 (15.5%) |
| 3.0x to 3.9x | 57 (8.6%) | 327 (21.7%) |
| 4.0x or more | 515 (77.7%) | 326 (21.6%) |
| Total | 663 (100.0%) | 1,506 (100.0%) |
Real Estate Taxes by Mortgage Status in Cedar Hills
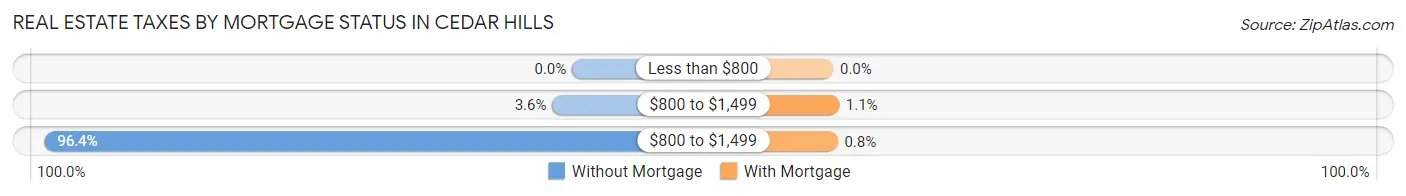
| Property Taxes | Without Mortgage | With Mortgage |
| Less than $800 | 0 (0.0%) | 0 (0.0%) |
| $800 to $1,499 | 24 (3.6%) | 16 (1.1%) |
| $800 to $1,499 | 639 (96.4%) | 12 (0.8%) |
| Total | 663 (100.0%) | 1,506 (100.0%) |
Health & Disability in Cedar Hills
Health Insurance Coverage by Age in Cedar Hills
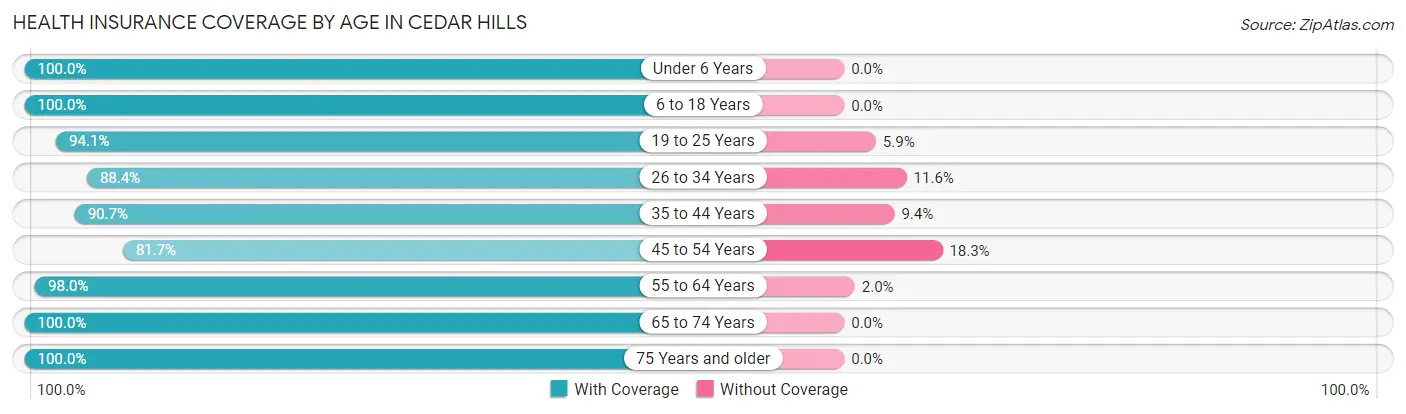
| Age Bracket | With Coverage | Without Coverage |
| Under 6 Years | 722 (100.0%) | 0 (0.0%) |
| 6 to 18 Years | 1,534 (100.0%) | 0 (0.0%) |
| 19 to 25 Years | 479 (94.1%) | 30 (5.9%) |
| 26 to 34 Years | 1,147 (88.4%) | 151 (11.6%) |
| 35 to 44 Years | 1,387 (90.6%) | 143 (9.3%) |
| 45 to 54 Years | 906 (81.7%) | 203 (18.3%) |
| 55 to 64 Years | 797 (98.0%) | 16 (2.0%) |
| 65 to 74 Years | 846 (100.0%) | 0 (0.0%) |
| 75 Years and older | 715 (100.0%) | 0 (0.0%) |
| Total | 8,533 (94.0%) | 543 (6.0%) |
Health Insurance Coverage by Citizenship Status in Cedar Hills
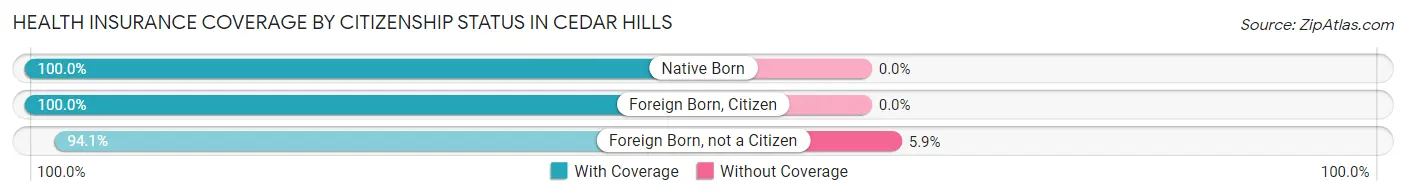
| Citizenship Status | With Coverage | Without Coverage |
| Native Born | 722 (100.0%) | 0 (0.0%) |
| Foreign Born, Citizen | 1,534 (100.0%) | 0 (0.0%) |
| Foreign Born, not a Citizen | 479 (94.1%) | 30 (5.9%) |
Health Insurance Coverage by Household Income in Cedar Hills
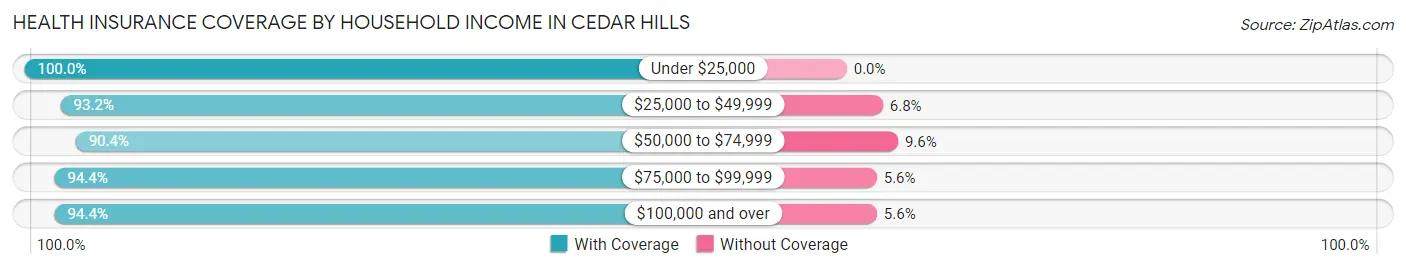
| Household Income | With Coverage | Without Coverage |
| Under $25,000 | 297 (100.0%) | 0 (0.0%) |
| $25,000 to $49,999 | 621 (93.2%) | 45 (6.8%) |
| $50,000 to $74,999 | 963 (90.4%) | 102 (9.6%) |
| $75,000 to $99,999 | 1,158 (94.4%) | 69 (5.6%) |
| $100,000 and over | 5,472 (94.4%) | 327 (5.6%) |
Public vs Private Health Insurance Coverage by Age in Cedar Hills
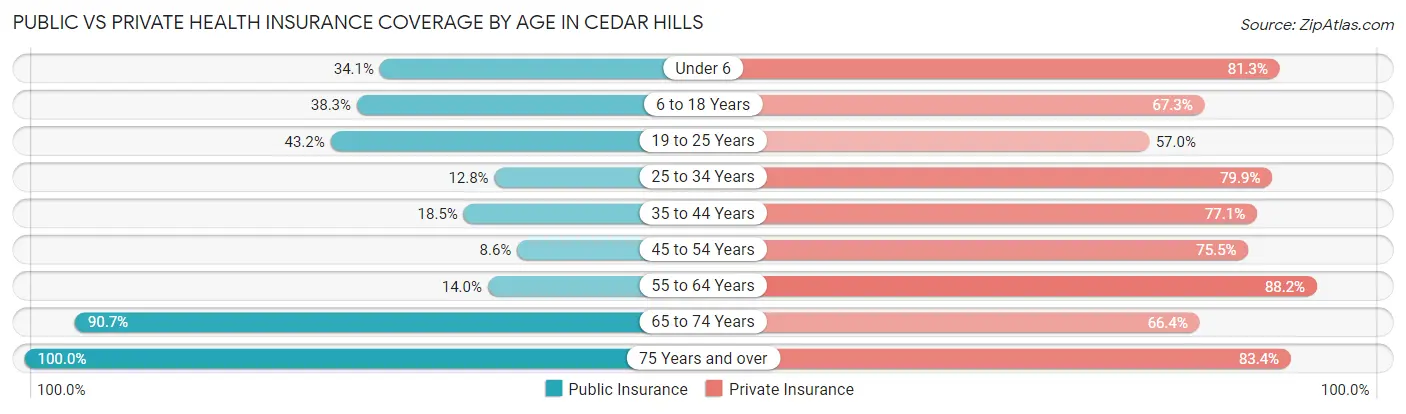
| Age Bracket | Public Insurance | Private Insurance |
| Under 6 | 246 (34.1%) | 587 (81.3%) |
| 6 to 18 Years | 588 (38.3%) | 1,033 (67.3%) |
| 19 to 25 Years | 220 (43.2%) | 290 (57.0%) |
| 25 to 34 Years | 166 (12.8%) | 1,037 (79.9%) |
| 35 to 44 Years | 283 (18.5%) | 1,179 (77.1%) |
| 45 to 54 Years | 95 (8.6%) | 837 (75.5%) |
| 55 to 64 Years | 114 (14.0%) | 717 (88.2%) |
| 65 to 74 Years | 767 (90.7%) | 562 (66.4%) |
| 75 Years and over | 715 (100.0%) | 596 (83.4%) |
| Total | 3,194 (35.2%) | 6,838 (75.3%) |
Disability Status by Sex by Age in Cedar Hills
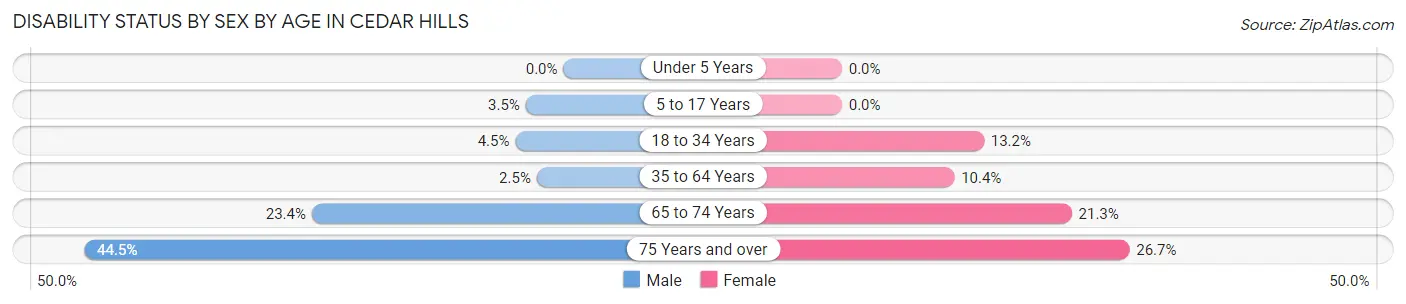
| Age Bracket | Male | Female |
| Under 5 Years | 0 (0.0%) | 0 (0.0%) |
| 5 to 17 Years | 24 (3.5%) | 0 (0.0%) |
| 18 to 34 Years | 39 (4.5%) | 136 (13.2%) |
| 35 to 64 Years | 44 (2.5%) | 174 (10.4%) |
| 65 to 74 Years | 99 (23.4%) | 90 (21.3%) |
| 75 Years and over | 153 (44.5%) | 99 (26.7%) |
Disability Class by Sex by Age in Cedar Hills
Disability Class: Hearing Difficulty
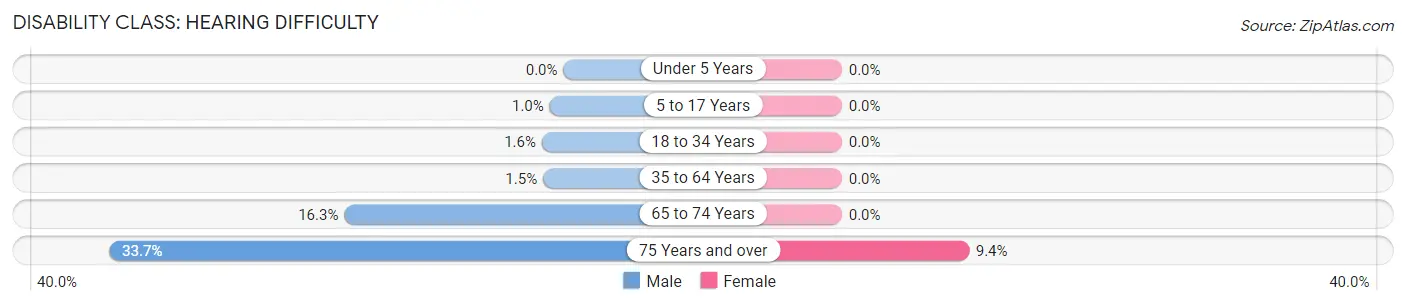
| Age Bracket | Male | Female |
| Under 5 Years | 0 (0.0%) | 0 (0.0%) |
| 5 to 17 Years | 7 (1.0%) | 0 (0.0%) |
| 18 to 34 Years | 14 (1.6%) | 0 (0.0%) |
| 35 to 64 Years | 27 (1.5%) | 0 (0.0%) |
| 65 to 74 Years | 69 (16.3%) | 0 (0.0%) |
| 75 Years and over | 116 (33.7%) | 35 (9.4%) |
Disability Class: Vision Difficulty
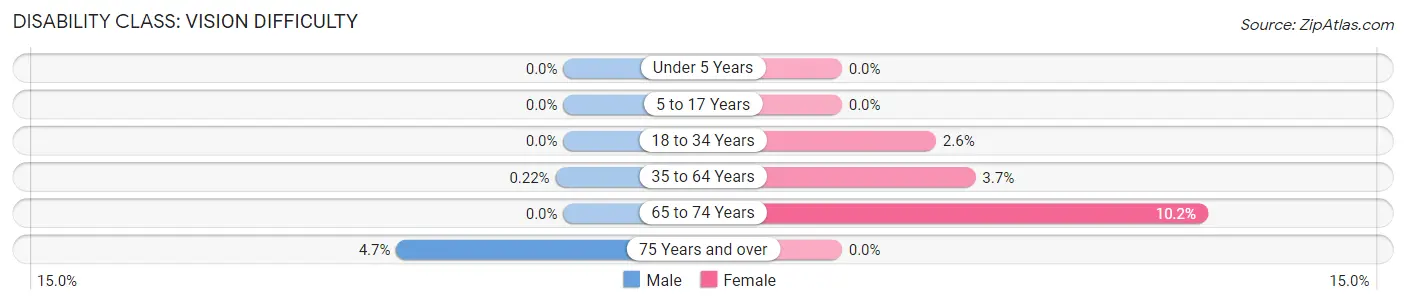
| Age Bracket | Male | Female |
| Under 5 Years | 0 (0.0%) | 0 (0.0%) |
| 5 to 17 Years | 0 (0.0%) | 0 (0.0%) |
| 18 to 34 Years | 0 (0.0%) | 27 (2.6%) |
| 35 to 64 Years | 4 (0.2%) | 62 (3.7%) |
| 65 to 74 Years | 0 (0.0%) | 43 (10.2%) |
| 75 Years and over | 16 (4.6%) | 0 (0.0%) |
Disability Class: Cognitive Difficulty
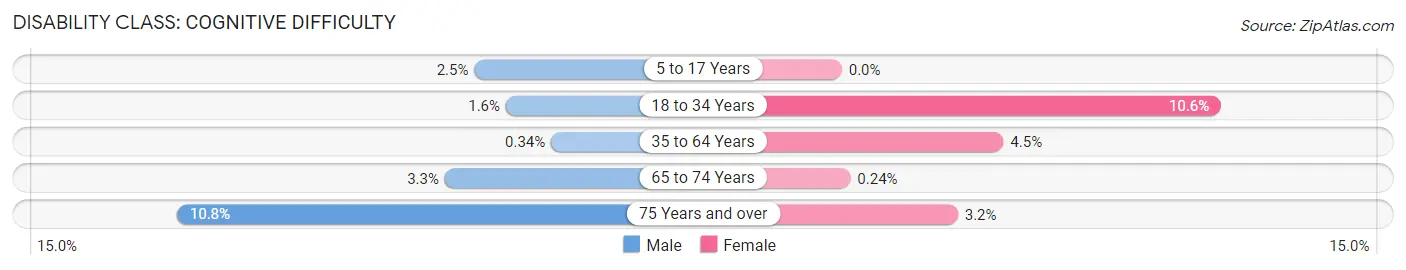
| Age Bracket | Male | Female |
| 5 to 17 Years | 17 (2.5%) | 0 (0.0%) |
| 18 to 34 Years | 14 (1.6%) | 109 (10.6%) |
| 35 to 64 Years | 6 (0.3%) | 75 (4.5%) |
| 65 to 74 Years | 14 (3.3%) | 1 (0.2%) |
| 75 Years and over | 37 (10.8%) | 12 (3.2%) |
Disability Class: Ambulatory Difficulty
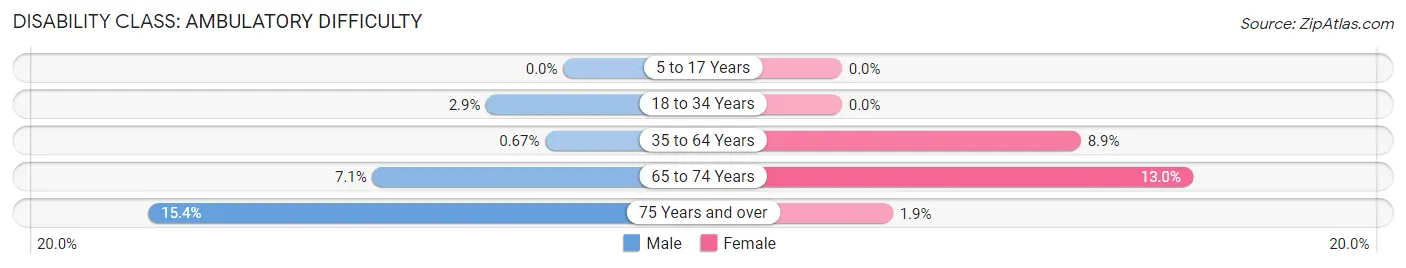
| Age Bracket | Male | Female |
| 5 to 17 Years | 0 (0.0%) | 0 (0.0%) |
| 18 to 34 Years | 25 (2.9%) | 0 (0.0%) |
| 35 to 64 Years | 12 (0.7%) | 148 (8.9%) |
| 65 to 74 Years | 30 (7.1%) | 55 (13.0%) |
| 75 Years and over | 53 (15.4%) | 7 (1.9%) |
Disability Class: Self-Care Difficulty
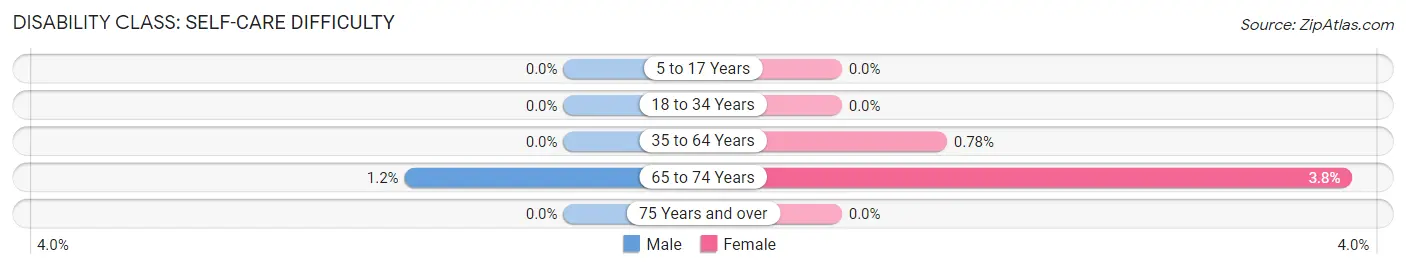
| Age Bracket | Male | Female |
| 5 to 17 Years | 0 (0.0%) | 0 (0.0%) |
| 18 to 34 Years | 0 (0.0%) | 0 (0.0%) |
| 35 to 64 Years | 0 (0.0%) | 13 (0.8%) |
| 65 to 74 Years | 5 (1.2%) | 16 (3.8%) |
| 75 Years and over | 0 (0.0%) | 0 (0.0%) |
Technology Access in Cedar Hills
Computing Device Access in Cedar Hills
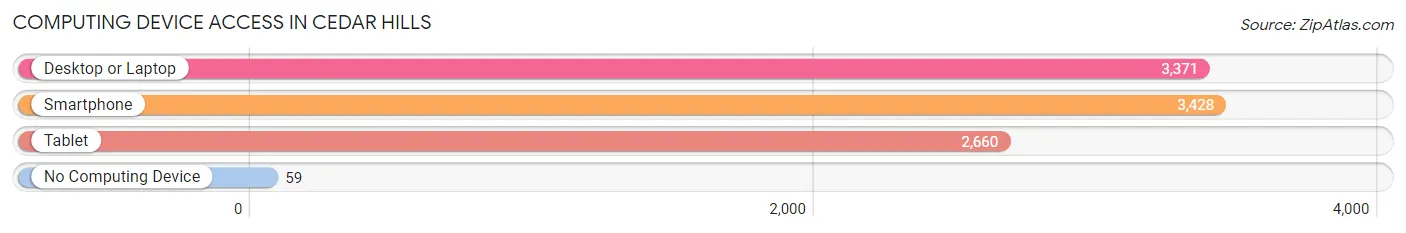
| Device Type | # Households | % Households |
| Desktop or Laptop | 3,371 | 91.1% |
| Smartphone | 3,428 | 92.7% |
| Tablet | 2,660 | 71.9% |
| No Computing Device | 59 | 1.6% |
| Total | 3,699 | 100.0% |
Internet Access in Cedar Hills
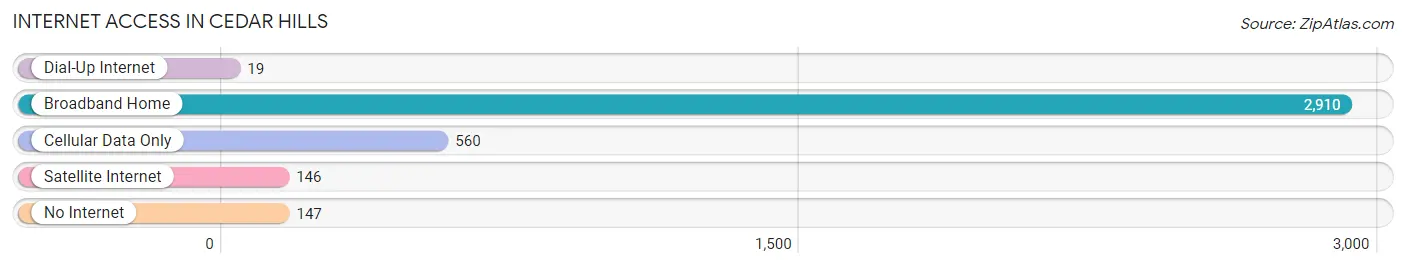
| Internet Type | # Households | % Households |
| Dial-Up Internet | 19 | 0.5% |
| Broadband Home | 2,910 | 78.7% |
| Cellular Data Only | 560 | 15.1% |
| Satellite Internet | 146 | 4.0% |
| No Internet | 147 | 4.0% |
| Total | 3,699 | 100.0% |
Cedar Hills Summary
Cedar Hills is a city located in Washington County, Oregon, United States. It is a suburb of Portland and is part of the Portland metropolitan area. The population was 10,541 at the 2010 census.
History
Cedar Hills was first settled in the late 1800s by homesteaders who were attracted to the area by its abundant timber resources. The area was originally known as Cedar Mill, and the first post office was established in 1891. The name was changed to Cedar Hills in 1951.
In the 1950s, the area began to experience rapid growth as Portland's population expanded and people began to move to the suburbs. The city was officially incorporated in 1965.
Geography
Cedar Hills is located in Washington County, Oregon, at the intersection of Highway 26 and Highway 217. It is bordered by Beaverton to the north, Hillsboro to the west, and Portland to the south. The city covers an area of 4.3 square miles and has an elevation of 545 feet.
The city is located in the Tualatin Valley, which is part of the Willamette Valley. The Tualatin River runs through the city, and the area is known for its rolling hills and lush forests.
Economy
Cedar Hills is primarily a residential community, but it does have a few businesses. The city is home to several retail stores, restaurants, and other businesses. The city also has a few industrial parks, which are home to a variety of businesses, including manufacturing, technology, and medical companies.
Demographics
As of the 2010 census, the population of Cedar Hills was 10,541. The racial makeup of the city was 79.3% White, 8.2% Asian, 6.2% Hispanic or Latino, 4.2% African American, and 2.1% from other races.
The median household income in Cedar Hills was $76,845 in 2019, and the median home value was $521,000. The city has a high rate of homeownership, with 73.3% of residents owning their homes.
Conclusion
Cedar Hills is a city located in Washington County, Oregon, United States. It is a suburb of Portland and is part of the Portland metropolitan area. The city was first settled in the late 1800s and was officially incorporated in 1965. Cedar Hills is primarily a residential community, but it does have a few businesses. The population of Cedar Hills was 10,541 at the 2010 census, and the median household income was $76,845 in 2019. The city has a high rate of homeownership, with 73.3% of residents owning their homes.
Common Questions
What is Per Capita Income in Cedar Hills?
Per Capita income in Cedar Hills is $50,345.
What is the Median Family Income in Cedar Hills?
Median Family Income in Cedar Hills is $116,071.
What is the Median Household income in Cedar Hills?
Median Household Income in Cedar Hills is $103,544.
What is Income or Wage Gap in Cedar Hills?
Income or Wage Gap in Cedar Hills is 38.1%.
Women in Cedar Hills earn 61.9 cents for every dollar earned by a man.
What is Inequality or Gini Index in Cedar Hills?
Inequality or Gini Index in Cedar Hills is 0.39.
What is the Total Population of Cedar Hills?
Total Population of Cedar Hills is 9,076.
What is the Total Male Population of Cedar Hills?
Total Male Population of Cedar Hills is 4,331.
What is the Total Female Population of Cedar Hills?
Total Female Population of Cedar Hills is 4,745.
What is the Ratio of Males per 100 Females in Cedar Hills?
There are 91.28 Males per 100 Females in Cedar Hills.
What is the Ratio of Females per 100 Males in Cedar Hills?
There are 109.56 Females per 100 Males in Cedar Hills.
What is the Median Population Age in Cedar Hills?
Median Population Age in Cedar Hills is 38.4 Years.
What is the Average Family Size in Cedar Hills
Average Family Size in Cedar Hills is 3.1 People.
What is the Average Household Size in Cedar Hills
Average Household Size in Cedar Hills is 2.5 People.
How Large is the Labor Force in Cedar Hills?
There are 5,202 People in the Labor Forcein in Cedar Hills.
What is the Percentage of People in the Labor Force in Cedar Hills?
72.5% of People are in the Labor Force in Cedar Hills.
What is the Unemployment Rate in Cedar Hills?
Unemployment Rate in Cedar Hills is 4.5%.