Johnson, OK Map & Demographics
Johnson Map
Johnson Overview
$26,980
PER CAPITA INCOME
$44,722
AVG FAMILY INCOME
$44,748
AVG HOUSEHOLD INCOME
26.8%
WAGE / INCOME GAP [ % ]
73.2¢/ $1
WAGE / INCOME GAP [ $ ]
0.30
INEQUALITY / GINI INDEX
752
TOTAL POPULATION
374
MALE POPULATION
378
FEMALE POPULATION
98.94
MALES / 100 FEMALES
101.07
FEMALES / 100 MALES
50.3
MEDIAN AGE
2.4
AVG FAMILY SIZE
2.4
AVG HOUSEHOLD SIZE
244
LABOR FORCE [ PEOPLE ]
40.0%
PERCENT IN LABOR FORCE
7.6%
UNEMPLOYMENT RATE
Johnson Area Codes
Income in Johnson
Income Overview in Johnson
Per Capita Income in Johnson is $26,980, while median incomes of families and households are $44,722 and $44,748 respectively.
| Characteristic | Number | Measure |
| Per Capita Income | 752 | $26,980 |
| Median Family Income | 292 | $44,722 |
| Mean Family Income | 292 | $65,843 |
| Median Household Income | 317 | $44,748 |
| Mean Household Income | 317 | $66,156 |
| Income Deficit | 292 | $0 |
| Wage / Income Gap (%) | 752 | 26.83% |
| Wage / Income Gap ($) | 752 | 73.17¢ per $1 |
| Gini / Inequality Index | 752 | 0.30 |
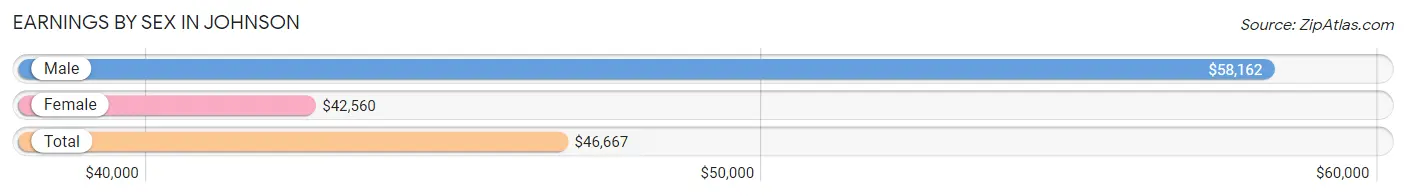
Earnings by Sex in Johnson
Average Earnings in Johnson are $46,667, $58,162 for men and $42,560 for women, a difference of 26.8%.
| Sex | Number | Average Earnings |
| Male | 141 (57.8%) | $58,162 |
| Female | 103 (42.2%) | $42,560 |
| Total | 244 (100.0%) | $46,667 |
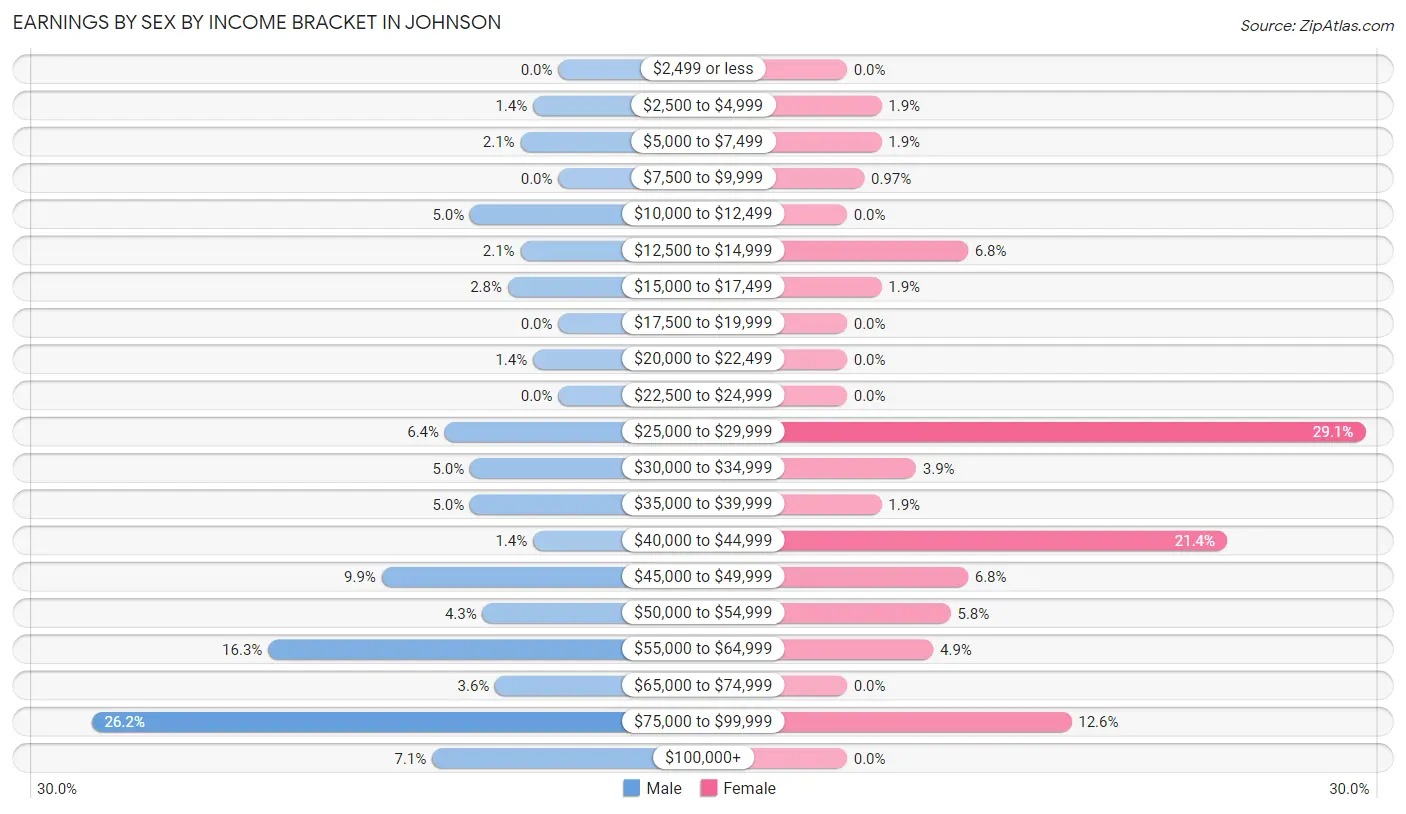
Earnings by Sex by Income Bracket in Johnson
The most common earnings brackets in Johnson are $75,000 to $99,999 for men (37 | 26.2%) and $25,000 to $29,999 for women (30 | 29.1%).
| Income | Male | Female |
| $2,499 or less | 0 (0.0%) | 0 (0.0%) |
| $2,500 to $4,999 | 2 (1.4%) | 2 (1.9%) |
| $5,000 to $7,499 | 3 (2.1%) | 2 (1.9%) |
| $7,500 to $9,999 | 0 (0.0%) | 1 (1.0%) |
| $10,000 to $12,499 | 7 (5.0%) | 0 (0.0%) |
| $12,500 to $14,999 | 3 (2.1%) | 7 (6.8%) |
| $15,000 to $17,499 | 4 (2.8%) | 2 (1.9%) |
| $17,500 to $19,999 | 0 (0.0%) | 0 (0.0%) |
| $20,000 to $22,499 | 2 (1.4%) | 0 (0.0%) |
| $22,500 to $24,999 | 0 (0.0%) | 0 (0.0%) |
| $25,000 to $29,999 | 9 (6.4%) | 30 (29.1%) |
| $30,000 to $34,999 | 7 (5.0%) | 4 (3.9%) |
| $35,000 to $39,999 | 7 (5.0%) | 2 (1.9%) |
| $40,000 to $44,999 | 2 (1.4%) | 22 (21.4%) |
| $45,000 to $49,999 | 14 (9.9%) | 7 (6.8%) |
| $50,000 to $54,999 | 6 (4.3%) | 6 (5.8%) |
| $55,000 to $64,999 | 23 (16.3%) | 5 (4.9%) |
| $65,000 to $74,999 | 5 (3.5%) | 0 (0.0%) |
| $75,000 to $99,999 | 37 (26.2%) | 13 (12.6%) |
| $100,000+ | 10 (7.1%) | 0 (0.0%) |
| Total | 141 (100.0%) | 103 (100.0%) |
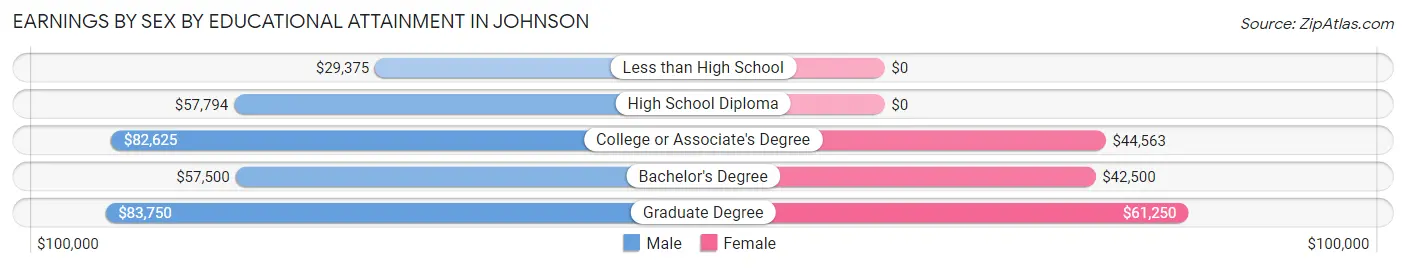
Earnings by Sex by Educational Attainment in Johnson
Average earnings in Johnson are $58,971 for men and $44,048 for women, a difference of 25.3%. Men with an educational attainment of graduate degree enjoy the highest average annual earnings of $83,750, while those with less than high school education earn the least with $29,375. Women with an educational attainment of graduate degree earn the most with the average annual earnings of $61,250, while those with bachelor's degree education have the smallest earnings of $42,500.
| Educational Attainment | Male Income | Female Income |
| Less than High School | $29,375 | $0 |
| High School Diploma | $57,794 | $0 |
| College or Associate's Degree | $82,625 | $44,563 |
| Bachelor's Degree | $57,500 | $42,500 |
| Graduate Degree | $83,750 | $61,250 |
| Total | $58,971 | $44,048 |
Family Income in Johnson
Family Income Brackets in Johnson
According to the Johnson family income data, there are 152 families falling into the $35,000 to $49,999 income range, which is the most common income bracket and makes up 52.0% of all families. Conversely, the $150,000 to $199,999 income bracket is the least frequent group with only 1 families (0.3%) belonging to this category.
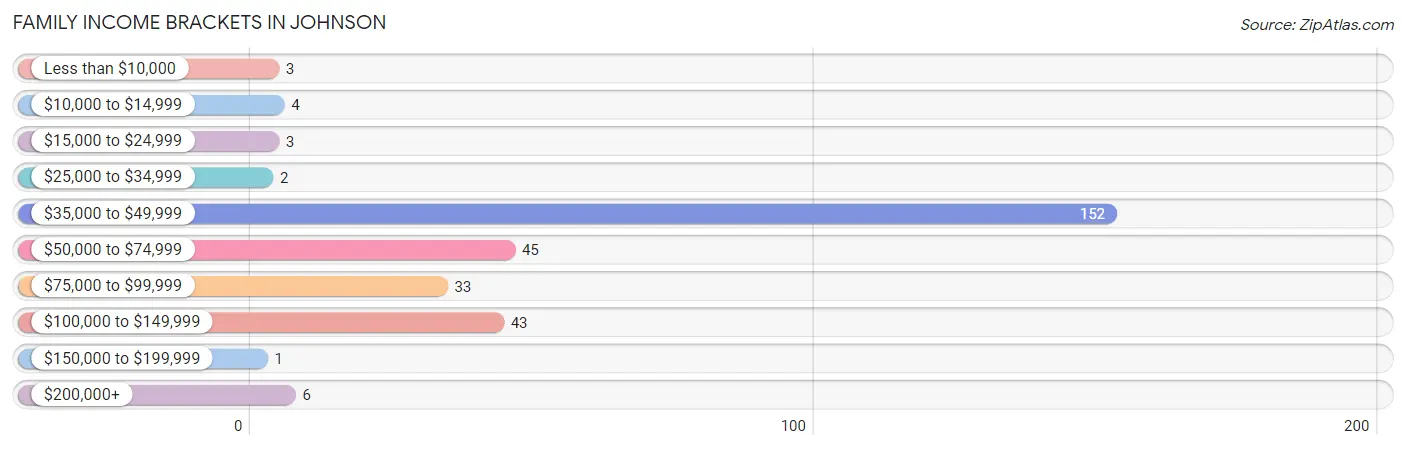
| Income Bracket | # Families | % Families |
| Less than $10,000 | 3 | 1.0% |
| $10,000 to $14,999 | 4 | 1.4% |
| $15,000 to $24,999 | 3 | 1.0% |
| $25,000 to $34,999 | 2 | 0.7% |
| $35,000 to $49,999 | 152 | 52.1% |
| $50,000 to $74,999 | 45 | 15.4% |
| $75,000 to $99,999 | 33 | 11.3% |
| $100,000 to $149,999 | 43 | 14.7% |
| $150,000 to $199,999 | 1 | 0.3% |
| $200,000+ | 6 | 2.1% |
Family Income by Famaliy Size in Johnson
5-person families (14 | 4.8%) account for the highest median family income in Johnson with $126,250 per family, while 3-person families (35 | 12.0%) have the highest median income of $26,042 per family member.
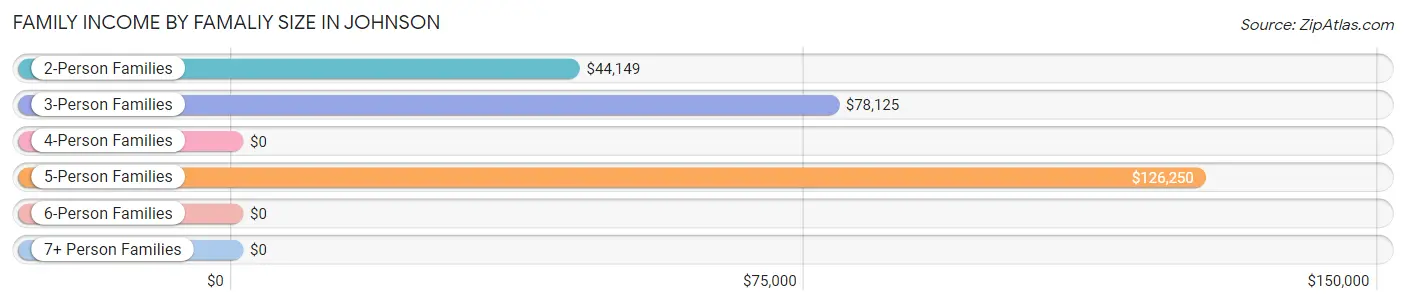
| Income Bracket | # Families | Median Income |
| 2-Person Families | 212 (72.6%) | $44,149 |
| 3-Person Families | 35 (12.0%) | $78,125 |
| 4-Person Families | 9 (3.1%) | $0 |
| 5-Person Families | 14 (4.8%) | $126,250 |
| 6-Person Families | 20 (6.9%) | $0 |
| 7+ Person Families | 2 (0.7%) | $0 |
| Total | 292 (100.0%) | $44,722 |
Family Income by Number of Earners in Johnson
The median family income in Johnson is $44,722, with families comprising 3+ earners (5) having the highest median family income of $146,875, while families with no earners (164) have the lowest median family income of $43,819, accounting for 1.7% and 56.2% of families, respectively.
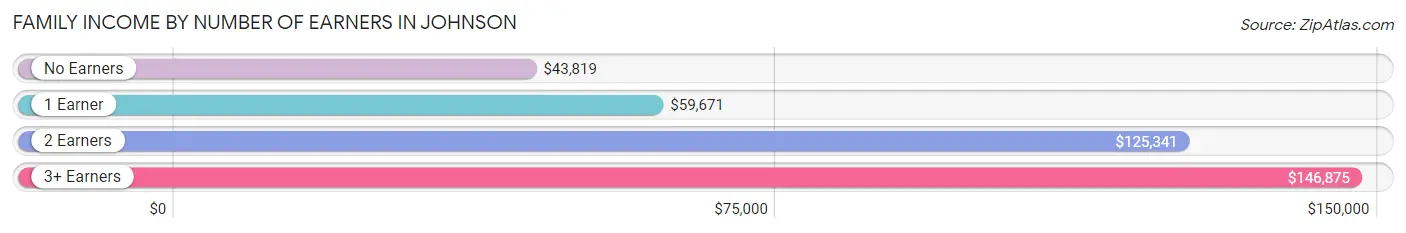
| Number of Earners | # Families | Median Income |
| No Earners | 164 (56.2%) | $43,819 |
| 1 Earner | 65 (22.3%) | $59,671 |
| 2 Earners | 58 (19.9%) | $125,341 |
| 3+ Earners | 5 (1.7%) | $146,875 |
| Total | 292 (100.0%) | $44,722 |
Household Income in Johnson
Household Income Brackets in Johnson
With 153 households falling in the category, the $35,000 to $49,999 income range is the most frequent in Johnson, accounting for 48.3% of all households. In contrast, only 1 households (0.3%) fall into the $150,000 to $199,999 income bracket, making it the least populous group.
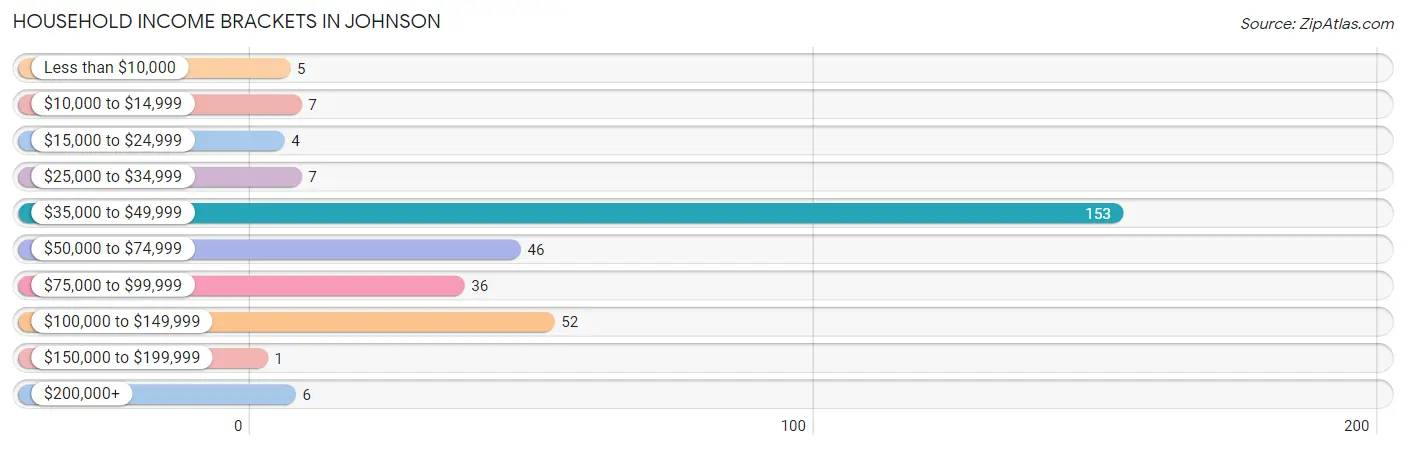
| Income Bracket | # Households | % Households |
| Less than $10,000 | 5 | 1.6% |
| $10,000 to $14,999 | 7 | 2.2% |
| $15,000 to $24,999 | 4 | 1.3% |
| $25,000 to $34,999 | 7 | 2.2% |
| $35,000 to $49,999 | 153 | 48.3% |
| $50,000 to $74,999 | 46 | 14.5% |
| $75,000 to $99,999 | 36 | 11.4% |
| $100,000 to $149,999 | 52 | 16.4% |
| $150,000 to $199,999 | 1 | 0.3% |
| $200,000+ | 6 | 1.9% |
Household Income by Householder Age in Johnson
The median household income in Johnson is $44,748, with the highest median household income of $110,417 found in the 25 to 44 years age bracket for the primary householder. A total of 67 households (21.1%) fall into this category. Meanwhile, the 15 to 24 years age bracket for the primary householder has the lowest median household income of $0, with 1 households (0.3%) in this group.
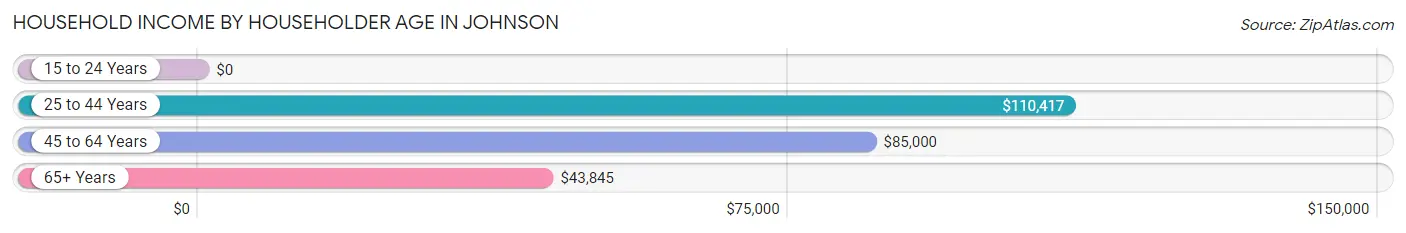
| Income Bracket | # Households | Median Income |
| 15 to 24 Years | 1 (0.3%) | $0 |
| 25 to 44 Years | 67 (21.1%) | $110,417 |
| 45 to 64 Years | 64 (20.2%) | $85,000 |
| 65+ Years | 185 (58.4%) | $43,845 |
| Total | 317 (100.0%) | $44,748 |
Poverty in Johnson
Income Below Poverty by Sex and Age in Johnson
With 7.0% poverty level for males and 4.5% for females among the residents of Johnson, 18 to 24 year old males and 5 year old females are the most vulnerable to poverty, with 10 males (45.5%) and 5 females (100.0%) in their respective age groups living below the poverty level.
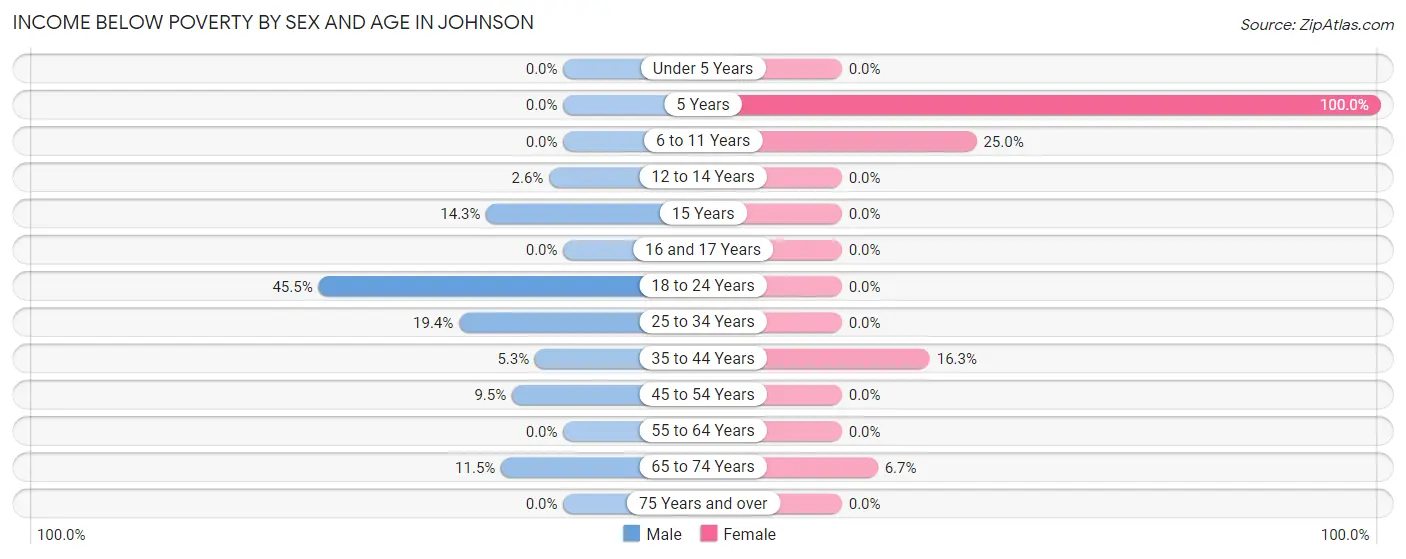
| Age Bracket | Male | Female |
| Under 5 Years | 0 (0.0%) | 0 (0.0%) |
| 5 Years | 0 (0.0%) | 5 (100.0%) |
| 6 to 11 Years | 0 (0.0%) | 2 (25.0%) |
| 12 to 14 Years | 1 (2.6%) | 0 (0.0%) |
| 15 Years | 1 (14.3%) | 0 (0.0%) |
| 16 and 17 Years | 0 (0.0%) | 0 (0.0%) |
| 18 to 24 Years | 10 (45.5%) | 0 (0.0%) |
| 25 to 34 Years | 6 (19.4%) | 0 (0.0%) |
| 35 to 44 Years | 3 (5.3%) | 8 (16.3%) |
| 45 to 54 Years | 2 (9.5%) | 0 (0.0%) |
| 55 to 64 Years | 0 (0.0%) | 0 (0.0%) |
| 65 to 74 Years | 3 (11.5%) | 2 (6.7%) |
| 75 Years and over | 0 (0.0%) | 0 (0.0%) |
| Total | 26 (7.0%) | 17 (4.5%) |
Income Above Poverty by Sex and Age in Johnson
According to the poverty statistics in Johnson, males aged under 5 years and females aged under 5 years are the age groups that are most secure financially, with 100.0% of males and 100.0% of females in these age groups living above the poverty line.
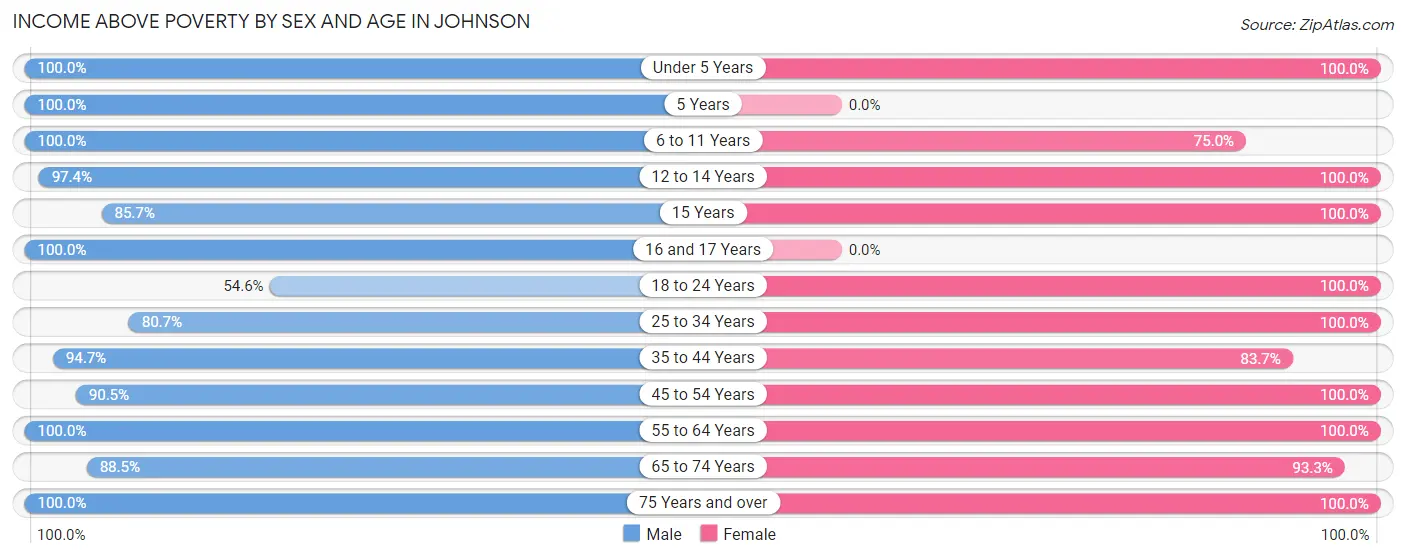
| Age Bracket | Male | Female |
| Under 5 Years | 10 (100.0%) | 4 (100.0%) |
| 5 Years | 1 (100.0%) | 0 (0.0%) |
| 6 to 11 Years | 42 (100.0%) | 6 (75.0%) |
| 12 to 14 Years | 37 (97.4%) | 11 (100.0%) |
| 15 Years | 6 (85.7%) | 16 (100.0%) |
| 16 and 17 Years | 15 (100.0%) | 0 (0.0%) |
| 18 to 24 Years | 12 (54.5%) | 27 (100.0%) |
| 25 to 34 Years | 25 (80.6%) | 15 (100.0%) |
| 35 to 44 Years | 54 (94.7%) | 41 (83.7%) |
| 45 to 54 Years | 19 (90.5%) | 15 (100.0%) |
| 55 to 64 Years | 96 (100.0%) | 40 (100.0%) |
| 65 to 74 Years | 23 (88.5%) | 28 (93.3%) |
| 75 Years and over | 8 (100.0%) | 158 (100.0%) |
| Total | 348 (93.0%) | 361 (95.5%) |
Income Below Poverty Among Married-Couple Families in Johnson
The poverty statistics for married-couple families in Johnson show that 3.8% or 5 of the total 131 families live below the poverty line. Families with 1 or 2 children have the highest poverty rate of 14.8%, comprising of 4 families. On the other hand, families with 3 or 4 children have the lowest poverty rate of 0.0%, which includes 0 families.
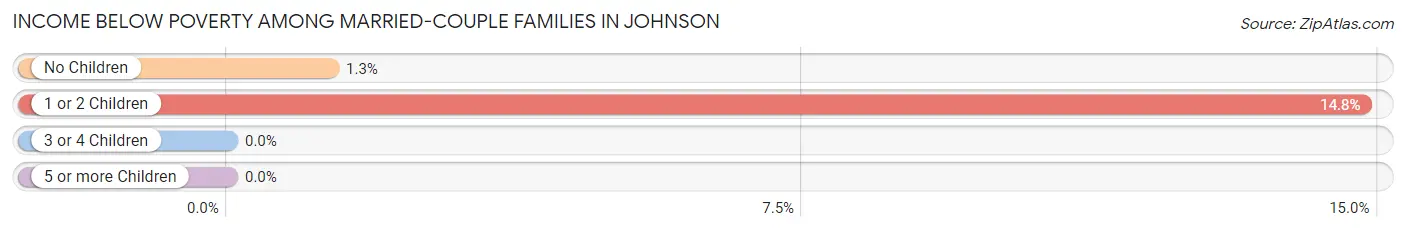
| Children | Above Poverty | Below Poverty |
| No Children | 75 (98.7%) | 1 (1.3%) |
| 1 or 2 Children | 23 (85.2%) | 4 (14.8%) |
| 3 or 4 Children | 28 (100.0%) | 0 (0.0%) |
| 5 or more Children | 0 (0.0%) | 0 (0.0%) |
| Total | 126 (96.2%) | 5 (3.8%) |
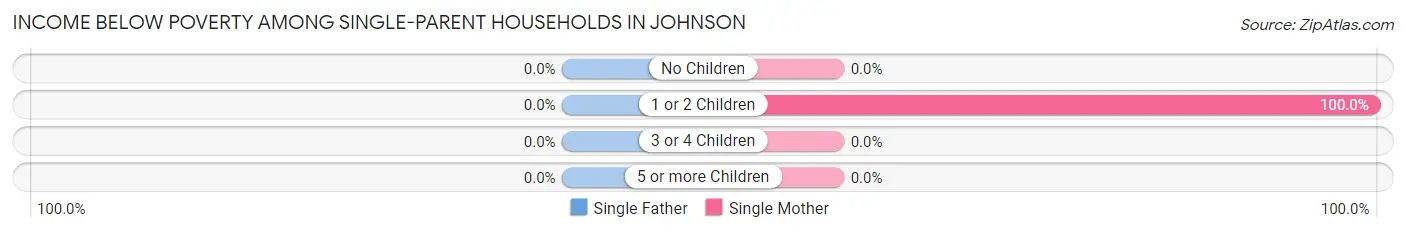
Income Below Poverty Among Single-Parent Households in Johnson
| Children | Single Father | Single Mother |
| No Children | 0 (0.0%) | 0 (0.0%) |
| 1 or 2 Children | 0 (0.0%) | 2 (100.0%) |
| 3 or 4 Children | 0 (0.0%) | 0 (0.0%) |
| 5 or more Children | 0 (0.0%) | 0 (0.0%) |
| Total | 0 (0.0%) | 2 (1.3%) |
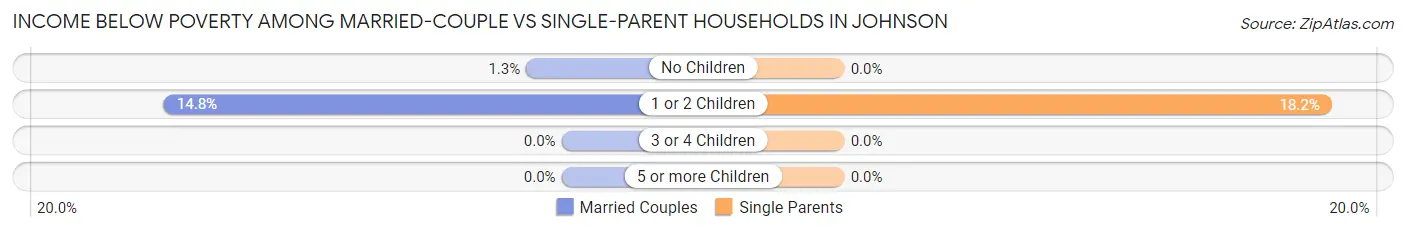
Income Below Poverty Among Married-Couple vs Single-Parent Households in Johnson
The poverty data for Johnson shows that 5 of the married-couple family households (3.8%) and 2 of the single-parent households (1.2%) are living below the poverty level. Within the married-couple family households, those with 1 or 2 children have the highest poverty rate, with 4 households (14.8%) falling below the poverty line. Among the single-parent households, those with 1 or 2 children have the highest poverty rate, with 2 household (18.2%) living below poverty.
| Children | Married-Couple Families | Single-Parent Households |
| No Children | 1 (1.3%) | 0 (0.0%) |
| 1 or 2 Children | 4 (14.8%) | 2 (18.2%) |
| 3 or 4 Children | 0 (0.0%) | 0 (0.0%) |
| 5 or more Children | 0 (0.0%) | 0 (0.0%) |
| Total | 5 (3.8%) | 2 (1.2%) |
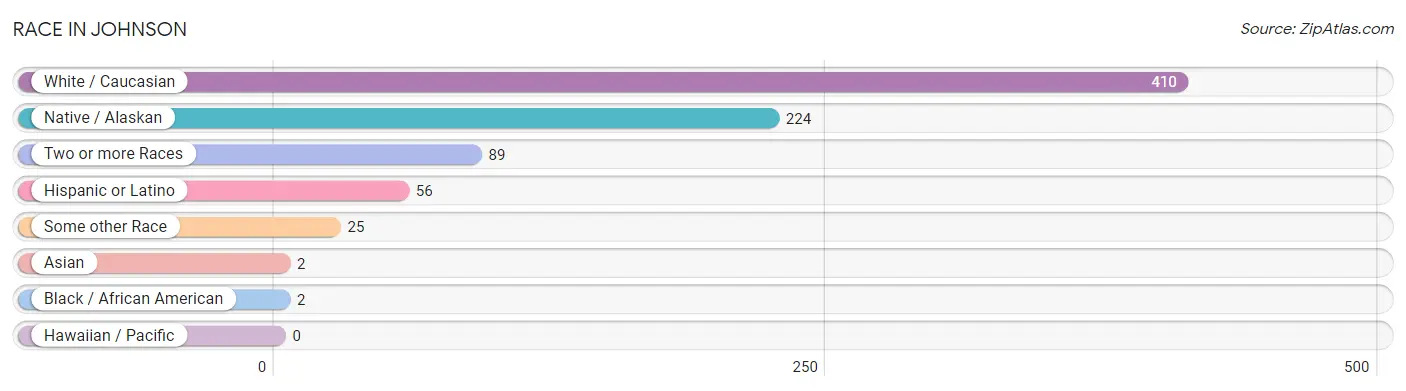
Race in Johnson
The most populous races in Johnson are White / Caucasian (410 | 54.5%), Native / Alaskan (224 | 29.8%), and Two or more Races (89 | 11.8%).
| Race | # Population | % Population |
| Asian | 2 | 0.3% |
| Black / African American | 2 | 0.3% |
| Hawaiian / Pacific | 0 | 0.0% |
| Hispanic or Latino | 56 | 7.4% |
| Native / Alaskan | 224 | 29.8% |
| White / Caucasian | 410 | 54.5% |
| Two or more Races | 89 | 11.8% |
| Some other Race | 25 | 3.3% |
| Total | 752 | 100.0% |
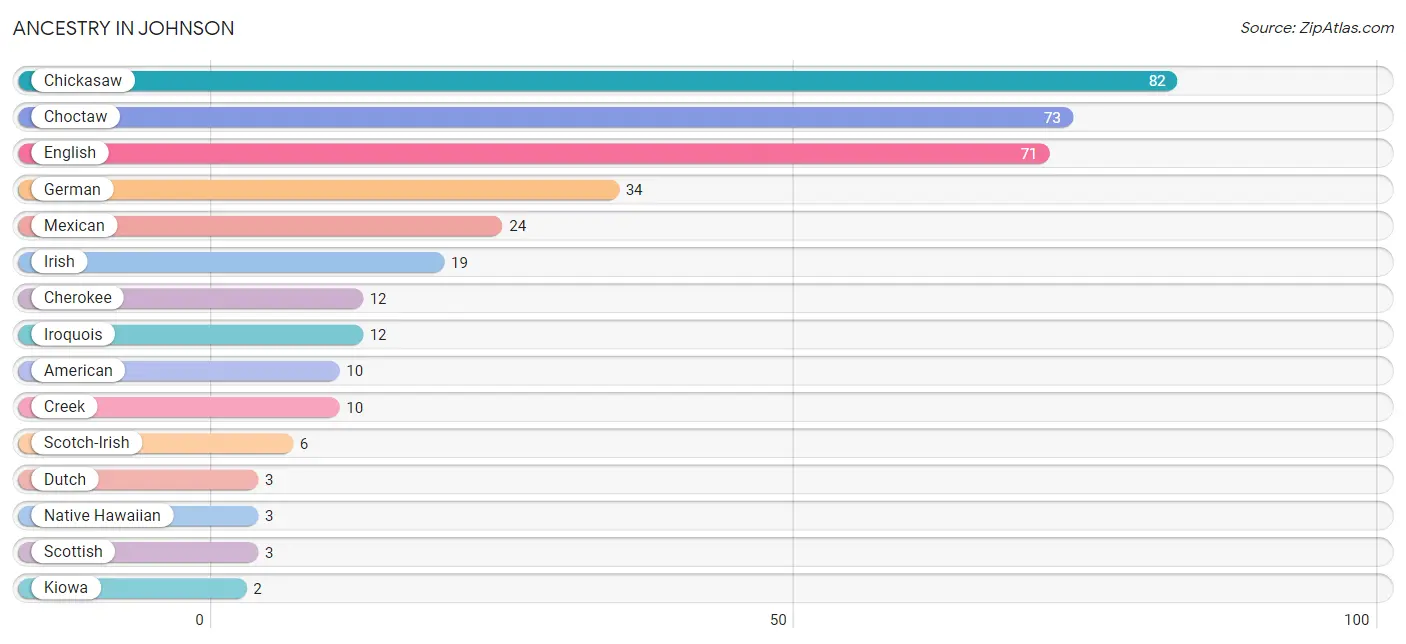
Ancestry in Johnson
The most populous ancestries reported in Johnson are Chickasaw (82 | 10.9%), Choctaw (73 | 9.7%), English (71 | 9.4%), German (34 | 4.5%), and Mexican (24 | 3.2%), together accounting for 37.8% of all Johnson residents.
| Ancestry | # Population | % Population |
| American | 10 | 1.3% |
| Cherokee | 12 | 1.6% |
| Chickasaw | 82 | 10.9% |
| Choctaw | 73 | 9.7% |
| Creek | 10 | 1.3% |
| Dutch | 3 | 0.4% |
| English | 71 | 9.4% |
| French | 1 | 0.1% |
| German | 34 | 4.5% |
| Irish | 19 | 2.5% |
| Iroquois | 12 | 1.6% |
| Italian | 1 | 0.1% |
| Kiowa | 2 | 0.3% |
| Korean | 2 | 0.3% |
| Mexican | 24 | 3.2% |
| Native Hawaiian | 3 | 0.4% |
| Navajo | 2 | 0.3% |
| Potawatomi | 1 | 0.1% |
| Scotch-Irish | 6 | 0.8% |
| Scottish | 3 | 0.4% |
| Seminole | 1 | 0.1% |
| Swedish | 1 | 0.1% |
| Welsh | 2 | 0.3% | View All 23 Rows |
Immigrants in Johnson
The most numerous immigrant groups reported in Johnson came from Asia (2 | 0.3%), Philippines (2 | 0.3%), South Eastern Asia (2 | 0.3%), Colombia (1 | 0.1%), and Latin America (1 | 0.1%), together accounting for 1.1% of all Johnson residents.
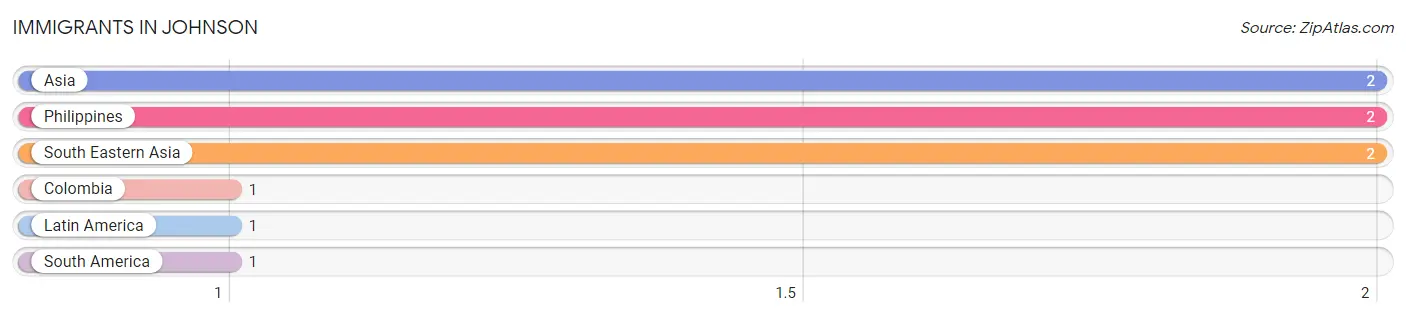
| Immigration Origin | # Population | % Population |
| Asia | 2 | 0.3% |
| Colombia | 1 | 0.1% |
| Latin America | 1 | 0.1% |
| Philippines | 2 | 0.3% |
| South America | 1 | 0.1% |
| South Eastern Asia | 2 | 0.3% | View All 6 Rows |
Sex and Age in Johnson
Sex and Age in Johnson
The most populous age groups in Johnson are 55 to 59 Years (65 | 17.4%) for men and 75 to 79 Years (150 | 39.7%) for women.
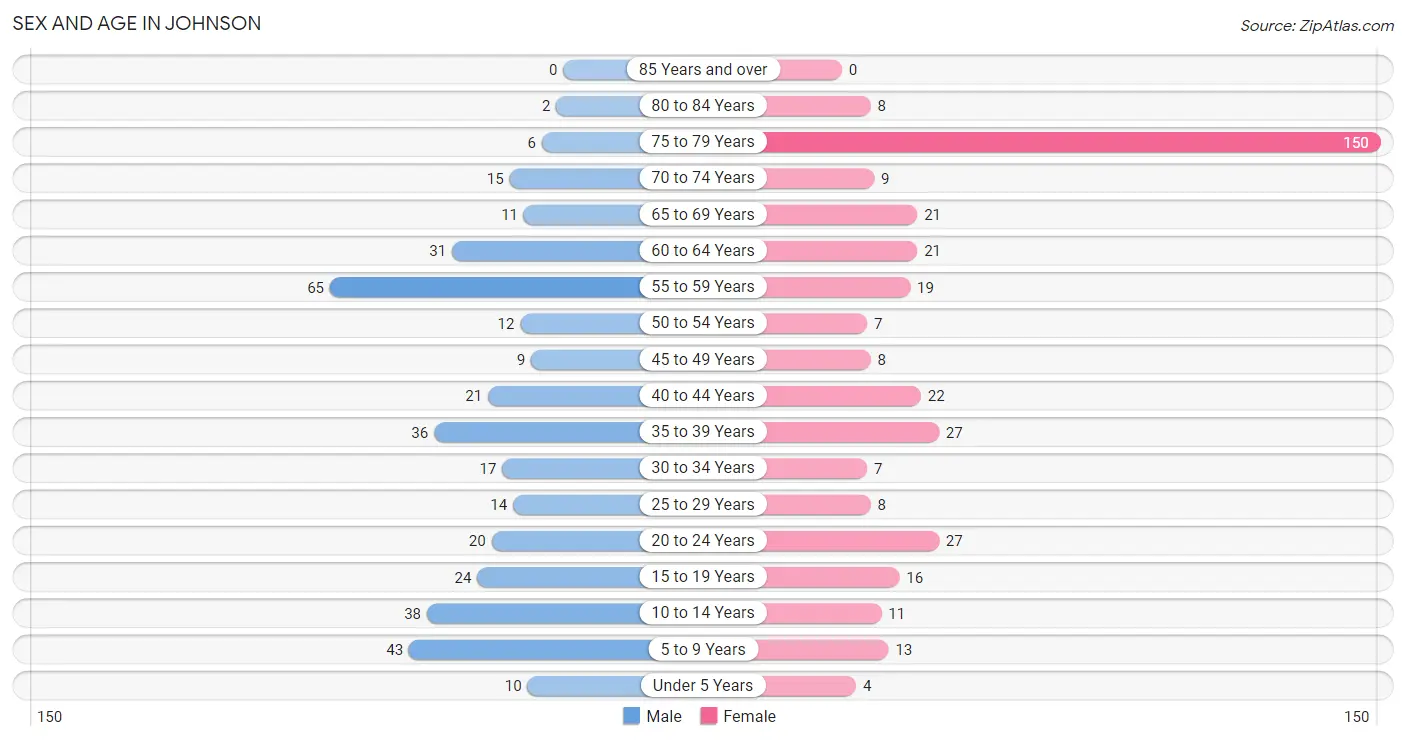
| Age Bracket | Male | Female |
| Under 5 Years | 10 (2.7%) | 4 (1.1%) |
| 5 to 9 Years | 43 (11.5%) | 13 (3.4%) |
| 10 to 14 Years | 38 (10.2%) | 11 (2.9%) |
| 15 to 19 Years | 24 (6.4%) | 16 (4.2%) |
| 20 to 24 Years | 20 (5.3%) | 27 (7.1%) |
| 25 to 29 Years | 14 (3.7%) | 8 (2.1%) |
| 30 to 34 Years | 17 (4.5%) | 7 (1.8%) |
| 35 to 39 Years | 36 (9.6%) | 27 (7.1%) |
| 40 to 44 Years | 21 (5.6%) | 22 (5.8%) |
| 45 to 49 Years | 9 (2.4%) | 8 (2.1%) |
| 50 to 54 Years | 12 (3.2%) | 7 (1.8%) |
| 55 to 59 Years | 65 (17.4%) | 19 (5.0%) |
| 60 to 64 Years | 31 (8.3%) | 21 (5.6%) |
| 65 to 69 Years | 11 (2.9%) | 21 (5.6%) |
| 70 to 74 Years | 15 (4.0%) | 9 (2.4%) |
| 75 to 79 Years | 6 (1.6%) | 150 (39.7%) |
| 80 to 84 Years | 2 (0.5%) | 8 (2.1%) |
| 85 Years and over | 0 (0.0%) | 0 (0.0%) |
| Total | 374 (100.0%) | 378 (100.0%) |
Families and Households in Johnson
Median Family Size in Johnson
The median family size in Johnson is 2.41 persons per family, with married-couple families (131 | 44.9%) accounting for the largest median family size of 3.89 persons per family. On the other hand, single female/mother families (149 | 51.0%) represent the smallest median family size with 1.06 persons per family.
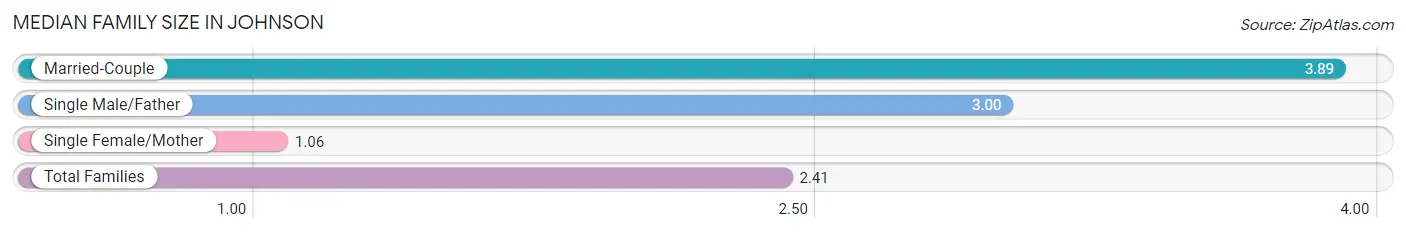
| Family Type | # Families | Family Size |
| Married-Couple | 131 (44.9%) | 3.89 |
| Single Male/Father | 12 (4.1%) | 3.00 |
| Single Female/Mother | 149 (51.0%) | 1.06 |
| Total Families | 292 (100.0%) | 2.41 |
Median Household Size in Johnson
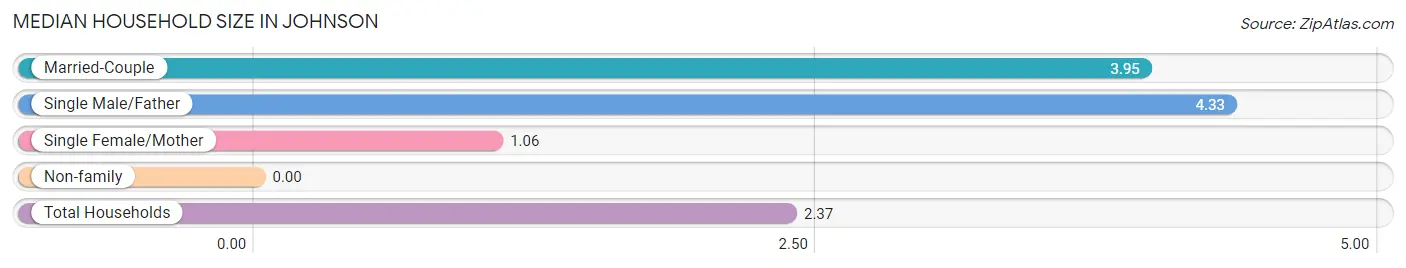
| Household Type | # Households | Household Size |
| Married-Couple | 131 (41.3%) | 3.95 |
| Single Male/Father | 12 (3.8%) | 4.33 |
| Single Female/Mother | 149 (47.0%) | 1.06 |
| Non-family | 25 (7.9%) | - |
| Total Households | 317 (100.0%) | 2.37 |
Household Size by Marriage Status in Johnson
Out of a total of 317 households in Johnson, 292 (92.1%) are family households, while 25 (7.9%) are nonfamily households. The most numerous type of family households are 2-person households, comprising 208, and the most common type of nonfamily households are 1-person households, comprising 25.
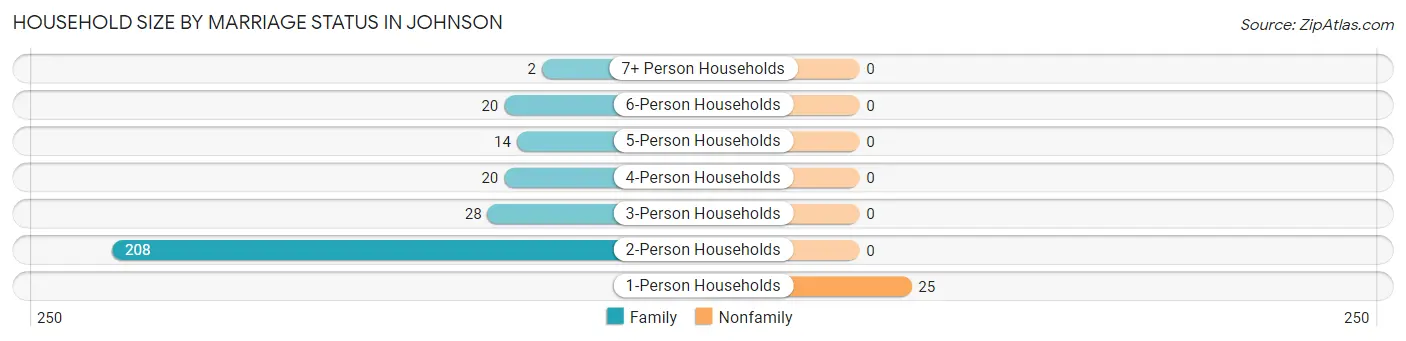
| Household Size | Family Households | Nonfamily Households |
| 1-Person Households | - | 25 (7.9%) |
| 2-Person Households | 208 (65.6%) | 0 (0.0%) |
| 3-Person Households | 28 (8.8%) | 0 (0.0%) |
| 4-Person Households | 20 (6.3%) | 0 (0.0%) |
| 5-Person Households | 14 (4.4%) | 0 (0.0%) |
| 6-Person Households | 20 (6.3%) | 0 (0.0%) |
| 7+ Person Households | 2 (0.6%) | 0 (0.0%) |
| Total | 292 (92.1%) | 25 (7.9%) |
Female Fertility in Johnson
Fertility by Age in Johnson
Average fertility rate in Johnson is 34.0 births per 1,000 women. Women in the age bracket of 20 to 34 years have the highest fertility rate with 95.0 births per 1,000 women. Women in the age bracket of 20 to 34 years acount for 100.0% of all women with births.
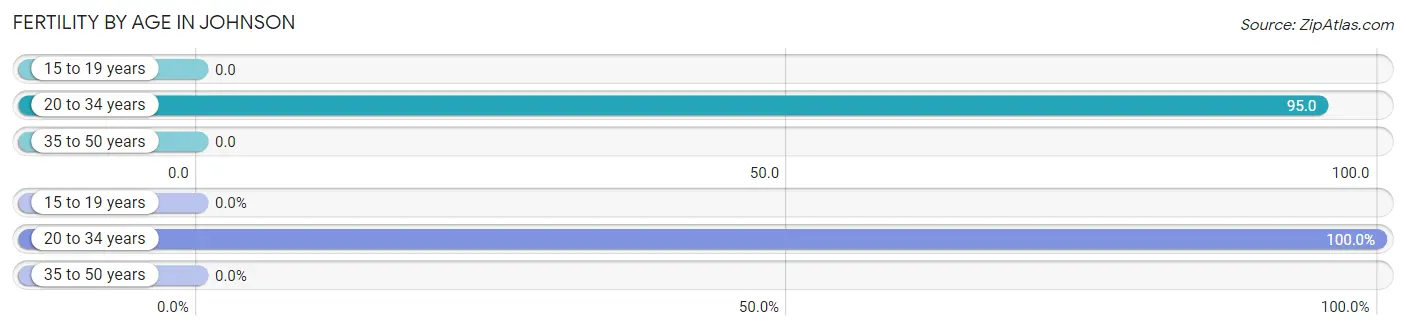
| Age Bracket | Women with Births | Births / 1,000 Women |
| 15 to 19 years | 0 (0.0%) | 0.0 |
| 20 to 34 years | 4 (100.0%) | 95.0 |
| 35 to 50 years | 0 (0.0%) | 0.0 |
| Total | 4 (100.0%) | 34.0 |
Fertility by Age by Marriage Status in Johnson
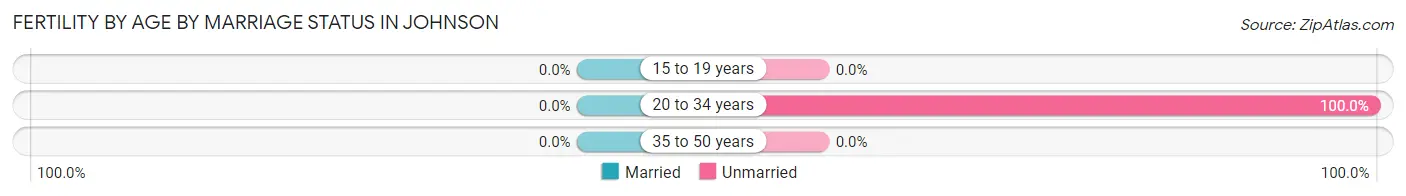
| Age Bracket | Married | Unmarried |
| 15 to 19 years | 0 (0.0%) | 0 (0.0%) |
| 20 to 34 years | 0 (0.0%) | 4 (100.0%) |
| 35 to 50 years | 0 (0.0%) | 0 (0.0%) |
| Total | 0 (0.0%) | 4 (100.0%) |
Fertility by Education in Johnson
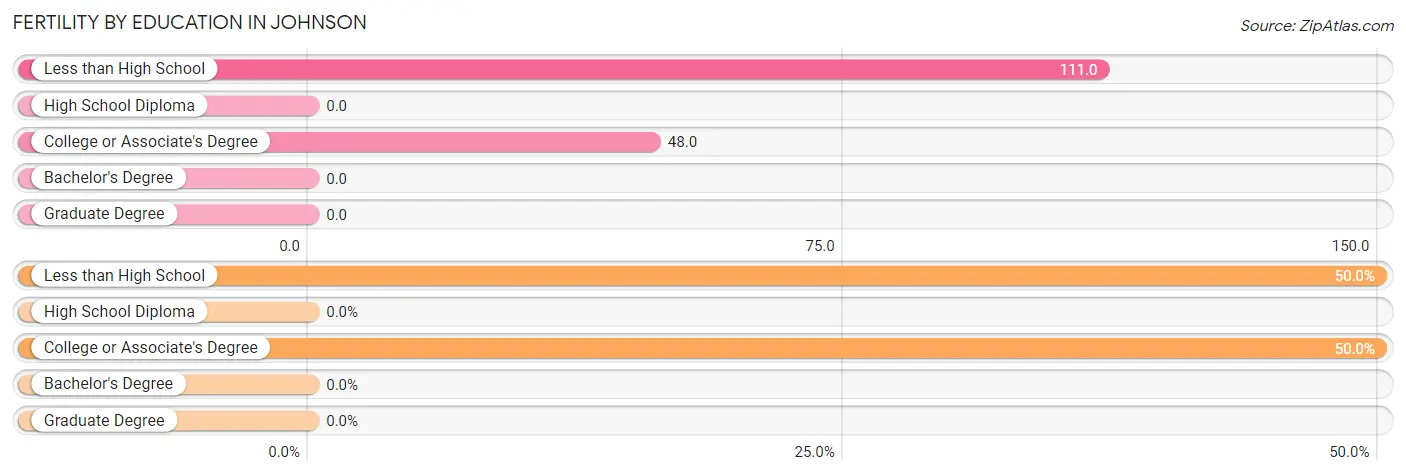
| Educational Attainment | Women with Births | Births / 1,000 Women |
| Less than High School | 2 (50.0%) | 111.0 |
| High School Diploma | 0 (0.0%) | 0.0 |
| College or Associate's Degree | 2 (50.0%) | 48.0 |
| Bachelor's Degree | 0 (0.0%) | 0.0 |
| Graduate Degree | 0 (0.0%) | 0.0 |
| Total | 4 (100.0%) | 34.0 |
Fertility by Education by Marriage Status in Johnson
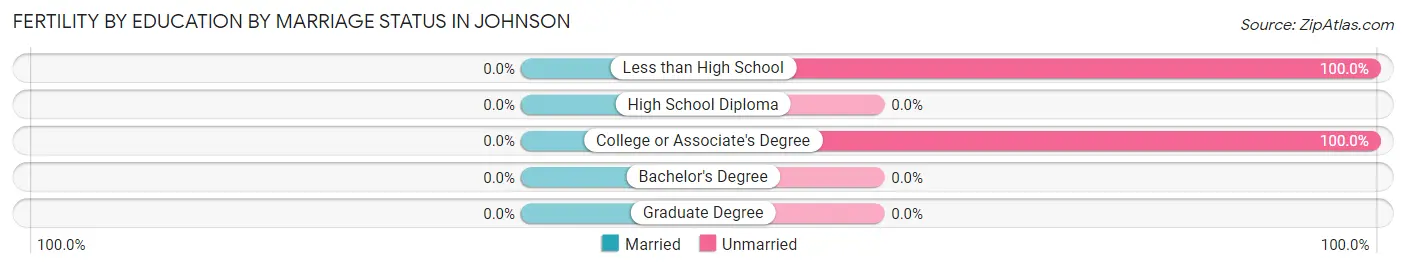
| Educational Attainment | Married | Unmarried |
| Less than High School | 0 (0.0%) | 2 (100.0%) |
| High School Diploma | 0 (0.0%) | 0 (0.0%) |
| College or Associate's Degree | 0 (0.0%) | 2 (100.0%) |
| Bachelor's Degree | 0 (0.0%) | 0 (0.0%) |
| Graduate Degree | 0 (0.0%) | 0 (0.0%) |
| Total | 0 (0.0%) | 4 (100.0%) |
Employment Characteristics in Johnson
Employment by Class of Employer in Johnson
Among the 226 employed individuals in Johnson, private company employees (149 | 65.9%), federal government employees (37 | 16.4%), and local government employees (19 | 8.4%) make up the most common classes of employment.
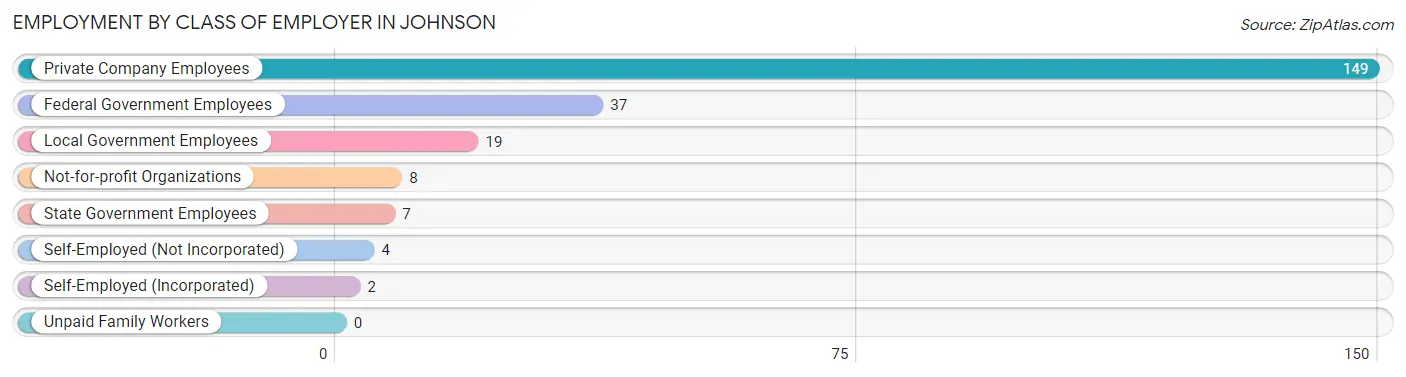
| Employer Class | # Employees | % Employees |
| Private Company Employees | 149 | 65.9% |
| Self-Employed (Incorporated) | 2 | 0.9% |
| Self-Employed (Not Incorporated) | 4 | 1.8% |
| Not-for-profit Organizations | 8 | 3.5% |
| Local Government Employees | 19 | 8.4% |
| State Government Employees | 7 | 3.1% |
| Federal Government Employees | 37 | 16.4% |
| Unpaid Family Workers | 0 | 0.0% |
| Total | 226 | 100.0% |
Employment Status by Age in Johnson
According to the labor force statistics for Johnson, out of the total population over 16 years of age (610), 40.0% or 244 individuals are in the labor force, with 7.6% or 19 of them unemployed. The age group with the highest labor force participation rate is 30 to 34 years, with 95.8% or 23 individuals in the labor force. Within the labor force, the 55 to 59 years age range has the highest percentage of unemployed individuals, with 33.3% or 4 of them being unemployed.
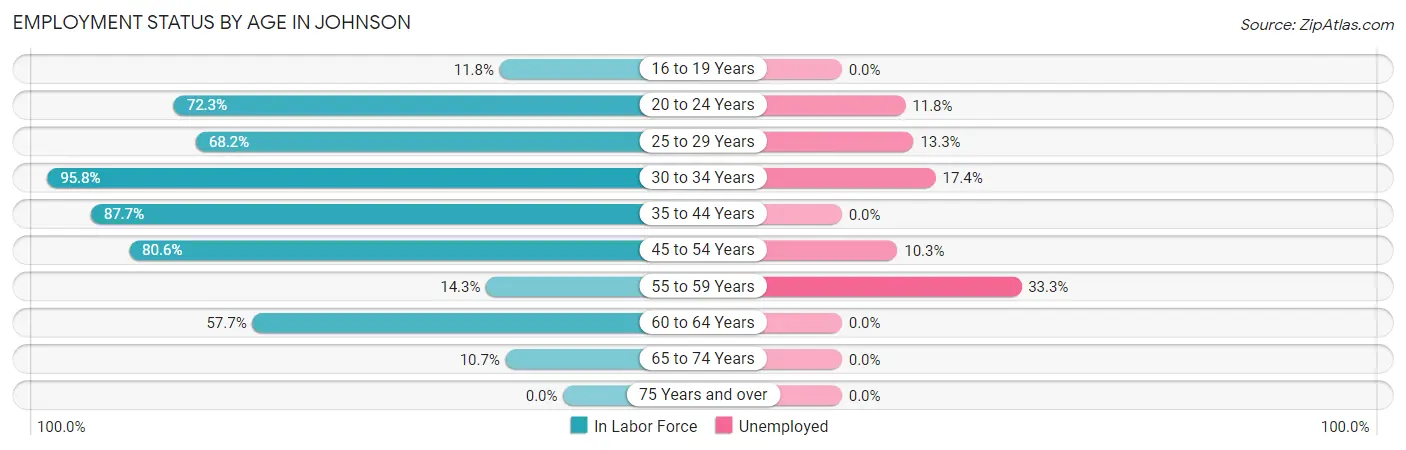
| Age Bracket | In Labor Force | Unemployed |
| 16 to 19 Years | 2 (11.8%) | 0 (0.0%) |
| 20 to 24 Years | 34 (72.3%) | 4 (11.8%) |
| 25 to 29 Years | 15 (68.2%) | 2 (13.3%) |
| 30 to 34 Years | 23 (95.8%) | 4 (17.4%) |
| 35 to 44 Years | 93 (87.7%) | 0 (0.0%) |
| 45 to 54 Years | 29 (80.6%) | 3 (10.3%) |
| 55 to 59 Years | 12 (14.3%) | 4 (33.3%) |
| 60 to 64 Years | 30 (57.7%) | 0 (0.0%) |
| 65 to 74 Years | 6 (10.7%) | 0 (0.0%) |
| 75 Years and over | 0 (0.0%) | 0 (0.0%) |
| Total | 244 (40.0%) | 19 (7.6%) |
Employment Status by Educational Attainment in Johnson
According to labor force statistics for Johnson, 62.3% of individuals (202) out of the total population between 25 and 64 years of age (324) are in the labor force, with 7.1% or 14 of them being unemployed. The group with the highest labor force participation rate are those with the educational attainment of college / associate degree, with 89.7% or 96 individuals in the labor force. Within the labor force, individuals with less than high school education have the highest percentage of unemployment, with 80.0% or 8 of them being unemployed.
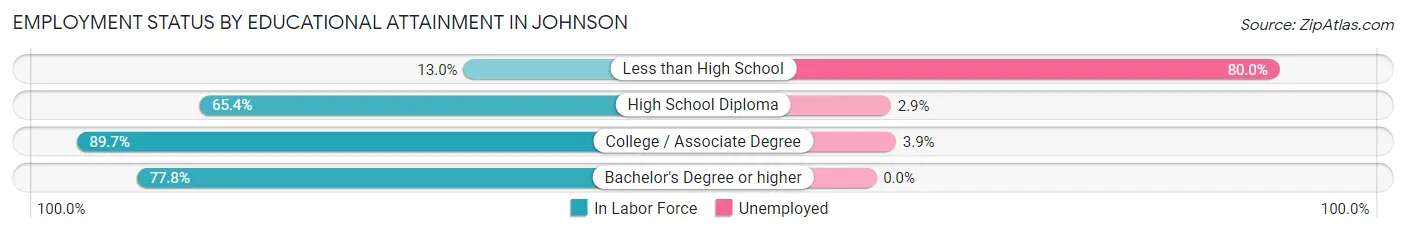
| Educational Attainment | In Labor Force | Unemployed |
| Less than High School | 10 (13.0%) | 62 (80.0%) |
| High School Diploma | 68 (65.4%) | 3 (2.9%) |
| College / Associate Degree | 96 (89.7%) | 4 (3.9%) |
| Bachelor's Degree or higher | 28 (77.8%) | 0 (0.0%) |
| Total | 202 (62.3%) | 23 (7.1%) |
Employment Occupations by Sex in Johnson
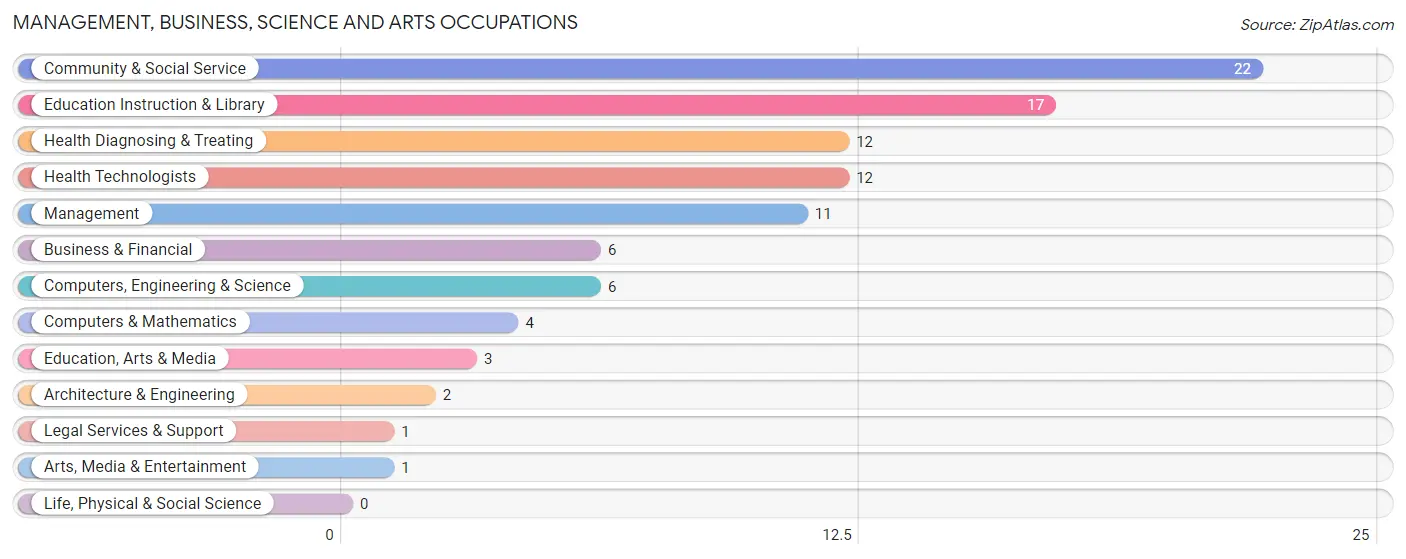
Management, Business, Science and Arts Occupations
The most common Management, Business, Science and Arts occupations in Johnson are Community & Social Service (22 | 10.6%), Education Instruction & Library (17 | 8.2%), Health Diagnosing & Treating (12 | 5.8%), Health Technologists (12 | 5.8%), and Management (11 | 5.3%).
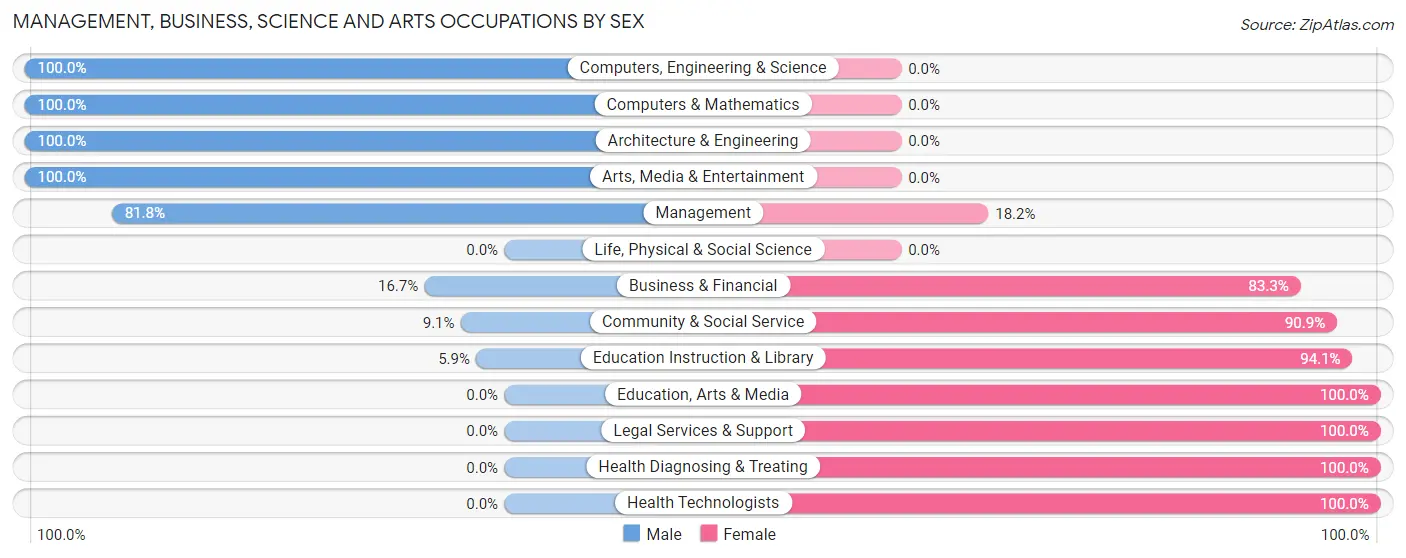
Management, Business, Science and Arts Occupations by Sex
Within the Management, Business, Science and Arts occupations in Johnson, the most male-oriented occupations are Computers, Engineering & Science (100.0%), Computers & Mathematics (100.0%), and Architecture & Engineering (100.0%), while the most female-oriented occupations are Education, Arts & Media (100.0%), Legal Services & Support (100.0%), and Health Diagnosing & Treating (100.0%).
| Occupation | Male | Female |
| Management | 9 (81.8%) | 2 (18.2%) |
| Business & Financial | 1 (16.7%) | 5 (83.3%) |
| Computers, Engineering & Science | 6 (100.0%) | 0 (0.0%) |
| Computers & Mathematics | 4 (100.0%) | 0 (0.0%) |
| Architecture & Engineering | 2 (100.0%) | 0 (0.0%) |
| Life, Physical & Social Science | 0 (0.0%) | 0 (0.0%) |
| Community & Social Service | 2 (9.1%) | 20 (90.9%) |
| Education, Arts & Media | 0 (0.0%) | 3 (100.0%) |
| Legal Services & Support | 0 (0.0%) | 1 (100.0%) |
| Education Instruction & Library | 1 (5.9%) | 16 (94.1%) |
| Arts, Media & Entertainment | 1 (100.0%) | 0 (0.0%) |
| Health Diagnosing & Treating | 0 (0.0%) | 12 (100.0%) |
| Health Technologists | 0 (0.0%) | 12 (100.0%) |
| Total (Category) | 18 (31.6%) | 39 (68.4%) |
| Total (Overall) | 110 (53.1%) | 97 (46.9%) |
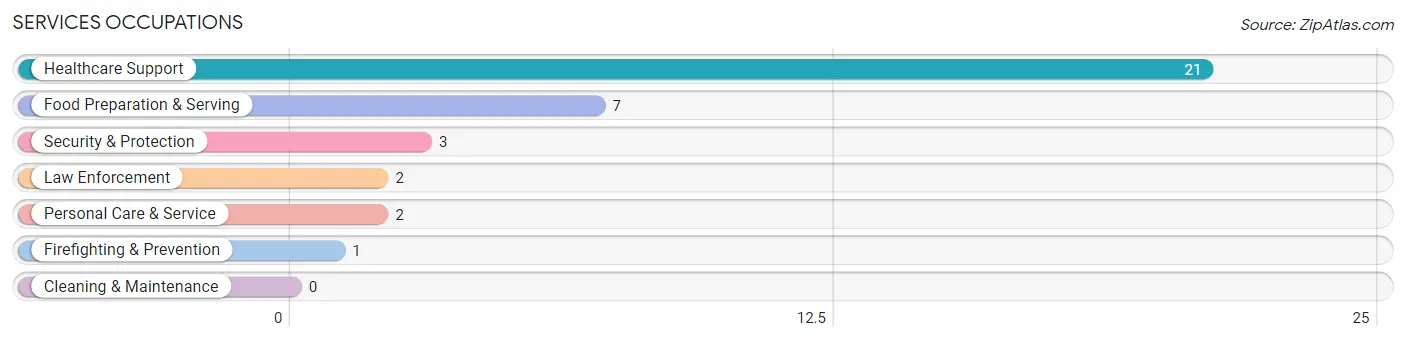
Services Occupations
The most common Services occupations in Johnson are Healthcare Support (21 | 10.1%), Food Preparation & Serving (7 | 3.4%), Security & Protection (3 | 1.5%), Law Enforcement (2 | 1.0%), and Personal Care & Service (2 | 1.0%).
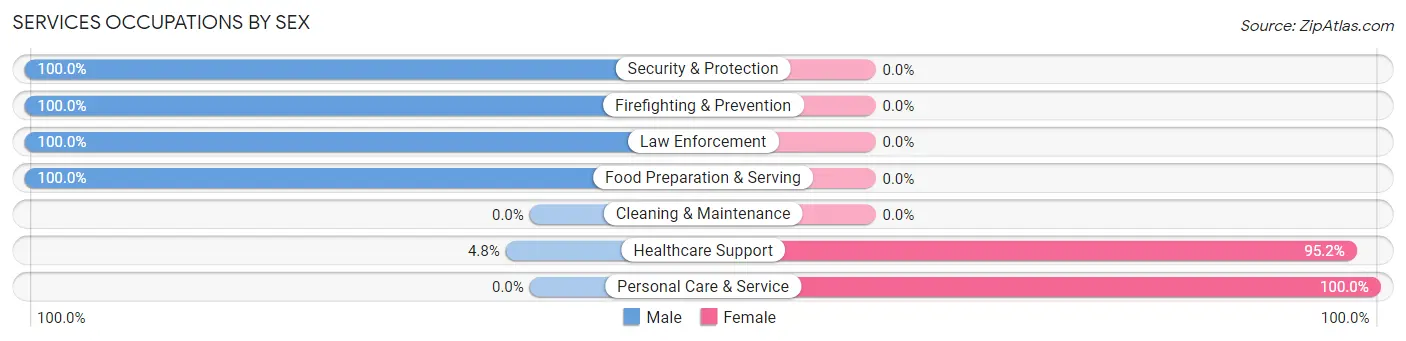
Services Occupations by Sex
Within the Services occupations in Johnson, the most male-oriented occupations are Security & Protection (100.0%), Firefighting & Prevention (100.0%), and Law Enforcement (100.0%), while the most female-oriented occupations are Personal Care & Service (100.0%), and Healthcare Support (95.2%).
| Occupation | Male | Female |
| Healthcare Support | 1 (4.8%) | 20 (95.2%) |
| Security & Protection | 3 (100.0%) | 0 (0.0%) |
| Firefighting & Prevention | 1 (100.0%) | 0 (0.0%) |
| Law Enforcement | 2 (100.0%) | 0 (0.0%) |
| Food Preparation & Serving | 7 (100.0%) | 0 (0.0%) |
| Cleaning & Maintenance | 0 (0.0%) | 0 (0.0%) |
| Personal Care & Service | 0 (0.0%) | 2 (100.0%) |
| Total (Category) | 11 (33.3%) | 22 (66.7%) |
| Total (Overall) | 110 (53.1%) | 97 (46.9%) |
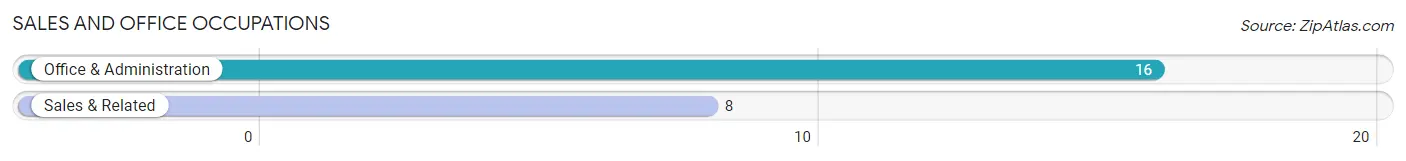
Sales and Office Occupations
The most common Sales and Office occupations in Johnson are Office & Administration (16 | 7.7%), and Sales & Related (8 | 3.9%).
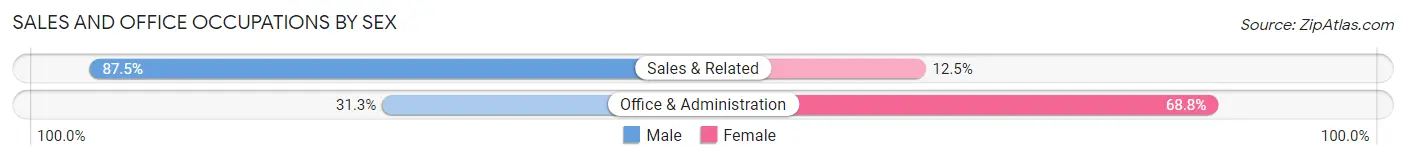
Sales and Office Occupations by Sex
| Occupation | Male | Female |
| Sales & Related | 7 (87.5%) | 1 (12.5%) |
| Office & Administration | 5 (31.2%) | 11 (68.8%) |
| Total (Category) | 12 (50.0%) | 12 (50.0%) |
| Total (Overall) | 110 (53.1%) | 97 (46.9%) |
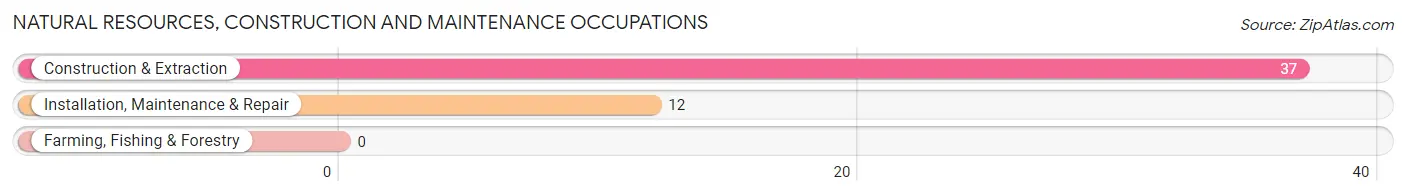
Natural Resources, Construction and Maintenance Occupations
The most common Natural Resources, Construction and Maintenance occupations in Johnson are Construction & Extraction (37 | 17.9%), and Installation, Maintenance & Repair (12 | 5.8%).
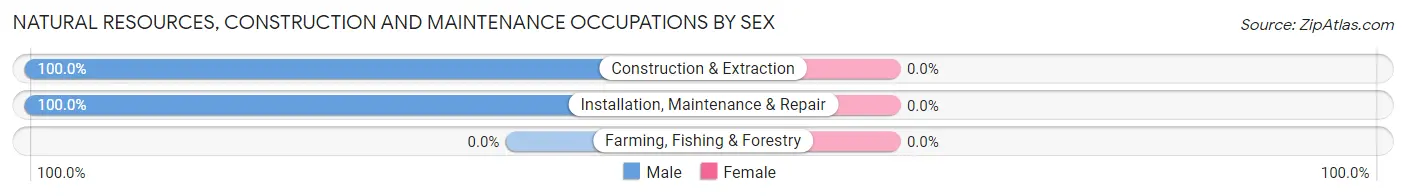
Natural Resources, Construction and Maintenance Occupations by Sex
| Occupation | Male | Female |
| Farming, Fishing & Forestry | 0 (0.0%) | 0 (0.0%) |
| Construction & Extraction | 37 (100.0%) | 0 (0.0%) |
| Installation, Maintenance & Repair | 12 (100.0%) | 0 (0.0%) |
| Total (Category) | 49 (100.0%) | 0 (0.0%) |
| Total (Overall) | 110 (53.1%) | 97 (46.9%) |
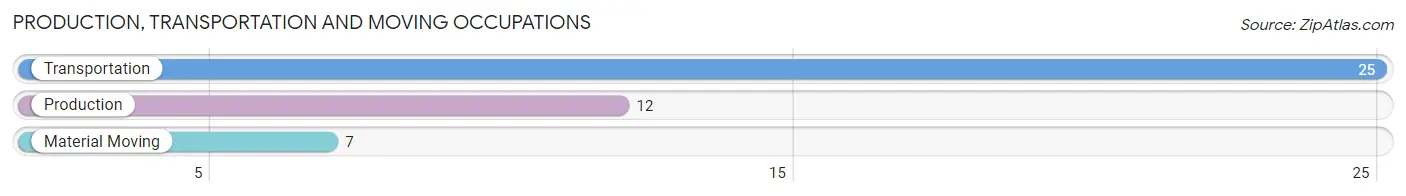
Production, Transportation and Moving Occupations
The most common Production, Transportation and Moving occupations in Johnson are Transportation (25 | 12.1%), Production (12 | 5.8%), and Material Moving (7 | 3.4%).
Production, Transportation and Moving Occupations by Sex
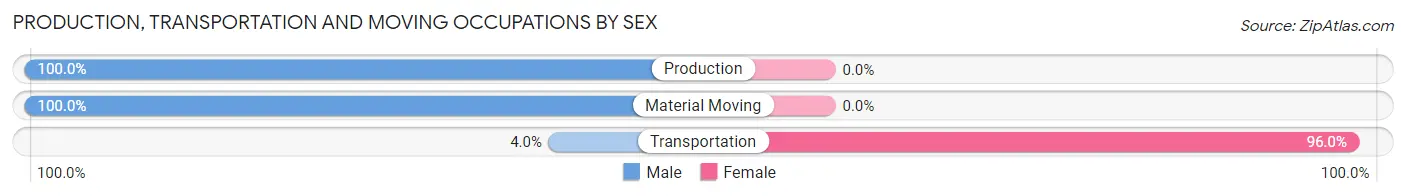
| Occupation | Male | Female |
| Production | 12 (100.0%) | 0 (0.0%) |
| Transportation | 1 (4.0%) | 24 (96.0%) |
| Material Moving | 7 (100.0%) | 0 (0.0%) |
| Total (Category) | 20 (45.5%) | 24 (54.5%) |
| Total (Overall) | 110 (53.1%) | 97 (46.9%) |
Employment Industries by Sex in Johnson
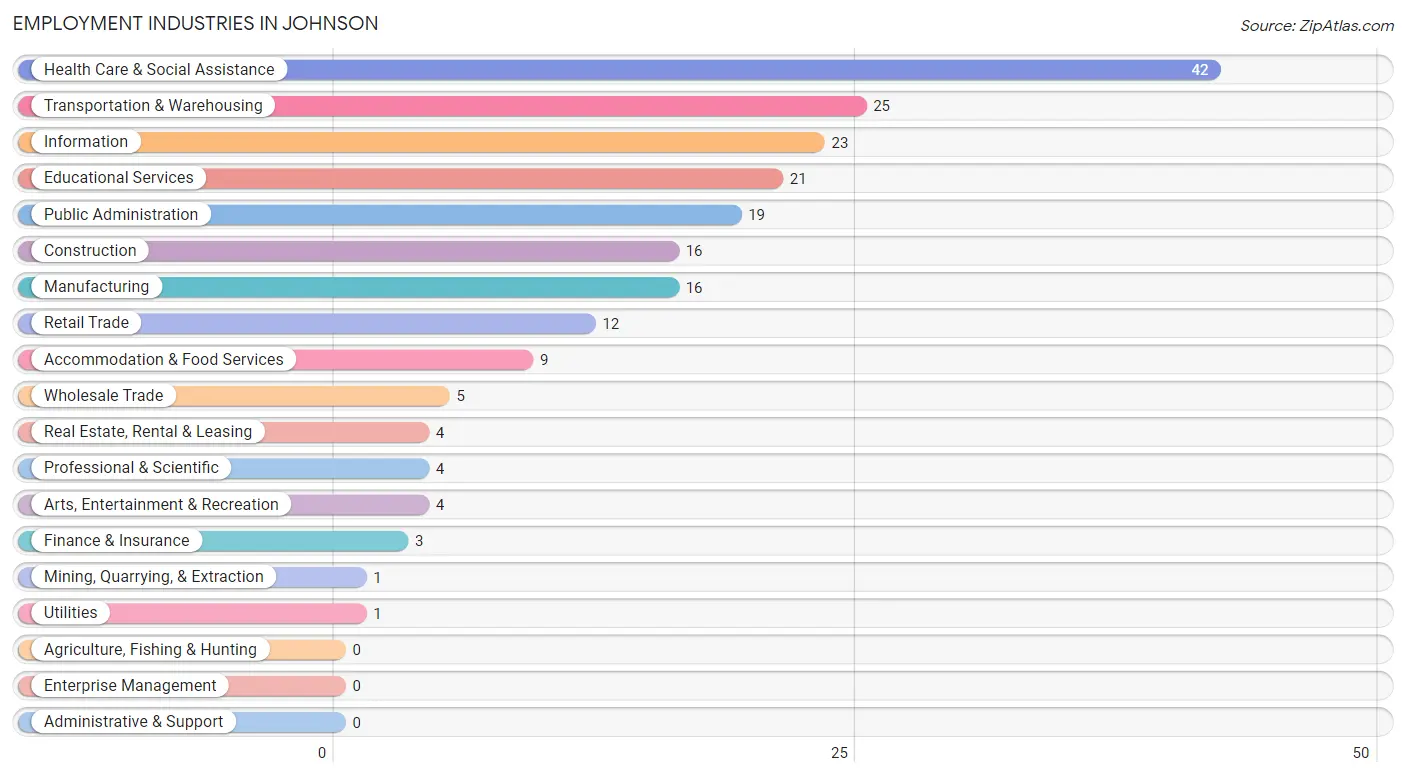
Employment Industries in Johnson
The major employment industries in Johnson include Health Care & Social Assistance (42 | 20.3%), Transportation & Warehousing (25 | 12.1%), Information (23 | 11.1%), Educational Services (21 | 10.1%), and Public Administration (19 | 9.2%).
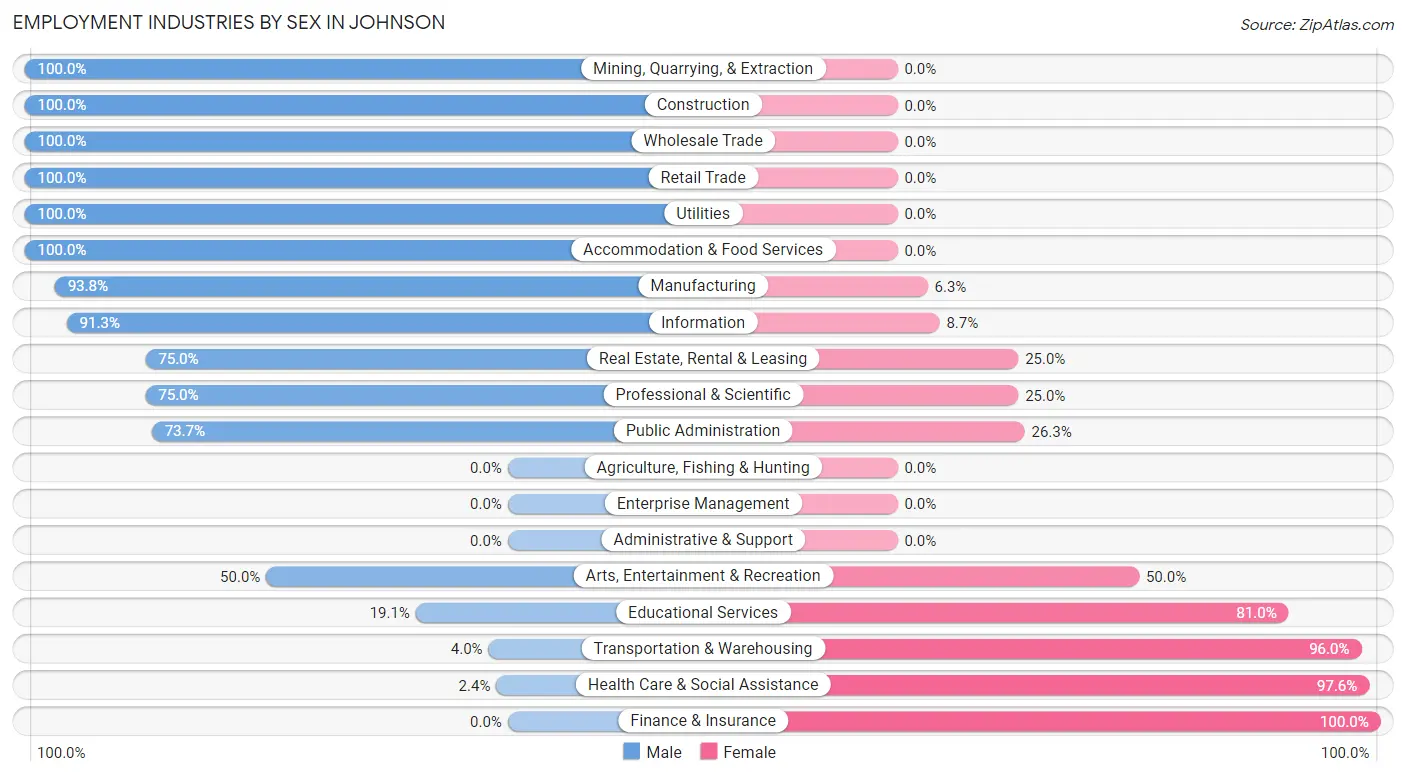
Employment Industries by Sex in Johnson
The Johnson industries that see more men than women are Mining, Quarrying, & Extraction (100.0%), Construction (100.0%), and Wholesale Trade (100.0%), whereas the industries that tend to have a higher number of women are Finance & Insurance (100.0%), Health Care & Social Assistance (97.6%), and Transportation & Warehousing (96.0%).
| Industry | Male | Female |
| Agriculture, Fishing & Hunting | 0 (0.0%) | 0 (0.0%) |
| Mining, Quarrying, & Extraction | 1 (100.0%) | 0 (0.0%) |
| Construction | 16 (100.0%) | 0 (0.0%) |
| Manufacturing | 15 (93.8%) | 1 (6.2%) |
| Wholesale Trade | 5 (100.0%) | 0 (0.0%) |
| Retail Trade | 12 (100.0%) | 0 (0.0%) |
| Transportation & Warehousing | 1 (4.0%) | 24 (96.0%) |
| Utilities | 1 (100.0%) | 0 (0.0%) |
| Information | 21 (91.3%) | 2 (8.7%) |
| Finance & Insurance | 0 (0.0%) | 3 (100.0%) |
| Real Estate, Rental & Leasing | 3 (75.0%) | 1 (25.0%) |
| Professional & Scientific | 3 (75.0%) | 1 (25.0%) |
| Enterprise Management | 0 (0.0%) | 0 (0.0%) |
| Administrative & Support | 0 (0.0%) | 0 (0.0%) |
| Educational Services | 4 (19.1%) | 17 (80.9%) |
| Health Care & Social Assistance | 1 (2.4%) | 41 (97.6%) |
| Arts, Entertainment & Recreation | 2 (50.0%) | 2 (50.0%) |
| Accommodation & Food Services | 9 (100.0%) | 0 (0.0%) |
| Public Administration | 14 (73.7%) | 5 (26.3%) |
| Total | 110 (53.1%) | 97 (46.9%) |
Education in Johnson
School Enrollment in Johnson
The most common levels of schooling among the 288 students in Johnson are high school (186 | 64.6%), elementary school (45 | 15.6%), and middle school (44 | 15.3%).
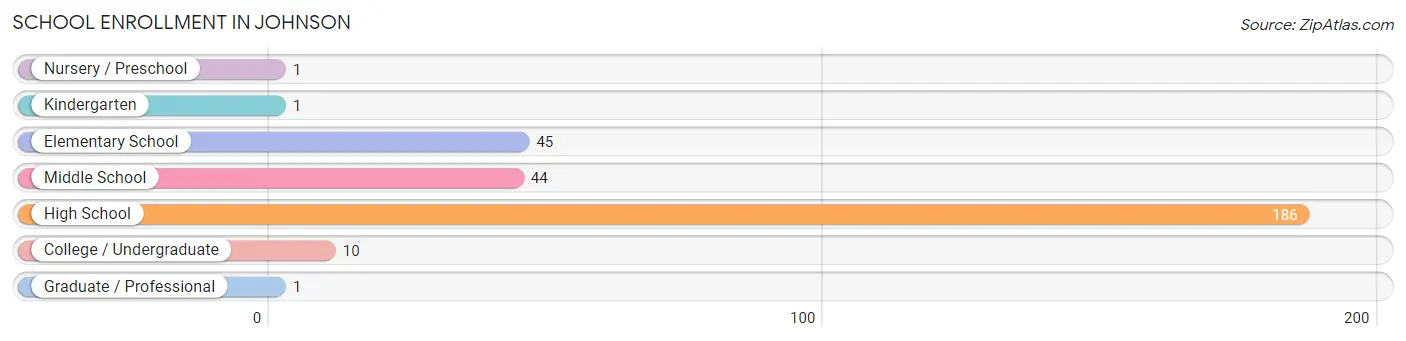
| School Level | # Students | % Students |
| Nursery / Preschool | 1 | 0.4% |
| Kindergarten | 1 | 0.4% |
| Elementary School | 45 | 15.6% |
| Middle School | 44 | 15.3% |
| High School | 186 | 64.6% |
| College / Undergraduate | 10 | 3.5% |
| Graduate / Professional | 1 | 0.4% |
| Total | 288 | 100.0% |
School Enrollment by Age by Funding Source in Johnson
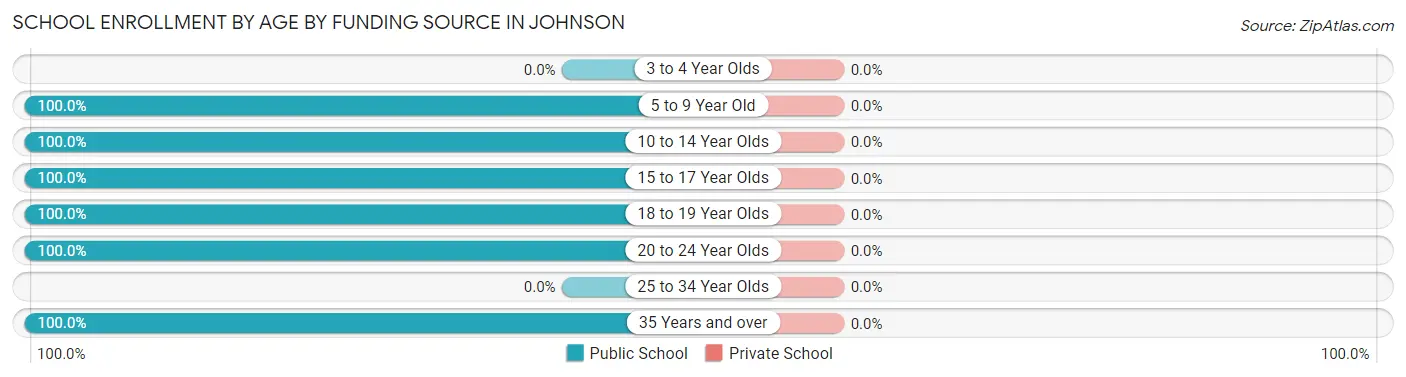
| Age Bracket | Public School | Private School |
| 3 to 4 Year Olds | 0 (0.0%) | 0 (0.0%) |
| 5 to 9 Year Old | 47 (100.0%) | 0 (0.0%) |
| 10 to 14 Year Olds | 48 (100.0%) | 0 (0.0%) |
| 15 to 17 Year Olds | 38 (100.0%) | 0 (0.0%) |
| 18 to 19 Year Olds | 2 (100.0%) | 0 (0.0%) |
| 20 to 24 Year Olds | 6 (100.0%) | 0 (0.0%) |
| 25 to 34 Year Olds | 0 (0.0%) | 0 (0.0%) |
| 35 Years and over | 147 (100.0%) | 0 (0.0%) |
| Total | 288 (100.0%) | 0 (0.0%) |
Educational Attainment by Field of Study in Johnson
Education (12 | 24.5%), business (8 | 16.3%), arts & humanities (8 | 16.3%), liberal arts & history (6 | 12.2%), and computers & mathematics (5 | 10.2%) are the most common fields of study among 49 individuals in Johnson who have obtained a bachelor's degree or higher.
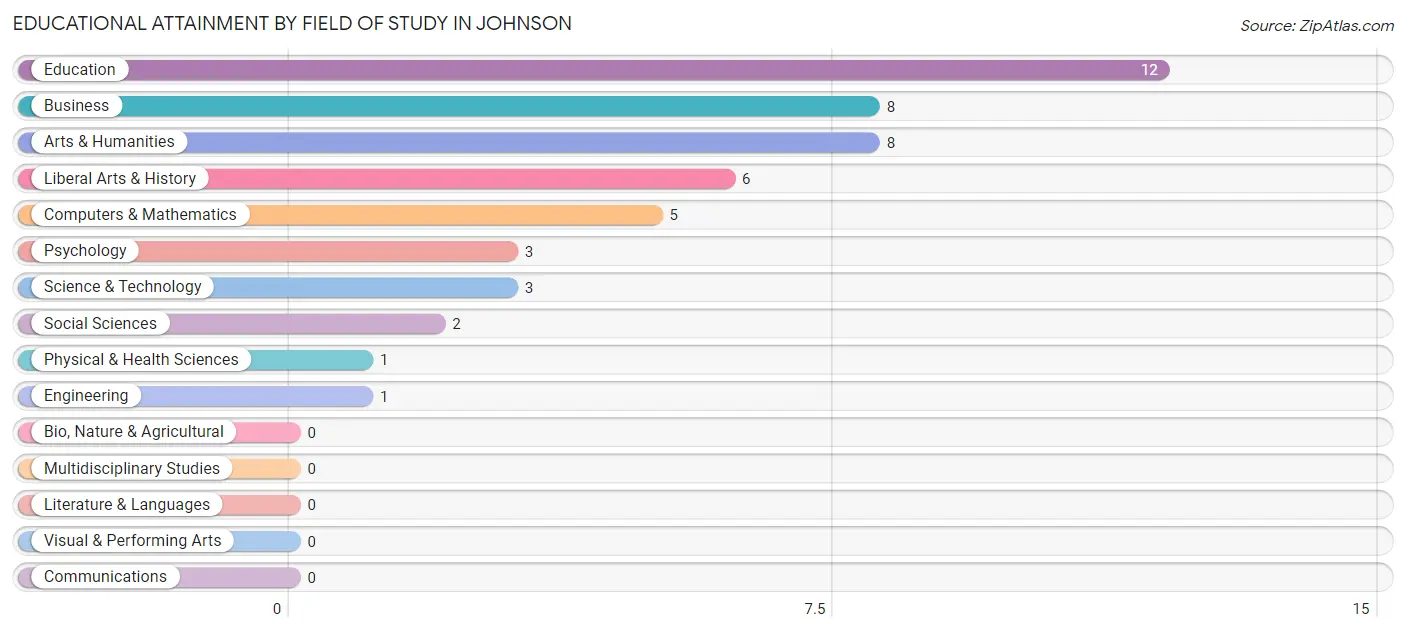
| Field of Study | # Graduates | % Graduates |
| Computers & Mathematics | 5 | 10.2% |
| Bio, Nature & Agricultural | 0 | 0.0% |
| Physical & Health Sciences | 1 | 2.0% |
| Psychology | 3 | 6.1% |
| Social Sciences | 2 | 4.1% |
| Engineering | 1 | 2.0% |
| Multidisciplinary Studies | 0 | 0.0% |
| Science & Technology | 3 | 6.1% |
| Business | 8 | 16.3% |
| Education | 12 | 24.5% |
| Literature & Languages | 0 | 0.0% |
| Liberal Arts & History | 6 | 12.2% |
| Visual & Performing Arts | 0 | 0.0% |
| Communications | 0 | 0.0% |
| Arts & Humanities | 8 | 16.3% |
| Total | 49 | 100.0% |
Transportation & Commute in Johnson
Vehicle Availability by Sex in Johnson
The most prevalent vehicle ownership categories in Johnson are males with 3 vehicles (79, accounting for 61.2%) and females with 3 vehicles (44, making up 81.4%).
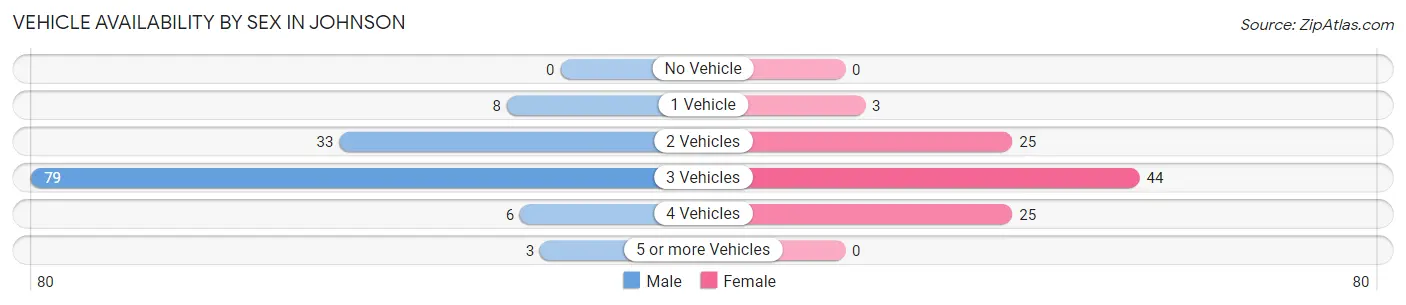
| Vehicles Available | Male | Female |
| No Vehicle | 0 (0.0%) | 0 (0.0%) |
| 1 Vehicle | 8 (6.2%) | 3 (3.1%) |
| 2 Vehicles | 33 (25.6%) | 25 (25.8%) |
| 3 Vehicles | 79 (61.2%) | 44 (45.4%) |
| 4 Vehicles | 6 (4.6%) | 25 (25.8%) |
| 5 or more Vehicles | 3 (2.3%) | 0 (0.0%) |
| Total | 129 (100.0%) | 97 (100.0%) |
Commute Time in Johnson
The most frequently occuring commute durations in Johnson are 25 to 29 minutes (34 commuters, 15.7%), 15 to 19 minutes (32 commuters, 14.7%), and 35 to 39 minutes (31 commuters, 14.3%).
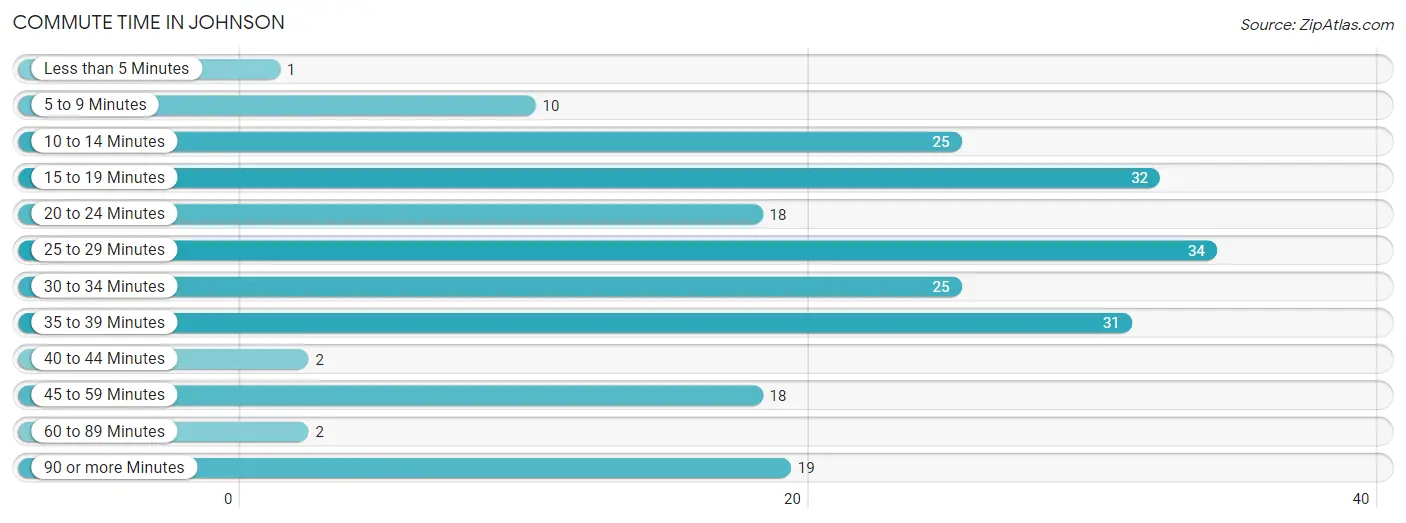
| Commute Time | # Commuters | % Commuters |
| Less than 5 Minutes | 1 | 0.5% |
| 5 to 9 Minutes | 10 | 4.6% |
| 10 to 14 Minutes | 25 | 11.5% |
| 15 to 19 Minutes | 32 | 14.7% |
| 20 to 24 Minutes | 18 | 8.3% |
| 25 to 29 Minutes | 34 | 15.7% |
| 30 to 34 Minutes | 25 | 11.5% |
| 35 to 39 Minutes | 31 | 14.3% |
| 40 to 44 Minutes | 2 | 0.9% |
| 45 to 59 Minutes | 18 | 8.3% |
| 60 to 89 Minutes | 2 | 0.9% |
| 90 or more Minutes | 19 | 8.8% |
Commute Time by Sex in Johnson
The most common commute times in Johnson are 25 to 29 minutes (32 commuters, 25.6%) for males and 35 to 39 minutes (25 commuters, 27.2%) for females.
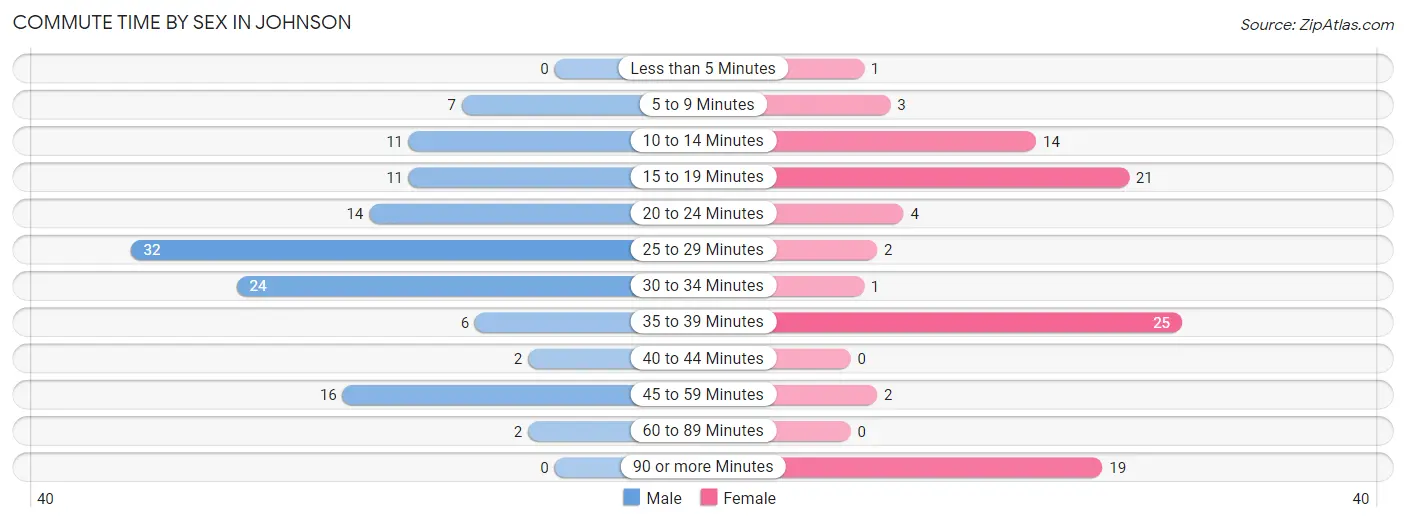
| Commute Time | Male | Female |
| Less than 5 Minutes | 0 (0.0%) | 1 (1.1%) |
| 5 to 9 Minutes | 7 (5.6%) | 3 (3.3%) |
| 10 to 14 Minutes | 11 (8.8%) | 14 (15.2%) |
| 15 to 19 Minutes | 11 (8.8%) | 21 (22.8%) |
| 20 to 24 Minutes | 14 (11.2%) | 4 (4.3%) |
| 25 to 29 Minutes | 32 (25.6%) | 2 (2.2%) |
| 30 to 34 Minutes | 24 (19.2%) | 1 (1.1%) |
| 35 to 39 Minutes | 6 (4.8%) | 25 (27.2%) |
| 40 to 44 Minutes | 2 (1.6%) | 0 (0.0%) |
| 45 to 59 Minutes | 16 (12.8%) | 2 (2.2%) |
| 60 to 89 Minutes | 2 (1.6%) | 0 (0.0%) |
| 90 or more Minutes | 0 (0.0%) | 19 (20.6%) |
Time of Departure to Work by Sex in Johnson
The most frequent times of departure to work in Johnson are 7:30 AM to 7:59 AM (26, 20.8%) for males and 11:00 AM to 11:59 AM (24, 26.1%) for females.
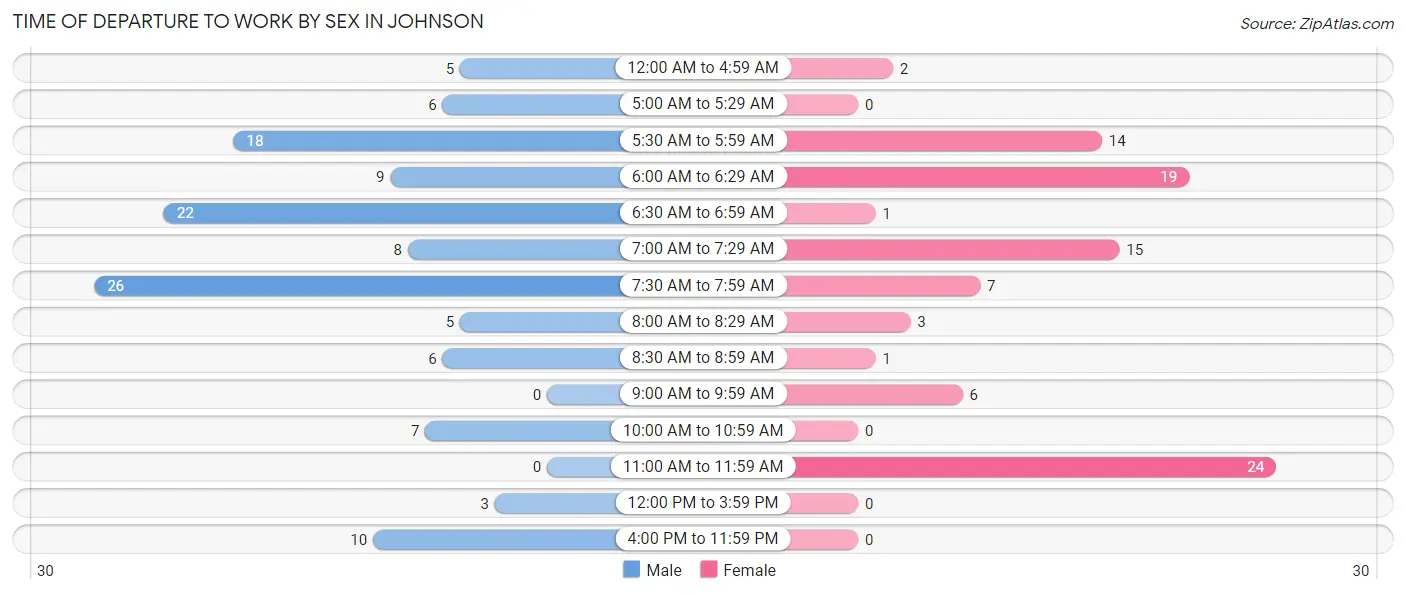
| Time of Departure | Male | Female |
| 12:00 AM to 4:59 AM | 5 (4.0%) | 2 (2.2%) |
| 5:00 AM to 5:29 AM | 6 (4.8%) | 0 (0.0%) |
| 5:30 AM to 5:59 AM | 18 (14.4%) | 14 (15.2%) |
| 6:00 AM to 6:29 AM | 9 (7.2%) | 19 (20.6%) |
| 6:30 AM to 6:59 AM | 22 (17.6%) | 1 (1.1%) |
| 7:00 AM to 7:29 AM | 8 (6.4%) | 15 (16.3%) |
| 7:30 AM to 7:59 AM | 26 (20.8%) | 7 (7.6%) |
| 8:00 AM to 8:29 AM | 5 (4.0%) | 3 (3.3%) |
| 8:30 AM to 8:59 AM | 6 (4.8%) | 1 (1.1%) |
| 9:00 AM to 9:59 AM | 0 (0.0%) | 6 (6.5%) |
| 10:00 AM to 10:59 AM | 7 (5.6%) | 0 (0.0%) |
| 11:00 AM to 11:59 AM | 0 (0.0%) | 24 (26.1%) |
| 12:00 PM to 3:59 PM | 3 (2.4%) | 0 (0.0%) |
| 4:00 PM to 11:59 PM | 10 (8.0%) | 0 (0.0%) |
| Total | 125 (100.0%) | 92 (100.0%) |
Housing Occupancy in Johnson
Occupancy by Ownership in Johnson
Of the total 317 dwellings in Johnson, owner-occupied units account for 297 (93.7%), while renter-occupied units make up 20 (6.3%).
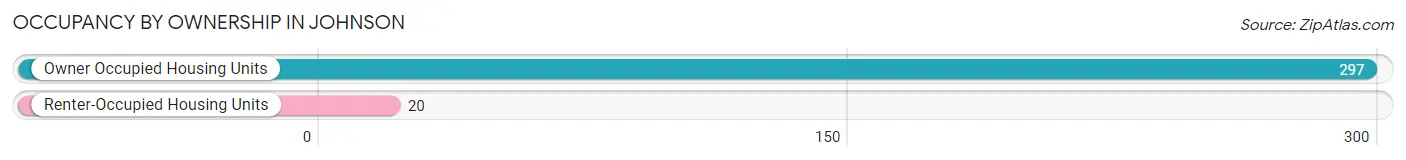
| Occupancy | # Housing Units | % Housing Units |
| Owner Occupied Housing Units | 297 | 93.7% |
| Renter-Occupied Housing Units | 20 | 6.3% |
| Total Occupied Housing Units | 317 | 100.0% |
Occupancy by Household Size in Johnson
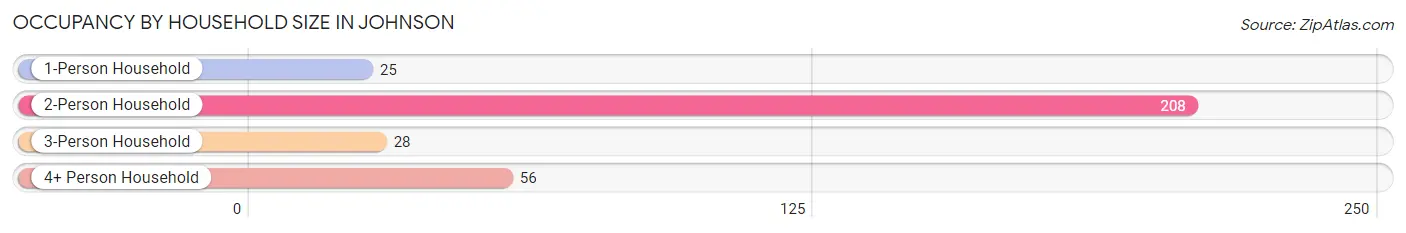
| Household Size | # Housing Units | % Housing Units |
| 1-Person Household | 25 | 7.9% |
| 2-Person Household | 208 | 65.6% |
| 3-Person Household | 28 | 8.8% |
| 4+ Person Household | 56 | 17.7% |
| Total Housing Units | 317 | 100.0% |
Occupancy by Ownership by Household Size in Johnson
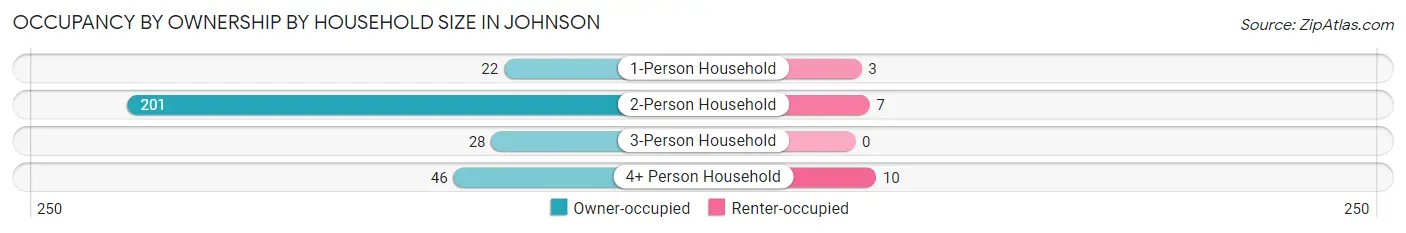
| Household Size | Owner-occupied | Renter-occupied |
| 1-Person Household | 22 (88.0%) | 3 (12.0%) |
| 2-Person Household | 201 (96.6%) | 7 (3.4%) |
| 3-Person Household | 28 (100.0%) | 0 (0.0%) |
| 4+ Person Household | 46 (82.1%) | 10 (17.9%) |
| Total Housing Units | 297 (93.7%) | 20 (6.3%) |
Occupancy by Educational Attainment in Johnson
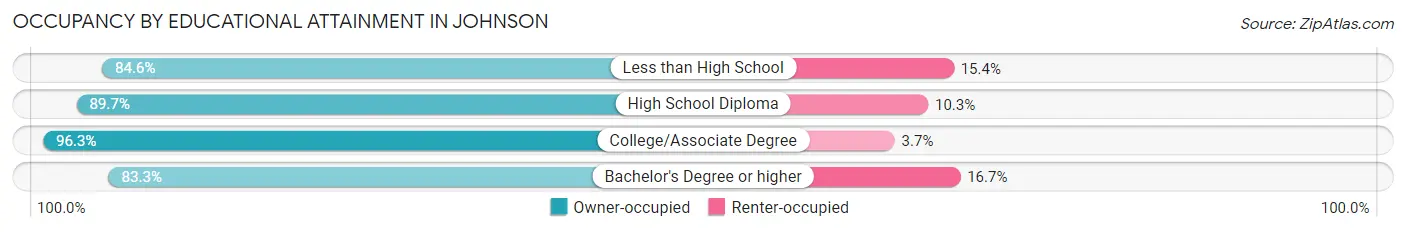
| Household Size | Owner-occupied | Renter-occupied |
| Less than High School | 11 (84.6%) | 2 (15.4%) |
| High School Diploma | 61 (89.7%) | 7 (10.3%) |
| College/Associate Degree | 210 (96.3%) | 8 (3.7%) |
| Bachelor's Degree or higher | 15 (83.3%) | 3 (16.7%) |
Occupancy by Age of Householder in Johnson
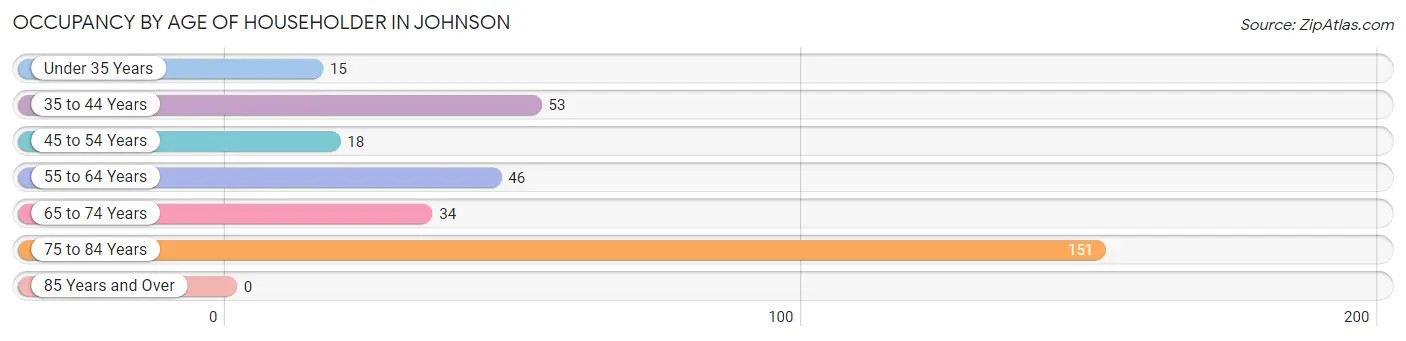
| Age Bracket | # Households | % Households |
| Under 35 Years | 15 | 4.7% |
| 35 to 44 Years | 53 | 16.7% |
| 45 to 54 Years | 18 | 5.7% |
| 55 to 64 Years | 46 | 14.5% |
| 65 to 74 Years | 34 | 10.7% |
| 75 to 84 Years | 151 | 47.6% |
| 85 Years and Over | 0 | 0.0% |
| Total | 317 | 100.0% |
Housing Finances in Johnson
Median Income by Occupancy in Johnson
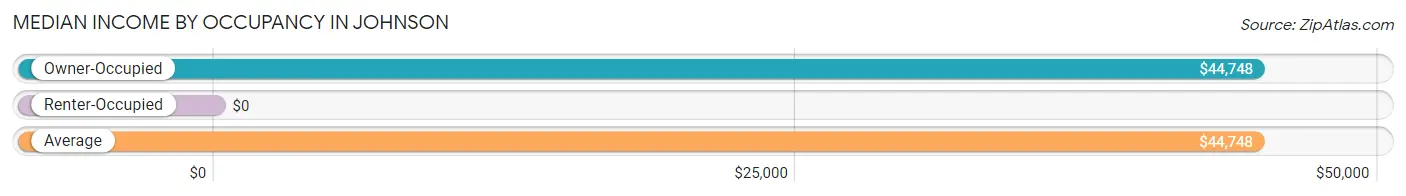
| Occupancy Type | # Households | Median Income |
| Owner-Occupied | 297 (93.7%) | $44,748 |
| Renter-Occupied | 20 (6.3%) | $0 |
| Average | 317 (100.0%) | $44,748 |
Occupancy by Householder Income Bracket in Johnson
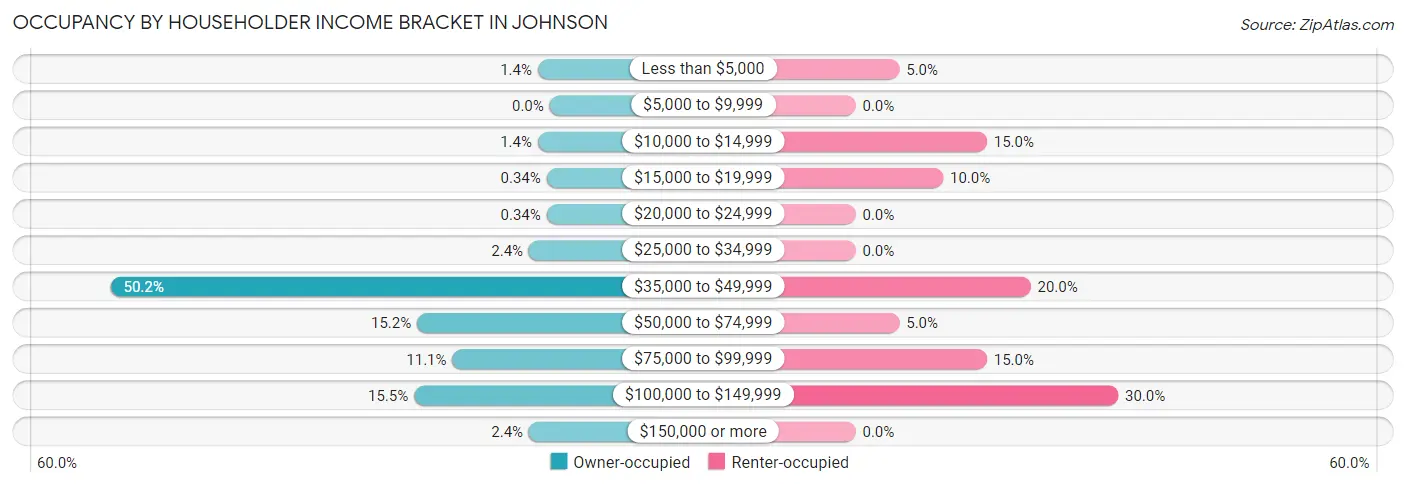
| Income Bracket | Owner-occupied | Renter-occupied |
| Less than $5,000 | 4 (1.3%) | 1 (5.0%) |
| $5,000 to $9,999 | 0 (0.0%) | 0 (0.0%) |
| $10,000 to $14,999 | 4 (1.3%) | 3 (15.0%) |
| $15,000 to $19,999 | 1 (0.3%) | 2 (10.0%) |
| $20,000 to $24,999 | 1 (0.3%) | 0 (0.0%) |
| $25,000 to $34,999 | 7 (2.4%) | 0 (0.0%) |
| $35,000 to $49,999 | 149 (50.2%) | 4 (20.0%) |
| $50,000 to $74,999 | 45 (15.1%) | 1 (5.0%) |
| $75,000 to $99,999 | 33 (11.1%) | 3 (15.0%) |
| $100,000 to $149,999 | 46 (15.5%) | 6 (30.0%) |
| $150,000 or more | 7 (2.4%) | 0 (0.0%) |
| Total | 297 (100.0%) | 20 (100.0%) |
Monthly Housing Cost Tiers in Johnson
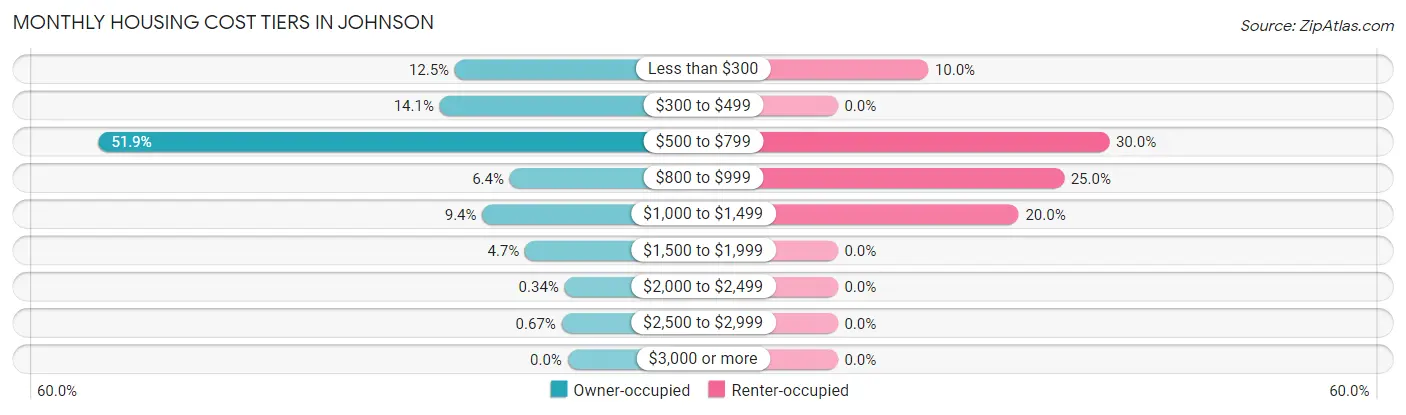
| Monthly Cost | Owner-occupied | Renter-occupied |
| Less than $300 | 37 (12.5%) | 2 (10.0%) |
| $300 to $499 | 42 (14.1%) | 0 (0.0%) |
| $500 to $799 | 154 (51.8%) | 6 (30.0%) |
| $800 to $999 | 19 (6.4%) | 5 (25.0%) |
| $1,000 to $1,499 | 28 (9.4%) | 4 (20.0%) |
| $1,500 to $1,999 | 14 (4.7%) | 0 (0.0%) |
| $2,000 to $2,499 | 1 (0.3%) | 0 (0.0%) |
| $2,500 to $2,999 | 2 (0.7%) | 0 (0.0%) |
| $3,000 or more | 0 (0.0%) | 0 (0.0%) |
| Total | 297 (100.0%) | 20 (100.0%) |
Physical Housing Characteristics in Johnson
Housing Structures in Johnson
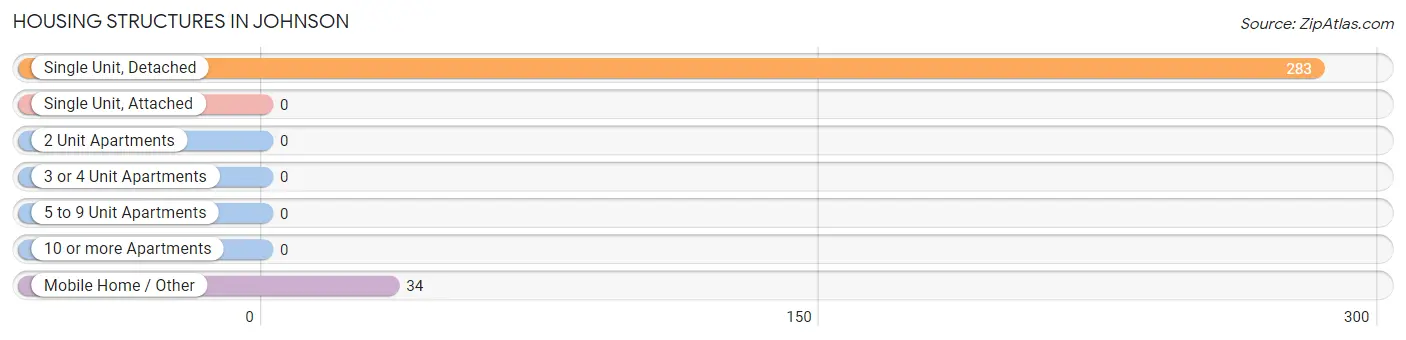
| Structure Type | # Housing Units | % Housing Units |
| Single Unit, Detached | 283 | 89.3% |
| Single Unit, Attached | 0 | 0.0% |
| 2 Unit Apartments | 0 | 0.0% |
| 3 or 4 Unit Apartments | 0 | 0.0% |
| 5 to 9 Unit Apartments | 0 | 0.0% |
| 10 or more Apartments | 0 | 0.0% |
| Mobile Home / Other | 34 | 10.7% |
| Total | 317 | 100.0% |
Housing Structures by Occupancy in Johnson
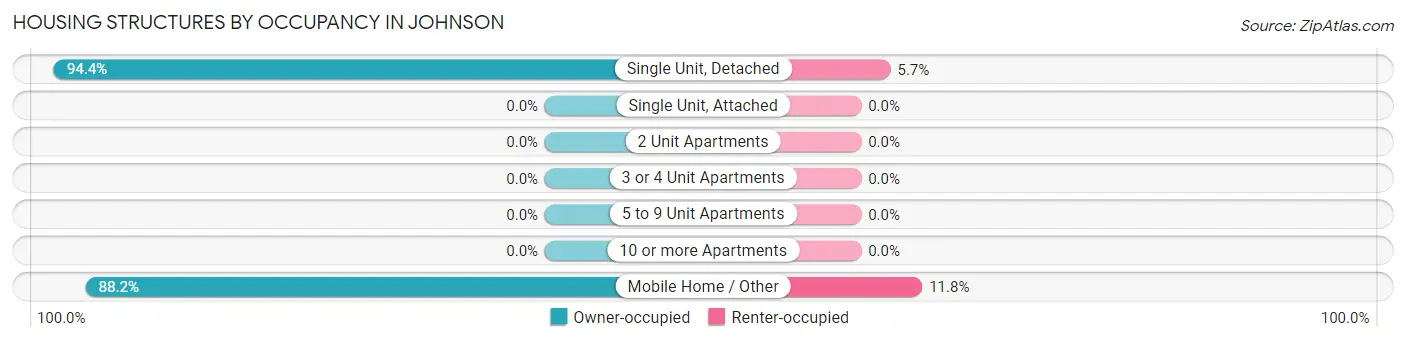
| Structure Type | Owner-occupied | Renter-occupied |
| Single Unit, Detached | 267 (94.4%) | 16 (5.7%) |
| Single Unit, Attached | 0 (0.0%) | 0 (0.0%) |
| 2 Unit Apartments | 0 (0.0%) | 0 (0.0%) |
| 3 or 4 Unit Apartments | 0 (0.0%) | 0 (0.0%) |
| 5 to 9 Unit Apartments | 0 (0.0%) | 0 (0.0%) |
| 10 or more Apartments | 0 (0.0%) | 0 (0.0%) |
| Mobile Home / Other | 30 (88.2%) | 4 (11.8%) |
| Total | 297 (93.7%) | 20 (6.3%) |
Housing Structures by Number of Rooms in Johnson
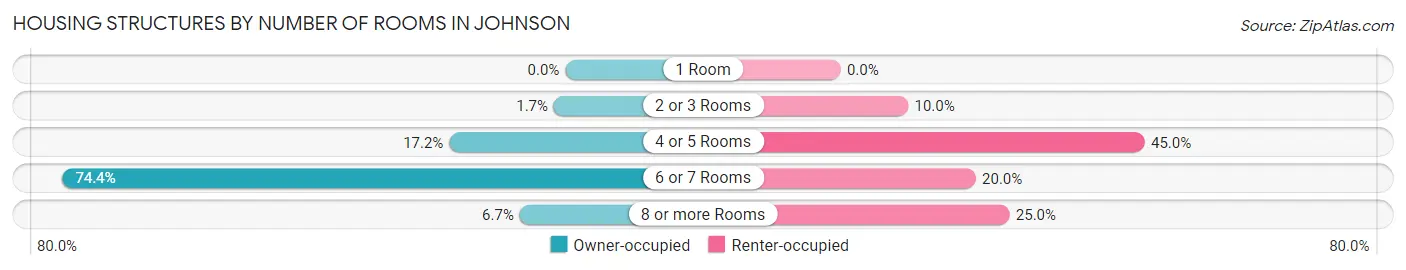
| Number of Rooms | Owner-occupied | Renter-occupied |
| 1 Room | 0 (0.0%) | 0 (0.0%) |
| 2 or 3 Rooms | 5 (1.7%) | 2 (10.0%) |
| 4 or 5 Rooms | 51 (17.2%) | 9 (45.0%) |
| 6 or 7 Rooms | 221 (74.4%) | 4 (20.0%) |
| 8 or more Rooms | 20 (6.7%) | 5 (25.0%) |
| Total | 297 (100.0%) | 20 (100.0%) |
Housing Structure by Heating Type in Johnson
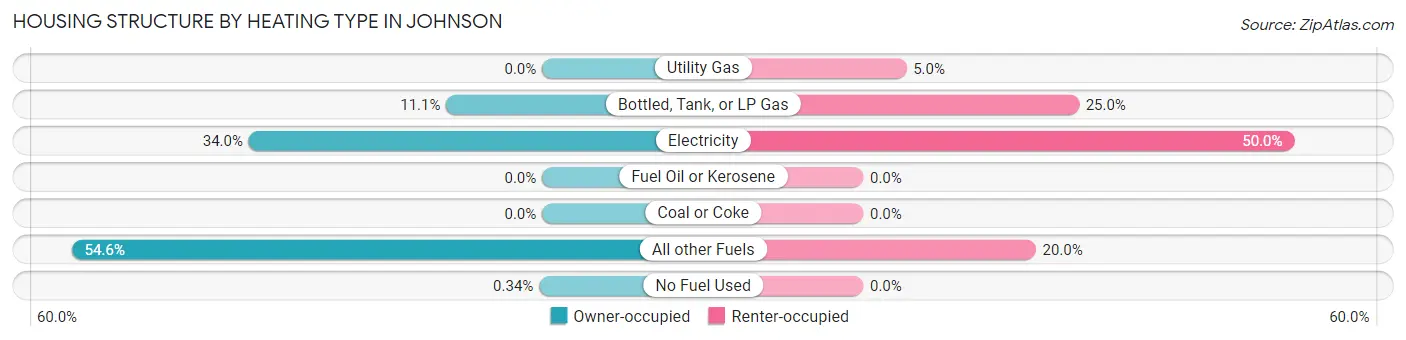
| Heating Type | Owner-occupied | Renter-occupied |
| Utility Gas | 0 (0.0%) | 1 (5.0%) |
| Bottled, Tank, or LP Gas | 33 (11.1%) | 5 (25.0%) |
| Electricity | 101 (34.0%) | 10 (50.0%) |
| Fuel Oil or Kerosene | 0 (0.0%) | 0 (0.0%) |
| Coal or Coke | 0 (0.0%) | 0 (0.0%) |
| All other Fuels | 162 (54.5%) | 4 (20.0%) |
| No Fuel Used | 1 (0.3%) | 0 (0.0%) |
| Total | 297 (100.0%) | 20 (100.0%) |
Household Vehicle Usage in Johnson
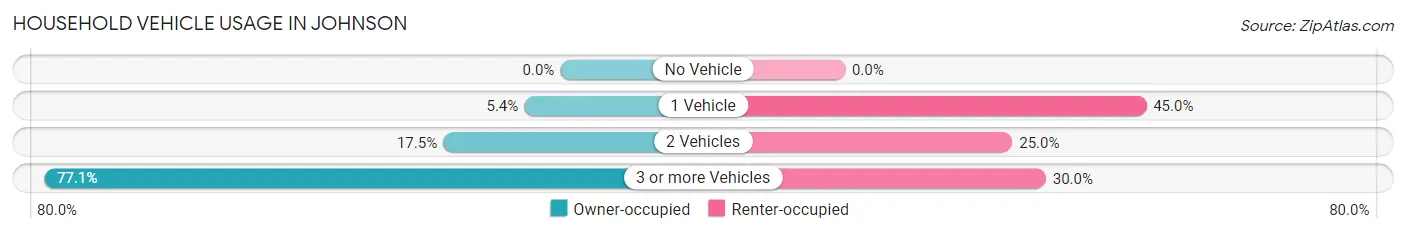
| Vehicles per Household | Owner-occupied | Renter-occupied |
| No Vehicle | 0 (0.0%) | 0 (0.0%) |
| 1 Vehicle | 16 (5.4%) | 9 (45.0%) |
| 2 Vehicles | 52 (17.5%) | 5 (25.0%) |
| 3 or more Vehicles | 229 (77.1%) | 6 (30.0%) |
| Total | 297 (100.0%) | 20 (100.0%) |
Real Estate & Mortgages in Johnson
Real Estate and Mortgage Overview in Johnson
| Characteristic | Without Mortgage | With Mortgage |
| Housing Units | 233 | 64 |
| Median Property Value | $158,600 | $161,800 |
| Median Household Income | $44,280 | $2 |
| Monthly Housing Costs | $625 | $0 |
| Real Estate Taxes | $2,254 | $1 |
Property Value by Mortgage Status in Johnson
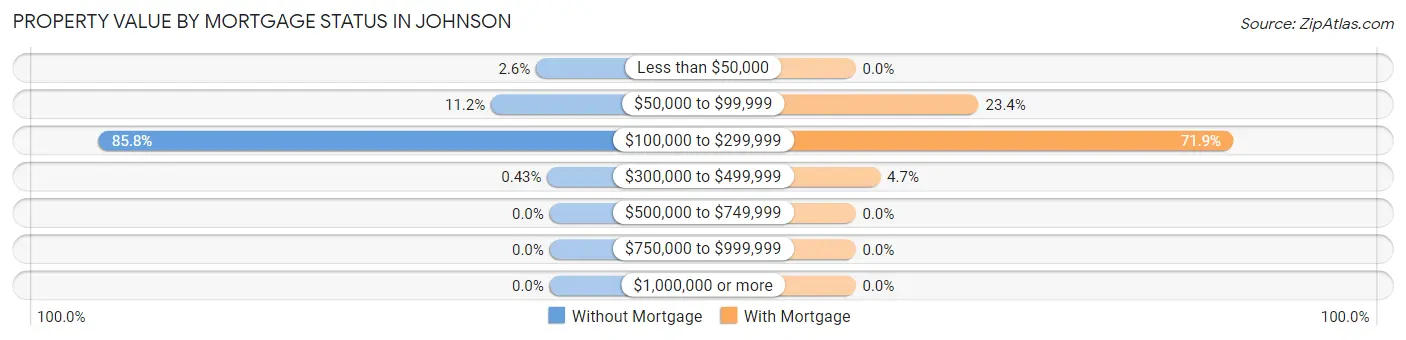
| Property Value | Without Mortgage | With Mortgage |
| Less than $50,000 | 6 (2.6%) | 0 (0.0%) |
| $50,000 to $99,999 | 26 (11.2%) | 15 (23.4%) |
| $100,000 to $299,999 | 200 (85.8%) | 46 (71.9%) |
| $300,000 to $499,999 | 1 (0.4%) | 3 (4.7%) |
| $500,000 to $749,999 | 0 (0.0%) | 0 (0.0%) |
| $750,000 to $999,999 | 0 (0.0%) | 0 (0.0%) |
| $1,000,000 or more | 0 (0.0%) | 0 (0.0%) |
| Total | 233 (100.0%) | 64 (100.0%) |
Household Income by Mortgage Status in Johnson
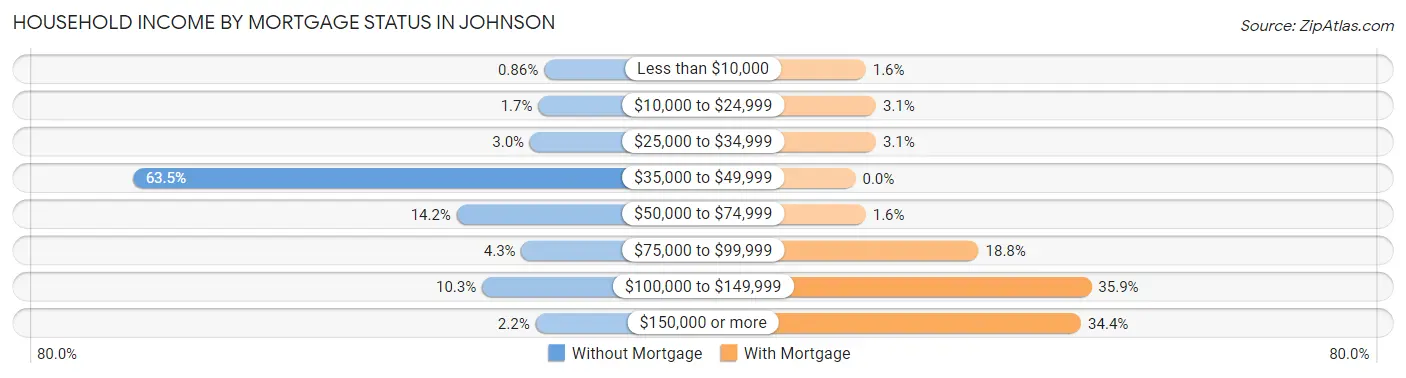
| Household Income | Without Mortgage | With Mortgage |
| Less than $10,000 | 2 (0.9%) | 1 (1.6%) |
| $10,000 to $24,999 | 4 (1.7%) | 2 (3.1%) |
| $25,000 to $34,999 | 7 (3.0%) | 2 (3.1%) |
| $35,000 to $49,999 | 148 (63.5%) | 0 (0.0%) |
| $50,000 to $74,999 | 33 (14.2%) | 1 (1.6%) |
| $75,000 to $99,999 | 10 (4.3%) | 12 (18.8%) |
| $100,000 to $149,999 | 24 (10.3%) | 23 (35.9%) |
| $150,000 or more | 5 (2.1%) | 22 (34.4%) |
| Total | 233 (100.0%) | 64 (100.0%) |
Property Value to Household Income Ratio in Johnson
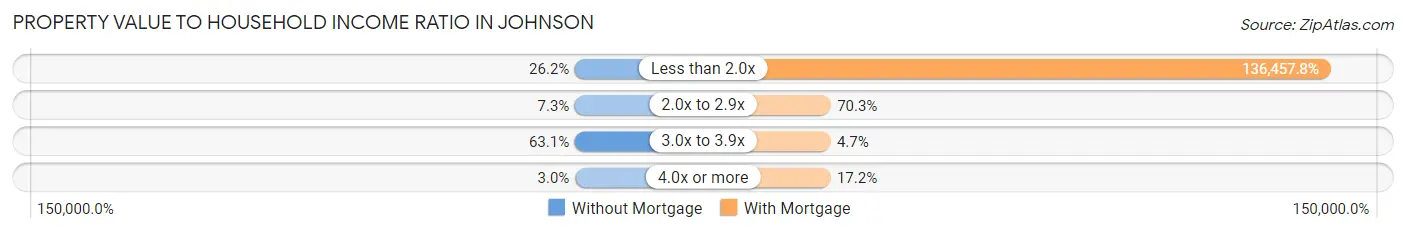
| Value-to-Income Ratio | Without Mortgage | With Mortgage |
| Less than 2.0x | 61 (26.2%) | 87,333 (136,457.8%) |
| 2.0x to 2.9x | 17 (7.3%) | 45 (70.3%) |
| 3.0x to 3.9x | 147 (63.1%) | 3 (4.7%) |
| 4.0x or more | 7 (3.0%) | 11 (17.2%) |
| Total | 233 (100.0%) | 64 (100.0%) |
Real Estate Taxes by Mortgage Status in Johnson
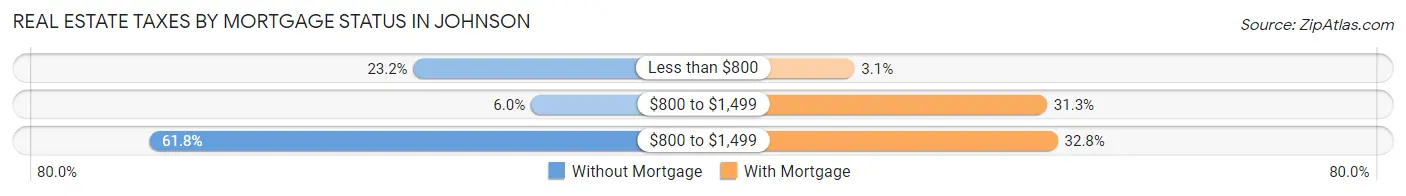
| Property Taxes | Without Mortgage | With Mortgage |
| Less than $800 | 54 (23.2%) | 2 (3.1%) |
| $800 to $1,499 | 14 (6.0%) | 20 (31.2%) |
| $800 to $1,499 | 144 (61.8%) | 21 (32.8%) |
| Total | 233 (100.0%) | 64 (100.0%) |
Health & Disability in Johnson
Health Insurance Coverage by Age in Johnson
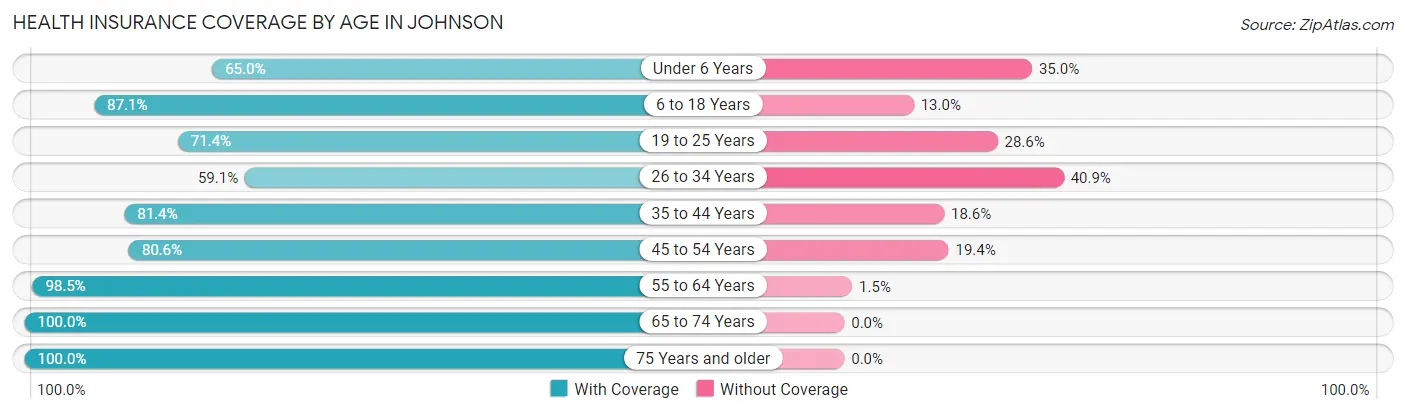
| Age Bracket | With Coverage | Without Coverage |
| Under 6 Years | 13 (65.0%) | 7 (35.0%) |
| 6 to 18 Years | 121 (87.1%) | 18 (13.0%) |
| 19 to 25 Years | 35 (71.4%) | 14 (28.6%) |
| 26 to 34 Years | 26 (59.1%) | 18 (40.9%) |
| 35 to 44 Years | 70 (81.4%) | 16 (18.6%) |
| 45 to 54 Years | 29 (80.6%) | 7 (19.4%) |
| 55 to 64 Years | 134 (98.5%) | 2 (1.5%) |
| 65 to 74 Years | 56 (100.0%) | 0 (0.0%) |
| 75 Years and older | 166 (100.0%) | 0 (0.0%) |
| Total | 650 (88.8%) | 82 (11.2%) |
Health Insurance Coverage by Citizenship Status in Johnson
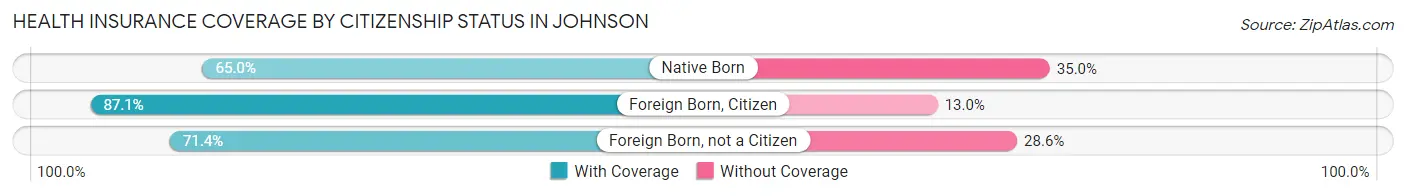
| Citizenship Status | With Coverage | Without Coverage |
| Native Born | 13 (65.0%) | 7 (35.0%) |
| Foreign Born, Citizen | 121 (87.1%) | 18 (13.0%) |
| Foreign Born, not a Citizen | 35 (71.4%) | 14 (28.6%) |
Health Insurance Coverage by Household Income in Johnson
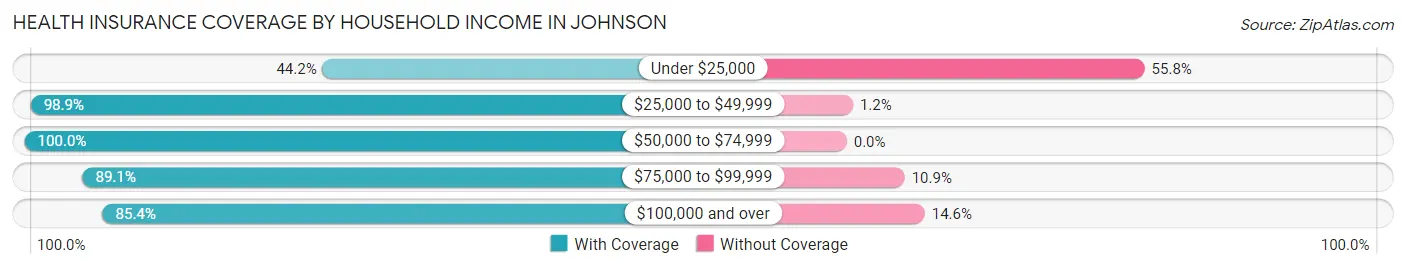
| Household Income | With Coverage | Without Coverage |
| Under $25,000 | 19 (44.2%) | 24 (55.8%) |
| $25,000 to $49,999 | 172 (98.9%) | 2 (1.1%) |
| $50,000 to $74,999 | 87 (100.0%) | 0 (0.0%) |
| $75,000 to $99,999 | 156 (89.1%) | 19 (10.9%) |
| $100,000 and over | 216 (85.4%) | 37 (14.6%) |
Public vs Private Health Insurance Coverage by Age in Johnson
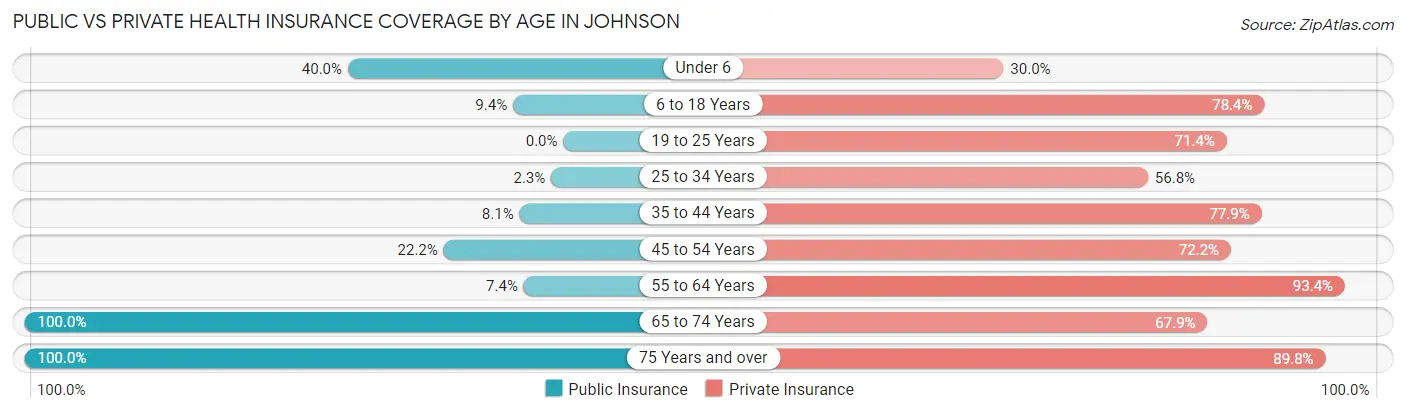
| Age Bracket | Public Insurance | Private Insurance |
| Under 6 | 8 (40.0%) | 6 (30.0%) |
| 6 to 18 Years | 13 (9.3%) | 109 (78.4%) |
| 19 to 25 Years | 0 (0.0%) | 35 (71.4%) |
| 25 to 34 Years | 1 (2.3%) | 25 (56.8%) |
| 35 to 44 Years | 7 (8.1%) | 67 (77.9%) |
| 45 to 54 Years | 8 (22.2%) | 26 (72.2%) |
| 55 to 64 Years | 10 (7.3%) | 127 (93.4%) |
| 65 to 74 Years | 56 (100.0%) | 38 (67.9%) |
| 75 Years and over | 166 (100.0%) | 149 (89.8%) |
| Total | 269 (36.7%) | 582 (79.5%) |
Disability Status by Sex by Age in Johnson
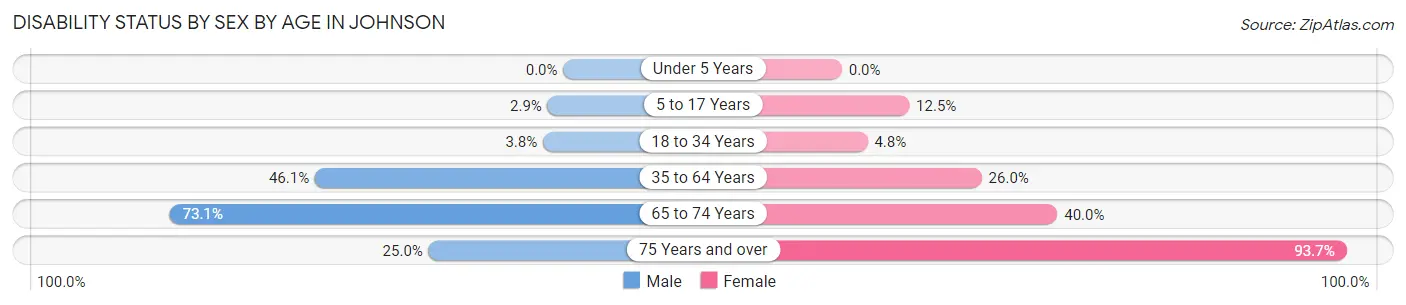
| Age Bracket | Male | Female |
| Under 5 Years | 0 (0.0%) | 0 (0.0%) |
| 5 to 17 Years | 3 (2.9%) | 5 (12.5%) |
| 18 to 34 Years | 2 (3.8%) | 2 (4.8%) |
| 35 to 64 Years | 71 (46.1%) | 27 (26.0%) |
| 65 to 74 Years | 19 (73.1%) | 12 (40.0%) |
| 75 Years and over | 2 (25.0%) | 148 (93.7%) |
Disability Class by Sex by Age in Johnson
Disability Class: Hearing Difficulty
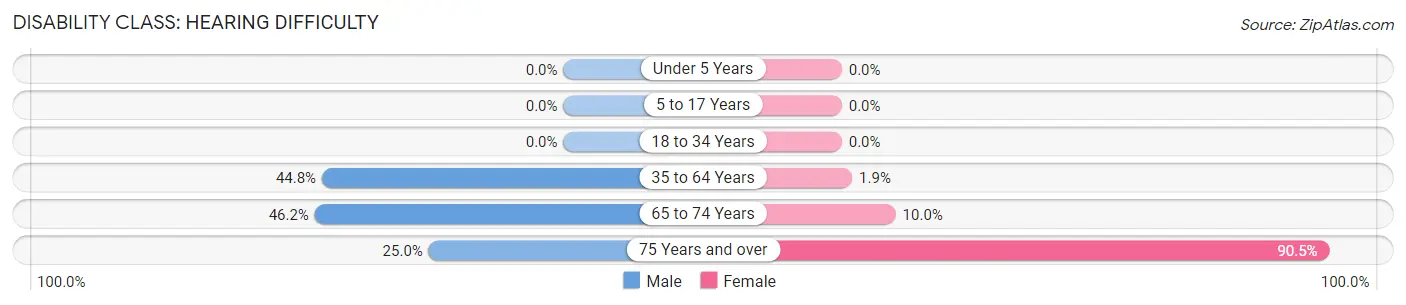
| Age Bracket | Male | Female |
| Under 5 Years | 0 (0.0%) | 0 (0.0%) |
| 5 to 17 Years | 0 (0.0%) | 0 (0.0%) |
| 18 to 34 Years | 0 (0.0%) | 0 (0.0%) |
| 35 to 64 Years | 69 (44.8%) | 2 (1.9%) |
| 65 to 74 Years | 12 (46.2%) | 3 (10.0%) |
| 75 Years and over | 2 (25.0%) | 143 (90.5%) |
Disability Class: Vision Difficulty
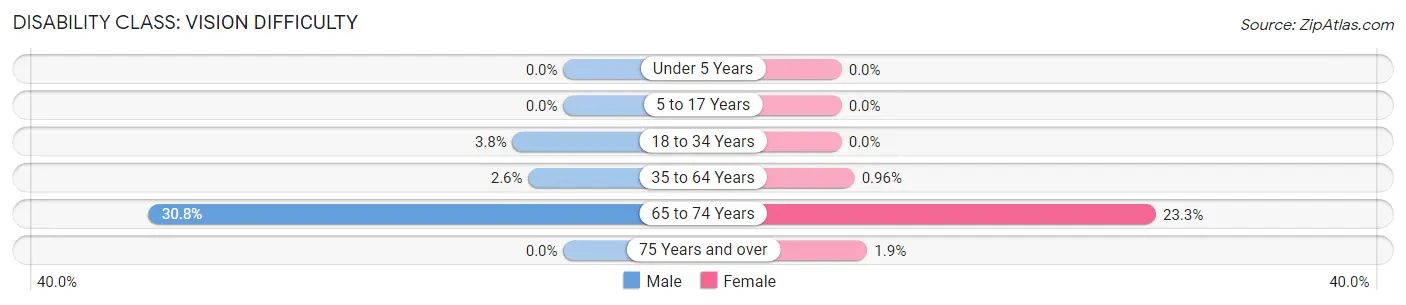
| Age Bracket | Male | Female |
| Under 5 Years | 0 (0.0%) | 0 (0.0%) |
| 5 to 17 Years | 0 (0.0%) | 0 (0.0%) |
| 18 to 34 Years | 2 (3.8%) | 0 (0.0%) |
| 35 to 64 Years | 4 (2.6%) | 1 (1.0%) |
| 65 to 74 Years | 8 (30.8%) | 7 (23.3%) |
| 75 Years and over | 0 (0.0%) | 3 (1.9%) |
Disability Class: Cognitive Difficulty
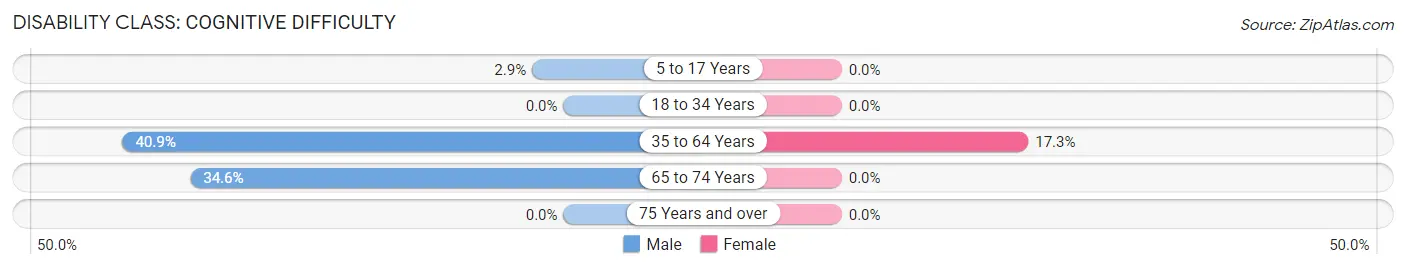
| Age Bracket | Male | Female |
| 5 to 17 Years | 3 (2.9%) | 0 (0.0%) |
| 18 to 34 Years | 0 (0.0%) | 0 (0.0%) |
| 35 to 64 Years | 63 (40.9%) | 18 (17.3%) |
| 65 to 74 Years | 9 (34.6%) | 0 (0.0%) |
| 75 Years and over | 0 (0.0%) | 0 (0.0%) |
Disability Class: Ambulatory Difficulty
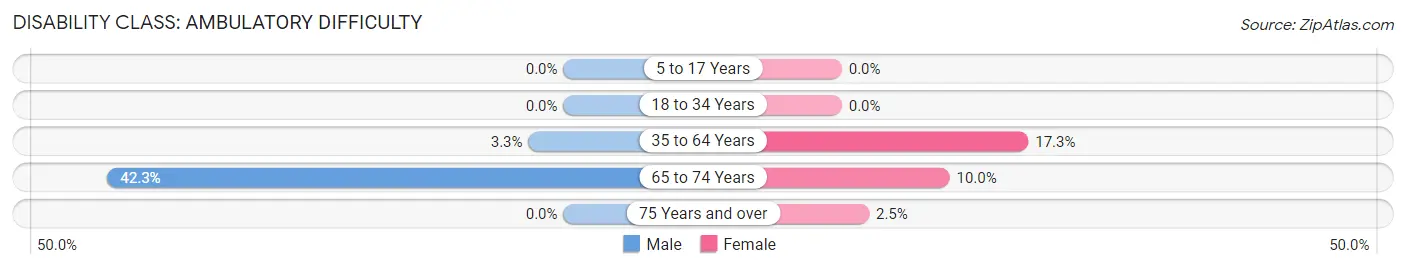
| Age Bracket | Male | Female |
| 5 to 17 Years | 0 (0.0%) | 0 (0.0%) |
| 18 to 34 Years | 0 (0.0%) | 0 (0.0%) |
| 35 to 64 Years | 5 (3.3%) | 18 (17.3%) |
| 65 to 74 Years | 11 (42.3%) | 3 (10.0%) |
| 75 Years and over | 0 (0.0%) | 4 (2.5%) |
Disability Class: Self-Care Difficulty
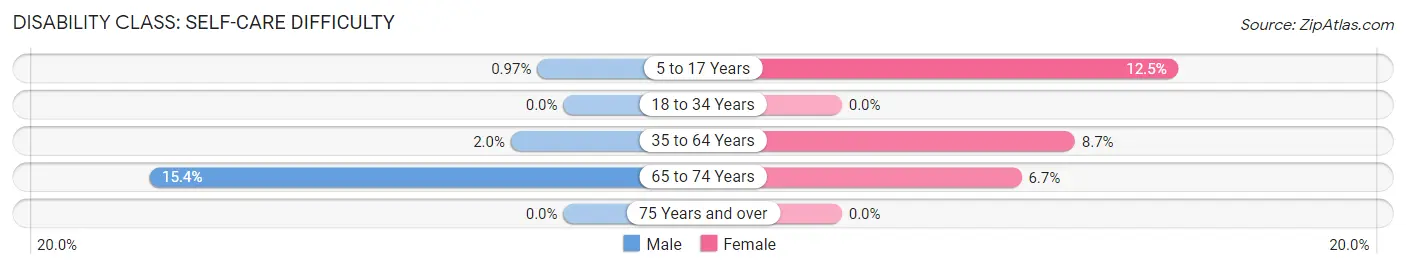
| Age Bracket | Male | Female |
| 5 to 17 Years | 1 (1.0%) | 5 (12.5%) |
| 18 to 34 Years | 0 (0.0%) | 0 (0.0%) |
| 35 to 64 Years | 3 (1.9%) | 9 (8.6%) |
| 65 to 74 Years | 4 (15.4%) | 2 (6.7%) |
| 75 Years and over | 0 (0.0%) | 0 (0.0%) |
Technology Access in Johnson
Computing Device Access in Johnson
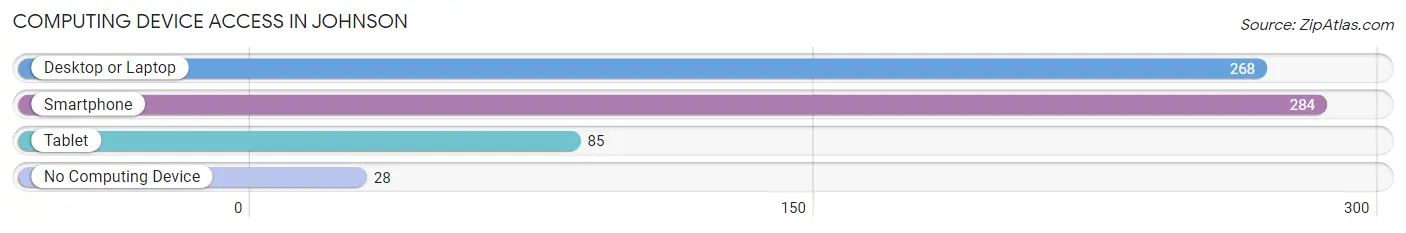
| Device Type | # Households | % Households |
| Desktop or Laptop | 268 | 84.5% |
| Smartphone | 284 | 89.6% |
| Tablet | 85 | 26.8% |
| No Computing Device | 28 | 8.8% |
| Total | 317 | 100.0% |
Internet Access in Johnson
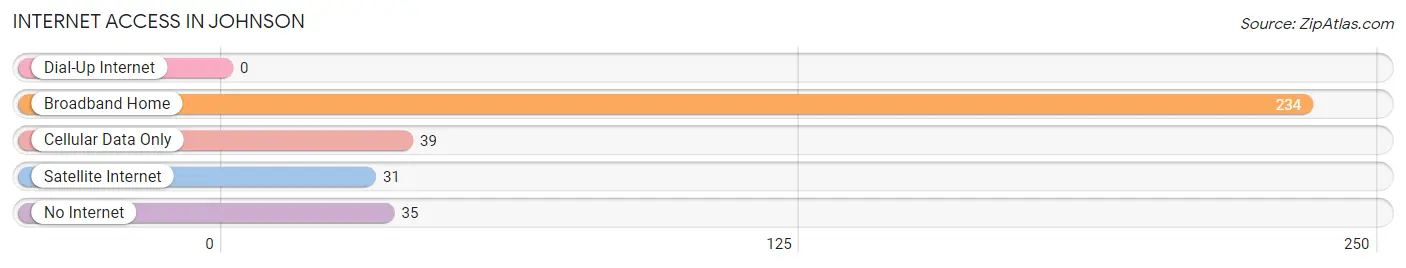
| Internet Type | # Households | % Households |
| Dial-Up Internet | 0 | 0.0% |
| Broadband Home | 234 | 73.8% |
| Cellular Data Only | 39 | 12.3% |
| Satellite Internet | 31 | 9.8% |
| No Internet | 35 | 11.0% |
| Total | 317 | 100.0% |
Johnson Summary
Johnson, Oklahoma is a small town located in the northeastern corner of the state. It is situated in the foothills of the Ozark Mountains and is part of the Ozark Plateau. The town was founded in 1891 and was named after the Johnson family, who were among the first settlers in the area.
Geography
Johnson is located in Adair County, Oklahoma, and is situated in the foothills of the Ozark Mountains. The town is located at the intersection of State Highway 10 and State Highway 28. The town is surrounded by rolling hills and is situated in a valley. The town is located at an elevation of 890 feet above sea level. The climate in Johnson is mild and humid, with average temperatures ranging from the mid-50s in the winter to the mid-80s in the summer.
Economy
The economy of Johnson is largely based on agriculture and tourism. The town is home to several farms, which produce a variety of crops, including corn, soybeans, wheat, and hay. The town is also home to several small businesses, including restaurants, retail stores, and service providers. Tourism is also an important part of the local economy, as the town is located near several popular attractions, including the Ozark National Forest and the Grand Lake of the Cherokees.
Demographics
As of the 2010 census, the population of Johnson was 1,845. The racial makeup of the town was 95.3% White, 0.3% African American, 0.7% Native American, 0.2% Asian, 0.1% Pacific Islander, and 3.4% from other races. The median household income in Johnson was $30,938, and the median family income was $37,813. The per capita income in Johnson was $15,945.
Education
Johnson is served by the Adair County School District, which includes Johnson Elementary School, Johnson Middle School, and Johnson High School. The town is also home to several private schools, including Johnson Christian Academy and Johnson Academy of Arts and Sciences.
Conclusion
Johnson, Oklahoma is a small town located in the northeastern corner of the state. It is situated in the foothills of the Ozark Mountains and is part of the Ozark Plateau. The town was founded in 1891 and was named after the Johnson family, who were among the first settlers in the area. The economy of Johnson is largely based on agriculture and tourism, and the town is home to several small businesses. The population of Johnson was 1,845 as of the 2010 census, and the town is served by the Adair County School District. Johnson is a small town with a rich history and a vibrant economy.
Common Questions
What is Per Capita Income in Johnson?
Per Capita income in Johnson is $26,980.
What is the Median Family Income in Johnson?
Median Family Income in Johnson is $44,722.
What is the Median Household income in Johnson?
Median Household Income in Johnson is $44,748.
What is Income or Wage Gap in Johnson?
Income or Wage Gap in Johnson is 26.8%.
Women in Johnson earn 73.2 cents for every dollar earned by a man.
What is Inequality or Gini Index in Johnson?
Inequality or Gini Index in Johnson is 0.30.
What is the Total Population of Johnson?
Total Population of Johnson is 752.
What is the Total Male Population of Johnson?
Total Male Population of Johnson is 374.
What is the Total Female Population of Johnson?
Total Female Population of Johnson is 378.
What is the Ratio of Males per 100 Females in Johnson?
There are 98.94 Males per 100 Females in Johnson.
What is the Ratio of Females per 100 Males in Johnson?
There are 101.07 Females per 100 Males in Johnson.
What is the Median Population Age in Johnson?
Median Population Age in Johnson is 50.3 Years.
What is the Average Family Size in Johnson
Average Family Size in Johnson is 2.4 People.
What is the Average Household Size in Johnson
Average Household Size in Johnson is 2.4 People.
How Large is the Labor Force in Johnson?
There are 244 People in the Labor Forcein in Johnson.
What is the Percentage of People in the Labor Force in Johnson?
40.0% of People are in the Labor Force in Johnson.
What is the Unemployment Rate in Johnson?
Unemployment Rate in Johnson is 7.6%.