Zip Codes with the Lowest Percentage of Renter-Occupied Units in Oklahoma City, OK

RELATED REPORTS & OPTIONS

Lowest Renter-Occupied
Population
Families and Households
Female Fertility
Female Fertility (Unmarried)
Race (Community Size)
Race (Percentage)
Ancestry (Community Size)
AfricanAlaska NativeAlbanianAmericanApacheArabArapahoArgentineanArmenianAustralianAustrianBahamianBangladeshiBarbadianBasqueBelgianBhutaneseBlackfeetBolivianBrazilianBritishBritish West IndianBulgarianBurmeseCajunCambodianCanadianCelticCentral AmericanCentral American IndianCherokeeCheyenneChickasawChileanChippewaChoctawColombianComancheCreeCreekCroatianCubanCzechCzechoslovakianDanishDelawareDominicanDutchDutch West IndianEastern EuropeanEcuadorianEgyptianEnglishEstonianEthiopianEuropeanFijianFilipinoFinnishFrenchFrench American IndianFrench CanadianGermanGerman RussianGhanaianGreekGuamanian / ChamorroGuatemalanGuyaneseHaitianHonduranHopiHungarianIcelanderIndian (Asian)IndonesianInupiatIranianIraqiIrishIroquoisIsraeliItalianJamaicanJapaneseJordanianKenyanKiowaKoreanLaotianLatvianLebaneseLiberianLithuanianLuxembourgerMalaysianMexicanMexican American IndianMongolianMoroccanNative HawaiianNavajoNew ZealanderNicaraguanNigerianNorthern EuropeanNorwegianOkinawanOsagePakistaniPalestinianPanamanianPennsylvania GermanPeruvianPimaPolishPortuguesePotawatomiPuebloPuerto RicanRomanianRussianSalvadoranSamoanScandinavianScotch-IrishScottishSeminoleSerbianSiouxSlavicSlovakSloveneSouth AfricanSouth AmericanSouth American IndianSpaniardSpanishSpanish American IndianSri LankanSubsaharan AfricanSudaneseSwedishSwissSyrianThaiTlingit-HaidaTonganTrinidadian and TobagonianTurkishU.S. Virgin IslanderUkrainianUruguayanVenezuelanVietnameseWelshWest IndianYugoslavianZimbabwean
Ancestry (Percentage)
AfricanAlaska NativeAlbanianAmericanApacheArabArapahoArgentineanArmenianAustralianAustrianBahamianBangladeshiBarbadianBasqueBelgianBhutaneseBlackfeetBolivianBrazilianBritishBritish West IndianBulgarianBurmeseCajunCambodianCanadianCelticCentral AmericanCentral American IndianCherokeeCheyenneChickasawChileanChippewaChoctawColombianComancheCreeCreekCroatianCubanCzechCzechoslovakianDanishDelawareDominicanDutchDutch West IndianEastern EuropeanEcuadorianEgyptianEnglishEstonianEthiopianEuropeanFijianFilipinoFinnishFrenchFrench American IndianFrench CanadianGermanGerman RussianGhanaianGreekGuamanian / ChamorroGuatemalanGuyaneseHaitianHonduranHopiHungarianIcelanderIndian (Asian)IndonesianInupiatIranianIraqiIrishIroquoisIsraeliItalianJamaicanJapaneseJordanianKenyanKiowaKoreanLaotianLatvianLebaneseLiberianLithuanianLuxembourgerMalaysianMexicanMexican American IndianMongolianMoroccanNative HawaiianNavajoNew ZealanderNicaraguanNigerianNorthern EuropeanNorwegianOkinawanOsagePakistaniPalestinianPanamanianPennsylvania GermanPeruvianPimaPolishPortuguesePotawatomiPuebloPuerto RicanRomanianRussianSalvadoranSamoanScandinavianScotch-IrishScottishSeminoleSerbianSiouxSlavicSlovakSloveneSouth AfricanSouth AmericanSouth American IndianSpaniardSpanishSpanish American IndianSri LankanSubsaharan AfricanSudaneseSwedishSwissSyrianThaiTlingit-HaidaTonganTrinidadian and TobagonianTurkishU.S. Virgin IslanderUkrainianUruguayanVenezuelanVietnameseWelshWest IndianYugoslavianZimbabwean
Immigrant Origin (Total)
AfricaArgentinaAsiaAustraliaAustriaBahamasBangladeshBosnia and HerzegovinaBrazilBulgariaBurma / MyanmarCambodiaCameroonCanadaCaribbeanCentral AmericaChileChinaColombiaCubaDominican RepublicEastern AfricaEastern AsiaEastern EuropeEcuadorEgyptEl SalvadorEnglandEritreaEthiopiaEuropeFranceGermanyGhanaGreeceGuatemalaHondurasHong KongIndiaIndonesiaIranIraqIrelandItalyJamaicaJapanJordanKazakhstanKenyaKoreaKuwaitLaosLatin AmericaLebanonLiberiaMalaysiaMexicoMiddle AfricaMoroccoNepalNetherlandsNicaraguaNigeriaNorthern AfricaNorthern EuropeNorwayOceaniaPakistanPanamaPeruPhilippinesPolandPortugalRussiaSaudi ArabiaScotlandSingaporeSouth AfricaSouth AmericaSouth Central AsiaSouth Eastern AsiaSouthern EuropeSpainSudanSyriaTaiwanThailandTrinidad and TobagoTurkeyUkraineVenezuelaVietnamWestern AfricaWestern AsiaWestern EuropeZaireZimbabwe
Immigrant Origin (Percentage)
AfricaArgentinaAsiaAustraliaAustriaBahamasBangladeshBosnia and HerzegovinaBrazilBulgariaBurma / MyanmarCambodiaCameroonCanadaCaribbeanCentral AmericaChileChinaColombiaCubaDominican RepublicEastern AfricaEastern AsiaEastern EuropeEcuadorEgyptEl SalvadorEnglandEritreaEthiopiaEuropeFranceGermanyGhanaGreeceGuatemalaHondurasHong KongIndiaIndonesiaIranIraqIrelandItalyJamaicaJapanJordanKazakhstanKenyaKoreaKuwaitLaosLatin AmericaLebanonLiberiaMalaysiaMexicoMiddle AfricaMoroccoNepalNetherlandsNicaraguaNigeriaNorthern AfricaNorthern EuropeNorwayOceaniaPakistanPanamaPeruPhilippinesPolandPortugalRussiaSaudi ArabiaScotlandSingaporeSouth AfricaSouth AmericaSouth Central AsiaSouth Eastern AsiaSouthern EuropeSpainSudanSyriaTaiwanThailandTrinidad and TobagoTurkeyUkraineVenezuelaVietnamWestern AfricaWestern AsiaWestern EuropeZaireZimbabwe
Income
Income (Families)
Income (Households)
Poverty
Poverty (Families)
Unemployment
Employment Occupations
Employment Industries
Employer Class
Commute Time
Commute Means
School Enrollment
Education by Degree Field
Occupancy
Finances
Physical Characteristics
Oklahoma City
Compare Zip Codes
Comparison Subject

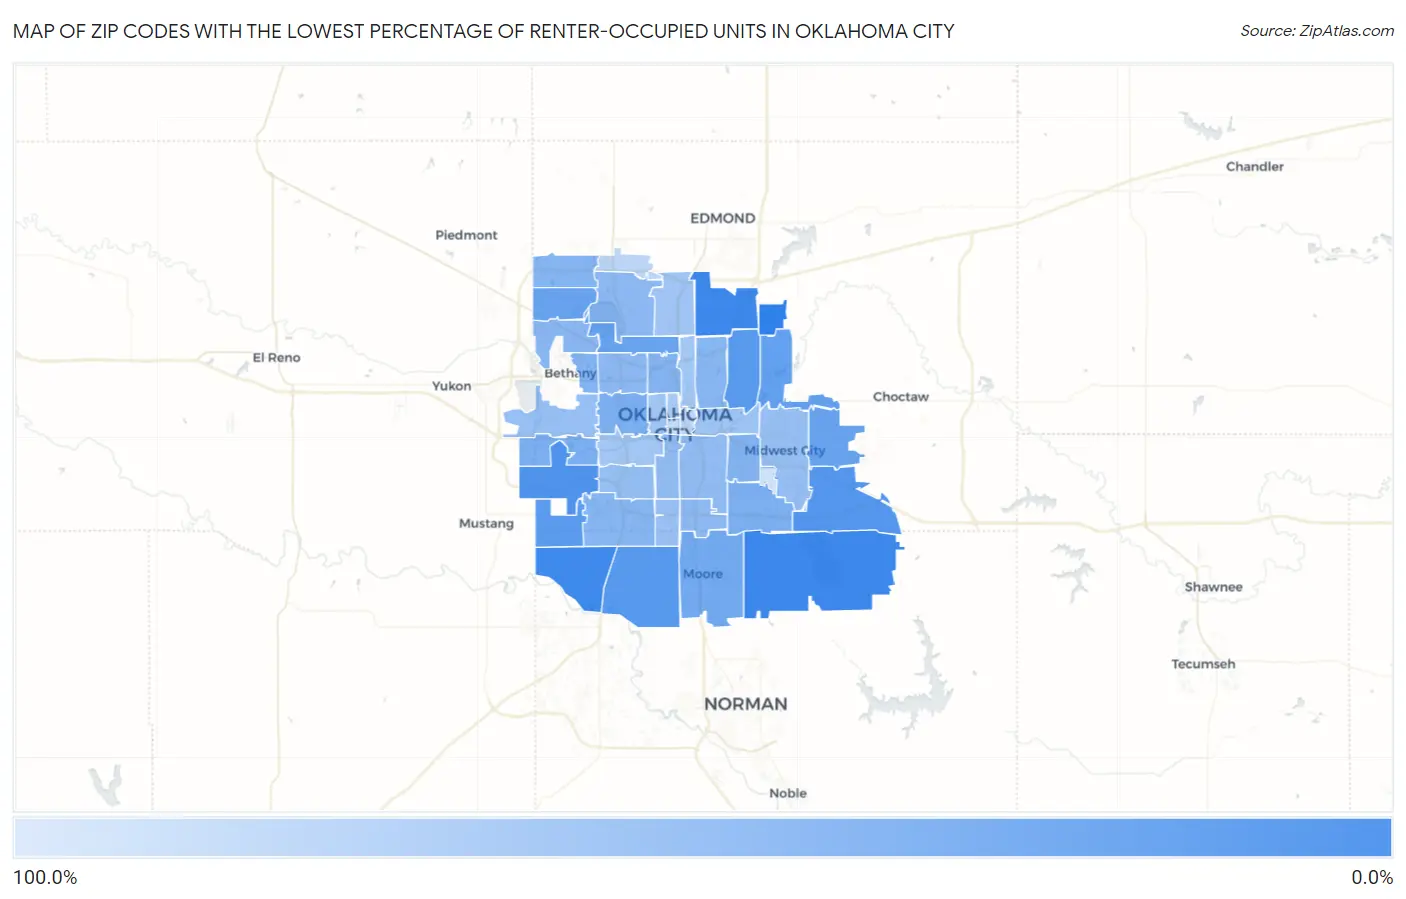
Map of Zip Codes with the Lowest Percentage of Renter-Occupied Units in Oklahoma City

100.0%
0.0%
Zip Codes with the Lowest Percentage of Renter-Occupied Units in Oklahoma City Map

Zip Codes with the Lowest Percentage of Renter-Occupied Units in Oklahoma City, OK

Zip Code % Renter-Occupied vs State vs National
1.731655.1%34.1%(-29.0)#535.2%(-30.1)#1,059
2.731315.5%34.1%(-28.6)#735.2%(-29.7)#1,213
3.731736.8%34.1%(-27.3)#1835.2%(-28.4)#1,806
4.7317915.1%34.1%(-19.0)#12935.2%(-20.1)#8,070
5.7315017.2%34.1%(-16.9)#16735.2%(-18.0)#10,092
6.7317018.8%34.1%(-15.3)#21035.2%(-16.4)#11,692
7.7312118.8%34.1%(-15.3)#21235.2%(-16.4)#11,734
8.7316920.2%34.1%(-13.9)#24935.2%(-15.0)#13,085
9.7314123.8%34.1%(-10.3)#32535.2%(-11.4)#16,361
10.7316227.5%34.1%(-6.53)#41735.2%(-7.65)#19,390
11.7313027.7%34.1%(-6.39)#41935.2%(-7.52)#19,481
12.7311628.2%34.1%(-5.90)#42535.2%(-7.02)#19,816
13.7316033.4%34.1%(-0.618)#50135.2%(-1.74)#23,013
14.7312837.6%34.1%(+3.58)#53235.2%(+2.45)#24,879
15.7310738.7%34.1%(+4.65)#54035.2%(+3.53)#25,285
16.7313539.9%34.1%(+5.81)#54635.2%(+4.69)#25,656
17.7311542.2%34.1%(+8.10)#56035.2%(+6.98)#26,306
18.7312242.6%34.1%(+8.53)#56435.2%(+7.41)#26,409
19.7311843.0%34.1%(+8.97)#56535.2%(+7.85)#26,535
20.7314243.3%34.1%(+9.24)#56735.2%(+8.12)#26,606
21.7311144.8%34.1%(+10.8)#57535.2%(+9.66)#27,004
22.7315945.4%34.1%(+11.3)#57935.2%(+10.2)#27,128
23.7313247.2%34.1%(+13.2)#58535.2%(+12.1)#27,507
24.7312047.9%34.1%(+13.8)#58735.2%(+12.7)#27,635
25.7311248.5%34.1%(+14.4)#59035.2%(+13.3)#27,740
26.7314949.0%34.1%(+14.9)#59335.2%(+13.8)#27,826
27.7312951.3%34.1%(+17.2)#59535.2%(+16.1)#28,220
28.7310951.6%34.1%(+17.5)#59635.2%(+16.4)#28,265
29.7311953.7%34.1%(+19.6)#60335.2%(+18.5)#28,587
30.7312755.6%34.1%(+21.5)#60835.2%(+20.4)#28,850
31.7311056.0%34.1%(+22.0)#60935.2%(+20.8)#28,896
32.7313957.6%34.1%(+23.6)#61235.2%(+22.4)#29,066
33.7311759.6%34.1%(+25.5)#61435.2%(+24.4)#29,254
34.7311462.4%34.1%(+28.4)#61635.2%(+27.3)#29,504
35.7310562.6%34.1%(+28.5)#61735.2%(+27.4)#29,519
36.7310663.4%34.1%(+29.4)#62035.2%(+28.2)#29,584
37.7310863.5%34.1%(+29.5)#62135.2%(+28.3)#29,593
38.7310366.8%34.1%(+32.8)#62535.2%(+31.6)#29,857
39.7313481.5%34.1%(+47.5)#62935.2%(+46.4)#30,470
40.7310483.0%34.1%(+49.0)#63035.2%(+47.8)#30,499
41.7310291.7%34.1%(+57.7)#63135.2%(+56.6)#30,670
42.7314598.7%34.1%(+64.6)#63235.2%(+63.5)#30,767

Common Questions

What are the Top 10 Zip Codes with the Lowest Percentage of Renter-Occupied Units in Oklahoma City, OK?
Top 10 Zip Codes with the Lowest Percentage of Renter-Occupied Units in Oklahoma City, OK are:
#1
0.0%
#2
5.1%
#3
5.5%
#4
6.8%
#5
15.1%
#6
17.2%
#7
18.8%
#8
18.8%
#9
20.2%
#10
23.8%
What zip code has the Lowest Percentage of Renter-Occupied Units in Oklahoma City, OK?
73165 has the Lowest Percentage of Renter-Occupied Units in Oklahoma City, OK with 5.1%.
What is the Percentage of Renter-Occupied Units in Oklahoma City, OK?
Percentage of Renter-Occupied Units in Oklahoma City is 40.5%.
What is the Percentage of Renter-Occupied Units in Oklahoma?
Percentage of Renter-Occupied Units in Oklahoma is 34.1%.
What is the Percentage of Renter-Occupied Units in the United States?
Percentage of Renter-Occupied Units in the United States is 35.2%.