Canadian, OK Map & Demographics
Canadian Map
Canadian Overview
$15,723
PER CAPITA INCOME
$60,750
AVG FAMILY INCOME
$61,250
AVG HOUSEHOLD INCOME
22.0%
WAGE / INCOME GAP [ % ]
78.0¢/ $1
WAGE / INCOME GAP [ $ ]
0.32
INEQUALITY / GINI INDEX
212
TOTAL POPULATION
86
MALE POPULATION
126
FEMALE POPULATION
68.25
MALES / 100 FEMALES
146.51
FEMALES / 100 MALES
25.9
MEDIAN AGE
4.5
AVG FAMILY SIZE
3.7
AVG HOUSEHOLD SIZE
84
LABOR FORCE [ PEOPLE ]
56.0%
PERCENT IN LABOR FORCE
3.6%
UNEMPLOYMENT RATE
Canadian Zip Codes
Canadian Area Codes
Income in Canadian
Income Overview in Canadian
Per Capita Income in Canadian is $15,723, while median incomes of families and households are $60,750 and $61,250 respectively.
| Characteristic | Number | Measure |
| Per Capita Income | 212 | $15,723 |
| Median Family Income | 43 | $60,750 |
| Mean Family Income | 43 | $64,305 |
| Median Household Income | 57 | $61,250 |
| Mean Household Income | 57 | $60,577 |
| Income Deficit | 43 | $0 |
| Wage / Income Gap (%) | 212 | 22.00% |
| Wage / Income Gap ($) | 212 | 78.00¢ per $1 |
| Gini / Inequality Index | 212 | 0.32 |
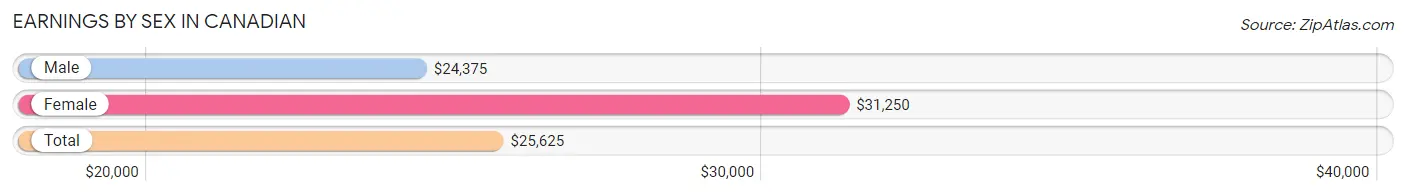
Earnings by Sex in Canadian
Average Earnings in Canadian are $25,625, $24,375 for men and $31,250 for women, a difference of 22.0%.
| Sex | Number | Average Earnings |
| Male | 51 (60.0%) | $24,375 |
| Female | 34 (40.0%) | $31,250 |
| Total | 85 (100.0%) | $25,625 |
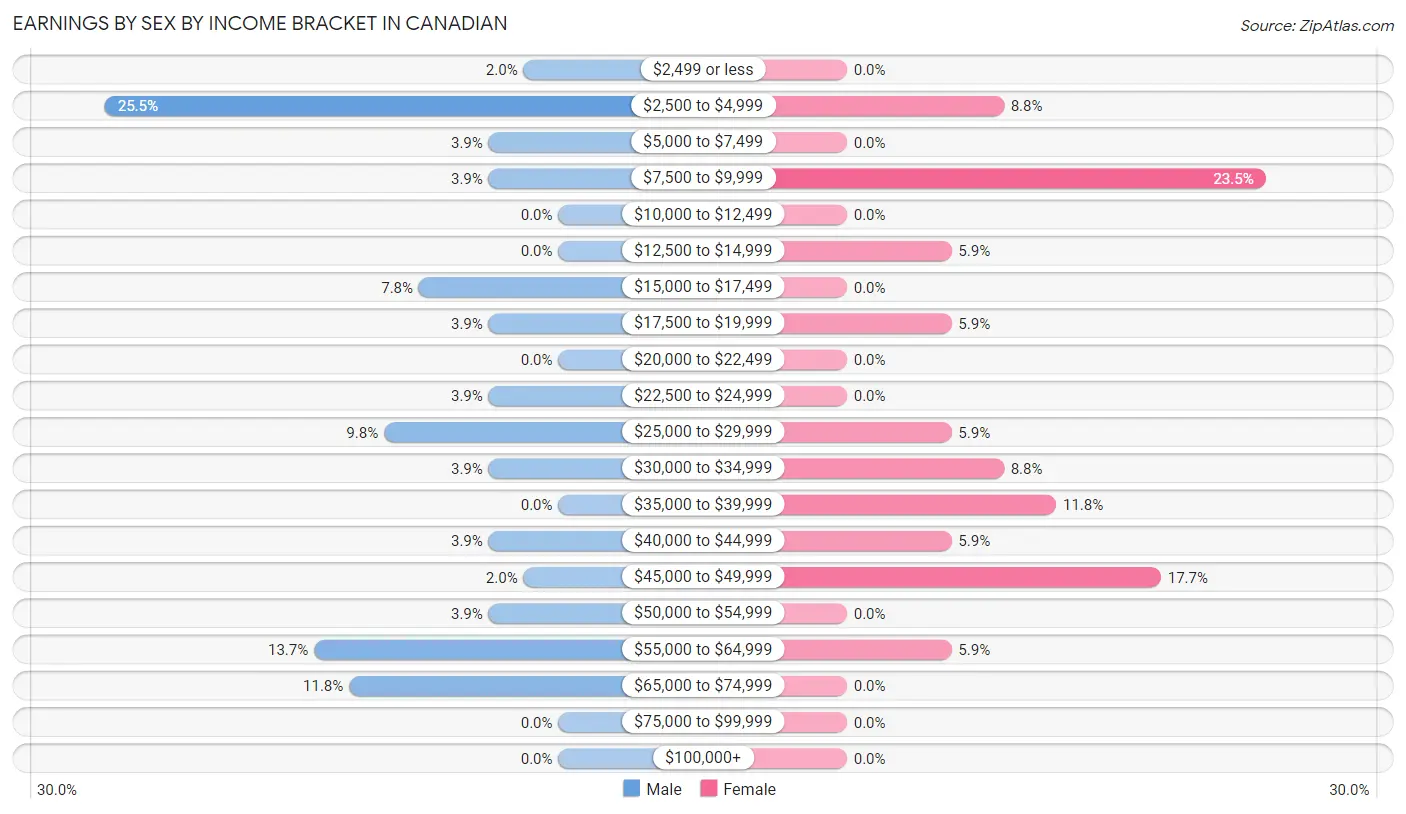
Earnings by Sex by Income Bracket in Canadian
The most common earnings brackets in Canadian are $2,500 to $4,999 for men (13 | 25.5%) and $7,500 to $9,999 for women (8 | 23.5%).
| Income | Male | Female |
| $2,499 or less | 1 (2.0%) | 0 (0.0%) |
| $2,500 to $4,999 | 13 (25.5%) | 3 (8.8%) |
| $5,000 to $7,499 | 2 (3.9%) | 0 (0.0%) |
| $7,500 to $9,999 | 2 (3.9%) | 8 (23.5%) |
| $10,000 to $12,499 | 0 (0.0%) | 0 (0.0%) |
| $12,500 to $14,999 | 0 (0.0%) | 2 (5.9%) |
| $15,000 to $17,499 | 4 (7.8%) | 0 (0.0%) |
| $17,500 to $19,999 | 2 (3.9%) | 2 (5.9%) |
| $20,000 to $22,499 | 0 (0.0%) | 0 (0.0%) |
| $22,500 to $24,999 | 2 (3.9%) | 0 (0.0%) |
| $25,000 to $29,999 | 5 (9.8%) | 2 (5.9%) |
| $30,000 to $34,999 | 2 (3.9%) | 3 (8.8%) |
| $35,000 to $39,999 | 0 (0.0%) | 4 (11.8%) |
| $40,000 to $44,999 | 2 (3.9%) | 2 (5.9%) |
| $45,000 to $49,999 | 1 (2.0%) | 6 (17.6%) |
| $50,000 to $54,999 | 2 (3.9%) | 0 (0.0%) |
| $55,000 to $64,999 | 7 (13.7%) | 2 (5.9%) |
| $65,000 to $74,999 | 6 (11.8%) | 0 (0.0%) |
| $75,000 to $99,999 | 0 (0.0%) | 0 (0.0%) |
| $100,000+ | 0 (0.0%) | 0 (0.0%) |
| Total | 51 (100.0%) | 34 (100.0%) |
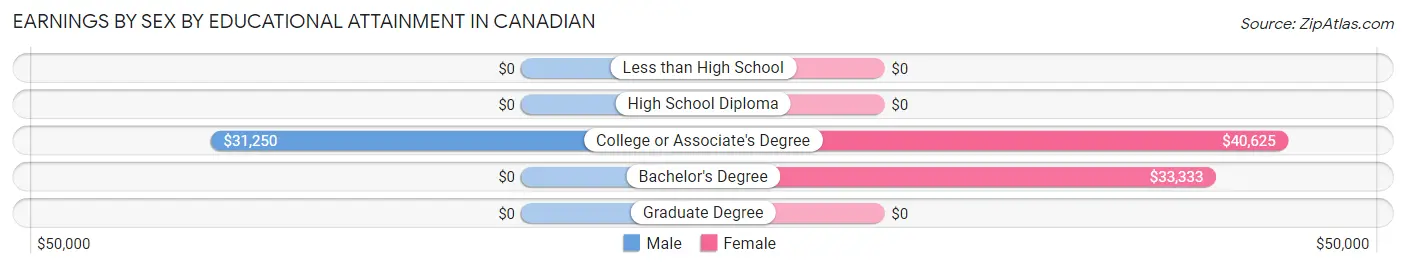
Earnings by Sex by Educational Attainment in Canadian
| Educational Attainment | Male Income | Female Income |
| Less than High School | - | - |
| High School Diploma | - | - |
| College or Associate's Degree | $31,250 | $40,625 |
| Bachelor's Degree | - | - |
| Graduate Degree | - | - |
| Total | - | - |
Family Income in Canadian
Family Income Brackets in Canadian
According to the Canadian family income data, there are 19 families falling into the $50,000 to $74,999 income range, which is the most common income bracket and makes up 44.2% of all families.
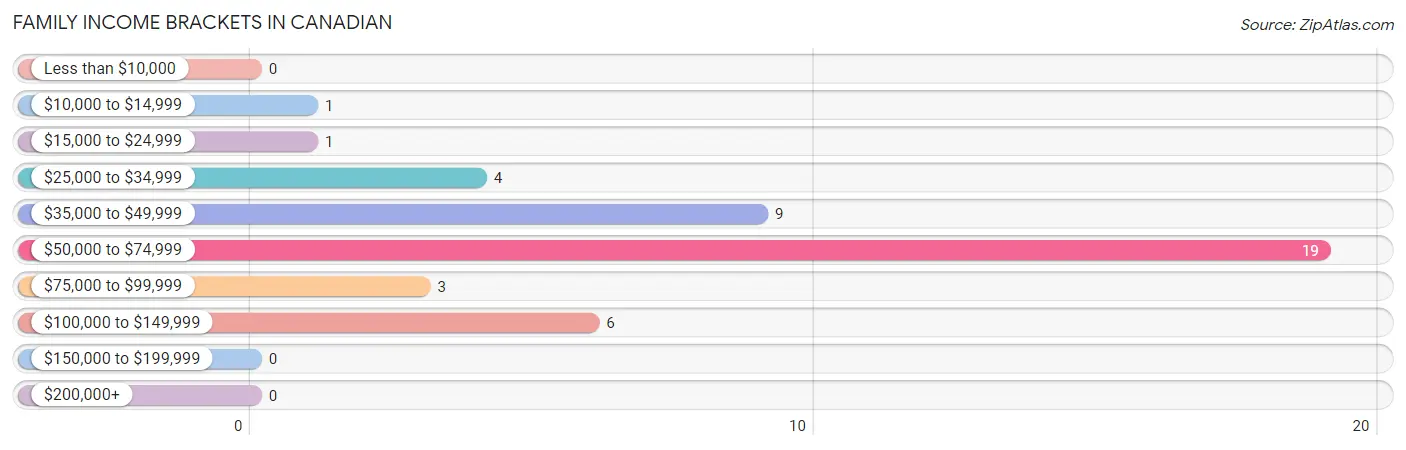
| Income Bracket | # Families | % Families |
| Less than $10,000 | 0 | 0.0% |
| $10,000 to $14,999 | 1 | 2.3% |
| $15,000 to $24,999 | 1 | 2.3% |
| $25,000 to $34,999 | 4 | 9.3% |
| $35,000 to $49,999 | 9 | 20.9% |
| $50,000 to $74,999 | 19 | 44.2% |
| $75,000 to $99,999 | 3 | 7.0% |
| $100,000 to $149,999 | 6 | 14.0% |
| $150,000 to $199,999 | 0 | 0.0% |
| $200,000+ | 0 | 0.0% |
Family Income by Famaliy Size in Canadian
3-person families (13 | 30.2%) account for the highest median family income in Canadian with $63,750 per family, while 2-person families (22 | 51.2%) have the highest median income of $30,500 per family member.
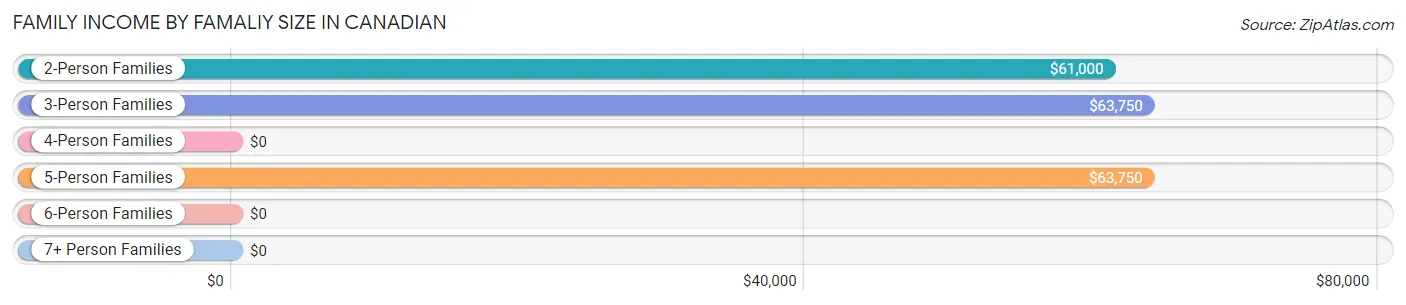
| Income Bracket | # Families | Median Income |
| 2-Person Families | 22 (51.2%) | $61,000 |
| 3-Person Families | 13 (30.2%) | $63,750 |
| 4-Person Families | 0 (0.0%) | $0 |
| 5-Person Families | 4 (9.3%) | $63,750 |
| 6-Person Families | 2 (4.6%) | $0 |
| 7+ Person Families | 2 (4.6%) | $0 |
| Total | 43 (100.0%) | $60,750 |
Family Income by Number of Earners in Canadian
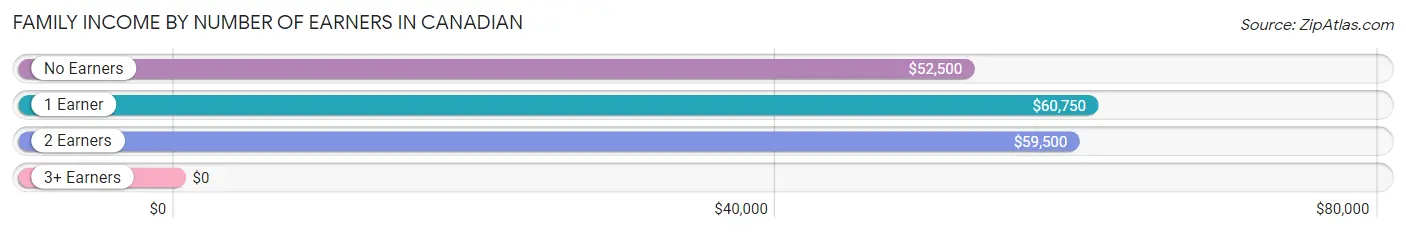
| Number of Earners | # Families | Median Income |
| No Earners | 6 (14.0%) | $52,500 |
| 1 Earner | 15 (34.9%) | $60,750 |
| 2 Earners | 20 (46.5%) | $59,500 |
| 3+ Earners | 2 (4.6%) | $0 |
| Total | 43 (100.0%) | $60,750 |
Household Income in Canadian
Household Income Brackets in Canadian
With 20 households falling in the category, the $50,000 to $74,999 income range is the most frequent in Canadian, accounting for 35.1% of all households.
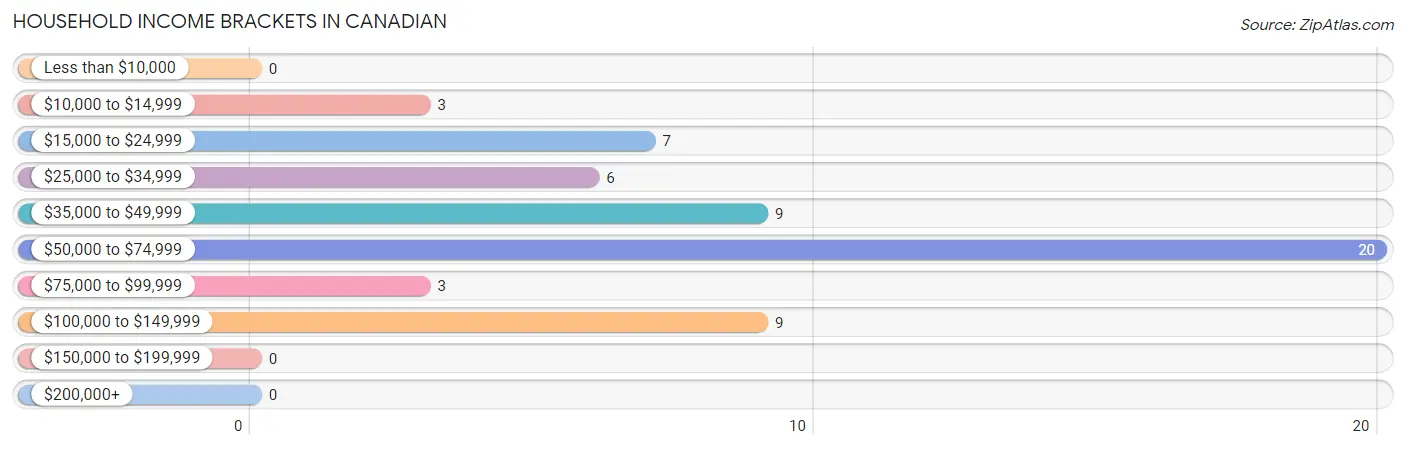
| Income Bracket | # Households | % Households |
| Less than $10,000 | 0 | 0.0% |
| $10,000 to $14,999 | 3 | 5.3% |
| $15,000 to $24,999 | 7 | 12.3% |
| $25,000 to $34,999 | 6 | 10.5% |
| $35,000 to $49,999 | 9 | 15.8% |
| $50,000 to $74,999 | 20 | 35.1% |
| $75,000 to $99,999 | 3 | 5.3% |
| $100,000 to $149,999 | 9 | 15.8% |
| $150,000 to $199,999 | 0 | 0.0% |
| $200,000+ | 0 | 0.0% |
Household Income by Householder Age in Canadian
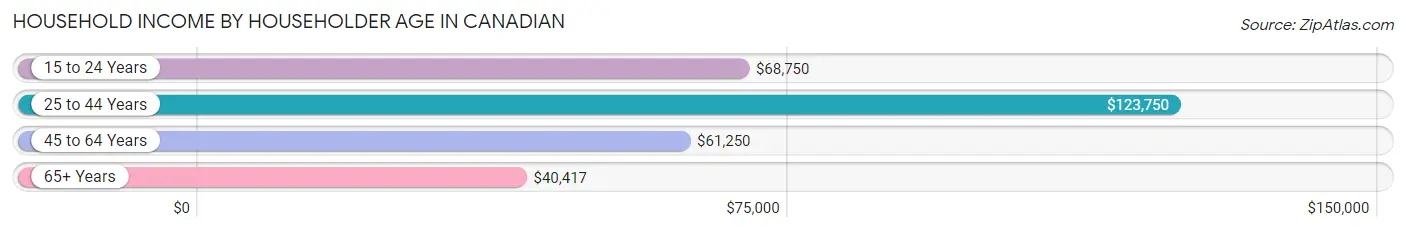
The median household income in Canadian is $61,250, with the highest median household income of $123,750 found in the 25 to 44 years age bracket for the primary householder. A total of 12 households (21.0%) fall into this category. Meanwhile, the 65+ years age bracket for the primary householder has the lowest median household income of $40,417, with 15 households (26.3%) in this group.
| Income Bracket | # Households | Median Income |
| 15 to 24 Years | 7 (12.3%) | $68,750 |
| 25 to 44 Years | 12 (21.0%) | $123,750 |
| 45 to 64 Years | 23 (40.4%) | $61,250 |
| 65+ Years | 15 (26.3%) | $40,417 |
| Total | 57 (100.0%) | $61,250 |
Poverty in Canadian
Income Below Poverty by Sex and Age in Canadian
With 7.0% poverty level for males and 11.1% for females among the residents of Canadian, 6 to 11 year old males and 12 to 14 year old females are the most vulnerable to poverty, with 2 males (66.7%) and 4 females (50.0%) in their respective age groups living below the poverty level.
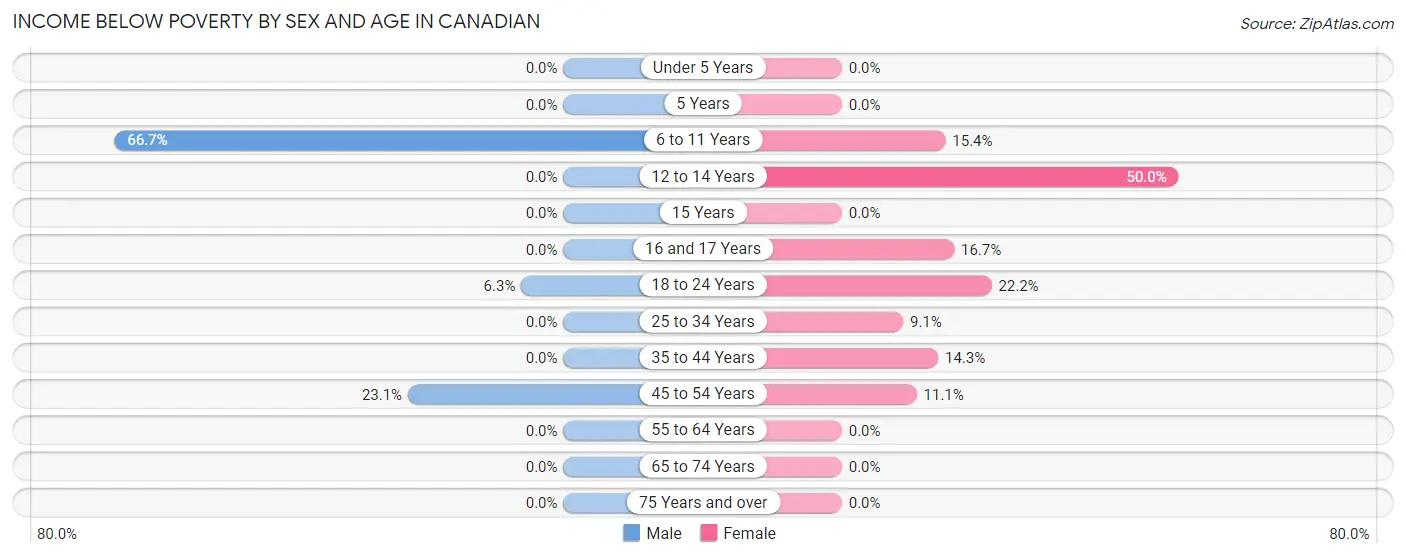
| Age Bracket | Male | Female |
| Under 5 Years | 0 (0.0%) | 0 (0.0%) |
| 5 Years | 0 (0.0%) | 0 (0.0%) |
| 6 to 11 Years | 2 (66.7%) | 2 (15.4%) |
| 12 to 14 Years | 0 (0.0%) | 4 (50.0%) |
| 15 Years | 0 (0.0%) | 0 (0.0%) |
| 16 and 17 Years | 0 (0.0%) | 1 (16.7%) |
| 18 to 24 Years | 1 (6.2%) | 2 (22.2%) |
| 25 to 34 Years | 0 (0.0%) | 2 (9.1%) |
| 35 to 44 Years | 0 (0.0%) | 1 (14.3%) |
| 45 to 54 Years | 3 (23.1%) | 2 (11.1%) |
| 55 to 64 Years | 0 (0.0%) | 0 (0.0%) |
| 65 to 74 Years | 0 (0.0%) | 0 (0.0%) |
| 75 Years and over | 0 (0.0%) | 0 (0.0%) |
| Total | 6 (7.0%) | 14 (11.1%) |
Income Above Poverty by Sex and Age in Canadian
According to the poverty statistics in Canadian, males aged 5 years and females aged under 5 years are the age groups that are most secure financially, with 100.0% of males and 100.0% of females in these age groups living above the poverty line.
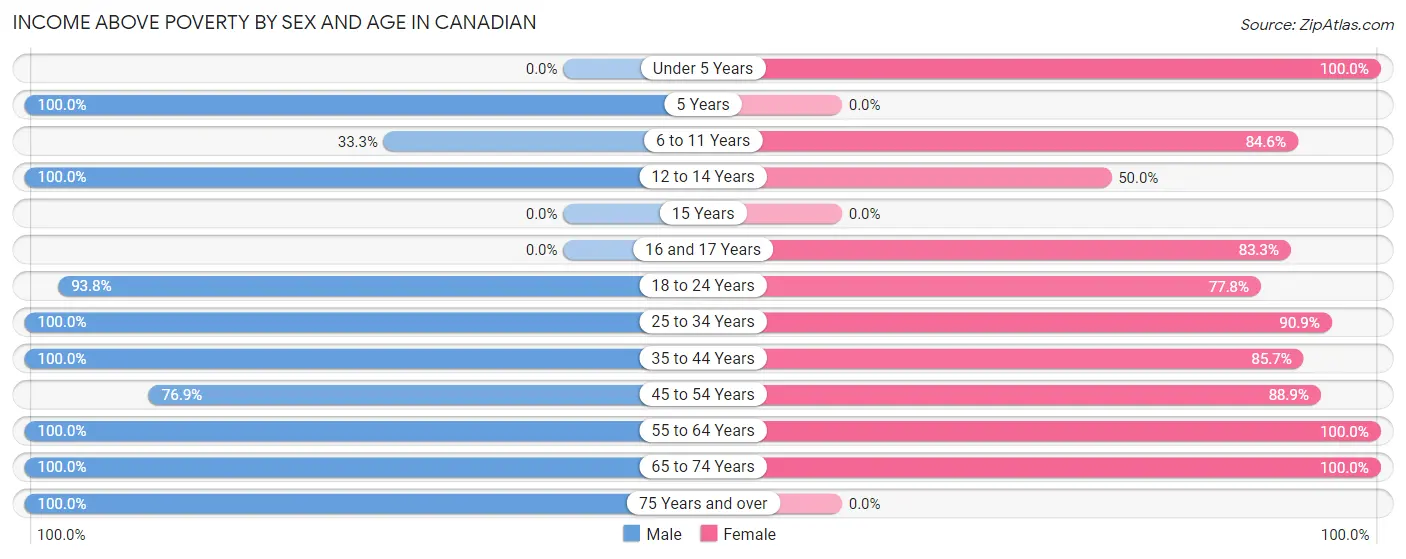
| Age Bracket | Male | Female |
| Under 5 Years | 0 (0.0%) | 22 (100.0%) |
| 5 Years | 10 (100.0%) | 0 (0.0%) |
| 6 to 11 Years | 1 (33.3%) | 11 (84.6%) |
| 12 to 14 Years | 6 (100.0%) | 4 (50.0%) |
| 15 Years | 0 (0.0%) | 0 (0.0%) |
| 16 and 17 Years | 0 (0.0%) | 5 (83.3%) |
| 18 to 24 Years | 15 (93.8%) | 7 (77.8%) |
| 25 to 34 Years | 11 (100.0%) | 20 (90.9%) |
| 35 to 44 Years | 7 (100.0%) | 6 (85.7%) |
| 45 to 54 Years | 10 (76.9%) | 16 (88.9%) |
| 55 to 64 Years | 6 (100.0%) | 10 (100.0%) |
| 65 to 74 Years | 11 (100.0%) | 11 (100.0%) |
| 75 Years and over | 3 (100.0%) | 0 (0.0%) |
| Total | 80 (93.0%) | 112 (88.9%) |
Income Below Poverty Among Married-Couple Families in Canadian
The poverty statistics for married-couple families in Canadian show that 10.7% or 3 of the total 28 families live below the poverty line. Families with 5 or more children have the highest poverty rate of 100.0%, comprising of 2 families. On the other hand, families with 1 or 2 children have the lowest poverty rate of 0.0%, which includes 0 families.
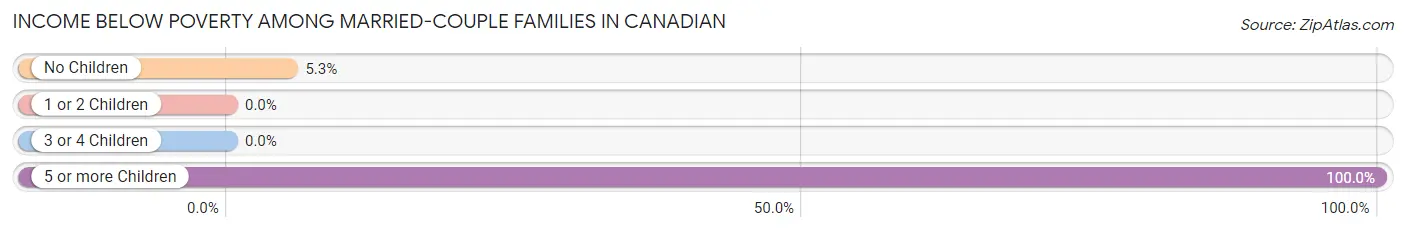
| Children | Above Poverty | Below Poverty |
| No Children | 18 (94.7%) | 1 (5.3%) |
| 1 or 2 Children | 3 (100.0%) | 0 (0.0%) |
| 3 or 4 Children | 4 (100.0%) | 0 (0.0%) |
| 5 or more Children | 0 (0.0%) | 2 (100.0%) |
| Total | 25 (89.3%) | 3 (10.7%) |
Income Below Poverty Among Single-Parent Households in Canadian
| Children | Single Father | Single Mother |
| No Children | 0 (0.0%) | 0 (0.0%) |
| 1 or 2 Children | 0 (0.0%) | 0 (0.0%) |
| 3 or 4 Children | 0 (0.0%) | 0 (0.0%) |
| 5 or more Children | 0 (0.0%) | 0 (0.0%) |
| Total | 0 (0.0%) | 0 (0.0%) |
Income Below Poverty Among Married-Couple vs Single-Parent Households in Canadian
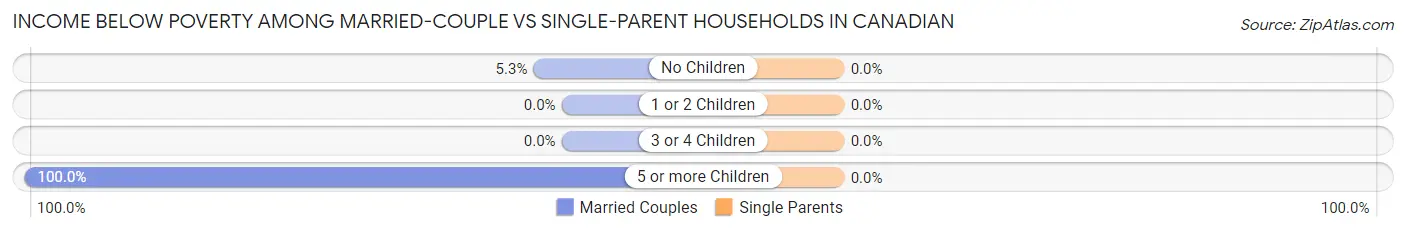
| Children | Married-Couple Families | Single-Parent Households |
| No Children | 1 (5.3%) | 0 (0.0%) |
| 1 or 2 Children | 0 (0.0%) | 0 (0.0%) |
| 3 or 4 Children | 0 (0.0%) | 0 (0.0%) |
| 5 or more Children | 2 (100.0%) | 0 (0.0%) |
| Total | 3 (10.7%) | 0 (0.0%) |
Race in Canadian
The most populous races in Canadian are White / Caucasian (185 | 87.3%), Two or more Races (20 | 9.4%), and Native / Alaskan (7 | 3.3%).
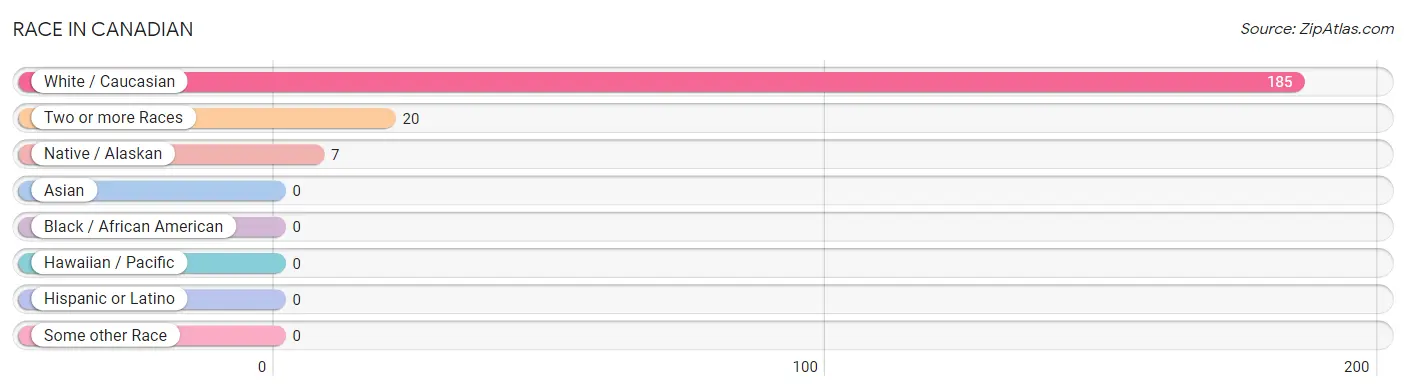
| Race | # Population | % Population |
| Asian | 0 | 0.0% |
| Black / African American | 0 | 0.0% |
| Hawaiian / Pacific | 0 | 0.0% |
| Hispanic or Latino | 0 | 0.0% |
| Native / Alaskan | 7 | 3.3% |
| White / Caucasian | 185 | 87.3% |
| Two or more Races | 20 | 9.4% |
| Some other Race | 0 | 0.0% |
| Total | 212 | 100.0% |
Ancestry in Canadian
The most populous ancestries reported in Canadian are Irish (84 | 39.6%), German (52 | 24.5%), British (44 | 20.7%), Choctaw (13 | 6.1%), and Italian (12 | 5.7%), together accounting for 96.7% of all Canadian residents.
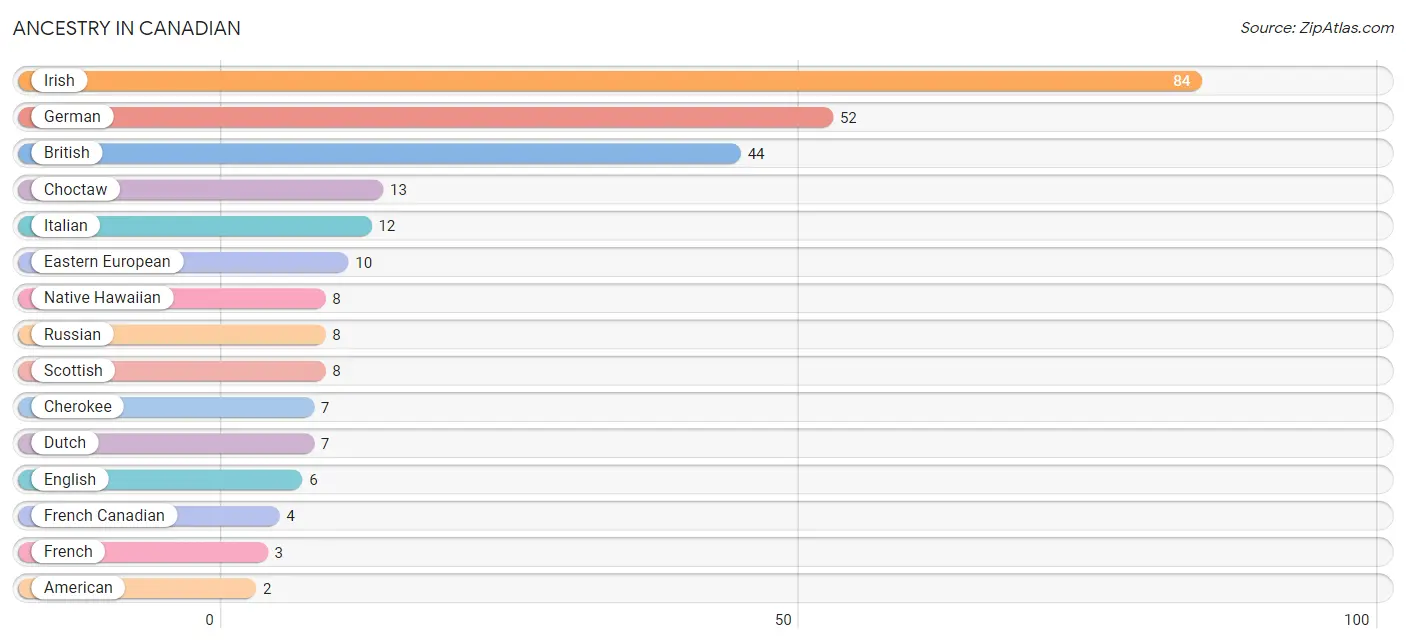
| Ancestry | # Population | % Population |
| American | 2 | 0.9% |
| British | 44 | 20.7% |
| Cherokee | 7 | 3.3% |
| Choctaw | 13 | 6.1% |
| Creek | 1 | 0.5% |
| Dutch | 7 | 3.3% |
| Eastern European | 10 | 4.7% |
| English | 6 | 2.8% |
| French | 3 | 1.4% |
| French Canadian | 4 | 1.9% |
| German | 52 | 24.5% |
| Irish | 84 | 39.6% |
| Italian | 12 | 5.7% |
| Native Hawaiian | 8 | 3.8% |
| Russian | 8 | 3.8% |
| Scotch-Irish | 1 | 0.5% |
| Scottish | 8 | 3.8% | View All 17 Rows |
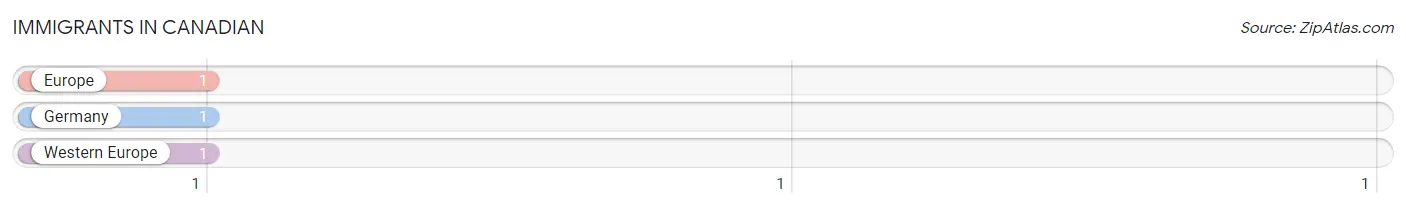
Immigrants in Canadian
The most numerous immigrant groups reported in Canadian came from Europe (1 | 0.5%), Germany (1 | 0.5%), and Western Europe (1 | 0.5%), together accounting for 1.4% of all Canadian residents.
| Immigration Origin | # Population | % Population |
| Europe | 1 | 0.5% |
| Germany | 1 | 0.5% |
| Western Europe | 1 | 0.5% | View All 3 Rows |
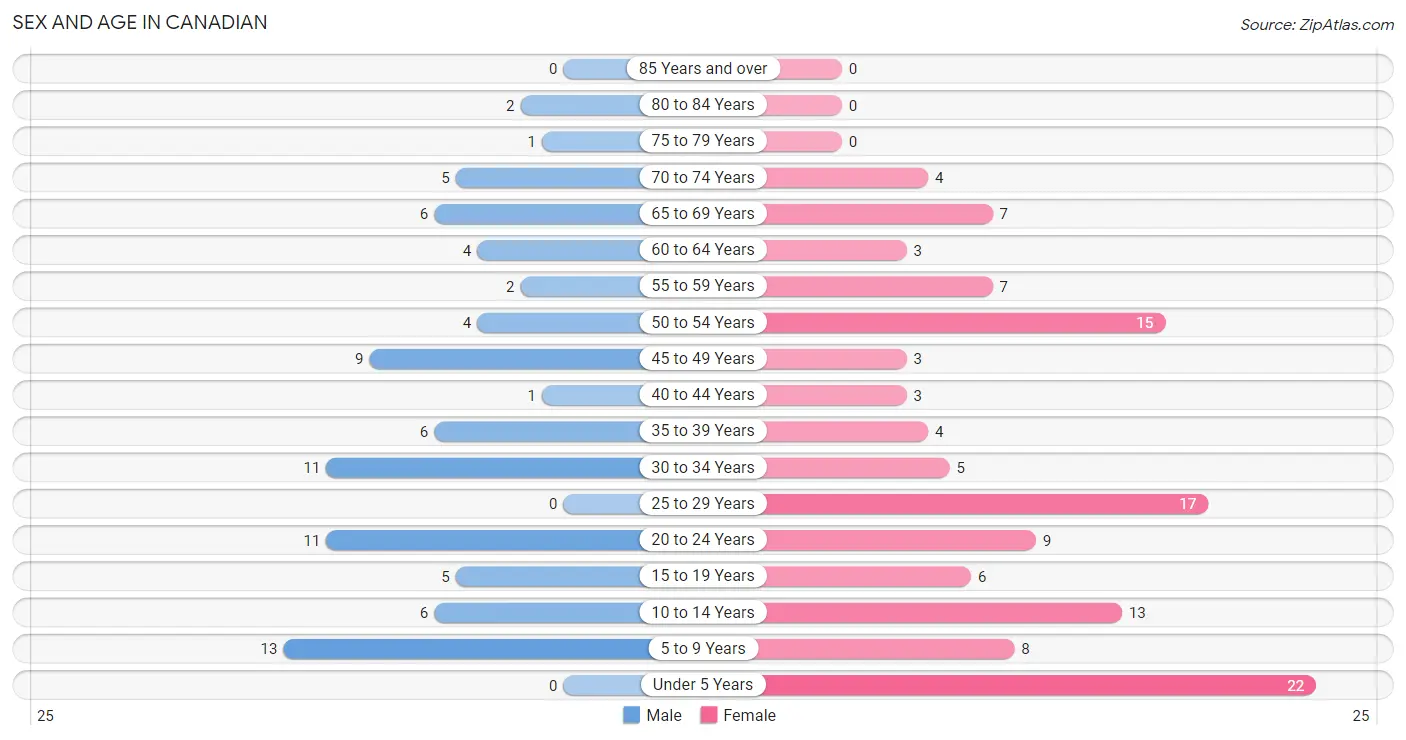
Sex and Age in Canadian
Sex and Age in Canadian
The most populous age groups in Canadian are 5 to 9 Years (13 | 15.1%) for men and Under 5 Years (22 | 17.5%) for women.
| Age Bracket | Male | Female |
| Under 5 Years | 0 (0.0%) | 22 (17.5%) |
| 5 to 9 Years | 13 (15.1%) | 8 (6.4%) |
| 10 to 14 Years | 6 (7.0%) | 13 (10.3%) |
| 15 to 19 Years | 5 (5.8%) | 6 (4.8%) |
| 20 to 24 Years | 11 (12.8%) | 9 (7.1%) |
| 25 to 29 Years | 0 (0.0%) | 17 (13.5%) |
| 30 to 34 Years | 11 (12.8%) | 5 (4.0%) |
| 35 to 39 Years | 6 (7.0%) | 4 (3.2%) |
| 40 to 44 Years | 1 (1.2%) | 3 (2.4%) |
| 45 to 49 Years | 9 (10.5%) | 3 (2.4%) |
| 50 to 54 Years | 4 (4.6%) | 15 (11.9%) |
| 55 to 59 Years | 2 (2.3%) | 7 (5.6%) |
| 60 to 64 Years | 4 (4.6%) | 3 (2.4%) |
| 65 to 69 Years | 6 (7.0%) | 7 (5.6%) |
| 70 to 74 Years | 5 (5.8%) | 4 (3.2%) |
| 75 to 79 Years | 1 (1.2%) | 0 (0.0%) |
| 80 to 84 Years | 2 (2.3%) | 0 (0.0%) |
| 85 Years and over | 0 (0.0%) | 0 (0.0%) |
| Total | 86 (100.0%) | 126 (100.0%) |
Families and Households in Canadian
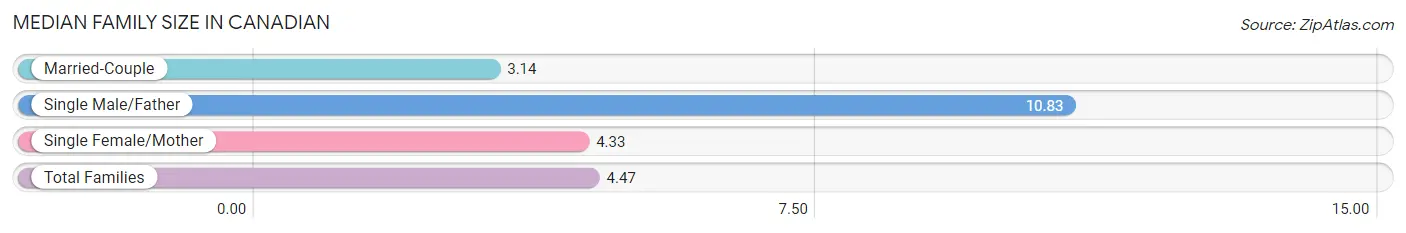
Median Family Size in Canadian
The median family size in Canadian is 4.47 persons per family, with single male/father families (6 | 14.0%) accounting for the largest median family size of 10.83 persons per family. On the other hand, married-couple families (28 | 65.1%) represent the smallest median family size with 3.14 persons per family.
| Family Type | # Families | Family Size |
| Married-Couple | 28 (65.1%) | 3.14 |
| Single Male/Father | 6 (14.0%) | 10.83 |
| Single Female/Mother | 9 (20.9%) | 4.33 |
| Total Families | 43 (100.0%) | 4.47 |
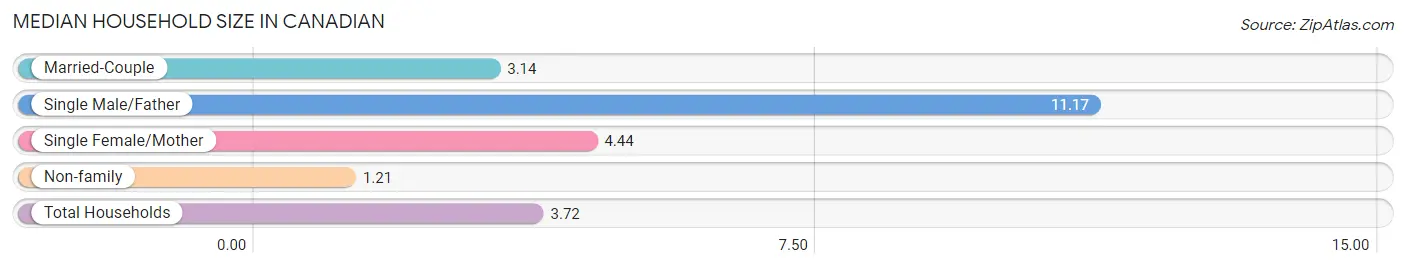
Median Household Size in Canadian
The median household size in Canadian is 3.72 persons per household, with single male/father households (6 | 10.5%) accounting for the largest median household size of 11.17 persons per household. non-family households (14 | 24.6%) represent the smallest median household size with 1.21 persons per household.
| Household Type | # Households | Household Size |
| Married-Couple | 28 (49.1%) | 3.14 |
| Single Male/Father | 6 (10.5%) | 11.17 |
| Single Female/Mother | 9 (15.8%) | 4.44 |
| Non-family | 14 (24.6%) | 1.21 |
| Total Households | 57 (100.0%) | 3.72 |
Household Size by Marriage Status in Canadian
Out of a total of 57 households in Canadian, 43 (75.4%) are family households, while 14 (24.6%) are nonfamily households. The most numerous type of family households are 2-person households, comprising 19, and the most common type of nonfamily households are 1-person households, comprising 11.
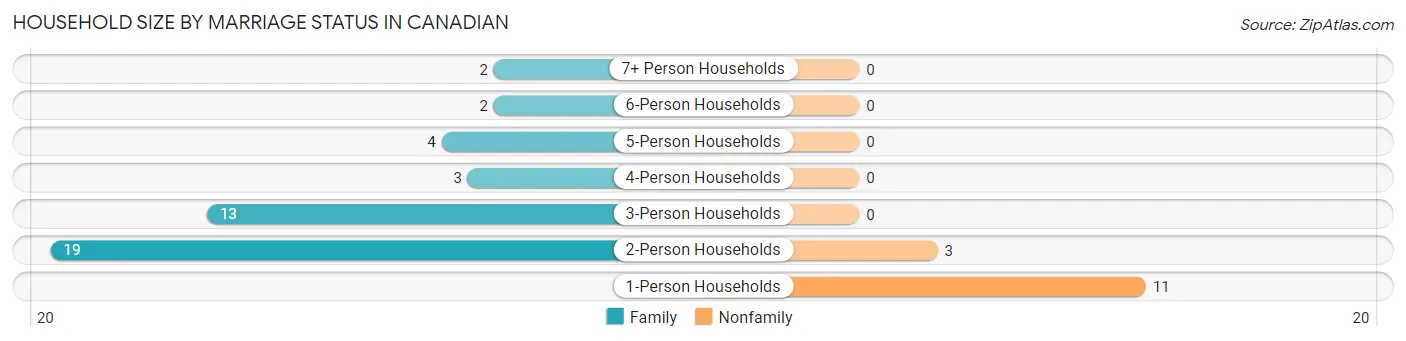
| Household Size | Family Households | Nonfamily Households |
| 1-Person Households | - | 11 (19.3%) |
| 2-Person Households | 19 (33.3%) | 3 (5.3%) |
| 3-Person Households | 13 (22.8%) | 0 (0.0%) |
| 4-Person Households | 3 (5.3%) | 0 (0.0%) |
| 5-Person Households | 4 (7.0%) | 0 (0.0%) |
| 6-Person Households | 2 (3.5%) | 0 (0.0%) |
| 7+ Person Households | 2 (3.5%) | 0 (0.0%) |
| Total | 43 (75.4%) | 14 (24.6%) |
Female Fertility in Canadian
Fertility by Age in Canadian
Average fertility rate in Canadian is 42.0 births per 1,000 women. Women in the age bracket of 35 to 50 years have the highest fertility rate with 182.0 births per 1,000 women. Women in the age bracket of 35 to 50 years acount for 100.0% of all women with births.
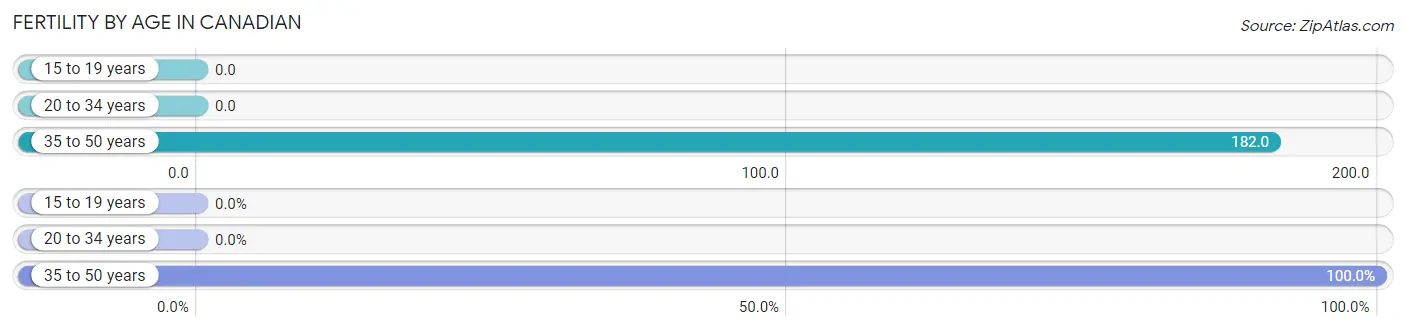
| Age Bracket | Women with Births | Births / 1,000 Women |
| 15 to 19 years | 0 (0.0%) | 0.0 |
| 20 to 34 years | 0 (0.0%) | 0.0 |
| 35 to 50 years | 2 (100.0%) | 182.0 |
| Total | 2 (100.0%) | 42.0 |
Fertility by Age by Marriage Status in Canadian
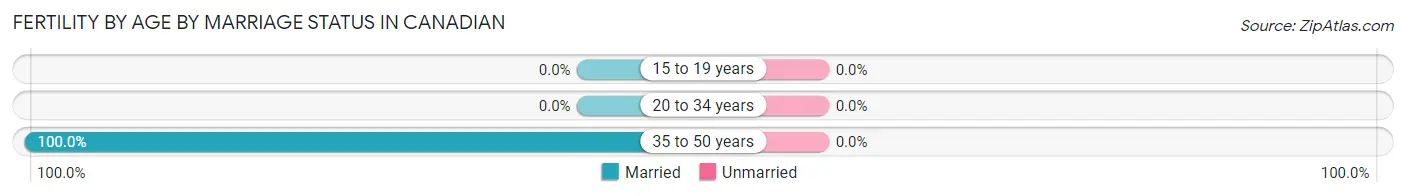
| Age Bracket | Married | Unmarried |
| 15 to 19 years | 0 (0.0%) | 0 (0.0%) |
| 20 to 34 years | 0 (0.0%) | 0 (0.0%) |
| 35 to 50 years | 2 (100.0%) | 0 (0.0%) |
| Total | 2 (100.0%) | 0 (0.0%) |
Fertility by Education in Canadian
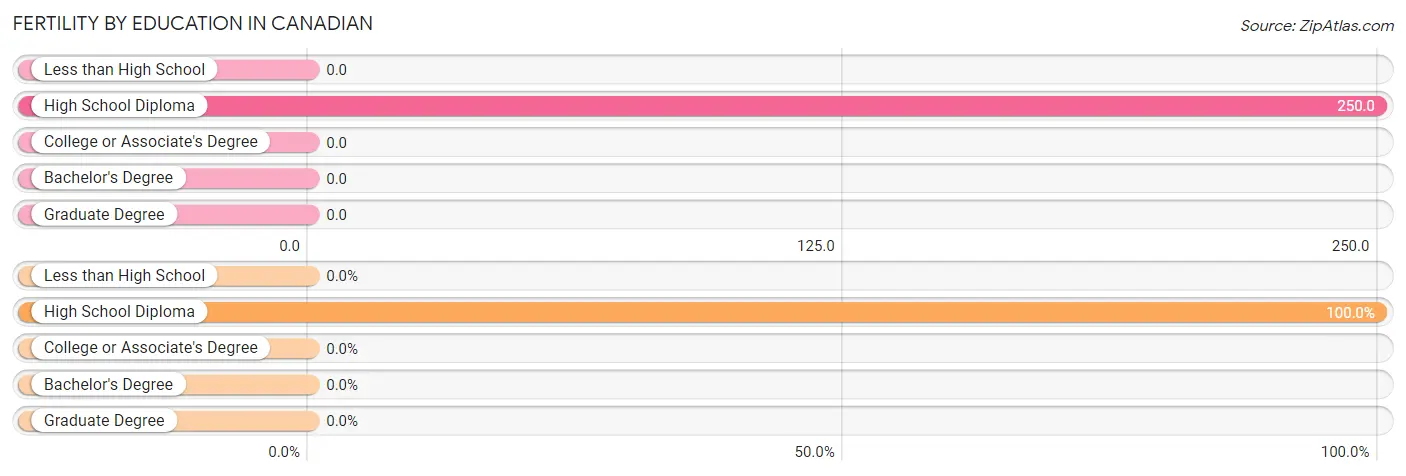
| Educational Attainment | Women with Births | Births / 1,000 Women |
| Less than High School | 0 (0.0%) | 0.0 |
| High School Diploma | 2 (100.0%) | 250.0 |
| College or Associate's Degree | 0 (0.0%) | 0.0 |
| Bachelor's Degree | 0 (0.0%) | 0.0 |
| Graduate Degree | 0 (0.0%) | 0.0 |
| Total | 2 (100.0%) | 42.0 |
Fertility by Education by Marriage Status in Canadian
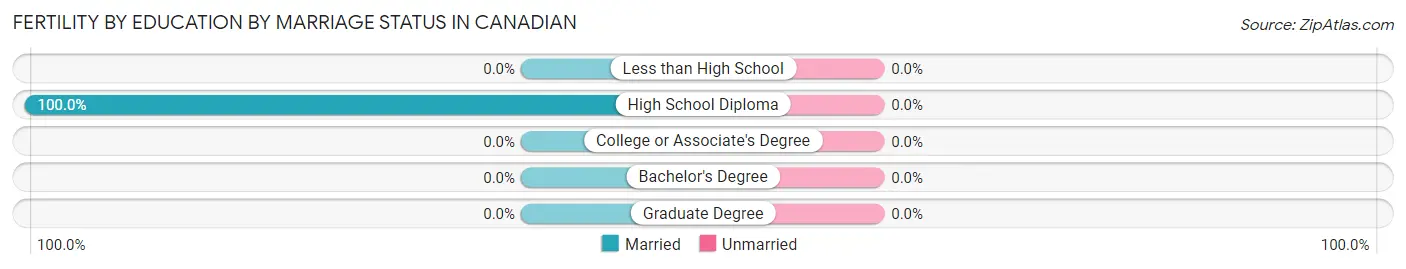
| Educational Attainment | Married | Unmarried |
| Less than High School | 0 (0.0%) | 0 (0.0%) |
| High School Diploma | 2 (100.0%) | 0 (0.0%) |
| College or Associate's Degree | 0 (0.0%) | 0 (0.0%) |
| Bachelor's Degree | 0 (0.0%) | 0 (0.0%) |
| Graduate Degree | 0 (0.0%) | 0 (0.0%) |
| Total | 2 (100.0%) | 0 (0.0%) |
Employment Characteristics in Canadian
Employment by Class of Employer in Canadian
Among the 79 employed individuals in Canadian, private company employees (58 | 73.4%), local government employees (8 | 10.1%), and self-employed (not incorporated) (5 | 6.3%) make up the most common classes of employment.
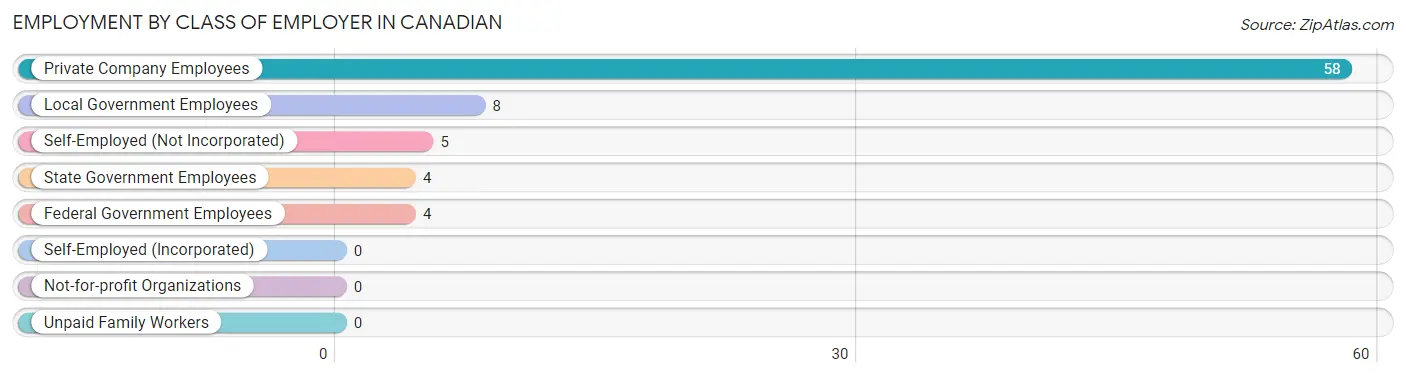
| Employer Class | # Employees | % Employees |
| Private Company Employees | 58 | 73.4% |
| Self-Employed (Incorporated) | 0 | 0.0% |
| Self-Employed (Not Incorporated) | 5 | 6.3% |
| Not-for-profit Organizations | 0 | 0.0% |
| Local Government Employees | 8 | 10.1% |
| State Government Employees | 4 | 5.1% |
| Federal Government Employees | 4 | 5.1% |
| Unpaid Family Workers | 0 | 0.0% |
| Total | 79 | 100.0% |
Employment Status by Age in Canadian
According to the labor force statistics for Canadian, out of the total population over 16 years of age (150), 56.0% or 84 individuals are in the labor force, with 3.6% or 3 of them unemployed. The age group with the highest labor force participation rate is 30 to 34 years, with 100.0% or 16 individuals in the labor force. Within the labor force, the 20 to 24 years age range has the highest percentage of unemployed individuals, with 15.4% or 2 of them being unemployed.
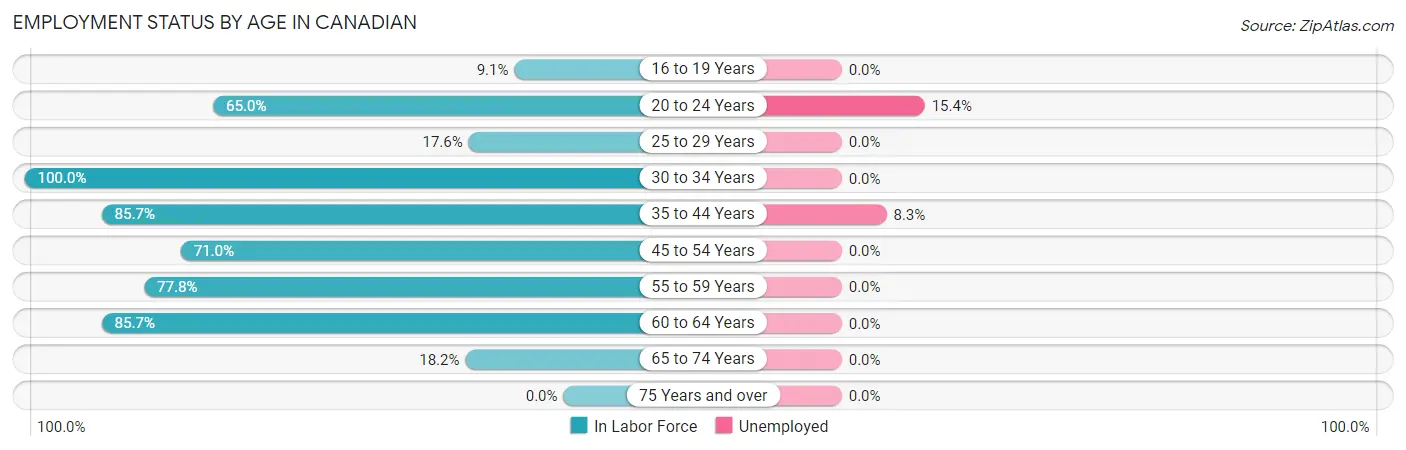
| Age Bracket | In Labor Force | Unemployed |
| 16 to 19 Years | 1 (9.1%) | 0 (0.0%) |
| 20 to 24 Years | 13 (65.0%) | 2 (15.4%) |
| 25 to 29 Years | 3 (17.6%) | 0 (0.0%) |
| 30 to 34 Years | 16 (100.0%) | 0 (0.0%) |
| 35 to 44 Years | 12 (85.7%) | 1 (8.3%) |
| 45 to 54 Years | 22 (71.0%) | 0 (0.0%) |
| 55 to 59 Years | 7 (77.8%) | 0 (0.0%) |
| 60 to 64 Years | 6 (85.7%) | 0 (0.0%) |
| 65 to 74 Years | 4 (18.2%) | 0 (0.0%) |
| 75 Years and over | 0 (0.0%) | 0 (0.0%) |
| Total | 84 (56.0%) | 3 (3.6%) |
Employment Status by Educational Attainment in Canadian
According to labor force statistics for Canadian, 70.2% of individuals (66) out of the total population between 25 and 64 years of age (94) are in the labor force, with 1.5% or 1 of them being unemployed. The group with the highest labor force participation rate are those with the educational attainment of high school diploma, with 100.0% or 35 individuals in the labor force. Within the labor force, individuals with high school diploma education have the highest percentage of unemployment, with 2.9% or 1 of them being unemployed.

| Educational Attainment | In Labor Force | Unemployed |
| Less than High School | 5 (83.3%) | 0 (0.0%) |
| High School Diploma | 35 (100.0%) | 1 (2.9%) |
| College / Associate Degree | 20 (69.0%) | 0 (0.0%) |
| Bachelor's Degree or higher | 6 (25.0%) | 0 (0.0%) |
| Total | 66 (70.2%) | 1 (1.5%) |
Employment Occupations by Sex in Canadian
Management, Business, Science and Arts Occupations
The most common Management, Business, Science and Arts occupations in Canadian are Business & Financial (6 | 7.4%), Community & Social Service (4 | 4.9%), Education Instruction & Library (3 | 3.7%), and Education, Arts & Media (1 | 1.2%).
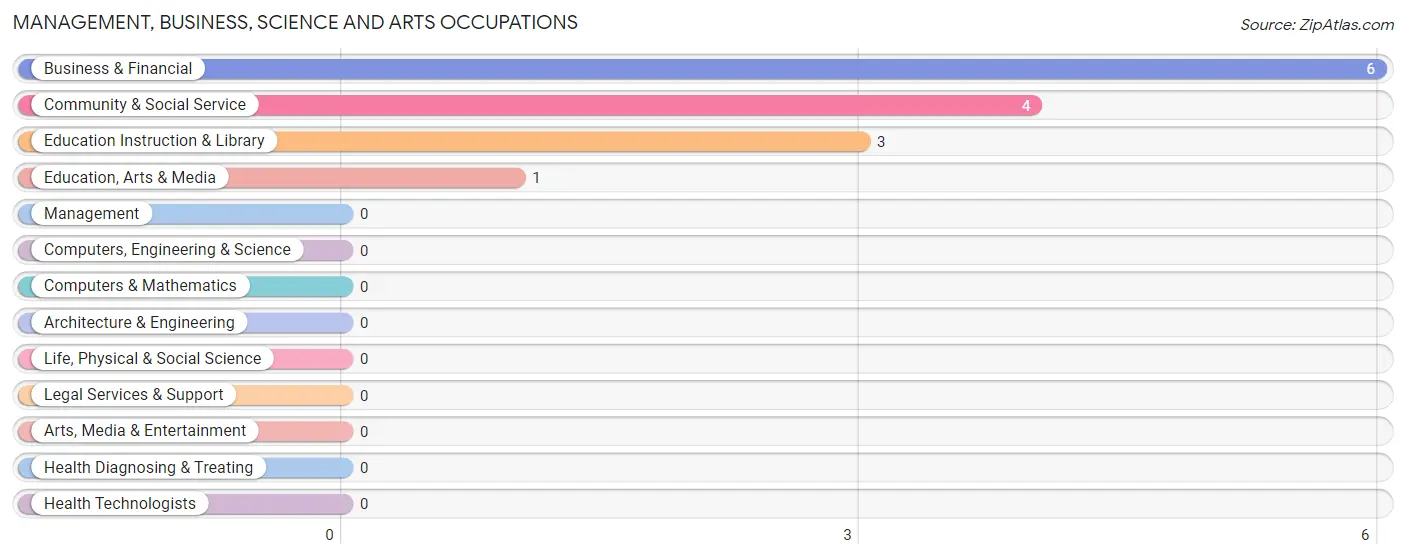
Management, Business, Science and Arts Occupations by Sex
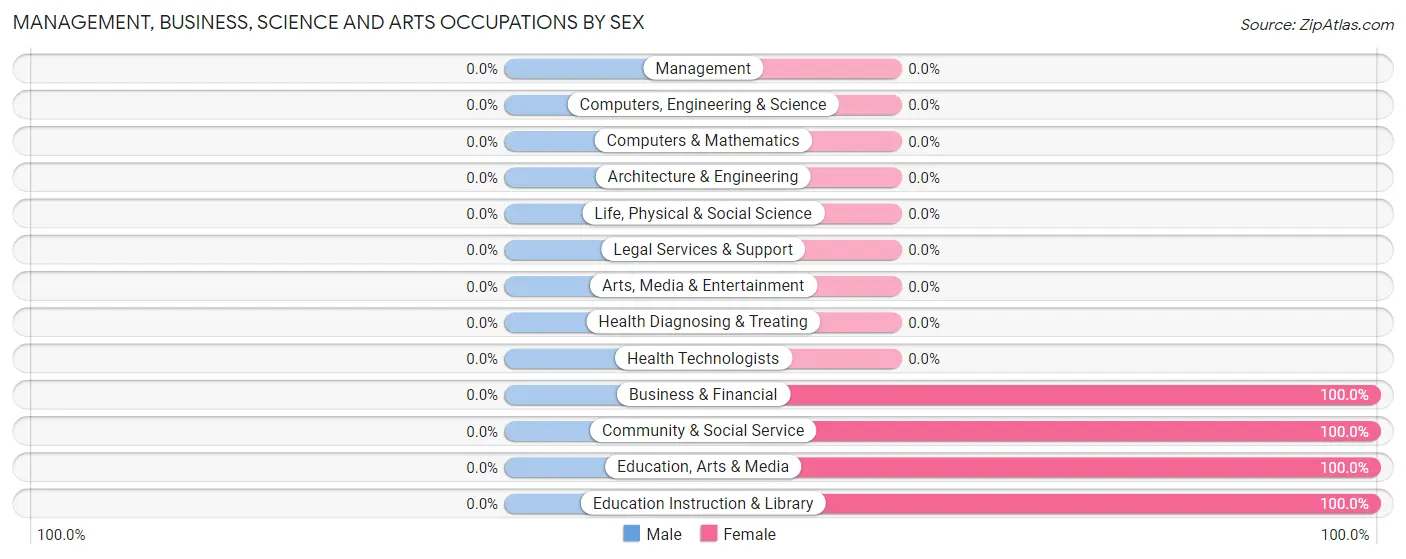
| Occupation | Male | Female |
| Management | 0 (0.0%) | 0 (0.0%) |
| Business & Financial | 0 (0.0%) | 6 (100.0%) |
| Computers, Engineering & Science | 0 (0.0%) | 0 (0.0%) |
| Computers & Mathematics | 0 (0.0%) | 0 (0.0%) |
| Architecture & Engineering | 0 (0.0%) | 0 (0.0%) |
| Life, Physical & Social Science | 0 (0.0%) | 0 (0.0%) |
| Community & Social Service | 0 (0.0%) | 4 (100.0%) |
| Education, Arts & Media | 0 (0.0%) | 1 (100.0%) |
| Legal Services & Support | 0 (0.0%) | 0 (0.0%) |
| Education Instruction & Library | 0 (0.0%) | 3 (100.0%) |
| Arts, Media & Entertainment | 0 (0.0%) | 0 (0.0%) |
| Health Diagnosing & Treating | 0 (0.0%) | 0 (0.0%) |
| Health Technologists | 0 (0.0%) | 0 (0.0%) |
| Total (Category) | 0 (0.0%) | 10 (100.0%) |
| Total (Overall) | 48 (59.3%) | 33 (40.7%) |
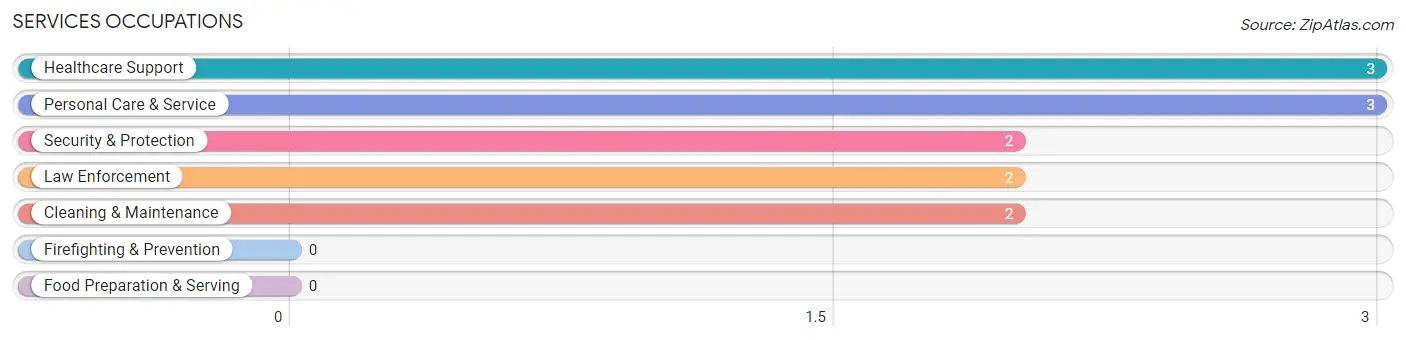
Services Occupations
The most common Services occupations in Canadian are Healthcare Support (3 | 3.7%), Personal Care & Service (3 | 3.7%), Security & Protection (2 | 2.5%), Law Enforcement (2 | 2.5%), and Cleaning & Maintenance (2 | 2.5%).
Services Occupations by Sex
Within the Services occupations in Canadian, the most male-oriented occupations are Security & Protection (100.0%), Law Enforcement (100.0%), and Cleaning & Maintenance (100.0%), while the most female-oriented occupations are Healthcare Support (100.0%), and Personal Care & Service (33.3%).
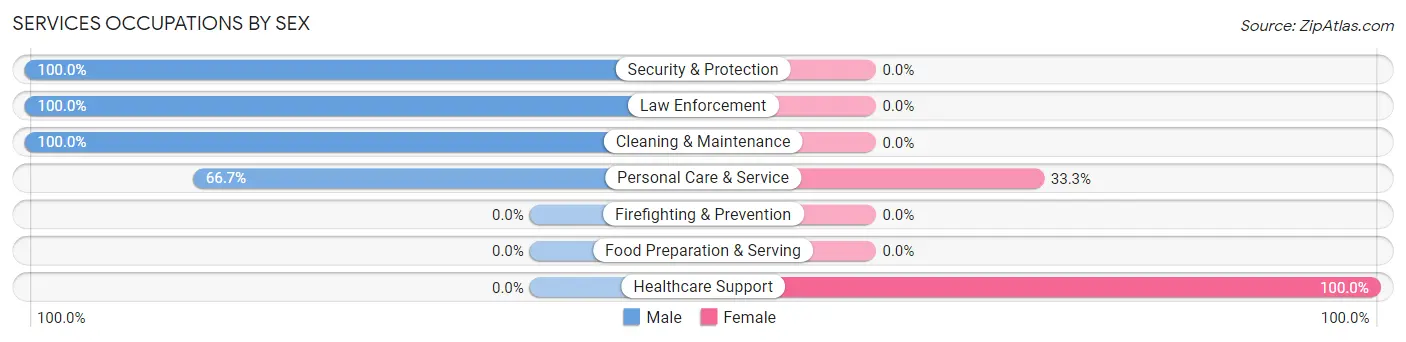
| Occupation | Male | Female |
| Healthcare Support | 0 (0.0%) | 3 (100.0%) |
| Security & Protection | 2 (100.0%) | 0 (0.0%) |
| Firefighting & Prevention | 0 (0.0%) | 0 (0.0%) |
| Law Enforcement | 2 (100.0%) | 0 (0.0%) |
| Food Preparation & Serving | 0 (0.0%) | 0 (0.0%) |
| Cleaning & Maintenance | 2 (100.0%) | 0 (0.0%) |
| Personal Care & Service | 2 (66.7%) | 1 (33.3%) |
| Total (Category) | 6 (60.0%) | 4 (40.0%) |
| Total (Overall) | 48 (59.3%) | 33 (40.7%) |
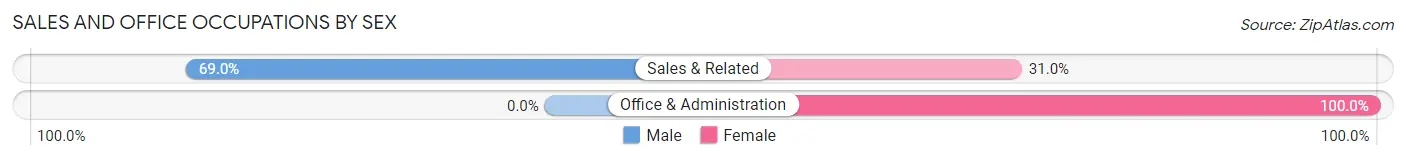
Sales and Office Occupations
The most common Sales and Office occupations in Canadian are Sales & Related (29 | 35.8%), and Office & Administration (4 | 4.9%).
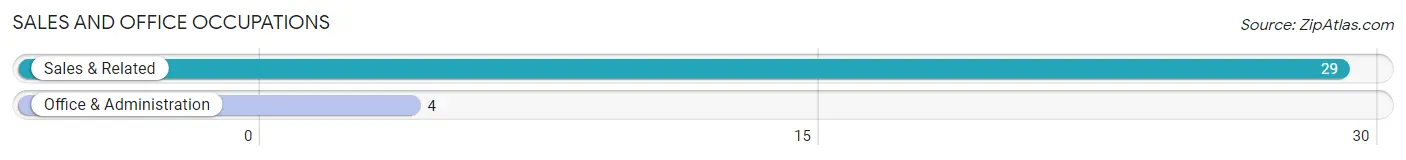
Sales and Office Occupations by Sex
| Occupation | Male | Female |
| Sales & Related | 20 (69.0%) | 9 (31.0%) |
| Office & Administration | 0 (0.0%) | 4 (100.0%) |
| Total (Category) | 20 (60.6%) | 13 (39.4%) |
| Total (Overall) | 48 (59.3%) | 33 (40.7%) |
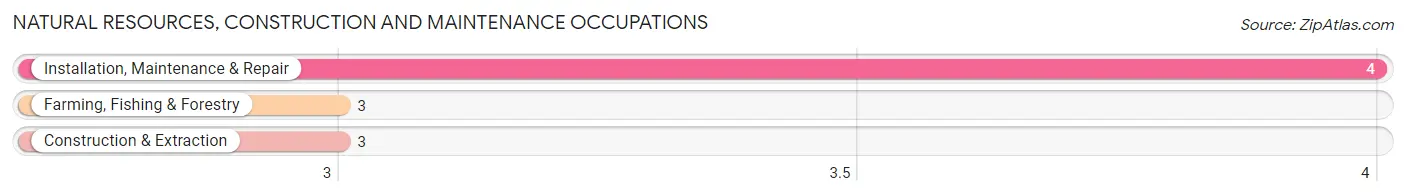
Natural Resources, Construction and Maintenance Occupations
The most common Natural Resources, Construction and Maintenance occupations in Canadian are Installation, Maintenance & Repair (4 | 4.9%), Farming, Fishing & Forestry (3 | 3.7%), and Construction & Extraction (3 | 3.7%).
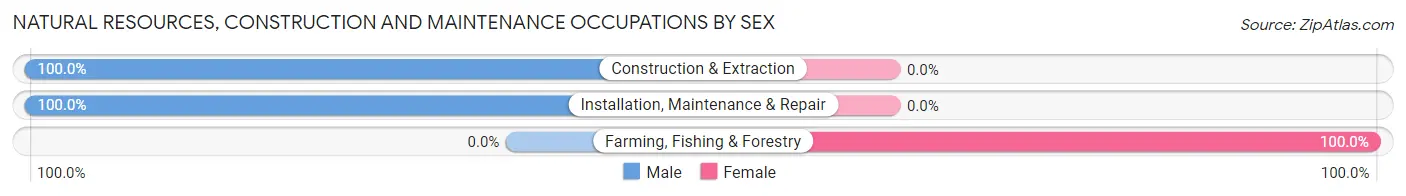
Natural Resources, Construction and Maintenance Occupations by Sex
| Occupation | Male | Female |
| Farming, Fishing & Forestry | 0 (0.0%) | 3 (100.0%) |
| Construction & Extraction | 3 (100.0%) | 0 (0.0%) |
| Installation, Maintenance & Repair | 4 (100.0%) | 0 (0.0%) |
| Total (Category) | 7 (70.0%) | 3 (30.0%) |
| Total (Overall) | 48 (59.3%) | 33 (40.7%) |
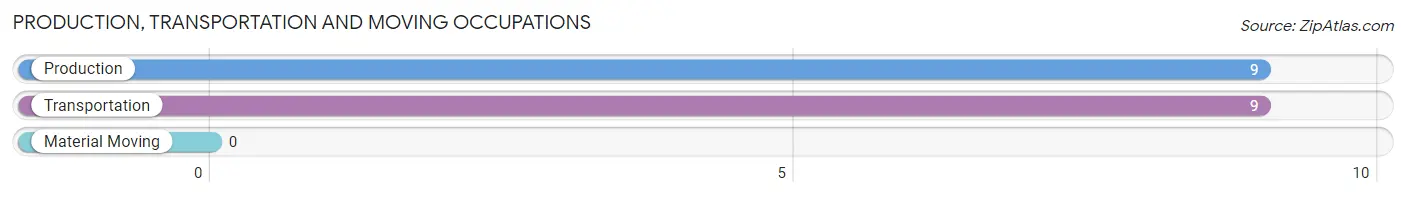
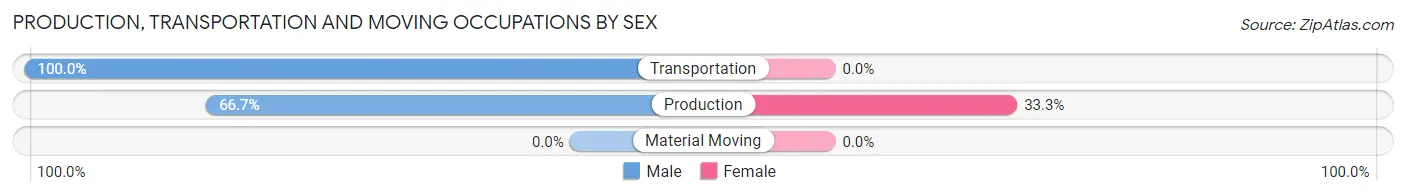
Production, Transportation and Moving Occupations
The most common Production, Transportation and Moving occupations in Canadian are Production (9 | 11.1%), and Transportation (9 | 11.1%).
Production, Transportation and Moving Occupations by Sex
| Occupation | Male | Female |
| Production | 6 (66.7%) | 3 (33.3%) |
| Transportation | 9 (100.0%) | 0 (0.0%) |
| Material Moving | 0 (0.0%) | 0 (0.0%) |
| Total (Category) | 15 (83.3%) | 3 (16.7%) |
| Total (Overall) | 48 (59.3%) | 33 (40.7%) |
Employment Industries by Sex in Canadian
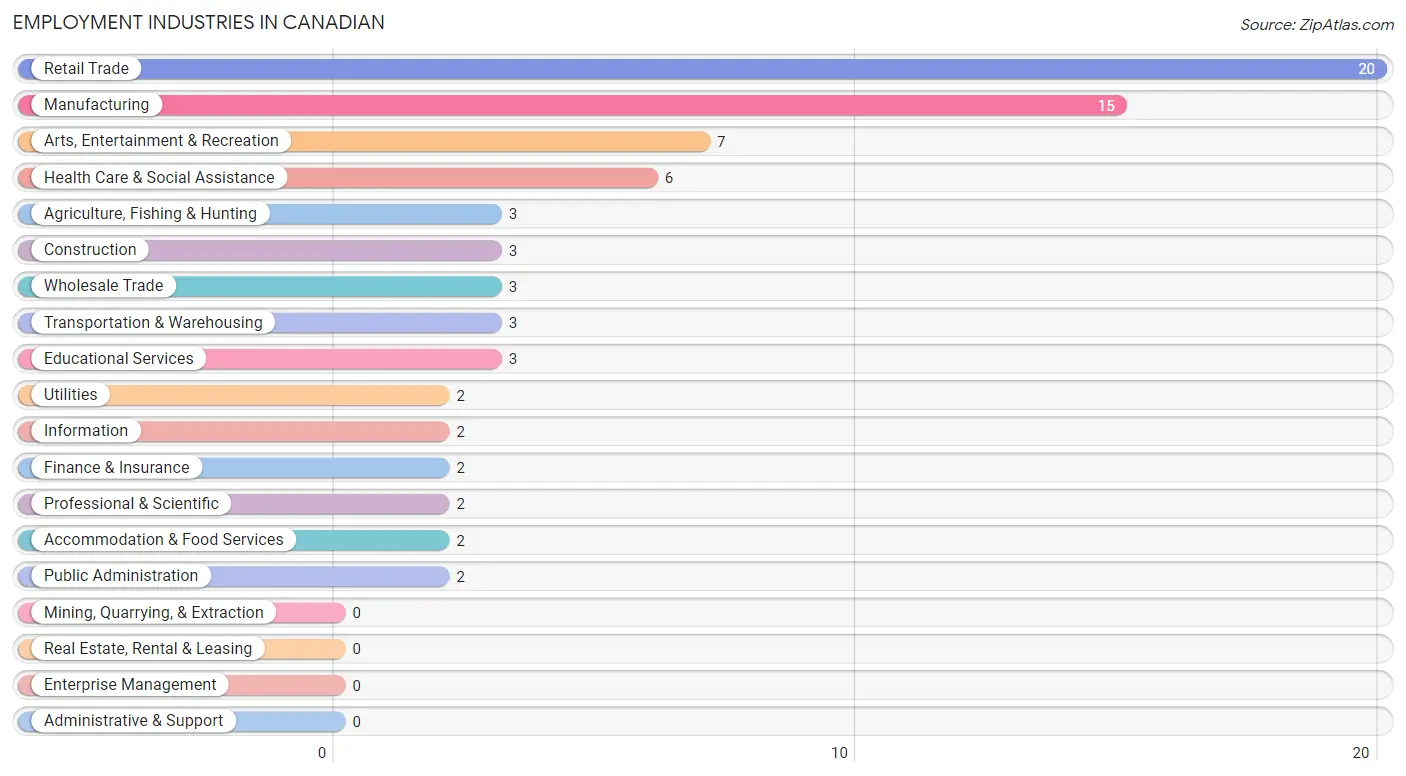
Employment Industries in Canadian
The major employment industries in Canadian include Retail Trade (20 | 24.7%), Manufacturing (15 | 18.5%), Arts, Entertainment & Recreation (7 | 8.6%), Health Care & Social Assistance (6 | 7.4%), and Agriculture, Fishing & Hunting (3 | 3.7%).
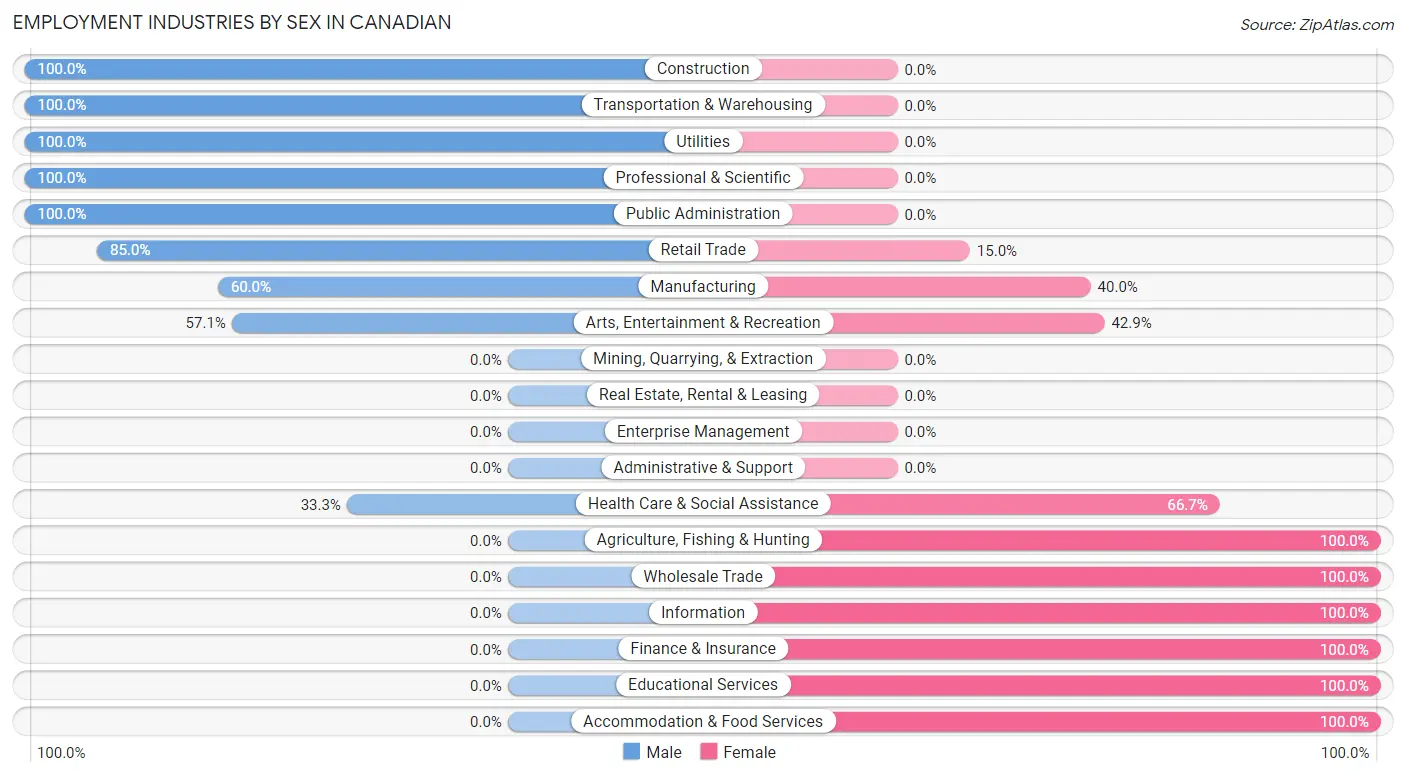
Employment Industries by Sex in Canadian
The Canadian industries that see more men than women are Construction (100.0%), Transportation & Warehousing (100.0%), and Utilities (100.0%), whereas the industries that tend to have a higher number of women are Agriculture, Fishing & Hunting (100.0%), Wholesale Trade (100.0%), and Information (100.0%).
| Industry | Male | Female |
| Agriculture, Fishing & Hunting | 0 (0.0%) | 3 (100.0%) |
| Mining, Quarrying, & Extraction | 0 (0.0%) | 0 (0.0%) |
| Construction | 3 (100.0%) | 0 (0.0%) |
| Manufacturing | 9 (60.0%) | 6 (40.0%) |
| Wholesale Trade | 0 (0.0%) | 3 (100.0%) |
| Retail Trade | 17 (85.0%) | 3 (15.0%) |
| Transportation & Warehousing | 3 (100.0%) | 0 (0.0%) |
| Utilities | 2 (100.0%) | 0 (0.0%) |
| Information | 0 (0.0%) | 2 (100.0%) |
| Finance & Insurance | 0 (0.0%) | 2 (100.0%) |
| Real Estate, Rental & Leasing | 0 (0.0%) | 0 (0.0%) |
| Professional & Scientific | 2 (100.0%) | 0 (0.0%) |
| Enterprise Management | 0 (0.0%) | 0 (0.0%) |
| Administrative & Support | 0 (0.0%) | 0 (0.0%) |
| Educational Services | 0 (0.0%) | 3 (100.0%) |
| Health Care & Social Assistance | 2 (33.3%) | 4 (66.7%) |
| Arts, Entertainment & Recreation | 4 (57.1%) | 3 (42.9%) |
| Accommodation & Food Services | 0 (0.0%) | 2 (100.0%) |
| Public Administration | 2 (100.0%) | 0 (0.0%) |
| Total | 48 (59.3%) | 33 (40.7%) |
Education in Canadian
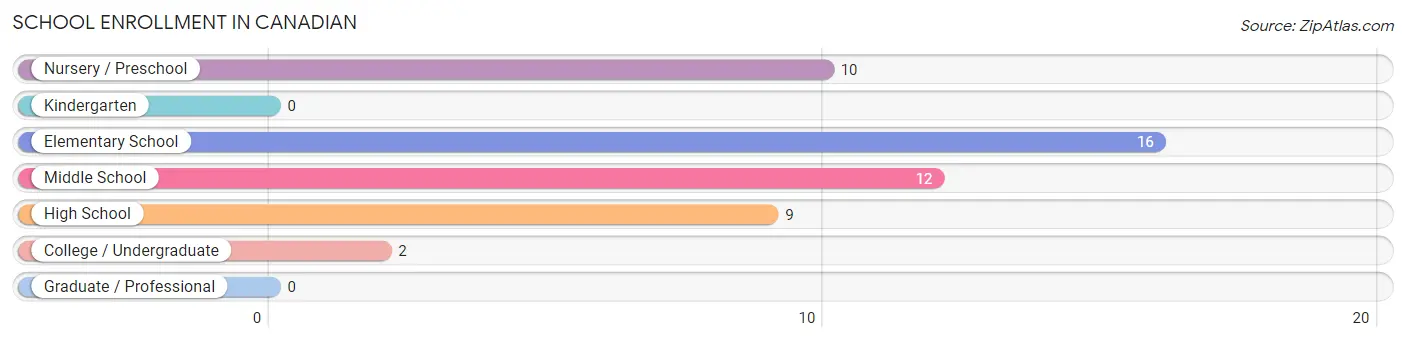
School Enrollment in Canadian
The most common levels of schooling among the 49 students in Canadian are elementary school (16 | 32.7%), middle school (12 | 24.5%), and nursery / preschool (10 | 20.4%).
| School Level | # Students | % Students |
| Nursery / Preschool | 10 | 20.4% |
| Kindergarten | 0 | 0.0% |
| Elementary School | 16 | 32.7% |
| Middle School | 12 | 24.5% |
| High School | 9 | 18.4% |
| College / Undergraduate | 2 | 4.1% |
| Graduate / Professional | 0 | 0.0% |
| Total | 49 | 100.0% |
School Enrollment by Age by Funding Source in Canadian
Out of a total of 49 students who are enrolled in schools in Canadian, 8 (16.3%) attend a private institution, while the remaining 41 (83.7%) are enrolled in public schools. The age group of 10 to 14 year olds has the highest likelihood of being enrolled in private schools, with 5 (26.3% in the age bracket) enrolled. Conversely, the age group of 15 to 17 year olds has the lowest likelihood of being enrolled in a private school, with 3 (100.0% in the age bracket) attending a public institution.
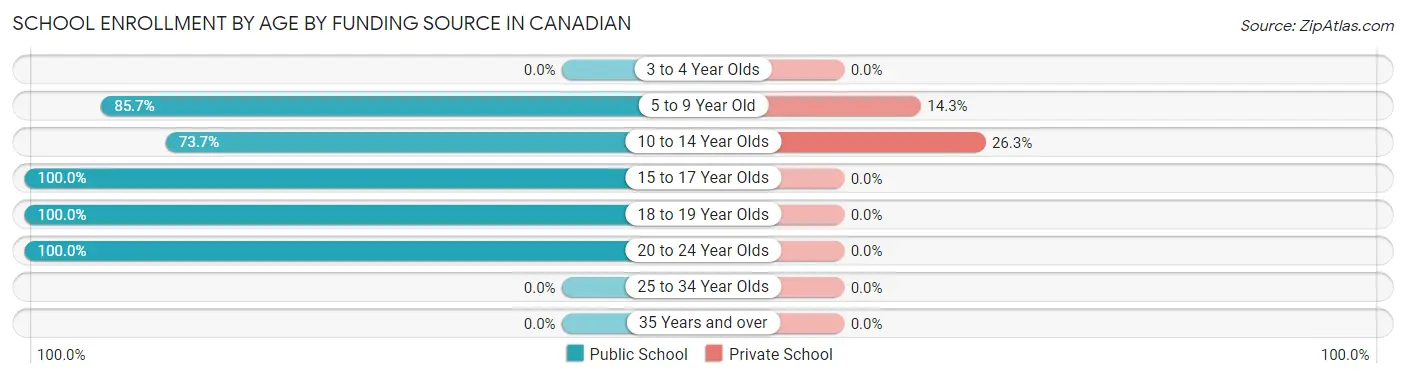
| Age Bracket | Public School | Private School |
| 3 to 4 Year Olds | 0 (0.0%) | 0 (0.0%) |
| 5 to 9 Year Old | 18 (85.7%) | 3 (14.3%) |
| 10 to 14 Year Olds | 14 (73.7%) | 5 (26.3%) |
| 15 to 17 Year Olds | 3 (100.0%) | 0 (0.0%) |
| 18 to 19 Year Olds | 4 (100.0%) | 0 (0.0%) |
| 20 to 24 Year Olds | 2 (100.0%) | 0 (0.0%) |
| 25 to 34 Year Olds | 0 (0.0%) | 0 (0.0%) |
| 35 Years and over | 0 (0.0%) | 0 (0.0%) |
| Total | 41 (83.7%) | 8 (16.3%) |
Educational Attainment by Field of Study in Canadian
Business (14 | 50.0%), education (9 | 32.1%), social sciences (2 | 7.1%), science & technology (2 | 7.1%), and multidisciplinary studies (1 | 3.6%) are the most common fields of study among 28 individuals in Canadian who have obtained a bachelor's degree or higher.
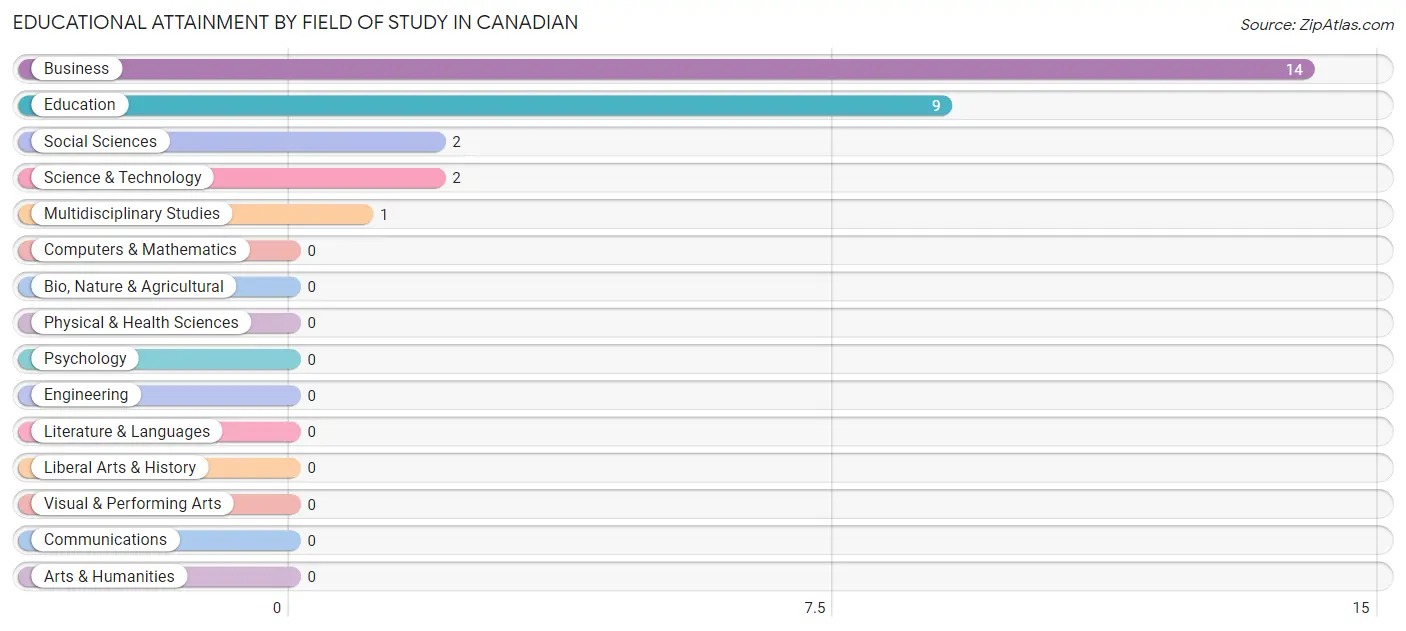
| Field of Study | # Graduates | % Graduates |
| Computers & Mathematics | 0 | 0.0% |
| Bio, Nature & Agricultural | 0 | 0.0% |
| Physical & Health Sciences | 0 | 0.0% |
| Psychology | 0 | 0.0% |
| Social Sciences | 2 | 7.1% |
| Engineering | 0 | 0.0% |
| Multidisciplinary Studies | 1 | 3.6% |
| Science & Technology | 2 | 7.1% |
| Business | 14 | 50.0% |
| Education | 9 | 32.1% |
| Literature & Languages | 0 | 0.0% |
| Liberal Arts & History | 0 | 0.0% |
| Visual & Performing Arts | 0 | 0.0% |
| Communications | 0 | 0.0% |
| Arts & Humanities | 0 | 0.0% |
| Total | 28 | 100.0% |
Transportation & Commute in Canadian
Vehicle Availability by Sex in Canadian
The most prevalent vehicle ownership categories in Canadian are males with 2 vehicles (20, accounting for 41.7%) and females with 2 vehicles (11, making up 64.5%).
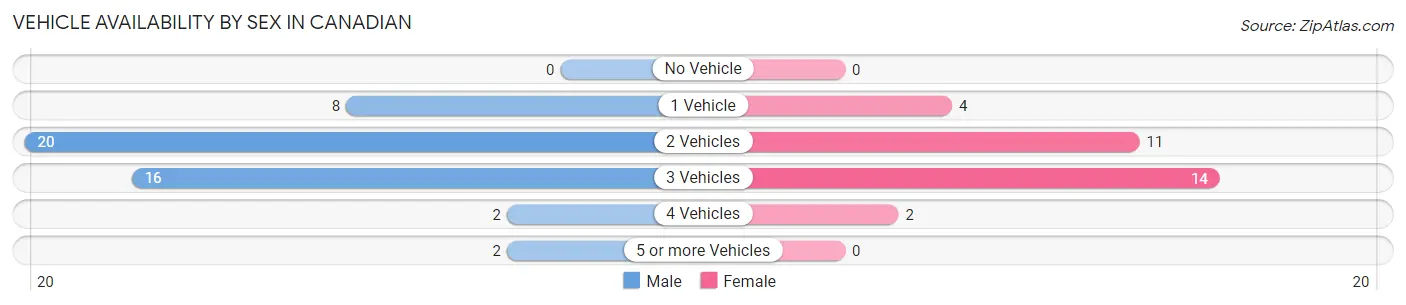
| Vehicles Available | Male | Female |
| No Vehicle | 0 (0.0%) | 0 (0.0%) |
| 1 Vehicle | 8 (16.7%) | 4 (12.9%) |
| 2 Vehicles | 20 (41.7%) | 11 (35.5%) |
| 3 Vehicles | 16 (33.3%) | 14 (45.2%) |
| 4 Vehicles | 2 (4.2%) | 2 (6.5%) |
| 5 or more Vehicles | 2 (4.2%) | 0 (0.0%) |
| Total | 48 (100.0%) | 31 (100.0%) |
Commute Time in Canadian
The most frequently occuring commute durations in Canadian are 20 to 24 minutes (33 commuters, 43.4%), 15 to 19 minutes (15 commuters, 19.7%), and 5 to 9 minutes (13 commuters, 17.1%).
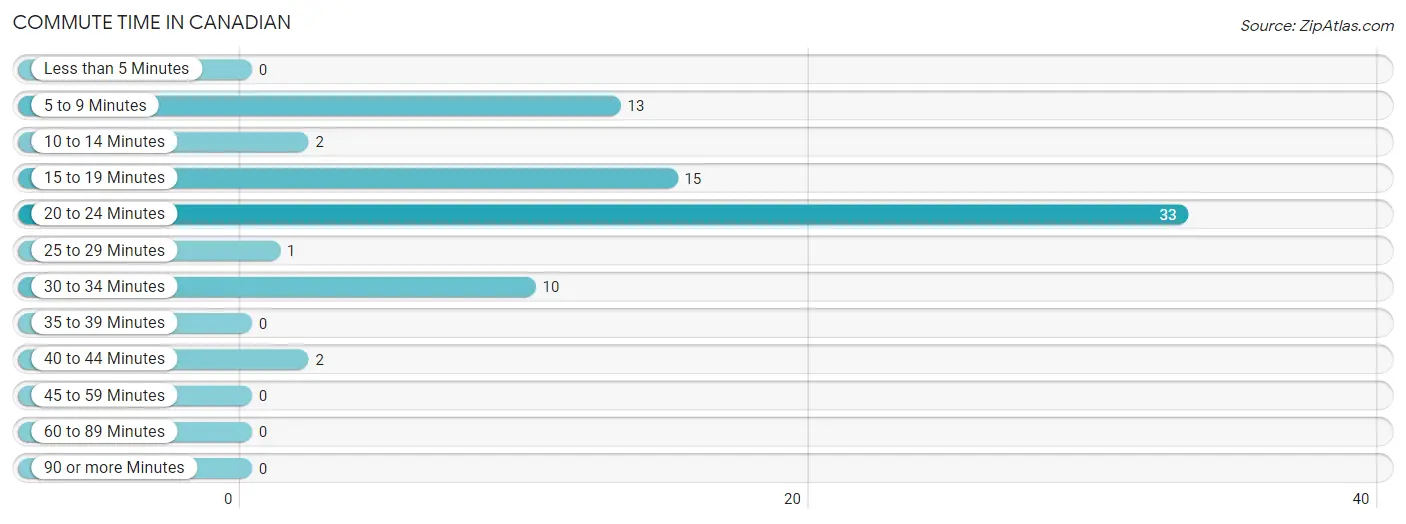
| Commute Time | # Commuters | % Commuters |
| Less than 5 Minutes | 0 | 0.0% |
| 5 to 9 Minutes | 13 | 17.1% |
| 10 to 14 Minutes | 2 | 2.6% |
| 15 to 19 Minutes | 15 | 19.7% |
| 20 to 24 Minutes | 33 | 43.4% |
| 25 to 29 Minutes | 1 | 1.3% |
| 30 to 34 Minutes | 10 | 13.2% |
| 35 to 39 Minutes | 0 | 0.0% |
| 40 to 44 Minutes | 2 | 2.6% |
| 45 to 59 Minutes | 0 | 0.0% |
| 60 to 89 Minutes | 0 | 0.0% |
| 90 or more Minutes | 0 | 0.0% |
Commute Time by Sex in Canadian
The most common commute times in Canadian are 20 to 24 minutes (18 commuters, 37.5%) for males and 20 to 24 minutes (15 commuters, 53.6%) for females.
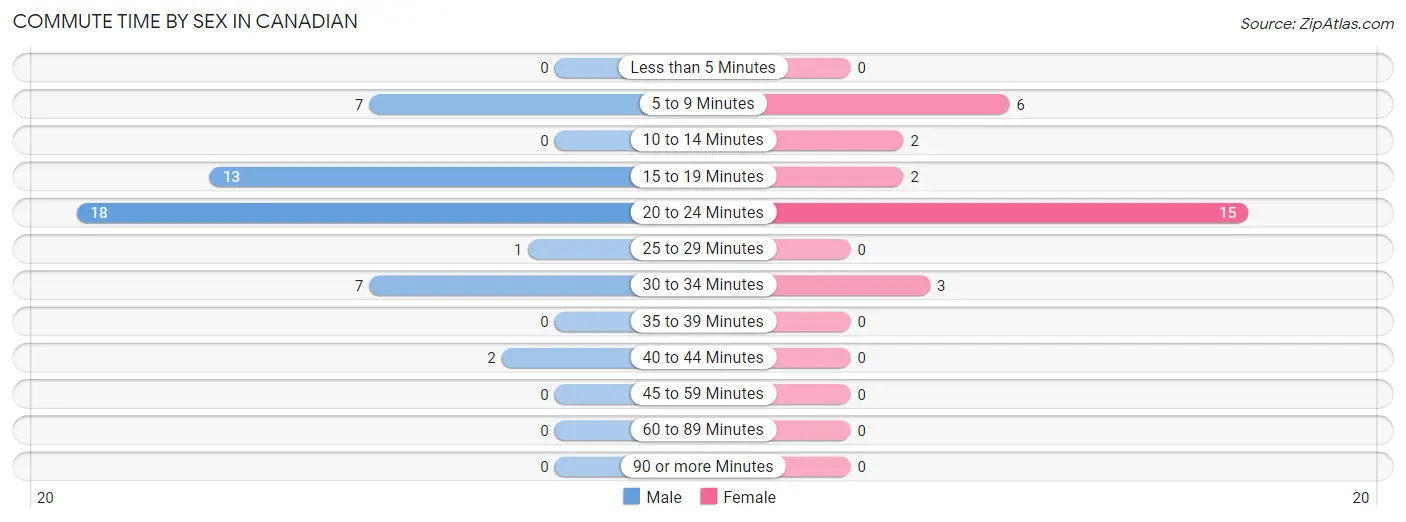
| Commute Time | Male | Female |
| Less than 5 Minutes | 0 (0.0%) | 0 (0.0%) |
| 5 to 9 Minutes | 7 (14.6%) | 6 (21.4%) |
| 10 to 14 Minutes | 0 (0.0%) | 2 (7.1%) |
| 15 to 19 Minutes | 13 (27.1%) | 2 (7.1%) |
| 20 to 24 Minutes | 18 (37.5%) | 15 (53.6%) |
| 25 to 29 Minutes | 1 (2.1%) | 0 (0.0%) |
| 30 to 34 Minutes | 7 (14.6%) | 3 (10.7%) |
| 35 to 39 Minutes | 0 (0.0%) | 0 (0.0%) |
| 40 to 44 Minutes | 2 (4.2%) | 0 (0.0%) |
| 45 to 59 Minutes | 0 (0.0%) | 0 (0.0%) |
| 60 to 89 Minutes | 0 (0.0%) | 0 (0.0%) |
| 90 or more Minutes | 0 (0.0%) | 0 (0.0%) |
Time of Departure to Work by Sex in Canadian
The most frequent times of departure to work in Canadian are 8:30 AM to 8:59 AM (16, 33.3%) for males and 7:00 AM to 7:29 AM (10, 35.7%) for females.
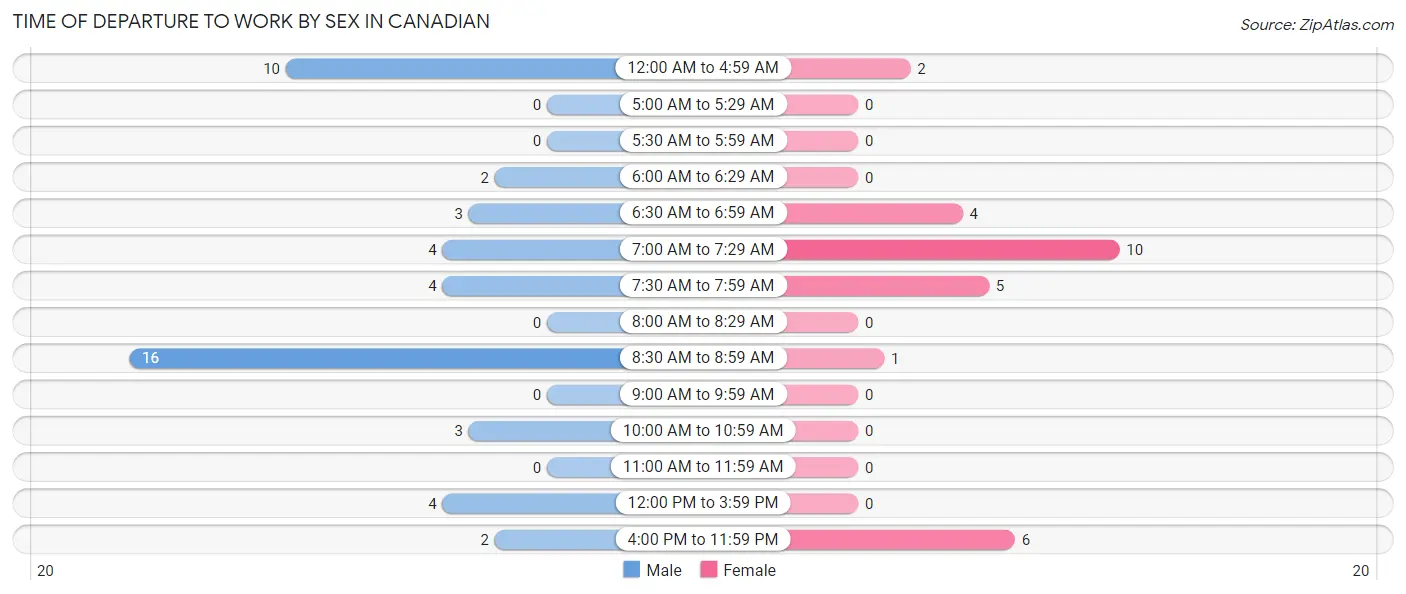
| Time of Departure | Male | Female |
| 12:00 AM to 4:59 AM | 10 (20.8%) | 2 (7.1%) |
| 5:00 AM to 5:29 AM | 0 (0.0%) | 0 (0.0%) |
| 5:30 AM to 5:59 AM | 0 (0.0%) | 0 (0.0%) |
| 6:00 AM to 6:29 AM | 2 (4.2%) | 0 (0.0%) |
| 6:30 AM to 6:59 AM | 3 (6.2%) | 4 (14.3%) |
| 7:00 AM to 7:29 AM | 4 (8.3%) | 10 (35.7%) |
| 7:30 AM to 7:59 AM | 4 (8.3%) | 5 (17.9%) |
| 8:00 AM to 8:29 AM | 0 (0.0%) | 0 (0.0%) |
| 8:30 AM to 8:59 AM | 16 (33.3%) | 1 (3.6%) |
| 9:00 AM to 9:59 AM | 0 (0.0%) | 0 (0.0%) |
| 10:00 AM to 10:59 AM | 3 (6.2%) | 0 (0.0%) |
| 11:00 AM to 11:59 AM | 0 (0.0%) | 0 (0.0%) |
| 12:00 PM to 3:59 PM | 4 (8.3%) | 0 (0.0%) |
| 4:00 PM to 11:59 PM | 2 (4.2%) | 6 (21.4%) |
| Total | 48 (100.0%) | 28 (100.0%) |
Housing Occupancy in Canadian
Occupancy by Ownership in Canadian
Of the total 57 dwellings in Canadian, owner-occupied units account for 42 (73.7%), while renter-occupied units make up 15 (26.3%).
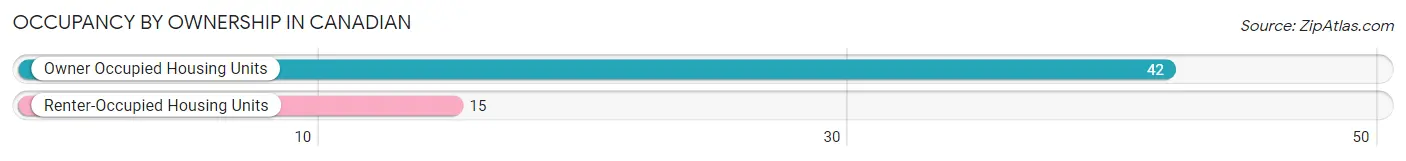
| Occupancy | # Housing Units | % Housing Units |
| Owner Occupied Housing Units | 42 | 73.7% |
| Renter-Occupied Housing Units | 15 | 26.3% |
| Total Occupied Housing Units | 57 | 100.0% |
Occupancy by Household Size in Canadian
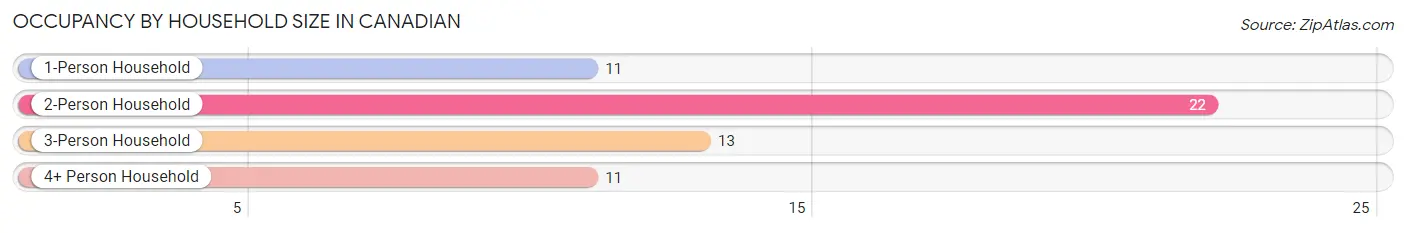
| Household Size | # Housing Units | % Housing Units |
| 1-Person Household | 11 | 19.3% |
| 2-Person Household | 22 | 38.6% |
| 3-Person Household | 13 | 22.8% |
| 4+ Person Household | 11 | 19.3% |
| Total Housing Units | 57 | 100.0% |
Occupancy by Ownership by Household Size in Canadian
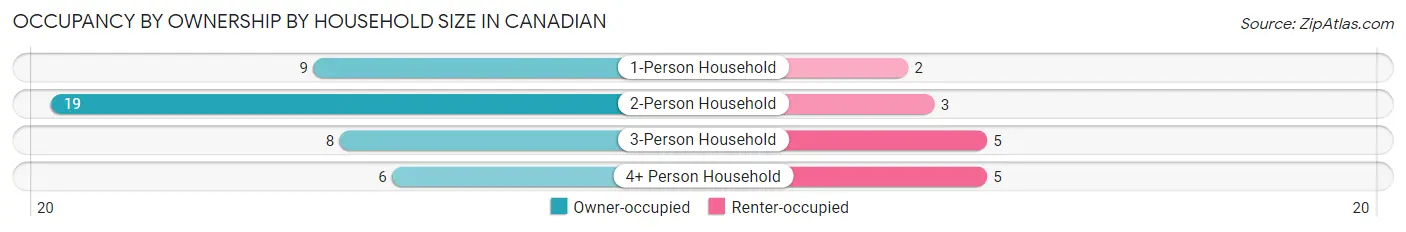
| Household Size | Owner-occupied | Renter-occupied |
| 1-Person Household | 9 (81.8%) | 2 (18.2%) |
| 2-Person Household | 19 (86.4%) | 3 (13.6%) |
| 3-Person Household | 8 (61.5%) | 5 (38.5%) |
| 4+ Person Household | 6 (54.5%) | 5 (45.5%) |
| Total Housing Units | 42 (73.7%) | 15 (26.3%) |
Occupancy by Educational Attainment in Canadian
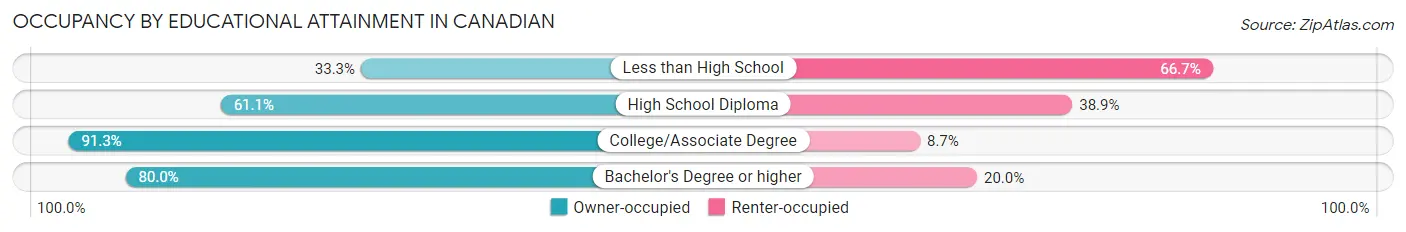
| Household Size | Owner-occupied | Renter-occupied |
| Less than High School | 2 (33.3%) | 4 (66.7%) |
| High School Diploma | 11 (61.1%) | 7 (38.9%) |
| College/Associate Degree | 21 (91.3%) | 2 (8.7%) |
| Bachelor's Degree or higher | 8 (80.0%) | 2 (20.0%) |
Occupancy by Age of Householder in Canadian
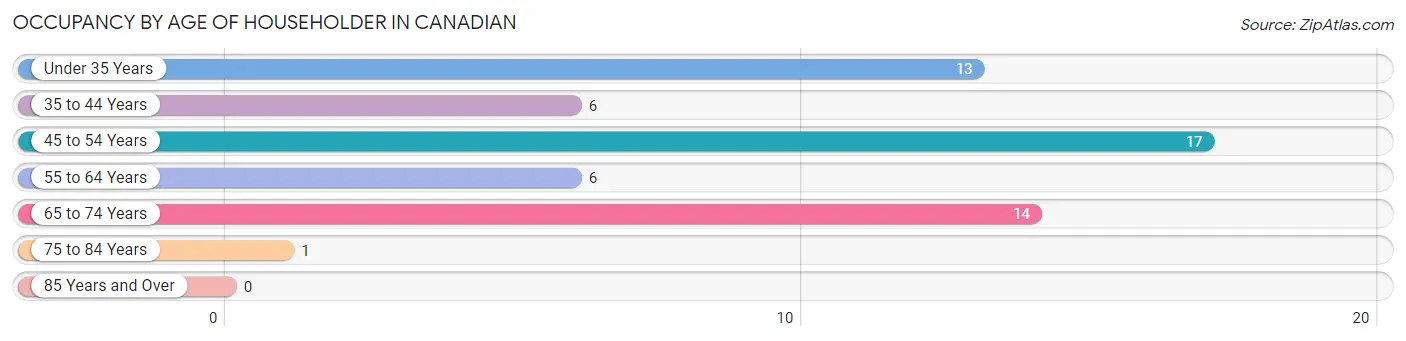
| Age Bracket | # Households | % Households |
| Under 35 Years | 13 | 22.8% |
| 35 to 44 Years | 6 | 10.5% |
| 45 to 54 Years | 17 | 29.8% |
| 55 to 64 Years | 6 | 10.5% |
| 65 to 74 Years | 14 | 24.6% |
| 75 to 84 Years | 1 | 1.8% |
| 85 Years and Over | 0 | 0.0% |
| Total | 57 | 100.0% |
Housing Finances in Canadian
Median Income by Occupancy in Canadian
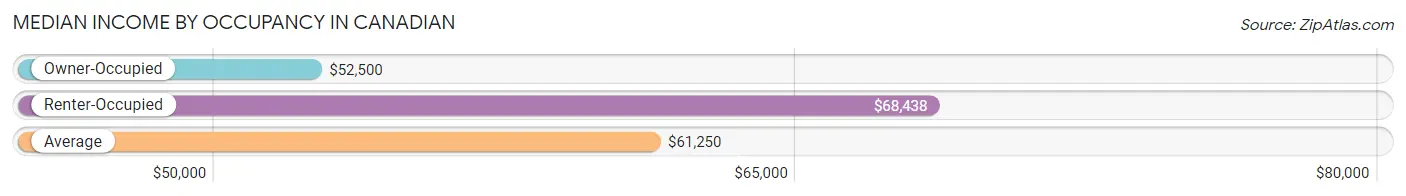
| Occupancy Type | # Households | Median Income |
| Owner-Occupied | 42 (73.7%) | $52,500 |
| Renter-Occupied | 15 (26.3%) | $68,438 |
| Average | 57 (100.0%) | $61,250 |
Occupancy by Householder Income Bracket in Canadian
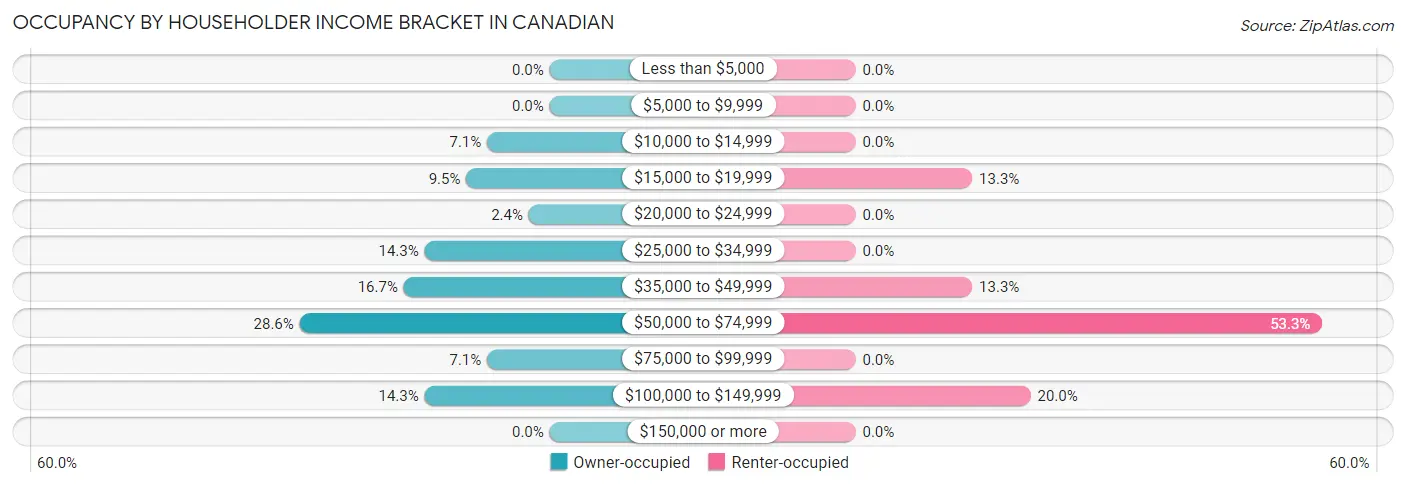
| Income Bracket | Owner-occupied | Renter-occupied |
| Less than $5,000 | 0 (0.0%) | 0 (0.0%) |
| $5,000 to $9,999 | 0 (0.0%) | 0 (0.0%) |
| $10,000 to $14,999 | 3 (7.1%) | 0 (0.0%) |
| $15,000 to $19,999 | 4 (9.5%) | 2 (13.3%) |
| $20,000 to $24,999 | 1 (2.4%) | 0 (0.0%) |
| $25,000 to $34,999 | 6 (14.3%) | 0 (0.0%) |
| $35,000 to $49,999 | 7 (16.7%) | 2 (13.3%) |
| $50,000 to $74,999 | 12 (28.6%) | 8 (53.3%) |
| $75,000 to $99,999 | 3 (7.1%) | 0 (0.0%) |
| $100,000 to $149,999 | 6 (14.3%) | 3 (20.0%) |
| $150,000 or more | 0 (0.0%) | 0 (0.0%) |
| Total | 42 (100.0%) | 15 (100.0%) |
Monthly Housing Cost Tiers in Canadian
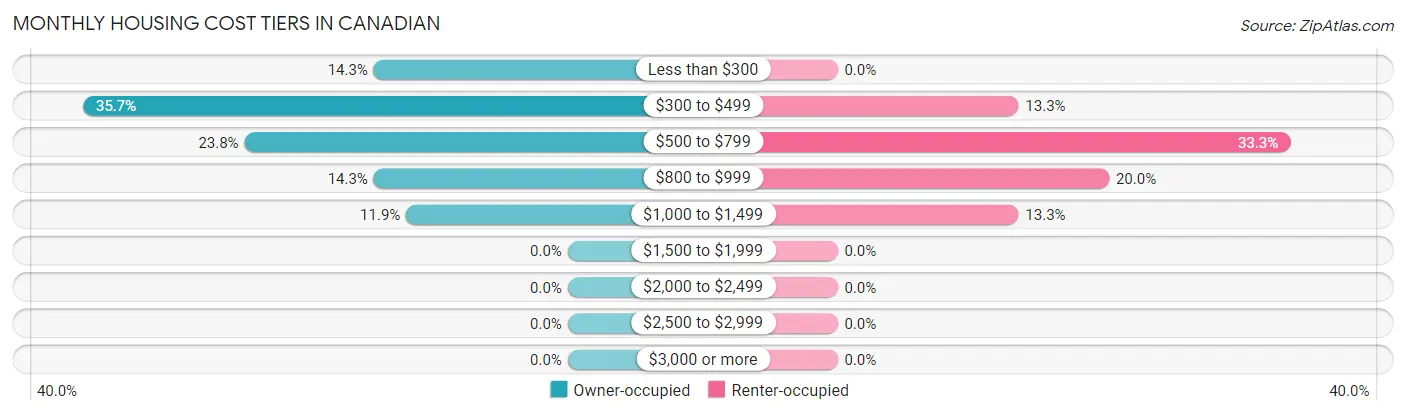
| Monthly Cost | Owner-occupied | Renter-occupied |
| Less than $300 | 6 (14.3%) | 0 (0.0%) |
| $300 to $499 | 15 (35.7%) | 2 (13.3%) |
| $500 to $799 | 10 (23.8%) | 5 (33.3%) |
| $800 to $999 | 6 (14.3%) | 3 (20.0%) |
| $1,000 to $1,499 | 5 (11.9%) | 2 (13.3%) |
| $1,500 to $1,999 | 0 (0.0%) | 0 (0.0%) |
| $2,000 to $2,499 | 0 (0.0%) | 0 (0.0%) |
| $2,500 to $2,999 | 0 (0.0%) | 0 (0.0%) |
| $3,000 or more | 0 (0.0%) | 0 (0.0%) |
| Total | 42 (100.0%) | 15 (100.0%) |
Physical Housing Characteristics in Canadian
Housing Structures in Canadian
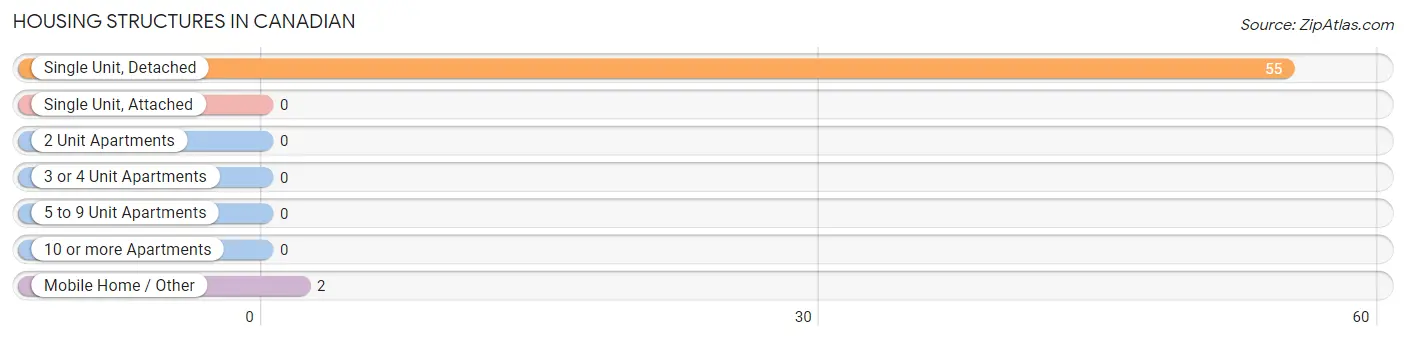
| Structure Type | # Housing Units | % Housing Units |
| Single Unit, Detached | 55 | 96.5% |
| Single Unit, Attached | 0 | 0.0% |
| 2 Unit Apartments | 0 | 0.0% |
| 3 or 4 Unit Apartments | 0 | 0.0% |
| 5 to 9 Unit Apartments | 0 | 0.0% |
| 10 or more Apartments | 0 | 0.0% |
| Mobile Home / Other | 2 | 3.5% |
| Total | 57 | 100.0% |
Housing Structures by Occupancy in Canadian
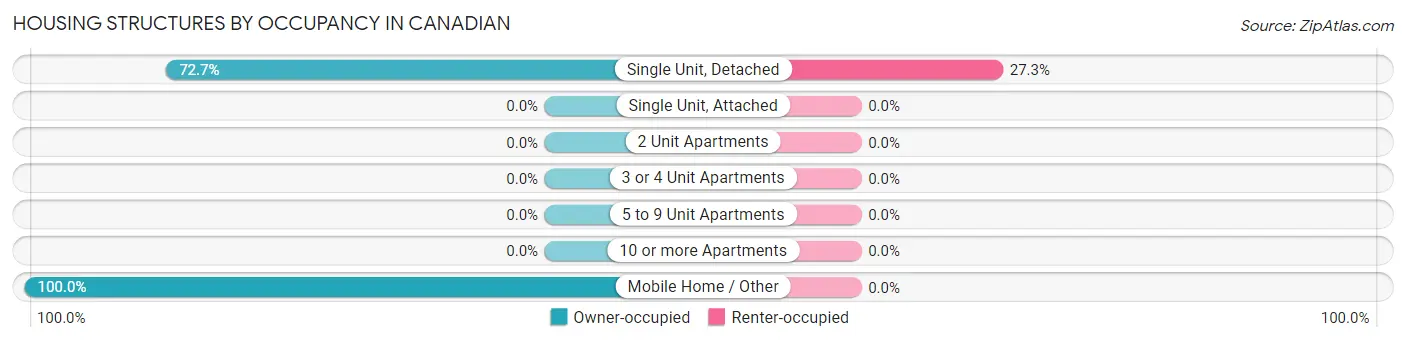
| Structure Type | Owner-occupied | Renter-occupied |
| Single Unit, Detached | 40 (72.7%) | 15 (27.3%) |
| Single Unit, Attached | 0 (0.0%) | 0 (0.0%) |
| 2 Unit Apartments | 0 (0.0%) | 0 (0.0%) |
| 3 or 4 Unit Apartments | 0 (0.0%) | 0 (0.0%) |
| 5 to 9 Unit Apartments | 0 (0.0%) | 0 (0.0%) |
| 10 or more Apartments | 0 (0.0%) | 0 (0.0%) |
| Mobile Home / Other | 2 (100.0%) | 0 (0.0%) |
| Total | 42 (73.7%) | 15 (26.3%) |
Housing Structures by Number of Rooms in Canadian
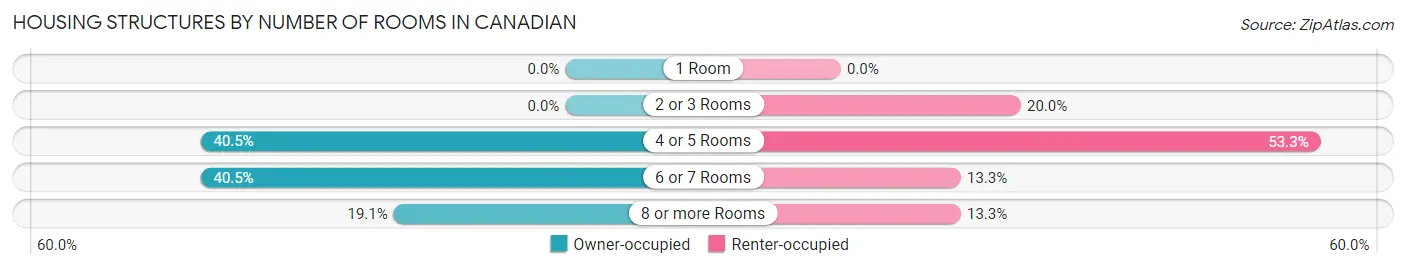
| Number of Rooms | Owner-occupied | Renter-occupied |
| 1 Room | 0 (0.0%) | 0 (0.0%) |
| 2 or 3 Rooms | 0 (0.0%) | 3 (20.0%) |
| 4 or 5 Rooms | 17 (40.5%) | 8 (53.3%) |
| 6 or 7 Rooms | 17 (40.5%) | 2 (13.3%) |
| 8 or more Rooms | 8 (19.1%) | 2 (13.3%) |
| Total | 42 (100.0%) | 15 (100.0%) |
Housing Structure by Heating Type in Canadian
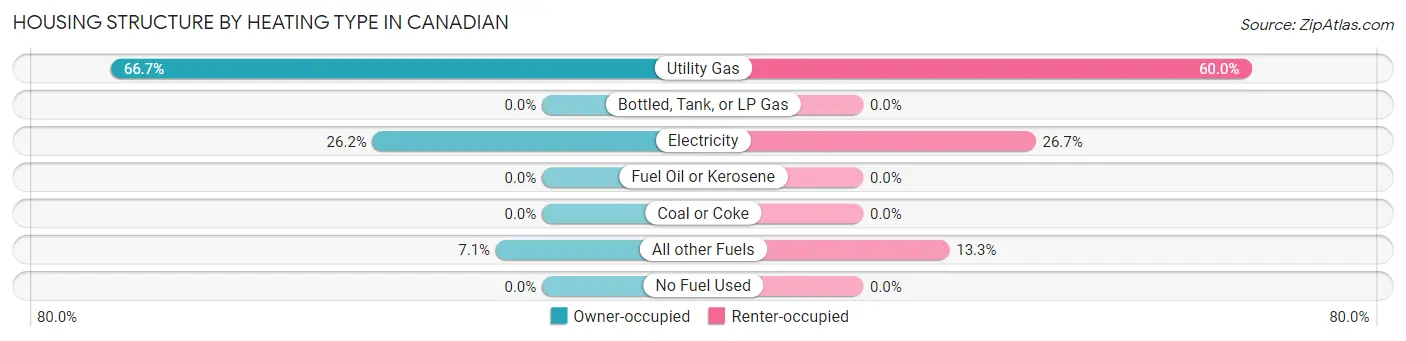
| Heating Type | Owner-occupied | Renter-occupied |
| Utility Gas | 28 (66.7%) | 9 (60.0%) |
| Bottled, Tank, or LP Gas | 0 (0.0%) | 0 (0.0%) |
| Electricity | 11 (26.2%) | 4 (26.7%) |
| Fuel Oil or Kerosene | 0 (0.0%) | 0 (0.0%) |
| Coal or Coke | 0 (0.0%) | 0 (0.0%) |
| All other Fuels | 3 (7.1%) | 2 (13.3%) |
| No Fuel Used | 0 (0.0%) | 0 (0.0%) |
| Total | 42 (100.0%) | 15 (100.0%) |
Household Vehicle Usage in Canadian
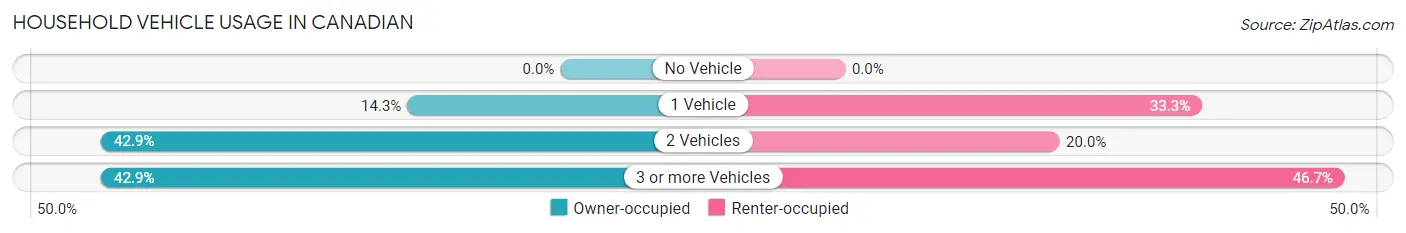
| Vehicles per Household | Owner-occupied | Renter-occupied |
| No Vehicle | 0 (0.0%) | 0 (0.0%) |
| 1 Vehicle | 6 (14.3%) | 5 (33.3%) |
| 2 Vehicles | 18 (42.9%) | 3 (20.0%) |
| 3 or more Vehicles | 18 (42.9%) | 7 (46.7%) |
| Total | 42 (100.0%) | 15 (100.0%) |
Real Estate & Mortgages in Canadian
Real Estate and Mortgage Overview in Canadian
| Characteristic | Without Mortgage | With Mortgage |
| Housing Units | 25 | 17 |
| Median Property Value | $55,600 | $84,200 |
| Median Household Income | $38,750 | $0 |
| Monthly Housing Costs | $359 | $0 |
| Real Estate Taxes | $260 | $0 |
Property Value by Mortgage Status in Canadian
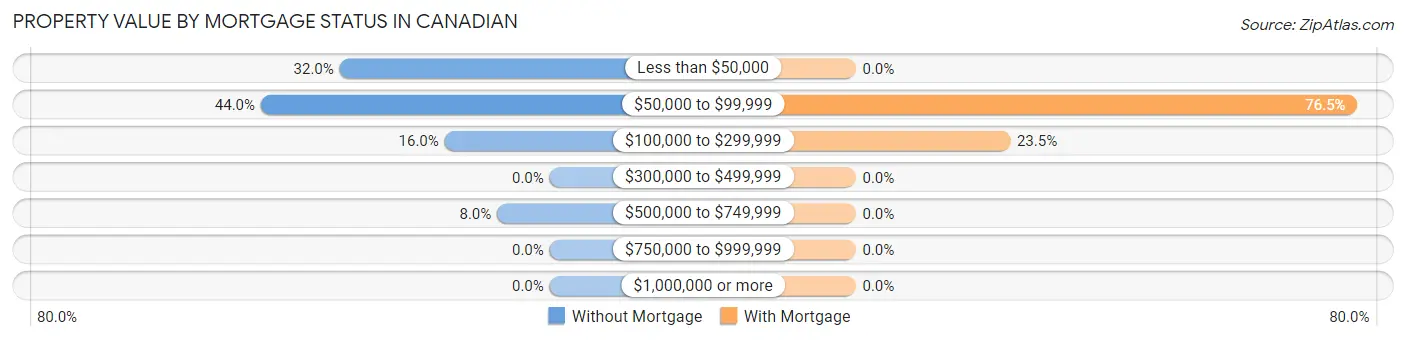
| Property Value | Without Mortgage | With Mortgage |
| Less than $50,000 | 8 (32.0%) | 0 (0.0%) |
| $50,000 to $99,999 | 11 (44.0%) | 13 (76.5%) |
| $100,000 to $299,999 | 4 (16.0%) | 4 (23.5%) |
| $300,000 to $499,999 | 0 (0.0%) | 0 (0.0%) |
| $500,000 to $749,999 | 2 (8.0%) | 0 (0.0%) |
| $750,000 to $999,999 | 0 (0.0%) | 0 (0.0%) |
| $1,000,000 or more | 0 (0.0%) | 0 (0.0%) |
| Total | 25 (100.0%) | 17 (100.0%) |
Household Income by Mortgage Status in Canadian
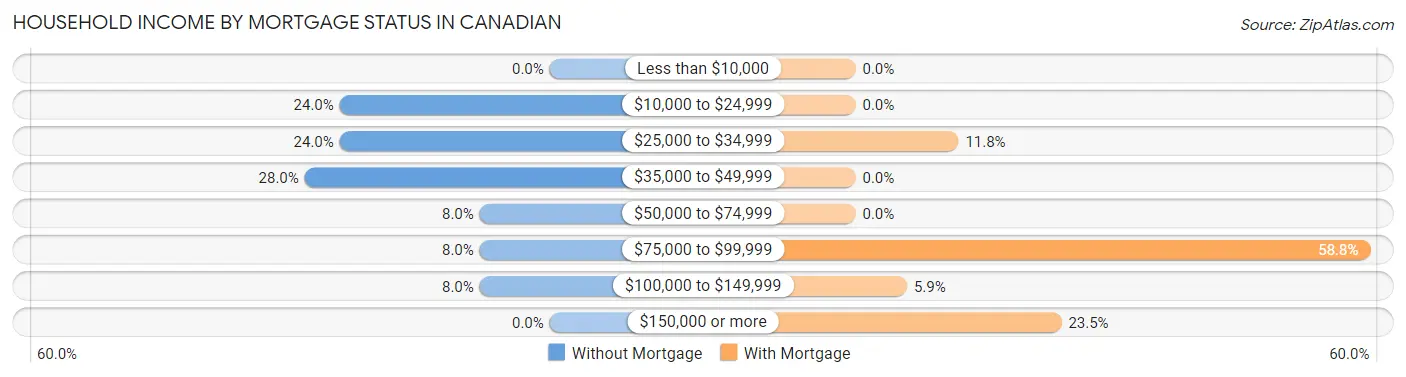
| Household Income | Without Mortgage | With Mortgage |
| Less than $10,000 | 0 (0.0%) | 0 (0.0%) |
| $10,000 to $24,999 | 6 (24.0%) | 0 (0.0%) |
| $25,000 to $34,999 | 6 (24.0%) | 2 (11.8%) |
| $35,000 to $49,999 | 7 (28.0%) | 0 (0.0%) |
| $50,000 to $74,999 | 2 (8.0%) | 0 (0.0%) |
| $75,000 to $99,999 | 2 (8.0%) | 10 (58.8%) |
| $100,000 to $149,999 | 2 (8.0%) | 1 (5.9%) |
| $150,000 or more | 0 (0.0%) | 4 (23.5%) |
| Total | 25 (100.0%) | 17 (100.0%) |
Property Value to Household Income Ratio in Canadian
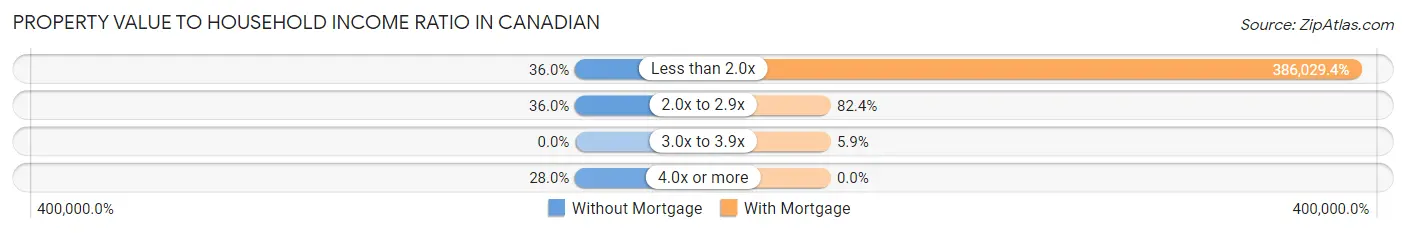
| Value-to-Income Ratio | Without Mortgage | With Mortgage |
| Less than 2.0x | 9 (36.0%) | 65,625 (386,029.4%) |
| 2.0x to 2.9x | 9 (36.0%) | 14 (82.4%) |
| 3.0x to 3.9x | 0 (0.0%) | 1 (5.9%) |
| 4.0x or more | 7 (28.0%) | 0 (0.0%) |
| Total | 25 (100.0%) | 17 (100.0%) |
Real Estate Taxes by Mortgage Status in Canadian
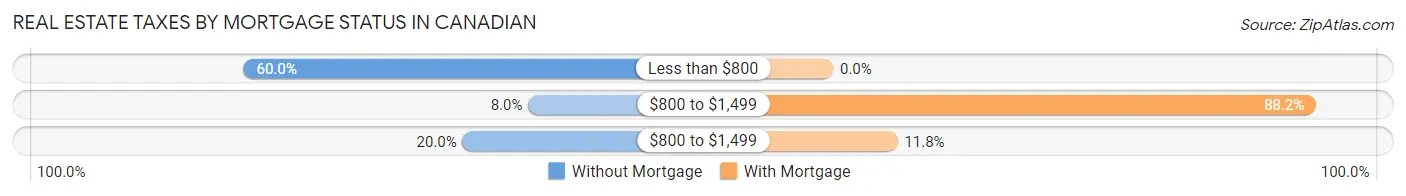
| Property Taxes | Without Mortgage | With Mortgage |
| Less than $800 | 15 (60.0%) | 0 (0.0%) |
| $800 to $1,499 | 2 (8.0%) | 15 (88.2%) |
| $800 to $1,499 | 5 (20.0%) | 2 (11.8%) |
| Total | 25 (100.0%) | 17 (100.0%) |
Health & Disability in Canadian
Health Insurance Coverage by Age in Canadian
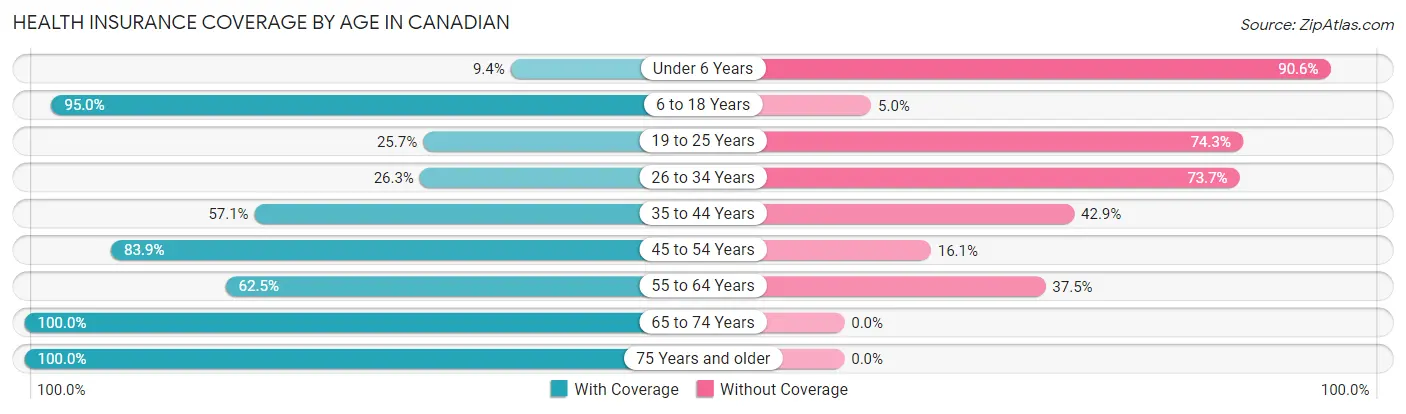
| Age Bracket | With Coverage | Without Coverage |
| Under 6 Years | 3 (9.4%) | 29 (90.6%) |
| 6 to 18 Years | 38 (95.0%) | 2 (5.0%) |
| 19 to 25 Years | 9 (25.7%) | 26 (74.3%) |
| 26 to 34 Years | 5 (26.3%) | 14 (73.7%) |
| 35 to 44 Years | 8 (57.1%) | 6 (42.9%) |
| 45 to 54 Years | 26 (83.9%) | 5 (16.1%) |
| 55 to 64 Years | 10 (62.5%) | 6 (37.5%) |
| 65 to 74 Years | 22 (100.0%) | 0 (0.0%) |
| 75 Years and older | 3 (100.0%) | 0 (0.0%) |
| Total | 124 (58.5%) | 88 (41.5%) |
Health Insurance Coverage by Citizenship Status in Canadian
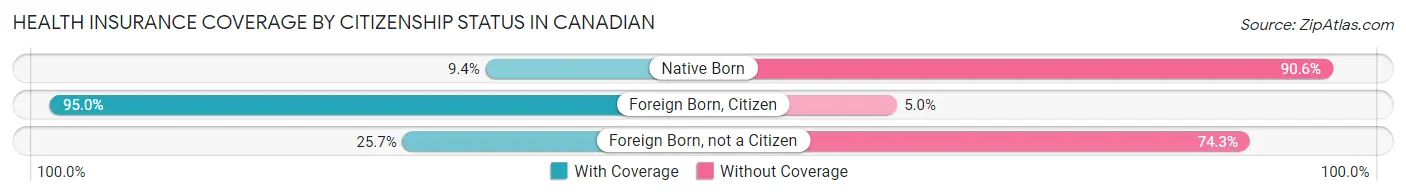
| Citizenship Status | With Coverage | Without Coverage |
| Native Born | 3 (9.4%) | 29 (90.6%) |
| Foreign Born, Citizen | 38 (95.0%) | 2 (5.0%) |
| Foreign Born, not a Citizen | 9 (25.7%) | 26 (74.3%) |
Health Insurance Coverage by Household Income in Canadian
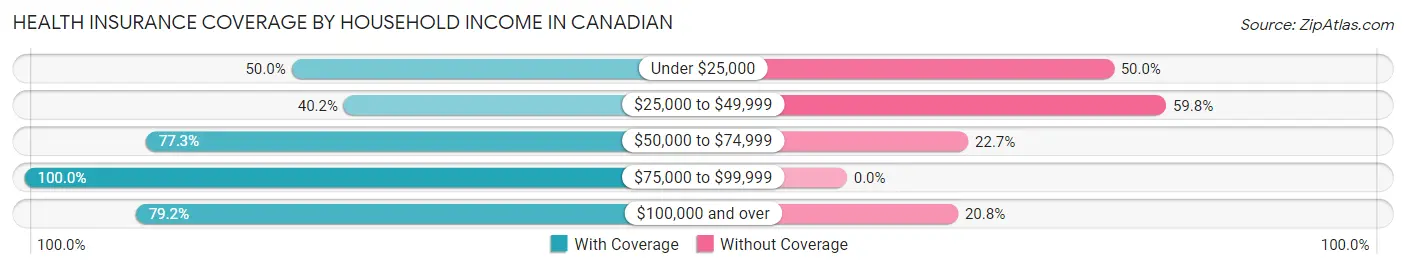
| Household Income | With Coverage | Without Coverage |
| Under $25,000 | 7 (50.0%) | 7 (50.0%) |
| $25,000 to $49,999 | 41 (40.2%) | 61 (59.8%) |
| $50,000 to $74,999 | 51 (77.3%) | 15 (22.7%) |
| $75,000 to $99,999 | 6 (100.0%) | 0 (0.0%) |
| $100,000 and over | 19 (79.2%) | 5 (20.8%) |
Public vs Private Health Insurance Coverage by Age in Canadian
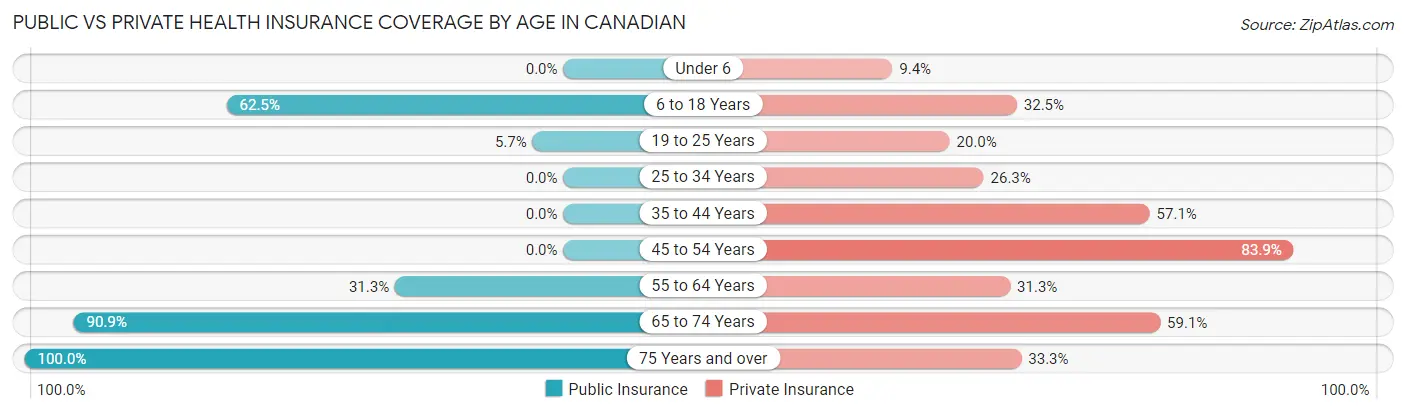
| Age Bracket | Public Insurance | Private Insurance |
| Under 6 | 0 (0.0%) | 3 (9.4%) |
| 6 to 18 Years | 25 (62.5%) | 13 (32.5%) |
| 19 to 25 Years | 2 (5.7%) | 7 (20.0%) |
| 25 to 34 Years | 0 (0.0%) | 5 (26.3%) |
| 35 to 44 Years | 0 (0.0%) | 8 (57.1%) |
| 45 to 54 Years | 0 (0.0%) | 26 (83.9%) |
| 55 to 64 Years | 5 (31.2%) | 5 (31.2%) |
| 65 to 74 Years | 20 (90.9%) | 13 (59.1%) |
| 75 Years and over | 3 (100.0%) | 1 (33.3%) |
| Total | 55 (25.9%) | 81 (38.2%) |
Disability Status by Sex by Age in Canadian
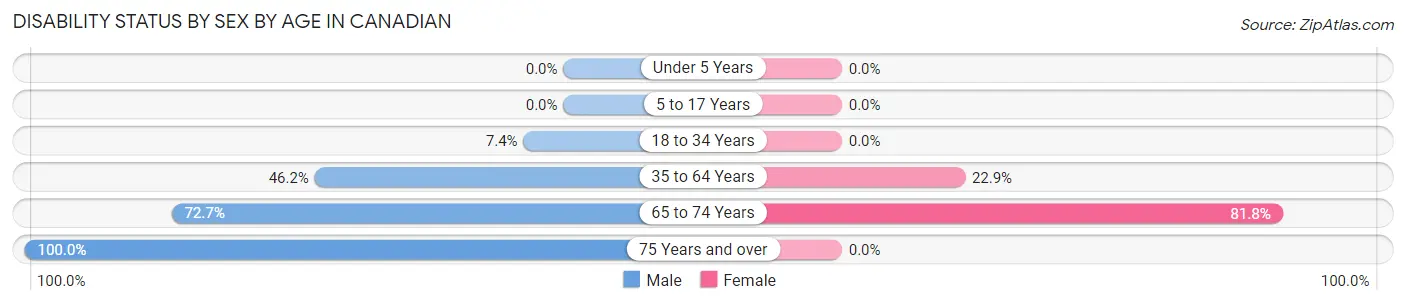
| Age Bracket | Male | Female |
| Under 5 Years | 0 (0.0%) | 0 (0.0%) |
| 5 to 17 Years | 0 (0.0%) | 0 (0.0%) |
| 18 to 34 Years | 2 (7.4%) | 0 (0.0%) |
| 35 to 64 Years | 12 (46.2%) | 8 (22.9%) |
| 65 to 74 Years | 8 (72.7%) | 9 (81.8%) |
| 75 Years and over | 3 (100.0%) | 0 (0.0%) |
Disability Class by Sex by Age in Canadian
Disability Class: Hearing Difficulty
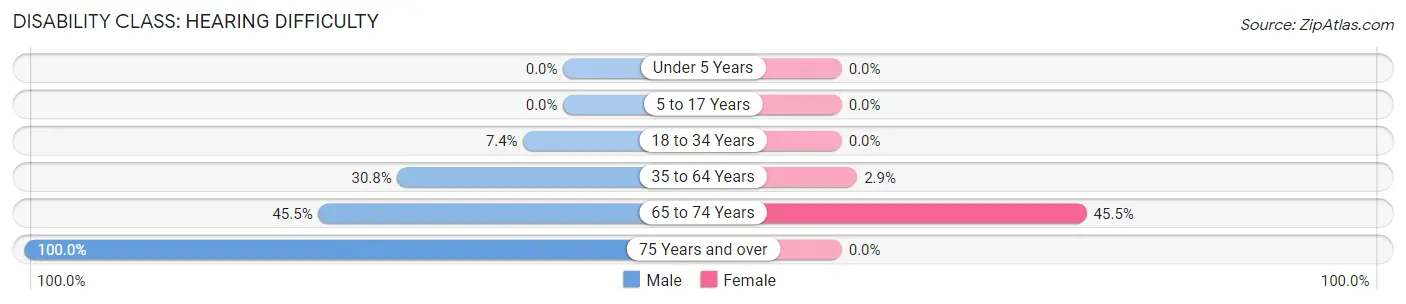
| Age Bracket | Male | Female |
| Under 5 Years | 0 (0.0%) | 0 (0.0%) |
| 5 to 17 Years | 0 (0.0%) | 0 (0.0%) |
| 18 to 34 Years | 2 (7.4%) | 0 (0.0%) |
| 35 to 64 Years | 8 (30.8%) | 1 (2.9%) |
| 65 to 74 Years | 5 (45.5%) | 5 (45.5%) |
| 75 Years and over | 3 (100.0%) | 0 (0.0%) |
Disability Class: Vision Difficulty
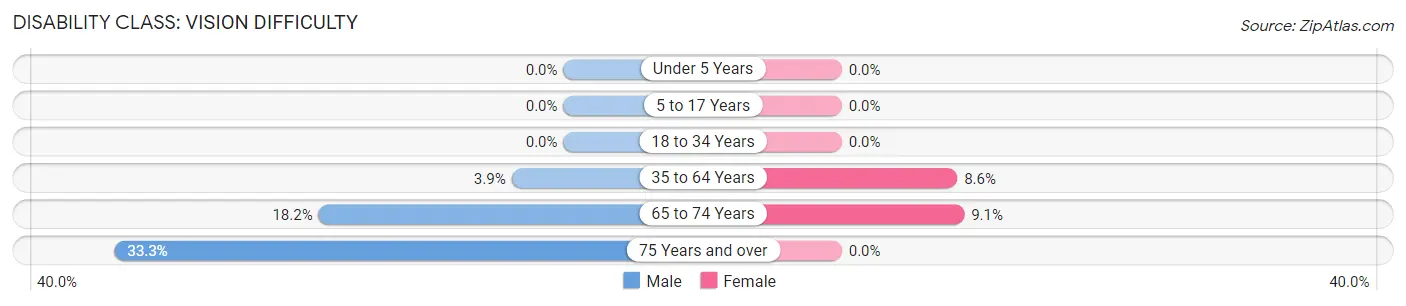
| Age Bracket | Male | Female |
| Under 5 Years | 0 (0.0%) | 0 (0.0%) |
| 5 to 17 Years | 0 (0.0%) | 0 (0.0%) |
| 18 to 34 Years | 0 (0.0%) | 0 (0.0%) |
| 35 to 64 Years | 1 (3.8%) | 3 (8.6%) |
| 65 to 74 Years | 2 (18.2%) | 1 (9.1%) |
| 75 Years and over | 1 (33.3%) | 0 (0.0%) |
Disability Class: Cognitive Difficulty
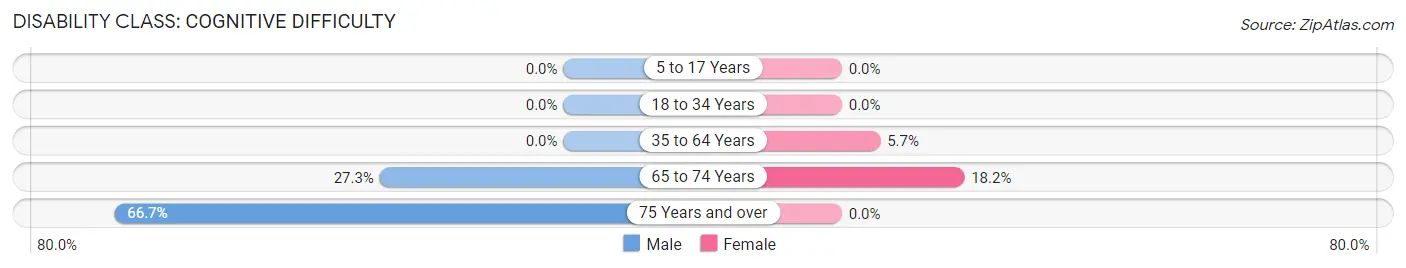
| Age Bracket | Male | Female |
| 5 to 17 Years | 0 (0.0%) | 0 (0.0%) |
| 18 to 34 Years | 0 (0.0%) | 0 (0.0%) |
| 35 to 64 Years | 0 (0.0%) | 2 (5.7%) |
| 65 to 74 Years | 3 (27.3%) | 2 (18.2%) |
| 75 Years and over | 2 (66.7%) | 0 (0.0%) |
Disability Class: Ambulatory Difficulty
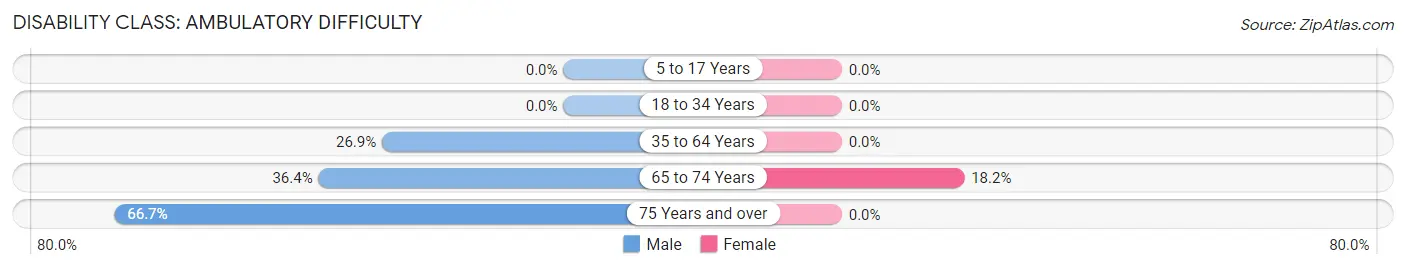
| Age Bracket | Male | Female |
| 5 to 17 Years | 0 (0.0%) | 0 (0.0%) |
| 18 to 34 Years | 0 (0.0%) | 0 (0.0%) |
| 35 to 64 Years | 7 (26.9%) | 0 (0.0%) |
| 65 to 74 Years | 4 (36.4%) | 2 (18.2%) |
| 75 Years and over | 2 (66.7%) | 0 (0.0%) |
Disability Class: Self-Care Difficulty
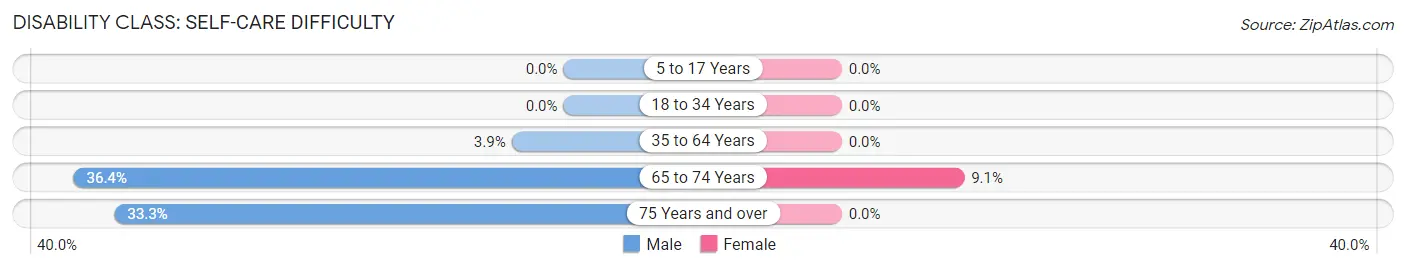
| Age Bracket | Male | Female |
| 5 to 17 Years | 0 (0.0%) | 0 (0.0%) |
| 18 to 34 Years | 0 (0.0%) | 0 (0.0%) |
| 35 to 64 Years | 1 (3.8%) | 0 (0.0%) |
| 65 to 74 Years | 4 (36.4%) | 1 (9.1%) |
| 75 Years and over | 1 (33.3%) | 0 (0.0%) |
Technology Access in Canadian
Computing Device Access in Canadian
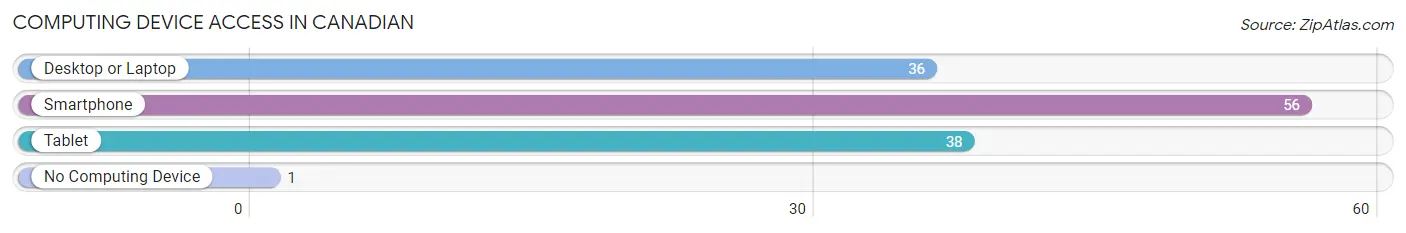
| Device Type | # Households | % Households |
| Desktop or Laptop | 36 | 63.2% |
| Smartphone | 56 | 98.3% |
| Tablet | 38 | 66.7% |
| No Computing Device | 1 | 1.8% |
| Total | 57 | 100.0% |
Internet Access in Canadian
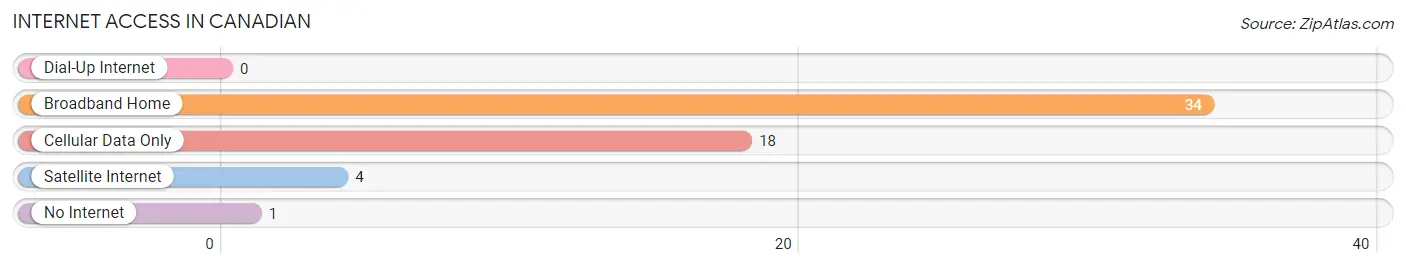
| Internet Type | # Households | % Households |
| Dial-Up Internet | 0 | 0.0% |
| Broadband Home | 34 | 59.7% |
| Cellular Data Only | 18 | 31.6% |
| Satellite Internet | 4 | 7.0% |
| No Internet | 1 | 1.8% |
| Total | 57 | 100.0% |
Canadian Summary
Canada is a country located in the northern part of North America, bordered by the United States to the south and the Arctic Ocean to the north. It is the world's second-largest country by total area, and its population of approximately 37 million people makes it the world's 38th most populous country. Canada is a federal parliamentary democracy and a constitutional monarchy, with Queen Elizabeth II as its head of state.
Oklahoma is a state located in the south-central region of the United States. It is bordered by Texas to the south, Arkansas and Missouri to the east, Kansas to the north, and Colorado and New Mexico to the west. Oklahoma has a population of approximately 3.9 million people, making it the 28th most populous state in the country. It is the 20th largest state in terms of total area, and its capital and largest city is Oklahoma City.
History
Canada has a long and complex history, beginning with the first inhabitants of the land, the Indigenous peoples. The first Europeans to arrive in Canada were the French, who established a colony in what is now Quebec in the early 17th century. The British later took control of the region, and in 1867, the British North America Act established the Dominion of Canada, uniting the provinces of Ontario, Quebec, Nova Scotia, and New Brunswick into a single country. Since then, Canada has grown to include 10 provinces and three territories, and has become a multicultural nation with a strong economy and a vibrant culture.
Oklahoma has a similarly long and complex history. The area was originally inhabited by Indigenous peoples, including the Apache, Comanche, and Kiowa. In the early 19th century, the area was part of the Louisiana Purchase, and was later organized as part of the Indian Territory. In 1907, Oklahoma became the 46th state to join the Union. Since then, Oklahoma has grown to become an important part of the United States, with a strong economy and a diverse population.
Geography
Canada is a vast country, stretching from the Atlantic Ocean in the east to the Pacific Ocean in the west. It is bordered by the United States to the south and the Arctic Ocean to the north. Canada is divided into 10 provinces and three territories, each with its own unique geography. The country is home to a wide variety of landscapes, from the Rocky Mountains in the west to the Great Lakes in the east.
Oklahoma is located in the south-central region of the United States. It is bordered by Texas to the south, Arkansas and Missouri to the east, Kansas to the north, and Colorado and New Mexico to the west. Oklahoma is divided into 77 counties, and its landscape is characterized by rolling hills, prairies, and forests. The state is home to a number of natural attractions, including the Ozark Mountains, the Wichita Mountains, and the Great Salt Plains.
Economy
Canada has a strong and diversified economy, with a GDP of approximately $1.7 trillion in 2019. The country is a major exporter of natural resources, including oil, natural gas, and timber. It is also a major producer of agricultural products, including wheat, corn, and livestock. The service sector is the largest contributor to the Canadian economy, accounting for approximately 70% of GDP.
Oklahoma has a strong and diversified economy, with a GDP of approximately $200 billion in 2019. The state is a major producer of oil and natural gas, and is also a major producer of agricultural products, including wheat, corn, and livestock. The service sector is the largest contributor to the Oklahoma economy, accounting for approximately 70% of GDP. The state is also home to a number of major industries, including aerospace, energy, and manufacturing.
Demographics
Canada is a multicultural nation, with a population of approximately 37 million people. The majority of the population is of European descent, with the largest ethnic groups being English, French, Scottish, Irish, German, and Italian. The country is also home to a large number of Indigenous peoples, including the Inuit, Métis, and First Nations.
Oklahoma has a population of approximately 3.9 million people. The majority of the population is of European descent, with the largest ethnic groups being German, Irish, English, and Native American. The state is also home to a large number of African Americans, Hispanics, and Asians. The state has a diverse religious landscape, with the largest denominations being Baptist, Methodist, and Catholic.
Common Questions
What is Per Capita Income in Canadian?
Per Capita income in Canadian is $15,723.
What is the Median Family Income in Canadian?
Median Family Income in Canadian is $60,750.
What is the Median Household income in Canadian?
Median Household Income in Canadian is $61,250.
What is Income or Wage Gap in Canadian?
Income or Wage Gap in Canadian is 22.0%.
Women in Canadian earn 78.0 cents for every dollar earned by a man.
What is Inequality or Gini Index in Canadian?
Inequality or Gini Index in Canadian is 0.32.
What is the Total Population of Canadian?
Total Population of Canadian is 212.
What is the Total Male Population of Canadian?
Total Male Population of Canadian is 86.
What is the Total Female Population of Canadian?
Total Female Population of Canadian is 126.
What is the Ratio of Males per 100 Females in Canadian?
There are 68.25 Males per 100 Females in Canadian.
What is the Ratio of Females per 100 Males in Canadian?
There are 146.51 Females per 100 Males in Canadian.
What is the Median Population Age in Canadian?
Median Population Age in Canadian is 25.9 Years.
What is the Average Family Size in Canadian
Average Family Size in Canadian is 4.5 People.
What is the Average Household Size in Canadian
Average Household Size in Canadian is 3.7 People.
How Large is the Labor Force in Canadian?
There are 84 People in the Labor Forcein in Canadian.
What is the Percentage of People in the Labor Force in Canadian?
56.0% of People are in the Labor Force in Canadian.
What is the Unemployment Rate in Canadian?
Unemployment Rate in Canadian is 3.6%.