La Huerta, NM Map & Demographics
La Huerta Map
La Huerta Overview
$49,652
PER CAPITA INCOME
$149,864
AVG FAMILY INCOME
0.41
INEQUALITY / GINI INDEX
1,274
TOTAL POPULATION
742
MALE POPULATION
532
FEMALE POPULATION
139.47
MALES / 100 FEMALES
71.70
FEMALES / 100 MALES
37.5
MEDIAN AGE
3.1
AVG FAMILY SIZE
2.6
AVG HOUSEHOLD SIZE
691
LABOR FORCE [ PEOPLE ]
69.0%
PERCENT IN LABOR FORCE
Income in La Huerta
Income Overview in La Huerta
| Characteristic | Number | Measure |
| Per Capita Income | 1,274 | $49,652 |
| Median Family Income | 361 | $149,864 |
| Mean Family Income | 361 | $156,534 |
| Median Household Income | 483 | $0 |
| Mean Household Income | 483 | $129,273 |
| Income Deficit | 361 | $0 |
| Wage / Income Gap (%) | 1,274 | 0.00% |
| Wage / Income Gap ($) | 1,274 | 100.00¢ per $1 |
| Gini / Inequality Index | 1,274 | 0.41 |
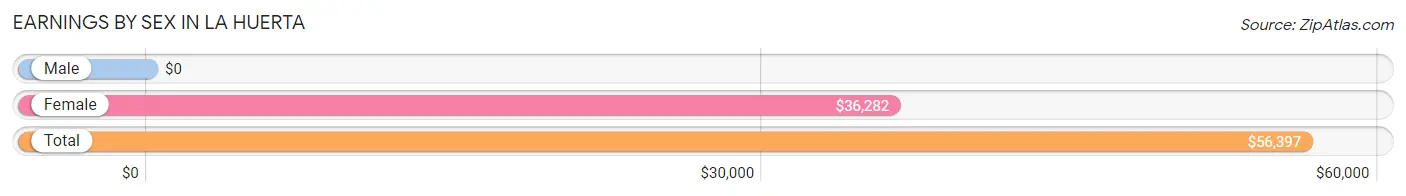
Earnings by Sex in La Huerta
| Sex | Number | Average Earnings |
| Male | 427 (56.4%) | $0 |
| Female | 330 (43.6%) | $36,282 |
| Total | 757 (100.0%) | $56,397 |
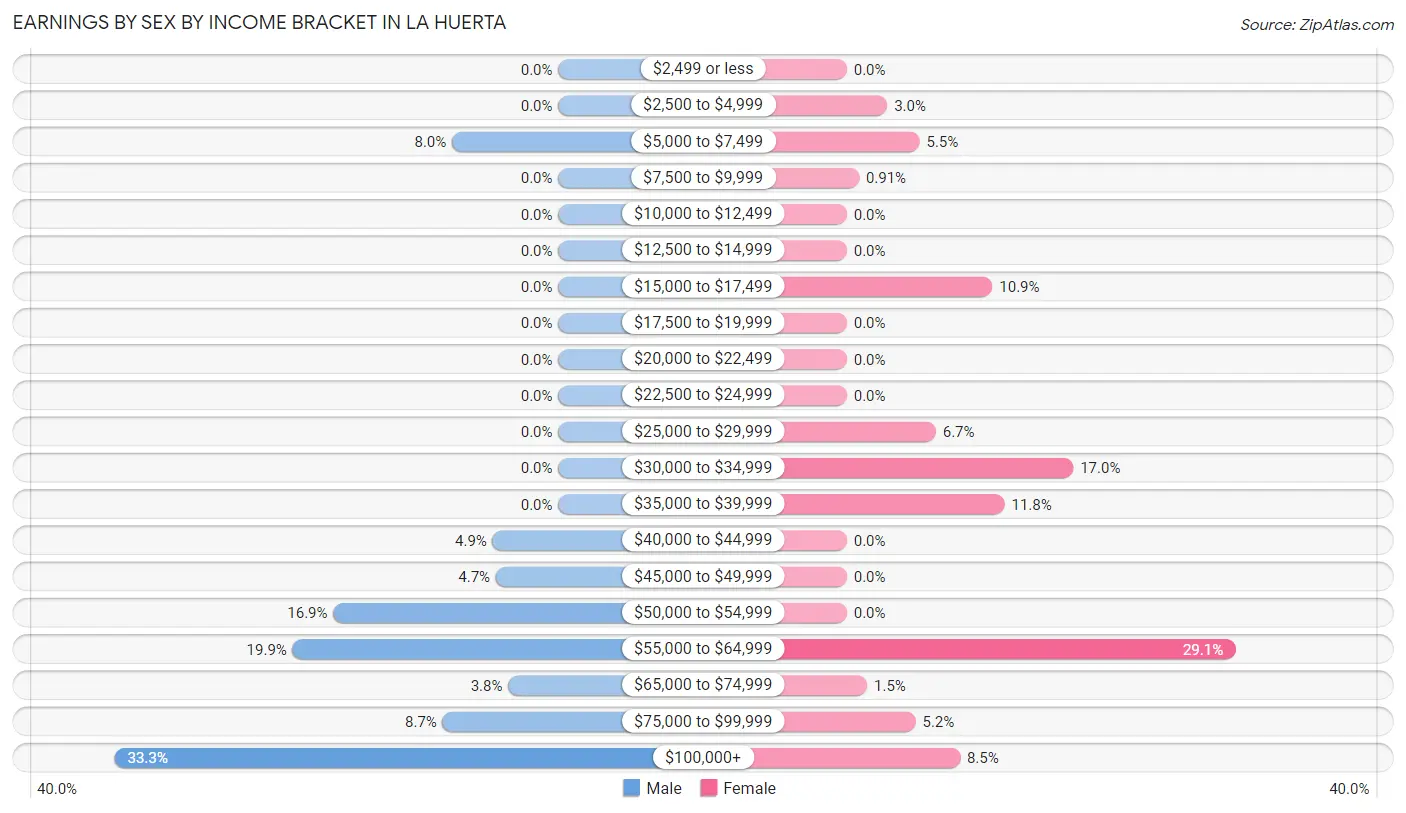
Earnings by Sex by Income Bracket in La Huerta
The most common earnings brackets in La Huerta are $100,000+ for men (142 | 33.3%) and $55,000 to $64,999 for women (96 | 29.1%).
| Income | Male | Female |
| $2,499 or less | 0 (0.0%) | 0 (0.0%) |
| $2,500 to $4,999 | 0 (0.0%) | 10 (3.0%) |
| $5,000 to $7,499 | 34 (8.0%) | 18 (5.4%) |
| $7,500 to $9,999 | 0 (0.0%) | 3 (0.9%) |
| $10,000 to $12,499 | 0 (0.0%) | 0 (0.0%) |
| $12,500 to $14,999 | 0 (0.0%) | 0 (0.0%) |
| $15,000 to $17,499 | 0 (0.0%) | 36 (10.9%) |
| $17,500 to $19,999 | 0 (0.0%) | 0 (0.0%) |
| $20,000 to $22,499 | 0 (0.0%) | 0 (0.0%) |
| $22,500 to $24,999 | 0 (0.0%) | 0 (0.0%) |
| $25,000 to $29,999 | 0 (0.0%) | 22 (6.7%) |
| $30,000 to $34,999 | 0 (0.0%) | 56 (17.0%) |
| $35,000 to $39,999 | 0 (0.0%) | 39 (11.8%) |
| $40,000 to $44,999 | 21 (4.9%) | 0 (0.0%) |
| $45,000 to $49,999 | 20 (4.7%) | 0 (0.0%) |
| $50,000 to $54,999 | 72 (16.9%) | 0 (0.0%) |
| $55,000 to $64,999 | 85 (19.9%) | 96 (29.1%) |
| $65,000 to $74,999 | 16 (3.7%) | 5 (1.5%) |
| $75,000 to $99,999 | 37 (8.7%) | 17 (5.1%) |
| $100,000+ | 142 (33.3%) | 28 (8.5%) |
| Total | 427 (100.0%) | 330 (100.0%) |
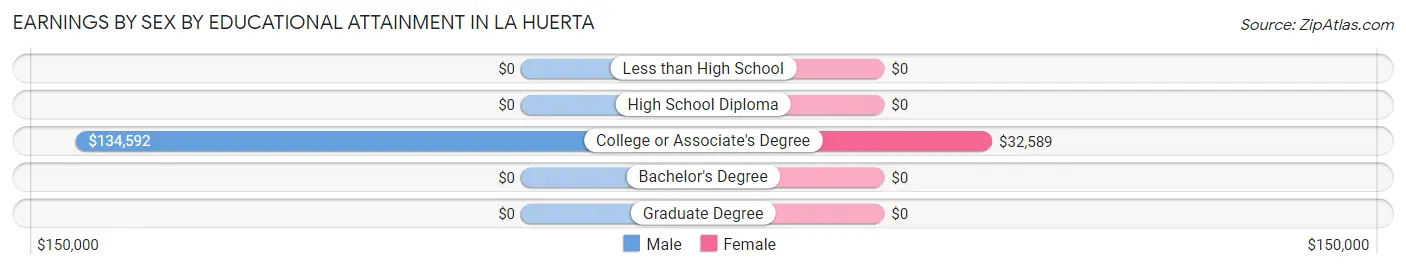
Earnings by Sex by Educational Attainment in La Huerta
| Educational Attainment | Male Income | Female Income |
| Less than High School | - | - |
| High School Diploma | - | - |
| College or Associate's Degree | $134,592 | $32,589 |
| Bachelor's Degree | - | - |
| Graduate Degree | - | - |
| Total | $95,682 | $0 |
Family Income in La Huerta
Family Income Brackets in La Huerta
According to the La Huerta family income data, there are 101 families falling into the $200,000+ income range, which is the most common income bracket and makes up 28.0% of all families.
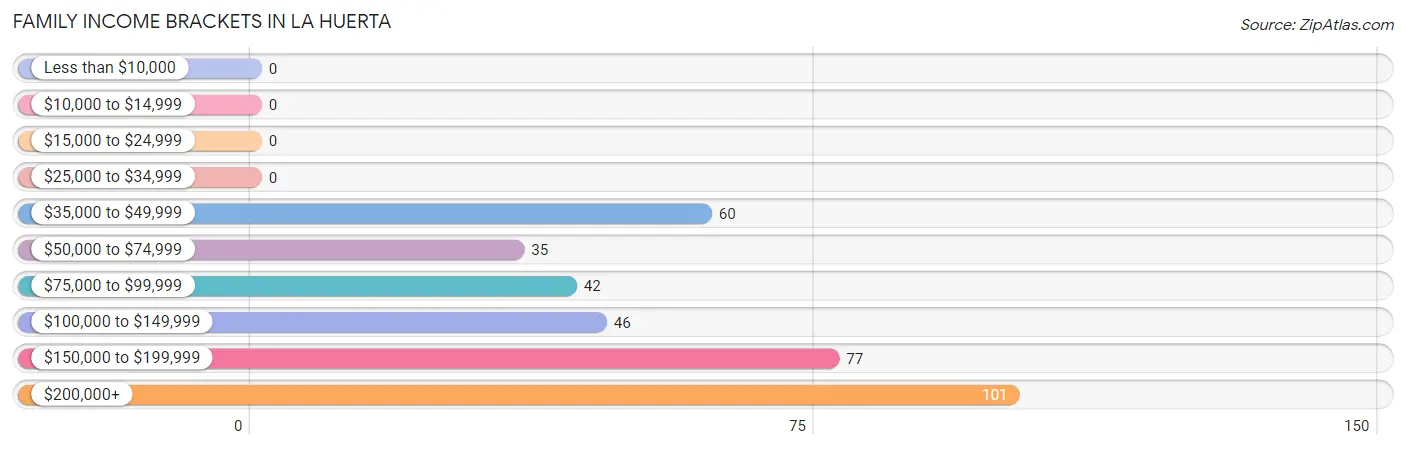
| Income Bracket | # Families | % Families |
| Less than $10,000 | 0 | 0.0% |
| $10,000 to $14,999 | 0 | 0.0% |
| $15,000 to $24,999 | 0 | 0.0% |
| $25,000 to $34,999 | 0 | 0.0% |
| $35,000 to $49,999 | 60 | 16.6% |
| $50,000 to $74,999 | 35 | 9.7% |
| $75,000 to $99,999 | 42 | 11.6% |
| $100,000 to $149,999 | 46 | 12.7% |
| $150,000 to $199,999 | 77 | 21.3% |
| $200,000+ | 101 | 28.0% |
Family Income by Famaliy Size in La Huerta
2-person families (159 | 44.0%) account for the highest median family income in La Huerta with $148,560 per family, while 2-person families (159 | 44.0%) have the highest median income of $74,280 per family member.
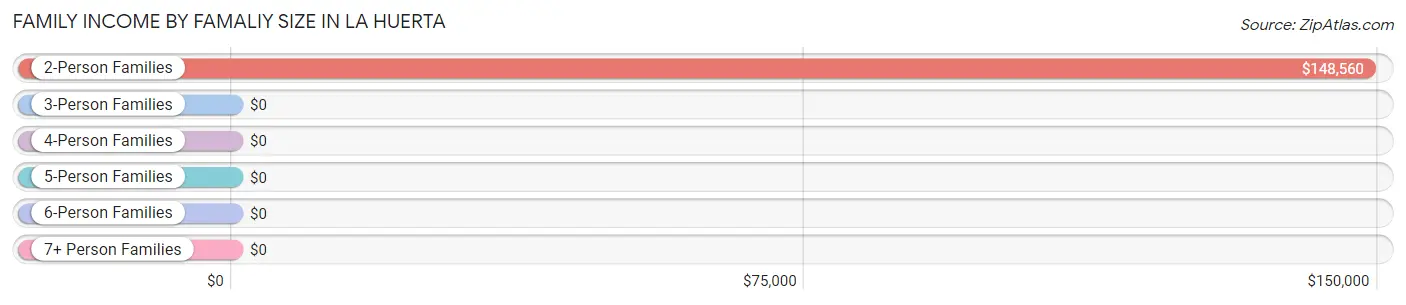
| Income Bracket | # Families | Median Income |
| 2-Person Families | 159 (44.0%) | $148,560 |
| 3-Person Families | 129 (35.7%) | $0 |
| 4-Person Families | 22 (6.1%) | $0 |
| 5-Person Families | 24 (6.7%) | $0 |
| 6-Person Families | 22 (6.1%) | $0 |
| 7+ Person Families | 5 (1.4%) | $0 |
| Total | 361 (100.0%) | $149,864 |
Family Income by Number of Earners in La Huerta
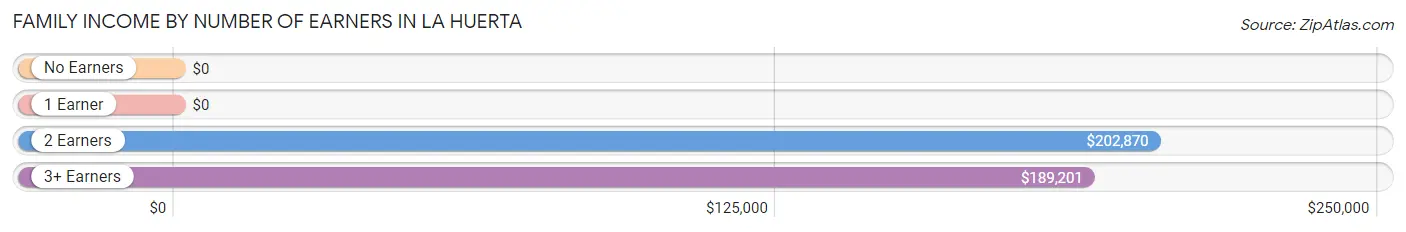
| Number of Earners | # Families | Median Income |
| No Earners | 19 (5.3%) | $0 |
| 1 Earner | 102 (28.2%) | $0 |
| 2 Earners | 142 (39.3%) | $202,870 |
| 3+ Earners | 98 (27.2%) | $189,201 |
| Total | 361 (100.0%) | $149,864 |
Household Income in La Huerta
Household Income Brackets in La Huerta
With 101 households falling in the category, the $200,000+ income range is the most frequent in La Huerta, accounting for 20.9% of all households.
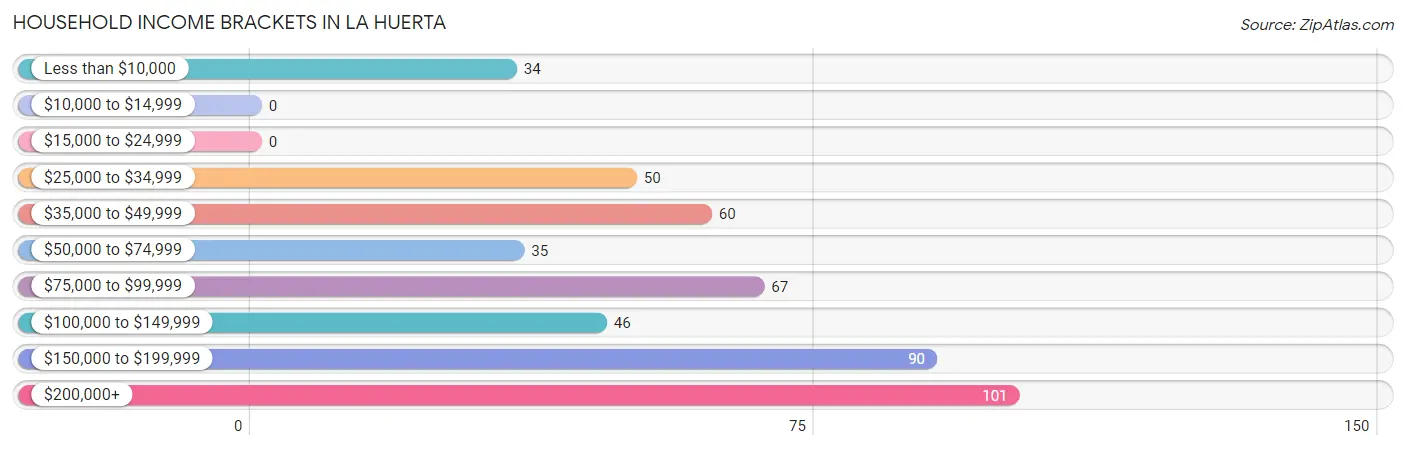
| Income Bracket | # Households | % Households |
| Less than $10,000 | 34 | 7.0% |
| $10,000 to $14,999 | 0 | 0.0% |
| $15,000 to $24,999 | 0 | 0.0% |
| $25,000 to $34,999 | 50 | 10.4% |
| $35,000 to $49,999 | 60 | 12.4% |
| $50,000 to $74,999 | 35 | 7.2% |
| $75,000 to $99,999 | 67 | 13.9% |
| $100,000 to $149,999 | 46 | 9.5% |
| $150,000 to $199,999 | 90 | 18.6% |
| $200,000+ | 101 | 20.9% |
Household Income by Householder Age in La Huerta
The median household income in La Huerta is $0, with the highest median household income of $188,802 found in the 45 to 64 years age bracket for the primary householder. A total of 175 households (36.2%) fall into this category.
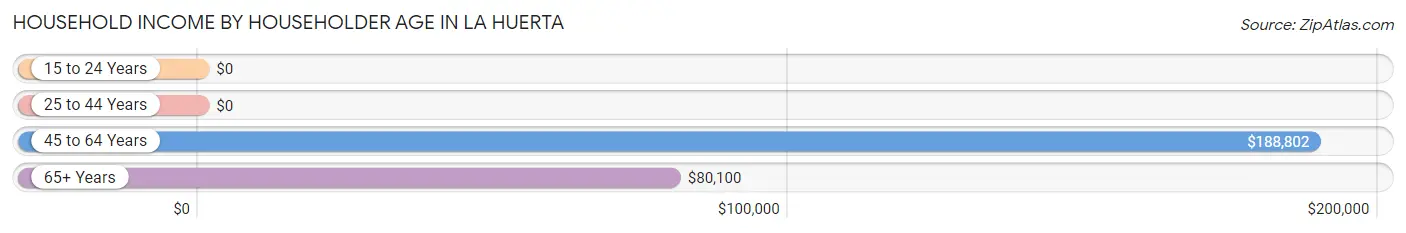
| Income Bracket | # Households | Median Income |
| 15 to 24 Years | 0 (0.0%) | $0 |
| 25 to 44 Years | 168 (34.8%) | $0 |
| 45 to 64 Years | 175 (36.2%) | $188,802 |
| 65+ Years | 140 (29.0%) | $80,100 |
| Total | 483 (100.0%) | $0 |
Poverty in La Huerta
Income Below Poverty by Sex and Age in La Huerta
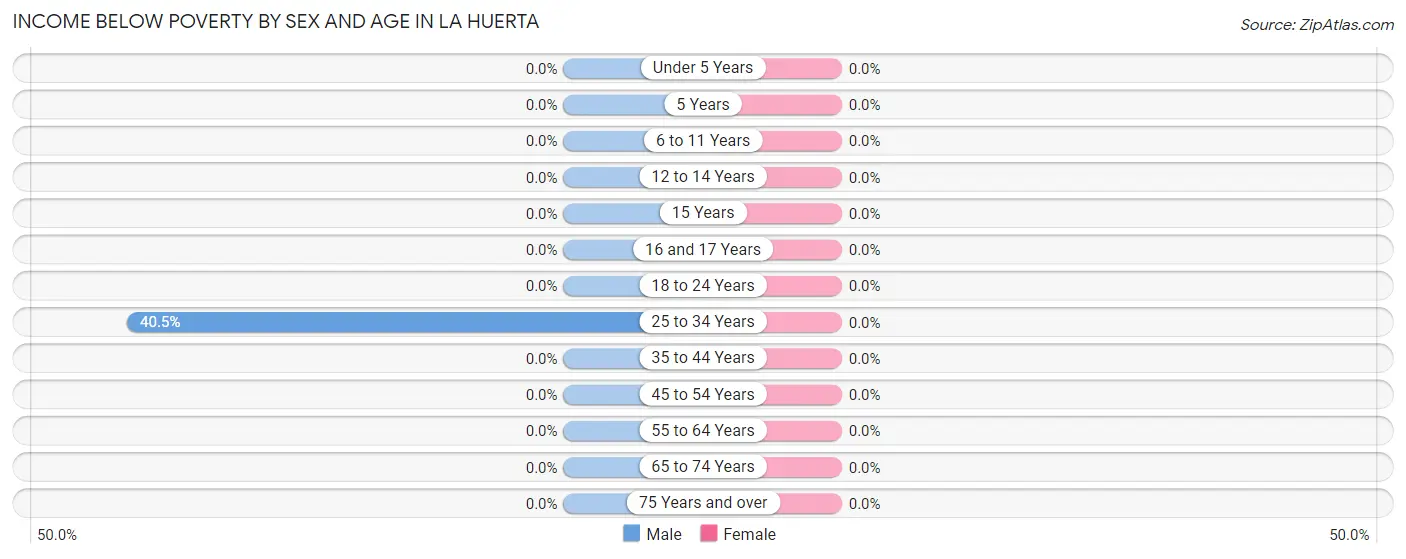
| Age Bracket | Male | Female |
| Under 5 Years | 0 (0.0%) | 0 (0.0%) |
| 5 Years | 0 (0.0%) | 0 (0.0%) |
| 6 to 11 Years | 0 (0.0%) | 0 (0.0%) |
| 12 to 14 Years | 0 (0.0%) | 0 (0.0%) |
| 15 Years | 0 (0.0%) | 0 (0.0%) |
| 16 and 17 Years | 0 (0.0%) | 0 (0.0%) |
| 18 to 24 Years | 0 (0.0%) | 0 (0.0%) |
| 25 to 34 Years | 34 (40.5%) | 0 (0.0%) |
| 35 to 44 Years | 0 (0.0%) | 0 (0.0%) |
| 45 to 54 Years | 0 (0.0%) | 0 (0.0%) |
| 55 to 64 Years | 0 (0.0%) | 0 (0.0%) |
| 65 to 74 Years | 0 (0.0%) | 0 (0.0%) |
| 75 Years and over | 0 (0.0%) | 0 (0.0%) |
| Total | 34 (4.6%) | 0 (0.0%) |
Income Above Poverty by Sex and Age in La Huerta
According to the poverty statistics in La Huerta, males aged under 5 years and females aged under 5 years are the age groups that are most secure financially, with 100.0% of males and 100.0% of females in these age groups living above the poverty line.
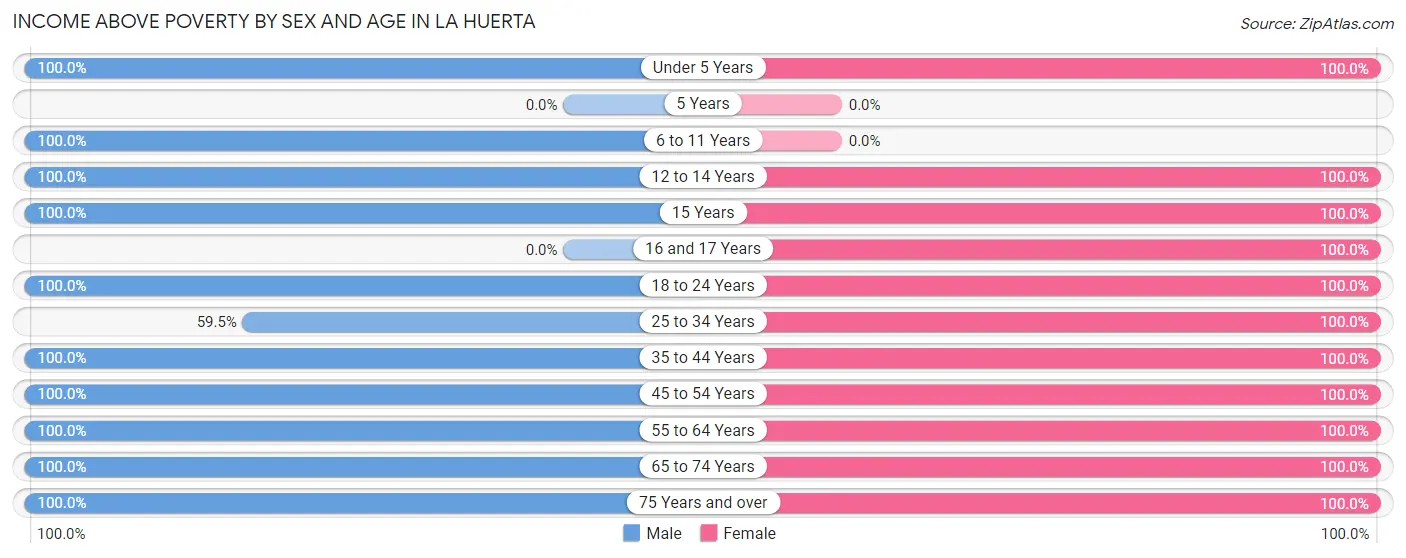
| Age Bracket | Male | Female |
| Under 5 Years | 66 (100.0%) | 26 (100.0%) |
| 5 Years | 0 (0.0%) | 0 (0.0%) |
| 6 to 11 Years | 78 (100.0%) | 0 (0.0%) |
| 12 to 14 Years | 59 (100.0%) | 7 (100.0%) |
| 15 Years | 26 (100.0%) | 10 (100.0%) |
| 16 and 17 Years | 0 (0.0%) | 29 (100.0%) |
| 18 to 24 Years | 85 (100.0%) | 25 (100.0%) |
| 25 to 34 Years | 50 (59.5%) | 77 (100.0%) |
| 35 to 44 Years | 68 (100.0%) | 61 (100.0%) |
| 45 to 54 Years | 127 (100.0%) | 166 (100.0%) |
| 55 to 64 Years | 52 (100.0%) | 28 (100.0%) |
| 65 to 74 Years | 88 (100.0%) | 48 (100.0%) |
| 75 Years and over | 9 (100.0%) | 55 (100.0%) |
| Total | 708 (95.4%) | 532 (100.0%) |
Income Below Poverty Among Married-Couple Families in La Huerta
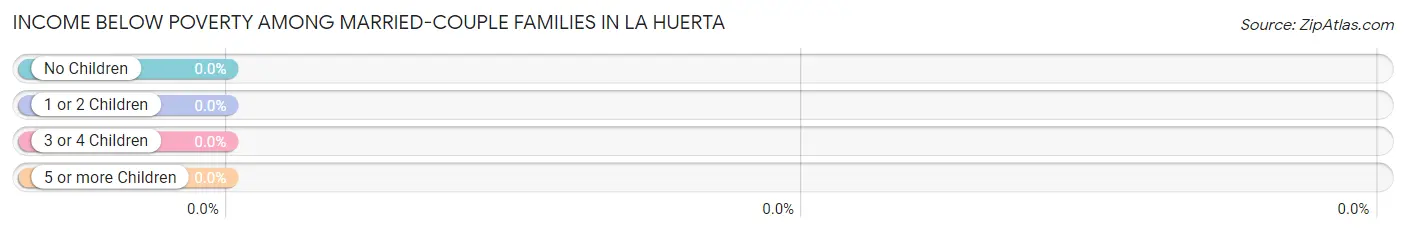
| Children | Above Poverty | Below Poverty |
| No Children | 212 (100.0%) | 0 (0.0%) |
| 1 or 2 Children | 62 (100.0%) | 0 (0.0%) |
| 3 or 4 Children | 27 (100.0%) | 0 (0.0%) |
| 5 or more Children | 0 (0.0%) | 0 (0.0%) |
| Total | 301 (100.0%) | 0 (0.0%) |
Income Below Poverty Among Single-Parent Households in La Huerta
| Children | Single Father | Single Mother |
| No Children | 0 (0.0%) | 0 (0.0%) |
| 1 or 2 Children | 0 (0.0%) | 0 (0.0%) |
| 3 or 4 Children | 0 (0.0%) | 0 (0.0%) |
| 5 or more Children | 0 (0.0%) | 0 (0.0%) |
| Total | 0 (0.0%) | 0 (0.0%) |
Income Below Poverty Among Married-Couple vs Single-Parent Households in La Huerta
| Children | Married-Couple Families | Single-Parent Households |
| No Children | 0 (0.0%) | 0 (0.0%) |
| 1 or 2 Children | 0 (0.0%) | 0 (0.0%) |
| 3 or 4 Children | 0 (0.0%) | 0 (0.0%) |
| 5 or more Children | 0 (0.0%) | 0 (0.0%) |
| Total | 0 (0.0%) | 0 (0.0%) |
Race in La Huerta
The most populous races in La Huerta are White / Caucasian (1,119 | 87.8%), Hispanic or Latino (466 | 36.6%), and Some other Race (82 | 6.4%).
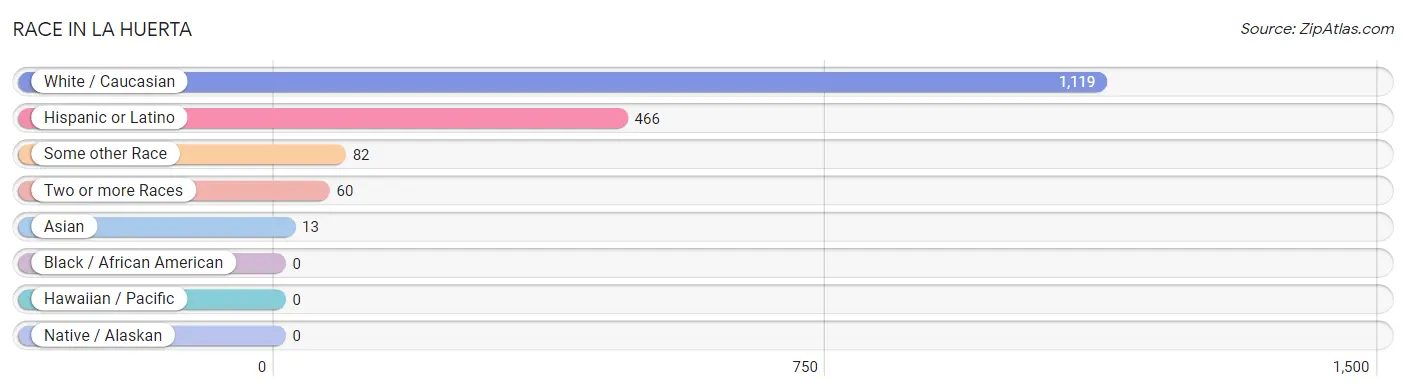
| Race | # Population | % Population |
| Asian | 13 | 1.0% |
| Black / African American | 0 | 0.0% |
| Hawaiian / Pacific | 0 | 0.0% |
| Hispanic or Latino | 466 | 36.6% |
| Native / Alaskan | 0 | 0.0% |
| White / Caucasian | 1,119 | 87.8% |
| Two or more Races | 60 | 4.7% |
| Some other Race | 82 | 6.4% |
| Total | 1,274 | 100.0% |
Ancestry in La Huerta
The most populous ancestries reported in La Huerta are Mexican (146 | 11.5%), English (120 | 9.4%), American (101 | 7.9%), Spaniard (82 | 6.4%), and Indian (Asian) (73 | 5.7%), together accounting for 41.0% of all La Huerta residents.
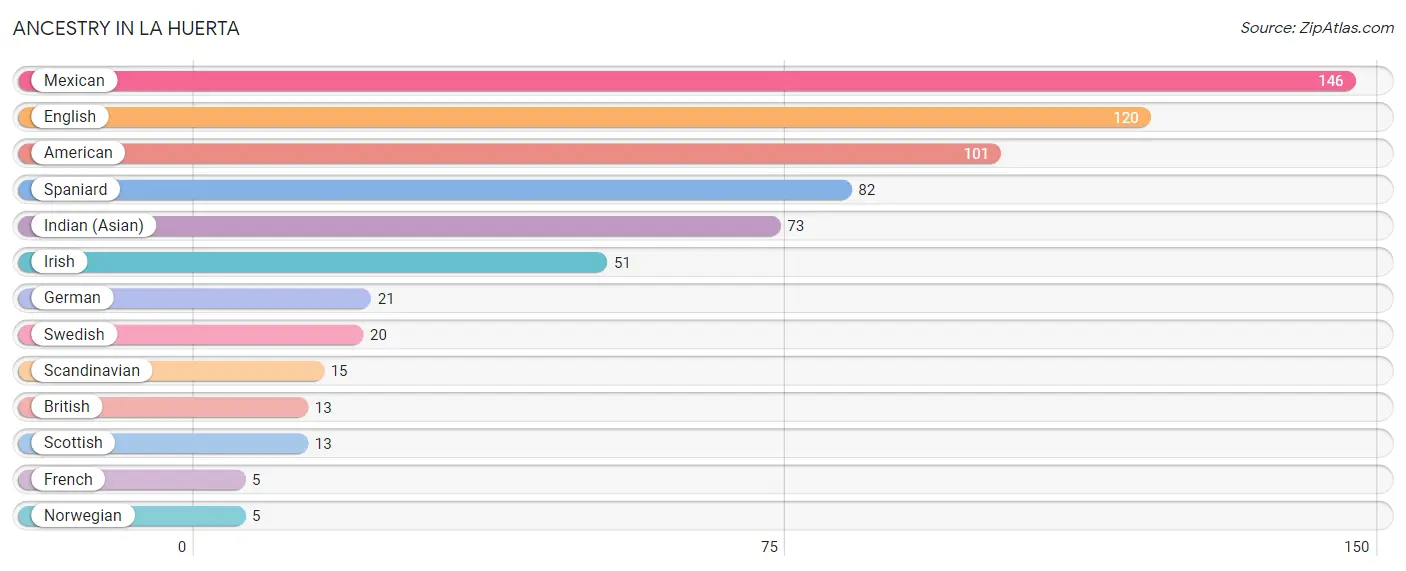
| Ancestry | # Population | % Population |
| American | 101 | 7.9% |
| British | 13 | 1.0% |
| English | 120 | 9.4% |
| French | 5 | 0.4% |
| German | 21 | 1.7% |
| Indian (Asian) | 73 | 5.7% |
| Irish | 51 | 4.0% |
| Mexican | 146 | 11.5% |
| Norwegian | 5 | 0.4% |
| Scandinavian | 15 | 1.2% |
| Scottish | 13 | 1.0% |
| Spaniard | 82 | 6.4% |
| Swedish | 20 | 1.6% | View All 13 Rows |
Immigrants in La Huerta
The most numerous immigrant groups reported in La Huerta came from Asia (13 | 1.0%), Singapore (13 | 1.0%), and South Eastern Asia (13 | 1.0%), together accounting for 3.1% of all La Huerta residents.
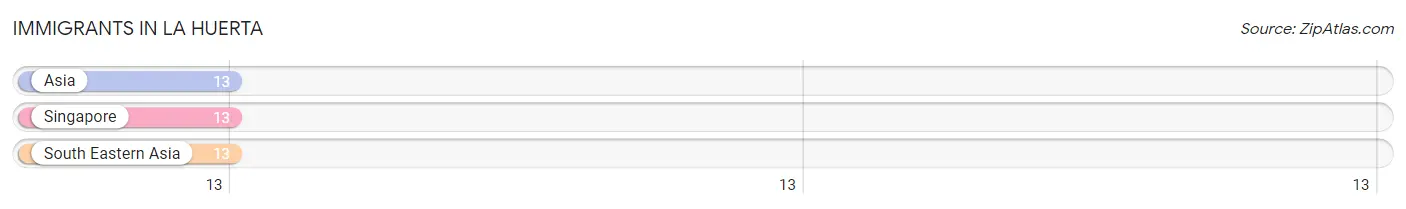
| Immigration Origin | # Population | % Population |
| Asia | 13 | 1.0% |
| Singapore | 13 | 1.0% |
| South Eastern Asia | 13 | 1.0% | View All 3 Rows |
Sex and Age in La Huerta
Sex and Age in La Huerta
The most populous age groups in La Huerta are 10 to 14 Years (100 | 13.5%) for men and 45 to 49 Years (151 | 28.4%) for women.
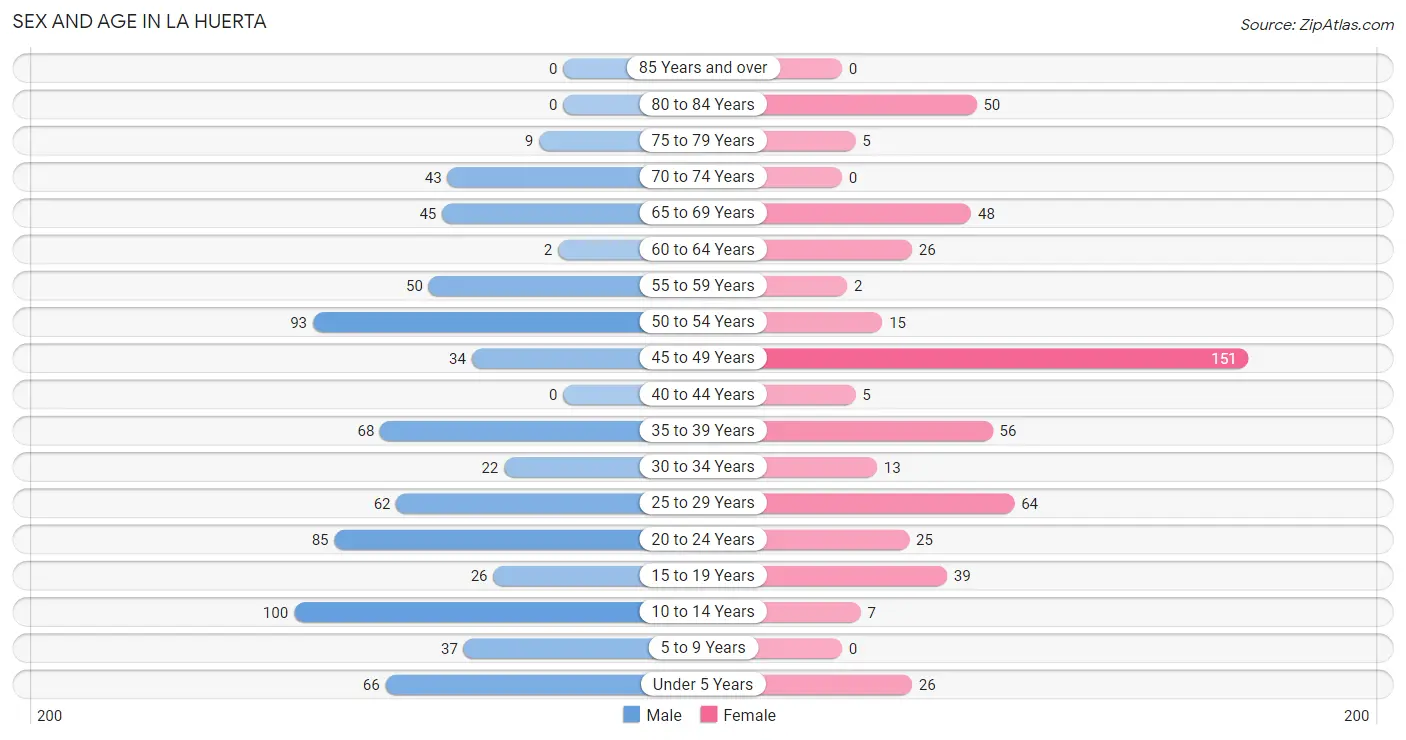
| Age Bracket | Male | Female |
| Under 5 Years | 66 (8.9%) | 26 (4.9%) |
| 5 to 9 Years | 37 (5.0%) | 0 (0.0%) |
| 10 to 14 Years | 100 (13.5%) | 7 (1.3%) |
| 15 to 19 Years | 26 (3.5%) | 39 (7.3%) |
| 20 to 24 Years | 85 (11.5%) | 25 (4.7%) |
| 25 to 29 Years | 62 (8.4%) | 64 (12.0%) |
| 30 to 34 Years | 22 (3.0%) | 13 (2.4%) |
| 35 to 39 Years | 68 (9.2%) | 56 (10.5%) |
| 40 to 44 Years | 0 (0.0%) | 5 (0.9%) |
| 45 to 49 Years | 34 (4.6%) | 151 (28.4%) |
| 50 to 54 Years | 93 (12.5%) | 15 (2.8%) |
| 55 to 59 Years | 50 (6.7%) | 2 (0.4%) |
| 60 to 64 Years | 2 (0.3%) | 26 (4.9%) |
| 65 to 69 Years | 45 (6.1%) | 48 (9.0%) |
| 70 to 74 Years | 43 (5.8%) | 0 (0.0%) |
| 75 to 79 Years | 9 (1.2%) | 5 (0.9%) |
| 80 to 84 Years | 0 (0.0%) | 50 (9.4%) |
| 85 Years and over | 0 (0.0%) | 0 (0.0%) |
| Total | 742 (100.0%) | 532 (100.0%) |
Families and Households in La Huerta
Median Family Size in La Huerta
The median family size in La Huerta is 3.15 persons per family, with married-couple families (301 | 83.4%) accounting for the largest median family size of 3.21 persons per family. On the other hand, single male/father families (21 | 5.8%) represent the smallest median family size with 2.33 persons per family.
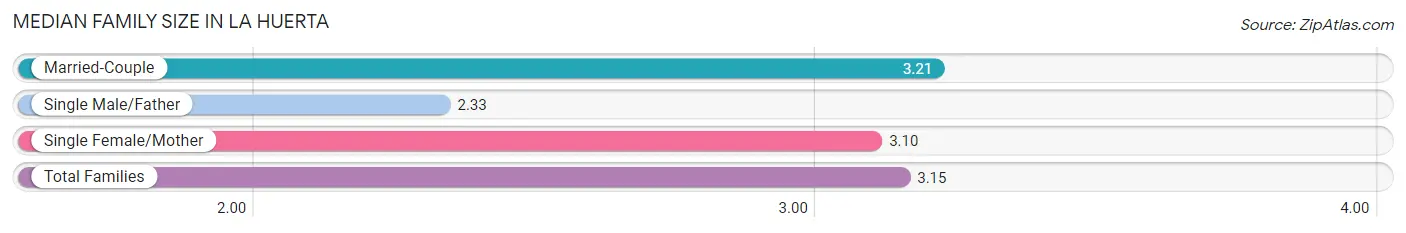
| Family Type | # Families | Family Size |
| Married-Couple | 301 (83.4%) | 3.21 |
| Single Male/Father | 21 (5.8%) | 2.33 |
| Single Female/Mother | 39 (10.8%) | 3.10 |
| Total Families | 361 (100.0%) | 3.15 |
Median Household Size in La Huerta
The median household size in La Huerta is 2.64 persons per household, with married-couple households (301 | 62.3%) accounting for the largest median household size of 3.21 persons per household. non-family households (122 | 25.3%) represent the smallest median household size with 1.12 persons per household.
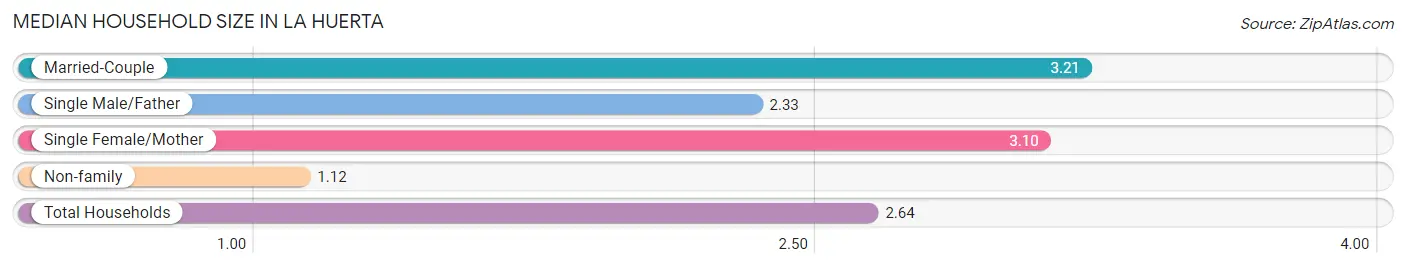
| Household Type | # Households | Household Size |
| Married-Couple | 301 (62.3%) | 3.21 |
| Single Male/Father | 21 (4.3%) | 2.33 |
| Single Female/Mother | 39 (8.1%) | 3.10 |
| Non-family | 122 (25.3%) | 1.12 |
| Total Households | 483 (100.0%) | 2.64 |
Household Size by Marriage Status in La Huerta
Out of a total of 483 households in La Huerta, 361 (74.7%) are family households, while 122 (25.3%) are nonfamily households. The most numerous type of family households are 2-person households, comprising 159, and the most common type of nonfamily households are 1-person households, comprising 109.
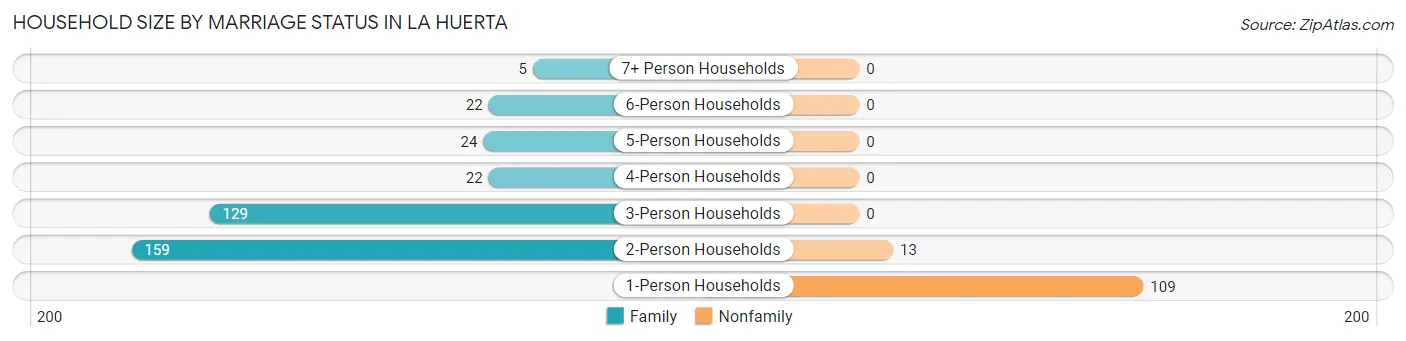
| Household Size | Family Households | Nonfamily Households |
| 1-Person Households | - | 109 (22.6%) |
| 2-Person Households | 159 (32.9%) | 13 (2.7%) |
| 3-Person Households | 129 (26.7%) | 0 (0.0%) |
| 4-Person Households | 22 (4.5%) | 0 (0.0%) |
| 5-Person Households | 24 (5.0%) | 0 (0.0%) |
| 6-Person Households | 22 (4.5%) | 0 (0.0%) |
| 7+ Person Households | 5 (1.0%) | 0 (0.0%) |
| Total | 361 (74.7%) | 122 (25.3%) |
Female Fertility in La Huerta
Fertility by Age in La Huerta
Average fertility rate in La Huerta is 76.0 births per 1,000 women. Women in the age bracket of 20 to 34 years have the highest fertility rate with 275.0 births per 1,000 women. Women in the age bracket of 20 to 34 years acount for 100.0% of all women with births.
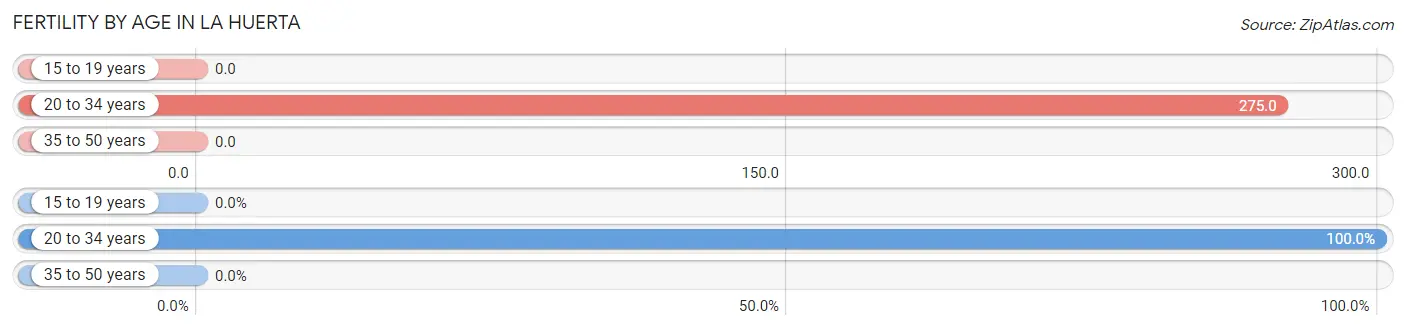
| Age Bracket | Women with Births | Births / 1,000 Women |
| 15 to 19 years | 0 (0.0%) | 0.0 |
| 20 to 34 years | 28 (100.0%) | 275.0 |
| 35 to 50 years | 0 (0.0%) | 0.0 |
| Total | 28 (100.0%) | 76.0 |
Fertility by Age by Marriage Status in La Huerta
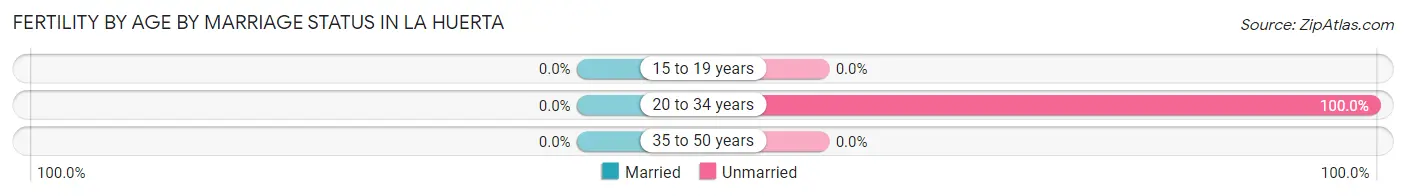
| Age Bracket | Married | Unmarried |
| 15 to 19 years | 0 (0.0%) | 0 (0.0%) |
| 20 to 34 years | 0 (0.0%) | 28 (100.0%) |
| 35 to 50 years | 0 (0.0%) | 0 (0.0%) |
| Total | 0 (0.0%) | 28 (100.0%) |
Fertility by Education in La Huerta
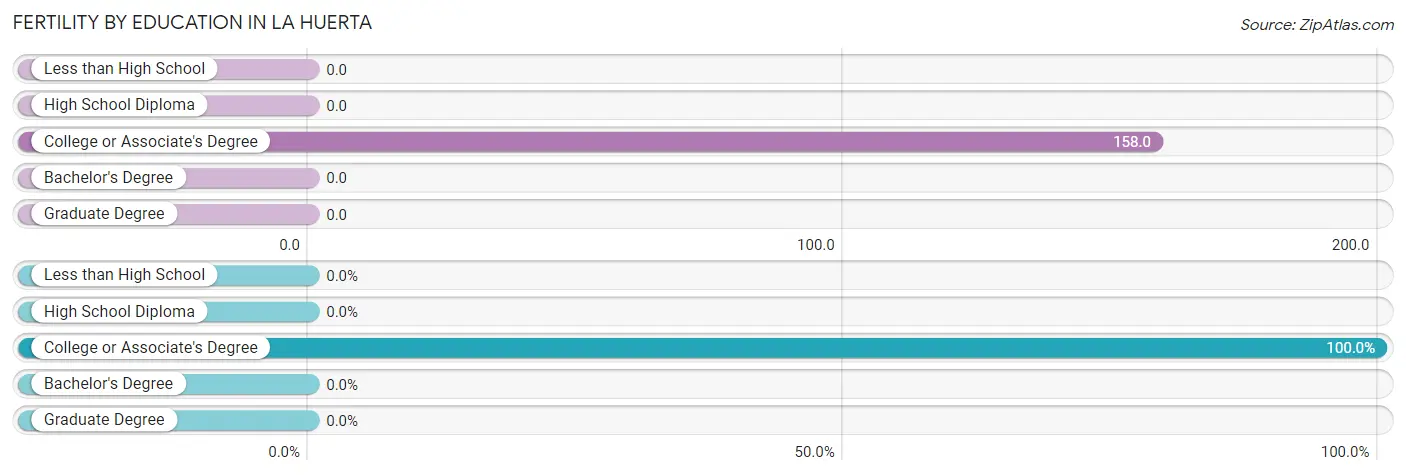
| Educational Attainment | Women with Births | Births / 1,000 Women |
| Less than High School | 0 (0.0%) | 0.0 |
| High School Diploma | 0 (0.0%) | 0.0 |
| College or Associate's Degree | 28 (100.0%) | 158.0 |
| Bachelor's Degree | 0 (0.0%) | 0.0 |
| Graduate Degree | 0 (0.0%) | 0.0 |
| Total | 28 (100.0%) | 76.0 |
Fertility by Education by Marriage Status in La Huerta
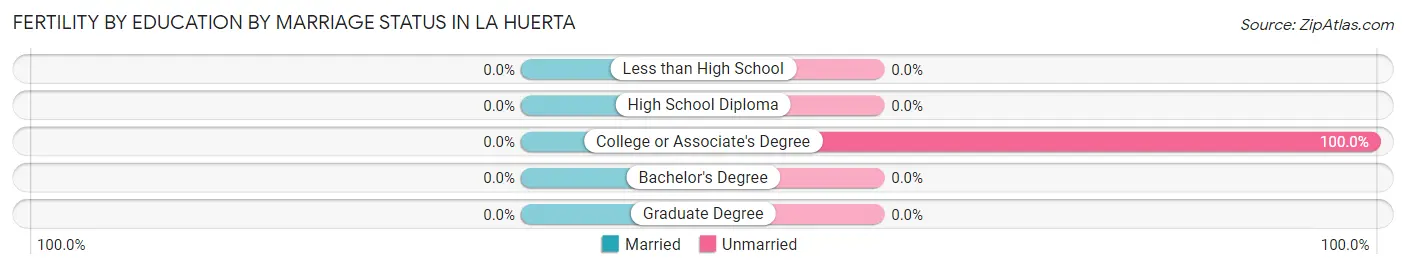
| Educational Attainment | Married | Unmarried |
| Less than High School | 0 (0.0%) | 0 (0.0%) |
| High School Diploma | 0 (0.0%) | 0 (0.0%) |
| College or Associate's Degree | 0 (0.0%) | 28 (100.0%) |
| Bachelor's Degree | 0 (0.0%) | 0 (0.0%) |
| Graduate Degree | 0 (0.0%) | 0 (0.0%) |
| Total | 0 (0.0%) | 28 (100.0%) |
Employment Characteristics in La Huerta
Employment by Class of Employer in La Huerta
Among the 691 employed individuals in La Huerta, private company employees (328 | 47.5%), local government employees (174 | 25.2%), and federal government employees (85 | 12.3%) make up the most common classes of employment.
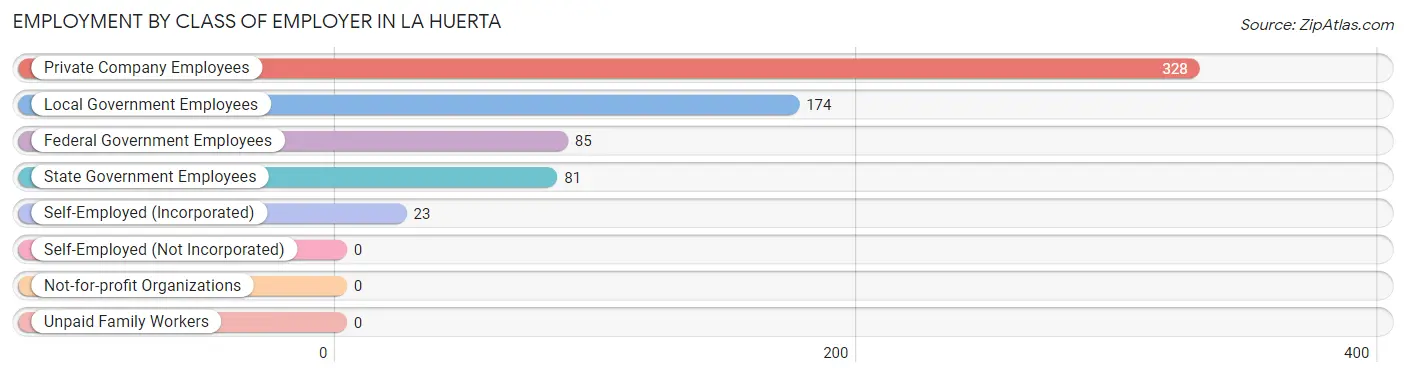
| Employer Class | # Employees | % Employees |
| Private Company Employees | 328 | 47.5% |
| Self-Employed (Incorporated) | 23 | 3.3% |
| Self-Employed (Not Incorporated) | 0 | 0.0% |
| Not-for-profit Organizations | 0 | 0.0% |
| Local Government Employees | 174 | 25.2% |
| State Government Employees | 81 | 11.7% |
| Federal Government Employees | 85 | 12.3% |
| Unpaid Family Workers | 0 | 0.0% |
| Total | 691 | 100.0% |
Employment Status by Age in La Huerta
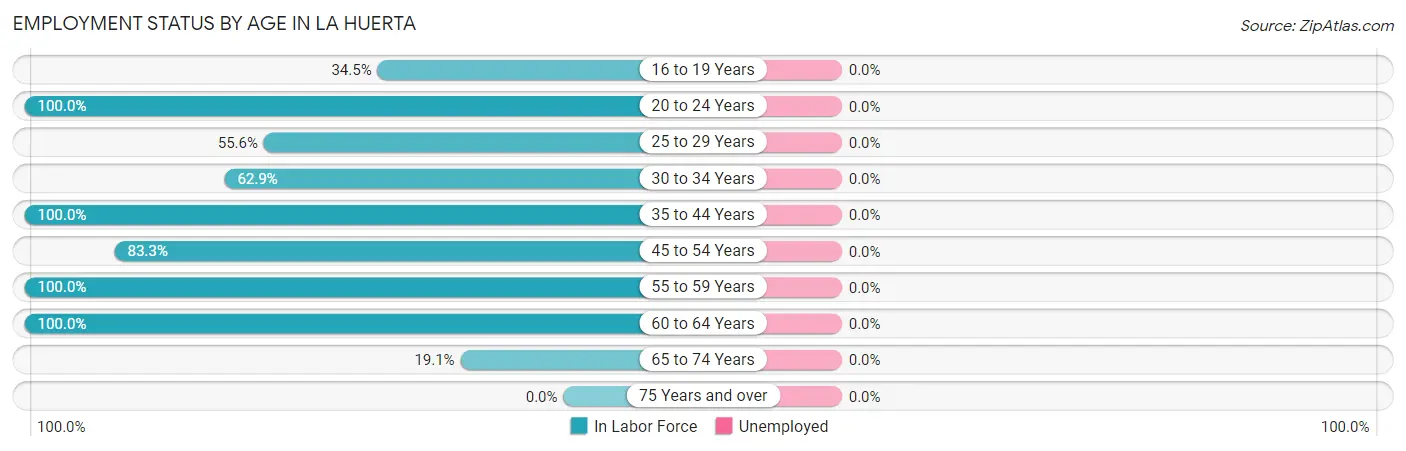
| Age Bracket | In Labor Force | Unemployed |
| 16 to 19 Years | 10 (34.5%) | 0 (0.0%) |
| 20 to 24 Years | 110 (100.0%) | 0 (0.0%) |
| 25 to 29 Years | 70 (55.6%) | 0 (0.0%) |
| 30 to 34 Years | 22 (62.9%) | 0 (0.0%) |
| 35 to 44 Years | 129 (100.0%) | 0 (0.0%) |
| 45 to 54 Years | 244 (83.3%) | 0 (0.0%) |
| 55 to 59 Years | 52 (100.0%) | 0 (0.0%) |
| 60 to 64 Years | 28 (100.0%) | 0 (0.0%) |
| 65 to 74 Years | 26 (19.1%) | 0 (0.0%) |
| 75 Years and over | 0 (0.0%) | 0 (0.0%) |
| Total | 691 (69.0%) | 0 (0.0%) |
Employment Status by Educational Attainment in La Huerta
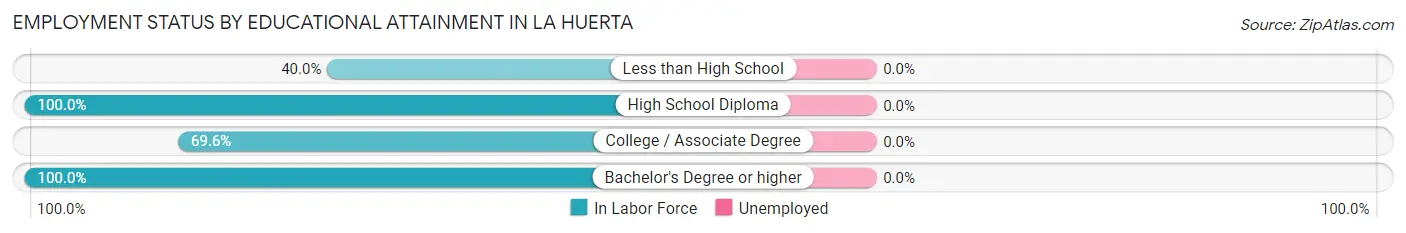
| Educational Attainment | In Labor Force | Unemployed |
| Less than High School | 16 (40.0%) | 0 (0.0%) |
| High School Diploma | 236 (100.0%) | 0 (0.0%) |
| College / Associate Degree | 215 (69.6%) | 0 (0.0%) |
| Bachelor's Degree or higher | 78 (100.0%) | 0 (0.0%) |
| Total | 545 (82.2%) | 0 (0.0%) |
Employment Occupations by Sex in La Huerta
Management, Business, Science and Arts Occupations
The most common Management, Business, Science and Arts occupations in La Huerta are Management (151 | 24.9%), Business & Financial (81 | 13.4%), Community & Social Service (53 | 8.7%), Education Instruction & Library (53 | 8.7%), and Health Diagnosing & Treating (2 | 0.3%).
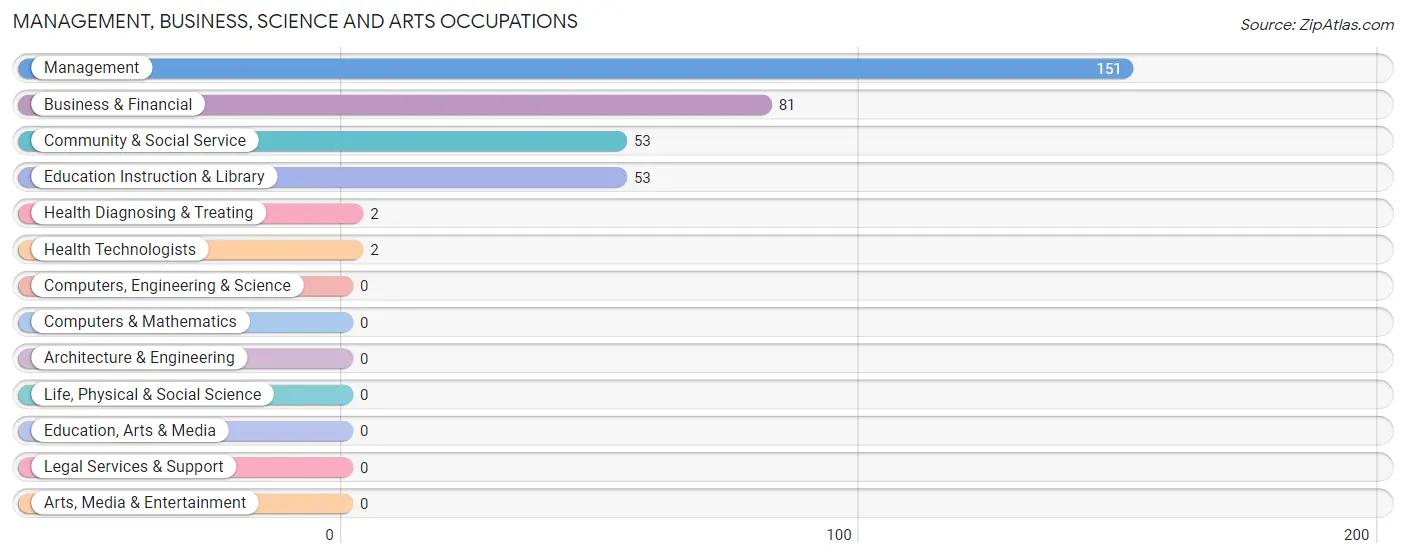
Management, Business, Science and Arts Occupations by Sex
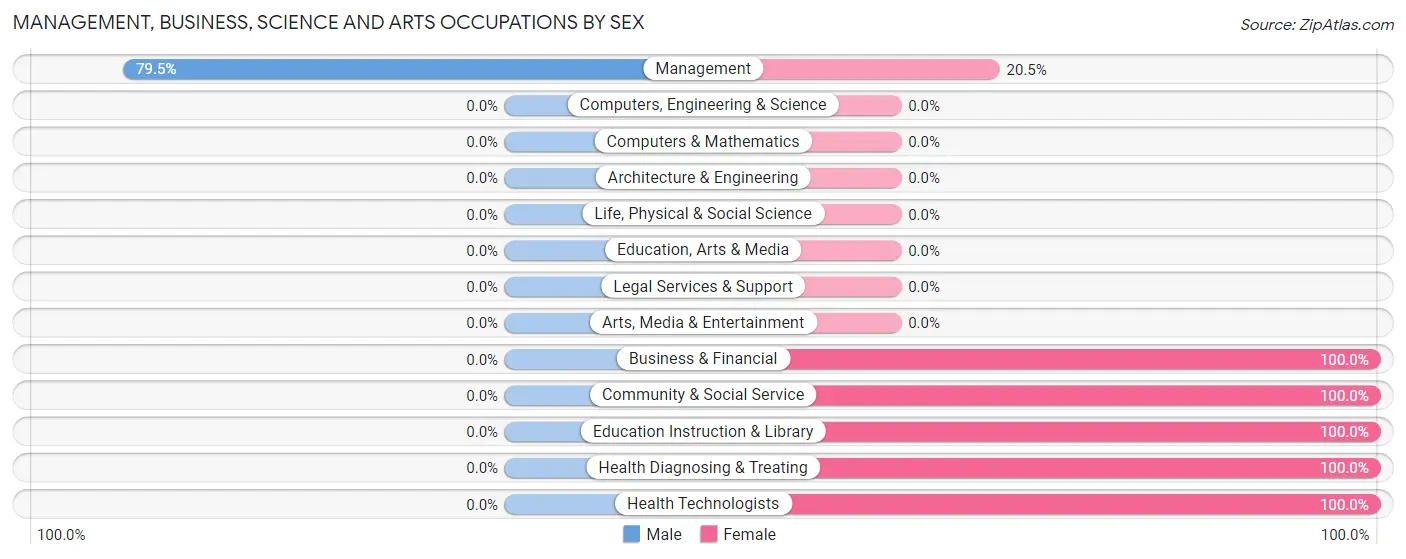
| Occupation | Male | Female |
| Management | 120 (79.5%) | 31 (20.5%) |
| Business & Financial | 0 (0.0%) | 81 (100.0%) |
| Computers, Engineering & Science | 0 (0.0%) | 0 (0.0%) |
| Computers & Mathematics | 0 (0.0%) | 0 (0.0%) |
| Architecture & Engineering | 0 (0.0%) | 0 (0.0%) |
| Life, Physical & Social Science | 0 (0.0%) | 0 (0.0%) |
| Community & Social Service | 0 (0.0%) | 53 (100.0%) |
| Education, Arts & Media | 0 (0.0%) | 0 (0.0%) |
| Legal Services & Support | 0 (0.0%) | 0 (0.0%) |
| Education Instruction & Library | 0 (0.0%) | 53 (100.0%) |
| Arts, Media & Entertainment | 0 (0.0%) | 0 (0.0%) |
| Health Diagnosing & Treating | 0 (0.0%) | 2 (100.0%) |
| Health Technologists | 0 (0.0%) | 2 (100.0%) |
| Total (Category) | 120 (41.8%) | 167 (58.2%) |
| Total (Overall) | 322 (53.1%) | 284 (46.9%) |
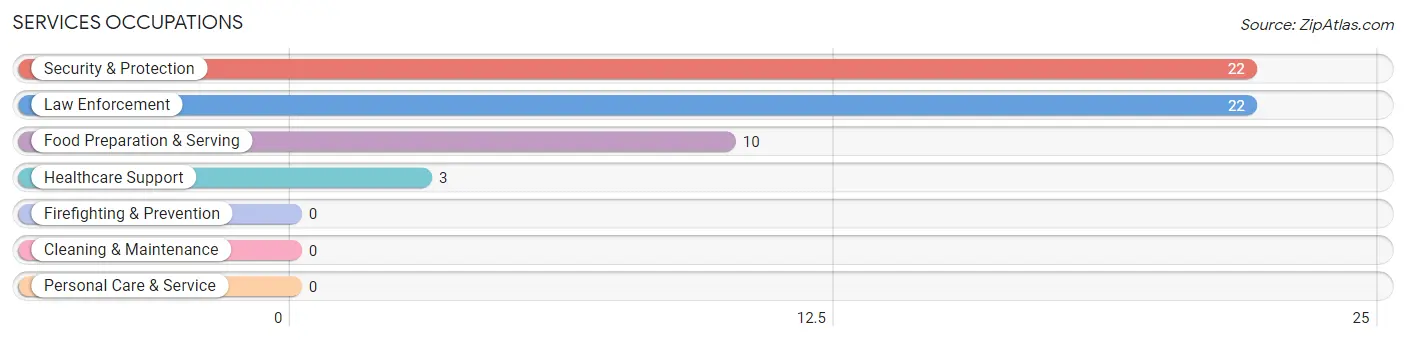
Services Occupations
The most common Services occupations in La Huerta are Security & Protection (22 | 3.6%), Law Enforcement (22 | 3.6%), Food Preparation & Serving (10 | 1.7%), and Healthcare Support (3 | 0.5%).
Services Occupations by Sex
Within the Services occupations in La Huerta, the most male-oriented occupations are Security & Protection (100.0%), and Law Enforcement (100.0%), while the most female-oriented occupations are Healthcare Support (100.0%), and Food Preparation & Serving (100.0%).
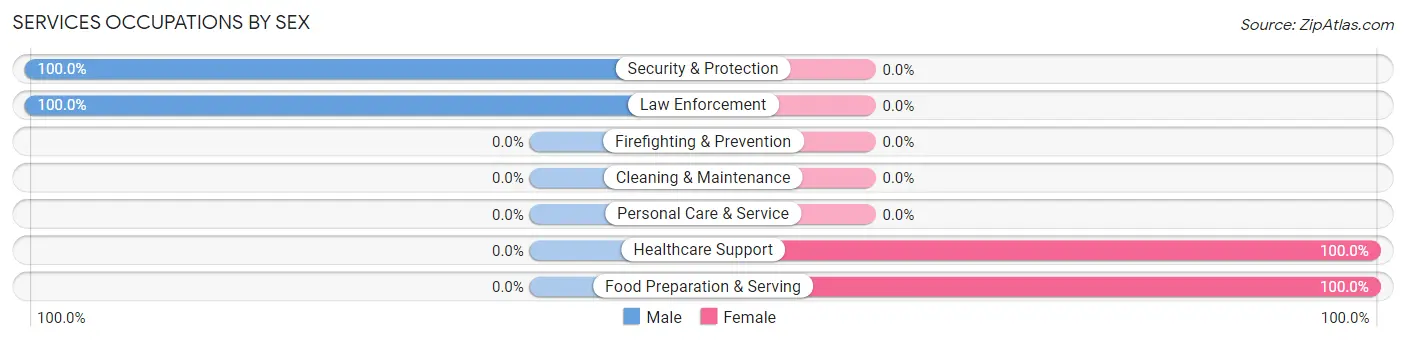
| Occupation | Male | Female |
| Healthcare Support | 0 (0.0%) | 3 (100.0%) |
| Security & Protection | 22 (100.0%) | 0 (0.0%) |
| Firefighting & Prevention | 0 (0.0%) | 0 (0.0%) |
| Law Enforcement | 22 (100.0%) | 0 (0.0%) |
| Food Preparation & Serving | 0 (0.0%) | 10 (100.0%) |
| Cleaning & Maintenance | 0 (0.0%) | 0 (0.0%) |
| Personal Care & Service | 0 (0.0%) | 0 (0.0%) |
| Total (Category) | 22 (62.9%) | 13 (37.1%) |
| Total (Overall) | 322 (53.1%) | 284 (46.9%) |
Sales and Office Occupations
The most common Sales and Office occupations in La Huerta are Office & Administration (65 | 10.7%), and Sales & Related (13 | 2.1%).

Sales and Office Occupations by Sex

| Occupation | Male | Female |
| Sales & Related | 13 (100.0%) | 0 (0.0%) |
| Office & Administration | 0 (0.0%) | 65 (100.0%) |
| Total (Category) | 13 (16.7%) | 65 (83.3%) |
| Total (Overall) | 322 (53.1%) | 284 (46.9%) |
Natural Resources, Construction and Maintenance Occupations
The most common Natural Resources, Construction and Maintenance occupations in La Huerta are Construction & Extraction (88 | 14.5%), and Installation, Maintenance & Repair (43 | 7.1%).
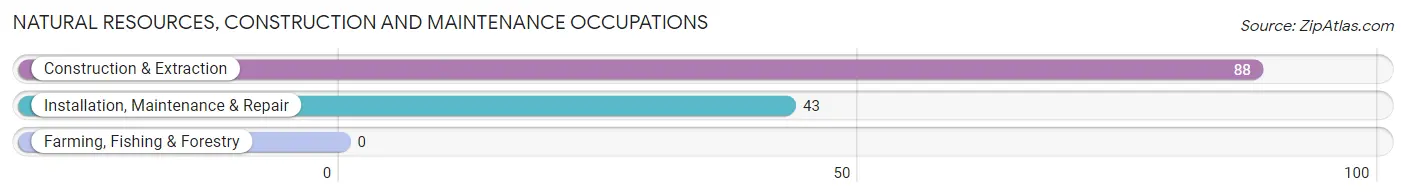
Natural Resources, Construction and Maintenance Occupations by Sex
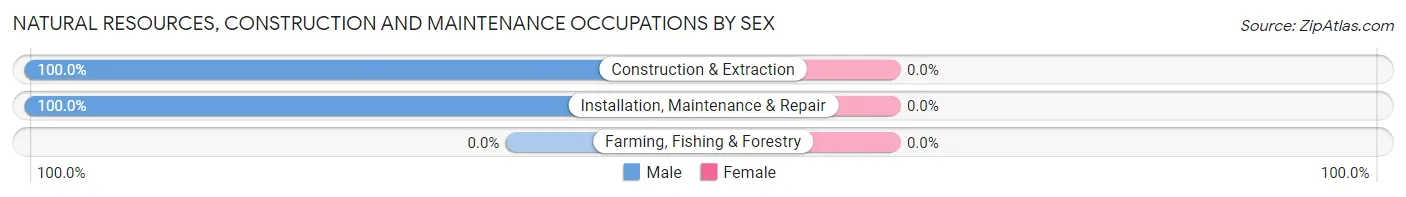
| Occupation | Male | Female |
| Farming, Fishing & Forestry | 0 (0.0%) | 0 (0.0%) |
| Construction & Extraction | 88 (100.0%) | 0 (0.0%) |
| Installation, Maintenance & Repair | 43 (100.0%) | 0 (0.0%) |
| Total (Category) | 131 (100.0%) | 0 (0.0%) |
| Total (Overall) | 322 (53.1%) | 284 (46.9%) |
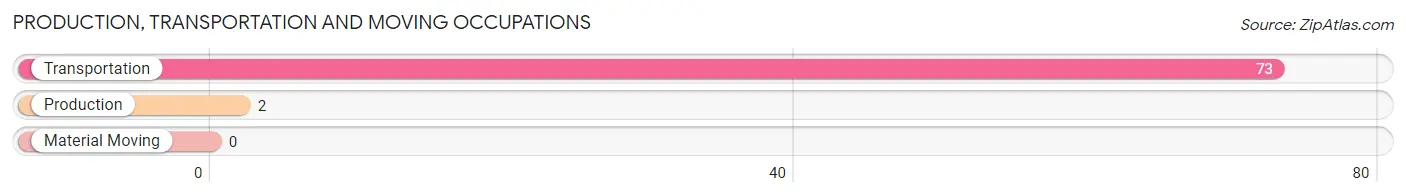
Production, Transportation and Moving Occupations
The most common Production, Transportation and Moving occupations in La Huerta are Transportation (73 | 12.0%), and Production (2 | 0.3%).
Production, Transportation and Moving Occupations by Sex
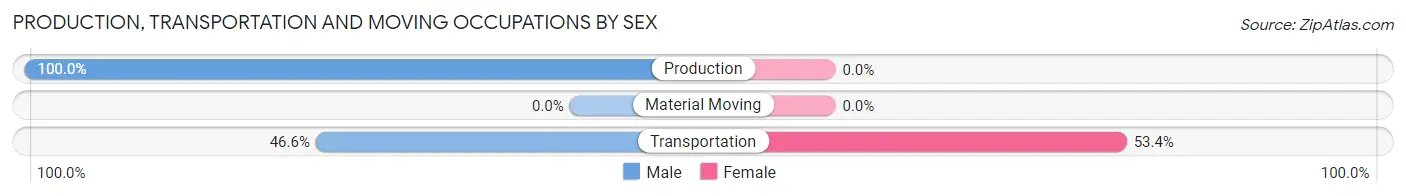
| Occupation | Male | Female |
| Production | 2 (100.0%) | 0 (0.0%) |
| Transportation | 34 (46.6%) | 39 (53.4%) |
| Material Moving | 0 (0.0%) | 0 (0.0%) |
| Total (Category) | 36 (48.0%) | 39 (52.0%) |
| Total (Overall) | 322 (53.1%) | 284 (46.9%) |
Employment Industries by Sex in La Huerta
Employment Industries in La Huerta
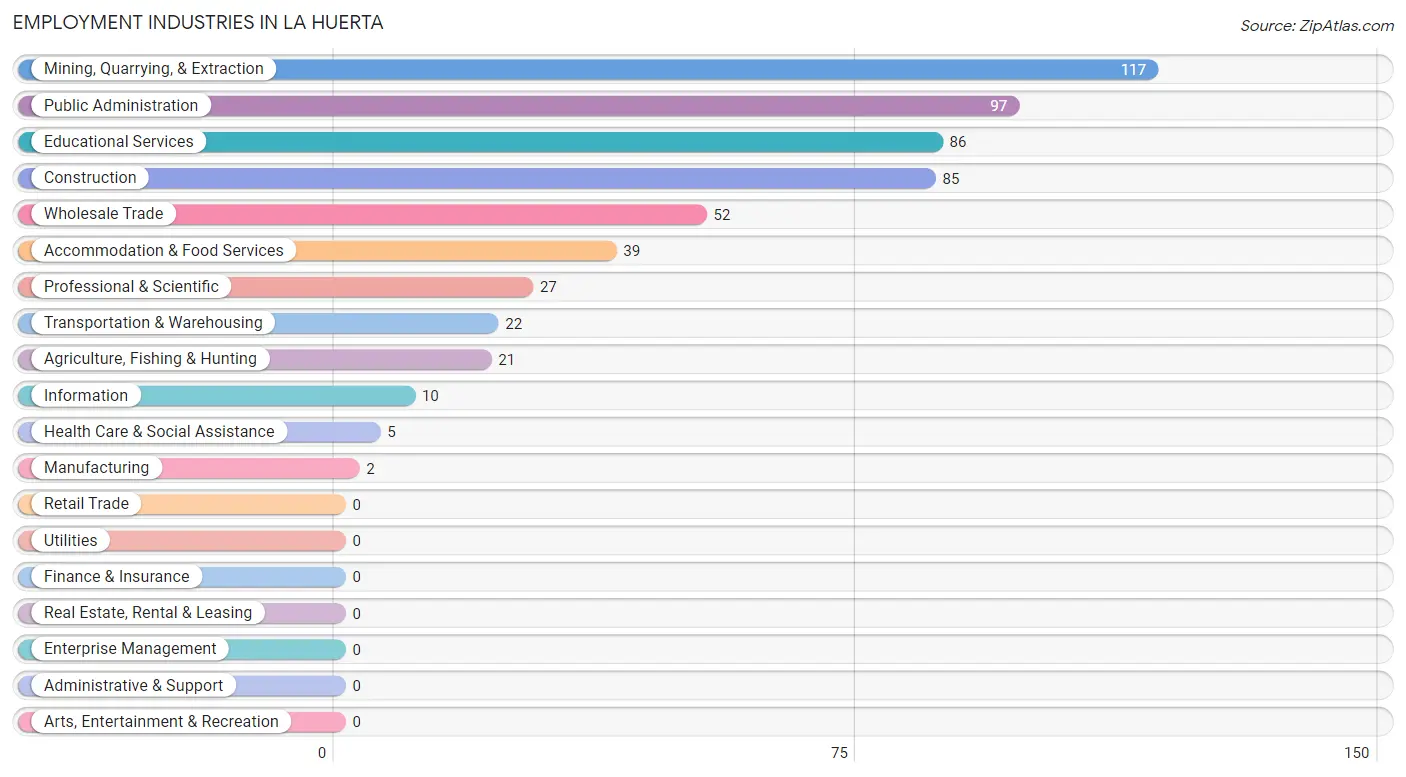
The major employment industries in La Huerta include Mining, Quarrying, & Extraction (117 | 19.3%), Public Administration (97 | 16.0%), Educational Services (86 | 14.2%), Construction (85 | 14.0%), and Wholesale Trade (52 | 8.6%).
Employment Industries by Sex in La Huerta
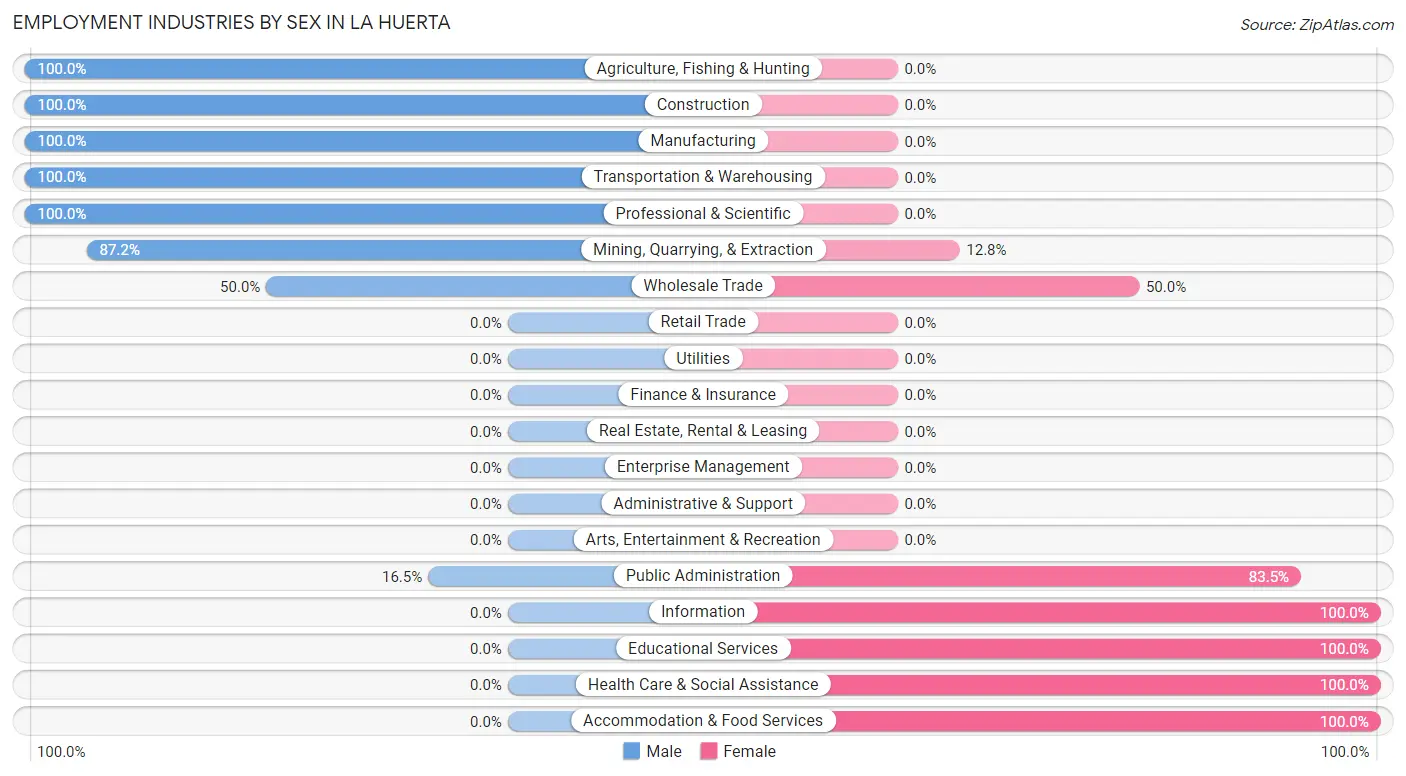
The La Huerta industries that see more men than women are Agriculture, Fishing & Hunting (100.0%), Construction (100.0%), and Manufacturing (100.0%), whereas the industries that tend to have a higher number of women are Information (100.0%), Educational Services (100.0%), and Health Care & Social Assistance (100.0%).
| Industry | Male | Female |
| Agriculture, Fishing & Hunting | 21 (100.0%) | 0 (0.0%) |
| Mining, Quarrying, & Extraction | 102 (87.2%) | 15 (12.8%) |
| Construction | 85 (100.0%) | 0 (0.0%) |
| Manufacturing | 2 (100.0%) | 0 (0.0%) |
| Wholesale Trade | 26 (50.0%) | 26 (50.0%) |
| Retail Trade | 0 (0.0%) | 0 (0.0%) |
| Transportation & Warehousing | 22 (100.0%) | 0 (0.0%) |
| Utilities | 0 (0.0%) | 0 (0.0%) |
| Information | 0 (0.0%) | 10 (100.0%) |
| Finance & Insurance | 0 (0.0%) | 0 (0.0%) |
| Real Estate, Rental & Leasing | 0 (0.0%) | 0 (0.0%) |
| Professional & Scientific | 27 (100.0%) | 0 (0.0%) |
| Enterprise Management | 0 (0.0%) | 0 (0.0%) |
| Administrative & Support | 0 (0.0%) | 0 (0.0%) |
| Educational Services | 0 (0.0%) | 86 (100.0%) |
| Health Care & Social Assistance | 0 (0.0%) | 5 (100.0%) |
| Arts, Entertainment & Recreation | 0 (0.0%) | 0 (0.0%) |
| Accommodation & Food Services | 0 (0.0%) | 39 (100.0%) |
| Public Administration | 16 (16.5%) | 81 (83.5%) |
| Total | 322 (53.1%) | 284 (46.9%) |
Education in La Huerta
School Enrollment in La Huerta
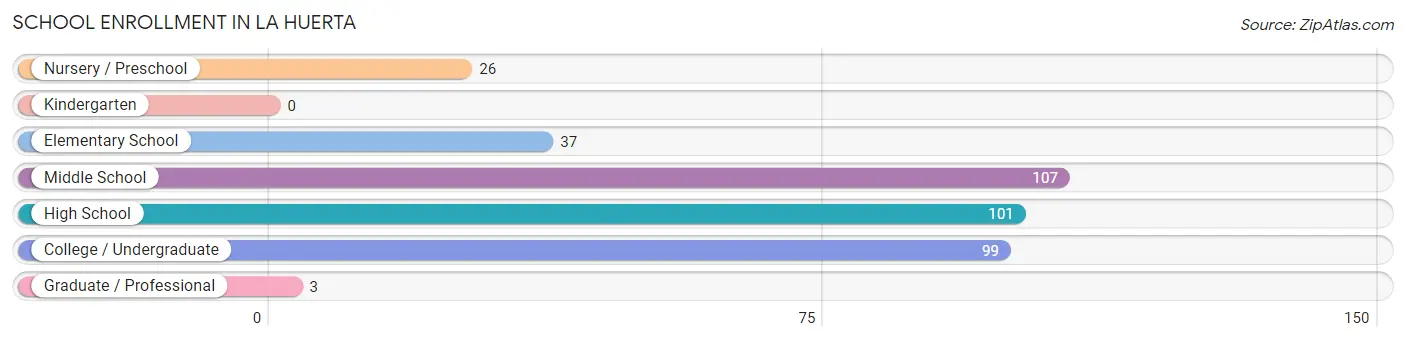
The most common levels of schooling among the 373 students in La Huerta are middle school (107 | 28.7%), high school (101 | 27.1%), and college / undergraduate (99 | 26.5%).
| School Level | # Students | % Students |
| Nursery / Preschool | 26 | 7.0% |
| Kindergarten | 0 | 0.0% |
| Elementary School | 37 | 9.9% |
| Middle School | 107 | 28.7% |
| High School | 101 | 27.1% |
| College / Undergraduate | 99 | 26.5% |
| Graduate / Professional | 3 | 0.8% |
| Total | 373 | 100.0% |
School Enrollment by Age by Funding Source in La Huerta
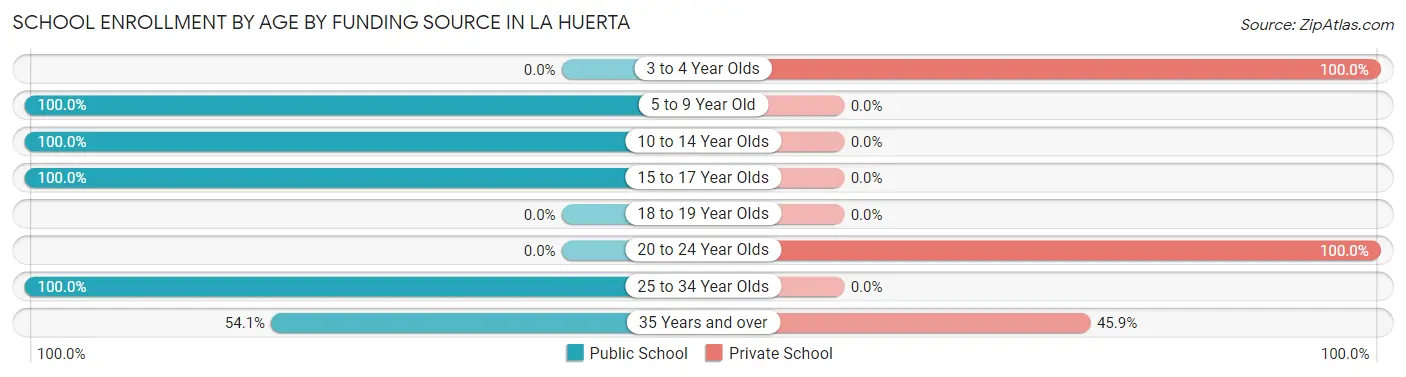
Out of a total of 373 students who are enrolled in schools in La Huerta, 68 (18.2%) attend a private institution, while the remaining 305 (81.8%) are enrolled in public schools. The age group of 3 to 4 year olds has the highest likelihood of being enrolled in private schools, with 26 (100.0% in the age bracket) enrolled. Conversely, the age group of 5 to 9 year old has the lowest likelihood of being enrolled in a private school, with 37 (100.0% in the age bracket) attending a public institution.
| Age Bracket | Public School | Private School |
| 3 to 4 Year Olds | 0 (0.0%) | 26 (100.0%) |
| 5 to 9 Year Old | 37 (100.0%) | 0 (0.0%) |
| 10 to 14 Year Olds | 107 (100.0%) | 0 (0.0%) |
| 15 to 17 Year Olds | 65 (100.0%) | 0 (0.0%) |
| 18 to 19 Year Olds | 0 (0.0%) | 0 (0.0%) |
| 20 to 24 Year Olds | 0 (0.0%) | 3 (100.0%) |
| 25 to 34 Year Olds | 50 (100.0%) | 0 (0.0%) |
| 35 Years and over | 46 (54.1%) | 39 (45.9%) |
| Total | 305 (81.8%) | 68 (18.2%) |
Educational Attainment by Field of Study in La Huerta
Education (55 | 37.9%), psychology (22 | 15.2%), engineering (22 | 15.2%), business (21 | 14.5%), and physical & health sciences (20 | 13.8%) are the most common fields of study among 145 individuals in La Huerta who have obtained a bachelor's degree or higher.
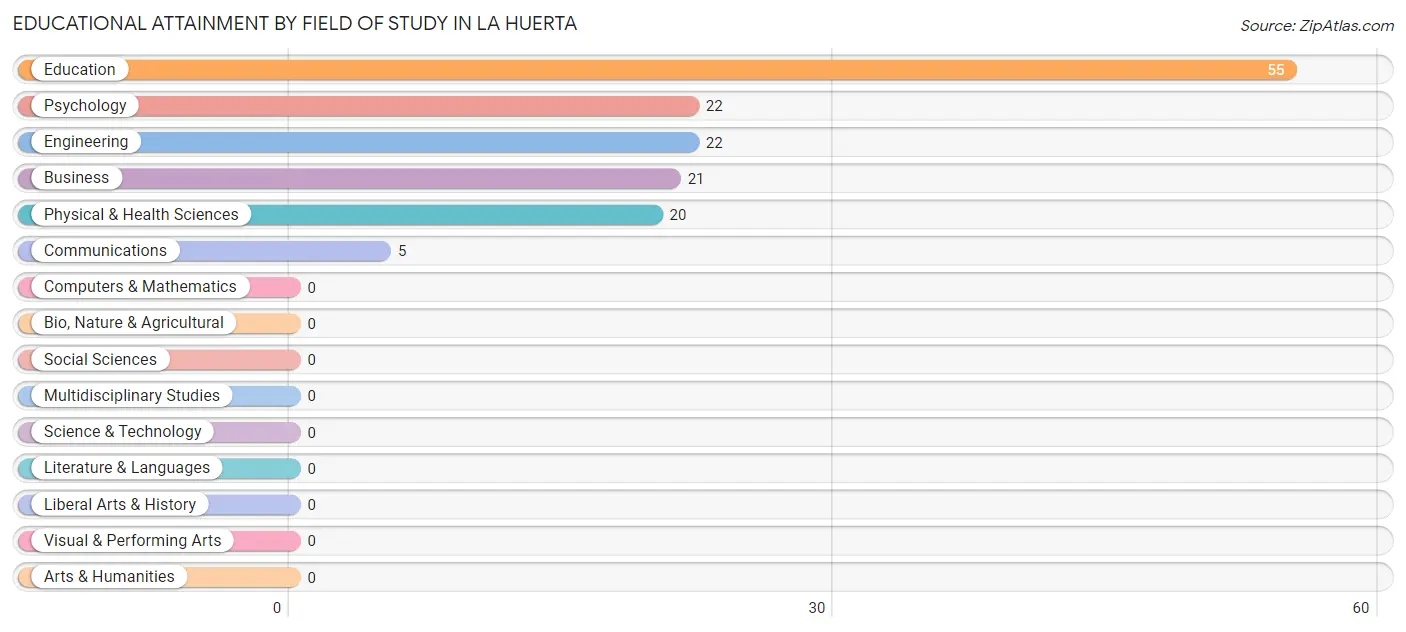
| Field of Study | # Graduates | % Graduates |
| Computers & Mathematics | 0 | 0.0% |
| Bio, Nature & Agricultural | 0 | 0.0% |
| Physical & Health Sciences | 20 | 13.8% |
| Psychology | 22 | 15.2% |
| Social Sciences | 0 | 0.0% |
| Engineering | 22 | 15.2% |
| Multidisciplinary Studies | 0 | 0.0% |
| Science & Technology | 0 | 0.0% |
| Business | 21 | 14.5% |
| Education | 55 | 37.9% |
| Literature & Languages | 0 | 0.0% |
| Liberal Arts & History | 0 | 0.0% |
| Visual & Performing Arts | 0 | 0.0% |
| Communications | 5 | 3.5% |
| Arts & Humanities | 0 | 0.0% |
| Total | 145 | 100.0% |
Transportation & Commute in La Huerta
Vehicle Availability by Sex in La Huerta
The most prevalent vehicle ownership categories in La Huerta are males with 5 or more vehicles (180, accounting for 44.2%) and females with 5 or more vehicles (108, making up 63.4%).
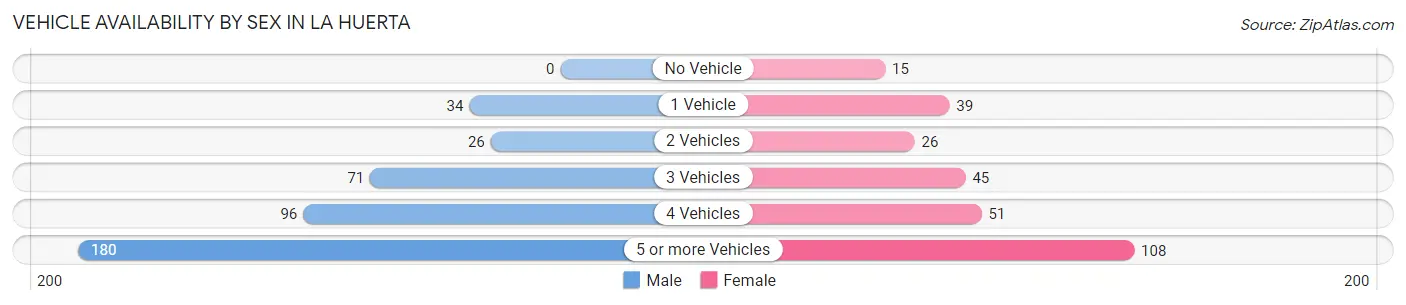
| Vehicles Available | Male | Female |
| No Vehicle | 0 (0.0%) | 15 (5.3%) |
| 1 Vehicle | 34 (8.4%) | 39 (13.7%) |
| 2 Vehicles | 26 (6.4%) | 26 (9.1%) |
| 3 Vehicles | 71 (17.4%) | 45 (15.9%) |
| 4 Vehicles | 96 (23.6%) | 51 (18.0%) |
| 5 or more Vehicles | 180 (44.2%) | 108 (38.0%) |
| Total | 407 (100.0%) | 284 (100.0%) |
Commute Time in La Huerta
The most frequently occuring commute durations in La Huerta are 15 to 19 minutes (226 commuters, 32.7%), 10 to 14 minutes (186 commuters, 26.9%), and 45 to 59 minutes (81 commuters, 11.7%).
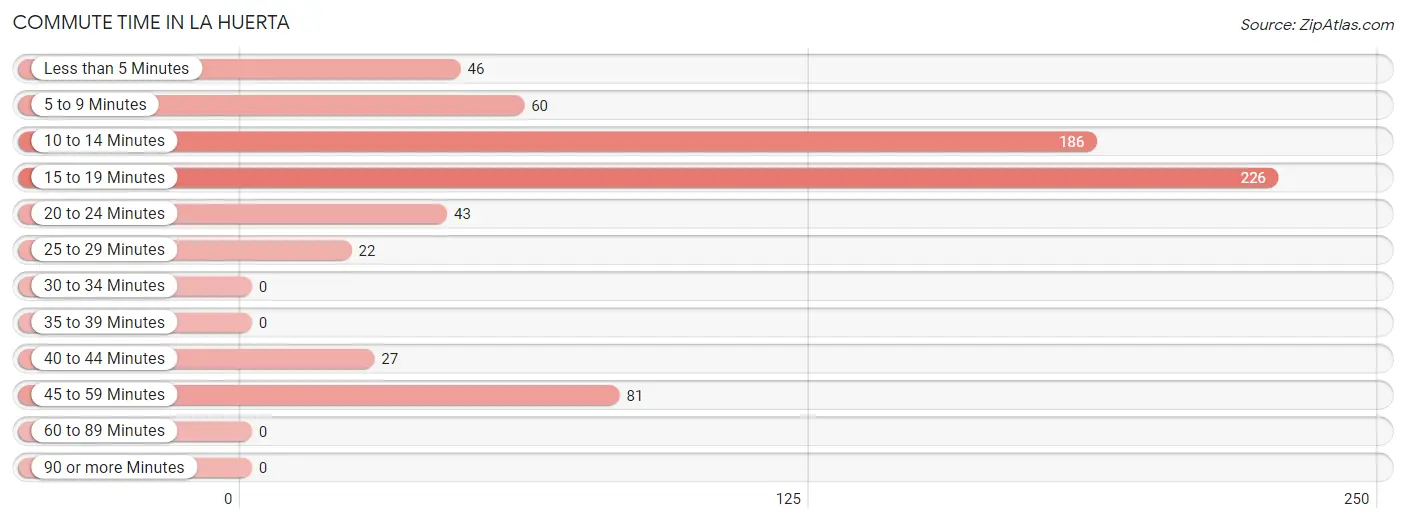
| Commute Time | # Commuters | % Commuters |
| Less than 5 Minutes | 46 | 6.7% |
| 5 to 9 Minutes | 60 | 8.7% |
| 10 to 14 Minutes | 186 | 26.9% |
| 15 to 19 Minutes | 226 | 32.7% |
| 20 to 24 Minutes | 43 | 6.2% |
| 25 to 29 Minutes | 22 | 3.2% |
| 30 to 34 Minutes | 0 | 0.0% |
| 35 to 39 Minutes | 0 | 0.0% |
| 40 to 44 Minutes | 27 | 3.9% |
| 45 to 59 Minutes | 81 | 11.7% |
| 60 to 89 Minutes | 0 | 0.0% |
| 90 or more Minutes | 0 | 0.0% |
Commute Time by Sex in La Huerta
The most common commute times in La Huerta are 15 to 19 minutes (204 commuters, 50.1%) for males and 10 to 14 minutes (123 commuters, 43.3%) for females.
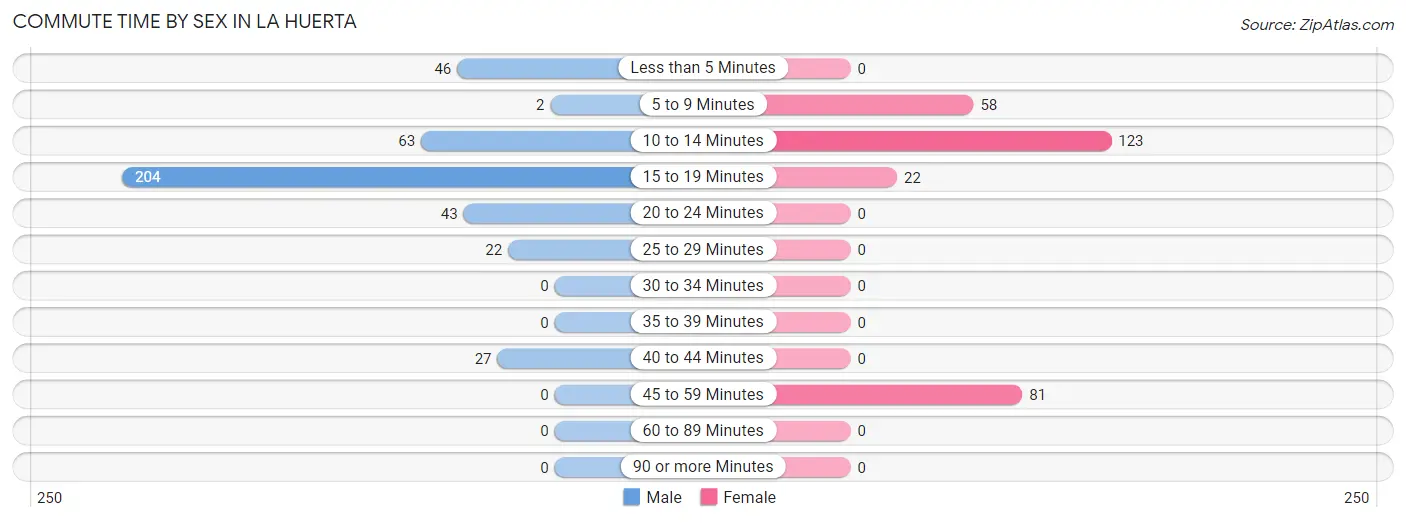
| Commute Time | Male | Female |
| Less than 5 Minutes | 46 (11.3%) | 0 (0.0%) |
| 5 to 9 Minutes | 2 (0.5%) | 58 (20.4%) |
| 10 to 14 Minutes | 63 (15.5%) | 123 (43.3%) |
| 15 to 19 Minutes | 204 (50.1%) | 22 (7.7%) |
| 20 to 24 Minutes | 43 (10.6%) | 0 (0.0%) |
| 25 to 29 Minutes | 22 (5.4%) | 0 (0.0%) |
| 30 to 34 Minutes | 0 (0.0%) | 0 (0.0%) |
| 35 to 39 Minutes | 0 (0.0%) | 0 (0.0%) |
| 40 to 44 Minutes | 27 (6.6%) | 0 (0.0%) |
| 45 to 59 Minutes | 0 (0.0%) | 81 (28.5%) |
| 60 to 89 Minutes | 0 (0.0%) | 0 (0.0%) |
| 90 or more Minutes | 0 (0.0%) | 0 (0.0%) |
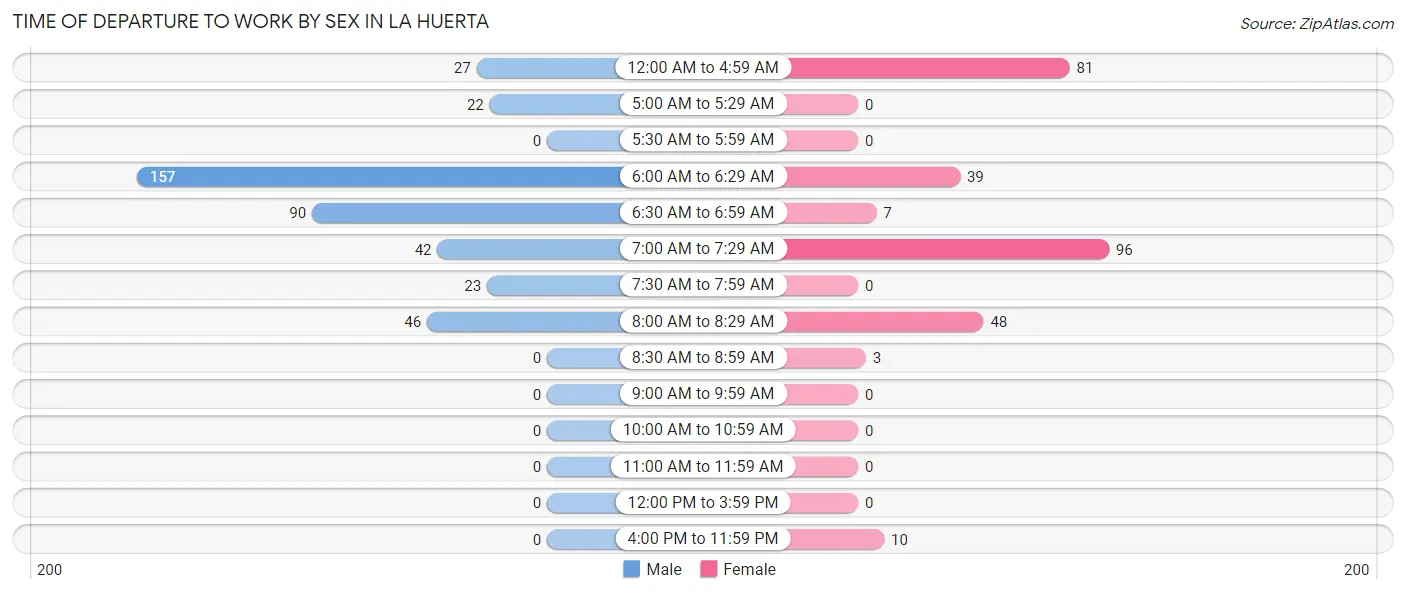
Time of Departure to Work by Sex in La Huerta
The most frequent times of departure to work in La Huerta are 6:00 AM to 6:29 AM (157, 38.6%) for males and 7:00 AM to 7:29 AM (96, 33.8%) for females.
| Time of Departure | Male | Female |
| 12:00 AM to 4:59 AM | 27 (6.6%) | 81 (28.5%) |
| 5:00 AM to 5:29 AM | 22 (5.4%) | 0 (0.0%) |
| 5:30 AM to 5:59 AM | 0 (0.0%) | 0 (0.0%) |
| 6:00 AM to 6:29 AM | 157 (38.6%) | 39 (13.7%) |
| 6:30 AM to 6:59 AM | 90 (22.1%) | 7 (2.5%) |
| 7:00 AM to 7:29 AM | 42 (10.3%) | 96 (33.8%) |
| 7:30 AM to 7:59 AM | 23 (5.7%) | 0 (0.0%) |
| 8:00 AM to 8:29 AM | 46 (11.3%) | 48 (16.9%) |
| 8:30 AM to 8:59 AM | 0 (0.0%) | 3 (1.1%) |
| 9:00 AM to 9:59 AM | 0 (0.0%) | 0 (0.0%) |
| 10:00 AM to 10:59 AM | 0 (0.0%) | 0 (0.0%) |
| 11:00 AM to 11:59 AM | 0 (0.0%) | 0 (0.0%) |
| 12:00 PM to 3:59 PM | 0 (0.0%) | 0 (0.0%) |
| 4:00 PM to 11:59 PM | 0 (0.0%) | 10 (3.5%) |
| Total | 407 (100.0%) | 284 (100.0%) |
Housing Occupancy in La Huerta
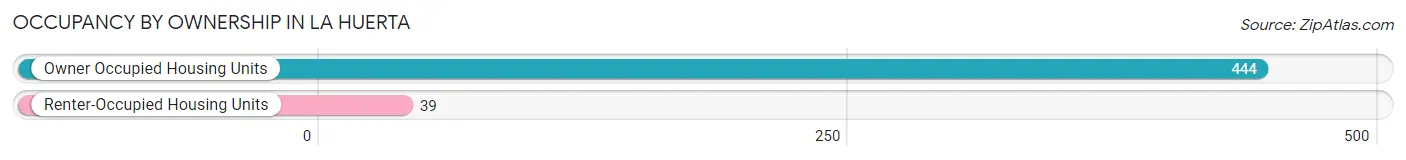
Occupancy by Ownership in La Huerta
Of the total 483 dwellings in La Huerta, owner-occupied units account for 444 (91.9%), while renter-occupied units make up 39 (8.1%).
| Occupancy | # Housing Units | % Housing Units |
| Owner Occupied Housing Units | 444 | 91.9% |
| Renter-Occupied Housing Units | 39 | 8.1% |
| Total Occupied Housing Units | 483 | 100.0% |
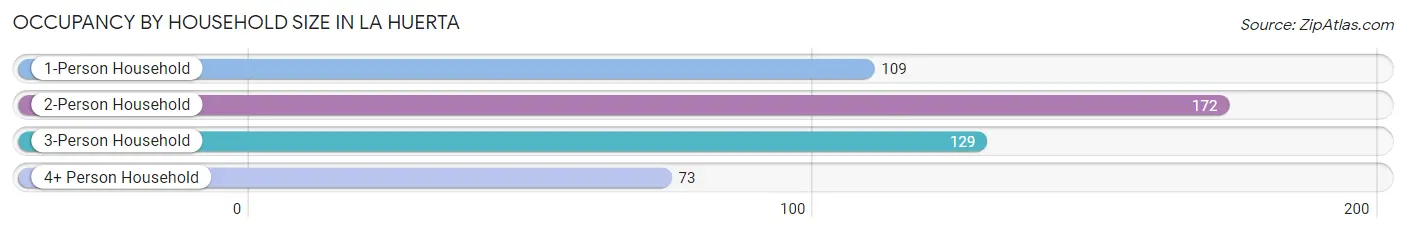
Occupancy by Household Size in La Huerta
| Household Size | # Housing Units | % Housing Units |
| 1-Person Household | 109 | 22.6% |
| 2-Person Household | 172 | 35.6% |
| 3-Person Household | 129 | 26.7% |
| 4+ Person Household | 73 | 15.1% |
| Total Housing Units | 483 | 100.0% |
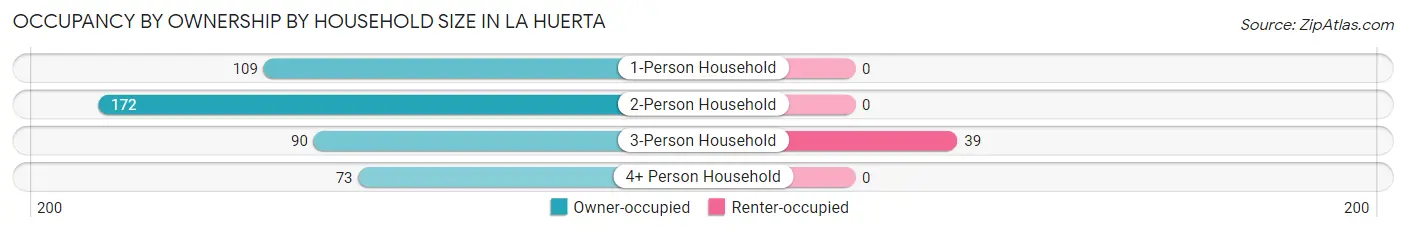
Occupancy by Ownership by Household Size in La Huerta
| Household Size | Owner-occupied | Renter-occupied |
| 1-Person Household | 109 (100.0%) | 0 (0.0%) |
| 2-Person Household | 172 (100.0%) | 0 (0.0%) |
| 3-Person Household | 90 (69.8%) | 39 (30.2%) |
| 4+ Person Household | 73 (100.0%) | 0 (0.0%) |
| Total Housing Units | 444 (91.9%) | 39 (8.1%) |
Occupancy by Educational Attainment in La Huerta
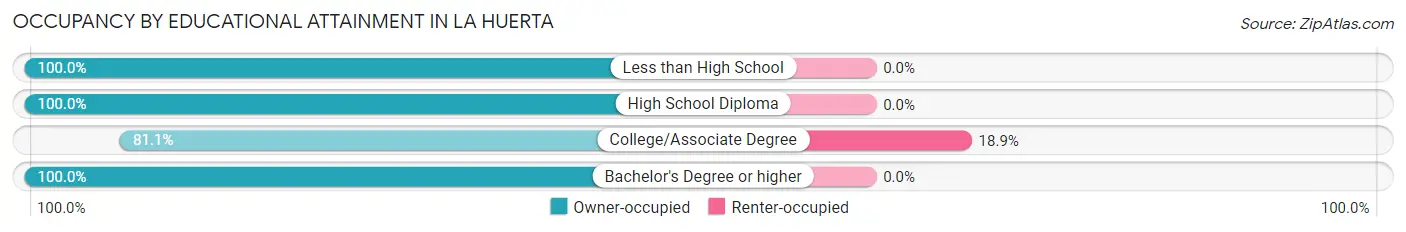
| Household Size | Owner-occupied | Renter-occupied |
| Less than High School | 40 (100.0%) | 0 (0.0%) |
| High School Diploma | 135 (100.0%) | 0 (0.0%) |
| College/Associate Degree | 167 (81.1%) | 39 (18.9%) |
| Bachelor's Degree or higher | 102 (100.0%) | 0 (0.0%) |
Occupancy by Age of Householder in La Huerta
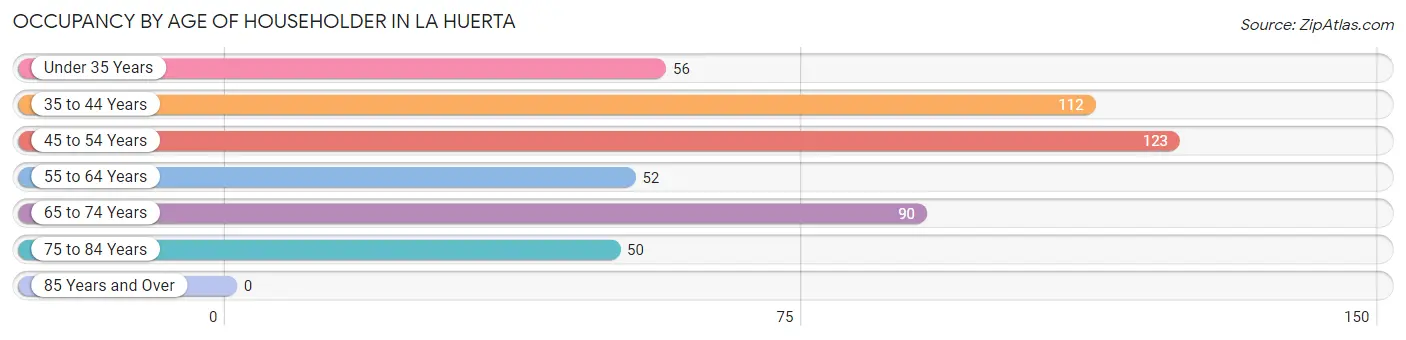
| Age Bracket | # Households | % Households |
| Under 35 Years | 56 | 11.6% |
| 35 to 44 Years | 112 | 23.2% |
| 45 to 54 Years | 123 | 25.5% |
| 55 to 64 Years | 52 | 10.8% |
| 65 to 74 Years | 90 | 18.6% |
| 75 to 84 Years | 50 | 10.3% |
| 85 Years and Over | 0 | 0.0% |
| Total | 483 | 100.0% |
Housing Finances in La Huerta
Median Income by Occupancy in La Huerta
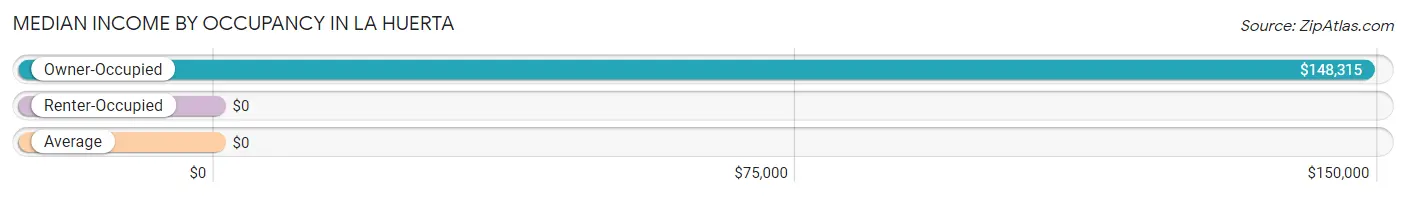
| Occupancy Type | # Households | Median Income |
| Owner-Occupied | 444 (91.9%) | $148,315 |
| Renter-Occupied | 39 (8.1%) | $0 |
| Average | 483 (100.0%) | $0 |
Occupancy by Householder Income Bracket in La Huerta
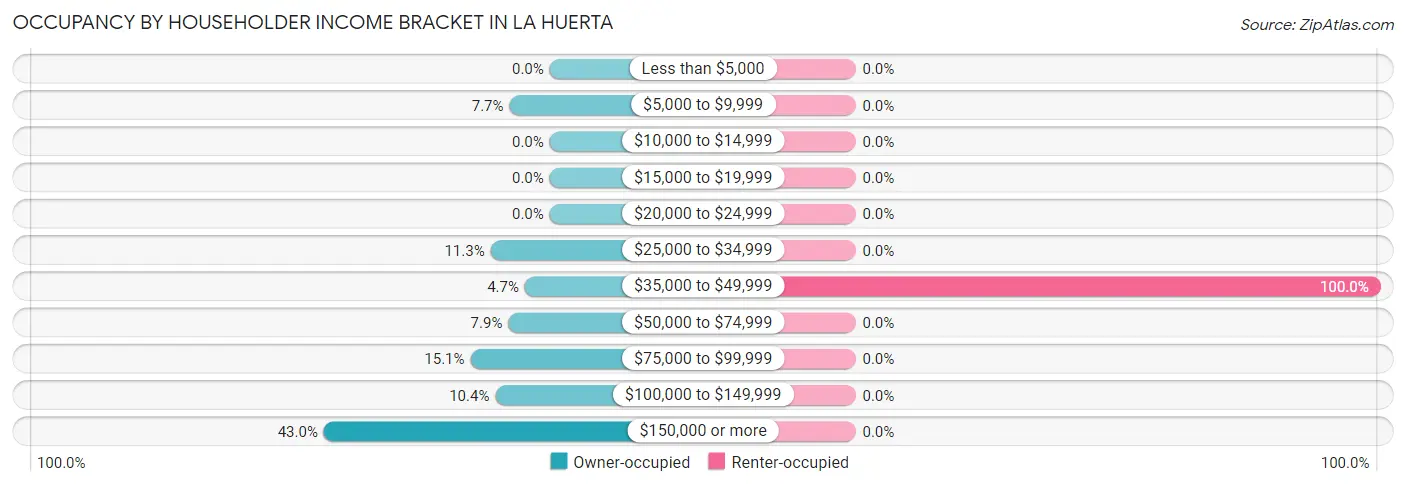
| Income Bracket | Owner-occupied | Renter-occupied |
| Less than $5,000 | 0 (0.0%) | 0 (0.0%) |
| $5,000 to $9,999 | 34 (7.7%) | 0 (0.0%) |
| $10,000 to $14,999 | 0 (0.0%) | 0 (0.0%) |
| $15,000 to $19,999 | 0 (0.0%) | 0 (0.0%) |
| $20,000 to $24,999 | 0 (0.0%) | 0 (0.0%) |
| $25,000 to $34,999 | 50 (11.3%) | 0 (0.0%) |
| $35,000 to $49,999 | 21 (4.7%) | 39 (100.0%) |
| $50,000 to $74,999 | 35 (7.9%) | 0 (0.0%) |
| $75,000 to $99,999 | 67 (15.1%) | 0 (0.0%) |
| $100,000 to $149,999 | 46 (10.4%) | 0 (0.0%) |
| $150,000 or more | 191 (43.0%) | 0 (0.0%) |
| Total | 444 (100.0%) | 39 (100.0%) |
Monthly Housing Cost Tiers in La Huerta
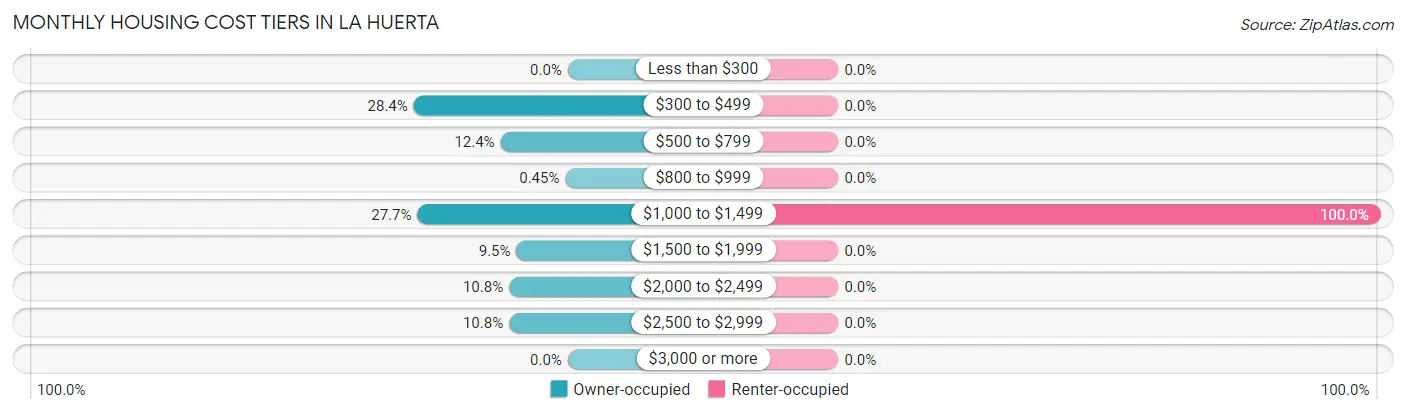
| Monthly Cost | Owner-occupied | Renter-occupied |
| Less than $300 | 0 (0.0%) | 0 (0.0%) |
| $300 to $499 | 126 (28.4%) | 0 (0.0%) |
| $500 to $799 | 55 (12.4%) | 0 (0.0%) |
| $800 to $999 | 2 (0.4%) | 0 (0.0%) |
| $1,000 to $1,499 | 123 (27.7%) | 39 (100.0%) |
| $1,500 to $1,999 | 42 (9.5%) | 0 (0.0%) |
| $2,000 to $2,499 | 48 (10.8%) | 0 (0.0%) |
| $2,500 to $2,999 | 48 (10.8%) | 0 (0.0%) |
| $3,000 or more | 0 (0.0%) | 0 (0.0%) |
| Total | 444 (100.0%) | 39 (100.0%) |
Physical Housing Characteristics in La Huerta
Housing Structures in La Huerta
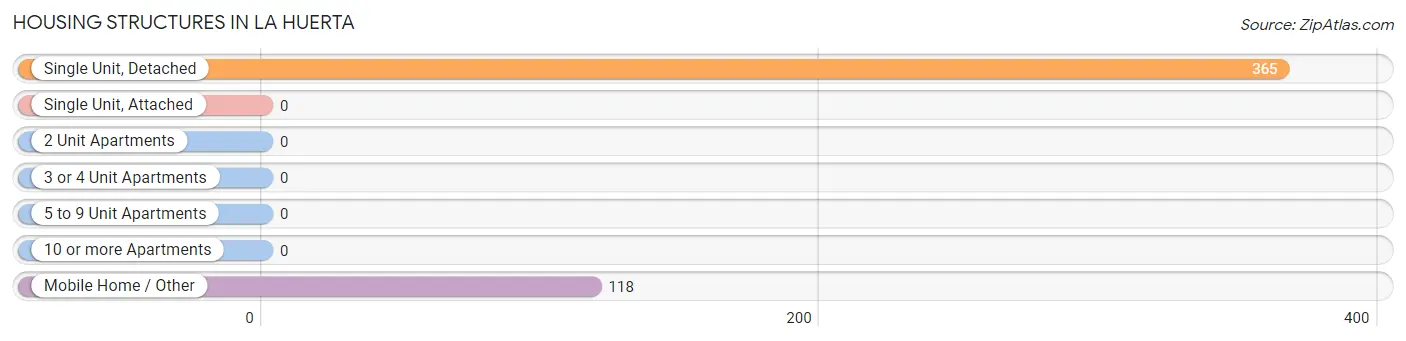
| Structure Type | # Housing Units | % Housing Units |
| Single Unit, Detached | 365 | 75.6% |
| Single Unit, Attached | 0 | 0.0% |
| 2 Unit Apartments | 0 | 0.0% |
| 3 or 4 Unit Apartments | 0 | 0.0% |
| 5 to 9 Unit Apartments | 0 | 0.0% |
| 10 or more Apartments | 0 | 0.0% |
| Mobile Home / Other | 118 | 24.4% |
| Total | 483 | 100.0% |
Housing Structures by Occupancy in La Huerta
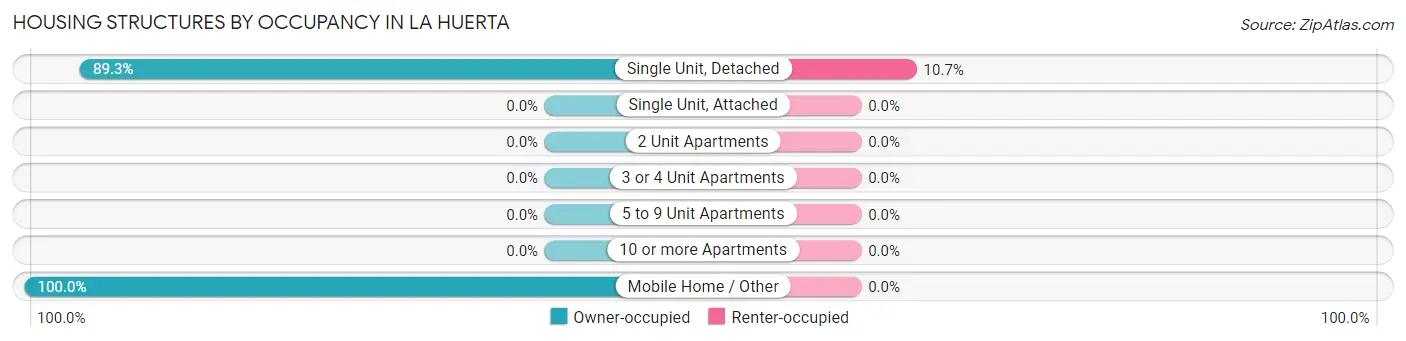
| Structure Type | Owner-occupied | Renter-occupied |
| Single Unit, Detached | 326 (89.3%) | 39 (10.7%) |
| Single Unit, Attached | 0 (0.0%) | 0 (0.0%) |
| 2 Unit Apartments | 0 (0.0%) | 0 (0.0%) |
| 3 or 4 Unit Apartments | 0 (0.0%) | 0 (0.0%) |
| 5 to 9 Unit Apartments | 0 (0.0%) | 0 (0.0%) |
| 10 or more Apartments | 0 (0.0%) | 0 (0.0%) |
| Mobile Home / Other | 118 (100.0%) | 0 (0.0%) |
| Total | 444 (91.9%) | 39 (8.1%) |
Housing Structures by Number of Rooms in La Huerta
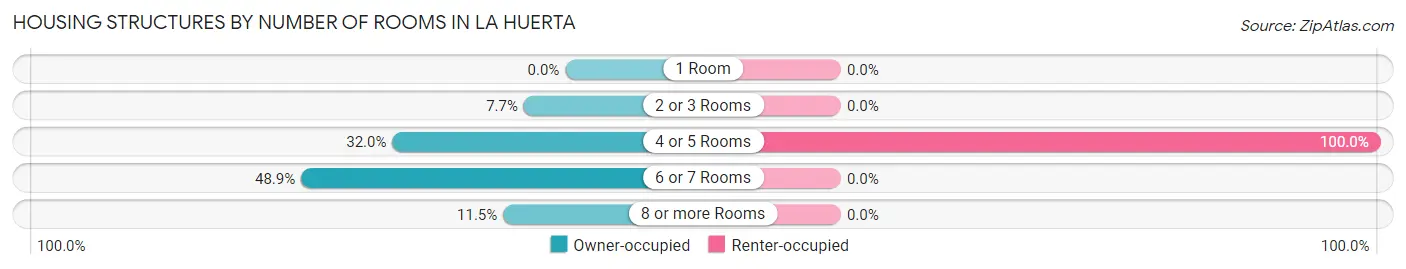
| Number of Rooms | Owner-occupied | Renter-occupied |
| 1 Room | 0 (0.0%) | 0 (0.0%) |
| 2 or 3 Rooms | 34 (7.7%) | 0 (0.0%) |
| 4 or 5 Rooms | 142 (32.0%) | 39 (100.0%) |
| 6 or 7 Rooms | 217 (48.9%) | 0 (0.0%) |
| 8 or more Rooms | 51 (11.5%) | 0 (0.0%) |
| Total | 444 (100.0%) | 39 (100.0%) |
Housing Structure by Heating Type in La Huerta
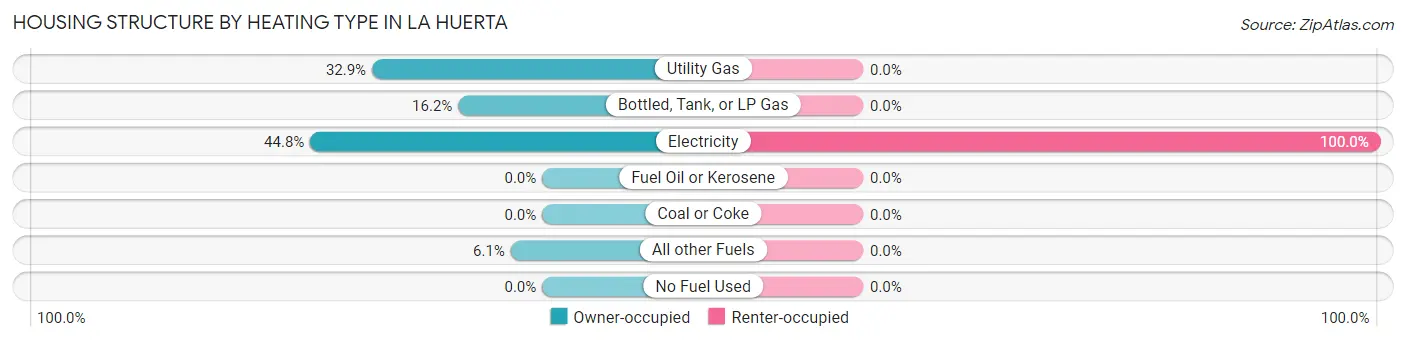
| Heating Type | Owner-occupied | Renter-occupied |
| Utility Gas | 146 (32.9%) | 0 (0.0%) |
| Bottled, Tank, or LP Gas | 72 (16.2%) | 0 (0.0%) |
| Electricity | 199 (44.8%) | 39 (100.0%) |
| Fuel Oil or Kerosene | 0 (0.0%) | 0 (0.0%) |
| Coal or Coke | 0 (0.0%) | 0 (0.0%) |
| All other Fuels | 27 (6.1%) | 0 (0.0%) |
| No Fuel Used | 0 (0.0%) | 0 (0.0%) |
| Total | 444 (100.0%) | 39 (100.0%) |
Household Vehicle Usage in La Huerta
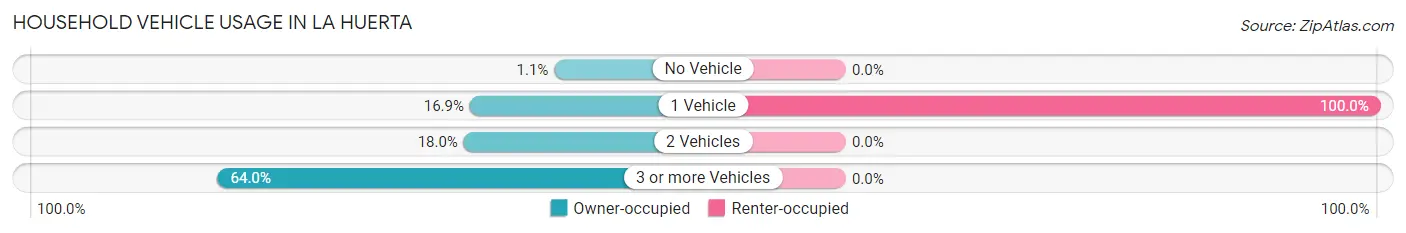
| Vehicles per Household | Owner-occupied | Renter-occupied |
| No Vehicle | 5 (1.1%) | 0 (0.0%) |
| 1 Vehicle | 75 (16.9%) | 39 (100.0%) |
| 2 Vehicles | 80 (18.0%) | 0 (0.0%) |
| 3 or more Vehicles | 284 (64.0%) | 0 (0.0%) |
| Total | 444 (100.0%) | 39 (100.0%) |
Real Estate & Mortgages in La Huerta
Real Estate and Mortgage Overview in La Huerta
| Characteristic | Without Mortgage | With Mortgage |
| Housing Units | 183 | 261 |
| Median Property Value | $285,300 | $414,000 |
| Median Household Income | $80,150 | $189 |
| Monthly Housing Costs | $457 | $0 |
| Real Estate Taxes | $1,336 | $0 |
Property Value by Mortgage Status in La Huerta
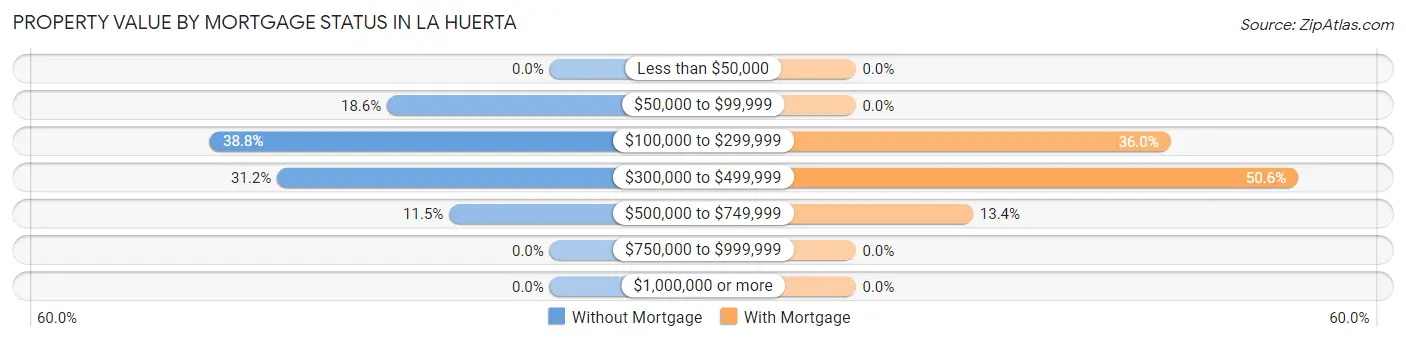
| Property Value | Without Mortgage | With Mortgage |
| Less than $50,000 | 0 (0.0%) | 0 (0.0%) |
| $50,000 to $99,999 | 34 (18.6%) | 0 (0.0%) |
| $100,000 to $299,999 | 71 (38.8%) | 94 (36.0%) |
| $300,000 to $499,999 | 57 (31.1%) | 132 (50.6%) |
| $500,000 to $749,999 | 21 (11.5%) | 35 (13.4%) |
| $750,000 to $999,999 | 0 (0.0%) | 0 (0.0%) |
| $1,000,000 or more | 0 (0.0%) | 0 (0.0%) |
| Total | 183 (100.0%) | 261 (100.0%) |
Household Income by Mortgage Status in La Huerta
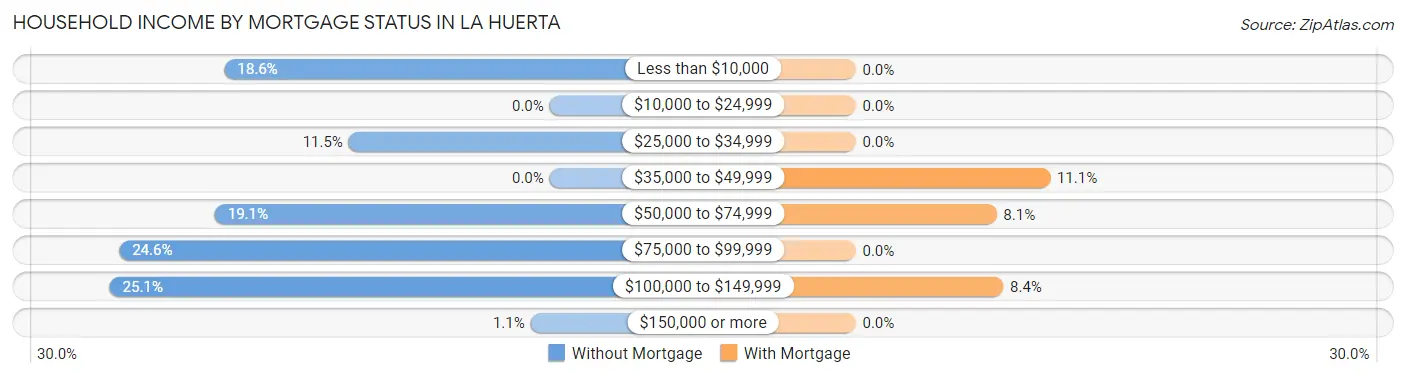
| Household Income | Without Mortgage | With Mortgage |
| Less than $10,000 | 34 (18.6%) | 0 (0.0%) |
| $10,000 to $24,999 | 0 (0.0%) | 0 (0.0%) |
| $25,000 to $34,999 | 21 (11.5%) | 0 (0.0%) |
| $35,000 to $49,999 | 0 (0.0%) | 29 (11.1%) |
| $50,000 to $74,999 | 35 (19.1%) | 21 (8.1%) |
| $75,000 to $99,999 | 45 (24.6%) | 0 (0.0%) |
| $100,000 to $149,999 | 46 (25.1%) | 22 (8.4%) |
| $150,000 or more | 2 (1.1%) | 0 (0.0%) |
| Total | 183 (100.0%) | 261 (100.0%) |
Property Value to Household Income Ratio in La Huerta
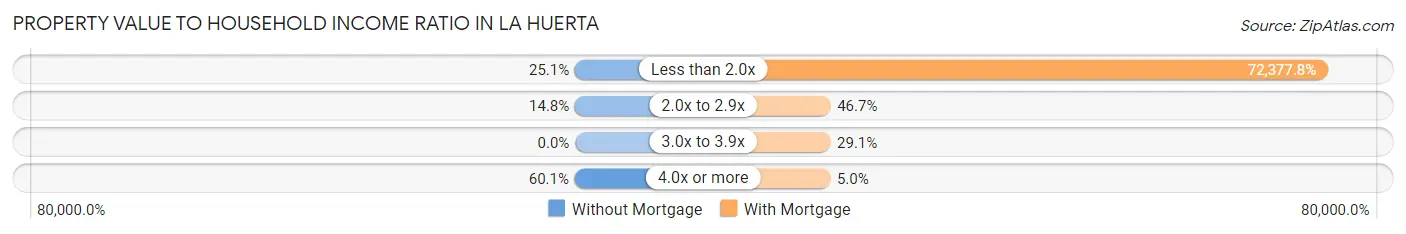
| Value-to-Income Ratio | Without Mortgage | With Mortgage |
| Less than 2.0x | 46 (25.1%) | 188,906 (72,377.8%) |
| 2.0x to 2.9x | 27 (14.7%) | 122 (46.7%) |
| 3.0x to 3.9x | 0 (0.0%) | 76 (29.1%) |
| 4.0x or more | 110 (60.1%) | 13 (5.0%) |
| Total | 183 (100.0%) | 261 (100.0%) |
Real Estate Taxes by Mortgage Status in La Huerta
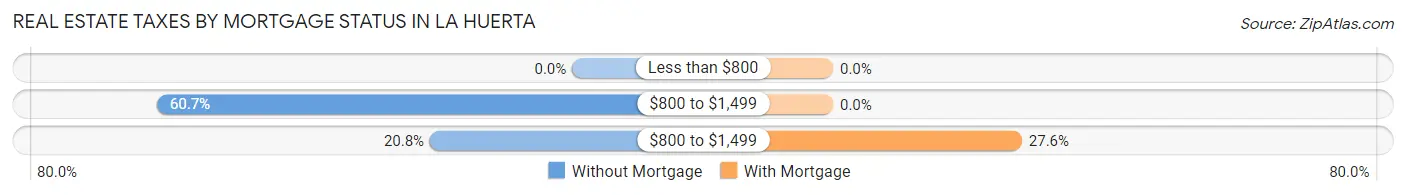
| Property Taxes | Without Mortgage | With Mortgage |
| Less than $800 | 0 (0.0%) | 0 (0.0%) |
| $800 to $1,499 | 111 (60.7%) | 0 (0.0%) |
| $800 to $1,499 | 38 (20.8%) | 72 (27.6%) |
| Total | 183 (100.0%) | 261 (100.0%) |
Health & Disability in La Huerta
Health Insurance Coverage by Age in La Huerta
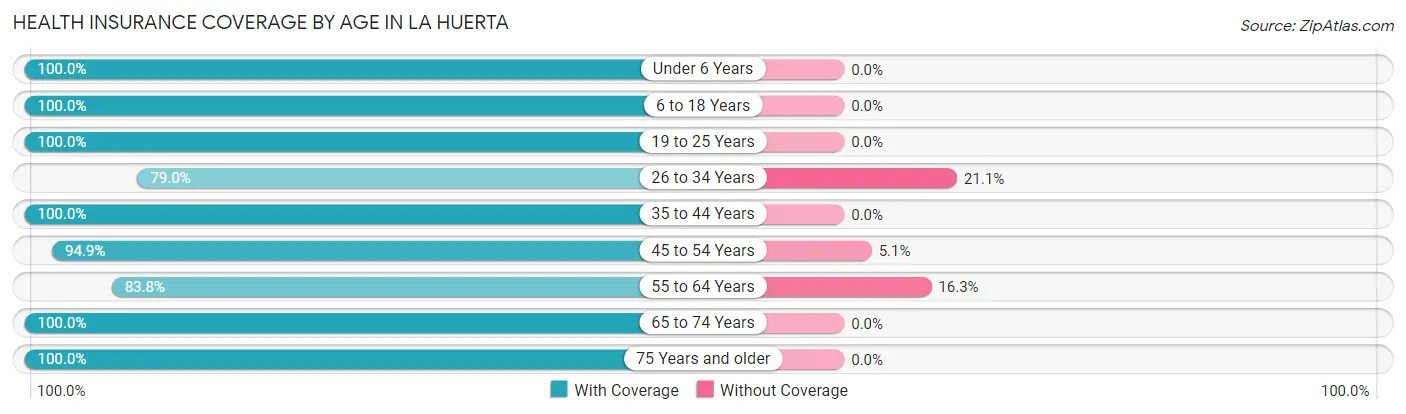
| Age Bracket | With Coverage | Without Coverage |
| Under 6 Years | 92 (100.0%) | 0 (0.0%) |
| 6 to 18 Years | 209 (100.0%) | 0 (0.0%) |
| 19 to 25 Years | 53 (100.0%) | 0 (0.0%) |
| 26 to 34 Years | 105 (78.9%) | 28 (21.0%) |
| 35 to 44 Years | 129 (100.0%) | 0 (0.0%) |
| 45 to 54 Years | 278 (94.9%) | 15 (5.1%) |
| 55 to 64 Years | 67 (83.8%) | 13 (16.3%) |
| 65 to 74 Years | 136 (100.0%) | 0 (0.0%) |
| 75 Years and older | 64 (100.0%) | 0 (0.0%) |
| Total | 1,133 (95.3%) | 56 (4.7%) |
Health Insurance Coverage by Citizenship Status in La Huerta
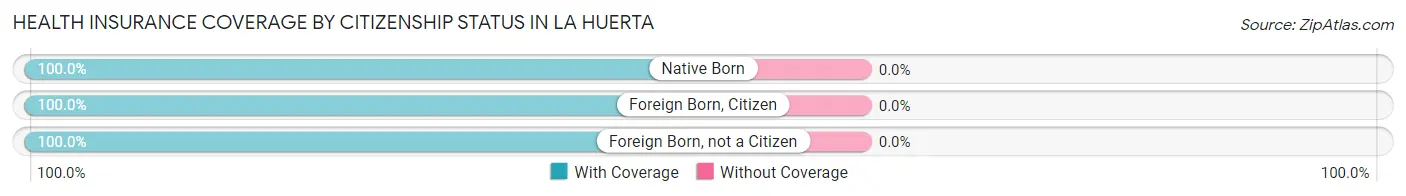
| Citizenship Status | With Coverage | Without Coverage |
| Native Born | 92 (100.0%) | 0 (0.0%) |
| Foreign Born, Citizen | 209 (100.0%) | 0 (0.0%) |
| Foreign Born, not a Citizen | 53 (100.0%) | 0 (0.0%) |
Health Insurance Coverage by Household Income in La Huerta
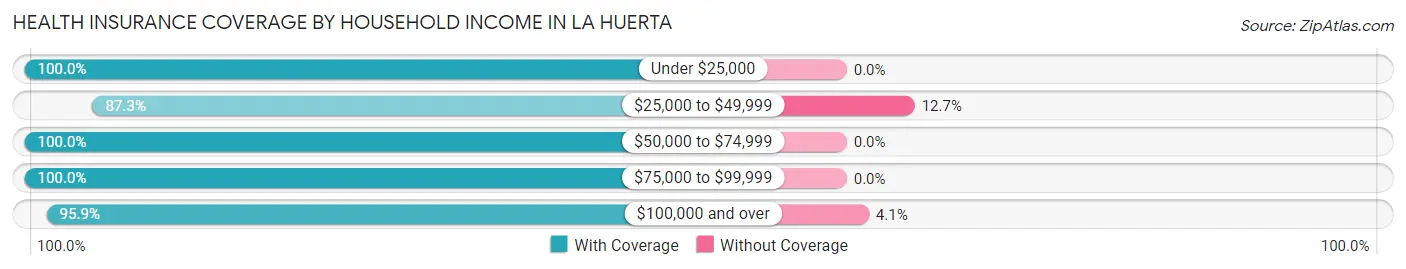
| Household Income | With Coverage | Without Coverage |
| Under $25,000 | 34 (100.0%) | 0 (0.0%) |
| $25,000 to $49,999 | 192 (87.3%) | 28 (12.7%) |
| $50,000 to $74,999 | 89 (100.0%) | 0 (0.0%) |
| $75,000 to $99,999 | 169 (100.0%) | 0 (0.0%) |
| $100,000 and over | 649 (95.9%) | 28 (4.1%) |
Public vs Private Health Insurance Coverage by Age in La Huerta
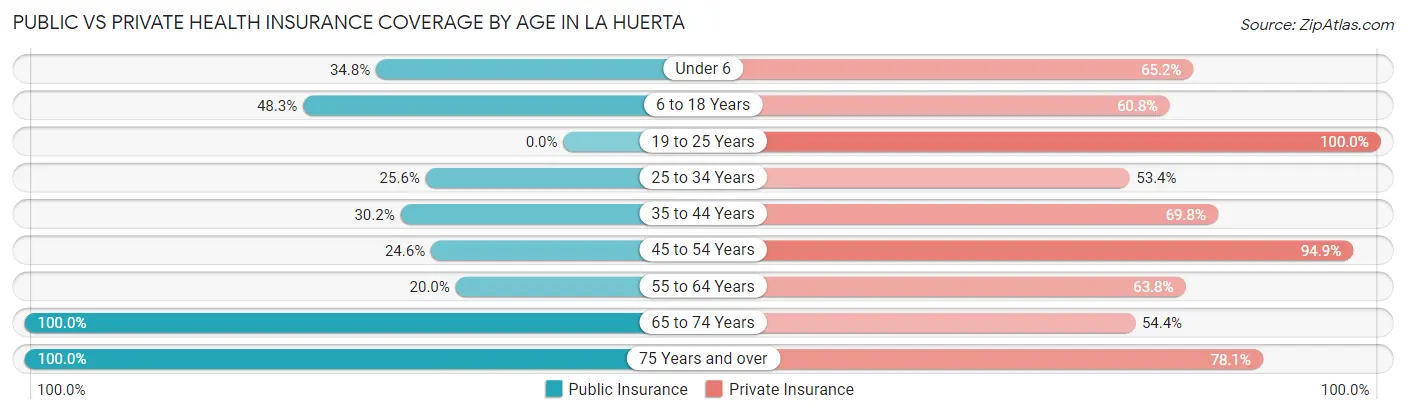
| Age Bracket | Public Insurance | Private Insurance |
| Under 6 | 32 (34.8%) | 60 (65.2%) |
| 6 to 18 Years | 101 (48.3%) | 127 (60.8%) |
| 19 to 25 Years | 0 (0.0%) | 53 (100.0%) |
| 25 to 34 Years | 34 (25.6%) | 71 (53.4%) |
| 35 to 44 Years | 39 (30.2%) | 90 (69.8%) |
| 45 to 54 Years | 72 (24.6%) | 278 (94.9%) |
| 55 to 64 Years | 16 (20.0%) | 51 (63.7%) |
| 65 to 74 Years | 136 (100.0%) | 74 (54.4%) |
| 75 Years and over | 64 (100.0%) | 50 (78.1%) |
| Total | 494 (41.5%) | 854 (71.8%) |
Disability Status by Sex by Age in La Huerta
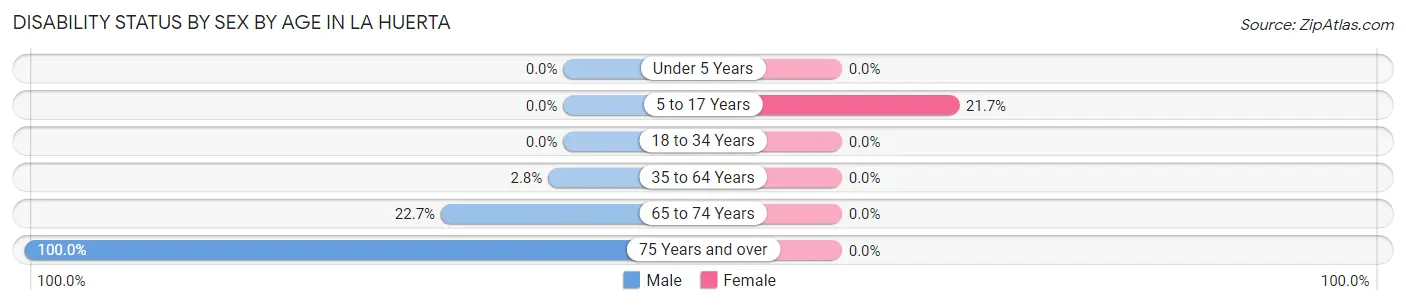
| Age Bracket | Male | Female |
| Under 5 Years | 0 (0.0%) | 0 (0.0%) |
| 5 to 17 Years | 0 (0.0%) | 10 (21.7%) |
| 18 to 34 Years | 0 (0.0%) | 0 (0.0%) |
| 35 to 64 Years | 7 (2.8%) | 0 (0.0%) |
| 65 to 74 Years | 20 (22.7%) | 0 (0.0%) |
| 75 Years and over | 9 (100.0%) | 0 (0.0%) |
Disability Class by Sex by Age in La Huerta
Disability Class: Hearing Difficulty
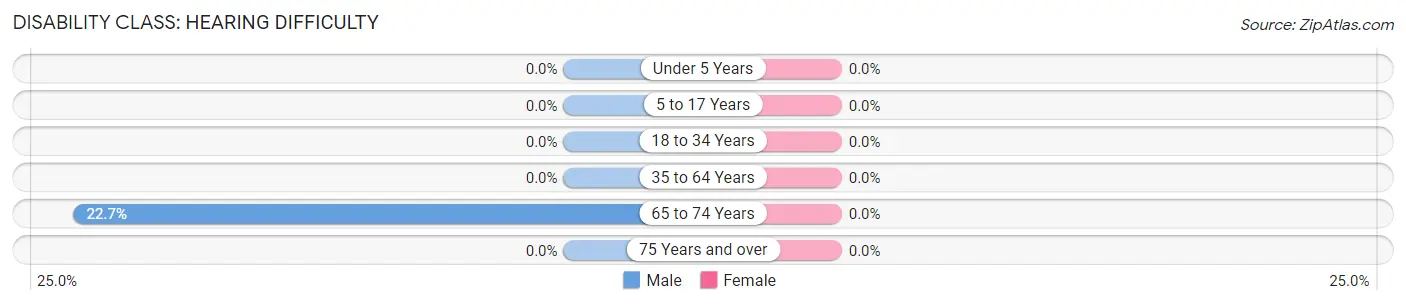
| Age Bracket | Male | Female |
| Under 5 Years | 0 (0.0%) | 0 (0.0%) |
| 5 to 17 Years | 0 (0.0%) | 0 (0.0%) |
| 18 to 34 Years | 0 (0.0%) | 0 (0.0%) |
| 35 to 64 Years | 0 (0.0%) | 0 (0.0%) |
| 65 to 74 Years | 20 (22.7%) | 0 (0.0%) |
| 75 Years and over | 0 (0.0%) | 0 (0.0%) |
Disability Class: Vision Difficulty
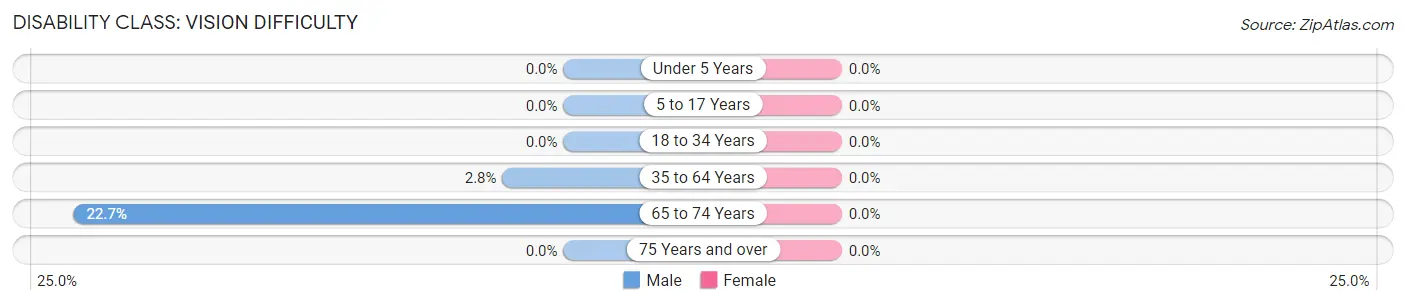
| Age Bracket | Male | Female |
| Under 5 Years | 0 (0.0%) | 0 (0.0%) |
| 5 to 17 Years | 0 (0.0%) | 0 (0.0%) |
| 18 to 34 Years | 0 (0.0%) | 0 (0.0%) |
| 35 to 64 Years | 7 (2.8%) | 0 (0.0%) |
| 65 to 74 Years | 20 (22.7%) | 0 (0.0%) |
| 75 Years and over | 0 (0.0%) | 0 (0.0%) |
Disability Class: Cognitive Difficulty
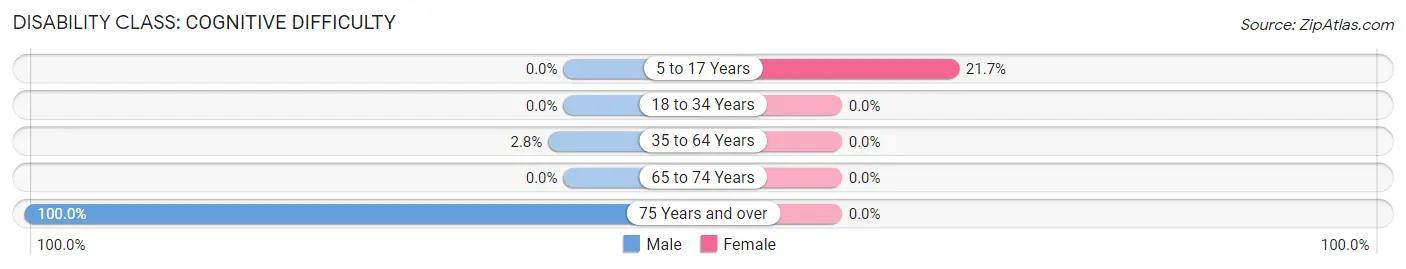
| Age Bracket | Male | Female |
| 5 to 17 Years | 0 (0.0%) | 10 (21.7%) |
| 18 to 34 Years | 0 (0.0%) | 0 (0.0%) |
| 35 to 64 Years | 7 (2.8%) | 0 (0.0%) |
| 65 to 74 Years | 0 (0.0%) | 0 (0.0%) |
| 75 Years and over | 9 (100.0%) | 0 (0.0%) |
Disability Class: Ambulatory Difficulty
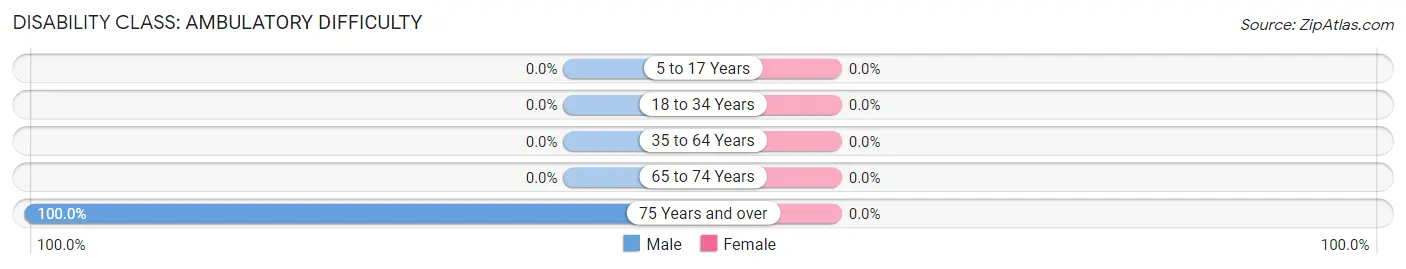
| Age Bracket | Male | Female |
| 5 to 17 Years | 0 (0.0%) | 0 (0.0%) |
| 18 to 34 Years | 0 (0.0%) | 0 (0.0%) |
| 35 to 64 Years | 0 (0.0%) | 0 (0.0%) |
| 65 to 74 Years | 0 (0.0%) | 0 (0.0%) |
| 75 Years and over | 9 (100.0%) | 0 (0.0%) |
Disability Class: Self-Care Difficulty
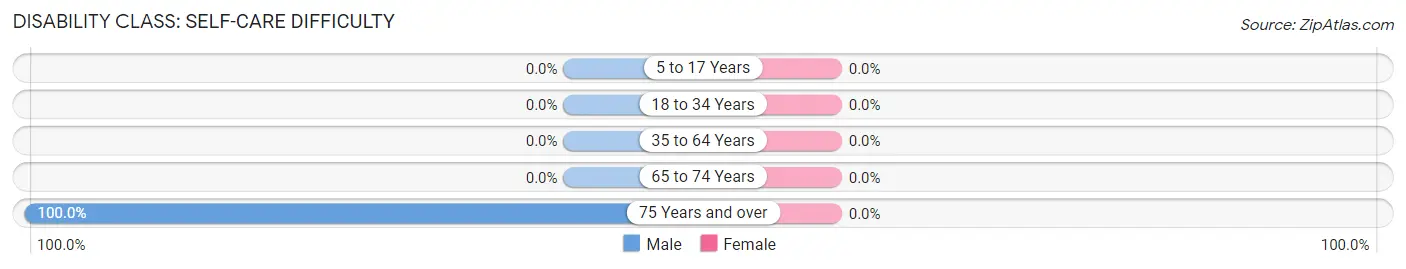
| Age Bracket | Male | Female |
| 5 to 17 Years | 0 (0.0%) | 0 (0.0%) |
| 18 to 34 Years | 0 (0.0%) | 0 (0.0%) |
| 35 to 64 Years | 0 (0.0%) | 0 (0.0%) |
| 65 to 74 Years | 0 (0.0%) | 0 (0.0%) |
| 75 Years and over | 9 (100.0%) | 0 (0.0%) |
Technology Access in La Huerta
Computing Device Access in La Huerta
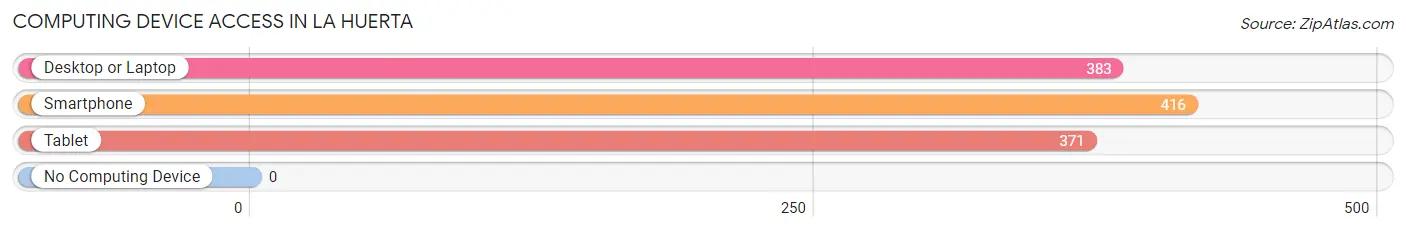
| Device Type | # Households | % Households |
| Desktop or Laptop | 383 | 79.3% |
| Smartphone | 416 | 86.1% |
| Tablet | 371 | 76.8% |
| No Computing Device | 0 | 0.0% |
| Total | 483 | 100.0% |
Internet Access in La Huerta
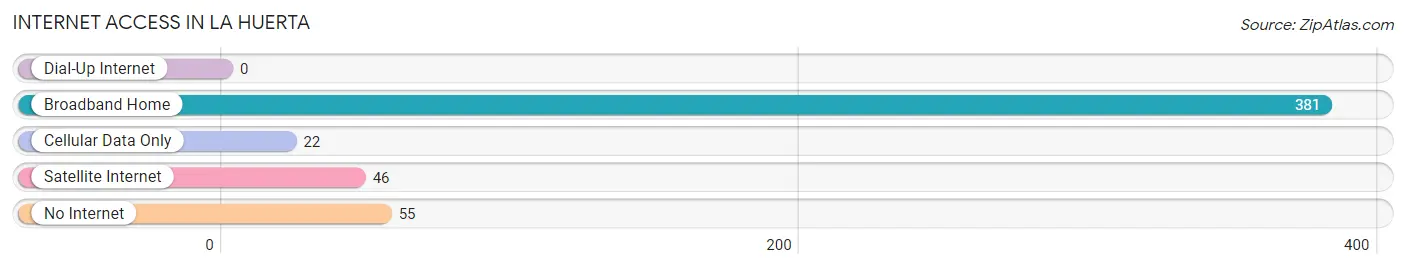
| Internet Type | # Households | % Households |
| Dial-Up Internet | 0 | 0.0% |
| Broadband Home | 381 | 78.9% |
| Cellular Data Only | 22 | 4.5% |
| Satellite Internet | 46 | 9.5% |
| No Internet | 55 | 11.4% |
| Total | 483 | 100.0% |
La Huerta Summary
Huerta, New Mexico is a small unincorporated community located in the northern part of the state, in San Miguel County. It is situated in the foothills of the Sangre de Cristo Mountains, about 25 miles south of Las Vegas, New Mexico. The population of Huerta was estimated to be around 200 people in 2020.
History
Huerta was founded in the late 1800s by a group of Mexican settlers who were looking for a place to settle and farm. The area was originally known as La Huerta de los Reyes, which translates to “The Garden of the Kings”. The settlers were attracted to the area due to its fertile soil and abundant water sources. The settlers built adobe homes and planted crops such as corn, beans, squash, and wheat.
The town was officially established in 1891 and was named after the local Huerta family. The Huerta family was one of the first families to settle in the area and they were instrumental in the development of the town. The Huerta family owned a large ranch in the area and they were also involved in the local government.
Geography
Huerta is located in the northern part of New Mexico, in San Miguel County. It is situated in the foothills of the Sangre de Cristo Mountains, about 25 miles south of Las Vegas, New Mexico. The town is located at an elevation of 6,000 feet and has a semi-arid climate with hot summers and cold winters.
The town is surrounded by rolling hills and is home to a variety of wildlife, including deer, elk, and antelope. The nearby San Miguel River provides a source of water for the town and the surrounding area.
Economy
The economy of Huerta is largely based on agriculture and ranching. The town is home to several small farms and ranches that produce a variety of crops, including corn, beans, squash, and wheat. The town also has a few small businesses, including a grocery store, a gas station, and a few restaurants.
Demographics
The population of Huerta was estimated to be around 200 people in 2020. The town is predominantly Hispanic, with a majority of the population being of Mexican descent. The median household income in Huerta is around $30,000, which is lower than the national average. The town has a high poverty rate, with around 40% of the population living below the poverty line.
Conclusion
Huerta, New Mexico is a small unincorporated community located in the northern part of the state, in San Miguel County. It is situated in the foothills of the Sangre de Cristo Mountains, about 25 miles south of Las Vegas, New Mexico. The town was founded in the late 1800s by a group of Mexican settlers and was officially established in 1891. The economy of Huerta is largely based on agriculture and ranching, and the population of the town was estimated to be around 200 people in 2020. The town is predominantly Hispanic, with a majority of the population being of Mexican descent. The median household income in Huerta is around $30,000, which is lower than the national average.
Common Questions
What is Per Capita Income in La Huerta?
Per Capita income in La Huerta is $49,652.
What is the Median Family Income in La Huerta?
Median Family Income in La Huerta is $149,864.
What is Inequality or Gini Index in La Huerta?
Inequality or Gini Index in La Huerta is 0.41.
What is the Total Population of La Huerta?
Total Population of La Huerta is 1,274.
What is the Total Male Population of La Huerta?
Total Male Population of La Huerta is 742.
What is the Total Female Population of La Huerta?
Total Female Population of La Huerta is 532.
What is the Ratio of Males per 100 Females in La Huerta?
There are 139.47 Males per 100 Females in La Huerta.
What is the Ratio of Females per 100 Males in La Huerta?
There are 71.70 Females per 100 Males in La Huerta.
What is the Median Population Age in La Huerta?
Median Population Age in La Huerta is 37.5 Years.
What is the Average Family Size in La Huerta
Average Family Size in La Huerta is 3.1 People.
What is the Average Household Size in La Huerta
Average Household Size in La Huerta is 2.6 People.
How Large is the Labor Force in La Huerta?
There are 691 People in the Labor Forcein in La Huerta.
What is the Percentage of People in the Labor Force in La Huerta?
69.0% of People are in the Labor Force in La Huerta.