Zip Codes with the Highest Percentage of Population Employed in Real Estate, Rental & Leasing in Roswell, NM
RELATED REPORTS & OPTIONS
Real Estate, Rental & Leasing
Roswell
Compare Zip Codes
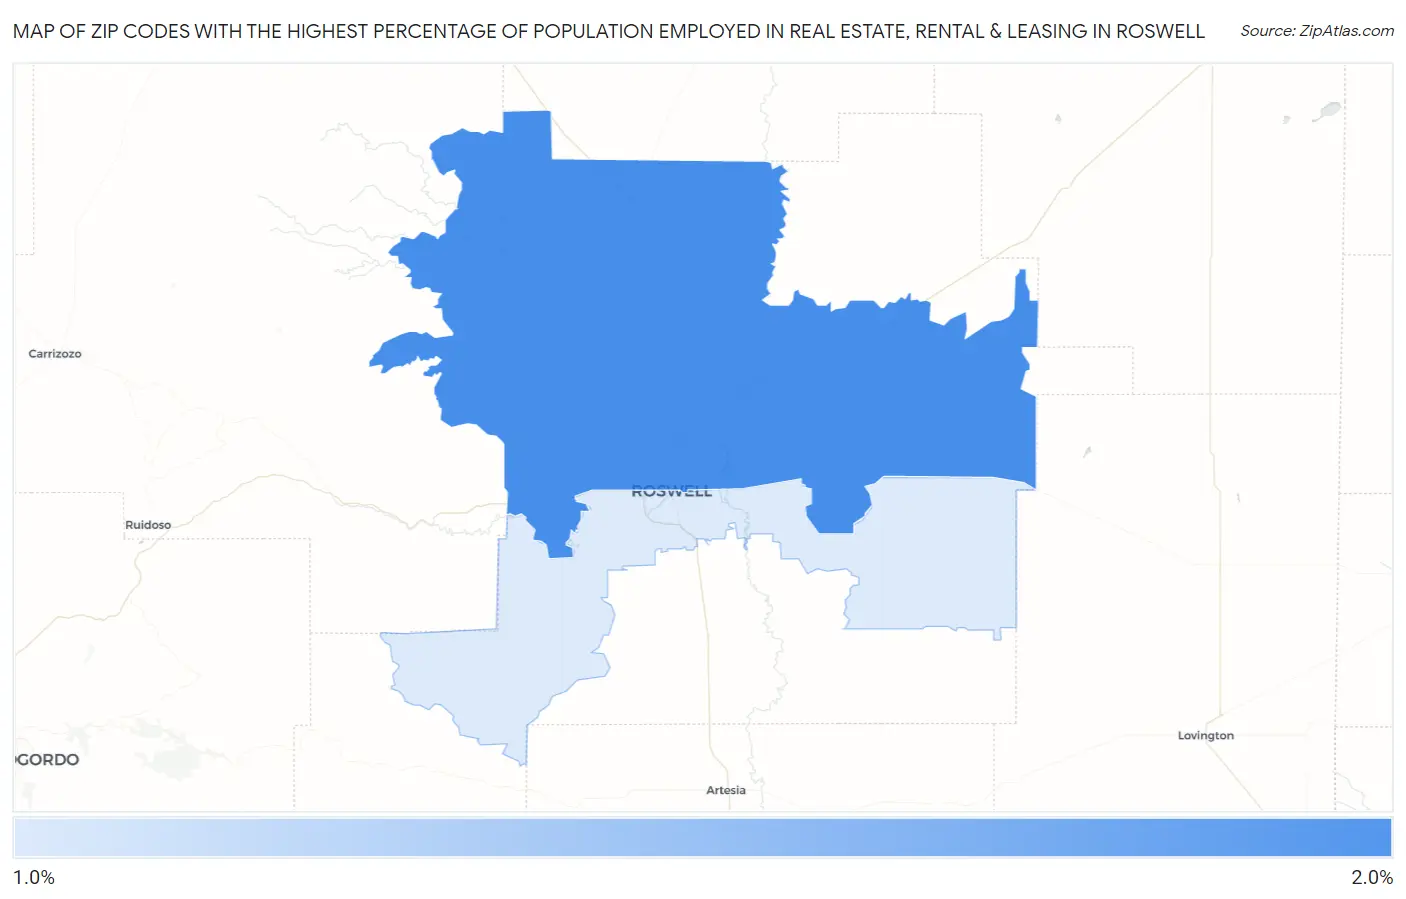
Map of Zip Codes with the Highest Percentage of Population Employed in Real Estate, Rental & Leasing in Roswell
1.3%
1.8%
Zip Codes with the Highest Percentage of Population Employed in Real Estate, Rental & Leasing in Roswell, NM
| Zip Code | % Employed | vs State | vs National | |
| 1. | 88201 | 1.8% | 1.6%(+0.203)#65 | 1.9%(-0.105)#9,218 |
| 2. | 88203 | 1.3% | 1.6%(-0.243)#87 | 1.9%(-0.551)#12,406 |
1
Common Questions
What are the Top Zip Codes with the Highest Percentage of Population Employed in Real Estate, Rental & Leasing in Roswell, NM?
Top Zip Codes with the Highest Percentage of Population Employed in Real Estate, Rental & Leasing in Roswell, NM are:
What zip code has the Highest Percentage of Population Employed in Real Estate, Rental & Leasing in Roswell, NM?
88201 has the Highest Percentage of Population Employed in Real Estate, Rental & Leasing in Roswell, NM with 1.8%.
What is the Percentage of Population Employed in Real Estate, Rental & Leasing in Roswell, NM?
Percentage of Population Employed in Real Estate, Rental & Leasing in Roswell is 1.4%.
What is the Percentage of Population Employed in Real Estate, Rental & Leasing in New Mexico?
Percentage of Population Employed in Real Estate, Rental & Leasing in New Mexico is 1.6%.
What is the Percentage of Population Employed in Real Estate, Rental & Leasing in the United States?
Percentage of Population Employed in Real Estate, Rental & Leasing in the United States is 1.9%.