Indian Beach, NC Map & Demographics
Indian Beach Map
Indian Beach Overview
$53,738
PER CAPITA INCOME
$109,063
AVG FAMILY INCOME
$80,000
AVG HOUSEHOLD INCOME
63.2%
WAGE / INCOME GAP [ % ]
36.8¢/ $1
WAGE / INCOME GAP [ $ ]
0.41
INEQUALITY / GINI INDEX
225
TOTAL POPULATION
106
MALE POPULATION
119
FEMALE POPULATION
89.08
MALES / 100 FEMALES
112.26
FEMALES / 100 MALES
63.2
MEDIAN AGE
2.5
AVG FAMILY SIZE
2.2
AVG HOUSEHOLD SIZE
74
LABOR FORCE [ PEOPLE ]
37.9%
PERCENT IN LABOR FORCE
1.4%
UNEMPLOYMENT RATE
Income in Indian Beach
Income Overview in Indian Beach
Per Capita Income in Indian Beach is $53,738, while median incomes of families and households are $109,063 and $80,000 respectively.
| Characteristic | Number | Measure |
| Per Capita Income | 225 | $53,738 |
| Median Family Income | 77 | $109,063 |
| Mean Family Income | 77 | $129,799 |
| Median Household Income | 98 | $80,000 |
| Mean Household Income | 98 | $114,185 |
| Income Deficit | 77 | $0 |
| Wage / Income Gap (%) | 225 | 63.15% |
| Wage / Income Gap ($) | 225 | 36.85¢ per $1 |
| Gini / Inequality Index | 225 | 0.41 |
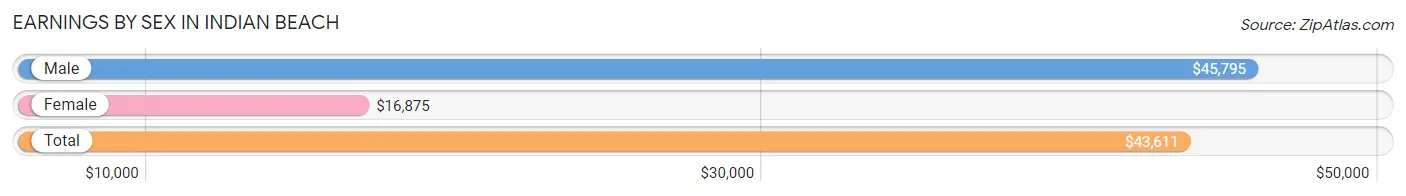
Earnings by Sex in Indian Beach
Average Earnings in Indian Beach are $43,611, $45,795 for men and $16,875 for women, a difference of 63.1%.
| Sex | Number | Average Earnings |
| Male | 61 (63.5%) | $45,795 |
| Female | 35 (36.5%) | $16,875 |
| Total | 96 (100.0%) | $43,611 |
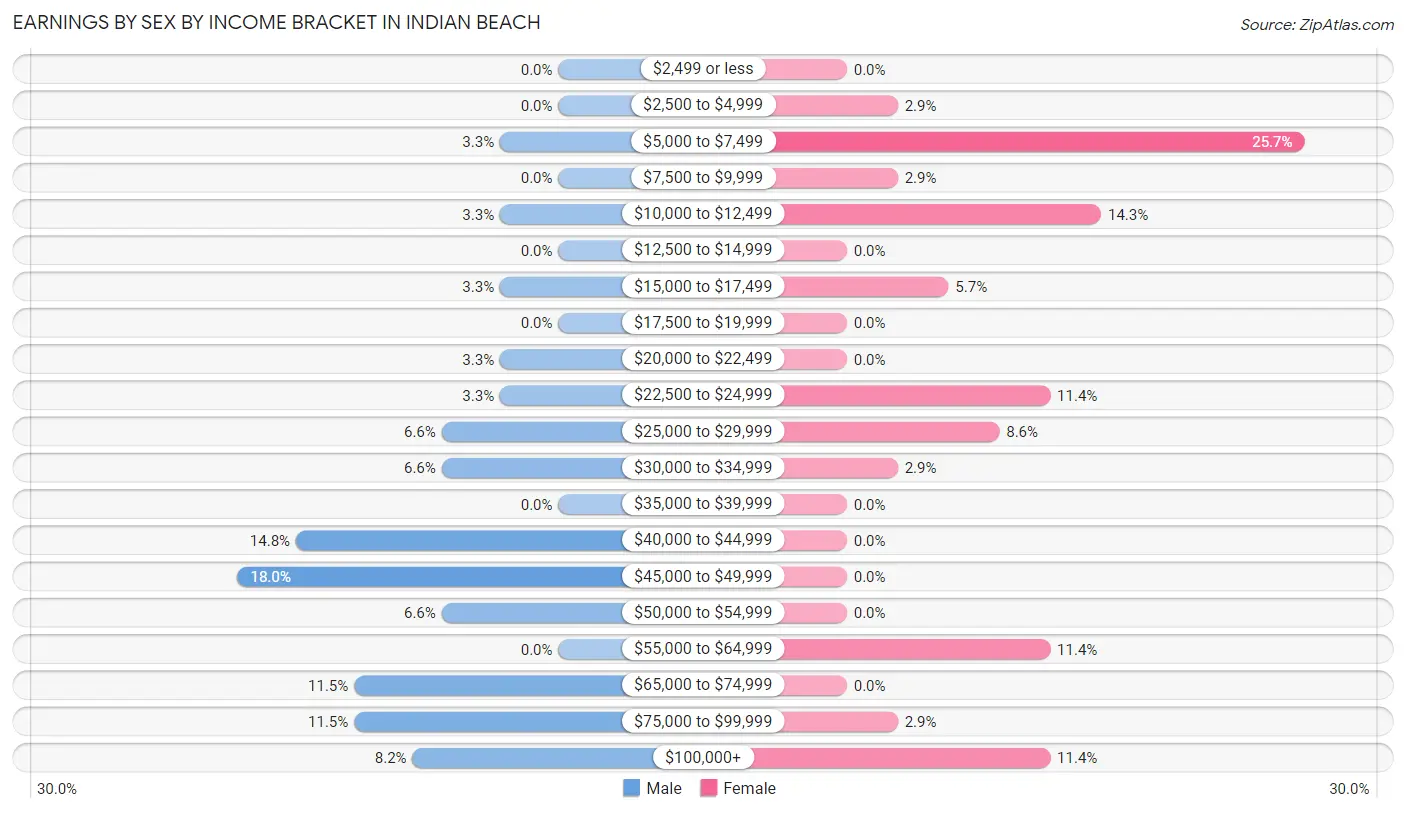
Earnings by Sex by Income Bracket in Indian Beach
The most common earnings brackets in Indian Beach are $45,000 to $49,999 for men (11 | 18.0%) and $5,000 to $7,499 for women (9 | 25.7%).
| Income | Male | Female |
| $2,499 or less | 0 (0.0%) | 0 (0.0%) |
| $2,500 to $4,999 | 0 (0.0%) | 1 (2.9%) |
| $5,000 to $7,499 | 2 (3.3%) | 9 (25.7%) |
| $7,500 to $9,999 | 0 (0.0%) | 1 (2.9%) |
| $10,000 to $12,499 | 2 (3.3%) | 5 (14.3%) |
| $12,500 to $14,999 | 0 (0.0%) | 0 (0.0%) |
| $15,000 to $17,499 | 2 (3.3%) | 2 (5.7%) |
| $17,500 to $19,999 | 0 (0.0%) | 0 (0.0%) |
| $20,000 to $22,499 | 2 (3.3%) | 0 (0.0%) |
| $22,500 to $24,999 | 2 (3.3%) | 4 (11.4%) |
| $25,000 to $29,999 | 4 (6.6%) | 3 (8.6%) |
| $30,000 to $34,999 | 4 (6.6%) | 1 (2.9%) |
| $35,000 to $39,999 | 0 (0.0%) | 0 (0.0%) |
| $40,000 to $44,999 | 9 (14.7%) | 0 (0.0%) |
| $45,000 to $49,999 | 11 (18.0%) | 0 (0.0%) |
| $50,000 to $54,999 | 4 (6.6%) | 0 (0.0%) |
| $55,000 to $64,999 | 0 (0.0%) | 4 (11.4%) |
| $65,000 to $74,999 | 7 (11.5%) | 0 (0.0%) |
| $75,000 to $99,999 | 7 (11.5%) | 1 (2.9%) |
| $100,000+ | 5 (8.2%) | 4 (11.4%) |
| Total | 61 (100.0%) | 35 (100.0%) |
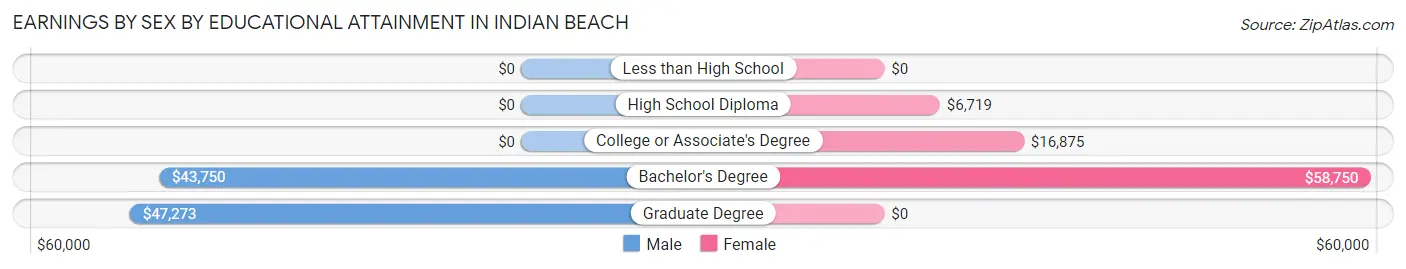
Earnings by Sex by Educational Attainment in Indian Beach
Average earnings in Indian Beach are $46,023 for men and $22,813 for women, a difference of 50.4%. Men with an educational attainment of graduate degree enjoy the highest average annual earnings of $47,273, while those with bachelor's degree education earn the least with $43,750. Women with an educational attainment of bachelor's degree earn the most with the average annual earnings of $58,750, while those with high school diploma education have the smallest earnings of $6,719.
| Educational Attainment | Male Income | Female Income |
| Less than High School | - | - |
| High School Diploma | - | - |
| College or Associate's Degree | - | - |
| Bachelor's Degree | $43,750 | $58,750 |
| Graduate Degree | $47,273 | $0 |
| Total | $46,023 | $22,813 |
Family Income in Indian Beach
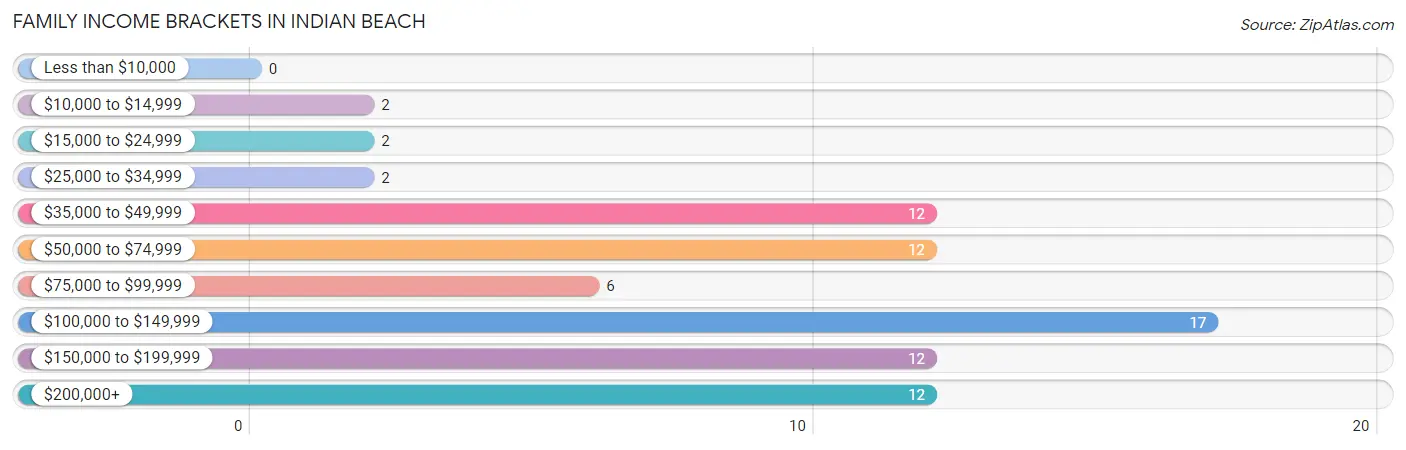
Family Income Brackets in Indian Beach
According to the Indian Beach family income data, there are 17 families falling into the $100,000 to $149,999 income range, which is the most common income bracket and makes up 22.1% of all families.
| Income Bracket | # Families | % Families |
| Less than $10,000 | 0 | 0.0% |
| $10,000 to $14,999 | 2 | 2.6% |
| $15,000 to $24,999 | 2 | 2.6% |
| $25,000 to $34,999 | 2 | 2.6% |
| $35,000 to $49,999 | 12 | 15.6% |
| $50,000 to $74,999 | 12 | 15.6% |
| $75,000 to $99,999 | 6 | 7.8% |
| $100,000 to $149,999 | 17 | 22.1% |
| $150,000 to $199,999 | 12 | 15.6% |
| $200,000+ | 12 | 15.6% |
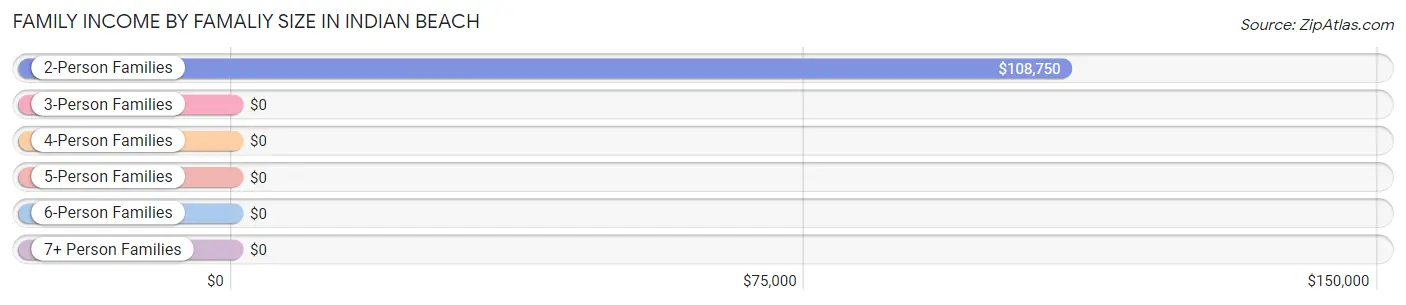
Family Income by Famaliy Size in Indian Beach
2-person families (58 | 75.3%) account for the highest median family income in Indian Beach with $108,750 per family, while 2-person families (58 | 75.3%) have the highest median income of $54,375 per family member.
| Income Bracket | # Families | Median Income |
| 2-Person Families | 58 (75.3%) | $108,750 |
| 3-Person Families | 7 (9.1%) | $0 |
| 4-Person Families | 1 (1.3%) | $0 |
| 5-Person Families | 11 (14.3%) | $0 |
| 6-Person Families | 0 (0.0%) | $0 |
| 7+ Person Families | 0 (0.0%) | $0 |
| Total | 77 (100.0%) | $109,063 |
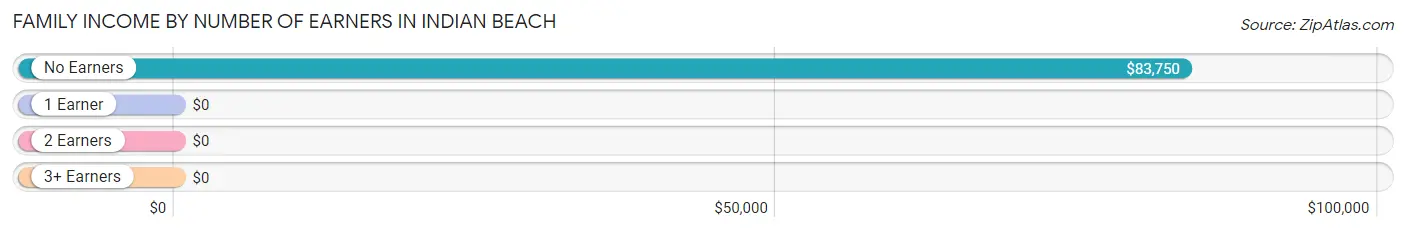
Family Income by Number of Earners in Indian Beach
| Number of Earners | # Families | Median Income |
| No Earners | 28 (36.4%) | $83,750 |
| 1 Earner | 29 (37.7%) | $0 |
| 2 Earners | 12 (15.6%) | $0 |
| 3+ Earners | 8 (10.4%) | $0 |
| Total | 77 (100.0%) | $109,063 |
Household Income in Indian Beach
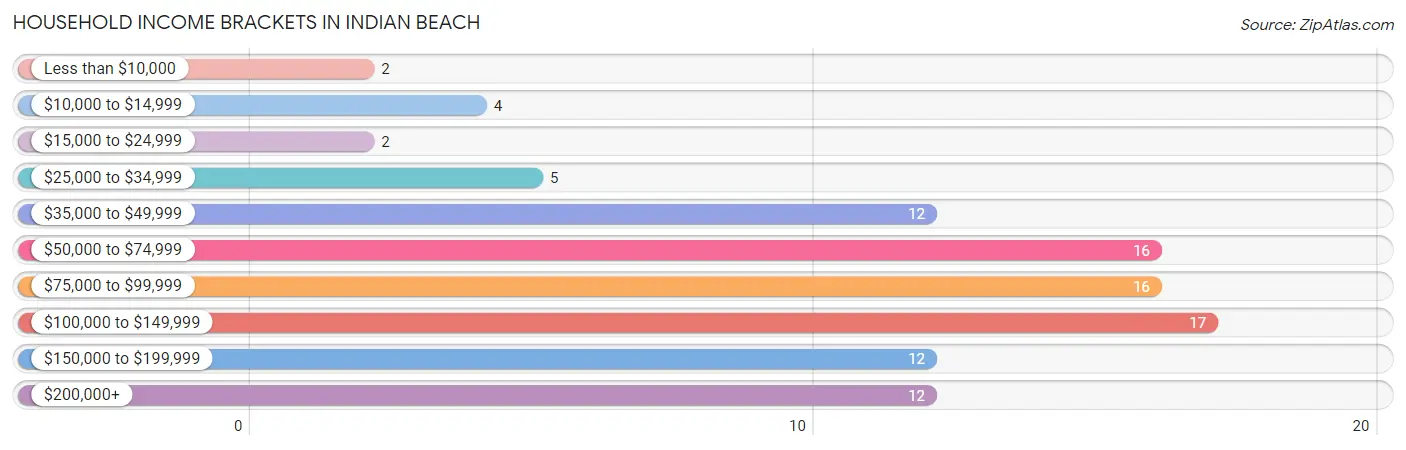
Household Income Brackets in Indian Beach
With 17 households falling in the category, the $100,000 to $149,999 income range is the most frequent in Indian Beach, accounting for 17.3% of all households. In contrast, only 2 households (2.0%) fall into the less than $10,000 income bracket, making it the least populous group.
| Income Bracket | # Households | % Households |
| Less than $10,000 | 2 | 2.0% |
| $10,000 to $14,999 | 4 | 4.1% |
| $15,000 to $24,999 | 2 | 2.0% |
| $25,000 to $34,999 | 5 | 5.1% |
| $35,000 to $49,999 | 12 | 12.2% |
| $50,000 to $74,999 | 16 | 16.3% |
| $75,000 to $99,999 | 16 | 16.3% |
| $100,000 to $149,999 | 17 | 17.3% |
| $150,000 to $199,999 | 12 | 12.2% |
| $200,000+ | 12 | 12.2% |
Household Income by Householder Age in Indian Beach
The median household income in Indian Beach is $80,000, with the highest median household income of $87,083 found in the 45 to 64 years age bracket for the primary householder. A total of 29 households (29.6%) fall into this category.
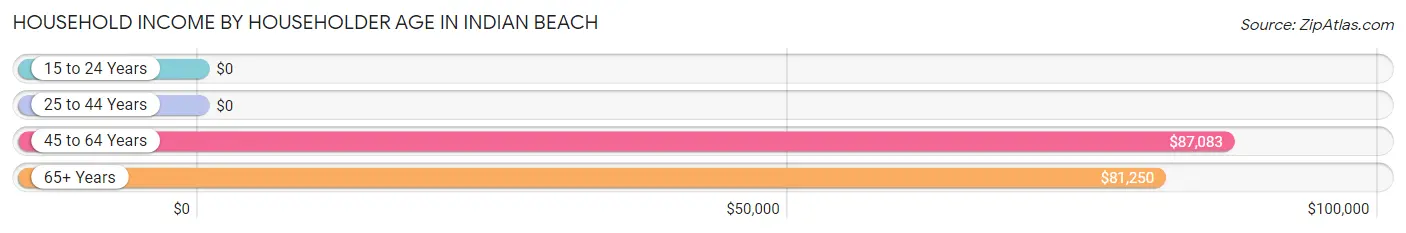
| Income Bracket | # Households | Median Income |
| 15 to 24 Years | 0 (0.0%) | $0 |
| 25 to 44 Years | 11 (11.2%) | $0 |
| 45 to 64 Years | 29 (29.6%) | $87,083 |
| 65+ Years | 58 (59.2%) | $81,250 |
| Total | 98 (100.0%) | $80,000 |
Poverty in Indian Beach
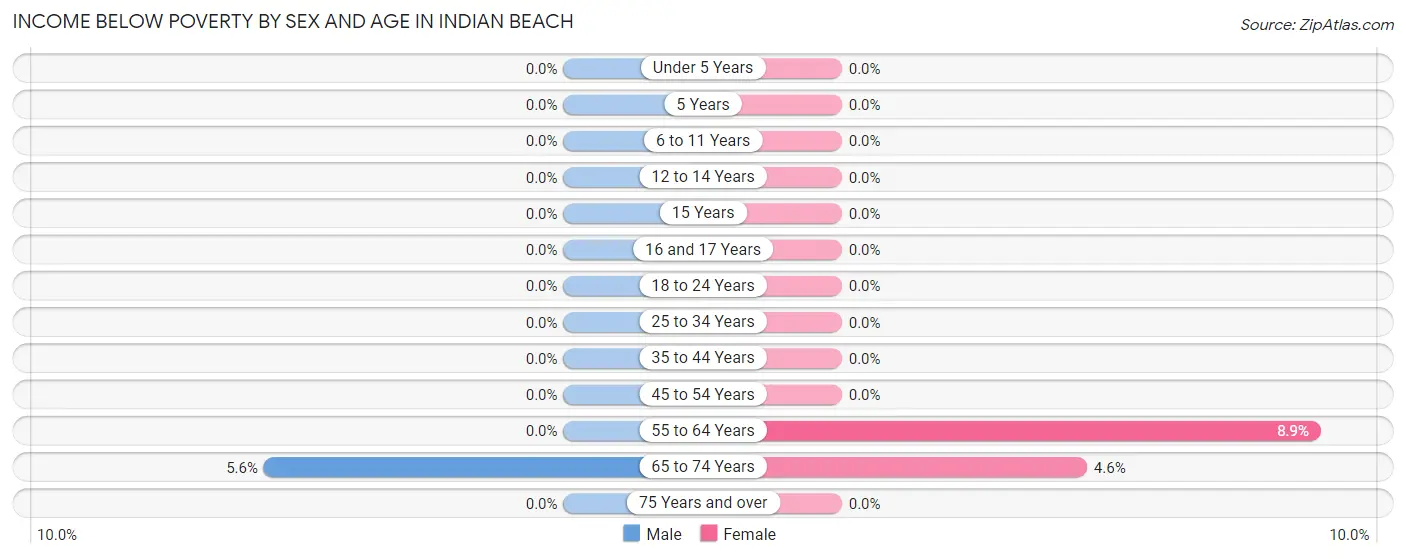
Income Below Poverty by Sex and Age in Indian Beach
With 2.0% poverty level for males and 4.4% for females among the residents of Indian Beach, 65 to 74 year old males and 55 to 64 year old females are the most vulnerable to poverty, with 2 males (5.6%) and 4 females (8.9%) in their respective age groups living below the poverty level.
| Age Bracket | Male | Female |
| Under 5 Years | 0 (0.0%) | 0 (0.0%) |
| 5 Years | 0 (0.0%) | 0 (0.0%) |
| 6 to 11 Years | 0 (0.0%) | 0 (0.0%) |
| 12 to 14 Years | 0 (0.0%) | 0 (0.0%) |
| 15 Years | 0 (0.0%) | 0 (0.0%) |
| 16 and 17 Years | 0 (0.0%) | 0 (0.0%) |
| 18 to 24 Years | 0 (0.0%) | 0 (0.0%) |
| 25 to 34 Years | 0 (0.0%) | 0 (0.0%) |
| 35 to 44 Years | 0 (0.0%) | 0 (0.0%) |
| 45 to 54 Years | 0 (0.0%) | 0 (0.0%) |
| 55 to 64 Years | 0 (0.0%) | 4 (8.9%) |
| 65 to 74 Years | 2 (5.6%) | 1 (4.5%) |
| 75 Years and over | 0 (0.0%) | 0 (0.0%) |
| Total | 2 (2.0%) | 5 (4.4%) |
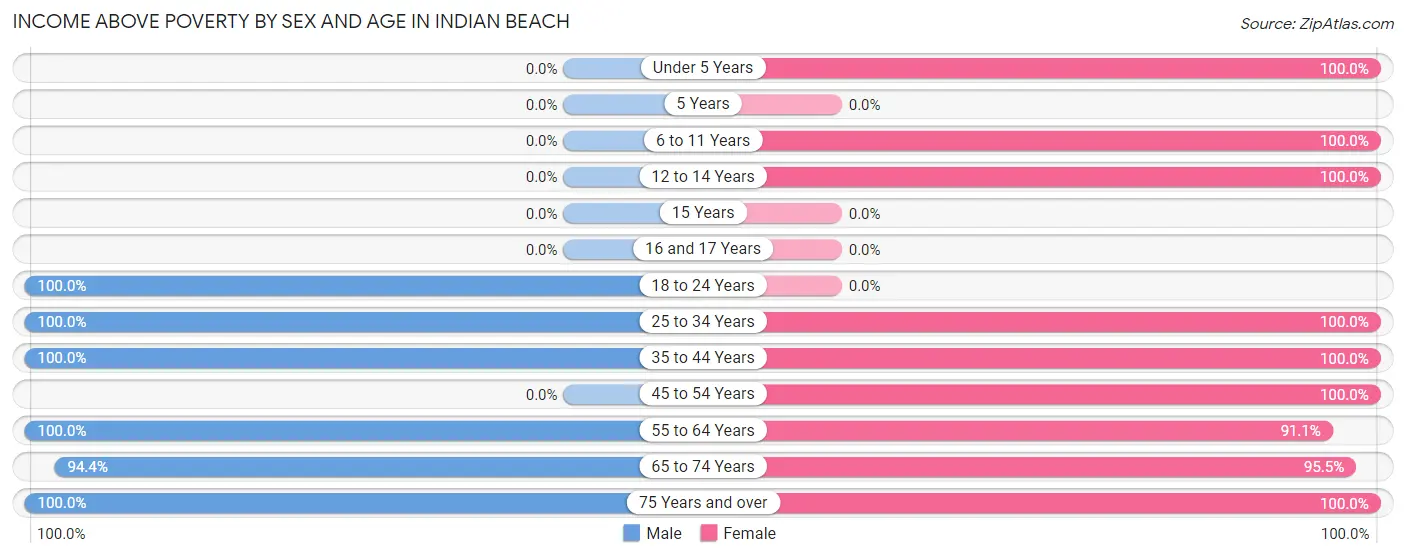
Income Above Poverty by Sex and Age in Indian Beach
According to the poverty statistics in Indian Beach, males aged 18 to 24 years and females aged under 5 years are the age groups that are most secure financially, with 100.0% of males and 100.0% of females in these age groups living above the poverty line.
| Age Bracket | Male | Female |
| Under 5 Years | 0 (0.0%) | 8 (100.0%) |
| 5 Years | 0 (0.0%) | 0 (0.0%) |
| 6 to 11 Years | 0 (0.0%) | 14 (100.0%) |
| 12 to 14 Years | 0 (0.0%) | 2 (100.0%) |
| 15 Years | 0 (0.0%) | 0 (0.0%) |
| 16 and 17 Years | 0 (0.0%) | 0 (0.0%) |
| 18 to 24 Years | 2 (100.0%) | 0 (0.0%) |
| 25 to 34 Years | 15 (100.0%) | 2 (100.0%) |
| 35 to 44 Years | 16 (100.0%) | 6 (100.0%) |
| 45 to 54 Years | 0 (0.0%) | 1 (100.0%) |
| 55 to 64 Years | 23 (100.0%) | 41 (91.1%) |
| 65 to 74 Years | 34 (94.4%) | 21 (95.5%) |
| 75 Years and over | 10 (100.0%) | 14 (100.0%) |
| Total | 100 (98.0%) | 109 (95.6%) |
Income Below Poverty Among Married-Couple Families in Indian Beach
The poverty statistics for married-couple families in Indian Beach show that 2.8% or 2 of the total 71 families live below the poverty line. Families with no children have the highest poverty rate of 3.3%, comprising of 2 families. On the other hand, families with 1 or 2 children have the lowest poverty rate of 0.0%, which includes 0 families.
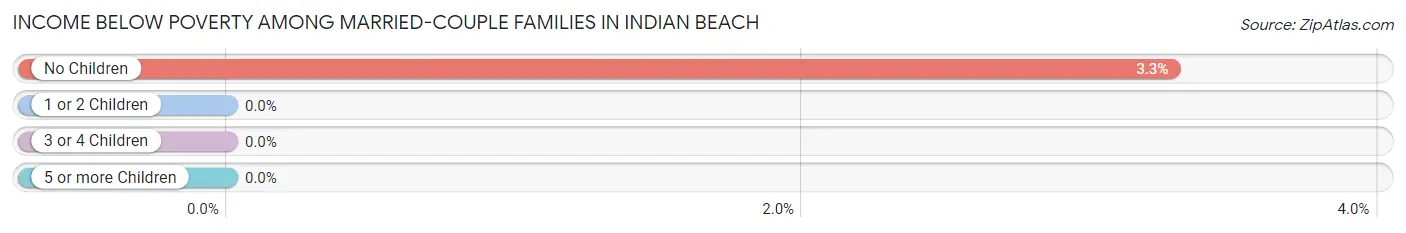
| Children | Above Poverty | Below Poverty |
| No Children | 59 (96.7%) | 2 (3.3%) |
| 1 or 2 Children | 1 (100.0%) | 0 (0.0%) |
| 3 or 4 Children | 9 (100.0%) | 0 (0.0%) |
| 5 or more Children | 0 (0.0%) | 0 (0.0%) |
| Total | 69 (97.2%) | 2 (2.8%) |
Income Below Poverty Among Single-Parent Households in Indian Beach
| Children | Single Father | Single Mother |
| No Children | 0 (0.0%) | 0 (0.0%) |
| 1 or 2 Children | 0 (0.0%) | 0 (0.0%) |
| 3 or 4 Children | 0 (0.0%) | 0 (0.0%) |
| 5 or more Children | 0 (0.0%) | 0 (0.0%) |
| Total | 0 (0.0%) | 0 (0.0%) |
Income Below Poverty Among Married-Couple vs Single-Parent Households in Indian Beach
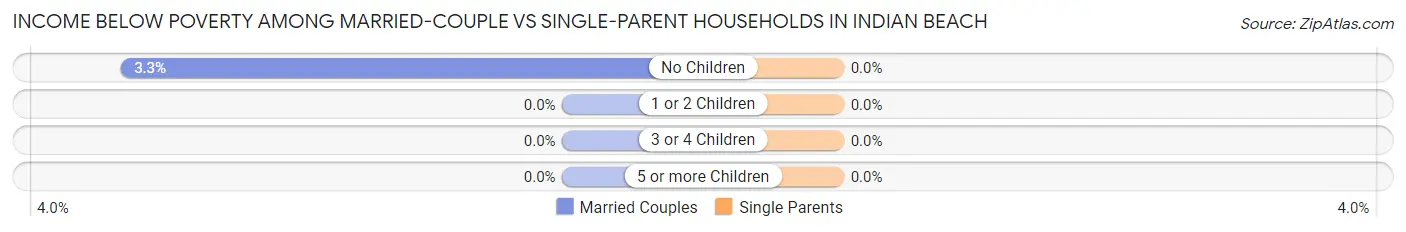
| Children | Married-Couple Families | Single-Parent Households |
| No Children | 2 (3.3%) | 0 (0.0%) |
| 1 or 2 Children | 0 (0.0%) | 0 (0.0%) |
| 3 or 4 Children | 0 (0.0%) | 0 (0.0%) |
| 5 or more Children | 0 (0.0%) | 0 (0.0%) |
| Total | 2 (2.8%) | 0 (0.0%) |
Race in Indian Beach
The most populous races in Indian Beach are White / Caucasian (221 | 98.2%), Black / African American (3 | 1.3%), and Hispanic or Latino (1 | 0.4%).
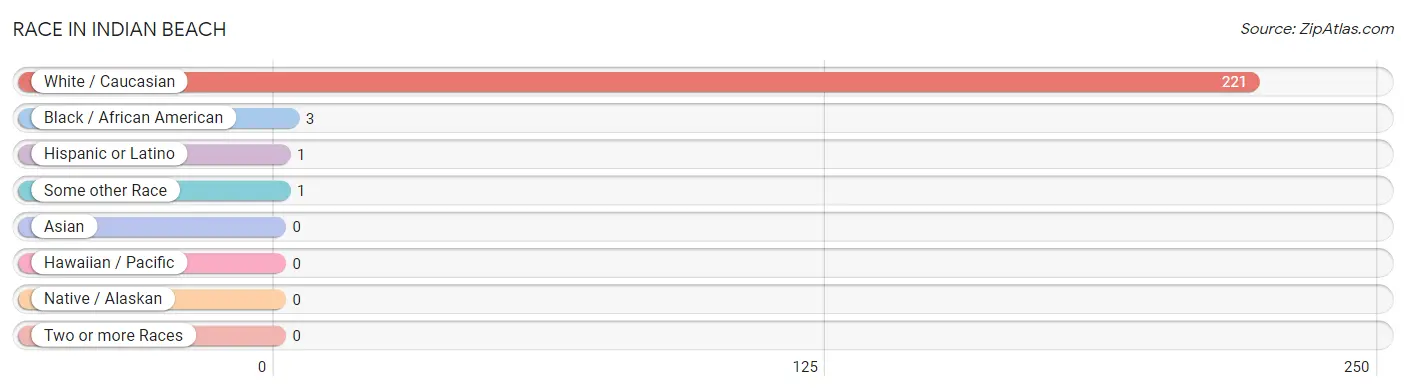
| Race | # Population | % Population |
| Asian | 0 | 0.0% |
| Black / African American | 3 | 1.3% |
| Hawaiian / Pacific | 0 | 0.0% |
| Hispanic or Latino | 1 | 0.4% |
| Native / Alaskan | 0 | 0.0% |
| White / Caucasian | 221 | 98.2% |
| Two or more Races | 0 | 0.0% |
| Some other Race | 1 | 0.4% |
| Total | 225 | 100.0% |
Ancestry in Indian Beach
The most populous ancestries reported in Indian Beach are English (45 | 20.0%), Scotch-Irish (19 | 8.4%), Hungarian (17 | 7.6%), German (16 | 7.1%), and Irish (15 | 6.7%), together accounting for 49.8% of all Indian Beach residents.
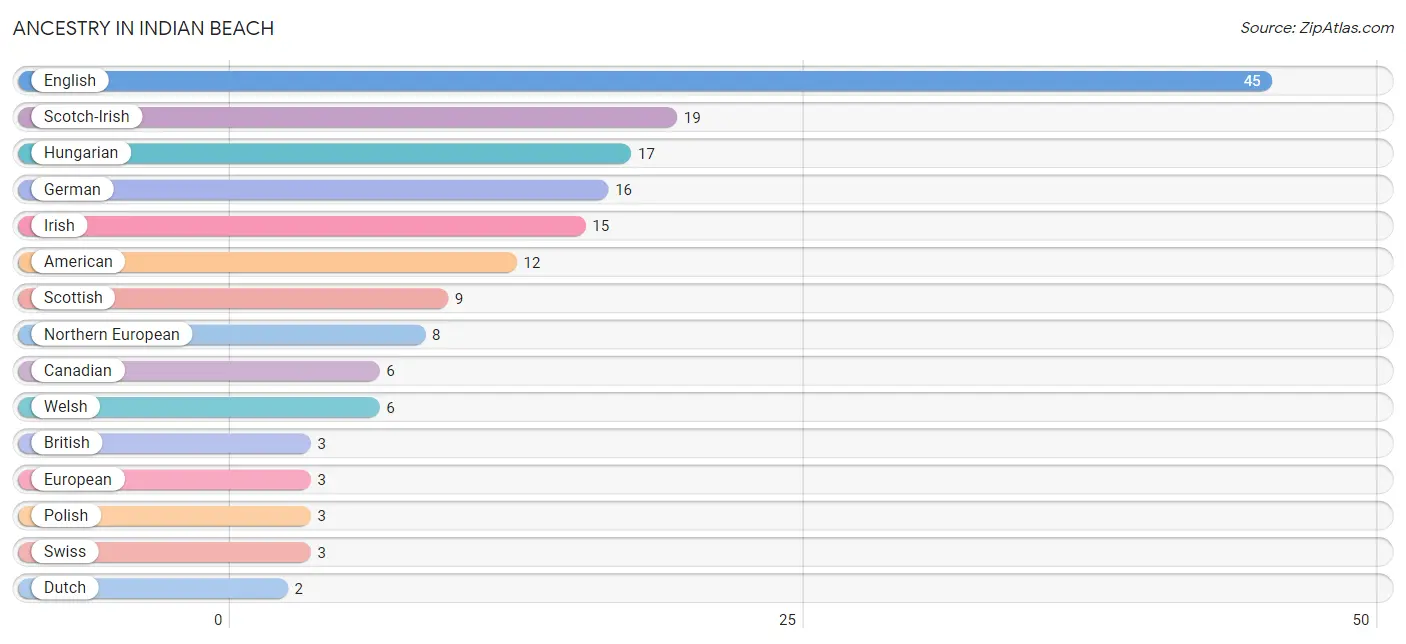
| Ancestry | # Population | % Population |
| American | 12 | 5.3% |
| British | 3 | 1.3% |
| Canadian | 6 | 2.7% |
| Central American | 1 | 0.4% |
| Dutch | 2 | 0.9% |
| English | 45 | 20.0% |
| European | 3 | 1.3% |
| Finnish | 1 | 0.4% |
| French | 2 | 0.9% |
| French Canadian | 1 | 0.4% |
| German | 16 | 7.1% |
| Guatemalan | 1 | 0.4% |
| Hungarian | 17 | 7.6% |
| Irish | 15 | 6.7% |
| Italian | 1 | 0.4% |
| Lithuanian | 1 | 0.4% |
| Northern European | 8 | 3.6% |
| Polish | 3 | 1.3% |
| Portuguese | 2 | 0.9% |
| Russian | 1 | 0.4% |
| Scandinavian | 1 | 0.4% |
| Scotch-Irish | 19 | 8.4% |
| Scottish | 9 | 4.0% |
| Slovak | 1 | 0.4% |
| Swedish | 1 | 0.4% |
| Swiss | 3 | 1.3% |
| Welsh | 6 | 2.7% | View All 27 Rows |
Immigrants in Indian Beach
The most numerous immigrant groups reported in Indian Beach came from Canada (4 | 1.8%), Australia (1 | 0.4%), Central America (1 | 0.4%), Eastern Europe (1 | 0.4%), and Europe (1 | 0.4%), together accounting for 3.5% of all Indian Beach residents.
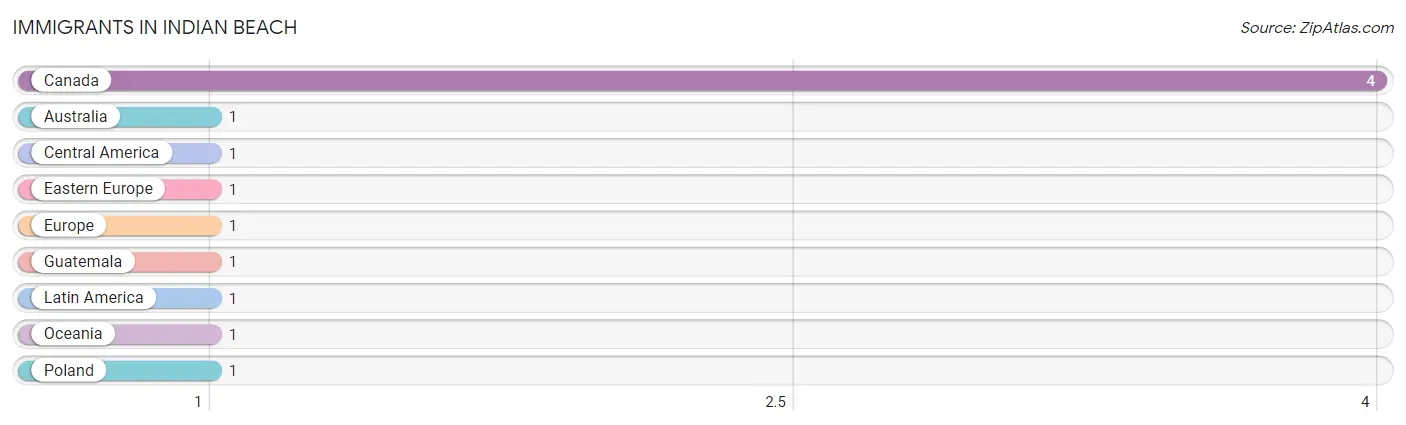
| Immigration Origin | # Population | % Population |
| Australia | 1 | 0.4% |
| Canada | 4 | 1.8% |
| Central America | 1 | 0.4% |
| Eastern Europe | 1 | 0.4% |
| Europe | 1 | 0.4% |
| Guatemala | 1 | 0.4% |
| Latin America | 1 | 0.4% |
| Oceania | 1 | 0.4% |
| Poland | 1 | 0.4% | View All 9 Rows |
Sex and Age in Indian Beach
Sex and Age in Indian Beach
The most populous age groups in Indian Beach are 70 to 74 Years (21 | 19.8%) for men and 60 to 64 Years (27 | 22.7%) for women.
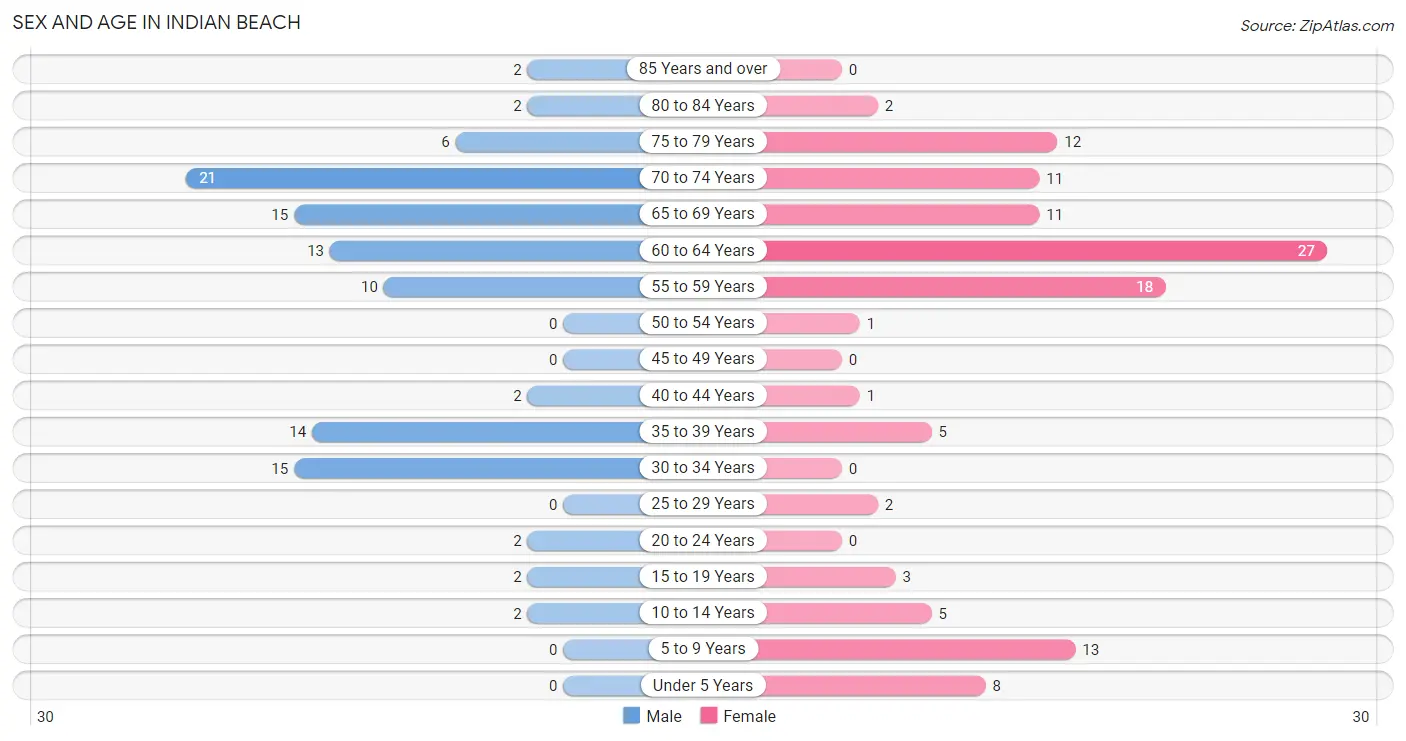
| Age Bracket | Male | Female |
| Under 5 Years | 0 (0.0%) | 8 (6.7%) |
| 5 to 9 Years | 0 (0.0%) | 13 (10.9%) |
| 10 to 14 Years | 2 (1.9%) | 5 (4.2%) |
| 15 to 19 Years | 2 (1.9%) | 3 (2.5%) |
| 20 to 24 Years | 2 (1.9%) | 0 (0.0%) |
| 25 to 29 Years | 0 (0.0%) | 2 (1.7%) |
| 30 to 34 Years | 15 (14.1%) | 0 (0.0%) |
| 35 to 39 Years | 14 (13.2%) | 5 (4.2%) |
| 40 to 44 Years | 2 (1.9%) | 1 (0.8%) |
| 45 to 49 Years | 0 (0.0%) | 0 (0.0%) |
| 50 to 54 Years | 0 (0.0%) | 1 (0.8%) |
| 55 to 59 Years | 10 (9.4%) | 18 (15.1%) |
| 60 to 64 Years | 13 (12.3%) | 27 (22.7%) |
| 65 to 69 Years | 15 (14.1%) | 11 (9.2%) |
| 70 to 74 Years | 21 (19.8%) | 11 (9.2%) |
| 75 to 79 Years | 6 (5.7%) | 12 (10.1%) |
| 80 to 84 Years | 2 (1.9%) | 2 (1.7%) |
| 85 Years and over | 2 (1.9%) | 0 (0.0%) |
| Total | 106 (100.0%) | 119 (100.0%) |
Families and Households in Indian Beach
Median Family Size in Indian Beach
The median family size in Indian Beach is 2.49 persons per family, with single female/mother families (4 | 5.2%) accounting for the largest median family size of 3.5 persons per family. On the other hand, single male/father families (2 | 2.6%) represent the smallest median family size with 2.00 persons per family.
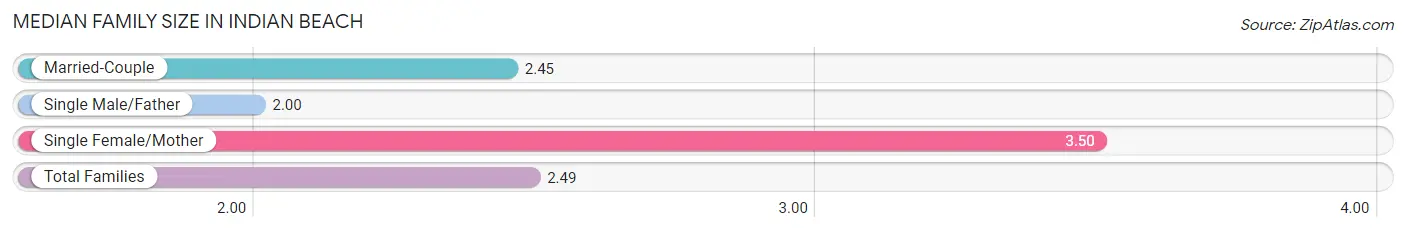
| Family Type | # Families | Family Size |
| Married-Couple | 71 (92.2%) | 2.45 |
| Single Male/Father | 2 (2.6%) | 2.00 |
| Single Female/Mother | 4 (5.2%) | 3.50 |
| Total Families | 77 (100.0%) | 2.49 |
Median Household Size in Indian Beach
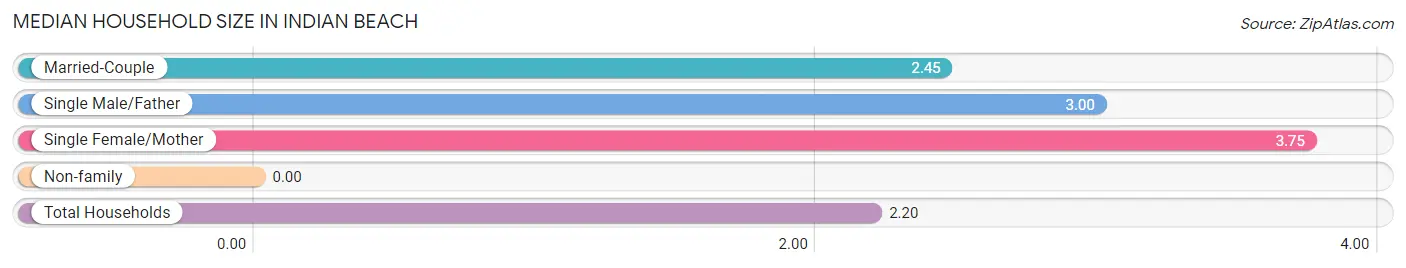
| Household Type | # Households | Household Size |
| Married-Couple | 71 (72.5%) | 2.45 |
| Single Male/Father | 2 (2.0%) | 3.00 |
| Single Female/Mother | 4 (4.1%) | 3.75 |
| Non-family | 21 (21.4%) | - |
| Total Households | 98 (100.0%) | 2.20 |
Household Size by Marriage Status in Indian Beach
Out of a total of 98 households in Indian Beach, 77 (78.6%) are family households, while 21 (21.4%) are nonfamily households. The most numerous type of family households are 2-person households, comprising 54, and the most common type of nonfamily households are 1-person households, comprising 21.
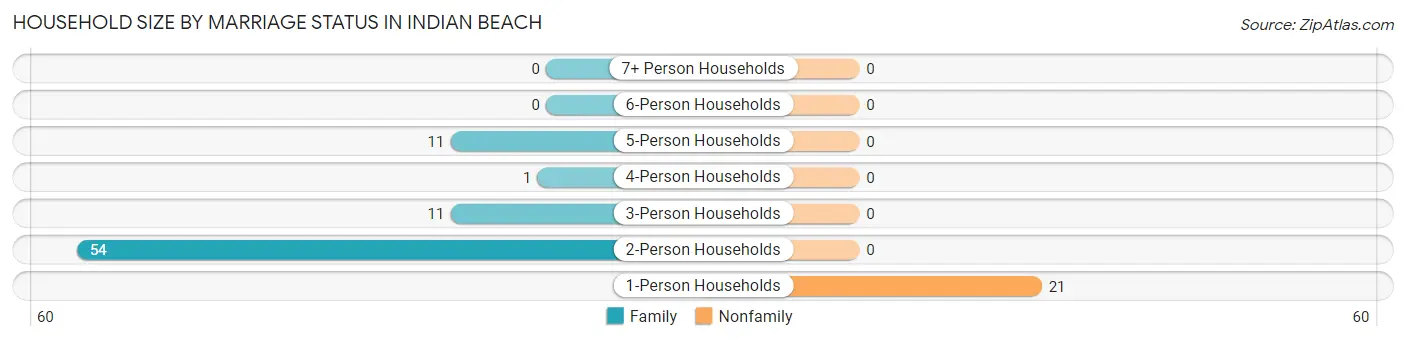
| Household Size | Family Households | Nonfamily Households |
| 1-Person Households | - | 21 (21.4%) |
| 2-Person Households | 54 (55.1%) | 0 (0.0%) |
| 3-Person Households | 11 (11.2%) | 0 (0.0%) |
| 4-Person Households | 1 (1.0%) | 0 (0.0%) |
| 5-Person Households | 11 (11.2%) | 0 (0.0%) |
| 6-Person Households | 0 (0.0%) | 0 (0.0%) |
| 7+ Person Households | 0 (0.0%) | 0 (0.0%) |
| Total | 77 (78.6%) | 21 (21.4%) |
Female Fertility in Indian Beach
Fertility by Age in Indian Beach
Average fertility rate in Indian Beach is 182.0 births per 1,000 women. Women in the age bracket of 20 to 34 years have the highest fertility rate with 1,000.0 births per 1,000 women. Women in the age bracket of 20 to 34 years acount for 100.0% of all women with births.
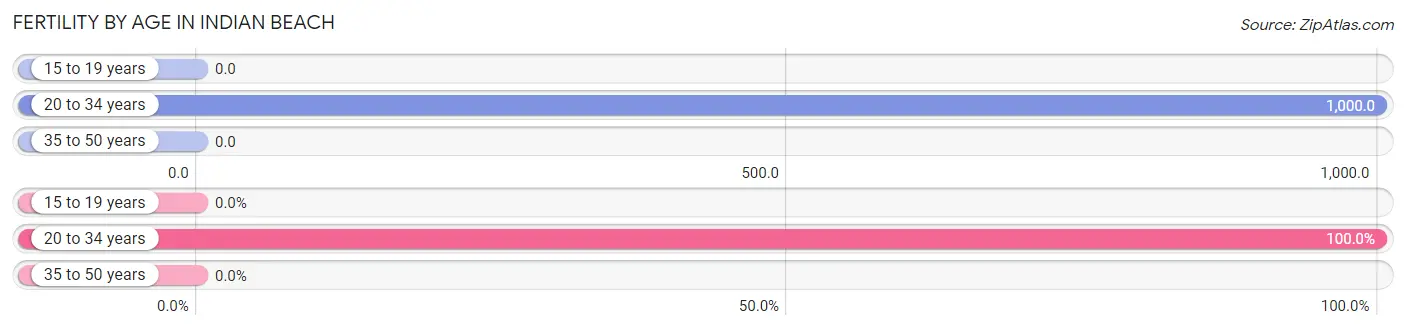
| Age Bracket | Women with Births | Births / 1,000 Women |
| 15 to 19 years | 0 (0.0%) | 0.0 |
| 20 to 34 years | 2 (100.0%) | 1,000.0 |
| 35 to 50 years | 0 (0.0%) | 0.0 |
| Total | 2 (100.0%) | 182.0 |
Fertility by Age by Marriage Status in Indian Beach
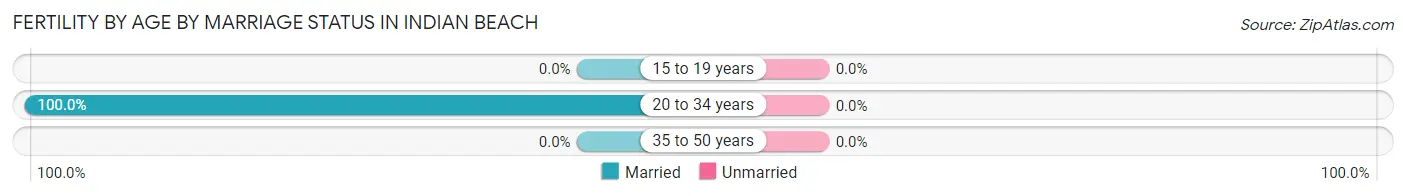
| Age Bracket | Married | Unmarried |
| 15 to 19 years | 0 (0.0%) | 0 (0.0%) |
| 20 to 34 years | 2 (100.0%) | 0 (0.0%) |
| 35 to 50 years | 0 (0.0%) | 0 (0.0%) |
| Total | 2 (100.0%) | 0 (0.0%) |
Fertility by Education in Indian Beach
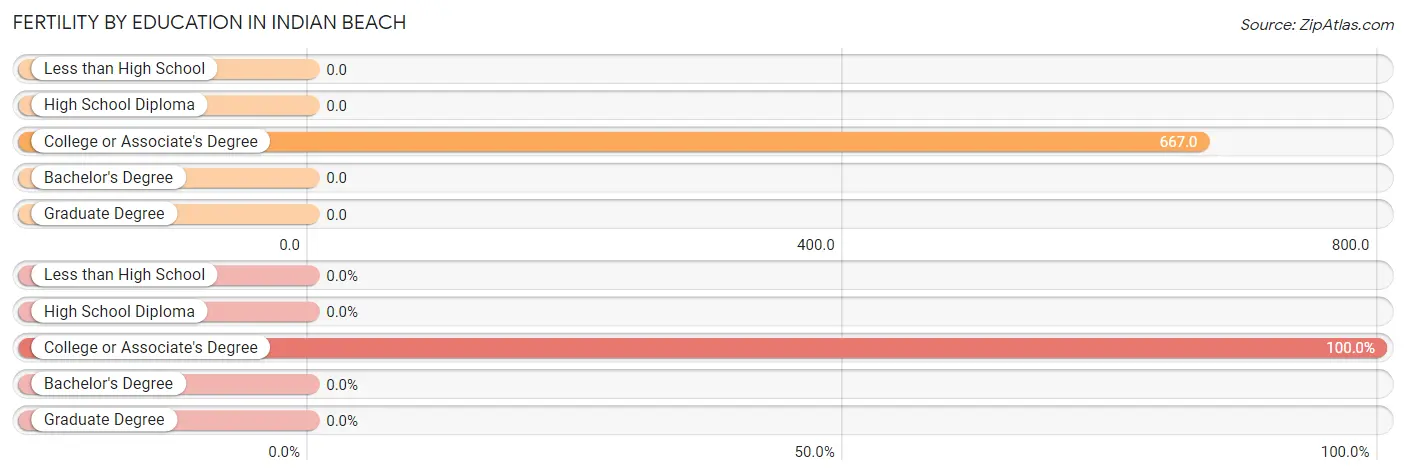
| Educational Attainment | Women with Births | Births / 1,000 Women |
| Less than High School | 0 (0.0%) | 0.0 |
| High School Diploma | 0 (0.0%) | 0.0 |
| College or Associate's Degree | 2 (100.0%) | 667.0 |
| Bachelor's Degree | 0 (0.0%) | 0.0 |
| Graduate Degree | 0 (0.0%) | 0.0 |
| Total | 2 (100.0%) | 182.0 |
Fertility by Education by Marriage Status in Indian Beach
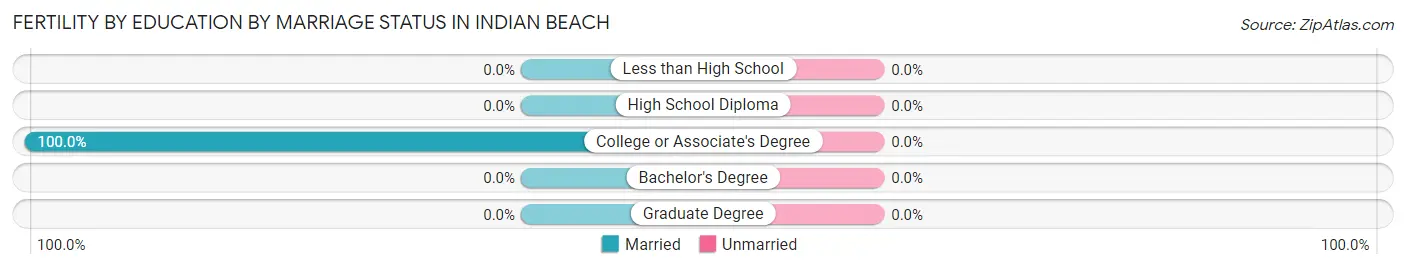
| Educational Attainment | Married | Unmarried |
| Less than High School | 0 (0.0%) | 0 (0.0%) |
| High School Diploma | 0 (0.0%) | 0 (0.0%) |
| College or Associate's Degree | 2 (100.0%) | 0 (0.0%) |
| Bachelor's Degree | 0 (0.0%) | 0 (0.0%) |
| Graduate Degree | 0 (0.0%) | 0 (0.0%) |
| Total | 2 (100.0%) | 0 (0.0%) |
Employment Characteristics in Indian Beach
Employment by Class of Employer in Indian Beach
Among the 70 employed individuals in Indian Beach, private company employees (30 | 42.9%), self-employed (not incorporated) (18 | 25.7%), and self-employed (incorporated) (11 | 15.7%) make up the most common classes of employment.
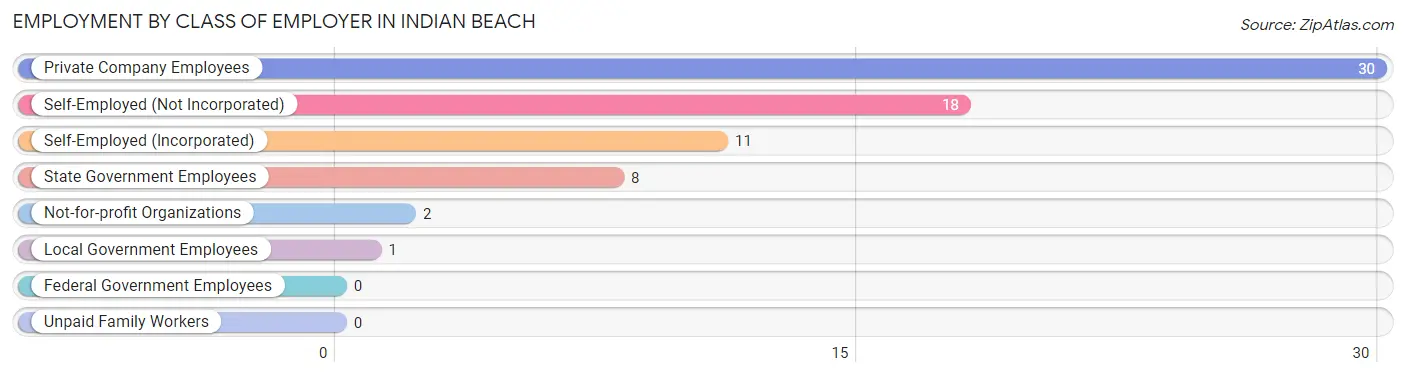
| Employer Class | # Employees | % Employees |
| Private Company Employees | 30 | 42.9% |
| Self-Employed (Incorporated) | 11 | 15.7% |
| Self-Employed (Not Incorporated) | 18 | 25.7% |
| Not-for-profit Organizations | 2 | 2.9% |
| Local Government Employees | 1 | 1.4% |
| State Government Employees | 8 | 11.4% |
| Federal Government Employees | 0 | 0.0% |
| Unpaid Family Workers | 0 | 0.0% |
| Total | 70 | 100.0% |
Employment Status by Age in Indian Beach
According to the labor force statistics for Indian Beach, out of the total population over 16 years of age (195), 37.9% or 74 individuals are in the labor force, with 1.4% or 1 of them unemployed. The age group with the highest labor force participation rate is 25 to 29 years, with 100.0% or 2 individuals in the labor force. Within the labor force, the 55 to 59 years age range has the highest percentage of unemployed individuals, with 5.9% or 1 of them being unemployed.
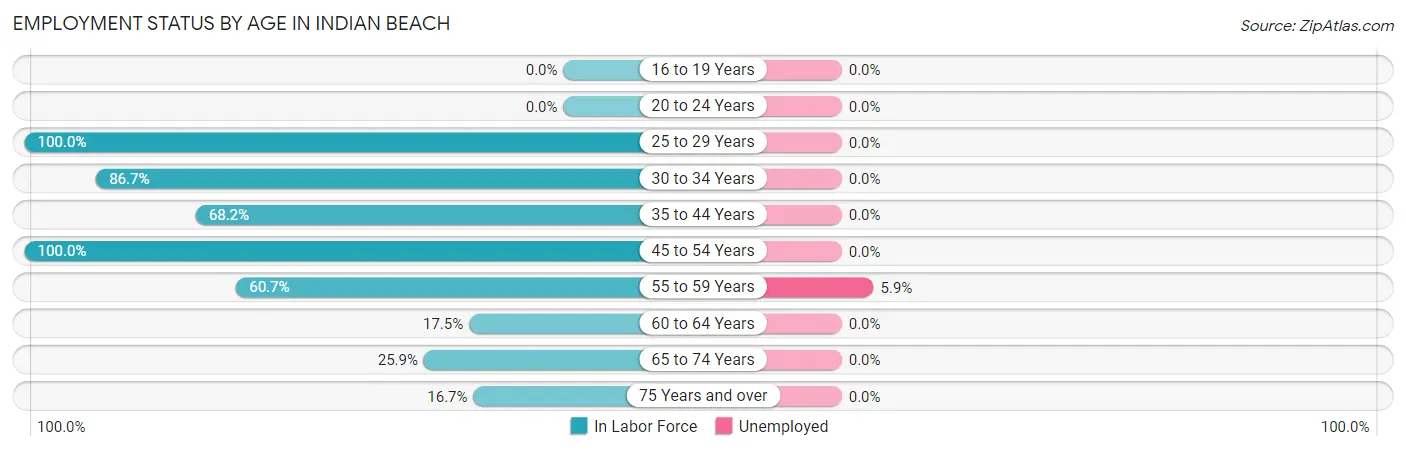
| Age Bracket | In Labor Force | Unemployed |
| 16 to 19 Years | 0 (0.0%) | 0 (0.0%) |
| 20 to 24 Years | 0 (0.0%) | 0 (0.0%) |
| 25 to 29 Years | 2 (100.0%) | 0 (0.0%) |
| 30 to 34 Years | 13 (86.7%) | 0 (0.0%) |
| 35 to 44 Years | 15 (68.2%) | 0 (0.0%) |
| 45 to 54 Years | 1 (100.0%) | 0 (0.0%) |
| 55 to 59 Years | 17 (60.7%) | 1 (5.9%) |
| 60 to 64 Years | 7 (17.5%) | 0 (0.0%) |
| 65 to 74 Years | 15 (25.9%) | 0 (0.0%) |
| 75 Years and over | 4 (16.7%) | 0 (0.0%) |
| Total | 74 (37.9%) | 1 (1.4%) |
Employment Status by Educational Attainment in Indian Beach
According to labor force statistics for Indian Beach, 50.9% of individuals (55) out of the total population between 25 and 64 years of age (108) are in the labor force, with 1.8% or 1 of them being unemployed. The group with the highest labor force participation rate are those with the educational attainment of college / associate degree, with 64.7% or 22 individuals in the labor force. Within the labor force, individuals with bachelor's degree or higher education have the highest percentage of unemployment, with 3.3% or 1 of them being unemployed.
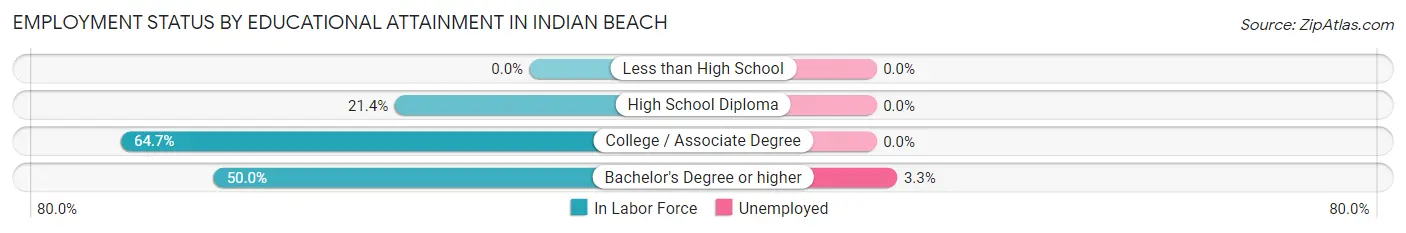
| Educational Attainment | In Labor Force | Unemployed |
| Less than High School | 0 (0.0%) | 0 (0.0%) |
| High School Diploma | 3 (21.4%) | 0 (0.0%) |
| College / Associate Degree | 22 (64.7%) | 0 (0.0%) |
| Bachelor's Degree or higher | 30 (50.0%) | 2 (3.3%) |
| Total | 55 (50.9%) | 2 (1.8%) |
Employment Occupations by Sex in Indian Beach
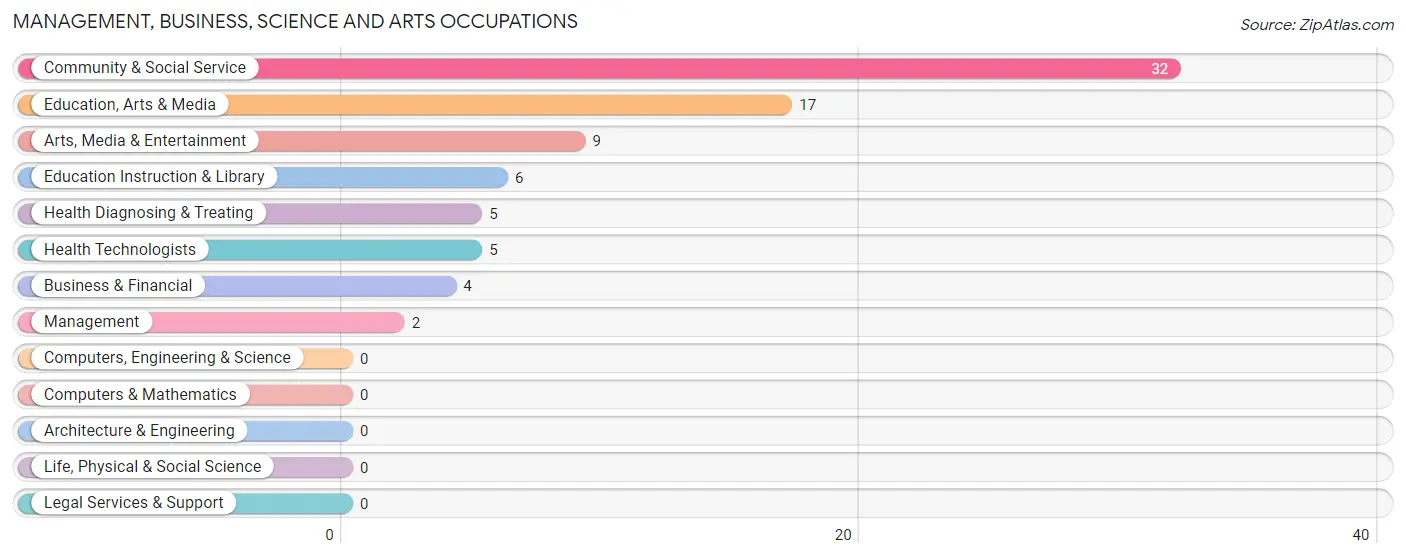
Management, Business, Science and Arts Occupations
The most common Management, Business, Science and Arts occupations in Indian Beach are Community & Social Service (32 | 43.8%), Education, Arts & Media (17 | 23.3%), Arts, Media & Entertainment (9 | 12.3%), Education Instruction & Library (6 | 8.2%), and Health Diagnosing & Treating (5 | 6.9%).
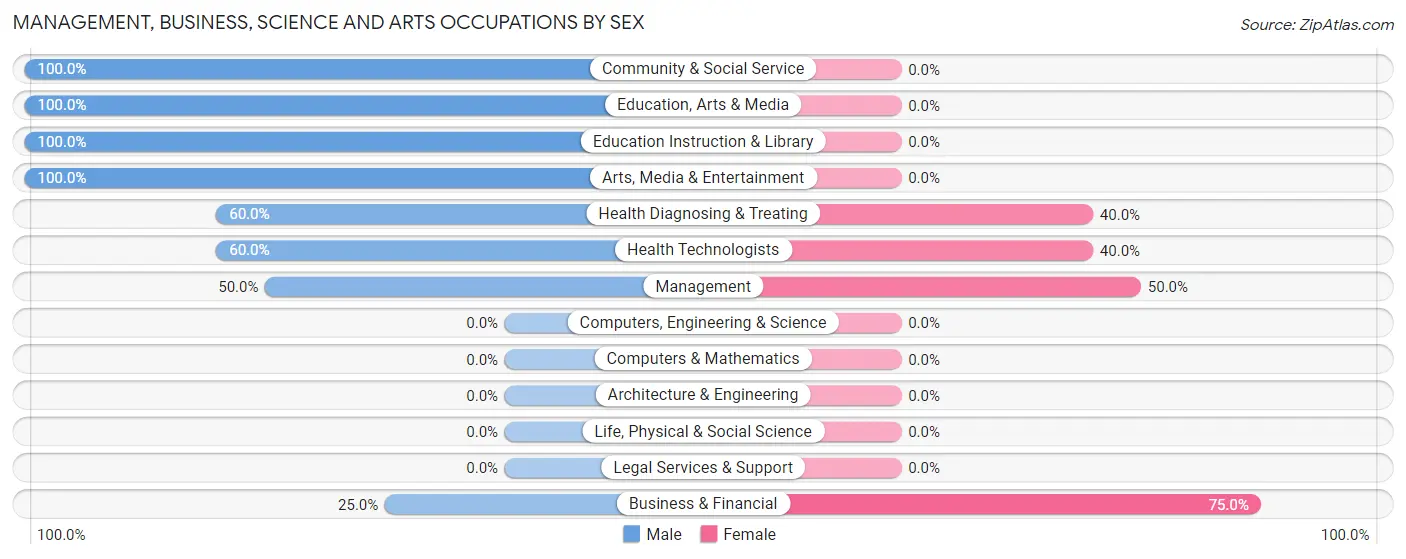
Management, Business, Science and Arts Occupations by Sex
Within the Management, Business, Science and Arts occupations in Indian Beach, the most male-oriented occupations are Community & Social Service (100.0%), Education, Arts & Media (100.0%), and Education Instruction & Library (100.0%), while the most female-oriented occupations are Business & Financial (75.0%), Management (50.0%), and Health Diagnosing & Treating (40.0%).
| Occupation | Male | Female |
| Management | 1 (50.0%) | 1 (50.0%) |
| Business & Financial | 1 (25.0%) | 3 (75.0%) |
| Computers, Engineering & Science | 0 (0.0%) | 0 (0.0%) |
| Computers & Mathematics | 0 (0.0%) | 0 (0.0%) |
| Architecture & Engineering | 0 (0.0%) | 0 (0.0%) |
| Life, Physical & Social Science | 0 (0.0%) | 0 (0.0%) |
| Community & Social Service | 32 (100.0%) | 0 (0.0%) |
| Education, Arts & Media | 17 (100.0%) | 0 (0.0%) |
| Legal Services & Support | 0 (0.0%) | 0 (0.0%) |
| Education Instruction & Library | 6 (100.0%) | 0 (0.0%) |
| Arts, Media & Entertainment | 9 (100.0%) | 0 (0.0%) |
| Health Diagnosing & Treating | 3 (60.0%) | 2 (40.0%) |
| Health Technologists | 3 (60.0%) | 2 (40.0%) |
| Total (Category) | 37 (86.1%) | 6 (14.0%) |
| Total (Overall) | 56 (76.7%) | 17 (23.3%) |
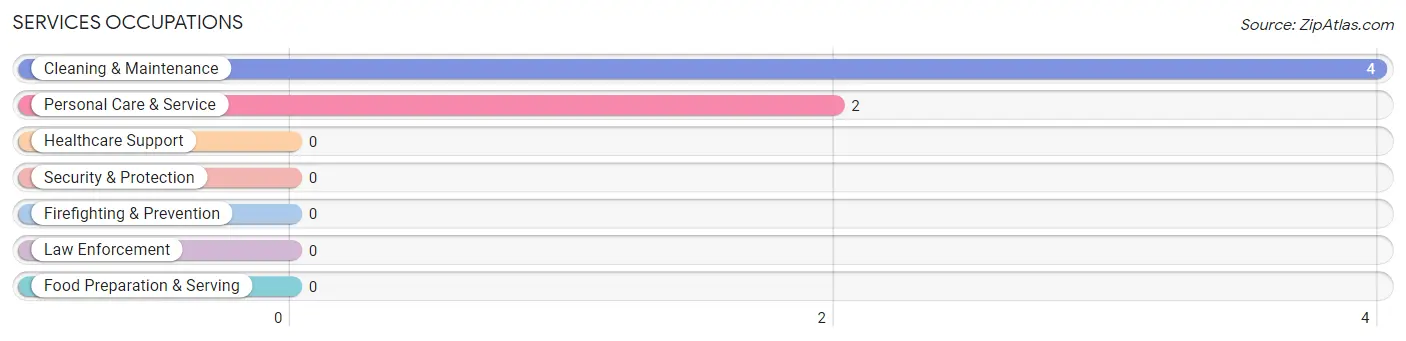
Services Occupations
The most common Services occupations in Indian Beach are Cleaning & Maintenance (4 | 5.5%), and Personal Care & Service (2 | 2.7%).
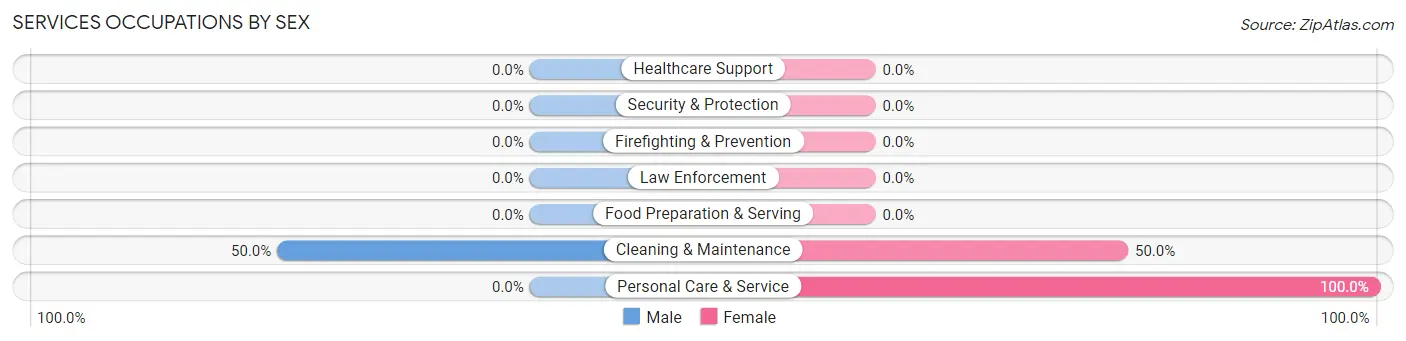
Services Occupations by Sex
| Occupation | Male | Female |
| Healthcare Support | 0 (0.0%) | 0 (0.0%) |
| Security & Protection | 0 (0.0%) | 0 (0.0%) |
| Firefighting & Prevention | 0 (0.0%) | 0 (0.0%) |
| Law Enforcement | 0 (0.0%) | 0 (0.0%) |
| Food Preparation & Serving | 0 (0.0%) | 0 (0.0%) |
| Cleaning & Maintenance | 2 (50.0%) | 2 (50.0%) |
| Personal Care & Service | 0 (0.0%) | 2 (100.0%) |
| Total (Category) | 2 (33.3%) | 4 (66.7%) |
| Total (Overall) | 56 (76.7%) | 17 (23.3%) |
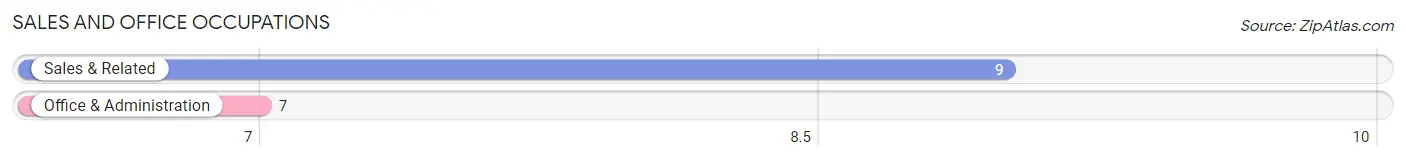
Sales and Office Occupations
The most common Sales and Office occupations in Indian Beach are Sales & Related (9 | 12.3%), and Office & Administration (7 | 9.6%).
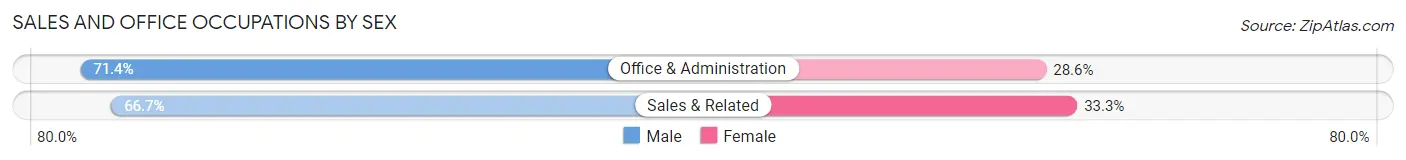
Sales and Office Occupations by Sex
| Occupation | Male | Female |
| Sales & Related | 6 (66.7%) | 3 (33.3%) |
| Office & Administration | 5 (71.4%) | 2 (28.6%) |
| Total (Category) | 11 (68.8%) | 5 (31.2%) |
| Total (Overall) | 56 (76.7%) | 17 (23.3%) |
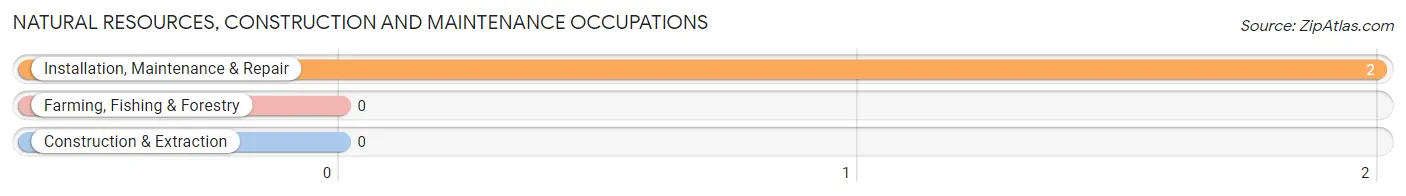
Natural Resources, Construction and Maintenance Occupations
The most common Natural Resources, Construction and Maintenance occupations in Indian Beach are , and Installation, Maintenance & Repair (2 | 2.7%).
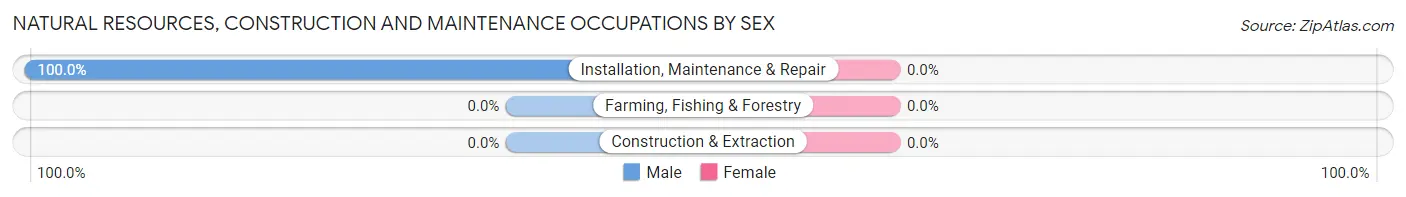
Natural Resources, Construction and Maintenance Occupations by Sex
| Occupation | Male | Female |
| Farming, Fishing & Forestry | 0 (0.0%) | 0 (0.0%) |
| Construction & Extraction | 0 (0.0%) | 0 (0.0%) |
| Installation, Maintenance & Repair | 2 (100.0%) | 0 (0.0%) |
| Total (Category) | 2 (100.0%) | 0 (0.0%) |
| Total (Overall) | 56 (76.7%) | 17 (23.3%) |
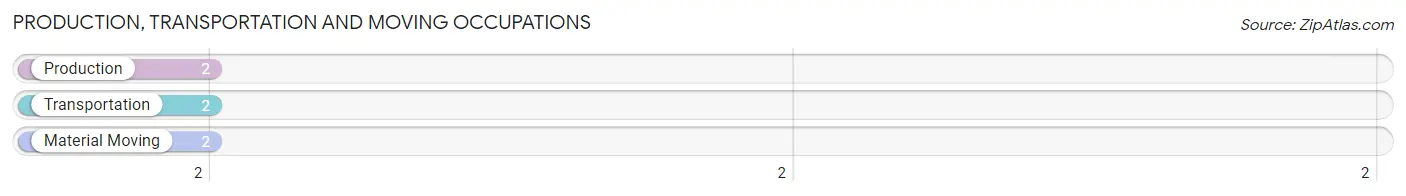
Production, Transportation and Moving Occupations
The most common Production, Transportation and Moving occupations in Indian Beach are Production (2 | 2.7%), Transportation (2 | 2.7%), and Material Moving (2 | 2.7%).
Production, Transportation and Moving Occupations by Sex
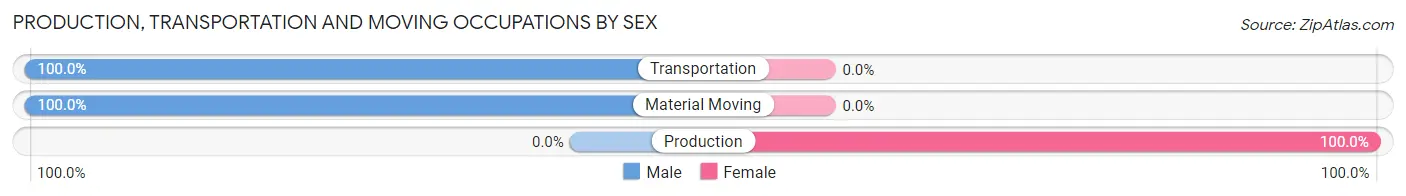
| Occupation | Male | Female |
| Production | 0 (0.0%) | 2 (100.0%) |
| Transportation | 2 (100.0%) | 0 (0.0%) |
| Material Moving | 2 (100.0%) | 0 (0.0%) |
| Total (Category) | 4 (66.7%) | 2 (33.3%) |
| Total (Overall) | 56 (76.7%) | 17 (23.3%) |
Employment Industries by Sex in Indian Beach
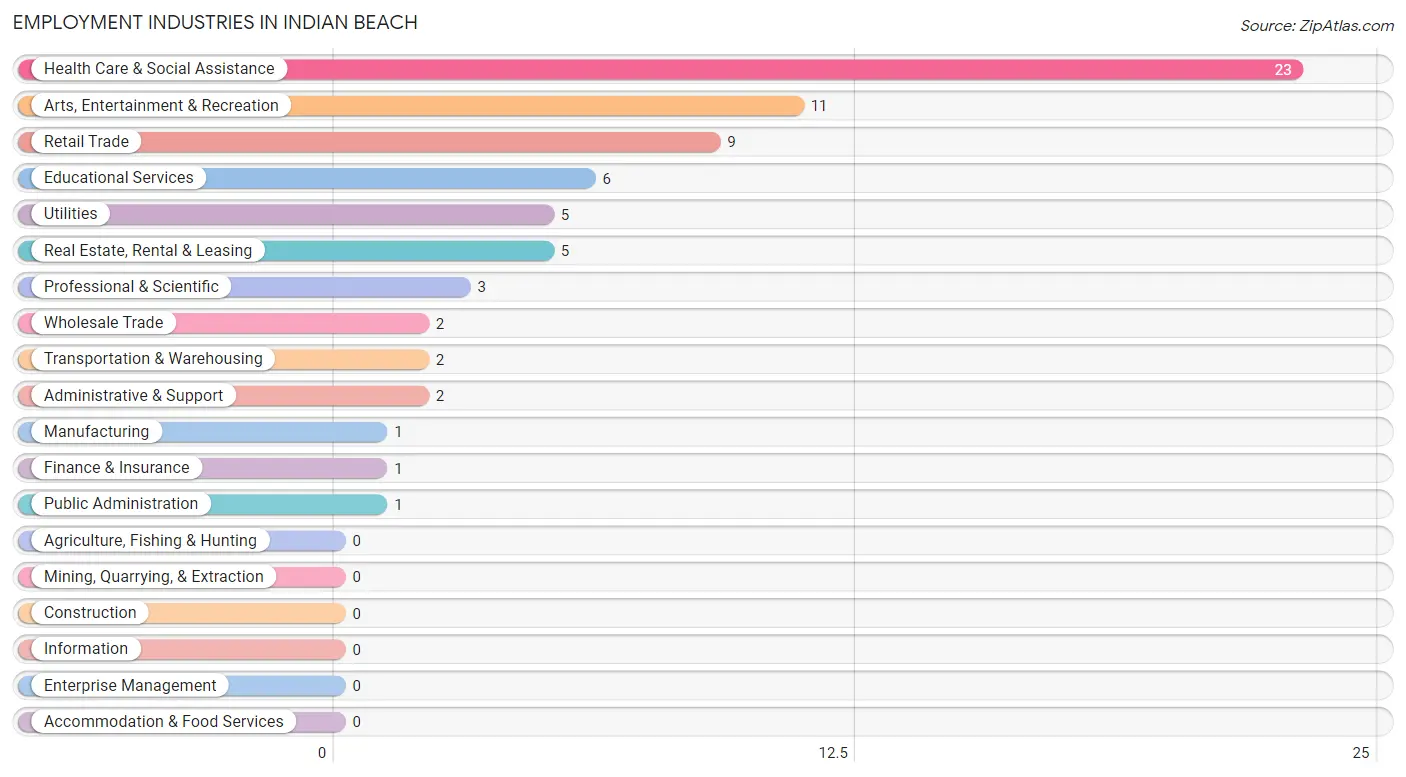
Employment Industries in Indian Beach
The major employment industries in Indian Beach include Health Care & Social Assistance (23 | 31.5%), Arts, Entertainment & Recreation (11 | 15.1%), Retail Trade (9 | 12.3%), Educational Services (6 | 8.2%), and Utilities (5 | 6.9%).
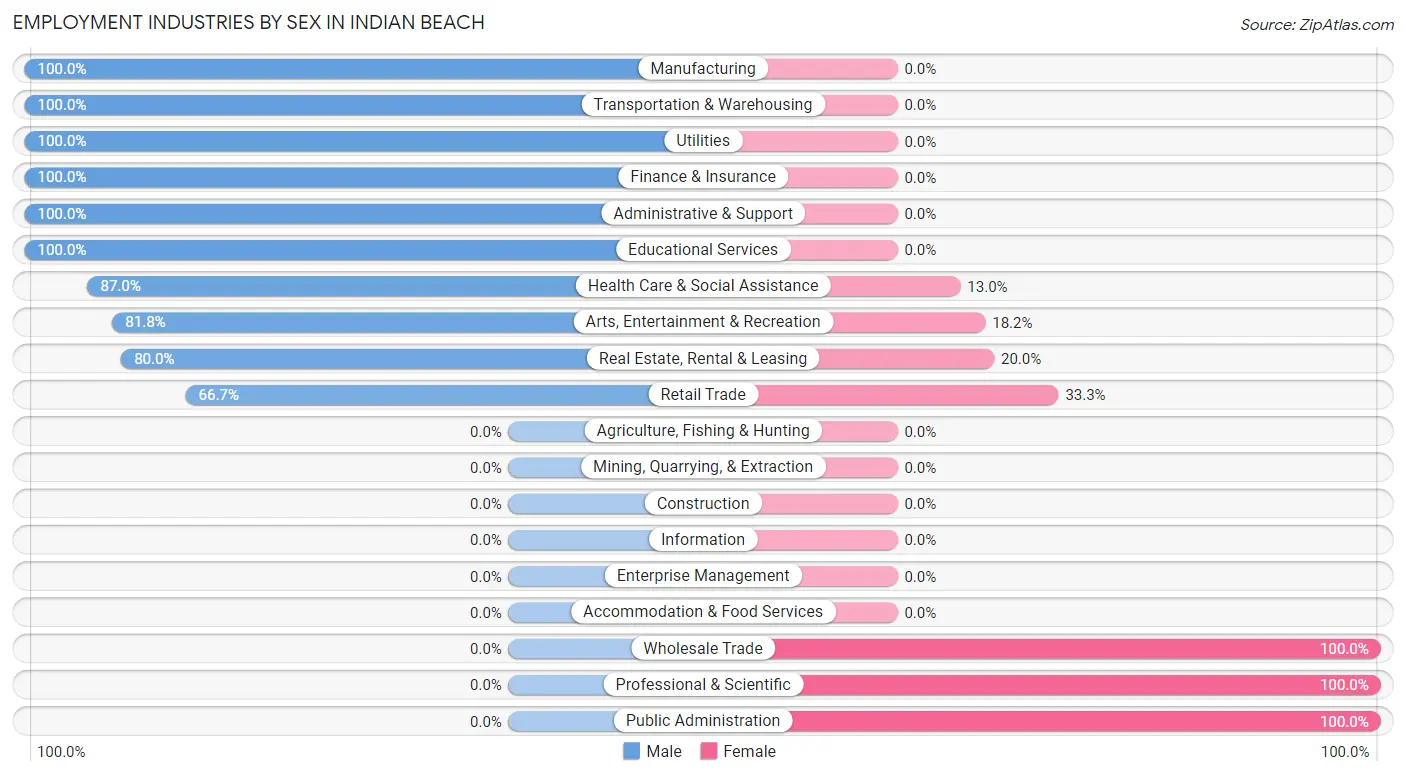
Employment Industries by Sex in Indian Beach
The Indian Beach industries that see more men than women are Manufacturing (100.0%), Transportation & Warehousing (100.0%), and Utilities (100.0%), whereas the industries that tend to have a higher number of women are Wholesale Trade (100.0%), Professional & Scientific (100.0%), and Public Administration (100.0%).
| Industry | Male | Female |
| Agriculture, Fishing & Hunting | 0 (0.0%) | 0 (0.0%) |
| Mining, Quarrying, & Extraction | 0 (0.0%) | 0 (0.0%) |
| Construction | 0 (0.0%) | 0 (0.0%) |
| Manufacturing | 1 (100.0%) | 0 (0.0%) |
| Wholesale Trade | 0 (0.0%) | 2 (100.0%) |
| Retail Trade | 6 (66.7%) | 3 (33.3%) |
| Transportation & Warehousing | 2 (100.0%) | 0 (0.0%) |
| Utilities | 5 (100.0%) | 0 (0.0%) |
| Information | 0 (0.0%) | 0 (0.0%) |
| Finance & Insurance | 1 (100.0%) | 0 (0.0%) |
| Real Estate, Rental & Leasing | 4 (80.0%) | 1 (20.0%) |
| Professional & Scientific | 0 (0.0%) | 3 (100.0%) |
| Enterprise Management | 0 (0.0%) | 0 (0.0%) |
| Administrative & Support | 2 (100.0%) | 0 (0.0%) |
| Educational Services | 6 (100.0%) | 0 (0.0%) |
| Health Care & Social Assistance | 20 (87.0%) | 3 (13.0%) |
| Arts, Entertainment & Recreation | 9 (81.8%) | 2 (18.2%) |
| Accommodation & Food Services | 0 (0.0%) | 0 (0.0%) |
| Public Administration | 0 (0.0%) | 1 (100.0%) |
| Total | 56 (76.7%) | 17 (23.3%) |
Education in Indian Beach
School Enrollment in Indian Beach
The most common levels of schooling among the 33 students in Indian Beach are elementary school (12 | 36.4%), middle school (7 | 21.2%), and nursery / preschool (6 | 18.2%).
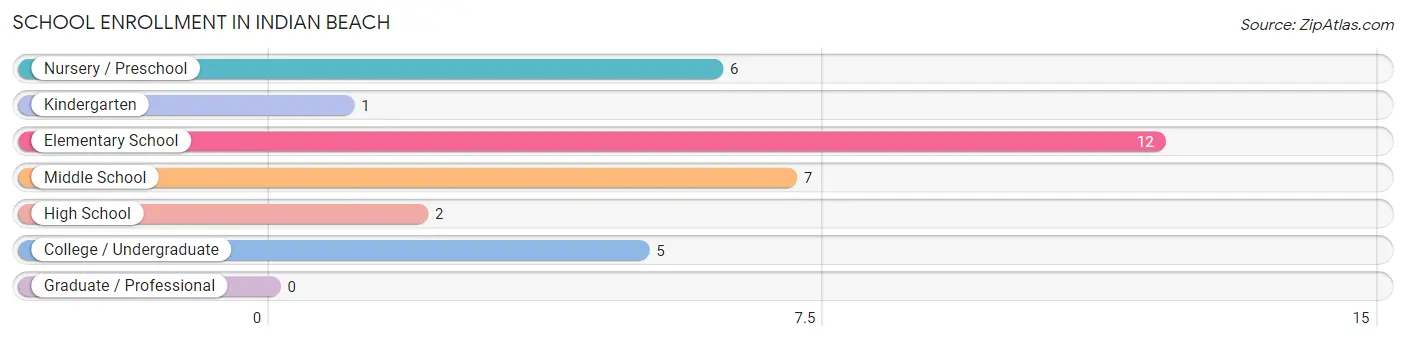
| School Level | # Students | % Students |
| Nursery / Preschool | 6 | 18.2% |
| Kindergarten | 1 | 3.0% |
| Elementary School | 12 | 36.4% |
| Middle School | 7 | 21.2% |
| High School | 2 | 6.1% |
| College / Undergraduate | 5 | 15.1% |
| Graduate / Professional | 0 | 0.0% |
| Total | 33 | 100.0% |
School Enrollment by Age by Funding Source in Indian Beach
Out of a total of 33 students who are enrolled in schools in Indian Beach, 21 (63.6%) attend a private institution, while the remaining 12 (36.4%) are enrolled in public schools. The age group of 3 to 4 year olds has the highest likelihood of being enrolled in private schools, with 6 (100.0% in the age bracket) enrolled. Conversely, the age group of 15 to 17 year olds has the lowest likelihood of being enrolled in a private school, with 2 (100.0% in the age bracket) attending a public institution.
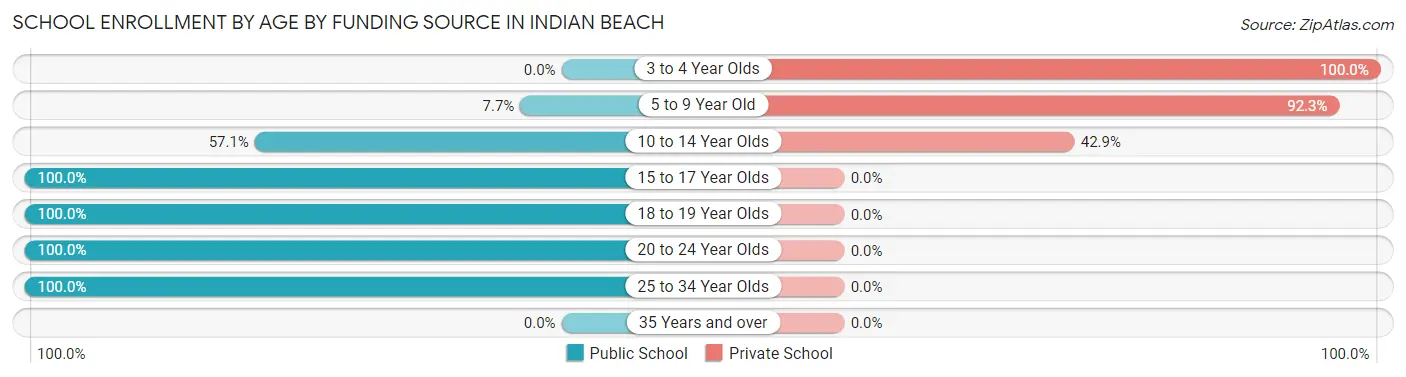
| Age Bracket | Public School | Private School |
| 3 to 4 Year Olds | 0 (0.0%) | 6 (100.0%) |
| 5 to 9 Year Old | 1 (7.7%) | 12 (92.3%) |
| 10 to 14 Year Olds | 4 (57.1%) | 3 (42.9%) |
| 15 to 17 Year Olds | 2 (100.0%) | 0 (0.0%) |
| 18 to 19 Year Olds | 1 (100.0%) | 0 (0.0%) |
| 20 to 24 Year Olds | 2 (100.0%) | 0 (0.0%) |
| 25 to 34 Year Olds | 2 (100.0%) | 0 (0.0%) |
| 35 Years and over | 0 (0.0%) | 0 (0.0%) |
| Total | 12 (36.4%) | 21 (63.6%) |
Educational Attainment by Field of Study in Indian Beach
Education (28 | 24.6%), business (25 | 21.9%), engineering (13 | 11.4%), social sciences (12 | 10.5%), and liberal arts & history (11 | 9.7%) are the most common fields of study among 114 individuals in Indian Beach who have obtained a bachelor's degree or higher.
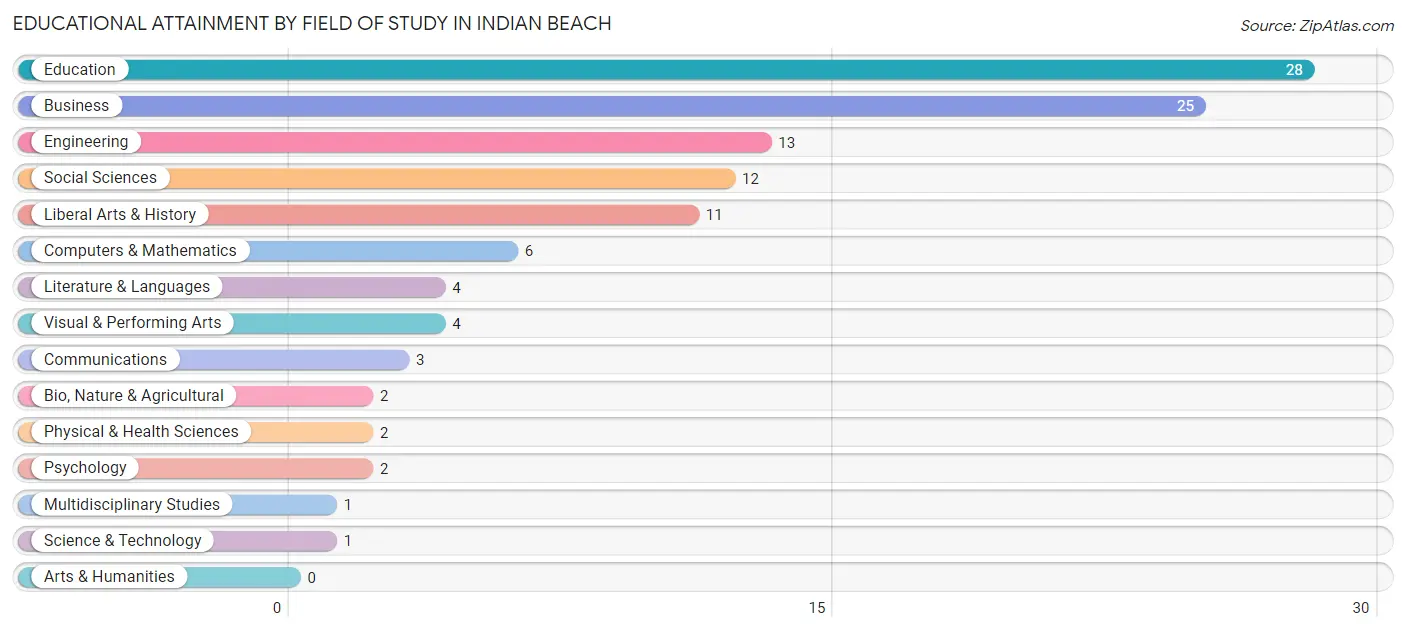
| Field of Study | # Graduates | % Graduates |
| Computers & Mathematics | 6 | 5.3% |
| Bio, Nature & Agricultural | 2 | 1.8% |
| Physical & Health Sciences | 2 | 1.8% |
| Psychology | 2 | 1.8% |
| Social Sciences | 12 | 10.5% |
| Engineering | 13 | 11.4% |
| Multidisciplinary Studies | 1 | 0.9% |
| Science & Technology | 1 | 0.9% |
| Business | 25 | 21.9% |
| Education | 28 | 24.6% |
| Literature & Languages | 4 | 3.5% |
| Liberal Arts & History | 11 | 9.7% |
| Visual & Performing Arts | 4 | 3.5% |
| Communications | 3 | 2.6% |
| Arts & Humanities | 0 | 0.0% |
| Total | 114 | 100.0% |
Transportation & Commute in Indian Beach
Vehicle Availability by Sex in Indian Beach
The most prevalent vehicle ownership categories in Indian Beach are males with 2 vehicles (23, accounting for 42.6%) and females with 2 vehicles (6, making up 143.8%).
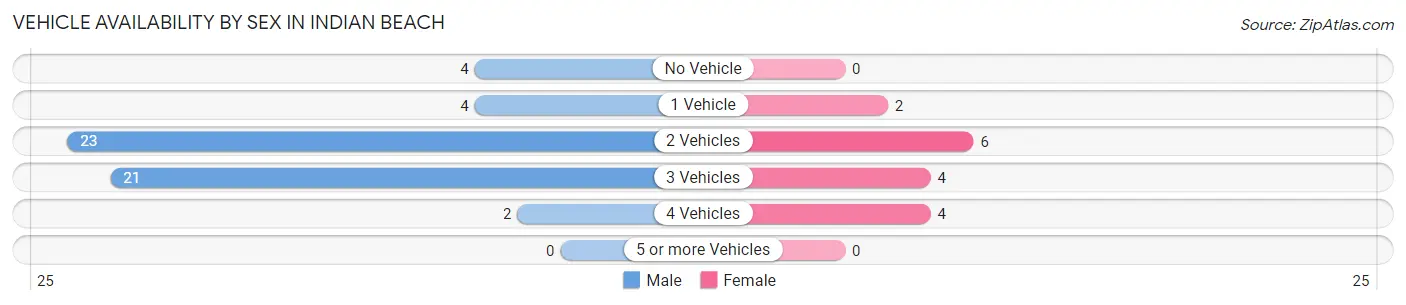
| Vehicles Available | Male | Female |
| No Vehicle | 4 (7.4%) | 0 (0.0%) |
| 1 Vehicle | 4 (7.4%) | 2 (12.5%) |
| 2 Vehicles | 23 (42.6%) | 6 (37.5%) |
| 3 Vehicles | 21 (38.9%) | 4 (25.0%) |
| 4 Vehicles | 2 (3.7%) | 4 (25.0%) |
| 5 or more Vehicles | 0 (0.0%) | 0 (0.0%) |
| Total | 54 (100.0%) | 16 (100.0%) |
Commute Time in Indian Beach
The most frequently occuring commute durations in Indian Beach are 15 to 19 minutes (7 commuters, 20.6%), 10 to 14 minutes (5 commuters, 14.7%), and 45 to 59 minutes (4 commuters, 11.8%).
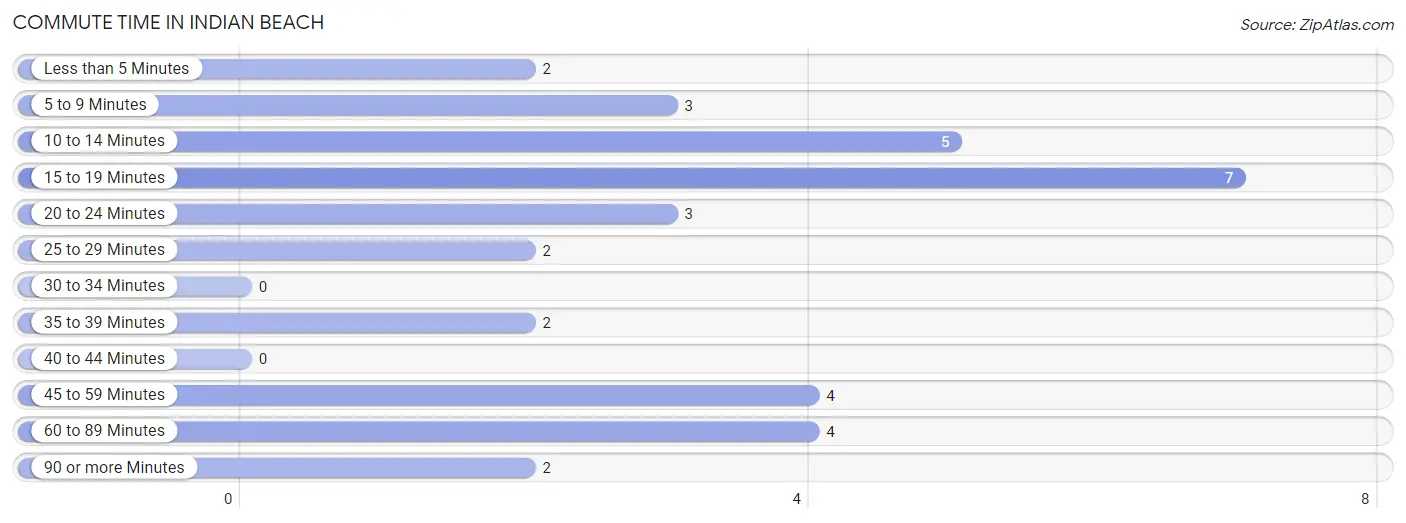
| Commute Time | # Commuters | % Commuters |
| Less than 5 Minutes | 2 | 5.9% |
| 5 to 9 Minutes | 3 | 8.8% |
| 10 to 14 Minutes | 5 | 14.7% |
| 15 to 19 Minutes | 7 | 20.6% |
| 20 to 24 Minutes | 3 | 8.8% |
| 25 to 29 Minutes | 2 | 5.9% |
| 30 to 34 Minutes | 0 | 0.0% |
| 35 to 39 Minutes | 2 | 5.9% |
| 40 to 44 Minutes | 0 | 0.0% |
| 45 to 59 Minutes | 4 | 11.8% |
| 60 to 89 Minutes | 4 | 11.8% |
| 90 or more Minutes | 2 | 5.9% |
Commute Time by Sex in Indian Beach
The most common commute times in Indian Beach are 10 to 14 minutes (4 commuters, 20.0%) for males and 15 to 19 minutes (5 commuters, 35.7%) for females.
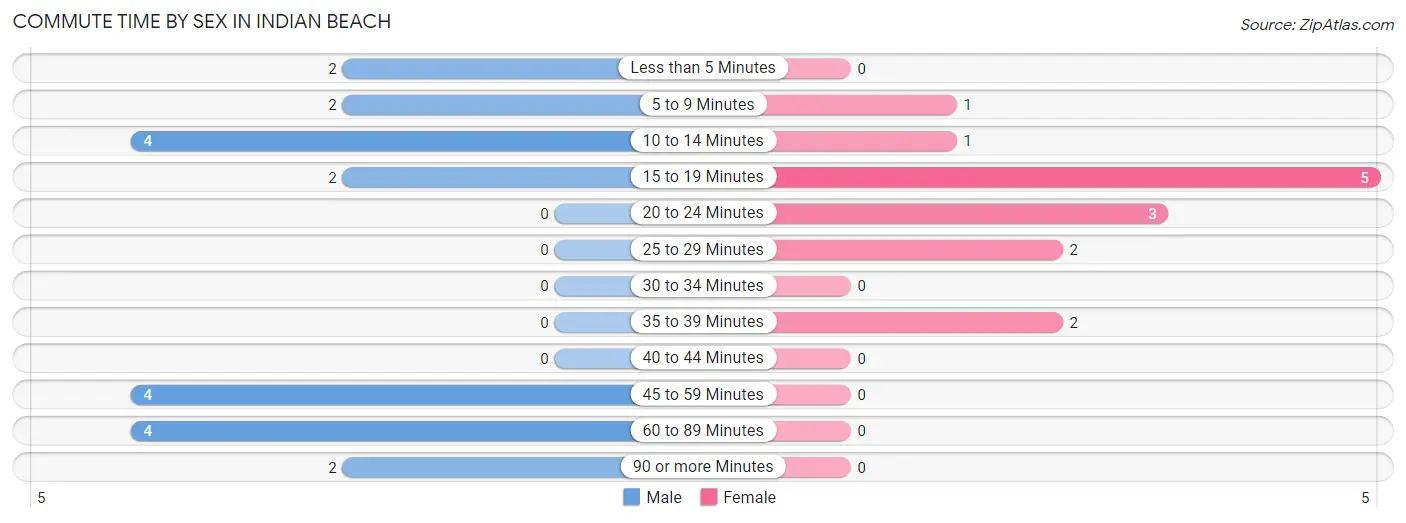
| Commute Time | Male | Female |
| Less than 5 Minutes | 2 (10.0%) | 0 (0.0%) |
| 5 to 9 Minutes | 2 (10.0%) | 1 (7.1%) |
| 10 to 14 Minutes | 4 (20.0%) | 1 (7.1%) |
| 15 to 19 Minutes | 2 (10.0%) | 5 (35.7%) |
| 20 to 24 Minutes | 0 (0.0%) | 3 (21.4%) |
| 25 to 29 Minutes | 0 (0.0%) | 2 (14.3%) |
| 30 to 34 Minutes | 0 (0.0%) | 0 (0.0%) |
| 35 to 39 Minutes | 0 (0.0%) | 2 (14.3%) |
| 40 to 44 Minutes | 0 (0.0%) | 0 (0.0%) |
| 45 to 59 Minutes | 4 (20.0%) | 0 (0.0%) |
| 60 to 89 Minutes | 4 (20.0%) | 0 (0.0%) |
| 90 or more Minutes | 2 (10.0%) | 0 (0.0%) |
Time of Departure to Work by Sex in Indian Beach
The most frequent times of departure to work in Indian Beach are 8:00 AM to 8:29 AM (8, 40.0%) for males and 9:00 AM to 9:59 AM (3, 21.4%) for females.
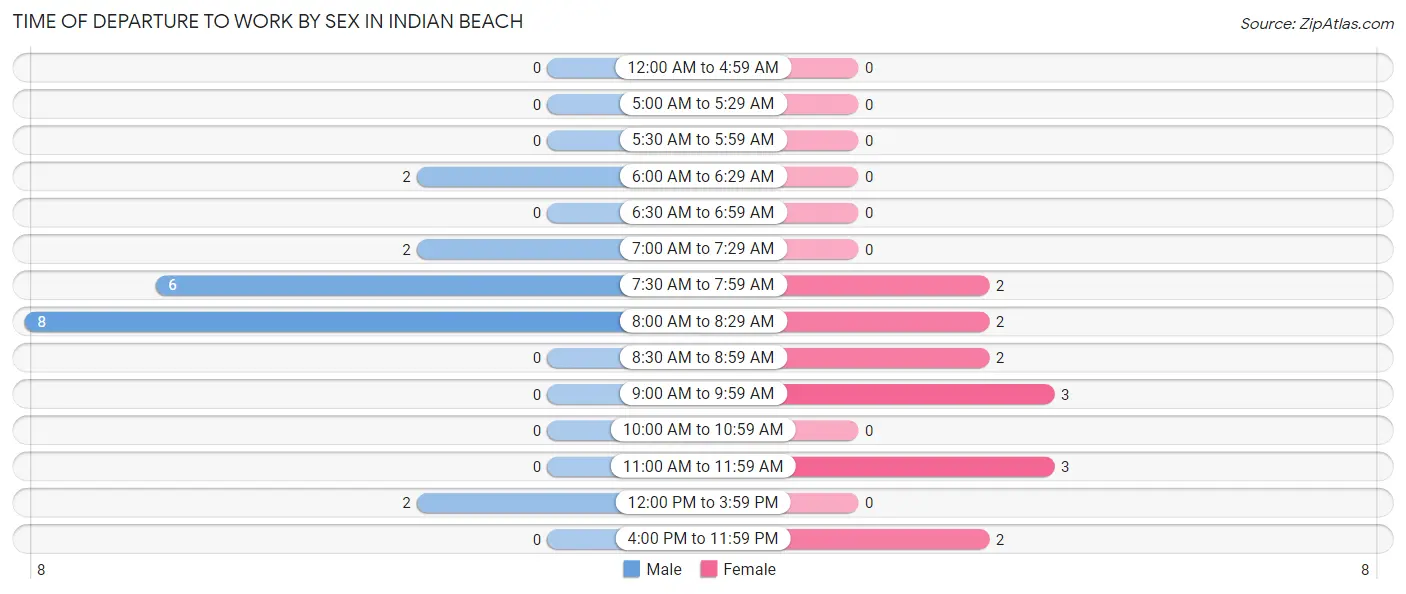
| Time of Departure | Male | Female |
| 12:00 AM to 4:59 AM | 0 (0.0%) | 0 (0.0%) |
| 5:00 AM to 5:29 AM | 0 (0.0%) | 0 (0.0%) |
| 5:30 AM to 5:59 AM | 0 (0.0%) | 0 (0.0%) |
| 6:00 AM to 6:29 AM | 2 (10.0%) | 0 (0.0%) |
| 6:30 AM to 6:59 AM | 0 (0.0%) | 0 (0.0%) |
| 7:00 AM to 7:29 AM | 2 (10.0%) | 0 (0.0%) |
| 7:30 AM to 7:59 AM | 6 (30.0%) | 2 (14.3%) |
| 8:00 AM to 8:29 AM | 8 (40.0%) | 2 (14.3%) |
| 8:30 AM to 8:59 AM | 0 (0.0%) | 2 (14.3%) |
| 9:00 AM to 9:59 AM | 0 (0.0%) | 3 (21.4%) |
| 10:00 AM to 10:59 AM | 0 (0.0%) | 0 (0.0%) |
| 11:00 AM to 11:59 AM | 0 (0.0%) | 3 (21.4%) |
| 12:00 PM to 3:59 PM | 2 (10.0%) | 0 (0.0%) |
| 4:00 PM to 11:59 PM | 0 (0.0%) | 2 (14.3%) |
| Total | 20 (100.0%) | 14 (100.0%) |
Housing Occupancy in Indian Beach
Occupancy by Ownership in Indian Beach
Of the total 98 dwellings in Indian Beach, owner-occupied units account for 94 (95.9%), while renter-occupied units make up 4 (4.1%).
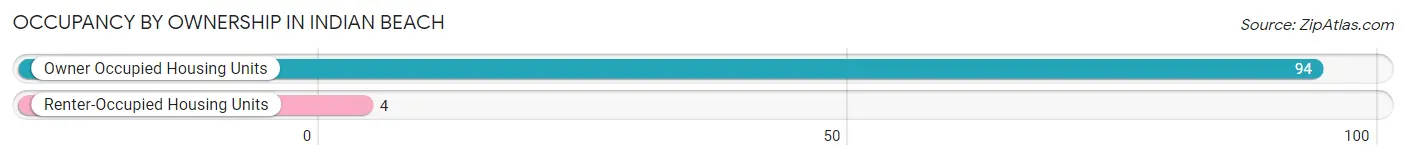
| Occupancy | # Housing Units | % Housing Units |
| Owner Occupied Housing Units | 94 | 95.9% |
| Renter-Occupied Housing Units | 4 | 4.1% |
| Total Occupied Housing Units | 98 | 100.0% |
Occupancy by Household Size in Indian Beach
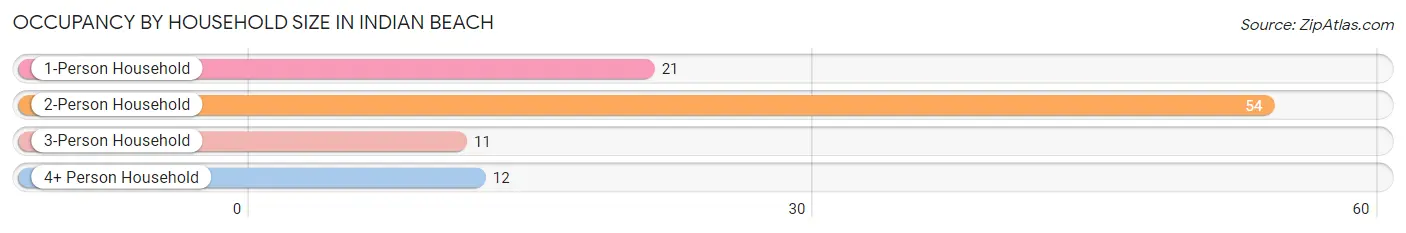
| Household Size | # Housing Units | % Housing Units |
| 1-Person Household | 21 | 21.4% |
| 2-Person Household | 54 | 55.1% |
| 3-Person Household | 11 | 11.2% |
| 4+ Person Household | 12 | 12.2% |
| Total Housing Units | 98 | 100.0% |
Occupancy by Ownership by Household Size in Indian Beach
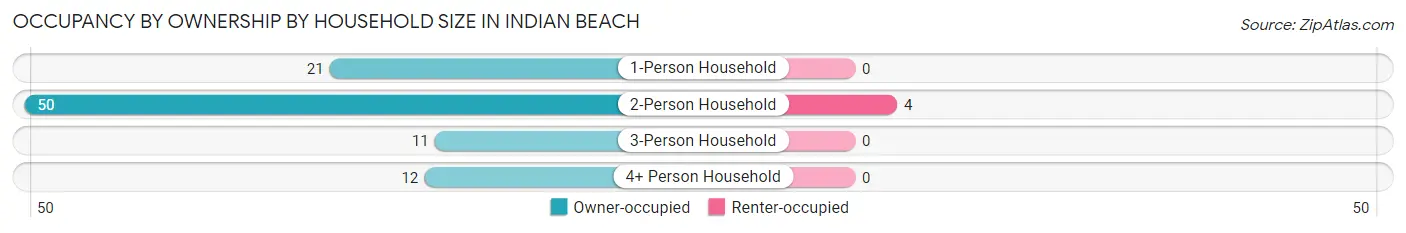
| Household Size | Owner-occupied | Renter-occupied |
| 1-Person Household | 21 (100.0%) | 0 (0.0%) |
| 2-Person Household | 50 (92.6%) | 4 (7.4%) |
| 3-Person Household | 11 (100.0%) | 0 (0.0%) |
| 4+ Person Household | 12 (100.0%) | 0 (0.0%) |
| Total Housing Units | 94 (95.9%) | 4 (4.1%) |
Occupancy by Educational Attainment in Indian Beach
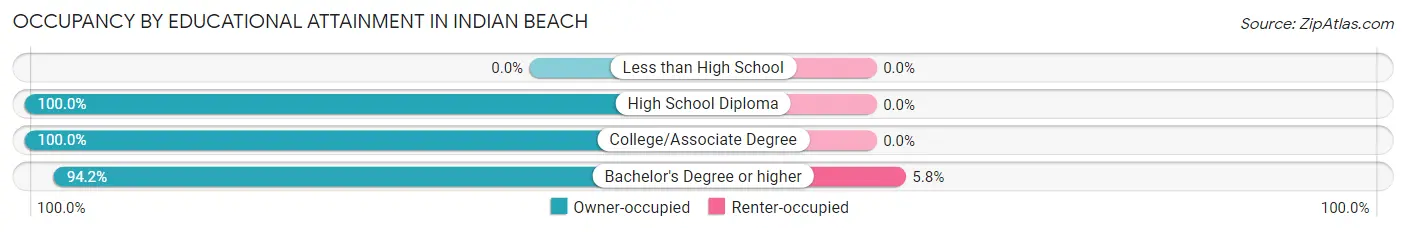
| Household Size | Owner-occupied | Renter-occupied |
| Less than High School | 0 (0.0%) | 0 (0.0%) |
| High School Diploma | 4 (100.0%) | 0 (0.0%) |
| College/Associate Degree | 25 (100.0%) | 0 (0.0%) |
| Bachelor's Degree or higher | 65 (94.2%) | 4 (5.8%) |
Occupancy by Age of Householder in Indian Beach
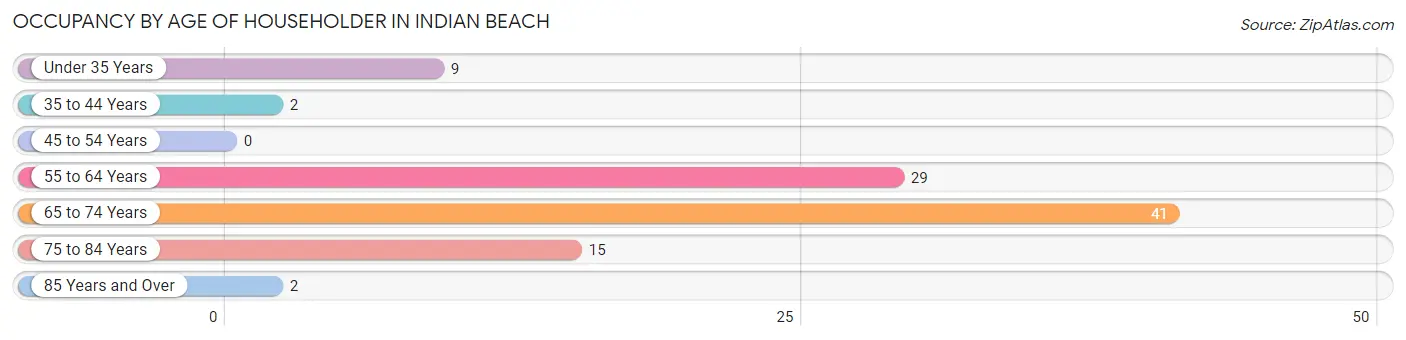
| Age Bracket | # Households | % Households |
| Under 35 Years | 9 | 9.2% |
| 35 to 44 Years | 2 | 2.0% |
| 45 to 54 Years | 0 | 0.0% |
| 55 to 64 Years | 29 | 29.6% |
| 65 to 74 Years | 41 | 41.8% |
| 75 to 84 Years | 15 | 15.3% |
| 85 Years and Over | 2 | 2.0% |
| Total | 98 | 100.0% |
Housing Finances in Indian Beach
Median Income by Occupancy in Indian Beach
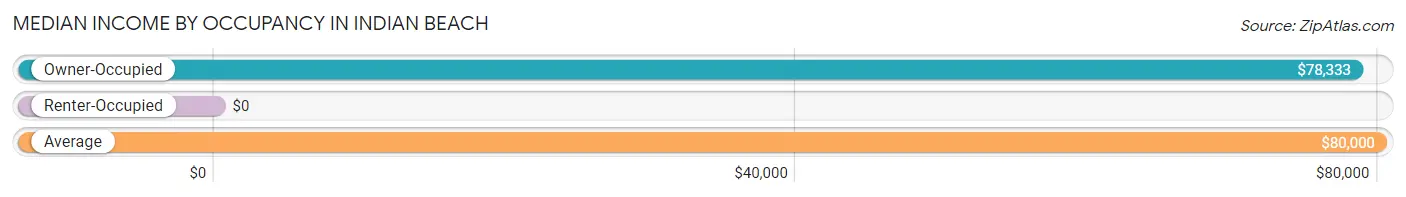
| Occupancy Type | # Households | Median Income |
| Owner-Occupied | 94 (95.9%) | $78,333 |
| Renter-Occupied | 4 (4.1%) | $0 |
| Average | 98 (100.0%) | $80,000 |
Occupancy by Householder Income Bracket in Indian Beach
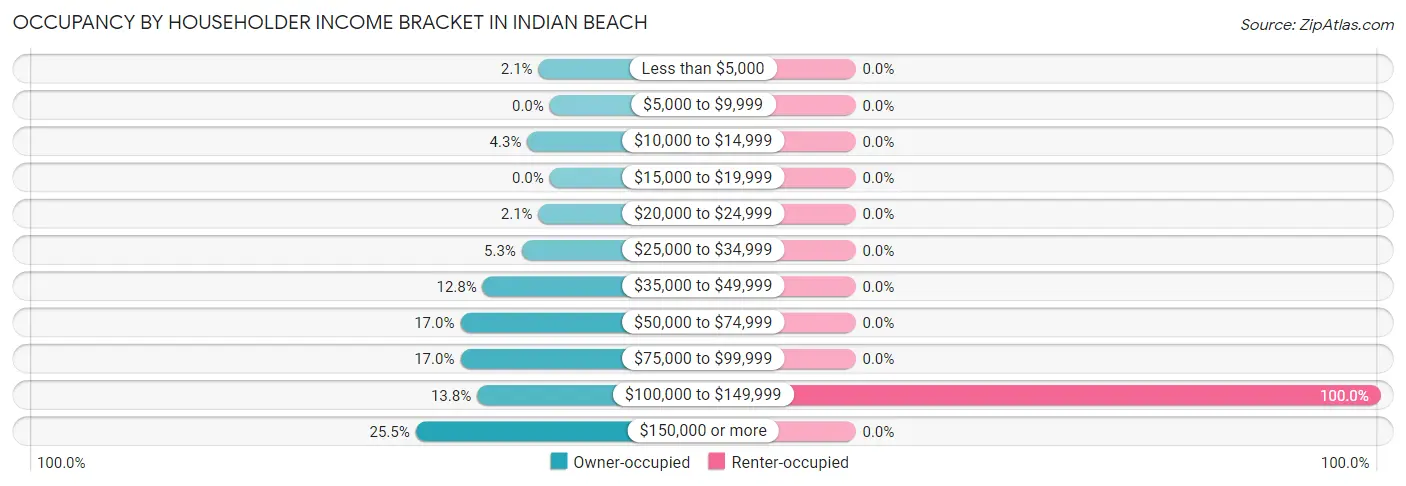
| Income Bracket | Owner-occupied | Renter-occupied |
| Less than $5,000 | 2 (2.1%) | 0 (0.0%) |
| $5,000 to $9,999 | 0 (0.0%) | 0 (0.0%) |
| $10,000 to $14,999 | 4 (4.3%) | 0 (0.0%) |
| $15,000 to $19,999 | 0 (0.0%) | 0 (0.0%) |
| $20,000 to $24,999 | 2 (2.1%) | 0 (0.0%) |
| $25,000 to $34,999 | 5 (5.3%) | 0 (0.0%) |
| $35,000 to $49,999 | 12 (12.8%) | 0 (0.0%) |
| $50,000 to $74,999 | 16 (17.0%) | 0 (0.0%) |
| $75,000 to $99,999 | 16 (17.0%) | 0 (0.0%) |
| $100,000 to $149,999 | 13 (13.8%) | 4 (100.0%) |
| $150,000 or more | 24 (25.5%) | 0 (0.0%) |
| Total | 94 (100.0%) | 4 (100.0%) |
Monthly Housing Cost Tiers in Indian Beach
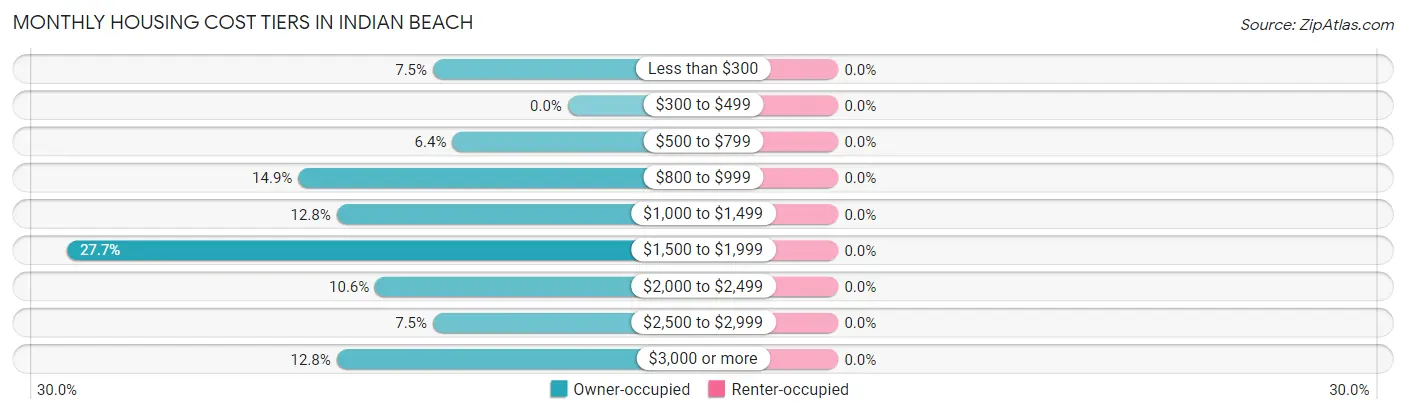
| Monthly Cost | Owner-occupied | Renter-occupied |
| Less than $300 | 7 (7.4%) | 0 (0.0%) |
| $300 to $499 | 0 (0.0%) | 0 (0.0%) |
| $500 to $799 | 6 (6.4%) | 0 (0.0%) |
| $800 to $999 | 14 (14.9%) | 0 (0.0%) |
| $1,000 to $1,499 | 12 (12.8%) | 0 (0.0%) |
| $1,500 to $1,999 | 26 (27.7%) | 0 (0.0%) |
| $2,000 to $2,499 | 10 (10.6%) | 0 (0.0%) |
| $2,500 to $2,999 | 7 (7.4%) | 0 (0.0%) |
| $3,000 or more | 12 (12.8%) | 0 (0.0%) |
| Total | 94 (100.0%) | 4 (100.0%) |
Physical Housing Characteristics in Indian Beach
Housing Structures in Indian Beach
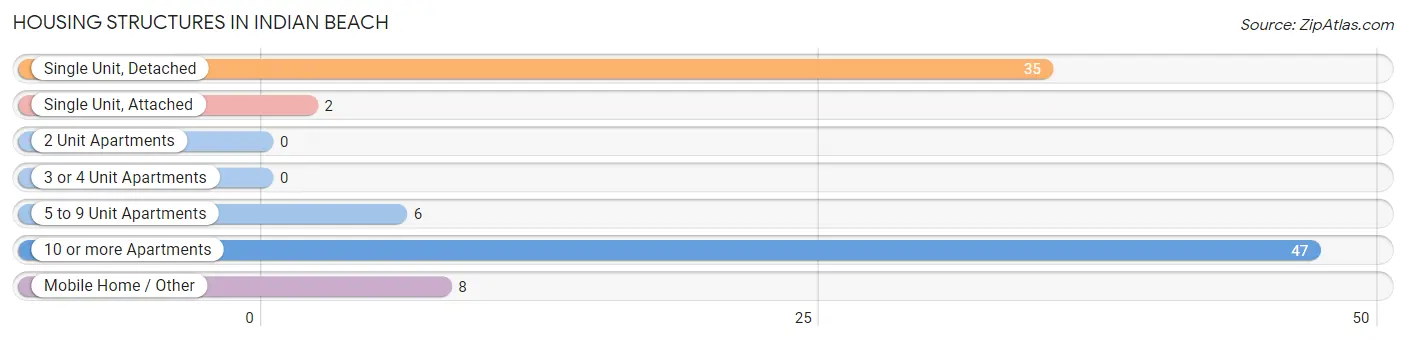
| Structure Type | # Housing Units | % Housing Units |
| Single Unit, Detached | 35 | 35.7% |
| Single Unit, Attached | 2 | 2.0% |
| 2 Unit Apartments | 0 | 0.0% |
| 3 or 4 Unit Apartments | 0 | 0.0% |
| 5 to 9 Unit Apartments | 6 | 6.1% |
| 10 or more Apartments | 47 | 48.0% |
| Mobile Home / Other | 8 | 8.2% |
| Total | 98 | 100.0% |
Housing Structures by Occupancy in Indian Beach
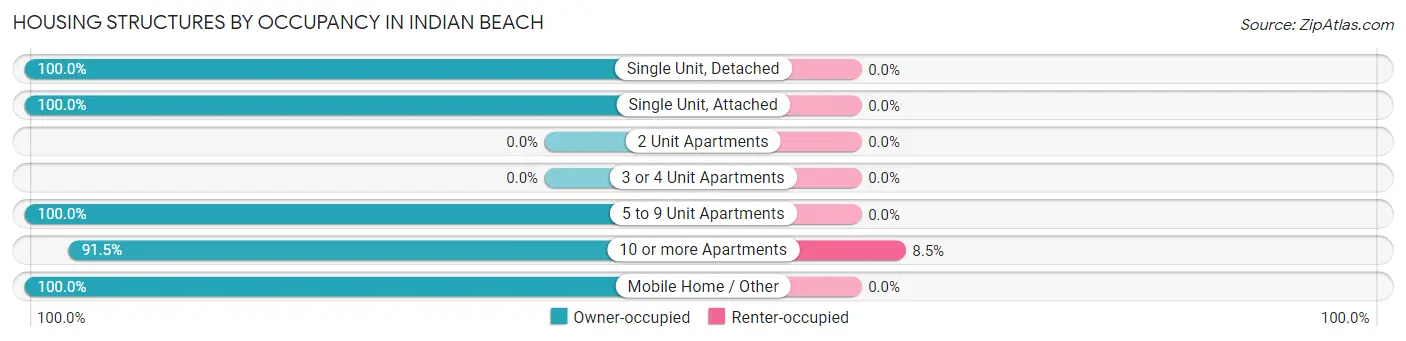
| Structure Type | Owner-occupied | Renter-occupied |
| Single Unit, Detached | 35 (100.0%) | 0 (0.0%) |
| Single Unit, Attached | 2 (100.0%) | 0 (0.0%) |
| 2 Unit Apartments | 0 (0.0%) | 0 (0.0%) |
| 3 or 4 Unit Apartments | 0 (0.0%) | 0 (0.0%) |
| 5 to 9 Unit Apartments | 6 (100.0%) | 0 (0.0%) |
| 10 or more Apartments | 43 (91.5%) | 4 (8.5%) |
| Mobile Home / Other | 8 (100.0%) | 0 (0.0%) |
| Total | 94 (95.9%) | 4 (4.1%) |
Housing Structures by Number of Rooms in Indian Beach
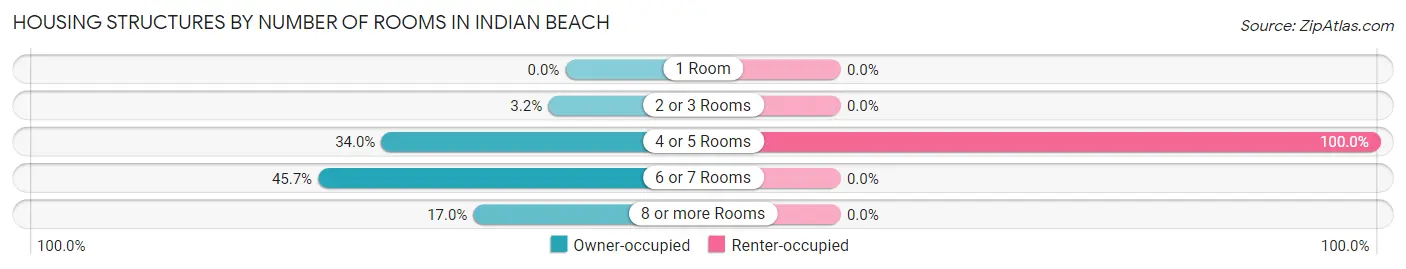
| Number of Rooms | Owner-occupied | Renter-occupied |
| 1 Room | 0 (0.0%) | 0 (0.0%) |
| 2 or 3 Rooms | 3 (3.2%) | 0 (0.0%) |
| 4 or 5 Rooms | 32 (34.0%) | 4 (100.0%) |
| 6 or 7 Rooms | 43 (45.7%) | 0 (0.0%) |
| 8 or more Rooms | 16 (17.0%) | 0 (0.0%) |
| Total | 94 (100.0%) | 4 (100.0%) |
Housing Structure by Heating Type in Indian Beach
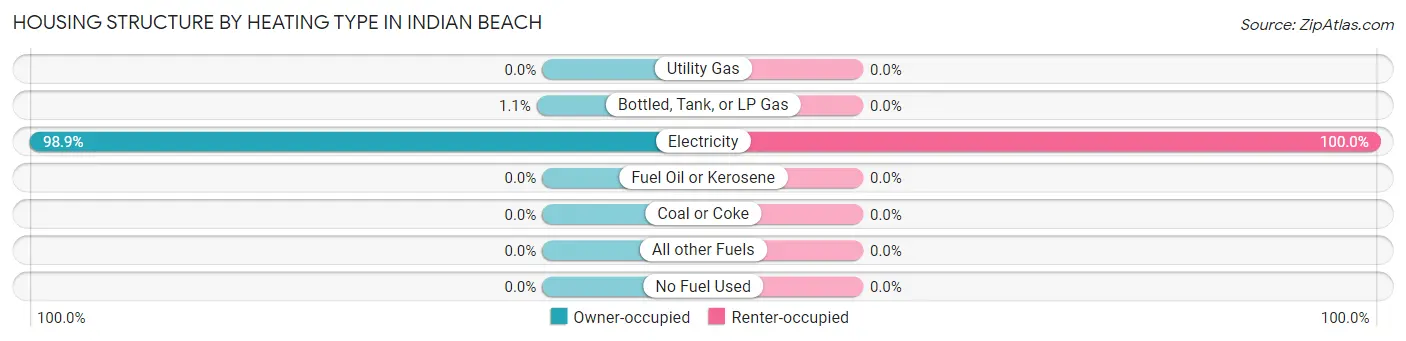
| Heating Type | Owner-occupied | Renter-occupied |
| Utility Gas | 0 (0.0%) | 0 (0.0%) |
| Bottled, Tank, or LP Gas | 1 (1.1%) | 0 (0.0%) |
| Electricity | 93 (98.9%) | 4 (100.0%) |
| Fuel Oil or Kerosene | 0 (0.0%) | 0 (0.0%) |
| Coal or Coke | 0 (0.0%) | 0 (0.0%) |
| All other Fuels | 0 (0.0%) | 0 (0.0%) |
| No Fuel Used | 0 (0.0%) | 0 (0.0%) |
| Total | 94 (100.0%) | 4 (100.0%) |
Household Vehicle Usage in Indian Beach
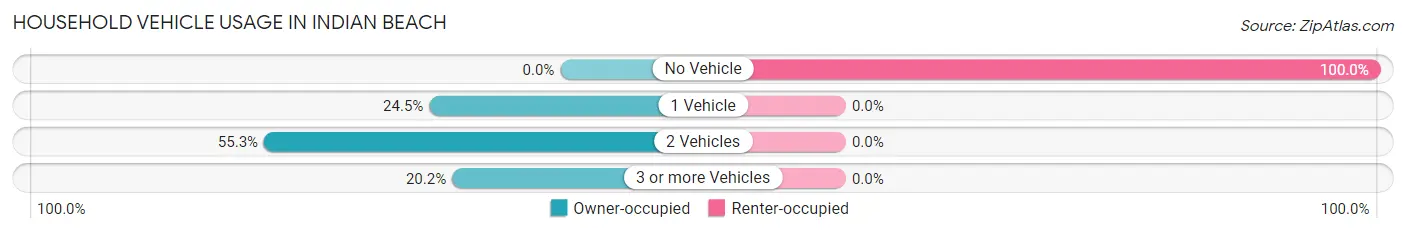
| Vehicles per Household | Owner-occupied | Renter-occupied |
| No Vehicle | 0 (0.0%) | 4 (100.0%) |
| 1 Vehicle | 23 (24.5%) | 0 (0.0%) |
| 2 Vehicles | 52 (55.3%) | 0 (0.0%) |
| 3 or more Vehicles | 19 (20.2%) | 0 (0.0%) |
| Total | 94 (100.0%) | 4 (100.0%) |
Real Estate & Mortgages in Indian Beach
Real Estate and Mortgage Overview in Indian Beach
| Characteristic | Without Mortgage | With Mortgage |
| Housing Units | 41 | 53 |
| Median Property Value | $541,700 | $522,100 |
| Median Household Income | $79,583 | $14 |
| Monthly Housing Costs | $935 | $12 |
| Real Estate Taxes | $2,400 | $0 |
Property Value by Mortgage Status in Indian Beach
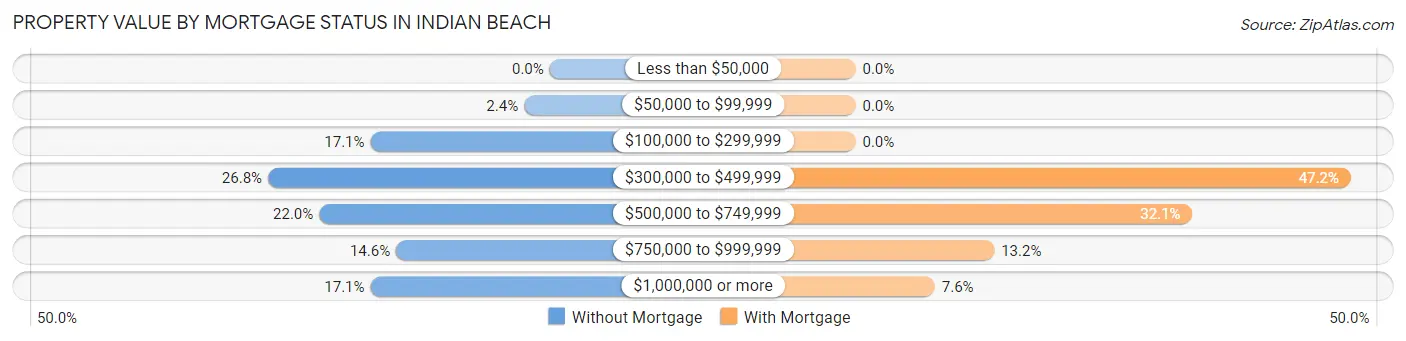
| Property Value | Without Mortgage | With Mortgage |
| Less than $50,000 | 0 (0.0%) | 0 (0.0%) |
| $50,000 to $99,999 | 1 (2.4%) | 0 (0.0%) |
| $100,000 to $299,999 | 7 (17.1%) | 0 (0.0%) |
| $300,000 to $499,999 | 11 (26.8%) | 25 (47.2%) |
| $500,000 to $749,999 | 9 (22.0%) | 17 (32.1%) |
| $750,000 to $999,999 | 6 (14.6%) | 7 (13.2%) |
| $1,000,000 or more | 7 (17.1%) | 4 (7.5%) |
| Total | 41 (100.0%) | 53 (100.0%) |
Household Income by Mortgage Status in Indian Beach
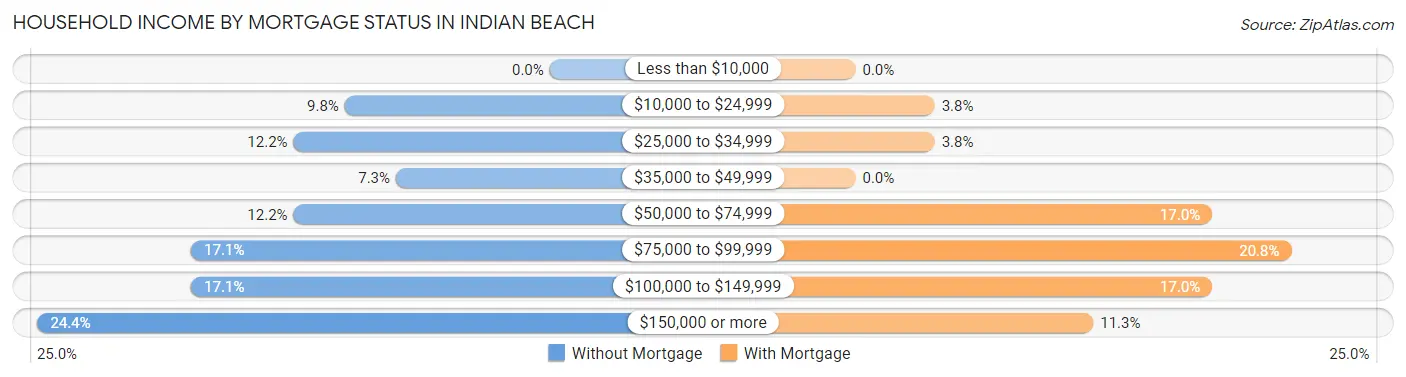
| Household Income | Without Mortgage | With Mortgage |
| Less than $10,000 | 0 (0.0%) | 0 (0.0%) |
| $10,000 to $24,999 | 4 (9.8%) | 2 (3.8%) |
| $25,000 to $34,999 | 5 (12.2%) | 2 (3.8%) |
| $35,000 to $49,999 | 3 (7.3%) | 0 (0.0%) |
| $50,000 to $74,999 | 5 (12.2%) | 9 (17.0%) |
| $75,000 to $99,999 | 7 (17.1%) | 11 (20.7%) |
| $100,000 to $149,999 | 7 (17.1%) | 9 (17.0%) |
| $150,000 or more | 10 (24.4%) | 6 (11.3%) |
| Total | 41 (100.0%) | 53 (100.0%) |
Property Value to Household Income Ratio in Indian Beach
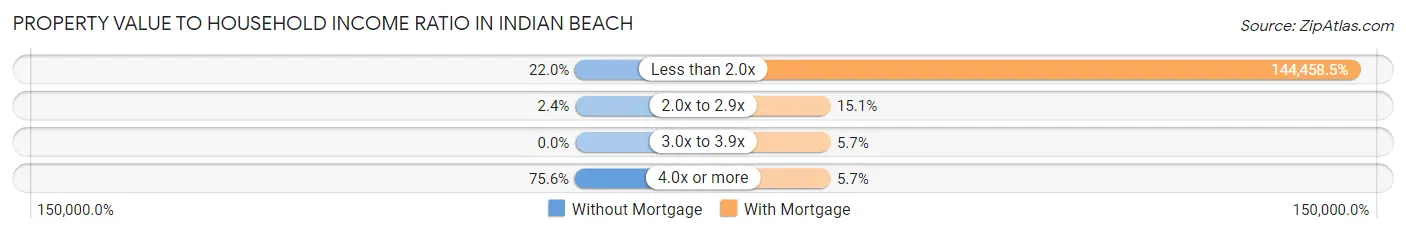
| Value-to-Income Ratio | Without Mortgage | With Mortgage |
| Less than 2.0x | 9 (22.0%) | 76,563 (144,458.5%) |
| 2.0x to 2.9x | 1 (2.4%) | 8 (15.1%) |
| 3.0x to 3.9x | 0 (0.0%) | 3 (5.7%) |
| 4.0x or more | 31 (75.6%) | 3 (5.7%) |
| Total | 41 (100.0%) | 53 (100.0%) |
Real Estate Taxes by Mortgage Status in Indian Beach
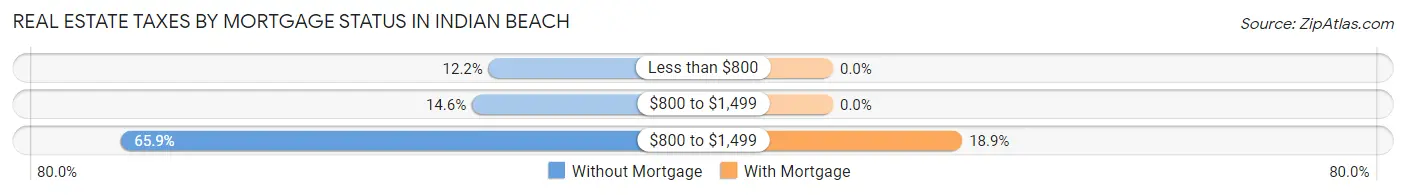
| Property Taxes | Without Mortgage | With Mortgage |
| Less than $800 | 5 (12.2%) | 0 (0.0%) |
| $800 to $1,499 | 6 (14.6%) | 0 (0.0%) |
| $800 to $1,499 | 27 (65.8%) | 10 (18.9%) |
| Total | 41 (100.0%) | 53 (100.0%) |
Health & Disability in Indian Beach
Health Insurance Coverage by Age in Indian Beach
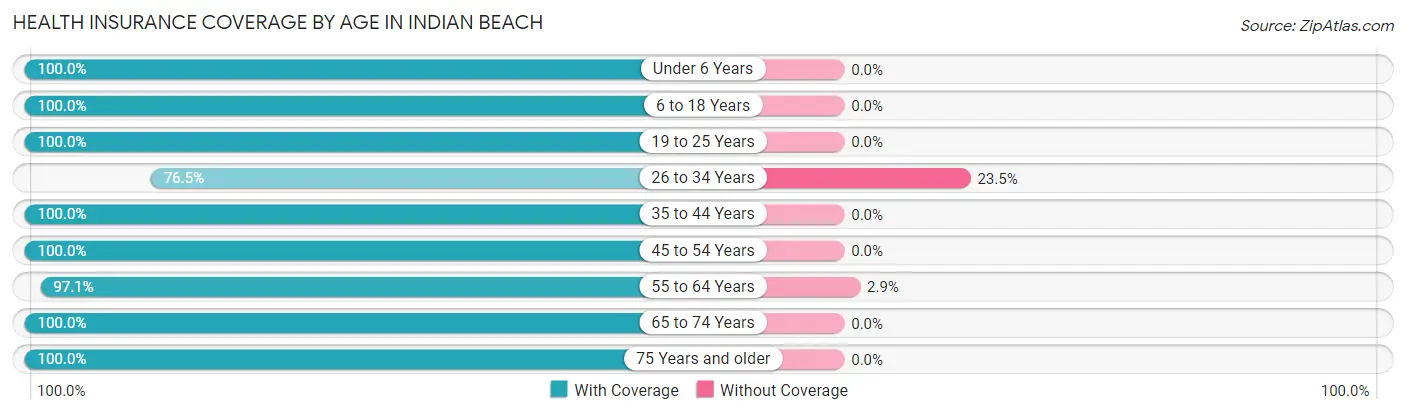
| Age Bracket | With Coverage | Without Coverage |
| Under 6 Years | 8 (100.0%) | 0 (0.0%) |
| 6 to 18 Years | 16 (100.0%) | 0 (0.0%) |
| 19 to 25 Years | 2 (100.0%) | 0 (0.0%) |
| 26 to 34 Years | 13 (76.5%) | 4 (23.5%) |
| 35 to 44 Years | 22 (100.0%) | 0 (0.0%) |
| 45 to 54 Years | 1 (100.0%) | 0 (0.0%) |
| 55 to 64 Years | 66 (97.1%) | 2 (2.9%) |
| 65 to 74 Years | 58 (100.0%) | 0 (0.0%) |
| 75 Years and older | 24 (100.0%) | 0 (0.0%) |
| Total | 210 (97.2%) | 6 (2.8%) |
Health Insurance Coverage by Citizenship Status in Indian Beach

| Citizenship Status | With Coverage | Without Coverage |
| Native Born | 8 (100.0%) | 0 (0.0%) |
| Foreign Born, Citizen | 16 (100.0%) | 0 (0.0%) |
| Foreign Born, not a Citizen | 2 (100.0%) | 0 (0.0%) |
Health Insurance Coverage by Household Income in Indian Beach
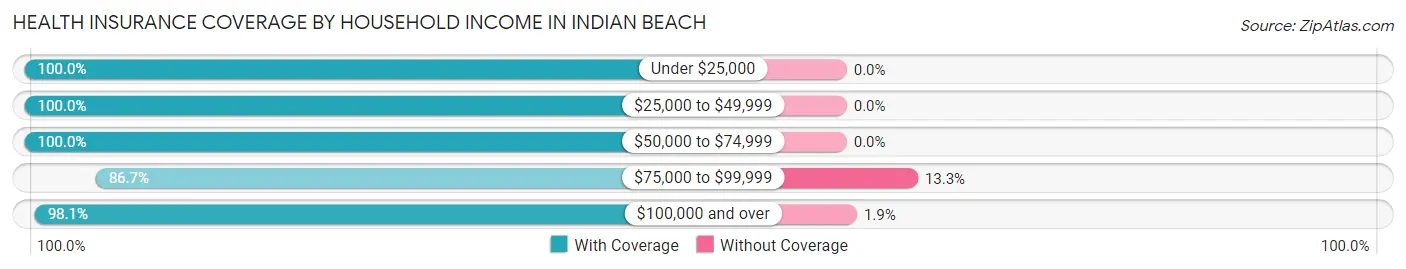
| Household Income | With Coverage | Without Coverage |
| Under $25,000 | 11 (100.0%) | 0 (0.0%) |
| $25,000 to $49,999 | 46 (100.0%) | 0 (0.0%) |
| $50,000 to $74,999 | 24 (100.0%) | 0 (0.0%) |
| $75,000 to $99,999 | 26 (86.7%) | 4 (13.3%) |
| $100,000 and over | 103 (98.1%) | 2 (1.9%) |
Public vs Private Health Insurance Coverage by Age in Indian Beach

| Age Bracket | Public Insurance | Private Insurance |
| Under 6 | 8 (100.0%) | 0 (0.0%) |
| 6 to 18 Years | 14 (87.5%) | 4 (25.0%) |
| 19 to 25 Years | 0 (0.0%) | 2 (100.0%) |
| 25 to 34 Years | 4 (23.5%) | 9 (52.9%) |
| 35 to 44 Years | 0 (0.0%) | 22 (100.0%) |
| 45 to 54 Years | 0 (0.0%) | 1 (100.0%) |
| 55 to 64 Years | 0 (0.0%) | 66 (97.1%) |
| 65 to 74 Years | 57 (98.3%) | 30 (51.7%) |
| 75 Years and over | 24 (100.0%) | 11 (45.8%) |
| Total | 107 (49.5%) | 145 (67.1%) |
Disability Status by Sex by Age in Indian Beach
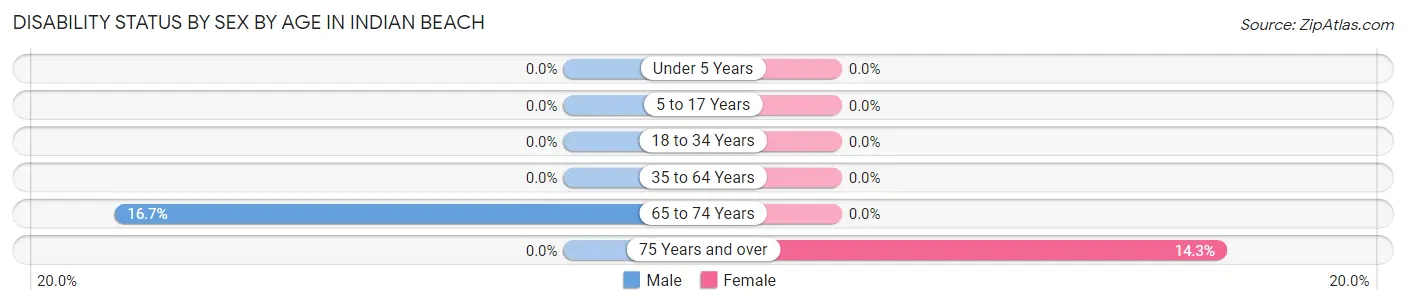
| Age Bracket | Male | Female |
| Under 5 Years | 0 (0.0%) | 0 (0.0%) |
| 5 to 17 Years | 0 (0.0%) | 0 (0.0%) |
| 18 to 34 Years | 0 (0.0%) | 0 (0.0%) |
| 35 to 64 Years | 0 (0.0%) | 0 (0.0%) |
| 65 to 74 Years | 6 (16.7%) | 0 (0.0%) |
| 75 Years and over | 0 (0.0%) | 2 (14.3%) |
Disability Class by Sex by Age in Indian Beach
Disability Class: Hearing Difficulty
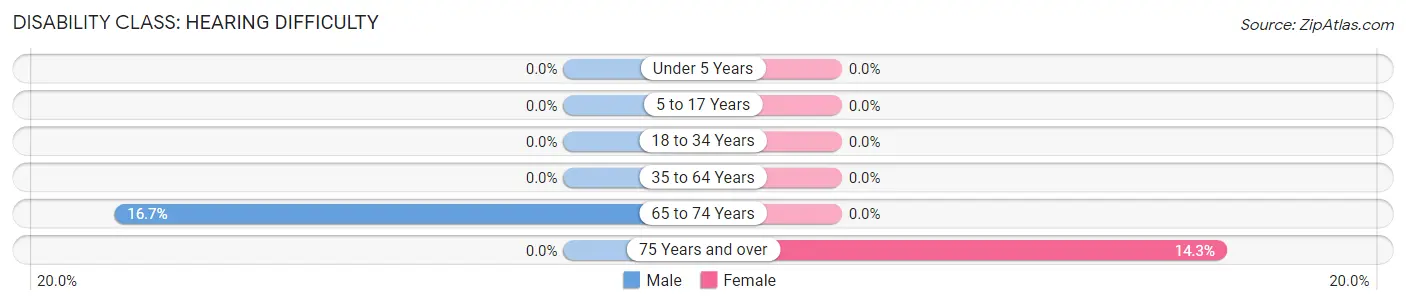
| Age Bracket | Male | Female |
| Under 5 Years | 0 (0.0%) | 0 (0.0%) |
| 5 to 17 Years | 0 (0.0%) | 0 (0.0%) |
| 18 to 34 Years | 0 (0.0%) | 0 (0.0%) |
| 35 to 64 Years | 0 (0.0%) | 0 (0.0%) |
| 65 to 74 Years | 6 (16.7%) | 0 (0.0%) |
| 75 Years and over | 0 (0.0%) | 2 (14.3%) |
Disability Class: Vision Difficulty
| Age Bracket | Male | Female |
| Under 5 Years | 0 (0.0%) | 0 (0.0%) |
| 5 to 17 Years | 0 (0.0%) | 0 (0.0%) |
| 18 to 34 Years | 0 (0.0%) | 0 (0.0%) |
| 35 to 64 Years | 0 (0.0%) | 0 (0.0%) |
| 65 to 74 Years | 0 (0.0%) | 0 (0.0%) |
| 75 Years and over | 0 (0.0%) | 0 (0.0%) |
Disability Class: Cognitive Difficulty
| Age Bracket | Male | Female |
| 5 to 17 Years | 0 (0.0%) | 0 (0.0%) |
| 18 to 34 Years | 0 (0.0%) | 0 (0.0%) |
| 35 to 64 Years | 0 (0.0%) | 0 (0.0%) |
| 65 to 74 Years | 2 (5.6%) | 0 (0.0%) |
| 75 Years and over | 0 (0.0%) | 0 (0.0%) |
Disability Class: Ambulatory Difficulty
| Age Bracket | Male | Female |
| 5 to 17 Years | 0 (0.0%) | 0 (0.0%) |
| 18 to 34 Years | 0 (0.0%) | 0 (0.0%) |
| 35 to 64 Years | 0 (0.0%) | 0 (0.0%) |
| 65 to 74 Years | 0 (0.0%) | 0 (0.0%) |
| 75 Years and over | 0 (0.0%) | 0 (0.0%) |
Disability Class: Self-Care Difficulty
| Age Bracket | Male | Female |
| 5 to 17 Years | 0 (0.0%) | 0 (0.0%) |
| 18 to 34 Years | 0 (0.0%) | 0 (0.0%) |
| 35 to 64 Years | 0 (0.0%) | 0 (0.0%) |
| 65 to 74 Years | 0 (0.0%) | 0 (0.0%) |
| 75 Years and over | 0 (0.0%) | 0 (0.0%) |
Technology Access in Indian Beach
Computing Device Access in Indian Beach
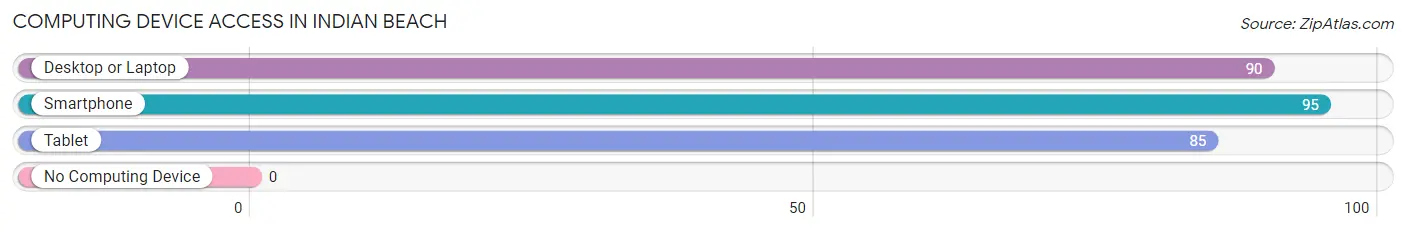
| Device Type | # Households | % Households |
| Desktop or Laptop | 90 | 91.8% |
| Smartphone | 95 | 96.9% |
| Tablet | 85 | 86.7% |
| No Computing Device | 0 | 0.0% |
| Total | 98 | 100.0% |
Internet Access in Indian Beach
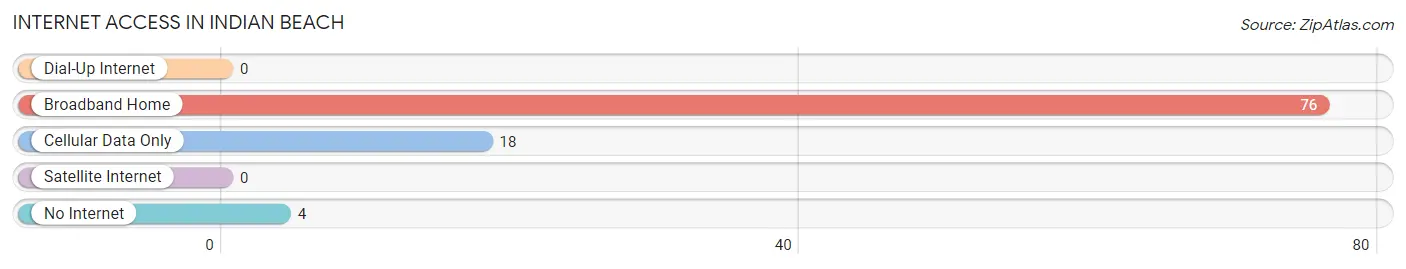
| Internet Type | # Households | % Households |
| Dial-Up Internet | 0 | 0.0% |
| Broadband Home | 76 | 77.5% |
| Cellular Data Only | 18 | 18.4% |
| Satellite Internet | 0 | 0.0% |
| No Internet | 4 | 4.1% |
| Total | 98 | 100.0% |
Indian Beach Summary
Beach, NC is a small town located in Carteret County, North Carolina. It is situated on the Atlantic Ocean, just south of Morehead City. The town is known for its beautiful beaches, fishing, and outdoor activities.
History
The area that is now Indian Beach was originally inhabited by the Coree Indians. The Coree were a small tribe of Native Americans who lived in the area for centuries before the arrival of Europeans. The first Europeans to settle in the area were the English, who arrived in the late 1600s. The town was originally known as “Indian Town” and was home to a small fishing village.
In the late 1800s, the town was renamed “Indian Beach” and began to attract more visitors. The town was a popular destination for wealthy vacationers from the North, who built large summer homes along the beach. The town was also home to a number of resorts, including the Indian Beach Hotel, which was built in the early 1900s.
In the early 1900s, the town began to attract more permanent residents. The population grew steadily throughout the 20th century, reaching a peak of 1,000 in the 1950s. The town’s population has since declined, and as of the 2010 census, the population was just over 500.
Geography
Indian Beach is located on the Atlantic Ocean, just south of Morehead City. The town is situated on a barrier island, which is separated from the mainland by the Newport River. The town is bordered by the Atlantic Ocean to the east, the Newport River to the west, and the Bogue Sound to the south.
The town is home to several beaches, including Indian Beach, which is the main beach in town. The beach is known for its white sand and crystal clear waters. The town is also home to a number of parks, including the Indian Beach Nature Preserve, which is a popular spot for bird watching.
Economy
The economy of Indian Beach is largely based on tourism. The town is home to a number of resorts and hotels, which attract visitors from all over the world. The town is also home to a number of restaurants, bars, and shops, which cater to tourists and locals alike.
The town is also home to a number of fishing charters, which offer deep sea fishing trips. The town is also home to a number of marinas, which offer boat rentals and other services.
Demographics
As of the 2010 census, the population of Indian Beach was 517. The town is predominantly white, with 92.3% of the population identifying as white. The town is also home to a small African American population, which makes up 4.3% of the population. The town is also home to a small Hispanic population, which makes up 2.3% of the population.
The median household income in Indian Beach is $45,000, which is slightly lower than the national average. The town has a poverty rate of 11.3%, which is slightly higher than the national average. The town also has a high rate of homeownership, with 73.3% of the population owning their own homes.
Common Questions
What is Per Capita Income in Indian Beach?
Per Capita income in Indian Beach is $53,738.
What is the Median Family Income in Indian Beach?
Median Family Income in Indian Beach is $109,063.
What is the Median Household income in Indian Beach?
Median Household Income in Indian Beach is $80,000.
What is Income or Wage Gap in Indian Beach?
Income or Wage Gap in Indian Beach is 63.2%.
Women in Indian Beach earn 36.8 cents for every dollar earned by a man.
What is Inequality or Gini Index in Indian Beach?
Inequality or Gini Index in Indian Beach is 0.41.
What is the Total Population of Indian Beach?
Total Population of Indian Beach is 225.
What is the Total Male Population of Indian Beach?
Total Male Population of Indian Beach is 106.
What is the Total Female Population of Indian Beach?
Total Female Population of Indian Beach is 119.
What is the Ratio of Males per 100 Females in Indian Beach?
There are 89.08 Males per 100 Females in Indian Beach.
What is the Ratio of Females per 100 Males in Indian Beach?
There are 112.26 Females per 100 Males in Indian Beach.
What is the Median Population Age in Indian Beach?
Median Population Age in Indian Beach is 63.2 Years.
What is the Average Family Size in Indian Beach
Average Family Size in Indian Beach is 2.5 People.
What is the Average Household Size in Indian Beach
Average Household Size in Indian Beach is 2.2 People.
How Large is the Labor Force in Indian Beach?
There are 74 People in the Labor Forcein in Indian Beach.
What is the Percentage of People in the Labor Force in Indian Beach?
37.9% of People are in the Labor Force in Indian Beach.
What is the Unemployment Rate in Indian Beach?
Unemployment Rate in Indian Beach is 1.4%.