St Helena, NC Map & Demographics
St Helena Map
St Helena Overview
$35,276
PER CAPITA INCOME
$78,125
AVG FAMILY INCOME
$73,571
AVG HOUSEHOLD INCOME
5.4%
WAGE / INCOME GAP [ % ]
94.6¢/ $1
WAGE / INCOME GAP [ $ ]
0.33
INEQUALITY / GINI INDEX
465
TOTAL POPULATION
239
MALE POPULATION
226
FEMALE POPULATION
105.75
MALES / 100 FEMALES
94.56
FEMALES / 100 MALES
46.2
MEDIAN AGE
2.9
AVG FAMILY SIZE
2.5
AVG HOUSEHOLD SIZE
238
LABOR FORCE [ PEOPLE ]
60.3%
PERCENT IN LABOR FORCE
4.7%
UNEMPLOYMENT RATE
Income in St Helena
Income Overview in St Helena
Per Capita Income in St Helena is $35,276, while median incomes of families and households are $78,125 and $73,571 respectively.
| Characteristic | Number | Measure |
| Per Capita Income | 465 | $35,276 |
| Median Family Income | 131 | $78,125 |
| Mean Family Income | 131 | $81,342 |
| Median Household Income | 186 | $73,571 |
| Mean Household Income | 186 | $83,963 |
| Income Deficit | 131 | $0 |
| Wage / Income Gap (%) | 465 | 5.40% |
| Wage / Income Gap ($) | 465 | 94.60¢ per $1 |
| Gini / Inequality Index | 465 | 0.33 |
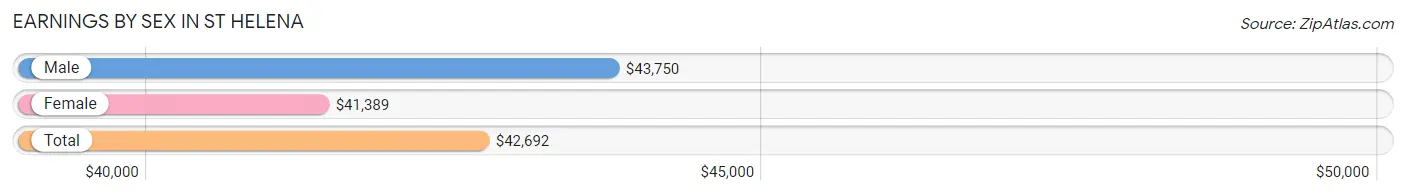
Earnings by Sex in St Helena
Average Earnings in St Helena are $42,692, $43,750 for men and $41,389 for women, a difference of 5.4%.
| Sex | Number | Average Earnings |
| Male | 142 (59.2%) | $43,750 |
| Female | 98 (40.8%) | $41,389 |
| Total | 240 (100.0%) | $42,692 |
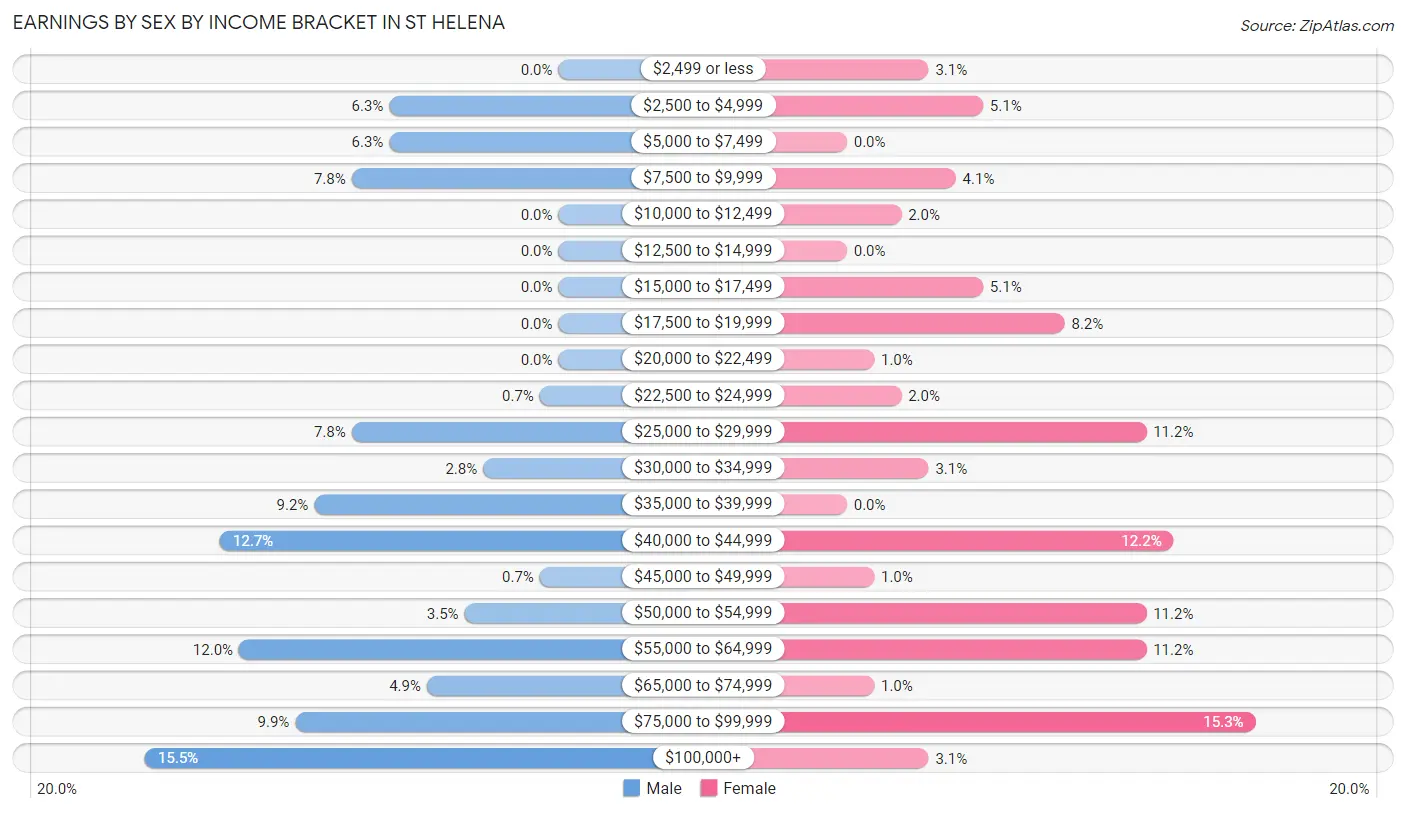
Earnings by Sex by Income Bracket in St Helena
The most common earnings brackets in St Helena are $100,000+ for men (22 | 15.5%) and $75,000 to $99,999 for women (15 | 15.3%).
| Income | Male | Female |
| $2,499 or less | 0 (0.0%) | 3 (3.1%) |
| $2,500 to $4,999 | 9 (6.3%) | 5 (5.1%) |
| $5,000 to $7,499 | 9 (6.3%) | 0 (0.0%) |
| $7,500 to $9,999 | 11 (7.7%) | 4 (4.1%) |
| $10,000 to $12,499 | 0 (0.0%) | 2 (2.0%) |
| $12,500 to $14,999 | 0 (0.0%) | 0 (0.0%) |
| $15,000 to $17,499 | 0 (0.0%) | 5 (5.1%) |
| $17,500 to $19,999 | 0 (0.0%) | 8 (8.2%) |
| $20,000 to $22,499 | 0 (0.0%) | 1 (1.0%) |
| $22,500 to $24,999 | 1 (0.7%) | 2 (2.0%) |
| $25,000 to $29,999 | 11 (7.7%) | 11 (11.2%) |
| $30,000 to $34,999 | 4 (2.8%) | 3 (3.1%) |
| $35,000 to $39,999 | 13 (9.1%) | 0 (0.0%) |
| $40,000 to $44,999 | 18 (12.7%) | 12 (12.2%) |
| $45,000 to $49,999 | 1 (0.7%) | 1 (1.0%) |
| $50,000 to $54,999 | 5 (3.5%) | 11 (11.2%) |
| $55,000 to $64,999 | 17 (12.0%) | 11 (11.2%) |
| $65,000 to $74,999 | 7 (4.9%) | 1 (1.0%) |
| $75,000 to $99,999 | 14 (9.9%) | 15 (15.3%) |
| $100,000+ | 22 (15.5%) | 3 (3.1%) |
| Total | 142 (100.0%) | 98 (100.0%) |
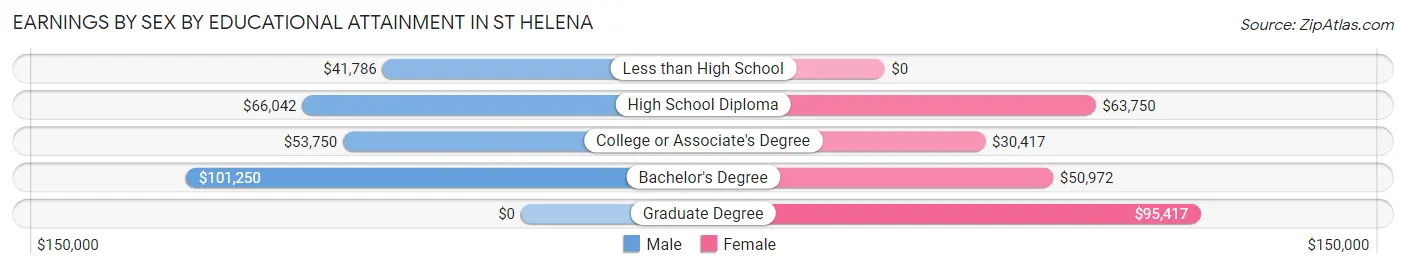
Earnings by Sex by Educational Attainment in St Helena
Average earnings in St Helena are $55,795 for men and $48,750 for women, a difference of 12.6%. Men with an educational attainment of bachelor's degree enjoy the highest average annual earnings of $101,250, while those with less than high school education earn the least with $41,786. Women with an educational attainment of graduate degree earn the most with the average annual earnings of $95,417, while those with college or associate's degree education have the smallest earnings of $30,417.
| Educational Attainment | Male Income | Female Income |
| Less than High School | $41,786 | $0 |
| High School Diploma | $66,042 | $63,750 |
| College or Associate's Degree | $53,750 | $30,417 |
| Bachelor's Degree | $101,250 | $50,972 |
| Graduate Degree | - | - |
| Total | $55,795 | $48,750 |
Family Income in St Helena
Family Income Brackets in St Helena
According to the St Helena family income data, there are 29 families falling into the $75,000 to $99,999 income range, which is the most common income bracket and makes up 22.1% of all families.
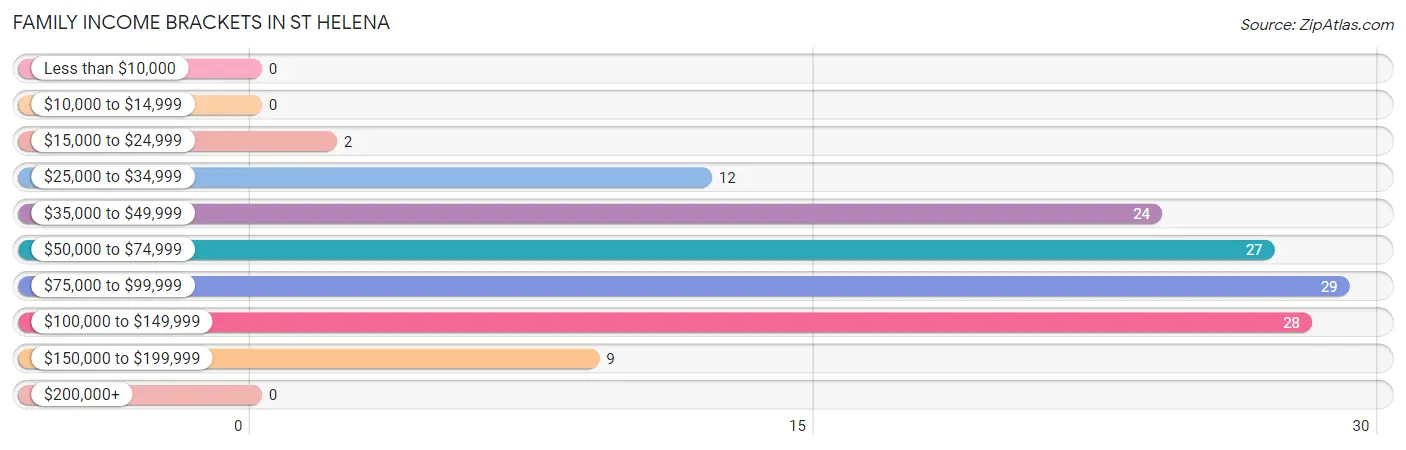
| Income Bracket | # Families | % Families |
| Less than $10,000 | 0 | 0.0% |
| $10,000 to $14,999 | 0 | 0.0% |
| $15,000 to $24,999 | 2 | 1.5% |
| $25,000 to $34,999 | 12 | 9.2% |
| $35,000 to $49,999 | 24 | 18.3% |
| $50,000 to $74,999 | 27 | 20.6% |
| $75,000 to $99,999 | 29 | 22.1% |
| $100,000 to $149,999 | 28 | 21.4% |
| $150,000 to $199,999 | 9 | 6.9% |
| $200,000+ | 0 | 0.0% |
Family Income by Famaliy Size in St Helena
3-person families (34 | 26.0%) account for the highest median family income in St Helena with $91,250 per family, while 2-person families (78 | 59.5%) have the highest median income of $34,375 per family member.
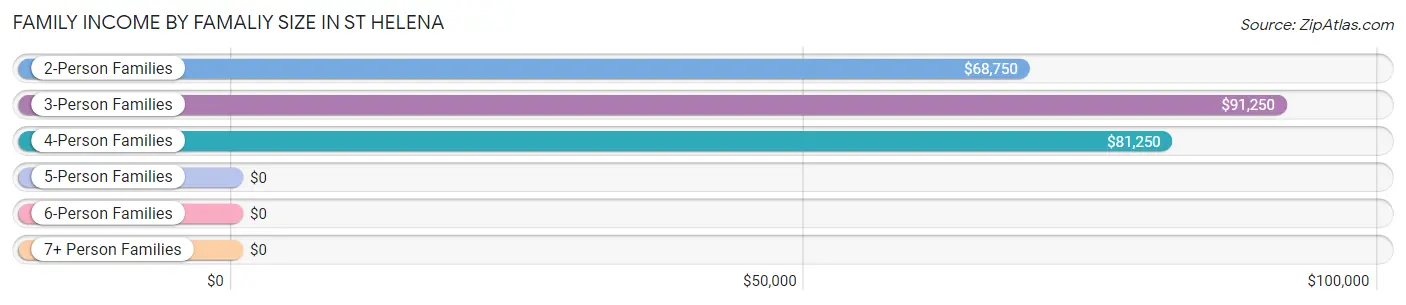
| Income Bracket | # Families | Median Income |
| 2-Person Families | 78 (59.5%) | $68,750 |
| 3-Person Families | 34 (26.0%) | $91,250 |
| 4-Person Families | 12 (9.2%) | $81,250 |
| 5-Person Families | 1 (0.8%) | $0 |
| 6-Person Families | 6 (4.6%) | $0 |
| 7+ Person Families | 0 (0.0%) | $0 |
| Total | 131 (100.0%) | $78,125 |
Family Income by Number of Earners in St Helena
The median family income in St Helena is $78,125, with families comprising 2 earners (47) having the highest median family income of $102,750, while families with 1 earner (48) have the lowest median family income of $50,000, accounting for 35.9% and 36.6% of families, respectively.
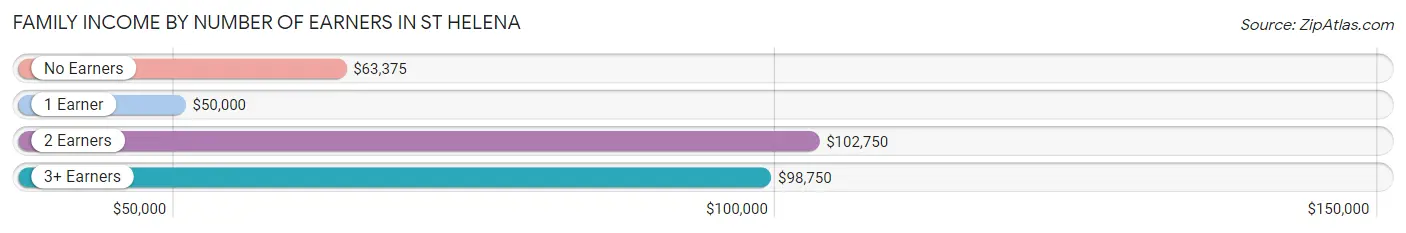
| Number of Earners | # Families | Median Income |
| No Earners | 27 (20.6%) | $63,375 |
| 1 Earner | 48 (36.6%) | $50,000 |
| 2 Earners | 47 (35.9%) | $102,750 |
| 3+ Earners | 9 (6.9%) | $98,750 |
| Total | 131 (100.0%) | $78,125 |
Household Income in St Helena
Household Income Brackets in St Helena
With 43 households falling in the category, the $35,000 to $49,999 income range is the most frequent in St Helena, accounting for 23.1% of all households. In contrast, only 1 households (0.5%) fall into the $10,000 to $14,999 income bracket, making it the least populous group.
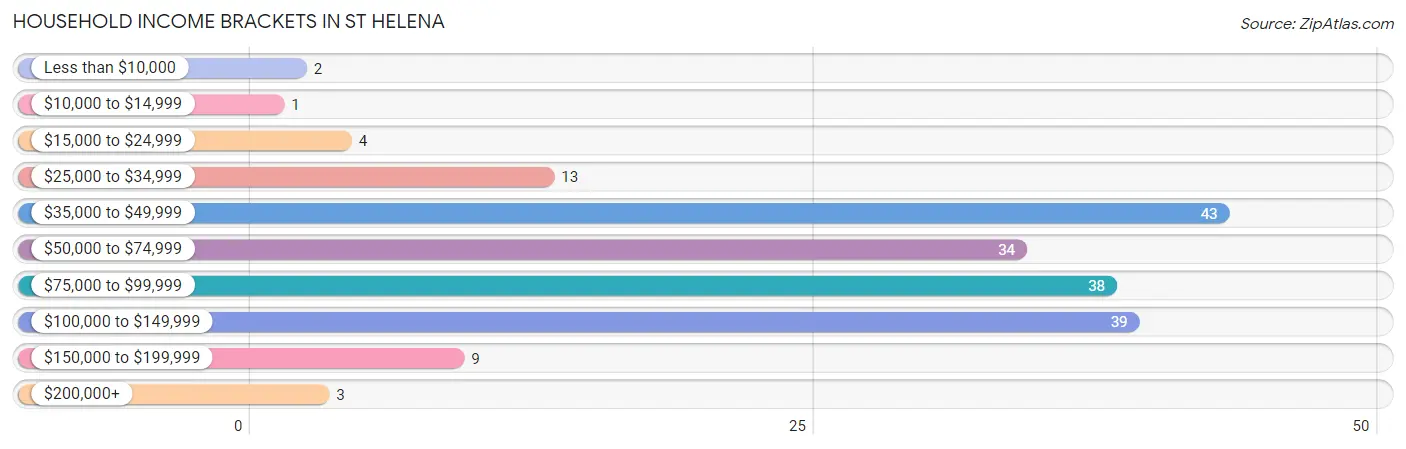
| Income Bracket | # Households | % Households |
| Less than $10,000 | 2 | 1.1% |
| $10,000 to $14,999 | 1 | 0.5% |
| $15,000 to $24,999 | 4 | 2.2% |
| $25,000 to $34,999 | 13 | 7.0% |
| $35,000 to $49,999 | 43 | 23.1% |
| $50,000 to $74,999 | 34 | 18.3% |
| $75,000 to $99,999 | 38 | 20.4% |
| $100,000 to $149,999 | 39 | 21.0% |
| $150,000 to $199,999 | 9 | 4.8% |
| $200,000+ | 3 | 1.6% |
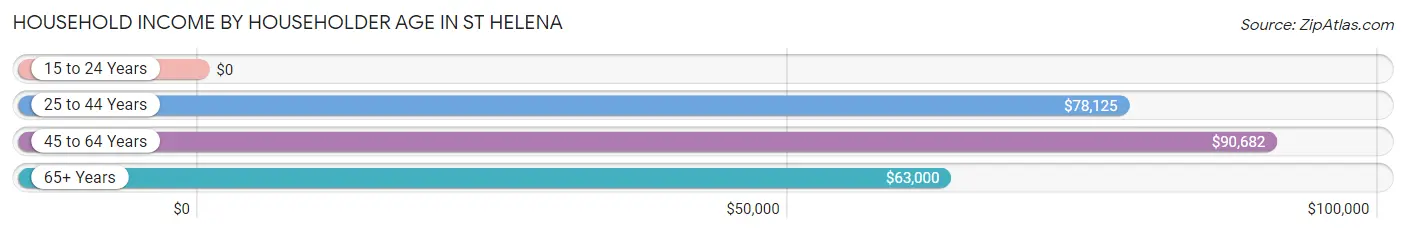
Household Income by Householder Age in St Helena
The median household income in St Helena is $73,571, with the highest median household income of $90,682 found in the 45 to 64 years age bracket for the primary householder. A total of 88 households (47.3%) fall into this category. Meanwhile, the 15 to 24 years age bracket for the primary householder has the lowest median household income of $0, with 3 households (1.6%) in this group.
| Income Bracket | # Households | Median Income |
| 15 to 24 Years | 3 (1.6%) | $0 |
| 25 to 44 Years | 35 (18.8%) | $78,125 |
| 45 to 64 Years | 88 (47.3%) | $90,682 |
| 65+ Years | 60 (32.3%) | $63,000 |
| Total | 186 (100.0%) | $73,571 |
Poverty in St Helena
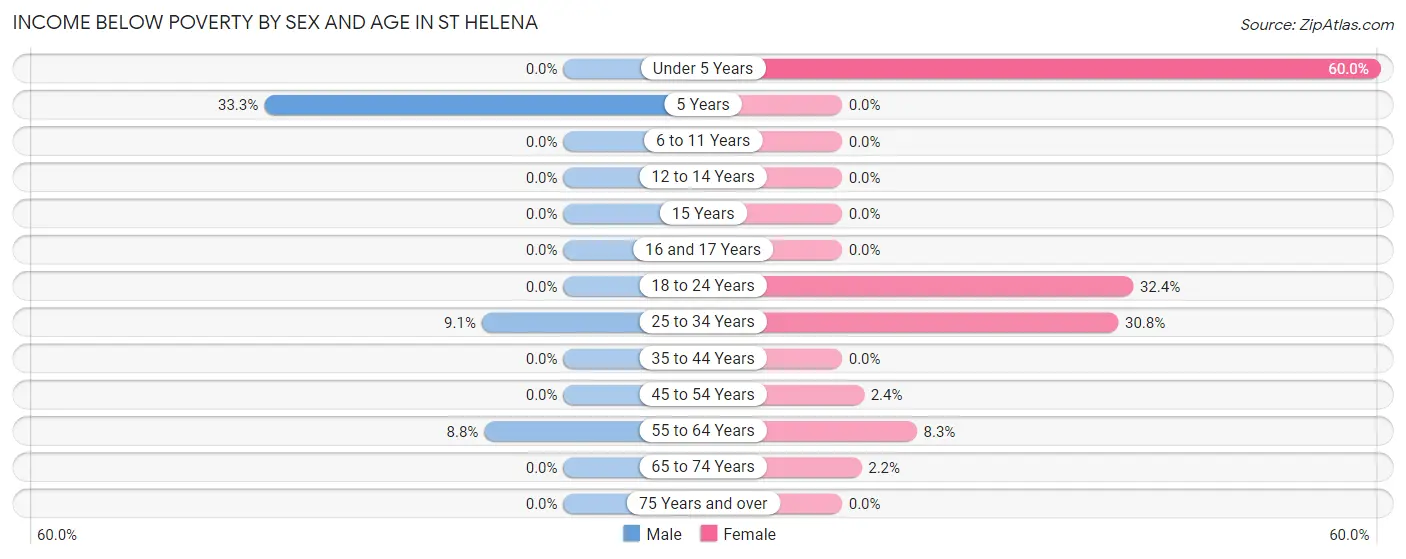
Income Below Poverty by Sex and Age in St Helena
With 3.5% poverty level for males and 10.2% for females among the residents of St Helena, 5 year old males and under 5 year old females are the most vulnerable to poverty, with 3 males (33.3%) and 3 females (60.0%) in their respective age groups living below the poverty level.
| Age Bracket | Male | Female |
| Under 5 Years | 0 (0.0%) | 3 (60.0%) |
| 5 Years | 3 (33.3%) | 0 (0.0%) |
| 6 to 11 Years | 0 (0.0%) | 0 (0.0%) |
| 12 to 14 Years | 0 (0.0%) | 0 (0.0%) |
| 15 Years | 0 (0.0%) | 0 (0.0%) |
| 16 and 17 Years | 0 (0.0%) | 0 (0.0%) |
| 18 to 24 Years | 0 (0.0%) | 12 (32.4%) |
| 25 to 34 Years | 2 (9.1%) | 4 (30.8%) |
| 35 to 44 Years | 0 (0.0%) | 0 (0.0%) |
| 45 to 54 Years | 0 (0.0%) | 1 (2.4%) |
| 55 to 64 Years | 3 (8.8%) | 2 (8.3%) |
| 65 to 74 Years | 0 (0.0%) | 1 (2.2%) |
| 75 Years and over | 0 (0.0%) | 0 (0.0%) |
| Total | 8 (3.5%) | 23 (10.2%) |
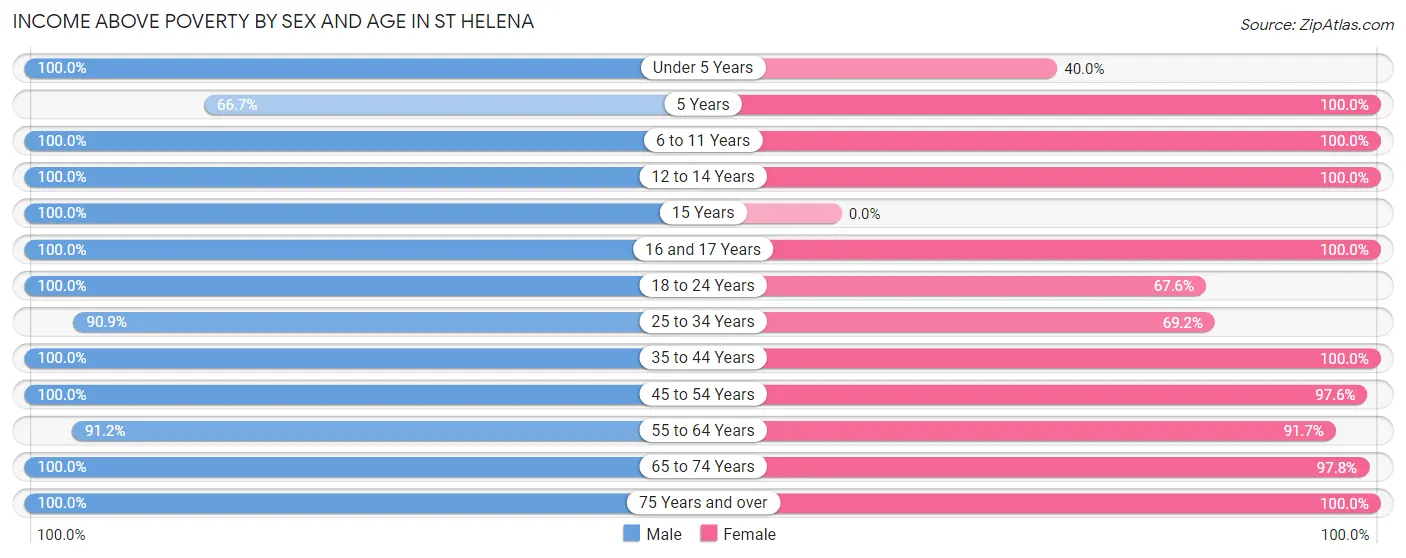
Income Above Poverty by Sex and Age in St Helena
According to the poverty statistics in St Helena, males aged under 5 years and females aged 5 years are the age groups that are most secure financially, with 100.0% of males and 100.0% of females in these age groups living above the poverty line.
| Age Bracket | Male | Female |
| Under 5 Years | 12 (100.0%) | 2 (40.0%) |
| 5 Years | 6 (66.7%) | 4 (100.0%) |
| 6 to 11 Years | 3 (100.0%) | 5 (100.0%) |
| 12 to 14 Years | 4 (100.0%) | 18 (100.0%) |
| 15 Years | 1 (100.0%) | 0 (0.0%) |
| 16 and 17 Years | 7 (100.0%) | 6 (100.0%) |
| 18 to 24 Years | 32 (100.0%) | 25 (67.6%) |
| 25 to 34 Years | 20 (90.9%) | 9 (69.2%) |
| 35 to 44 Years | 21 (100.0%) | 15 (100.0%) |
| 45 to 54 Years | 38 (100.0%) | 40 (97.6%) |
| 55 to 64 Years | 31 (91.2%) | 22 (91.7%) |
| 65 to 74 Years | 34 (100.0%) | 45 (97.8%) |
| 75 Years and over | 13 (100.0%) | 12 (100.0%) |
| Total | 222 (96.5%) | 203 (89.8%) |
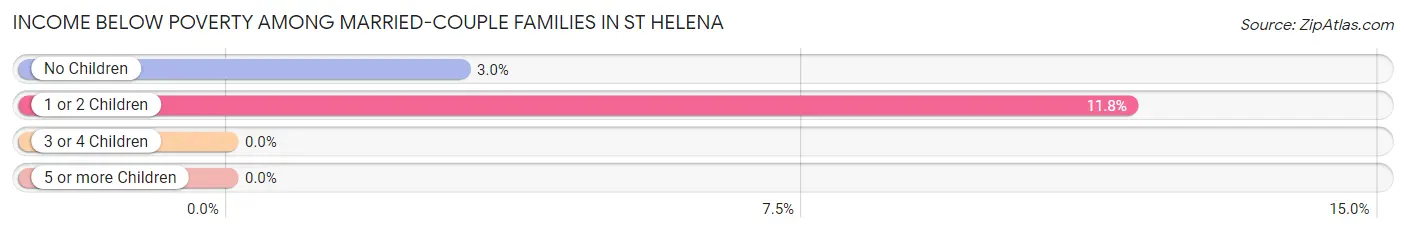
Income Below Poverty Among Married-Couple Families in St Helena
The poverty statistics for married-couple families in St Helena show that 5.9% or 6 of the total 101 families live below the poverty line. Families with 1 or 2 children have the highest poverty rate of 11.8%, comprising of 4 families. On the other hand, families with 3 or 4 children have the lowest poverty rate of 0.0%, which includes 0 families.
| Children | Above Poverty | Below Poverty |
| No Children | 64 (97.0%) | 2 (3.0%) |
| 1 or 2 Children | 30 (88.2%) | 4 (11.8%) |
| 3 or 4 Children | 1 (100.0%) | 0 (0.0%) |
| 5 or more Children | 0 (0.0%) | 0 (0.0%) |
| Total | 95 (94.1%) | 6 (5.9%) |
Income Below Poverty Among Single-Parent Households in St Helena
| Children | Single Father | Single Mother |
| No Children | 0 (0.0%) | 0 (0.0%) |
| 1 or 2 Children | 0 (0.0%) | 0 (0.0%) |
| 3 or 4 Children | 0 (0.0%) | 0 (0.0%) |
| 5 or more Children | 0 (0.0%) | 0 (0.0%) |
| Total | 0 (0.0%) | 0 (0.0%) |
Income Below Poverty Among Married-Couple vs Single-Parent Households in St Helena
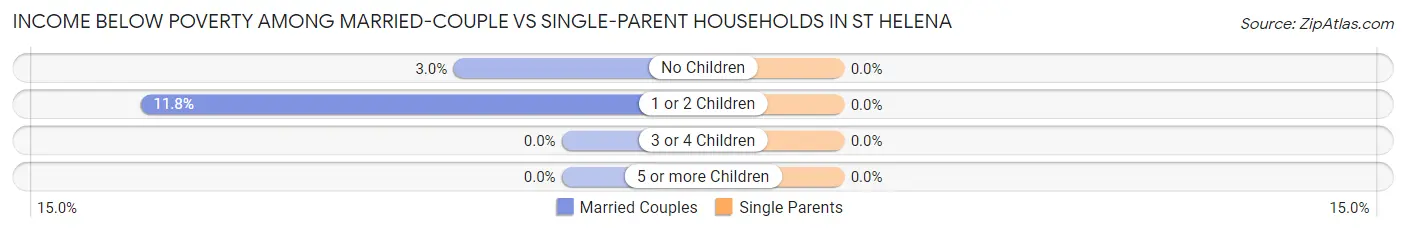
| Children | Married-Couple Families | Single-Parent Households |
| No Children | 2 (3.0%) | 0 (0.0%) |
| 1 or 2 Children | 4 (11.8%) | 0 (0.0%) |
| 3 or 4 Children | 0 (0.0%) | 0 (0.0%) |
| 5 or more Children | 0 (0.0%) | 0 (0.0%) |
| Total | 6 (5.9%) | 0 (0.0%) |
Race in St Helena
The most populous races in St Helena are White / Caucasian (270 | 58.1%), Black / African American (96 | 20.6%), and Two or more Races (49 | 10.5%).
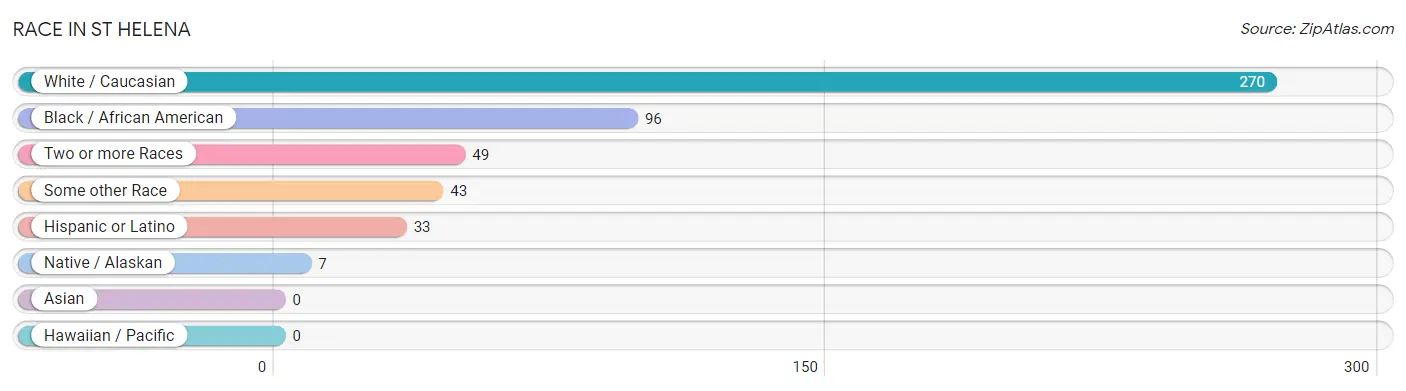
| Race | # Population | % Population |
| Asian | 0 | 0.0% |
| Black / African American | 96 | 20.6% |
| Hawaiian / Pacific | 0 | 0.0% |
| Hispanic or Latino | 33 | 7.1% |
| Native / Alaskan | 7 | 1.5% |
| White / Caucasian | 270 | 58.1% |
| Two or more Races | 49 | 10.5% |
| Some other Race | 43 | 9.2% |
| Total | 465 | 100.0% |
Ancestry in St Helena
The most populous ancestries reported in St Helena are English (42 | 9.0%), Mexican (33 | 7.1%), Italian (32 | 6.9%), Irish (25 | 5.4%), and American (24 | 5.2%), together accounting for 33.5% of all St Helena residents.
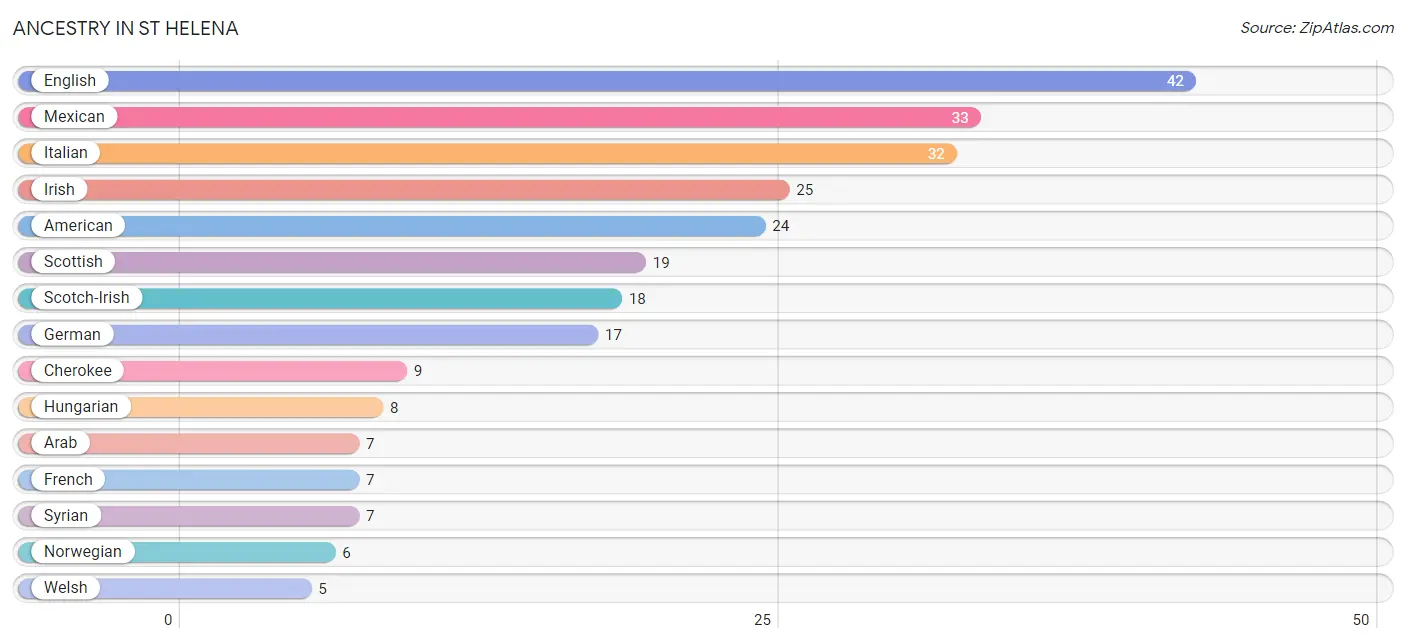
| Ancestry | # Population | % Population |
| African | 4 | 0.9% |
| American | 24 | 5.2% |
| Arab | 7 | 1.5% |
| Belgian | 2 | 0.4% |
| Cherokee | 9 | 1.9% |
| Czech | 1 | 0.2% |
| English | 42 | 9.0% |
| French | 7 | 1.5% |
| German | 17 | 3.7% |
| Greek | 2 | 0.4% |
| Hungarian | 8 | 1.7% |
| Iranian | 1 | 0.2% |
| Irish | 25 | 5.4% |
| Italian | 32 | 6.9% |
| Mexican | 33 | 7.1% |
| Norwegian | 6 | 1.3% |
| Polish | 1 | 0.2% |
| Russian | 2 | 0.4% |
| Scotch-Irish | 18 | 3.9% |
| Scottish | 19 | 4.1% |
| Subsaharan African | 4 | 0.9% |
| Syrian | 7 | 1.5% |
| Ukrainian | 2 | 0.4% |
| Welsh | 5 | 1.1% | View All 24 Rows |
Immigrants in St Helena
The most numerous immigrant groups reported in St Helena came from Latin America (15 | 3.2%), South America (11 | 2.4%), Asia (7 | 1.5%), Western Asia (7 | 1.5%), and Argentina (6 | 1.3%), together accounting for 9.9% of all St Helena residents.
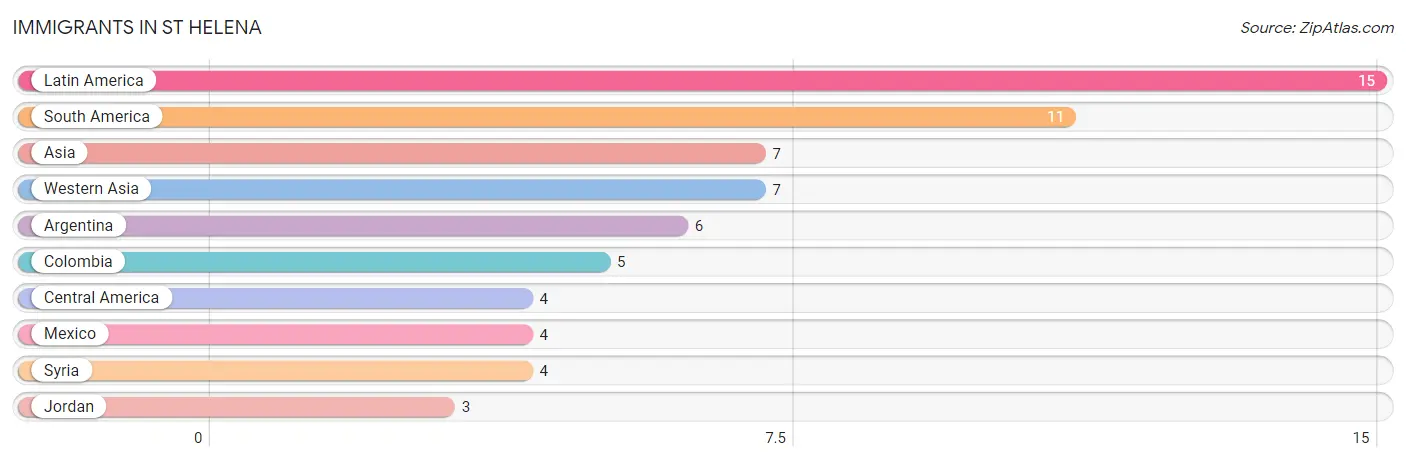
| Immigration Origin | # Population | % Population |
| Argentina | 6 | 1.3% |
| Asia | 7 | 1.5% |
| Central America | 4 | 0.9% |
| Colombia | 5 | 1.1% |
| Jordan | 3 | 0.6% |
| Latin America | 15 | 3.2% |
| Mexico | 4 | 0.9% |
| South America | 11 | 2.4% |
| Syria | 4 | 0.9% |
| Western Asia | 7 | 1.5% | View All 10 Rows |
Sex and Age in St Helena
Sex and Age in St Helena
The most populous age groups in St Helena are 20 to 24 Years (22 | 9.2%) for men and 20 to 24 Years (25 | 11.1%) for women.
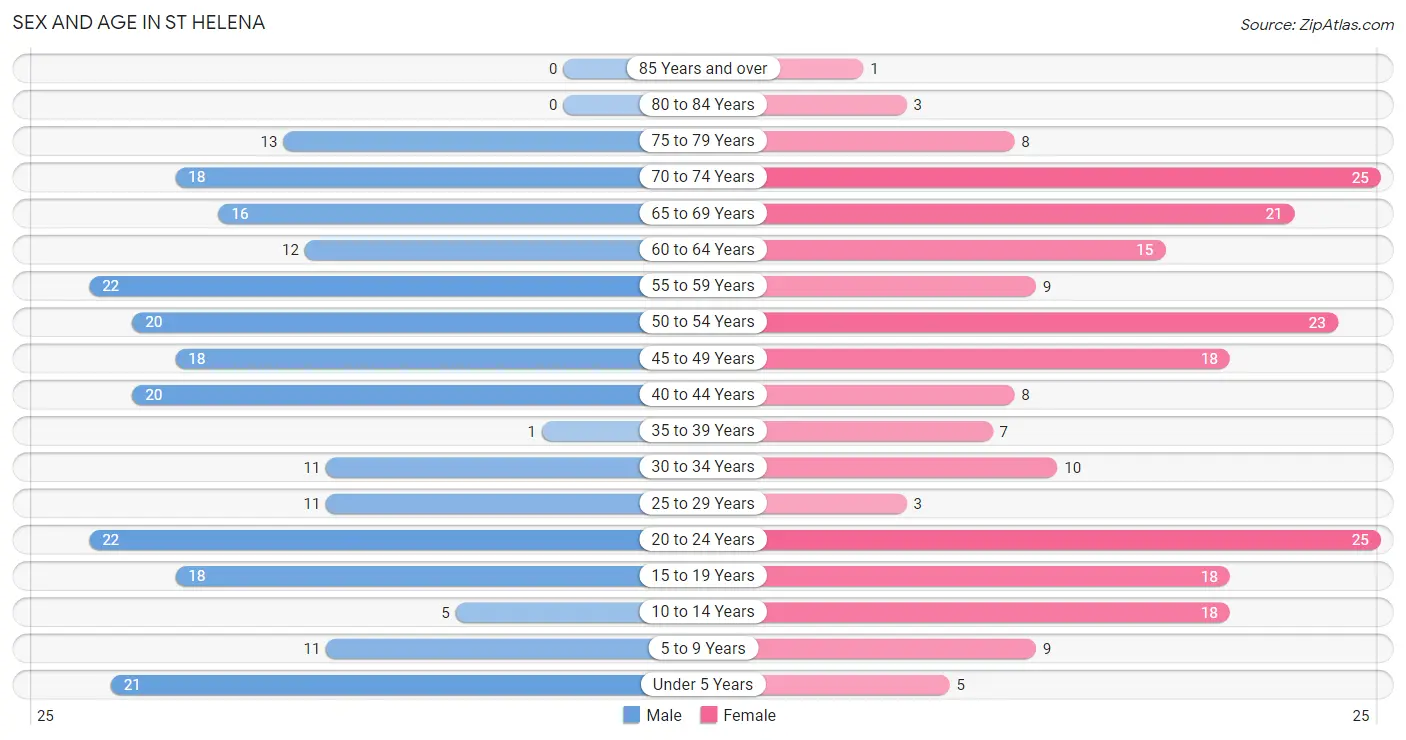
| Age Bracket | Male | Female |
| Under 5 Years | 21 (8.8%) | 5 (2.2%) |
| 5 to 9 Years | 11 (4.6%) | 9 (4.0%) |
| 10 to 14 Years | 5 (2.1%) | 18 (8.0%) |
| 15 to 19 Years | 18 (7.5%) | 18 (8.0%) |
| 20 to 24 Years | 22 (9.2%) | 25 (11.1%) |
| 25 to 29 Years | 11 (4.6%) | 3 (1.3%) |
| 30 to 34 Years | 11 (4.6%) | 10 (4.4%) |
| 35 to 39 Years | 1 (0.4%) | 7 (3.1%) |
| 40 to 44 Years | 20 (8.4%) | 8 (3.5%) |
| 45 to 49 Years | 18 (7.5%) | 18 (8.0%) |
| 50 to 54 Years | 20 (8.4%) | 23 (10.2%) |
| 55 to 59 Years | 22 (9.2%) | 9 (4.0%) |
| 60 to 64 Years | 12 (5.0%) | 15 (6.6%) |
| 65 to 69 Years | 16 (6.7%) | 21 (9.3%) |
| 70 to 74 Years | 18 (7.5%) | 25 (11.1%) |
| 75 to 79 Years | 13 (5.4%) | 8 (3.5%) |
| 80 to 84 Years | 0 (0.0%) | 3 (1.3%) |
| 85 Years and over | 0 (0.0%) | 1 (0.4%) |
| Total | 239 (100.0%) | 226 (100.0%) |
Families and Households in St Helena
Median Family Size in St Helena
The median family size in St Helena is 2.91 persons per family, with married-couple families (101 | 77.1%) accounting for the largest median family size of 3.05 persons per family. On the other hand, single male/father families (11 | 8.4%) represent the smallest median family size with 2.27 persons per family.
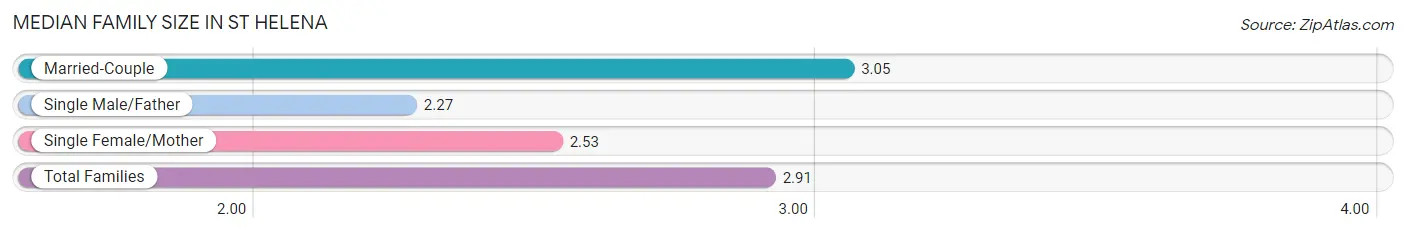
| Family Type | # Families | Family Size |
| Married-Couple | 101 (77.1%) | 3.05 |
| Single Male/Father | 11 (8.4%) | 2.27 |
| Single Female/Mother | 19 (14.5%) | 2.53 |
| Total Families | 131 (100.0%) | 2.91 |
Median Household Size in St Helena
The median household size in St Helena is 2.50 persons per household, with married-couple households (101 | 54.3%) accounting for the largest median household size of 3.25 persons per household. non-family households (55 | 29.6%) represent the smallest median household size with 1.07 persons per household.
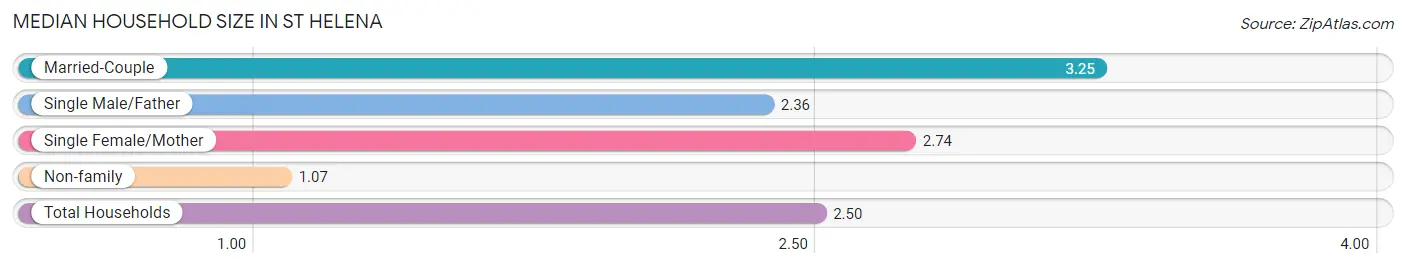
| Household Type | # Households | Household Size |
| Married-Couple | 101 (54.3%) | 3.25 |
| Single Male/Father | 11 (5.9%) | 2.36 |
| Single Female/Mother | 19 (10.2%) | 2.74 |
| Non-family | 55 (29.6%) | 1.07 |
| Total Households | 186 (100.0%) | 2.50 |
Household Size by Marriage Status in St Helena
Out of a total of 186 households in St Helena, 131 (70.4%) are family households, while 55 (29.6%) are nonfamily households. The most numerous type of family households are 2-person households, comprising 68, and the most common type of nonfamily households are 1-person households, comprising 52.
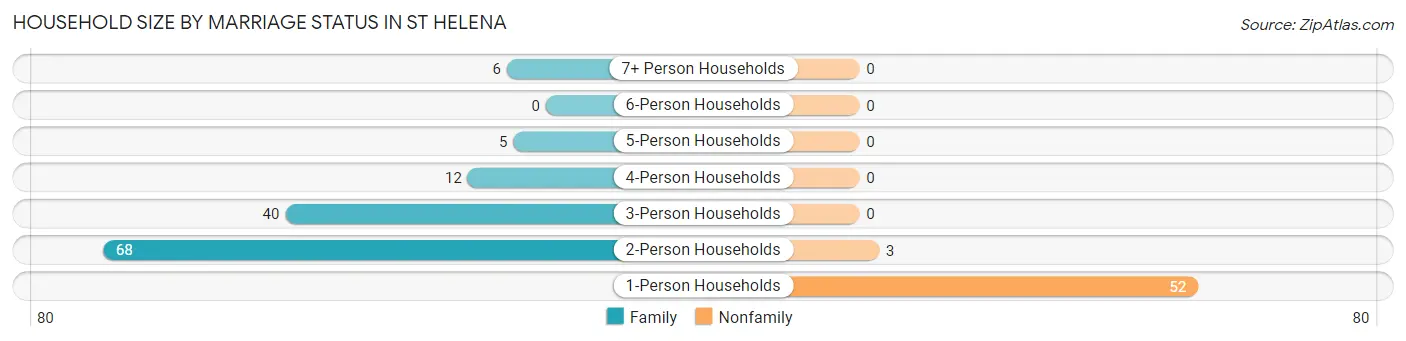
| Household Size | Family Households | Nonfamily Households |
| 1-Person Households | - | 52 (28.0%) |
| 2-Person Households | 68 (36.6%) | 3 (1.6%) |
| 3-Person Households | 40 (21.5%) | 0 (0.0%) |
| 4-Person Households | 12 (6.5%) | 0 (0.0%) |
| 5-Person Households | 5 (2.7%) | 0 (0.0%) |
| 6-Person Households | 0 (0.0%) | 0 (0.0%) |
| 7+ Person Households | 6 (3.2%) | 0 (0.0%) |
| Total | 131 (70.4%) | 55 (29.6%) |
Female Fertility in St Helena
Fertility by Age in St Helena
Average fertility rate in St Helena is 157.0 births per 1,000 women. Women in the age bracket of 20 to 34 years have the highest fertility rate with 368.0 births per 1,000 women. Women in the age bracket of 20 to 34 years acount for 100.0% of all women with births.
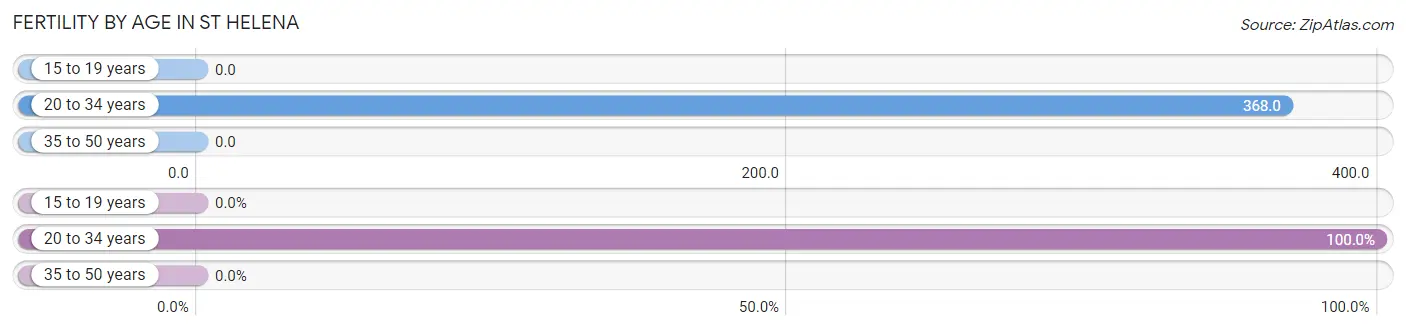
| Age Bracket | Women with Births | Births / 1,000 Women |
| 15 to 19 years | 0 (0.0%) | 0.0 |
| 20 to 34 years | 14 (100.0%) | 368.0 |
| 35 to 50 years | 0 (0.0%) | 0.0 |
| Total | 14 (100.0%) | 157.0 |
Fertility by Age by Marriage Status in St Helena
28.6% of women with births (14) in St Helena are married. The highest percentage of unmarried women with births falls into 20 to 34 years age bracket with 71.4% of them unmarried at the time of birth, while the lowest percentage of unmarried women with births belong to 20 to 34 years age bracket with 71.4% of them unmarried.
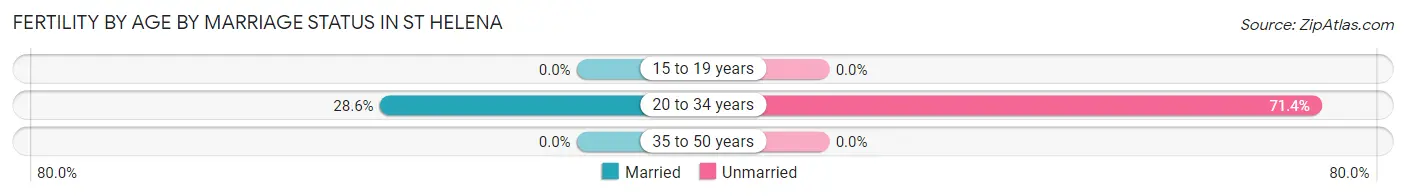
| Age Bracket | Married | Unmarried |
| 15 to 19 years | 0 (0.0%) | 0 (0.0%) |
| 20 to 34 years | 4 (28.6%) | 10 (71.4%) |
| 35 to 50 years | 0 (0.0%) | 0 (0.0%) |
| Total | 4 (28.6%) | 10 (71.4%) |
Fertility by Education in St Helena
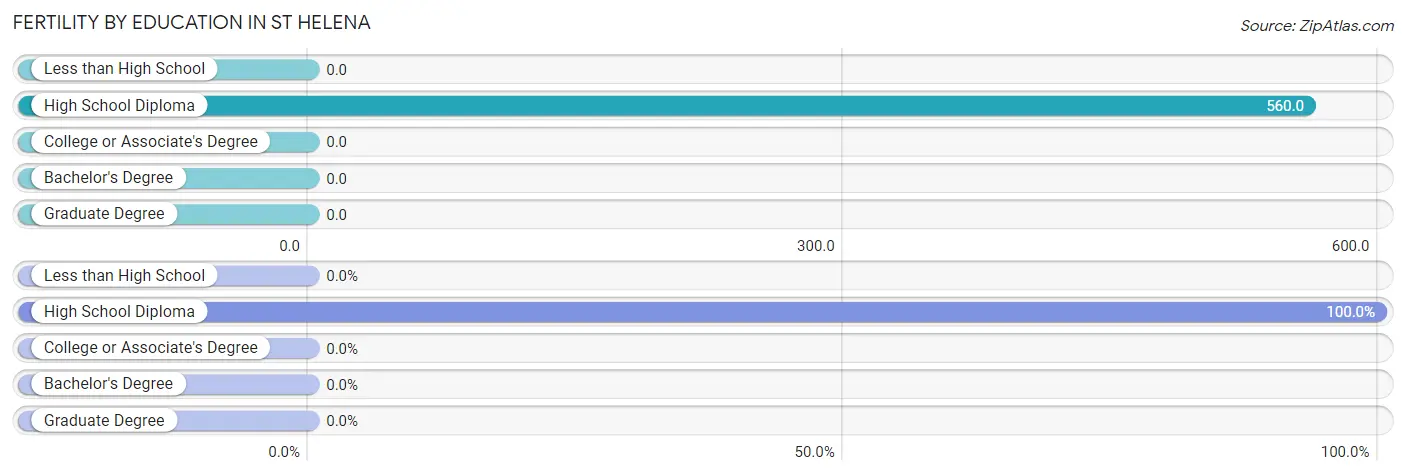
| Educational Attainment | Women with Births | Births / 1,000 Women |
| Less than High School | 0 (0.0%) | 0.0 |
| High School Diploma | 14 (100.0%) | 560.0 |
| College or Associate's Degree | 0 (0.0%) | 0.0 |
| Bachelor's Degree | 0 (0.0%) | 0.0 |
| Graduate Degree | 0 (0.0%) | 0.0 |
| Total | 14 (100.0%) | 157.0 |
Fertility by Education by Marriage Status in St Helena
71.4% of women with births in St Helena are unmarried. Women with the educational attainment of high school diploma are most likely to be married with 28.6% of them married at childbirth, while women with the educational attainment of high school diploma are least likely to be married with 71.4% of them unmarried at childbirth.
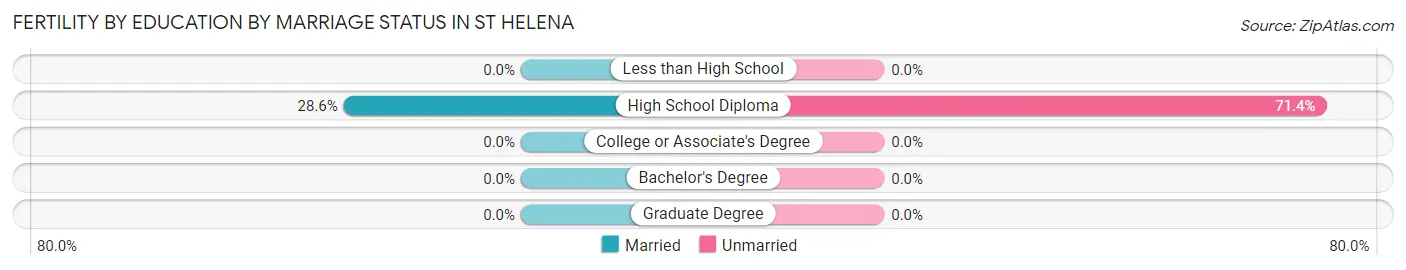
| Educational Attainment | Married | Unmarried |
| Less than High School | 0 (0.0%) | 0 (0.0%) |
| High School Diploma | 4 (28.6%) | 10 (71.4%) |
| College or Associate's Degree | 0 (0.0%) | 0 (0.0%) |
| Bachelor's Degree | 0 (0.0%) | 0 (0.0%) |
| Graduate Degree | 0 (0.0%) | 0 (0.0%) |
| Total | 4 (28.6%) | 10 (71.4%) |
Employment Characteristics in St Helena
Employment by Class of Employer in St Helena
Among the 223 employed individuals in St Helena, private company employees (146 | 65.5%), local government employees (23 | 10.3%), and self-employed (incorporated) (16 | 7.2%) make up the most common classes of employment.
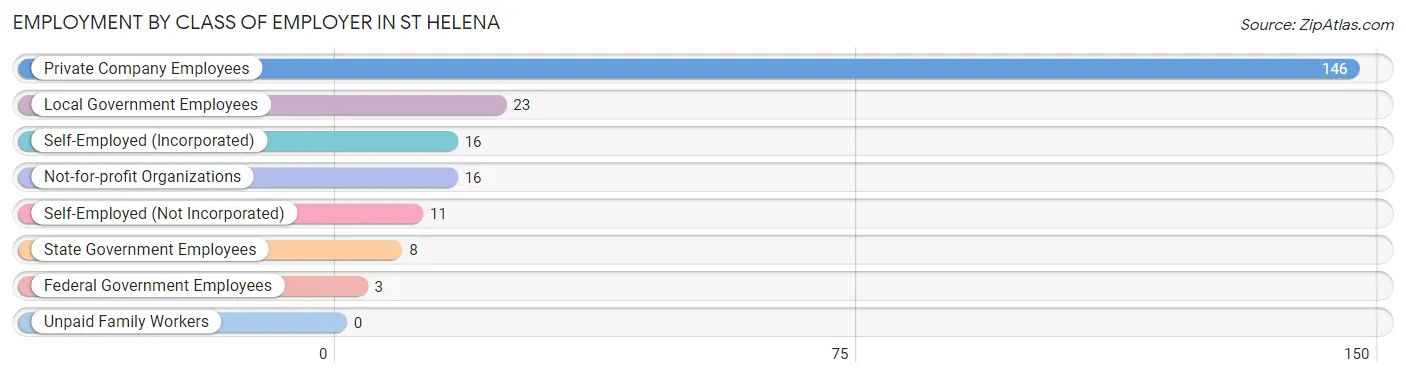
| Employer Class | # Employees | % Employees |
| Private Company Employees | 146 | 65.5% |
| Self-Employed (Incorporated) | 16 | 7.2% |
| Self-Employed (Not Incorporated) | 11 | 4.9% |
| Not-for-profit Organizations | 16 | 7.2% |
| Local Government Employees | 23 | 10.3% |
| State Government Employees | 8 | 3.6% |
| Federal Government Employees | 3 | 1.3% |
| Unpaid Family Workers | 0 | 0.0% |
| Total | 223 | 100.0% |
Employment Status by Age in St Helena
According to the labor force statistics for St Helena, out of the total population over 16 years of age (395), 60.3% or 238 individuals are in the labor force, with 4.7% or 11 of them unemployed. The age group with the highest labor force participation rate is 25 to 29 years, with 100.0% or 14 individuals in the labor force. Within the labor force, the 25 to 29 years age range has the highest percentage of unemployed individuals, with 41.7% or 6 of them being unemployed.
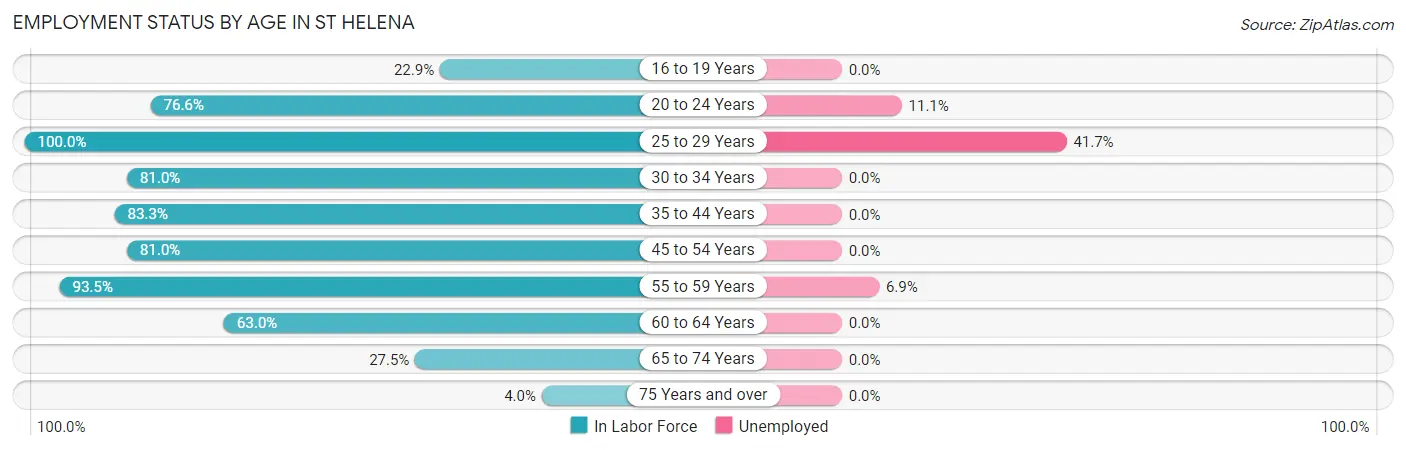
| Age Bracket | In Labor Force | Unemployed |
| 16 to 19 Years | 8 (22.9%) | 0 (0.0%) |
| 20 to 24 Years | 36 (76.6%) | 4 (11.1%) |
| 25 to 29 Years | 14 (100.0%) | 6 (41.7%) |
| 30 to 34 Years | 17 (81.0%) | 0 (0.0%) |
| 35 to 44 Years | 30 (83.3%) | 0 (0.0%) |
| 45 to 54 Years | 64 (81.0%) | 0 (0.0%) |
| 55 to 59 Years | 29 (93.5%) | 2 (6.9%) |
| 60 to 64 Years | 17 (63.0%) | 0 (0.0%) |
| 65 to 74 Years | 22 (27.5%) | 0 (0.0%) |
| 75 Years and over | 1 (4.0%) | 0 (0.0%) |
| Total | 238 (60.3%) | 11 (4.7%) |
Employment Status by Educational Attainment in St Helena
According to labor force statistics for St Helena, 82.2% of individuals (171) out of the total population between 25 and 64 years of age (208) are in the labor force, with 4.1% or 7 of them being unemployed. The group with the highest labor force participation rate are those with the educational attainment of less than high school, with 100.0% or 22 individuals in the labor force. Within the labor force, individuals with college / associate degree education have the highest percentage of unemployment, with 9.3% or 7 of them being unemployed.
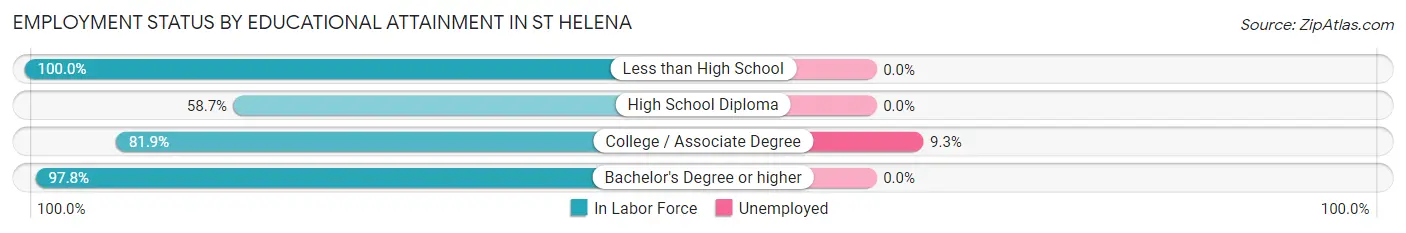
| Educational Attainment | In Labor Force | Unemployed |
| Less than High School | 22 (100.0%) | 0 (0.0%) |
| High School Diploma | 27 (58.7%) | 0 (0.0%) |
| College / Associate Degree | 77 (81.9%) | 9 (9.3%) |
| Bachelor's Degree or higher | 45 (97.8%) | 0 (0.0%) |
| Total | 171 (82.2%) | 9 (4.1%) |
Employment Occupations by Sex in St Helena
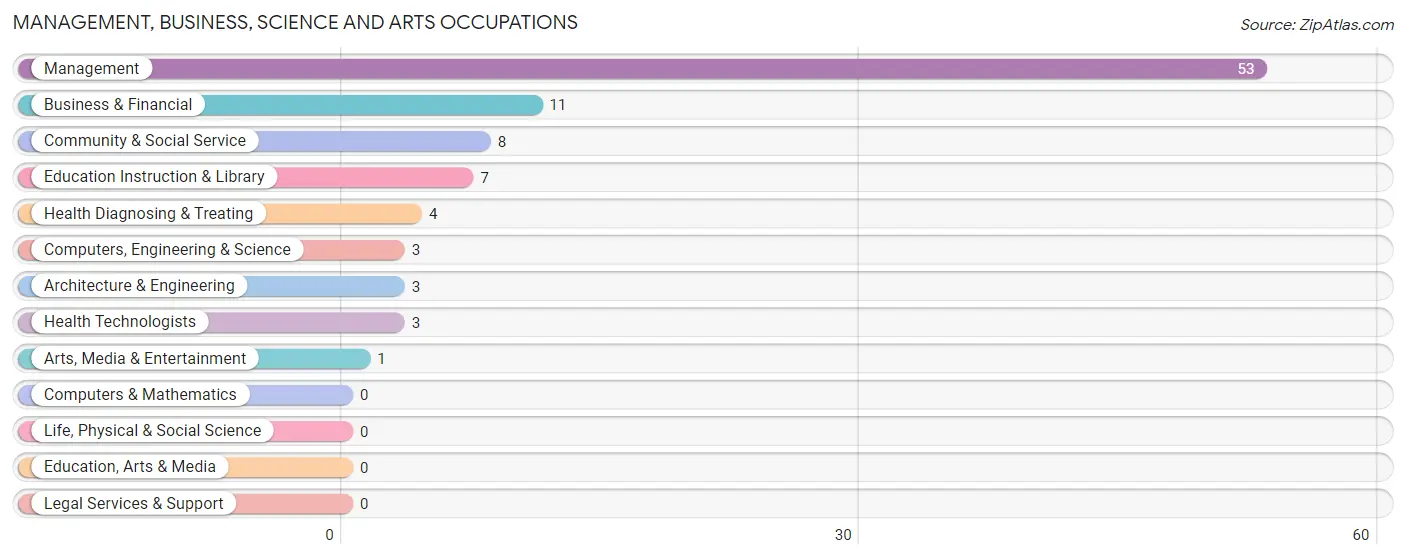
Management, Business, Science and Arts Occupations
The most common Management, Business, Science and Arts occupations in St Helena are Management (53 | 23.6%), Business & Financial (11 | 4.9%), Community & Social Service (8 | 3.6%), Education Instruction & Library (7 | 3.1%), and Health Diagnosing & Treating (4 | 1.8%).
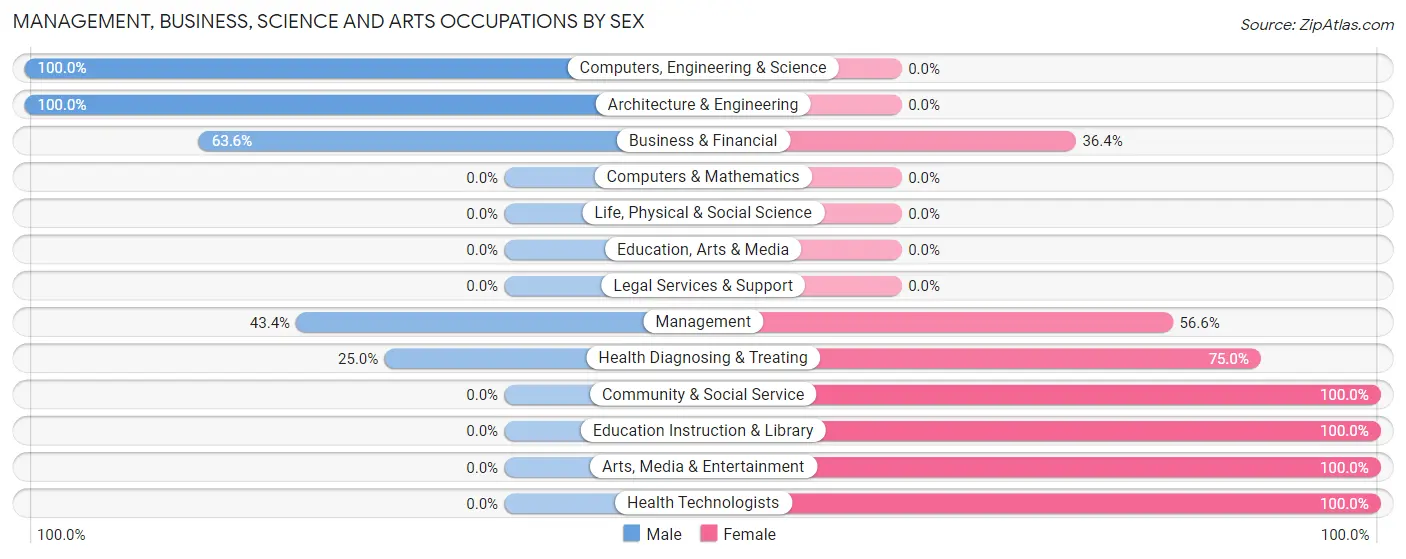
Management, Business, Science and Arts Occupations by Sex
Within the Management, Business, Science and Arts occupations in St Helena, the most male-oriented occupations are Computers, Engineering & Science (100.0%), Architecture & Engineering (100.0%), and Business & Financial (63.6%), while the most female-oriented occupations are Community & Social Service (100.0%), Education Instruction & Library (100.0%), and Arts, Media & Entertainment (100.0%).
| Occupation | Male | Female |
| Management | 23 (43.4%) | 30 (56.6%) |
| Business & Financial | 7 (63.6%) | 4 (36.4%) |
| Computers, Engineering & Science | 3 (100.0%) | 0 (0.0%) |
| Computers & Mathematics | 0 (0.0%) | 0 (0.0%) |
| Architecture & Engineering | 3 (100.0%) | 0 (0.0%) |
| Life, Physical & Social Science | 0 (0.0%) | 0 (0.0%) |
| Community & Social Service | 0 (0.0%) | 8 (100.0%) |
| Education, Arts & Media | 0 (0.0%) | 0 (0.0%) |
| Legal Services & Support | 0 (0.0%) | 0 (0.0%) |
| Education Instruction & Library | 0 (0.0%) | 7 (100.0%) |
| Arts, Media & Entertainment | 0 (0.0%) | 1 (100.0%) |
| Health Diagnosing & Treating | 1 (25.0%) | 3 (75.0%) |
| Health Technologists | 0 (0.0%) | 3 (100.0%) |
| Total (Category) | 34 (43.0%) | 45 (57.0%) |
| Total (Overall) | 133 (59.1%) | 92 (40.9%) |
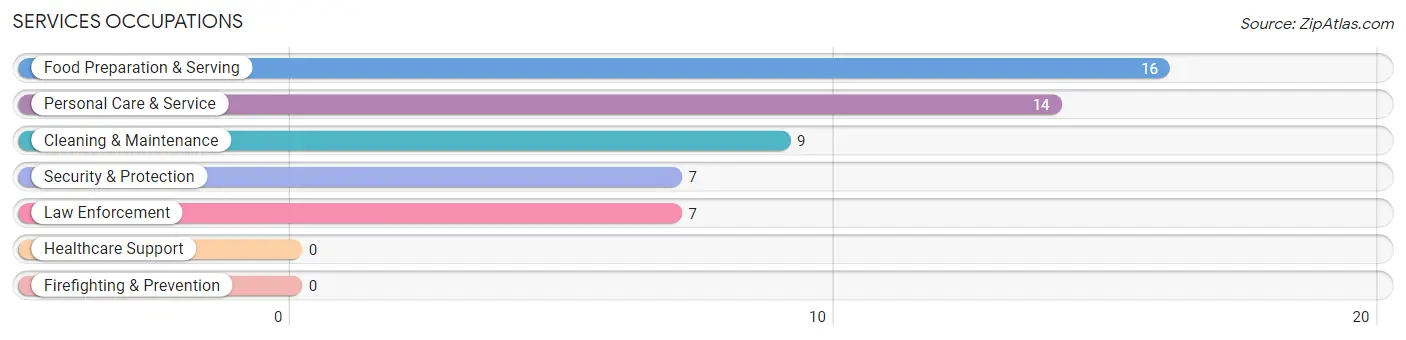
Services Occupations
The most common Services occupations in St Helena are Food Preparation & Serving (16 | 7.1%), Personal Care & Service (14 | 6.2%), Cleaning & Maintenance (9 | 4.0%), Security & Protection (7 | 3.1%), and Law Enforcement (7 | 3.1%).
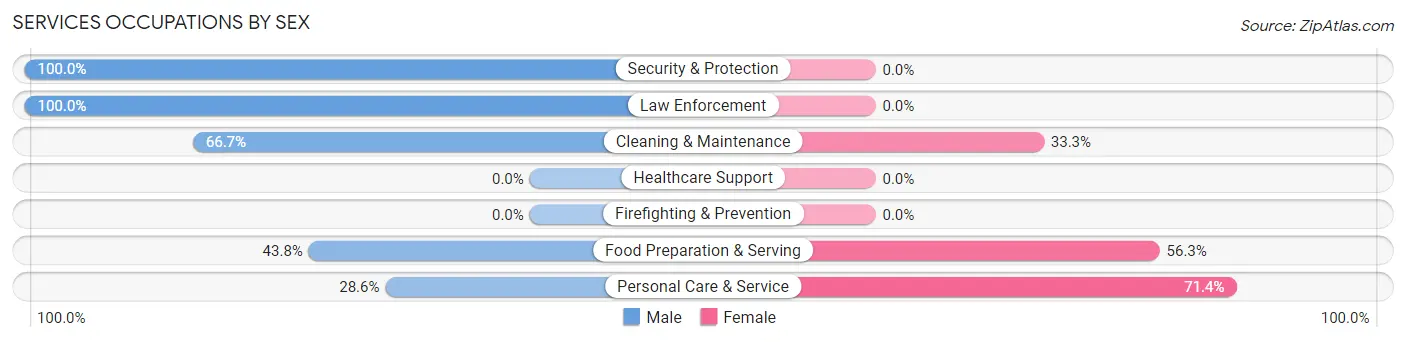
Services Occupations by Sex
Within the Services occupations in St Helena, the most male-oriented occupations are Security & Protection (100.0%), Law Enforcement (100.0%), and Cleaning & Maintenance (66.7%), while the most female-oriented occupations are Personal Care & Service (71.4%), Food Preparation & Serving (56.2%), and Cleaning & Maintenance (33.3%).
| Occupation | Male | Female |
| Healthcare Support | 0 (0.0%) | 0 (0.0%) |
| Security & Protection | 7 (100.0%) | 0 (0.0%) |
| Firefighting & Prevention | 0 (0.0%) | 0 (0.0%) |
| Law Enforcement | 7 (100.0%) | 0 (0.0%) |
| Food Preparation & Serving | 7 (43.8%) | 9 (56.2%) |
| Cleaning & Maintenance | 6 (66.7%) | 3 (33.3%) |
| Personal Care & Service | 4 (28.6%) | 10 (71.4%) |
| Total (Category) | 24 (52.2%) | 22 (47.8%) |
| Total (Overall) | 133 (59.1%) | 92 (40.9%) |
Sales and Office Occupations
The most common Sales and Office occupations in St Helena are Sales & Related (29 | 12.9%), and Office & Administration (10 | 4.4%).
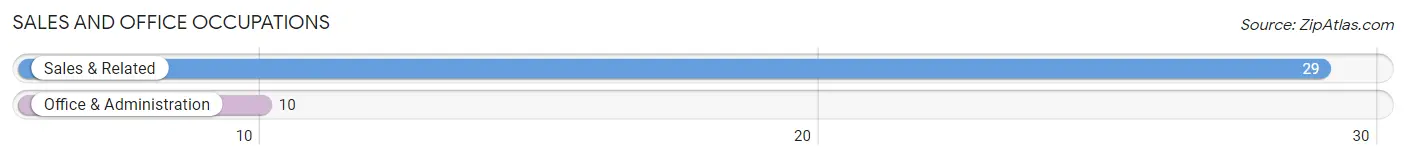
Sales and Office Occupations by Sex
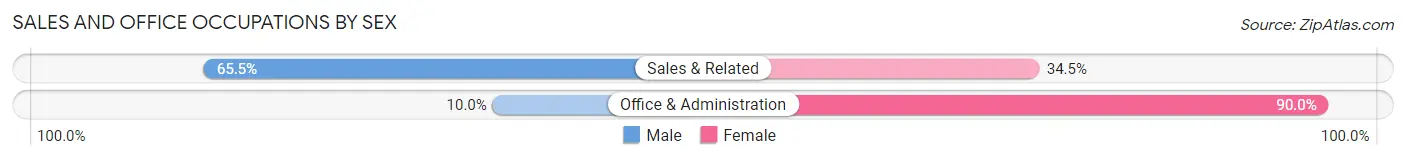
| Occupation | Male | Female |
| Sales & Related | 19 (65.5%) | 10 (34.5%) |
| Office & Administration | 1 (10.0%) | 9 (90.0%) |
| Total (Category) | 20 (51.3%) | 19 (48.7%) |
| Total (Overall) | 133 (59.1%) | 92 (40.9%) |
Natural Resources, Construction and Maintenance Occupations
The most common Natural Resources, Construction and Maintenance occupations in St Helena are Construction & Extraction (26 | 11.6%), Installation, Maintenance & Repair (11 | 4.9%), and Farming, Fishing & Forestry (2 | 0.9%).
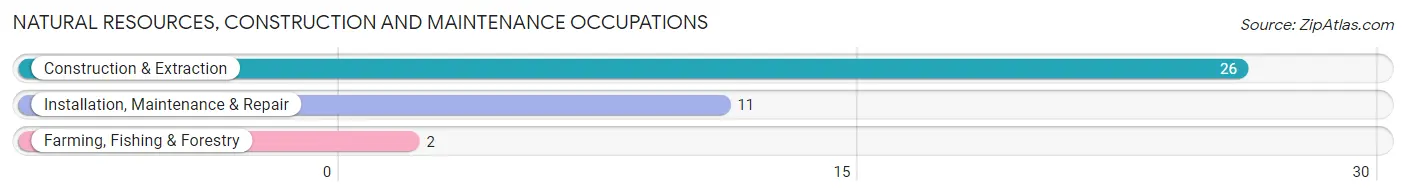
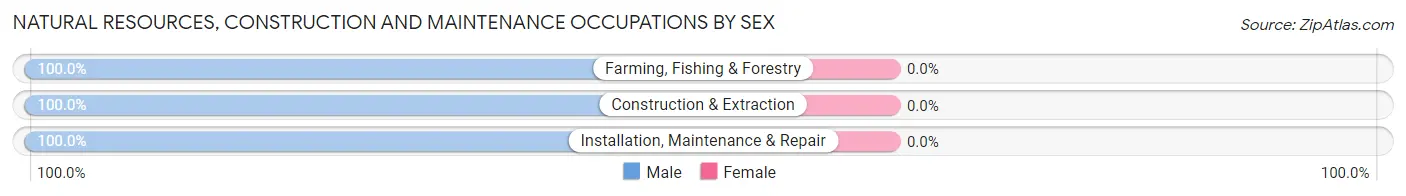
Natural Resources, Construction and Maintenance Occupations by Sex
| Occupation | Male | Female |
| Farming, Fishing & Forestry | 2 (100.0%) | 0 (0.0%) |
| Construction & Extraction | 26 (100.0%) | 0 (0.0%) |
| Installation, Maintenance & Repair | 11 (100.0%) | 0 (0.0%) |
| Total (Category) | 39 (100.0%) | 0 (0.0%) |
| Total (Overall) | 133 (59.1%) | 92 (40.9%) |
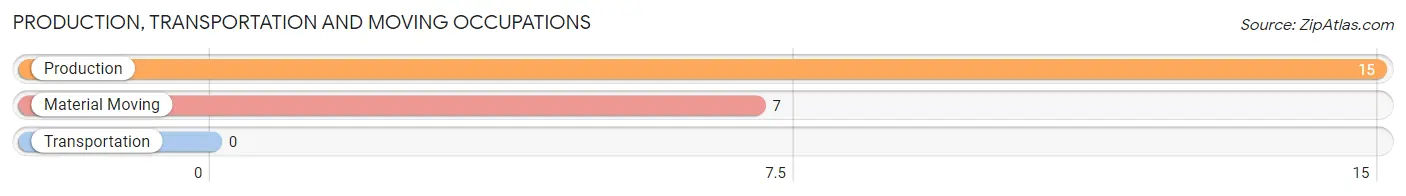
Production, Transportation and Moving Occupations
The most common Production, Transportation and Moving occupations in St Helena are Production (15 | 6.7%), and Material Moving (7 | 3.1%).
Production, Transportation and Moving Occupations by Sex
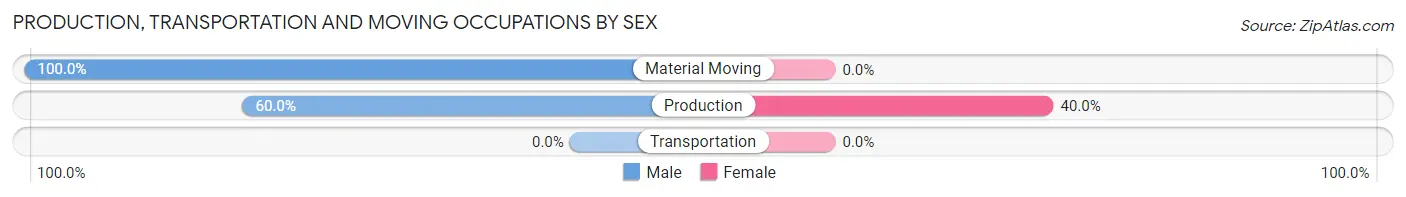
| Occupation | Male | Female |
| Production | 9 (60.0%) | 6 (40.0%) |
| Transportation | 0 (0.0%) | 0 (0.0%) |
| Material Moving | 7 (100.0%) | 0 (0.0%) |
| Total (Category) | 16 (72.7%) | 6 (27.3%) |
| Total (Overall) | 133 (59.1%) | 92 (40.9%) |
Employment Industries by Sex in St Helena
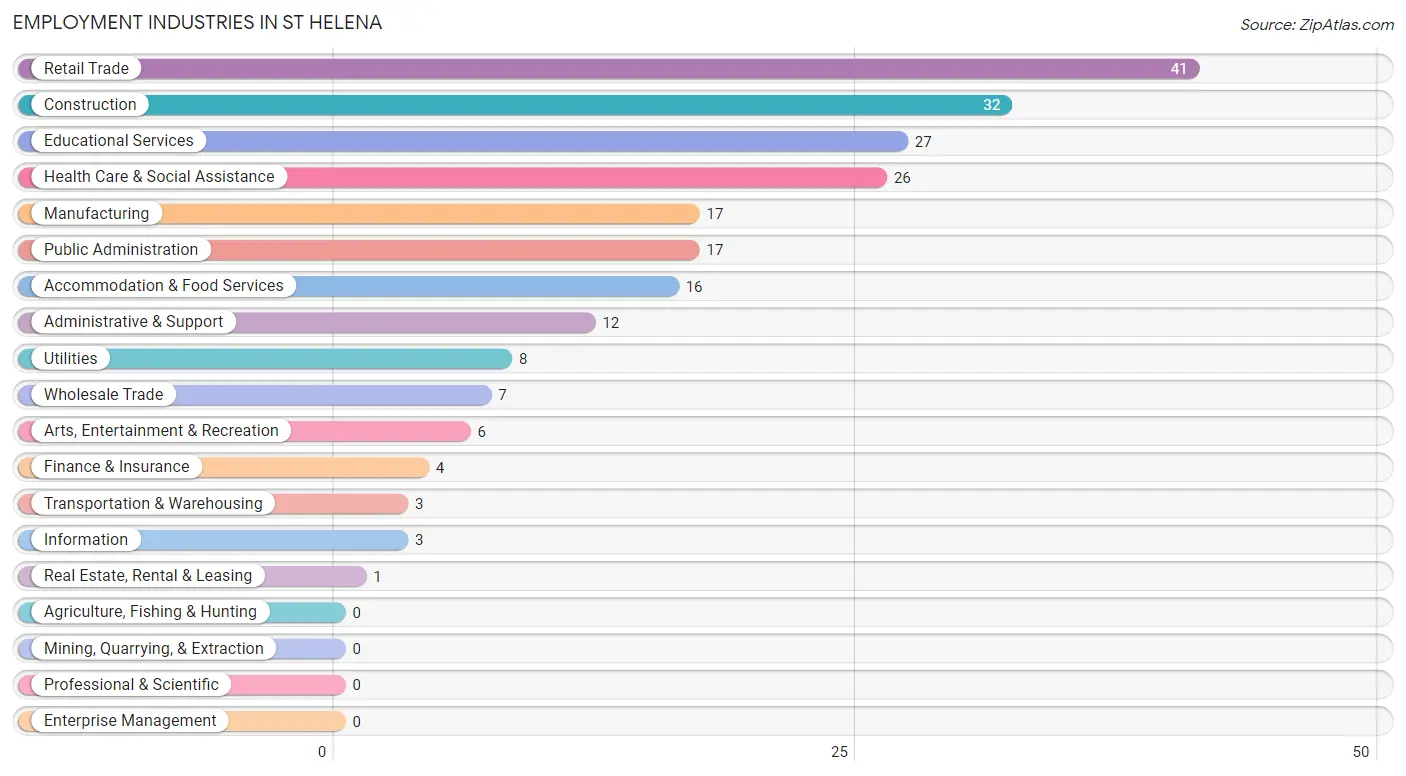
Employment Industries in St Helena
The major employment industries in St Helena include Retail Trade (41 | 18.2%), Construction (32 | 14.2%), Educational Services (27 | 12.0%), Health Care & Social Assistance (26 | 11.6%), and Manufacturing (17 | 7.6%).
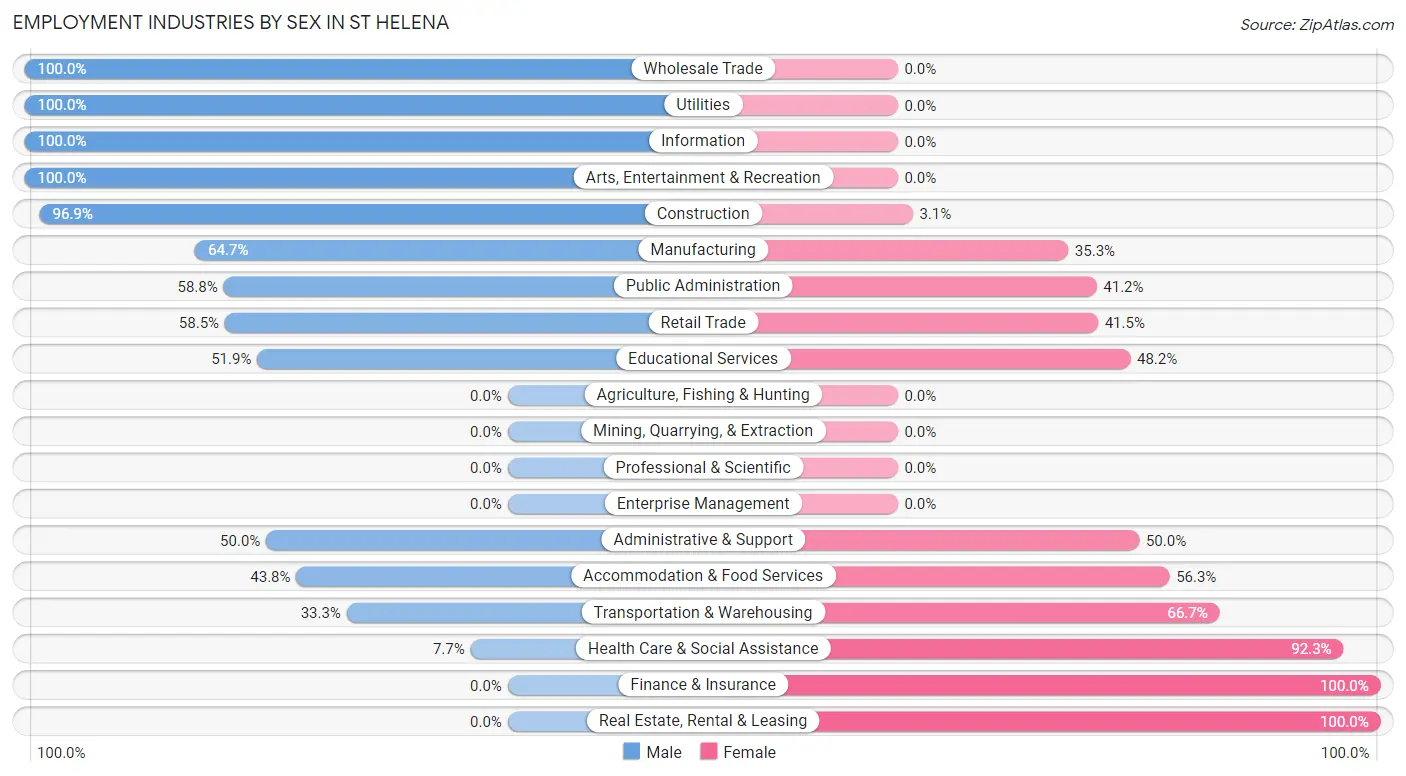
Employment Industries by Sex in St Helena
The St Helena industries that see more men than women are Wholesale Trade (100.0%), Utilities (100.0%), and Information (100.0%), whereas the industries that tend to have a higher number of women are Finance & Insurance (100.0%), Real Estate, Rental & Leasing (100.0%), and Health Care & Social Assistance (92.3%).
| Industry | Male | Female |
| Agriculture, Fishing & Hunting | 0 (0.0%) | 0 (0.0%) |
| Mining, Quarrying, & Extraction | 0 (0.0%) | 0 (0.0%) |
| Construction | 31 (96.9%) | 1 (3.1%) |
| Manufacturing | 11 (64.7%) | 6 (35.3%) |
| Wholesale Trade | 7 (100.0%) | 0 (0.0%) |
| Retail Trade | 24 (58.5%) | 17 (41.5%) |
| Transportation & Warehousing | 1 (33.3%) | 2 (66.7%) |
| Utilities | 8 (100.0%) | 0 (0.0%) |
| Information | 3 (100.0%) | 0 (0.0%) |
| Finance & Insurance | 0 (0.0%) | 4 (100.0%) |
| Real Estate, Rental & Leasing | 0 (0.0%) | 1 (100.0%) |
| Professional & Scientific | 0 (0.0%) | 0 (0.0%) |
| Enterprise Management | 0 (0.0%) | 0 (0.0%) |
| Administrative & Support | 6 (50.0%) | 6 (50.0%) |
| Educational Services | 14 (51.8%) | 13 (48.1%) |
| Health Care & Social Assistance | 2 (7.7%) | 24 (92.3%) |
| Arts, Entertainment & Recreation | 6 (100.0%) | 0 (0.0%) |
| Accommodation & Food Services | 7 (43.8%) | 9 (56.2%) |
| Public Administration | 10 (58.8%) | 7 (41.2%) |
| Total | 133 (59.1%) | 92 (40.9%) |
Education in St Helena
School Enrollment in St Helena
The most common levels of schooling among the 83 students in St Helena are high school (25 | 30.1%), middle school (22 | 26.5%), and college / undergraduate (17 | 20.5%).
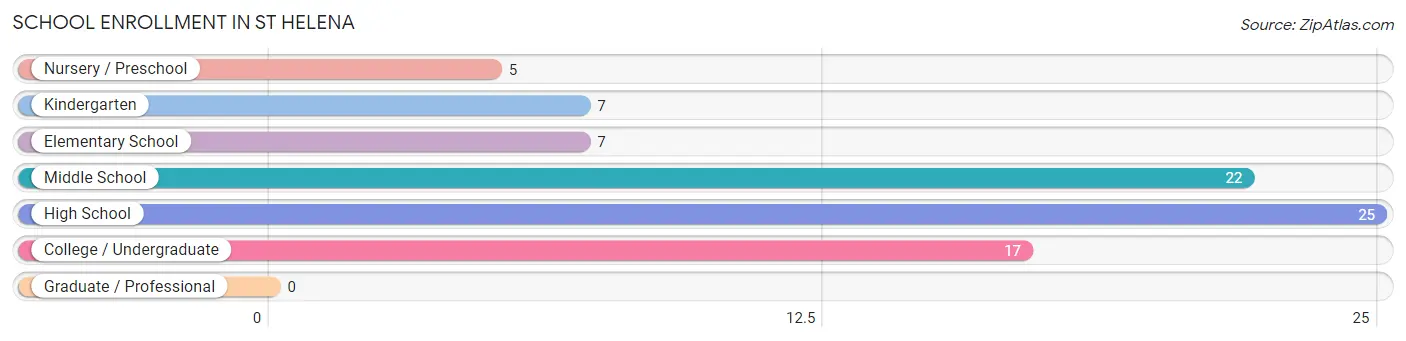
| School Level | # Students | % Students |
| Nursery / Preschool | 5 | 6.0% |
| Kindergarten | 7 | 8.4% |
| Elementary School | 7 | 8.4% |
| Middle School | 22 | 26.5% |
| High School | 25 | 30.1% |
| College / Undergraduate | 17 | 20.5% |
| Graduate / Professional | 0 | 0.0% |
| Total | 83 | 100.0% |
School Enrollment by Age by Funding Source in St Helena
Out of a total of 83 students who are enrolled in schools in St Helena, 2 (2.4%) attend a private institution, while the remaining 81 (97.6%) are enrolled in public schools. The age group of 5 to 9 year old has the highest likelihood of being enrolled in private schools, with 2 (11.8% in the age bracket) enrolled. Conversely, the age group of 3 to 4 year olds has the lowest likelihood of being enrolled in a private school, with 1 (100.0% in the age bracket) attending a public institution.
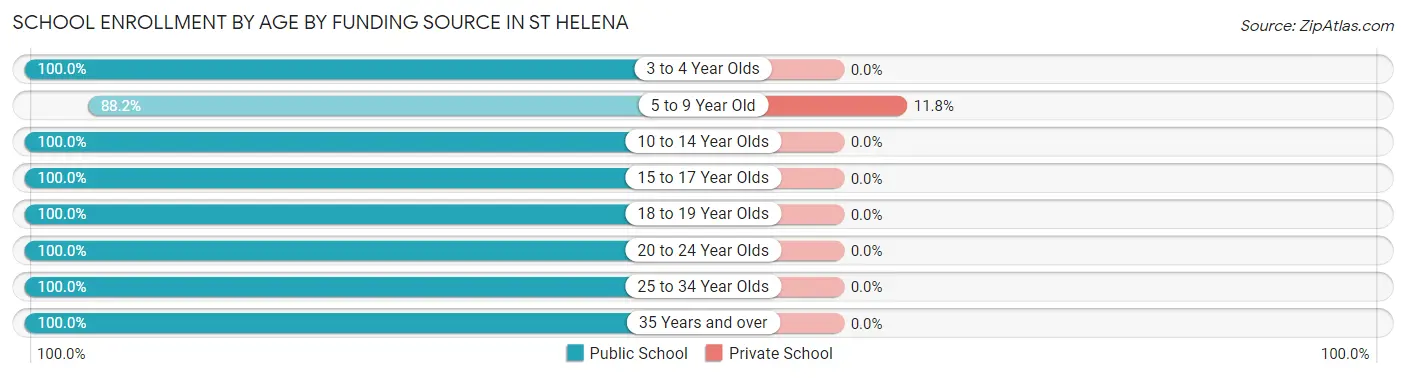
| Age Bracket | Public School | Private School |
| 3 to 4 Year Olds | 1 (100.0%) | 0 (0.0%) |
| 5 to 9 Year Old | 15 (88.2%) | 2 (11.8%) |
| 10 to 14 Year Olds | 23 (100.0%) | 0 (0.0%) |
| 15 to 17 Year Olds | 14 (100.0%) | 0 (0.0%) |
| 18 to 19 Year Olds | 22 (100.0%) | 0 (0.0%) |
| 20 to 24 Year Olds | 1 (100.0%) | 0 (0.0%) |
| 25 to 34 Year Olds | 4 (100.0%) | 0 (0.0%) |
| 35 Years and over | 1 (100.0%) | 0 (0.0%) |
| Total | 81 (97.6%) | 2 (2.4%) |
Educational Attainment by Field of Study in St Helena
Education (31 | 28.2%), social sciences (18 | 16.4%), business (14 | 12.7%), bio, nature & agricultural (9 | 8.2%), and multidisciplinary studies (9 | 8.2%) are the most common fields of study among 110 individuals in St Helena who have obtained a bachelor's degree or higher.
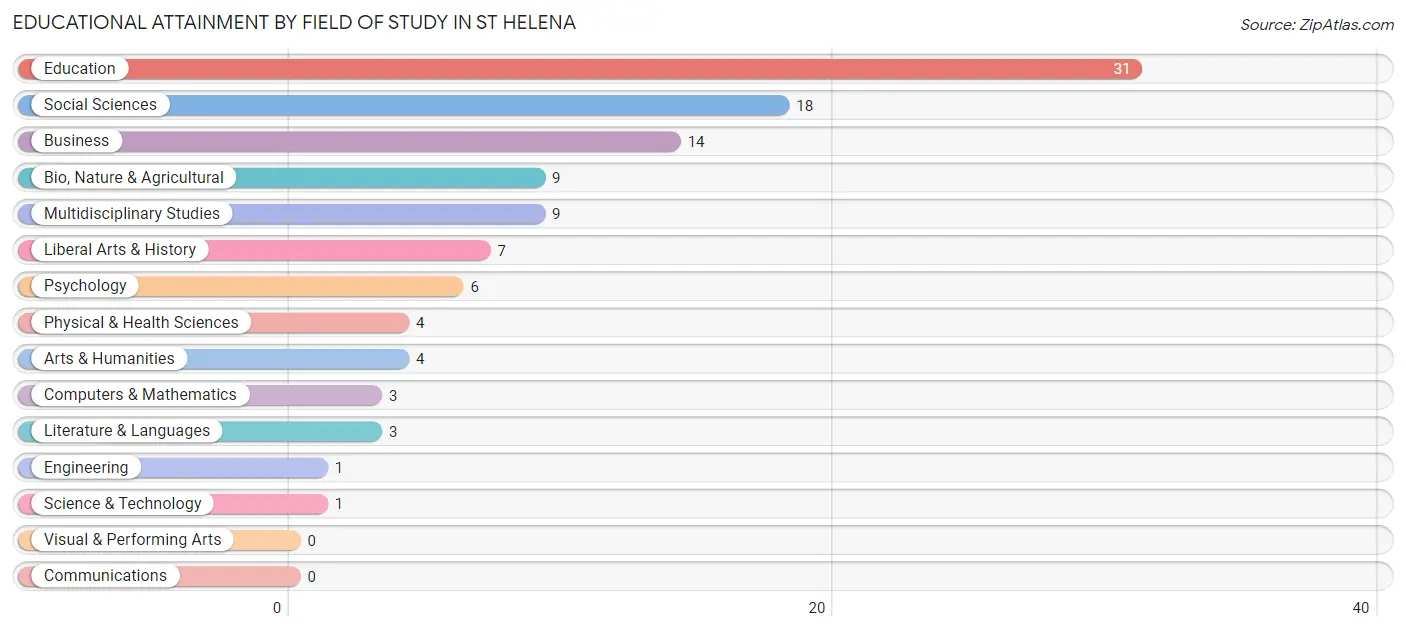
| Field of Study | # Graduates | % Graduates |
| Computers & Mathematics | 3 | 2.7% |
| Bio, Nature & Agricultural | 9 | 8.2% |
| Physical & Health Sciences | 4 | 3.6% |
| Psychology | 6 | 5.4% |
| Social Sciences | 18 | 16.4% |
| Engineering | 1 | 0.9% |
| Multidisciplinary Studies | 9 | 8.2% |
| Science & Technology | 1 | 0.9% |
| Business | 14 | 12.7% |
| Education | 31 | 28.2% |
| Literature & Languages | 3 | 2.7% |
| Liberal Arts & History | 7 | 6.4% |
| Visual & Performing Arts | 0 | 0.0% |
| Communications | 0 | 0.0% |
| Arts & Humanities | 4 | 3.6% |
| Total | 110 | 100.0% |
Transportation & Commute in St Helena
Vehicle Availability by Sex in St Helena
The most prevalent vehicle ownership categories in St Helena are males with 3 vehicles (60, accounting for 44.8%) and females with 3 vehicles (27, making up 67.4%).
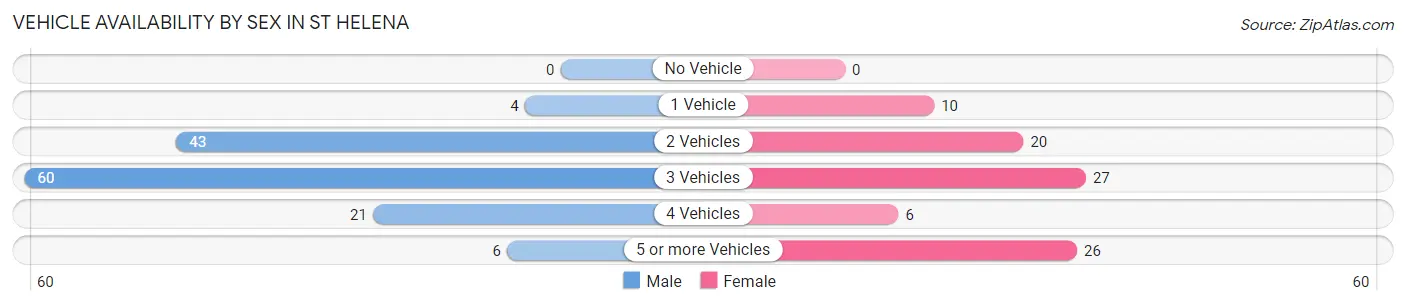
| Vehicles Available | Male | Female |
| No Vehicle | 0 (0.0%) | 0 (0.0%) |
| 1 Vehicle | 4 (3.0%) | 10 (11.2%) |
| 2 Vehicles | 43 (32.1%) | 20 (22.5%) |
| 3 Vehicles | 60 (44.8%) | 27 (30.3%) |
| 4 Vehicles | 21 (15.7%) | 6 (6.7%) |
| 5 or more Vehicles | 6 (4.5%) | 26 (29.2%) |
| Total | 134 (100.0%) | 89 (100.0%) |
Commute Time in St Helena
The most frequently occuring commute durations in St Helena are 30 to 34 minutes (58 commuters, 27.2%), 10 to 14 minutes (33 commuters, 15.5%), and 20 to 24 minutes (30 commuters, 14.1%).
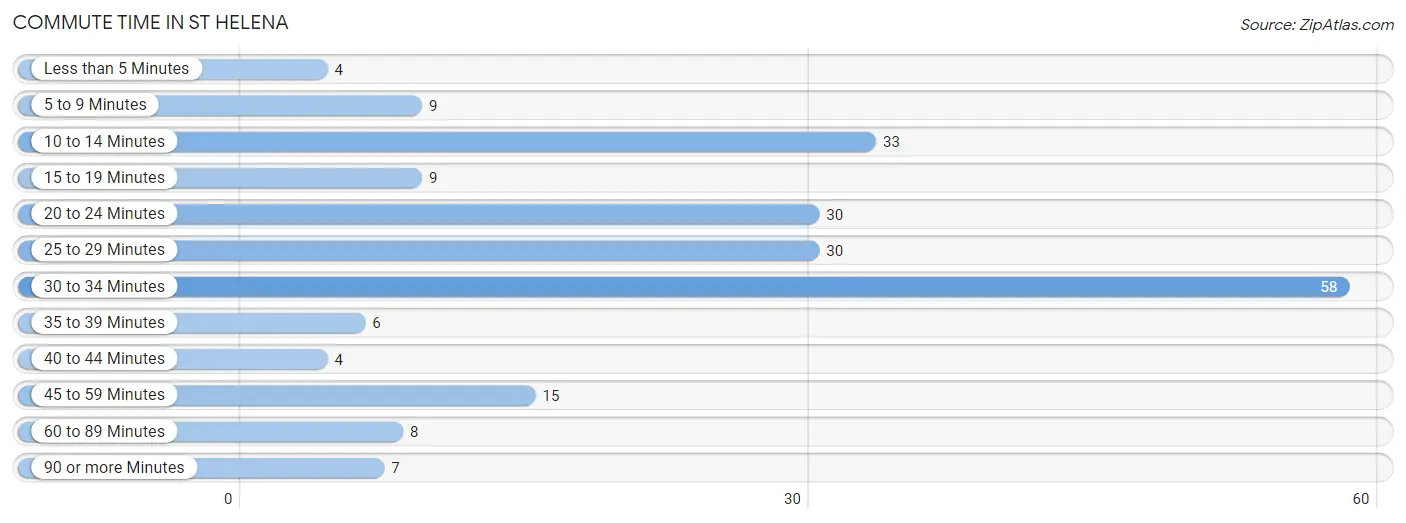
| Commute Time | # Commuters | % Commuters |
| Less than 5 Minutes | 4 | 1.9% |
| 5 to 9 Minutes | 9 | 4.2% |
| 10 to 14 Minutes | 33 | 15.5% |
| 15 to 19 Minutes | 9 | 4.2% |
| 20 to 24 Minutes | 30 | 14.1% |
| 25 to 29 Minutes | 30 | 14.1% |
| 30 to 34 Minutes | 58 | 27.2% |
| 35 to 39 Minutes | 6 | 2.8% |
| 40 to 44 Minutes | 4 | 1.9% |
| 45 to 59 Minutes | 15 | 7.0% |
| 60 to 89 Minutes | 8 | 3.8% |
| 90 or more Minutes | 7 | 3.3% |
Commute Time by Sex in St Helena
The most common commute times in St Helena are 30 to 34 minutes (46 commuters, 34.3%) for males and 20 to 24 minutes (22 commuters, 27.9%) for females.
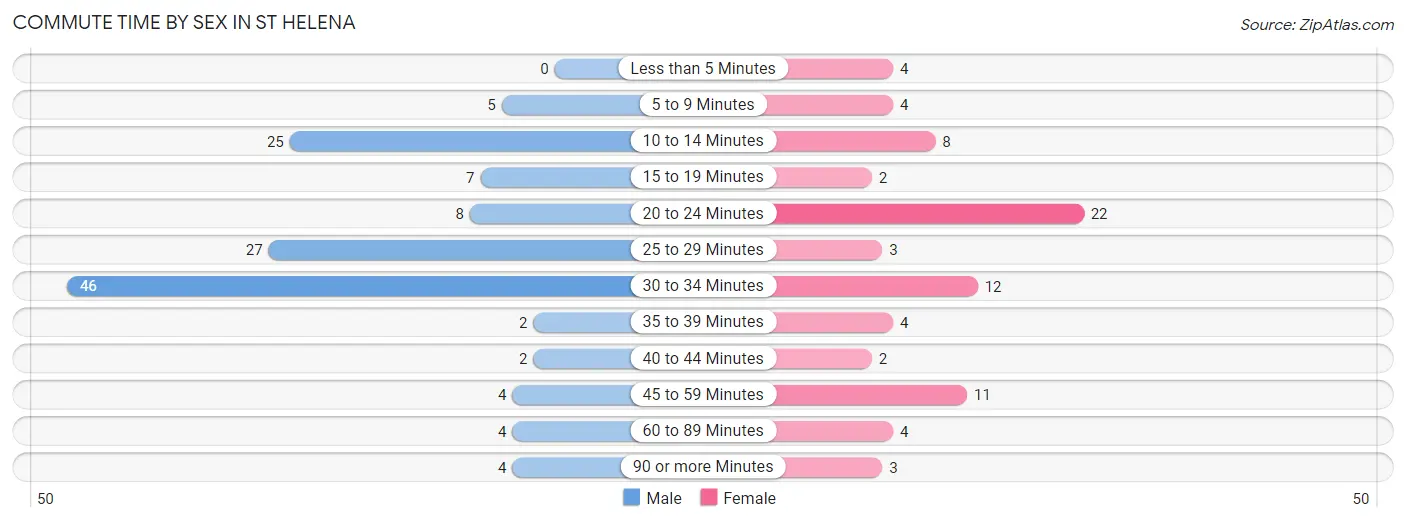
| Commute Time | Male | Female |
| Less than 5 Minutes | 0 (0.0%) | 4 (5.1%) |
| 5 to 9 Minutes | 5 (3.7%) | 4 (5.1%) |
| 10 to 14 Minutes | 25 (18.7%) | 8 (10.1%) |
| 15 to 19 Minutes | 7 (5.2%) | 2 (2.5%) |
| 20 to 24 Minutes | 8 (6.0%) | 22 (27.9%) |
| 25 to 29 Minutes | 27 (20.2%) | 3 (3.8%) |
| 30 to 34 Minutes | 46 (34.3%) | 12 (15.2%) |
| 35 to 39 Minutes | 2 (1.5%) | 4 (5.1%) |
| 40 to 44 Minutes | 2 (1.5%) | 2 (2.5%) |
| 45 to 59 Minutes | 4 (3.0%) | 11 (13.9%) |
| 60 to 89 Minutes | 4 (3.0%) | 4 (5.1%) |
| 90 or more Minutes | 4 (3.0%) | 3 (3.8%) |
Time of Departure to Work by Sex in St Helena
The most frequent times of departure to work in St Helena are 12:00 AM to 4:59 AM (29, 21.6%) for males and 4:00 PM to 11:59 PM (26, 32.9%) for females.
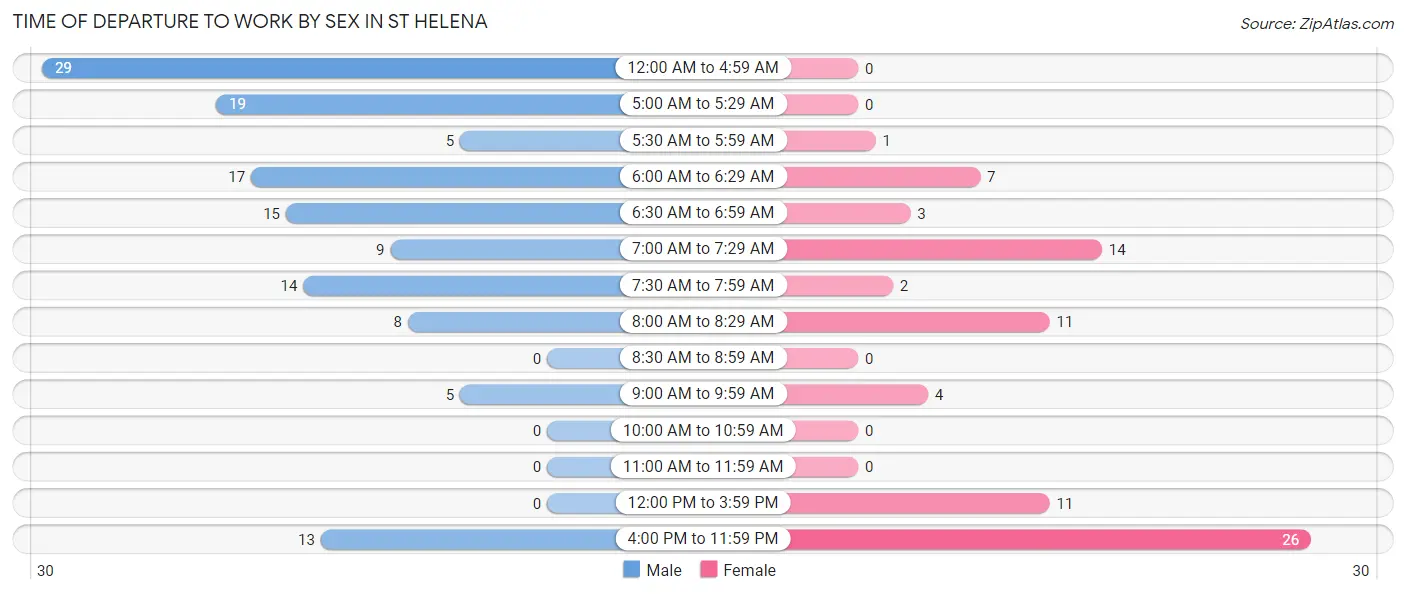
| Time of Departure | Male | Female |
| 12:00 AM to 4:59 AM | 29 (21.6%) | 0 (0.0%) |
| 5:00 AM to 5:29 AM | 19 (14.2%) | 0 (0.0%) |
| 5:30 AM to 5:59 AM | 5 (3.7%) | 1 (1.3%) |
| 6:00 AM to 6:29 AM | 17 (12.7%) | 7 (8.9%) |
| 6:30 AM to 6:59 AM | 15 (11.2%) | 3 (3.8%) |
| 7:00 AM to 7:29 AM | 9 (6.7%) | 14 (17.7%) |
| 7:30 AM to 7:59 AM | 14 (10.4%) | 2 (2.5%) |
| 8:00 AM to 8:29 AM | 8 (6.0%) | 11 (13.9%) |
| 8:30 AM to 8:59 AM | 0 (0.0%) | 0 (0.0%) |
| 9:00 AM to 9:59 AM | 5 (3.7%) | 4 (5.1%) |
| 10:00 AM to 10:59 AM | 0 (0.0%) | 0 (0.0%) |
| 11:00 AM to 11:59 AM | 0 (0.0%) | 0 (0.0%) |
| 12:00 PM to 3:59 PM | 0 (0.0%) | 11 (13.9%) |
| 4:00 PM to 11:59 PM | 13 (9.7%) | 26 (32.9%) |
| Total | 134 (100.0%) | 79 (100.0%) |
Housing Occupancy in St Helena
Occupancy by Ownership in St Helena
Of the total 186 dwellings in St Helena, owner-occupied units account for 165 (88.7%), while renter-occupied units make up 21 (11.3%).
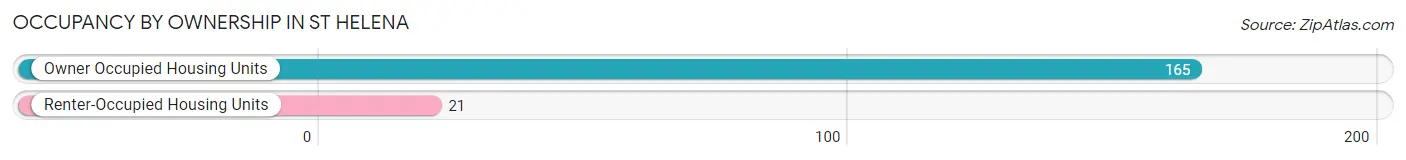
| Occupancy | # Housing Units | % Housing Units |
| Owner Occupied Housing Units | 165 | 88.7% |
| Renter-Occupied Housing Units | 21 | 11.3% |
| Total Occupied Housing Units | 186 | 100.0% |
Occupancy by Household Size in St Helena
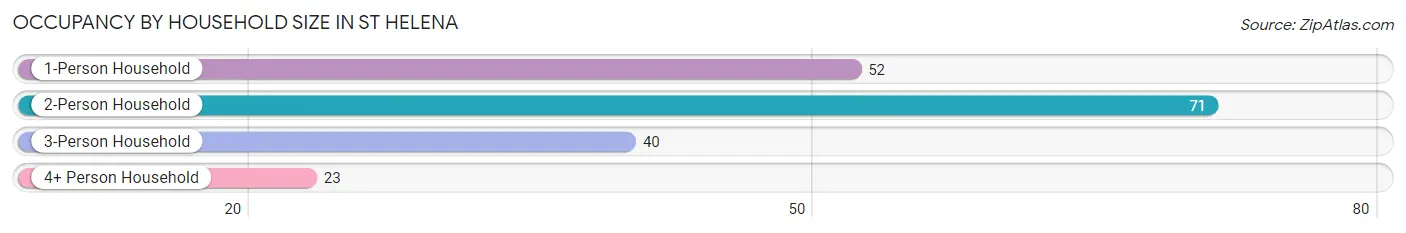
| Household Size | # Housing Units | % Housing Units |
| 1-Person Household | 52 | 28.0% |
| 2-Person Household | 71 | 38.2% |
| 3-Person Household | 40 | 21.5% |
| 4+ Person Household | 23 | 12.4% |
| Total Housing Units | 186 | 100.0% |
Occupancy by Ownership by Household Size in St Helena
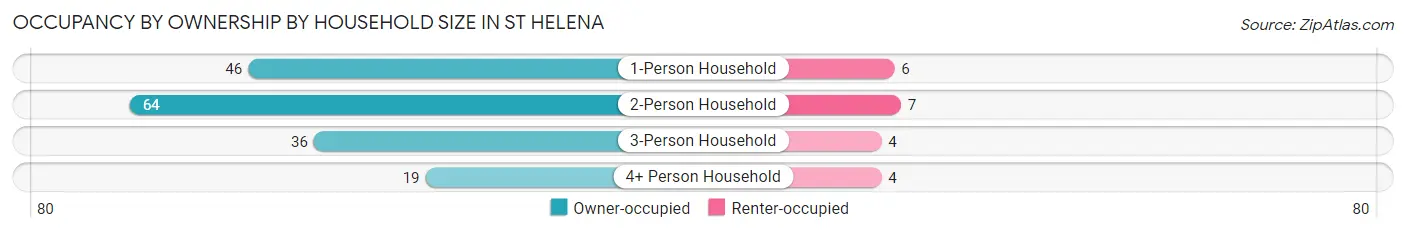
| Household Size | Owner-occupied | Renter-occupied |
| 1-Person Household | 46 (88.5%) | 6 (11.5%) |
| 2-Person Household | 64 (90.1%) | 7 (9.9%) |
| 3-Person Household | 36 (90.0%) | 4 (10.0%) |
| 4+ Person Household | 19 (82.6%) | 4 (17.4%) |
| Total Housing Units | 165 (88.7%) | 21 (11.3%) |
Occupancy by Educational Attainment in St Helena
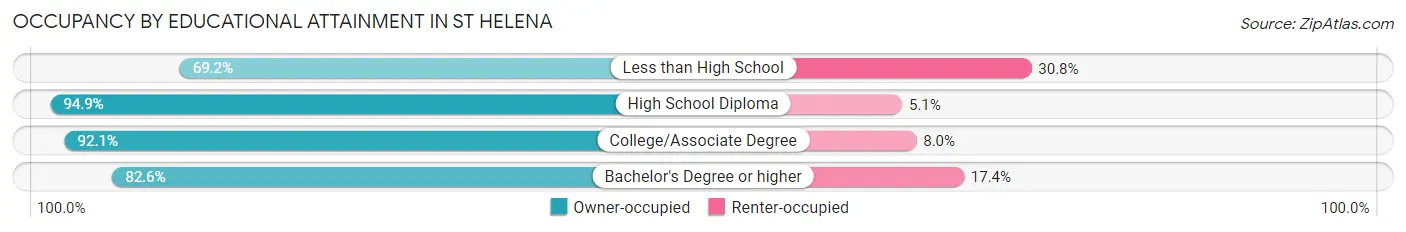
| Household Size | Owner-occupied | Renter-occupied |
| Less than High School | 9 (69.2%) | 4 (30.8%) |
| High School Diploma | 37 (94.9%) | 2 (5.1%) |
| College/Associate Degree | 81 (92.0%) | 7 (8.0%) |
| Bachelor's Degree or higher | 38 (82.6%) | 8 (17.4%) |
Occupancy by Age of Householder in St Helena
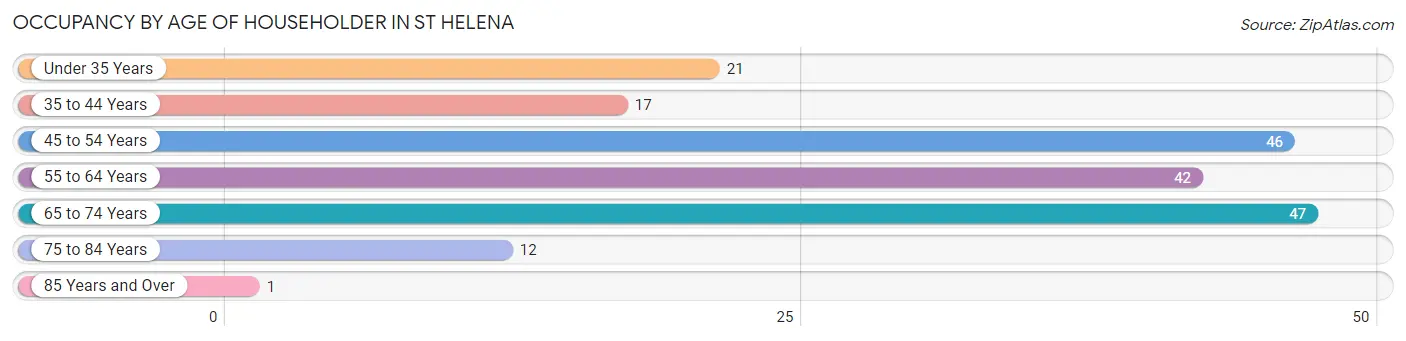
| Age Bracket | # Households | % Households |
| Under 35 Years | 21 | 11.3% |
| 35 to 44 Years | 17 | 9.1% |
| 45 to 54 Years | 46 | 24.7% |
| 55 to 64 Years | 42 | 22.6% |
| 65 to 74 Years | 47 | 25.3% |
| 75 to 84 Years | 12 | 6.5% |
| 85 Years and Over | 1 | 0.5% |
| Total | 186 | 100.0% |
Housing Finances in St Helena
Median Income by Occupancy in St Helena
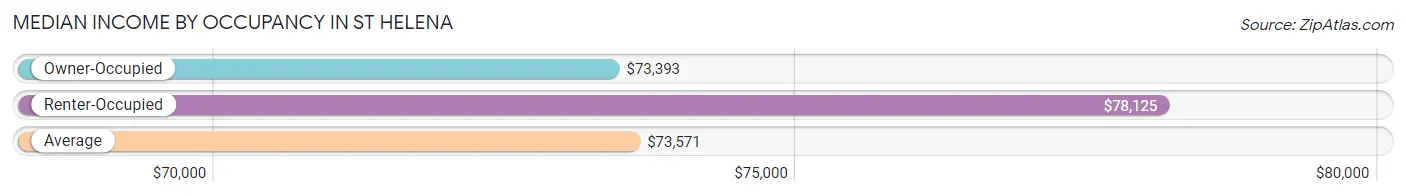
| Occupancy Type | # Households | Median Income |
| Owner-Occupied | 165 (88.7%) | $73,393 |
| Renter-Occupied | 21 (11.3%) | $78,125 |
| Average | 186 (100.0%) | $73,571 |
Occupancy by Householder Income Bracket in St Helena
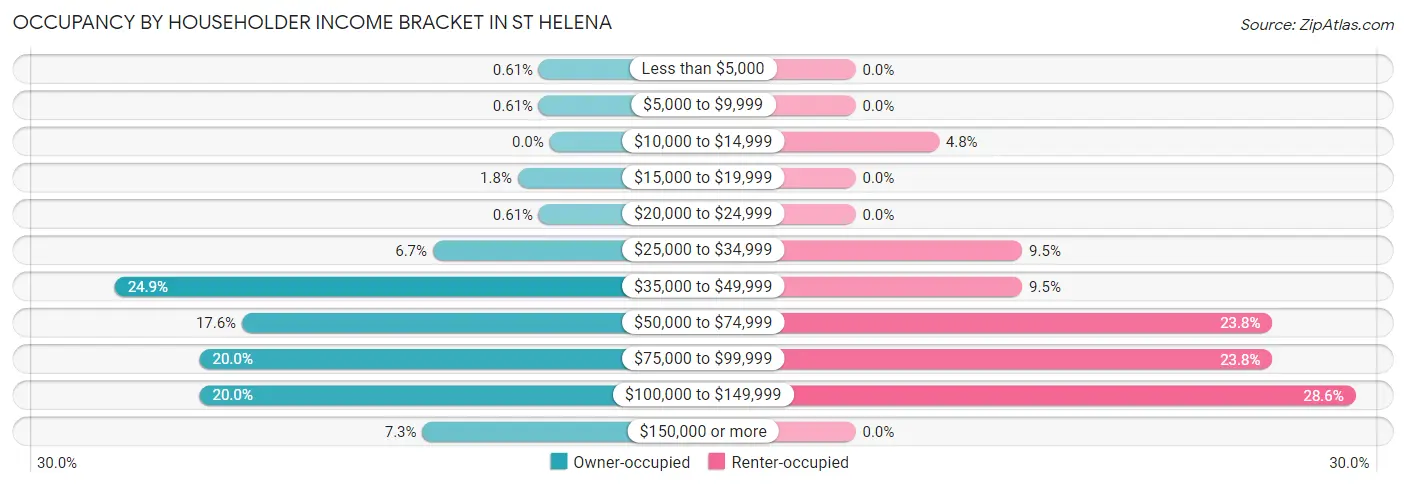
| Income Bracket | Owner-occupied | Renter-occupied |
| Less than $5,000 | 1 (0.6%) | 0 (0.0%) |
| $5,000 to $9,999 | 1 (0.6%) | 0 (0.0%) |
| $10,000 to $14,999 | 0 (0.0%) | 1 (4.8%) |
| $15,000 to $19,999 | 3 (1.8%) | 0 (0.0%) |
| $20,000 to $24,999 | 1 (0.6%) | 0 (0.0%) |
| $25,000 to $34,999 | 11 (6.7%) | 2 (9.5%) |
| $35,000 to $49,999 | 41 (24.8%) | 2 (9.5%) |
| $50,000 to $74,999 | 29 (17.6%) | 5 (23.8%) |
| $75,000 to $99,999 | 33 (20.0%) | 5 (23.8%) |
| $100,000 to $149,999 | 33 (20.0%) | 6 (28.6%) |
| $150,000 or more | 12 (7.3%) | 0 (0.0%) |
| Total | 165 (100.0%) | 21 (100.0%) |
Monthly Housing Cost Tiers in St Helena
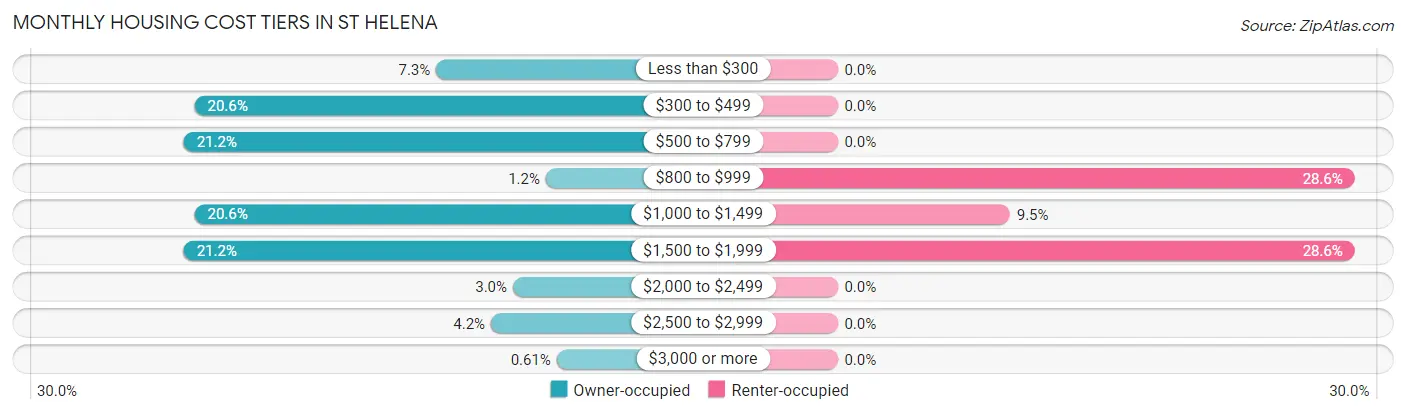
| Monthly Cost | Owner-occupied | Renter-occupied |
| Less than $300 | 12 (7.3%) | 0 (0.0%) |
| $300 to $499 | 34 (20.6%) | 0 (0.0%) |
| $500 to $799 | 35 (21.2%) | 0 (0.0%) |
| $800 to $999 | 2 (1.2%) | 6 (28.6%) |
| $1,000 to $1,499 | 34 (20.6%) | 2 (9.5%) |
| $1,500 to $1,999 | 35 (21.2%) | 6 (28.6%) |
| $2,000 to $2,499 | 5 (3.0%) | 0 (0.0%) |
| $2,500 to $2,999 | 7 (4.2%) | 0 (0.0%) |
| $3,000 or more | 1 (0.6%) | 0 (0.0%) |
| Total | 165 (100.0%) | 21 (100.0%) |
Physical Housing Characteristics in St Helena
Housing Structures in St Helena
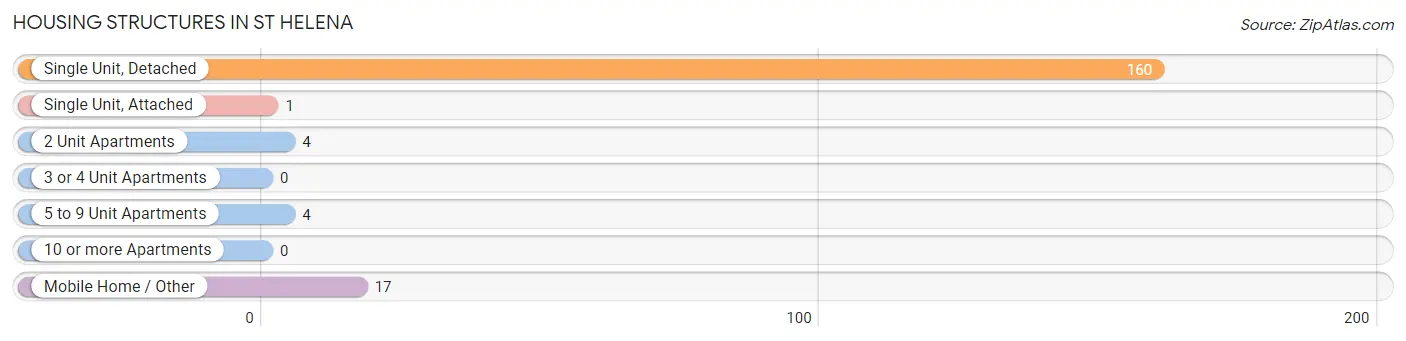
| Structure Type | # Housing Units | % Housing Units |
| Single Unit, Detached | 160 | 86.0% |
| Single Unit, Attached | 1 | 0.5% |
| 2 Unit Apartments | 4 | 2.1% |
| 3 or 4 Unit Apartments | 0 | 0.0% |
| 5 to 9 Unit Apartments | 4 | 2.1% |
| 10 or more Apartments | 0 | 0.0% |
| Mobile Home / Other | 17 | 9.1% |
| Total | 186 | 100.0% |
Housing Structures by Occupancy in St Helena
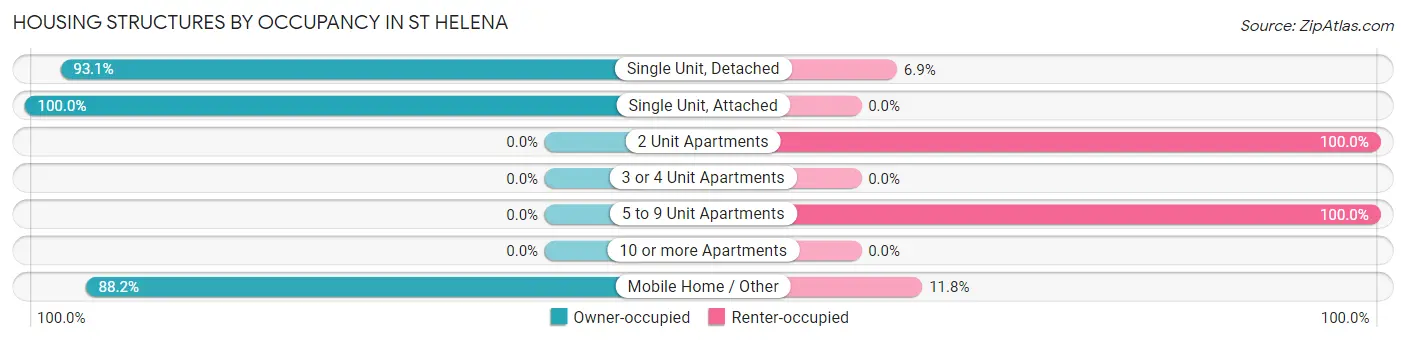
| Structure Type | Owner-occupied | Renter-occupied |
| Single Unit, Detached | 149 (93.1%) | 11 (6.9%) |
| Single Unit, Attached | 1 (100.0%) | 0 (0.0%) |
| 2 Unit Apartments | 0 (0.0%) | 4 (100.0%) |
| 3 or 4 Unit Apartments | 0 (0.0%) | 0 (0.0%) |
| 5 to 9 Unit Apartments | 0 (0.0%) | 4 (100.0%) |
| 10 or more Apartments | 0 (0.0%) | 0 (0.0%) |
| Mobile Home / Other | 15 (88.2%) | 2 (11.8%) |
| Total | 165 (88.7%) | 21 (11.3%) |
Housing Structures by Number of Rooms in St Helena
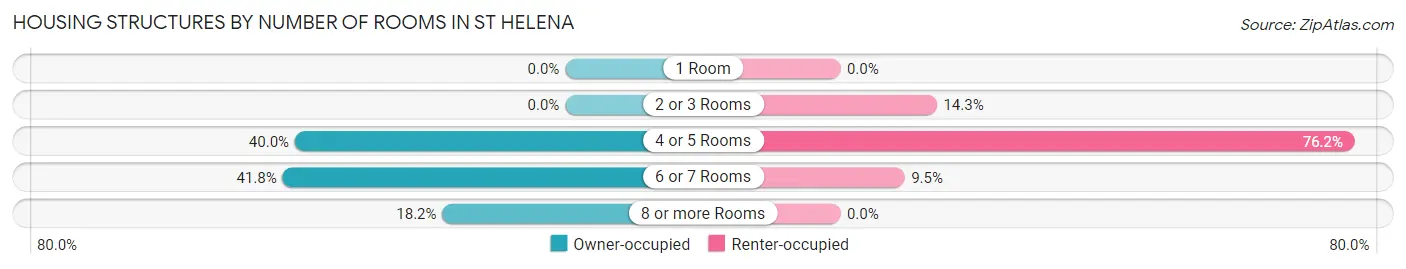
| Number of Rooms | Owner-occupied | Renter-occupied |
| 1 Room | 0 (0.0%) | 0 (0.0%) |
| 2 or 3 Rooms | 0 (0.0%) | 3 (14.3%) |
| 4 or 5 Rooms | 66 (40.0%) | 16 (76.2%) |
| 6 or 7 Rooms | 69 (41.8%) | 2 (9.5%) |
| 8 or more Rooms | 30 (18.2%) | 0 (0.0%) |
| Total | 165 (100.0%) | 21 (100.0%) |
Housing Structure by Heating Type in St Helena
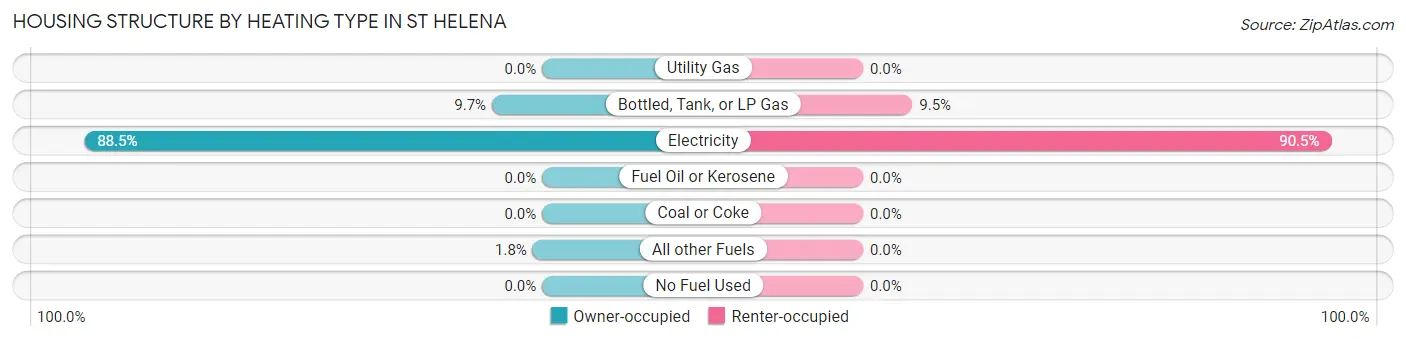
| Heating Type | Owner-occupied | Renter-occupied |
| Utility Gas | 0 (0.0%) | 0 (0.0%) |
| Bottled, Tank, or LP Gas | 16 (9.7%) | 2 (9.5%) |
| Electricity | 146 (88.5%) | 19 (90.5%) |
| Fuel Oil or Kerosene | 0 (0.0%) | 0 (0.0%) |
| Coal or Coke | 0 (0.0%) | 0 (0.0%) |
| All other Fuels | 3 (1.8%) | 0 (0.0%) |
| No Fuel Used | 0 (0.0%) | 0 (0.0%) |
| Total | 165 (100.0%) | 21 (100.0%) |
Household Vehicle Usage in St Helena
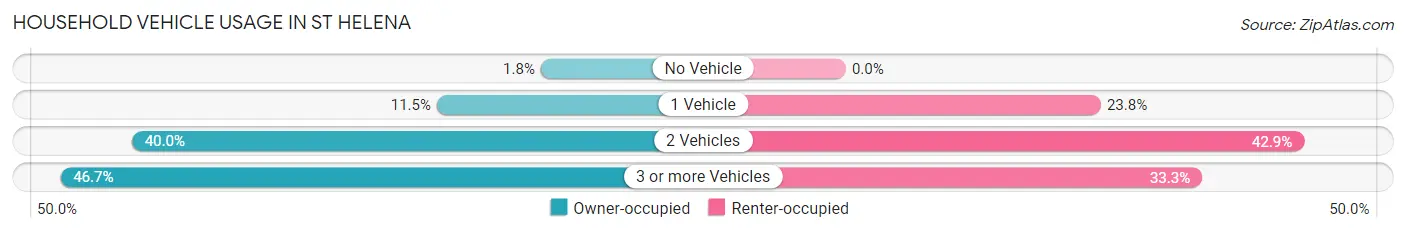
| Vehicles per Household | Owner-occupied | Renter-occupied |
| No Vehicle | 3 (1.8%) | 0 (0.0%) |
| 1 Vehicle | 19 (11.5%) | 5 (23.8%) |
| 2 Vehicles | 66 (40.0%) | 9 (42.9%) |
| 3 or more Vehicles | 77 (46.7%) | 7 (33.3%) |
| Total | 165 (100.0%) | 21 (100.0%) |
Real Estate & Mortgages in St Helena
Real Estate and Mortgage Overview in St Helena
| Characteristic | Without Mortgage | With Mortgage |
| Housing Units | 60 | 105 |
| Median Property Value | $173,100 | $214,400 |
| Median Household Income | $62,955 | $9 |
| Monthly Housing Costs | $390 | $1 |
| Real Estate Taxes | $1,409 | $3 |
Property Value by Mortgage Status in St Helena
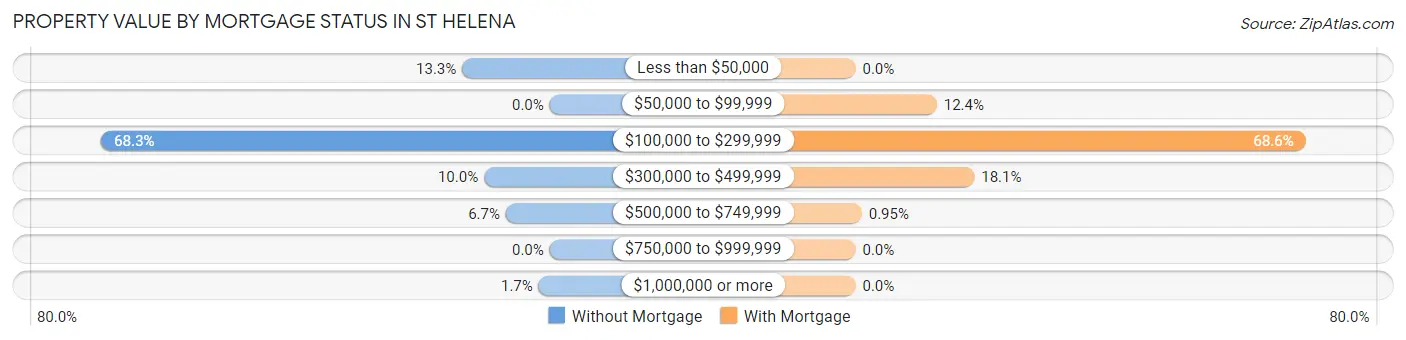
| Property Value | Without Mortgage | With Mortgage |
| Less than $50,000 | 8 (13.3%) | 0 (0.0%) |
| $50,000 to $99,999 | 0 (0.0%) | 13 (12.4%) |
| $100,000 to $299,999 | 41 (68.3%) | 72 (68.6%) |
| $300,000 to $499,999 | 6 (10.0%) | 19 (18.1%) |
| $500,000 to $749,999 | 4 (6.7%) | 1 (0.9%) |
| $750,000 to $999,999 | 0 (0.0%) | 0 (0.0%) |
| $1,000,000 or more | 1 (1.7%) | 0 (0.0%) |
| Total | 60 (100.0%) | 105 (100.0%) |
Household Income by Mortgage Status in St Helena
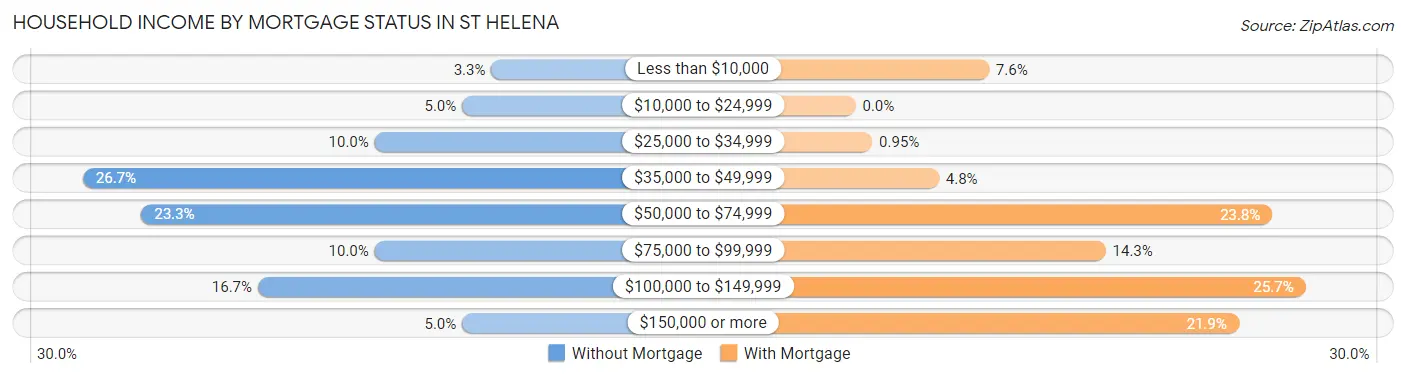
| Household Income | Without Mortgage | With Mortgage |
| Less than $10,000 | 2 (3.3%) | 8 (7.6%) |
| $10,000 to $24,999 | 3 (5.0%) | 0 (0.0%) |
| $25,000 to $34,999 | 6 (10.0%) | 1 (0.9%) |
| $35,000 to $49,999 | 16 (26.7%) | 5 (4.8%) |
| $50,000 to $74,999 | 14 (23.3%) | 25 (23.8%) |
| $75,000 to $99,999 | 6 (10.0%) | 15 (14.3%) |
| $100,000 to $149,999 | 10 (16.7%) | 27 (25.7%) |
| $150,000 or more | 3 (5.0%) | 23 (21.9%) |
| Total | 60 (100.0%) | 105 (100.0%) |
Property Value to Household Income Ratio in St Helena
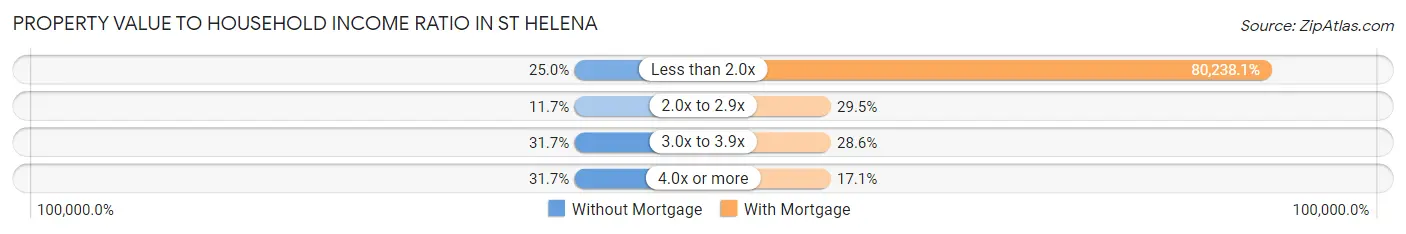
| Value-to-Income Ratio | Without Mortgage | With Mortgage |
| Less than 2.0x | 15 (25.0%) | 84,250 (80,238.1%) |
| 2.0x to 2.9x | 7 (11.7%) | 31 (29.5%) |
| 3.0x to 3.9x | 19 (31.7%) | 30 (28.6%) |
| 4.0x or more | 19 (31.7%) | 18 (17.1%) |
| Total | 60 (100.0%) | 105 (100.0%) |
Real Estate Taxes by Mortgage Status in St Helena
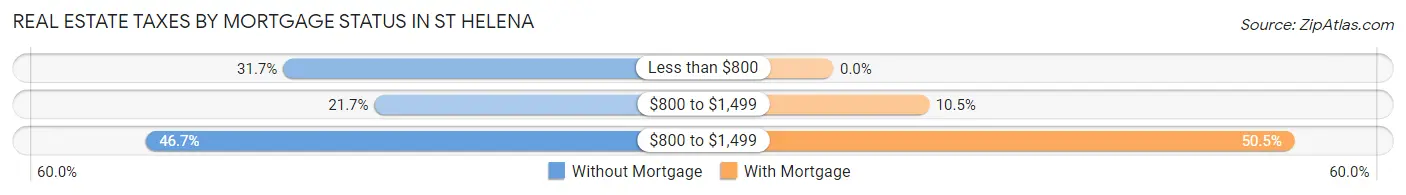
| Property Taxes | Without Mortgage | With Mortgage |
| Less than $800 | 19 (31.7%) | 0 (0.0%) |
| $800 to $1,499 | 13 (21.7%) | 11 (10.5%) |
| $800 to $1,499 | 28 (46.7%) | 53 (50.5%) |
| Total | 60 (100.0%) | 105 (100.0%) |
Health & Disability in St Helena
Health Insurance Coverage by Age in St Helena
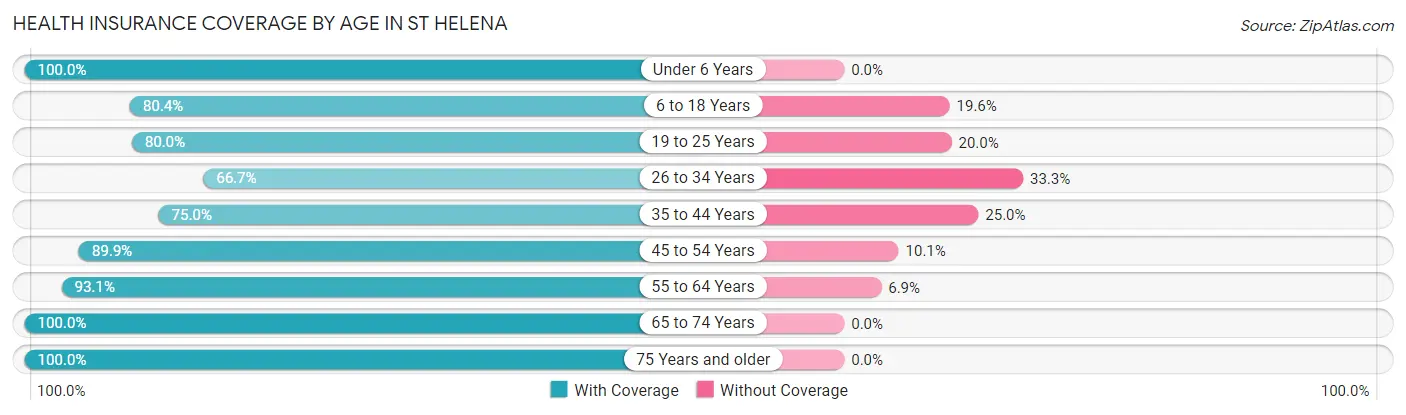
| Age Bracket | With Coverage | Without Coverage |
| Under 6 Years | 39 (100.0%) | 0 (0.0%) |
| 6 to 18 Years | 45 (80.4%) | 11 (19.6%) |
| 19 to 25 Years | 48 (80.0%) | 12 (20.0%) |
| 26 to 34 Years | 20 (66.7%) | 10 (33.3%) |
| 35 to 44 Years | 27 (75.0%) | 9 (25.0%) |
| 45 to 54 Years | 71 (89.9%) | 8 (10.1%) |
| 55 to 64 Years | 54 (93.1%) | 4 (6.9%) |
| 65 to 74 Years | 80 (100.0%) | 0 (0.0%) |
| 75 Years and older | 25 (100.0%) | 0 (0.0%) |
| Total | 409 (88.3%) | 54 (11.7%) |
Health Insurance Coverage by Citizenship Status in St Helena
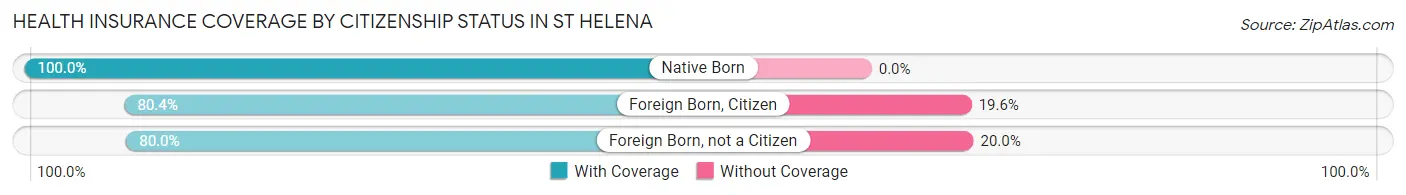
| Citizenship Status | With Coverage | Without Coverage |
| Native Born | 39 (100.0%) | 0 (0.0%) |
| Foreign Born, Citizen | 45 (80.4%) | 11 (19.6%) |
| Foreign Born, not a Citizen | 48 (80.0%) | 12 (20.0%) |
Health Insurance Coverage by Household Income in St Helena
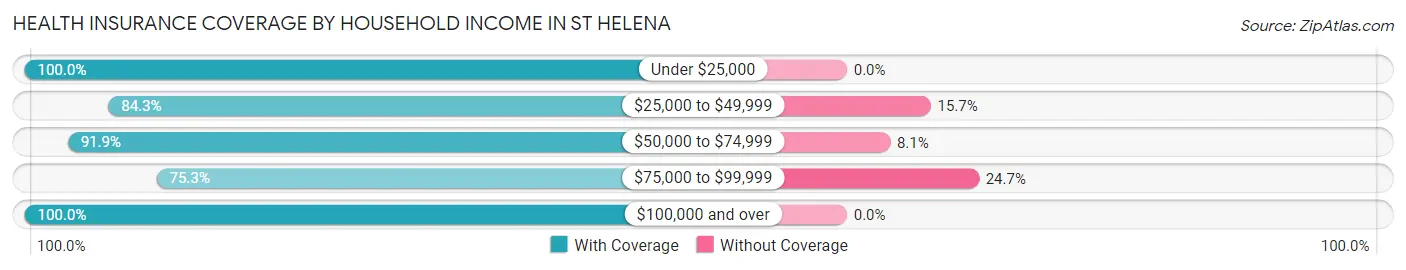
| Household Income | With Coverage | Without Coverage |
| Under $25,000 | 9 (100.0%) | 0 (0.0%) |
| $25,000 to $49,999 | 129 (84.3%) | 24 (15.7%) |
| $50,000 to $74,999 | 91 (91.9%) | 8 (8.1%) |
| $75,000 to $99,999 | 67 (75.3%) | 22 (24.7%) |
| $100,000 and over | 113 (100.0%) | 0 (0.0%) |
Public vs Private Health Insurance Coverage by Age in St Helena
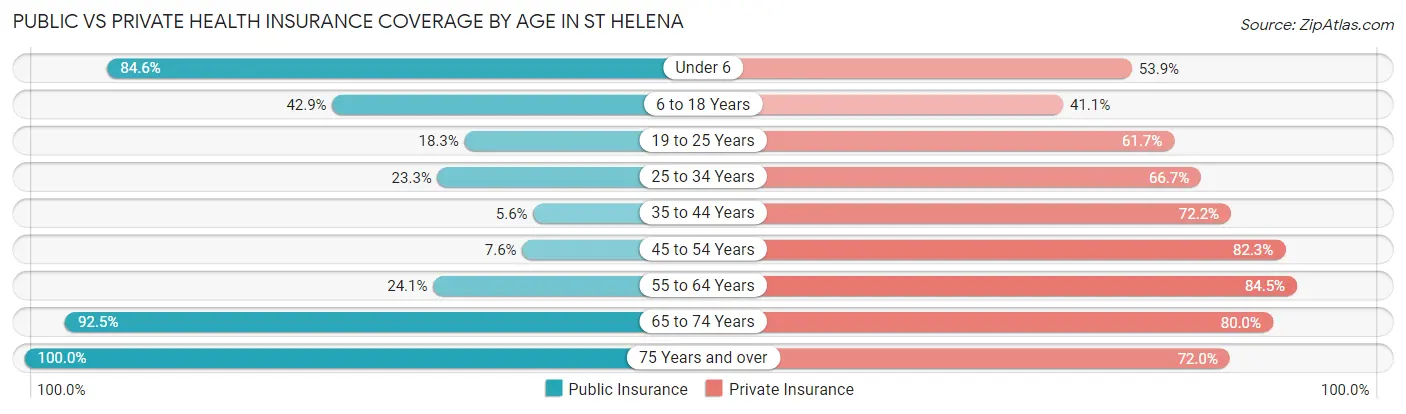
| Age Bracket | Public Insurance | Private Insurance |
| Under 6 | 33 (84.6%) | 21 (53.8%) |
| 6 to 18 Years | 24 (42.9%) | 23 (41.1%) |
| 19 to 25 Years | 11 (18.3%) | 37 (61.7%) |
| 25 to 34 Years | 7 (23.3%) | 20 (66.7%) |
| 35 to 44 Years | 2 (5.6%) | 26 (72.2%) |
| 45 to 54 Years | 6 (7.6%) | 65 (82.3%) |
| 55 to 64 Years | 14 (24.1%) | 49 (84.5%) |
| 65 to 74 Years | 74 (92.5%) | 64 (80.0%) |
| 75 Years and over | 25 (100.0%) | 18 (72.0%) |
| Total | 196 (42.3%) | 323 (69.8%) |
Disability Status by Sex by Age in St Helena
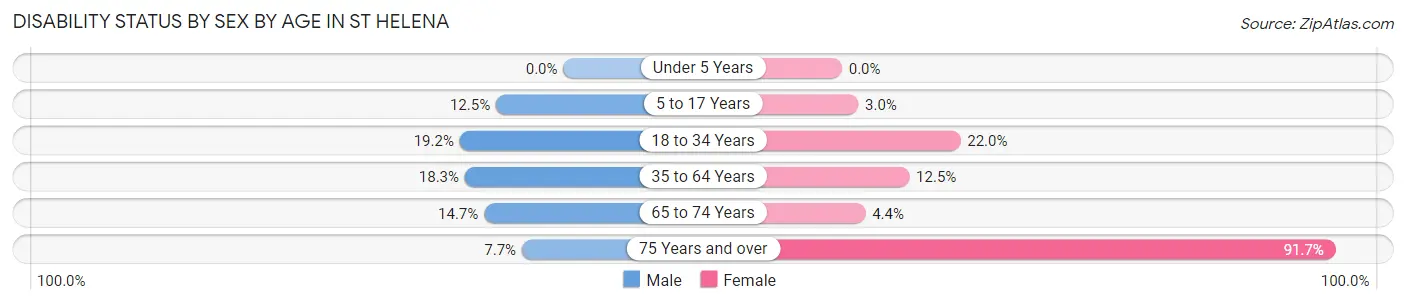
| Age Bracket | Male | Female |
| Under 5 Years | 0 (0.0%) | 0 (0.0%) |
| 5 to 17 Years | 3 (12.5%) | 1 (3.0%) |
| 18 to 34 Years | 10 (19.2%) | 11 (22.0%) |
| 35 to 64 Years | 17 (18.3%) | 10 (12.5%) |
| 65 to 74 Years | 5 (14.7%) | 2 (4.3%) |
| 75 Years and over | 1 (7.7%) | 11 (91.7%) |
Disability Class by Sex by Age in St Helena
Disability Class: Hearing Difficulty
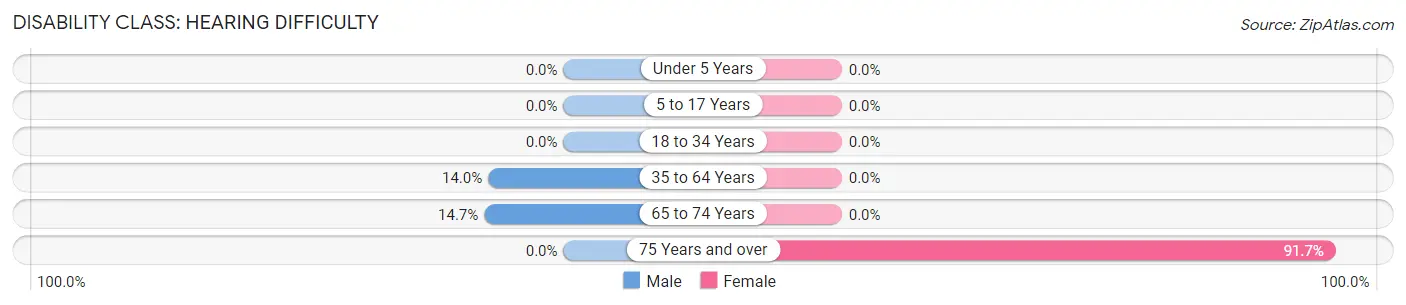
| Age Bracket | Male | Female |
| Under 5 Years | 0 (0.0%) | 0 (0.0%) |
| 5 to 17 Years | 0 (0.0%) | 0 (0.0%) |
| 18 to 34 Years | 0 (0.0%) | 0 (0.0%) |
| 35 to 64 Years | 13 (14.0%) | 0 (0.0%) |
| 65 to 74 Years | 5 (14.7%) | 0 (0.0%) |
| 75 Years and over | 0 (0.0%) | 11 (91.7%) |
Disability Class: Vision Difficulty
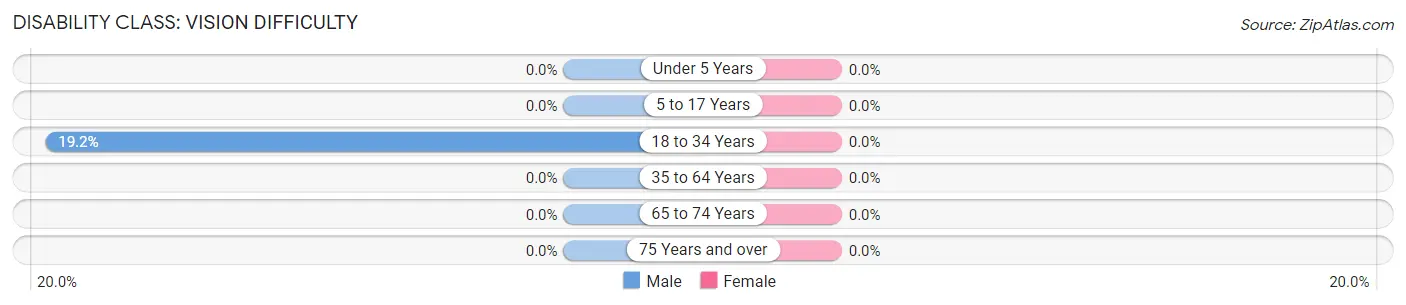
| Age Bracket | Male | Female |
| Under 5 Years | 0 (0.0%) | 0 (0.0%) |
| 5 to 17 Years | 0 (0.0%) | 0 (0.0%) |
| 18 to 34 Years | 10 (19.2%) | 0 (0.0%) |
| 35 to 64 Years | 0 (0.0%) | 0 (0.0%) |
| 65 to 74 Years | 0 (0.0%) | 0 (0.0%) |
| 75 Years and over | 0 (0.0%) | 0 (0.0%) |
Disability Class: Cognitive Difficulty
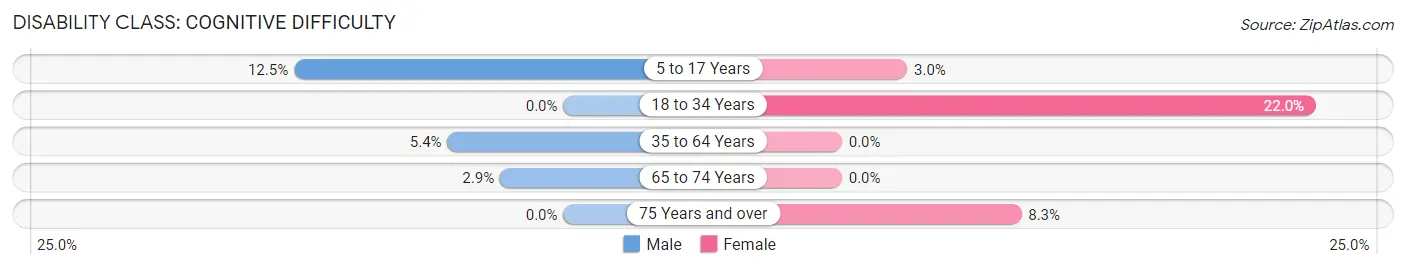
| Age Bracket | Male | Female |
| 5 to 17 Years | 3 (12.5%) | 1 (3.0%) |
| 18 to 34 Years | 0 (0.0%) | 11 (22.0%) |
| 35 to 64 Years | 5 (5.4%) | 0 (0.0%) |
| 65 to 74 Years | 1 (2.9%) | 0 (0.0%) |
| 75 Years and over | 0 (0.0%) | 1 (8.3%) |
Disability Class: Ambulatory Difficulty
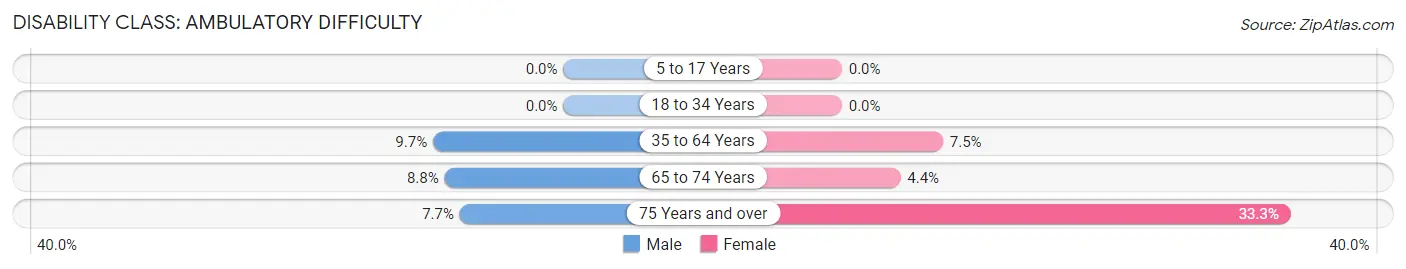
| Age Bracket | Male | Female |
| 5 to 17 Years | 0 (0.0%) | 0 (0.0%) |
| 18 to 34 Years | 0 (0.0%) | 0 (0.0%) |
| 35 to 64 Years | 9 (9.7%) | 6 (7.5%) |
| 65 to 74 Years | 3 (8.8%) | 2 (4.3%) |
| 75 Years and over | 1 (7.7%) | 4 (33.3%) |
Disability Class: Self-Care Difficulty
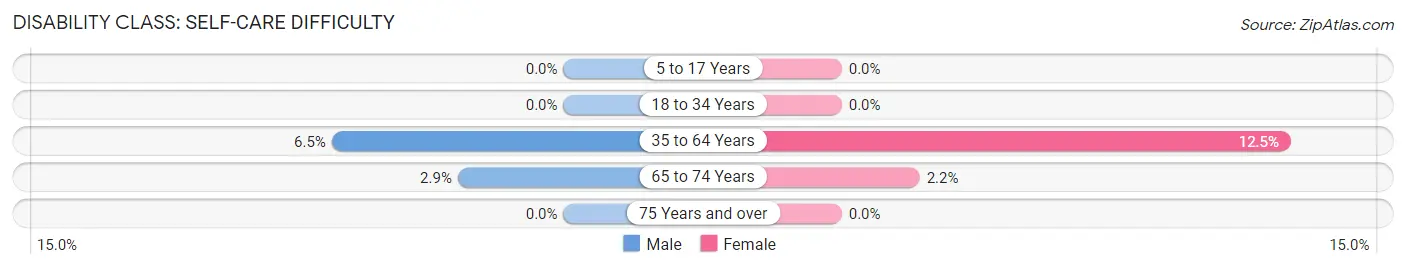
| Age Bracket | Male | Female |
| 5 to 17 Years | 0 (0.0%) | 0 (0.0%) |
| 18 to 34 Years | 0 (0.0%) | 0 (0.0%) |
| 35 to 64 Years | 6 (6.5%) | 10 (12.5%) |
| 65 to 74 Years | 1 (2.9%) | 1 (2.2%) |
| 75 Years and over | 0 (0.0%) | 0 (0.0%) |
Technology Access in St Helena
Computing Device Access in St Helena
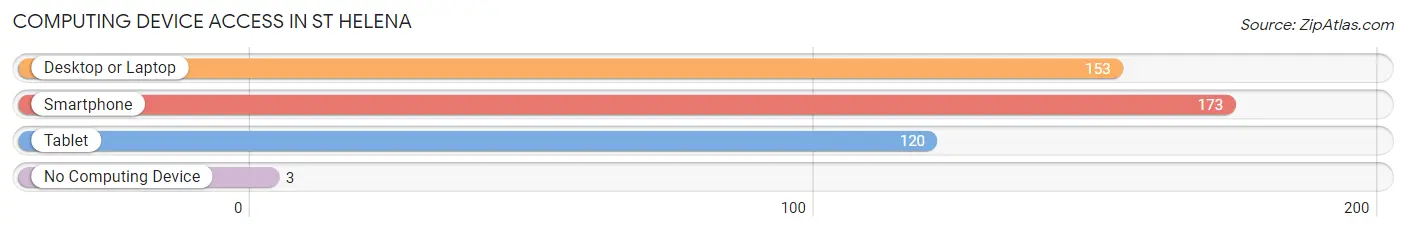
| Device Type | # Households | % Households |
| Desktop or Laptop | 153 | 82.3% |
| Smartphone | 173 | 93.0% |
| Tablet | 120 | 64.5% |
| No Computing Device | 3 | 1.6% |
| Total | 186 | 100.0% |
Internet Access in St Helena
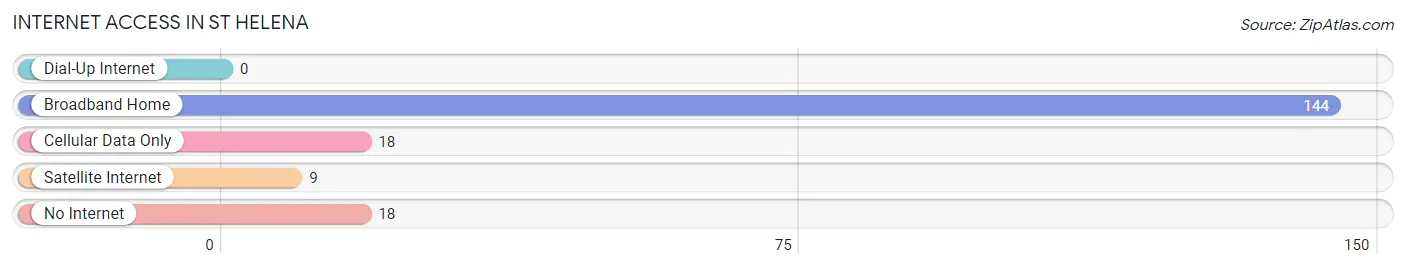
| Internet Type | # Households | % Households |
| Dial-Up Internet | 0 | 0.0% |
| Broadband Home | 144 | 77.4% |
| Cellular Data Only | 18 | 9.7% |
| Satellite Internet | 9 | 4.8% |
| No Internet | 18 | 9.7% |
| Total | 186 | 100.0% |
St Helena Summary
History
St Helena is a small town located in Beaufort County, North Carolina. It is situated on the banks of the Pamlico River, and is part of the Outer Banks region. The town was first settled in the late 1700s by a group of settlers from Scotland, who named the town after the island of St Helena in the South Atlantic Ocean. The town was incorporated in 1883, and has since grown to a population of around 1,000 people.
The town has a rich history, and was once a major port for the shipping of naval stores, such as tar, pitch, and turpentine. During the Civil War, St Helena was a major Confederate port, and was the site of several battles. After the war, the town was used as a base for the Union Army, and was the site of a major naval battle in 1864.
Geography
St Helena is located in the Outer Banks region of North Carolina, on the banks of the Pamlico River. The town is situated on a peninsula, and is surrounded by the Pamlico Sound to the east and the Neuse River to the west. The town is located approximately 30 miles south of the city of New Bern, and is about 50 miles north of Wilmington.
The town is located in a humid subtropical climate zone, and experiences hot, humid summers and mild winters. The average annual temperature is around 70 degrees Fahrenheit, and the average annual precipitation is around 50 inches.
Economy
The economy of St Helena is largely based on tourism and fishing. The town is a popular destination for tourists, who come to enjoy the beaches, fishing, and other outdoor activities. The town also has a number of restaurants, shops, and other businesses that cater to tourists.
The town is also home to a number of commercial fishing operations, which harvest a variety of seafood, including shrimp, oysters, and crabs. The seafood is then sold to local restaurants and markets, as well as to other parts of the country.
Demographics
As of the 2010 census, the population of St Helena was 1,039. The racial makeup of the town was 79.3% White, 16.2% African American, 0.7% Native American, 0.7% Asian, 0.1% Pacific Islander, and 2.9% from other races. The median household income was $37,917, and the median family income was $45,625.
The town is served by the Beaufort County School District, which includes two elementary schools, one middle school, and one high school. The town also has a number of churches, including Baptist, Methodist, and Episcopal.
Conclusion
St Helena is a small town located in Beaufort County, North Carolina. It is situated on the banks of the Pamlico River, and is part of the Outer Banks region. The town has a rich history, and was once a major port for the shipping of naval stores. The economy of St Helena is largely based on tourism and fishing, and the town is a popular destination for tourists. As of the 2010 census, the population of St Helena was 1,039, and the town is served by the Beaufort County School District.
Common Questions
What is Per Capita Income in St Helena?
Per Capita income in St Helena is $35,276.
What is the Median Family Income in St Helena?
Median Family Income in St Helena is $78,125.
What is the Median Household income in St Helena?
Median Household Income in St Helena is $73,571.
What is Income or Wage Gap in St Helena?
Income or Wage Gap in St Helena is 5.4%.
Women in St Helena earn 94.6 cents for every dollar earned by a man.
What is Inequality or Gini Index in St Helena?
Inequality or Gini Index in St Helena is 0.33.
What is the Total Population of St Helena?
Total Population of St Helena is 465.
What is the Total Male Population of St Helena?
Total Male Population of St Helena is 239.
What is the Total Female Population of St Helena?
Total Female Population of St Helena is 226.
What is the Ratio of Males per 100 Females in St Helena?
There are 105.75 Males per 100 Females in St Helena.
What is the Ratio of Females per 100 Males in St Helena?
There are 94.56 Females per 100 Males in St Helena.
What is the Median Population Age in St Helena?
Median Population Age in St Helena is 46.2 Years.
What is the Average Family Size in St Helena
Average Family Size in St Helena is 2.9 People.
What is the Average Household Size in St Helena
Average Household Size in St Helena is 2.5 People.
How Large is the Labor Force in St Helena?
There are 238 People in the Labor Forcein in St Helena.
What is the Percentage of People in the Labor Force in St Helena?
60.3% of People are in the Labor Force in St Helena.
What is the Unemployment Rate in St Helena?
Unemployment Rate in St Helena is 4.7%.