Hays, NC Map & Demographics
Hays Map
Hays Overview
$26,301
PER CAPITA INCOME
$41,250
AVG FAMILY INCOME
$40,963
AVG HOUSEHOLD INCOME
$4,206
FAMILY INCOME DEFICIT
0.41
INEQUALITY / GINI INDEX
1,389
TOTAL POPULATION
793
MALE POPULATION
596
FEMALE POPULATION
133.05
MALES / 100 FEMALES
75.16
FEMALES / 100 MALES
44.6
MEDIAN AGE
2.8
AVG FAMILY SIZE
2.2
AVG HOUSEHOLD SIZE
657
LABOR FORCE [ PEOPLE ]
55.5%
PERCENT IN LABOR FORCE
Hays Zip Codes
Hays Area Codes
Income in Hays
Income Overview in Hays
Per Capita Income in Hays is $26,301, while median incomes of families and households are $41,250 and $40,963 respectively.
| Characteristic | Number | Measure |
| Per Capita Income | 1,389 | $26,301 |
| Median Family Income | 425 | $41,250 |
| Mean Family Income | 425 | $54,493 |
| Median Household Income | 627 | $40,963 |
| Mean Household Income | 627 | $54,935 |
| Income Deficit | 425 | $4,206 |
| Wage / Income Gap (%) | 1,389 | 0.00% |
| Wage / Income Gap ($) | 1,389 | 100.00¢ per $1 |
| Gini / Inequality Index | 1,389 | 0.41 |
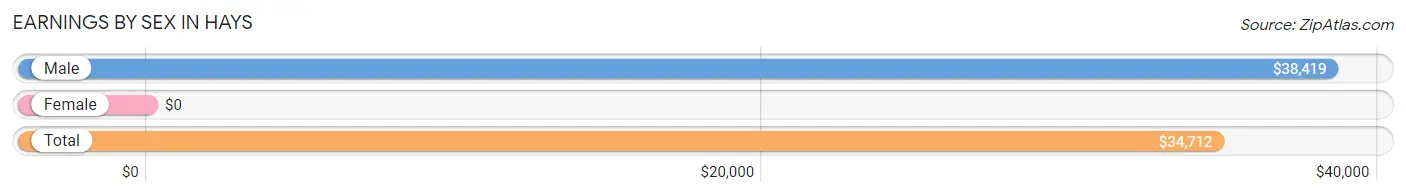
Earnings by Sex in Hays
| Sex | Number | Average Earnings |
| Male | 460 (68.0%) | $38,419 |
| Female | 216 (32.0%) | $0 |
| Total | 676 (100.0%) | $34,712 |
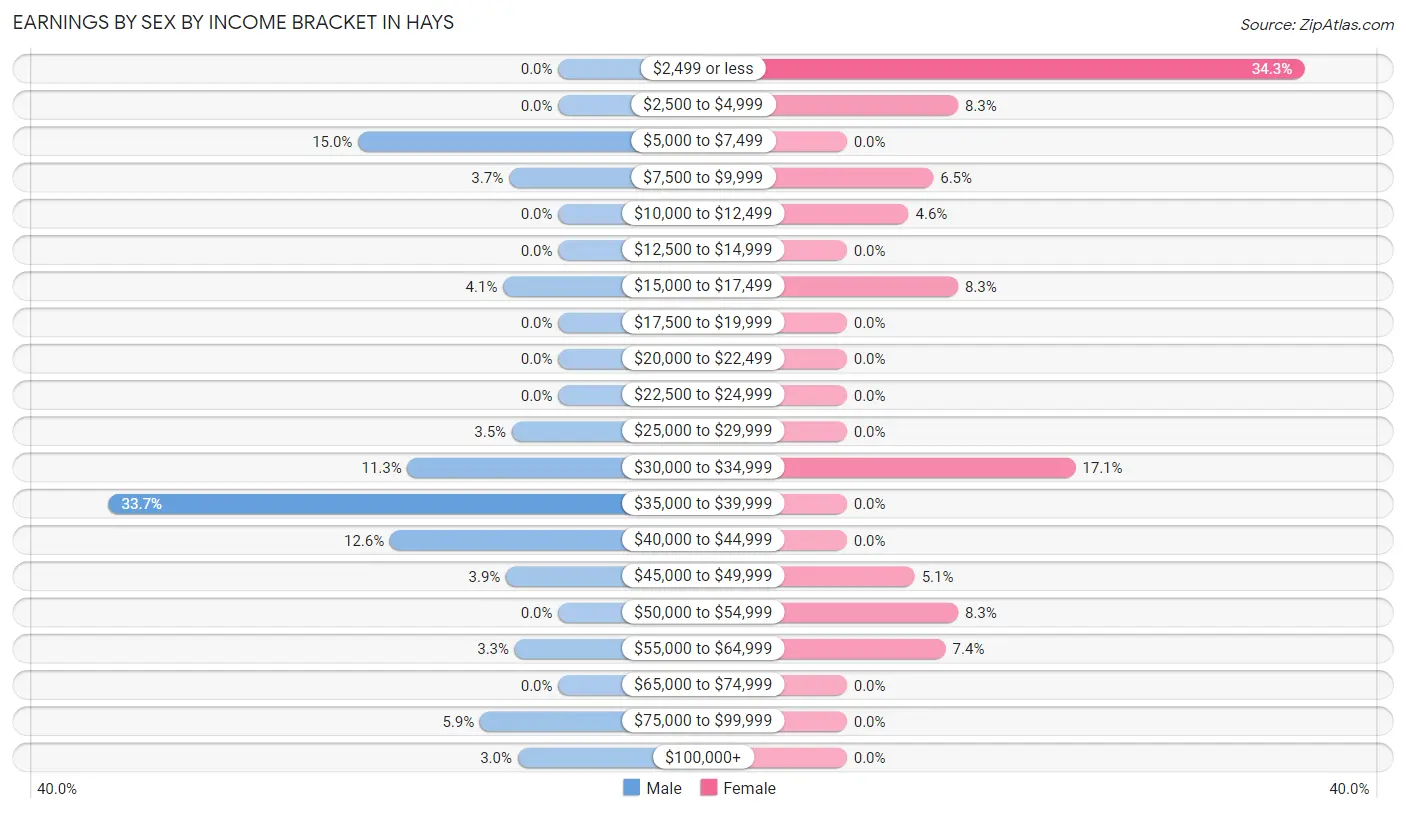
Earnings by Sex by Income Bracket in Hays
The most common earnings brackets in Hays are $35,000 to $39,999 for men (155 | 33.7%) and $2,499 or less for women (74 | 34.3%).
| Income | Male | Female |
| $2,499 or less | 0 (0.0%) | 74 (34.3%) |
| $2,500 to $4,999 | 0 (0.0%) | 18 (8.3%) |
| $5,000 to $7,499 | 69 (15.0%) | 0 (0.0%) |
| $7,500 to $9,999 | 17 (3.7%) | 14 (6.5%) |
| $10,000 to $12,499 | 0 (0.0%) | 10 (4.6%) |
| $12,500 to $14,999 | 0 (0.0%) | 0 (0.0%) |
| $15,000 to $17,499 | 19 (4.1%) | 18 (8.3%) |
| $17,500 to $19,999 | 0 (0.0%) | 0 (0.0%) |
| $20,000 to $22,499 | 0 (0.0%) | 0 (0.0%) |
| $22,500 to $24,999 | 0 (0.0%) | 0 (0.0%) |
| $25,000 to $29,999 | 16 (3.5%) | 0 (0.0%) |
| $30,000 to $34,999 | 52 (11.3%) | 37 (17.1%) |
| $35,000 to $39,999 | 155 (33.7%) | 0 (0.0%) |
| $40,000 to $44,999 | 58 (12.6%) | 0 (0.0%) |
| $45,000 to $49,999 | 18 (3.9%) | 11 (5.1%) |
| $50,000 to $54,999 | 0 (0.0%) | 18 (8.3%) |
| $55,000 to $64,999 | 15 (3.3%) | 16 (7.4%) |
| $65,000 to $74,999 | 0 (0.0%) | 0 (0.0%) |
| $75,000 to $99,999 | 27 (5.9%) | 0 (0.0%) |
| $100,000+ | 14 (3.0%) | 0 (0.0%) |
| Total | 460 (100.0%) | 216 (100.0%) |
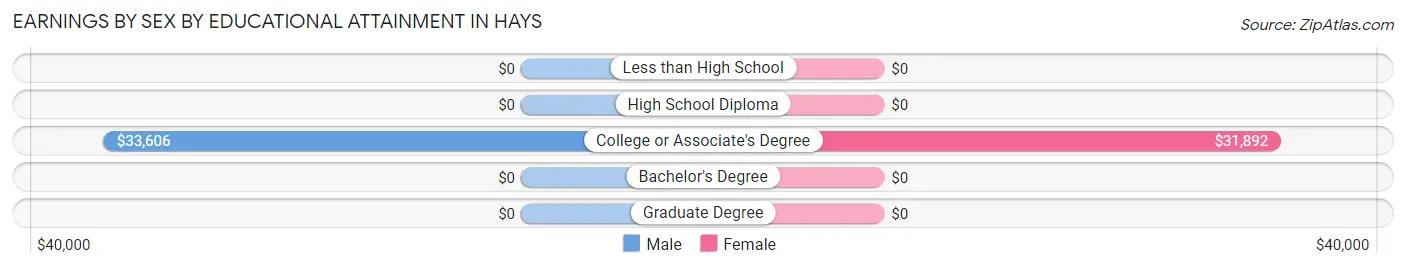
Earnings by Sex by Educational Attainment in Hays
Average earnings in Hays are $34,808 for men and $30,743 for women, a difference of 11.7%. Men with an educational attainment of college or associate's degree enjoy the highest average annual earnings of $33,606, while those with college or associate's degree education earn the least with $33,606. Women with an educational attainment of college or associate's degree earn the most with the average annual earnings of $31,892, while those with college or associate's degree education have the smallest earnings of $31,892.
| Educational Attainment | Male Income | Female Income |
| Less than High School | - | - |
| High School Diploma | - | - |
| College or Associate's Degree | $33,606 | $31,892 |
| Bachelor's Degree | - | - |
| Graduate Degree | - | - |
| Total | $34,808 | $30,743 |
Family Income in Hays
Family Income Brackets in Hays
According to the Hays family income data, there are 174 families falling into the $35,000 to $49,999 income range, which is the most common income bracket and makes up 40.9% of all families.
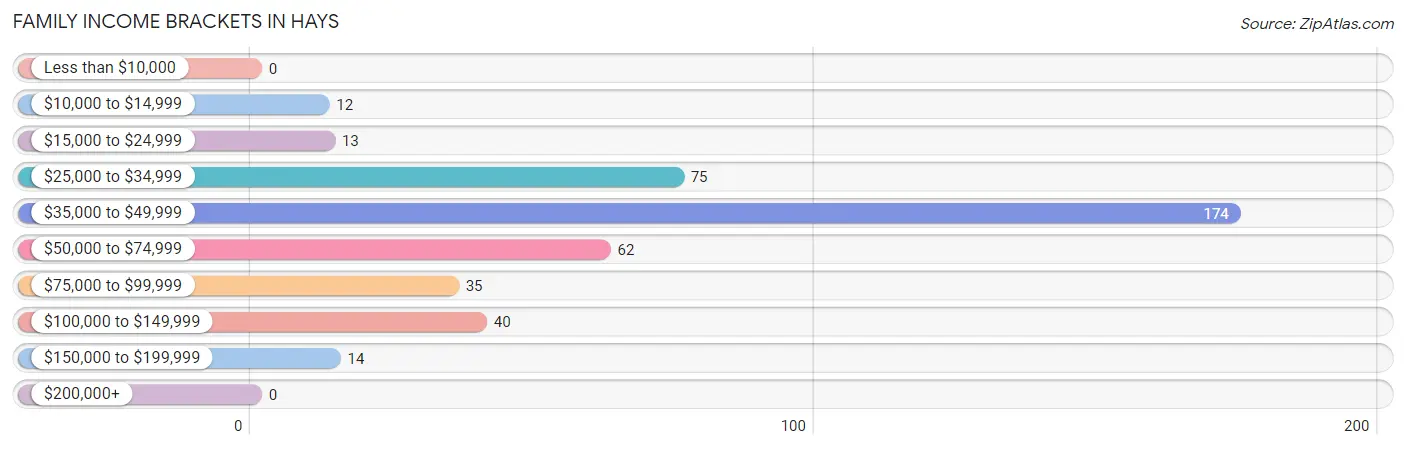
| Income Bracket | # Families | % Families |
| Less than $10,000 | 0 | 0.0% |
| $10,000 to $14,999 | 12 | 2.8% |
| $15,000 to $24,999 | 13 | 3.1% |
| $25,000 to $34,999 | 75 | 17.6% |
| $35,000 to $49,999 | 174 | 40.9% |
| $50,000 to $74,999 | 62 | 14.6% |
| $75,000 to $99,999 | 35 | 8.2% |
| $100,000 to $149,999 | 40 | 9.4% |
| $150,000 to $199,999 | 14 | 3.3% |
| $200,000+ | 0 | 0.0% |
Family Income by Famaliy Size in Hays
4-person families (88 | 20.7%) account for the highest median family income in Hays with $41,833 per family, while 2-person families (176 | 41.4%) have the highest median income of $20,185 per family member.
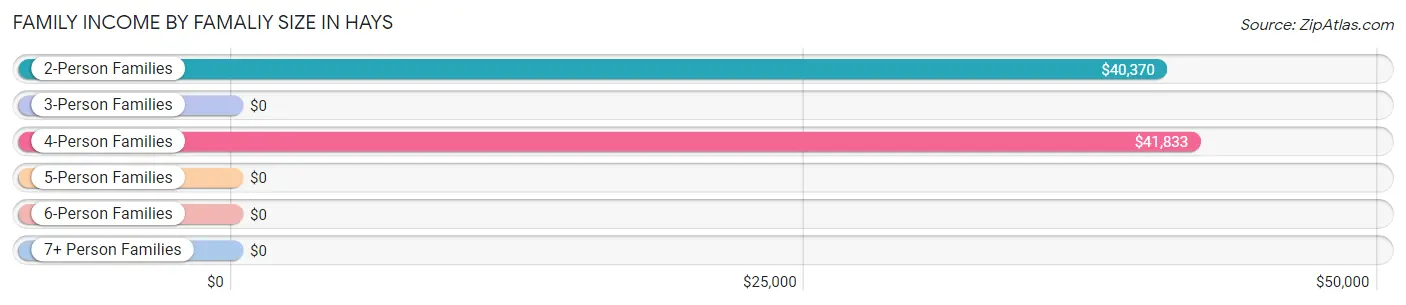
| Income Bracket | # Families | Median Income |
| 2-Person Families | 176 (41.4%) | $40,370 |
| 3-Person Families | 133 (31.3%) | $0 |
| 4-Person Families | 88 (20.7%) | $41,833 |
| 5-Person Families | 28 (6.6%) | $0 |
| 6-Person Families | 0 (0.0%) | $0 |
| 7+ Person Families | 0 (0.0%) | $0 |
| Total | 425 (100.0%) | $41,250 |
Family Income by Number of Earners in Hays
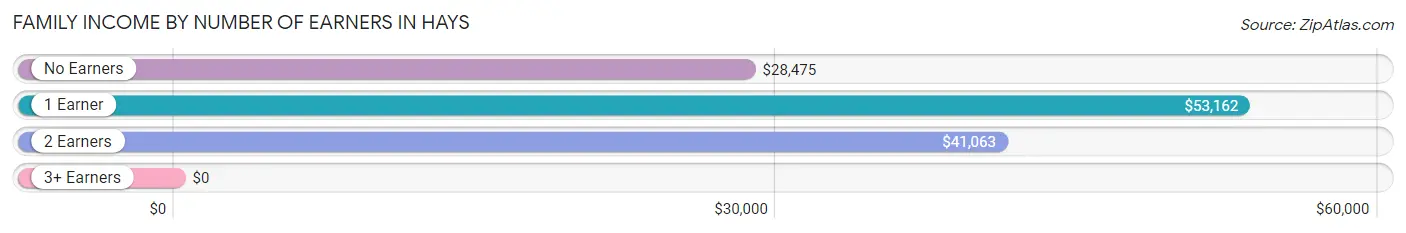
| Number of Earners | # Families | Median Income |
| No Earners | 89 (20.9%) | $28,475 |
| 1 Earner | 121 (28.5%) | $53,162 |
| 2 Earners | 189 (44.5%) | $41,063 |
| 3+ Earners | 26 (6.1%) | $0 |
| Total | 425 (100.0%) | $41,250 |
Household Income in Hays
Household Income Brackets in Hays
With 174 households falling in the category, the $35,000 to $49,999 income range is the most frequent in Hays, accounting for 27.8% of all households.
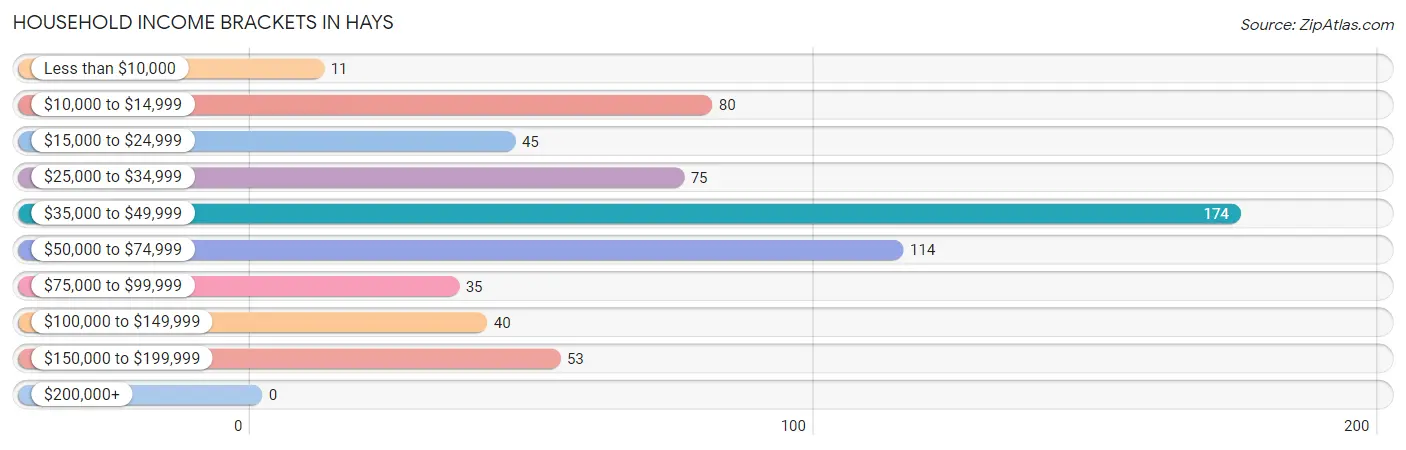
| Income Bracket | # Households | % Households |
| Less than $10,000 | 11 | 1.8% |
| $10,000 to $14,999 | 80 | 12.8% |
| $15,000 to $24,999 | 45 | 7.2% |
| $25,000 to $34,999 | 75 | 12.0% |
| $35,000 to $49,999 | 174 | 27.8% |
| $50,000 to $74,999 | 114 | 18.2% |
| $75,000 to $99,999 | 35 | 5.6% |
| $100,000 to $149,999 | 40 | 6.4% |
| $150,000 to $199,999 | 53 | 8.5% |
| $200,000+ | 0 | 0.0% |
Household Income by Householder Age in Hays
The median household income in Hays is $40,963, with the highest median household income of $63,828 found in the 25 to 44 years age bracket for the primary householder. A total of 79 households (12.6%) fall into this category. Meanwhile, the 15 to 24 years age bracket for the primary householder has the lowest median household income of $0, with 60 households (9.6%) in this group.
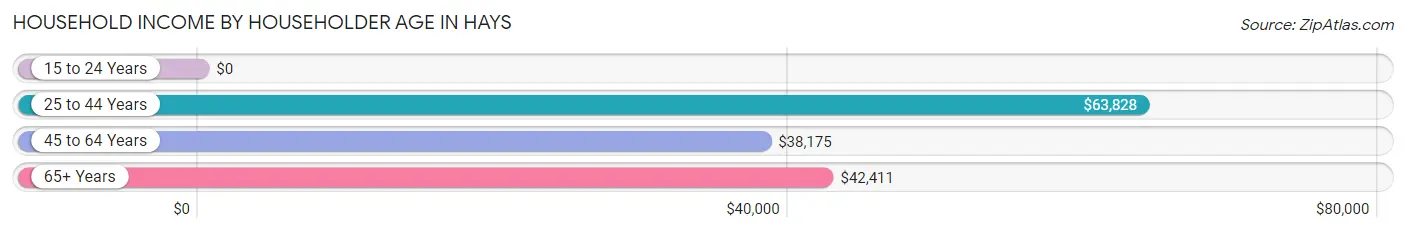
| Income Bracket | # Households | Median Income |
| 15 to 24 Years | 60 (9.6%) | $0 |
| 25 to 44 Years | 79 (12.6%) | $63,828 |
| 45 to 64 Years | 237 (37.8%) | $38,175 |
| 65+ Years | 251 (40.0%) | $42,411 |
| Total | 627 (100.0%) | $40,963 |
Poverty in Hays
Income Below Poverty by Sex and Age in Hays
With 10.3% poverty level for males and 19.8% for females among the residents of Hays, 25 to 34 year old males and 12 to 14 year old females are the most vulnerable to poverty, with 19 males (36.5%) and 13 females (50.0%) in their respective age groups living below the poverty level.
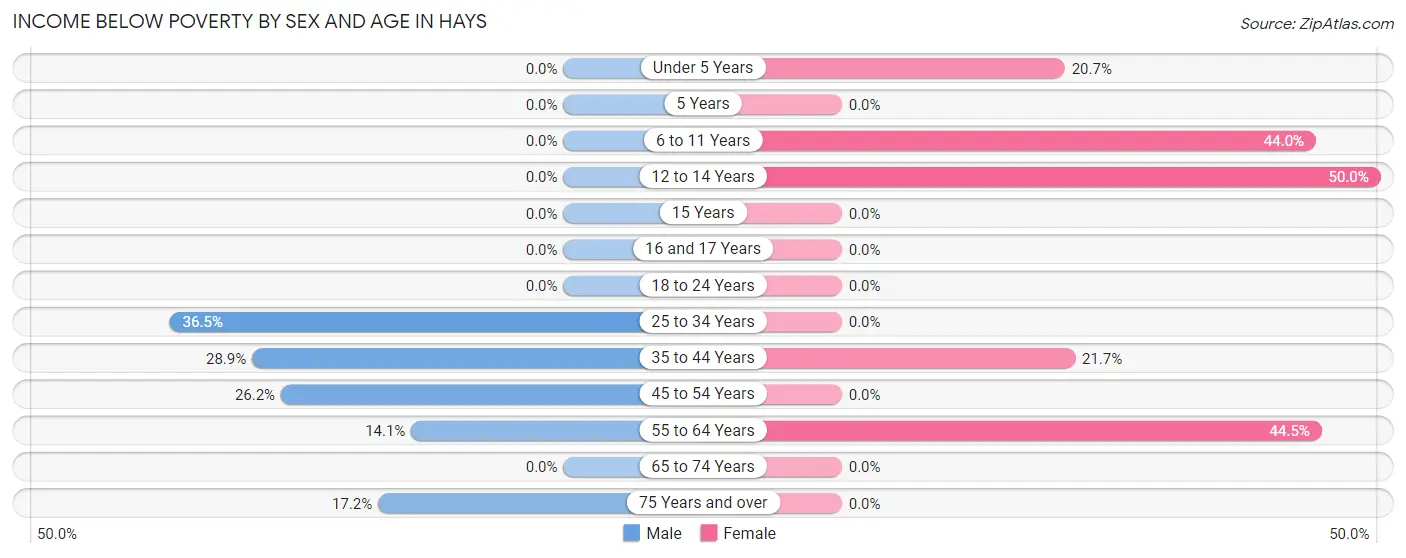
| Age Bracket | Male | Female |
| Under 5 Years | 0 (0.0%) | 12 (20.7%) |
| 5 Years | 0 (0.0%) | 0 (0.0%) |
| 6 to 11 Years | 0 (0.0%) | 11 (44.0%) |
| 12 to 14 Years | 0 (0.0%) | 13 (50.0%) |
| 15 Years | 0 (0.0%) | 0 (0.0%) |
| 16 and 17 Years | 0 (0.0%) | 0 (0.0%) |
| 18 to 24 Years | 0 (0.0%) | 0 (0.0%) |
| 25 to 34 Years | 19 (36.5%) | 0 (0.0%) |
| 35 to 44 Years | 13 (28.9%) | 21 (21.6%) |
| 45 to 54 Years | 27 (26.2%) | 0 (0.0%) |
| 55 to 64 Years | 12 (14.1%) | 61 (44.5%) |
| 65 to 74 Years | 0 (0.0%) | 0 (0.0%) |
| 75 Years and over | 11 (17.2%) | 0 (0.0%) |
| Total | 82 (10.3%) | 118 (19.8%) |
Income Above Poverty by Sex and Age in Hays
According to the poverty statistics in Hays, males aged under 5 years and females aged 16 and 17 years are the age groups that are most secure financially, with 100.0% of males and 100.0% of females in these age groups living above the poverty line.
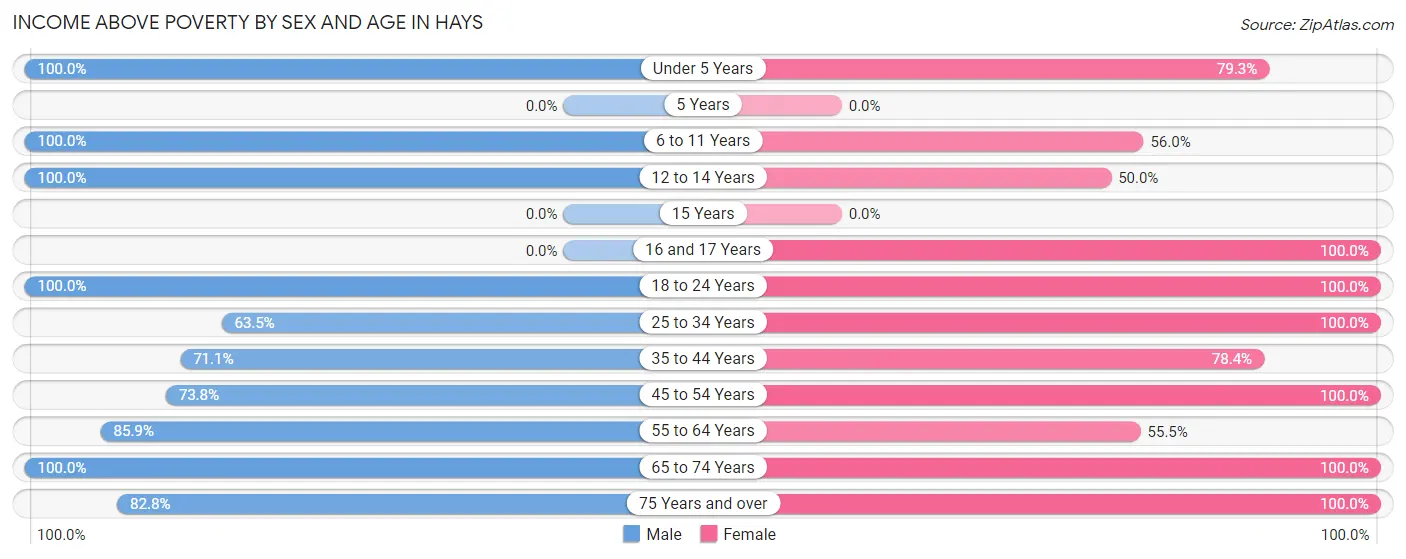
| Age Bracket | Male | Female |
| Under 5 Years | 39 (100.0%) | 46 (79.3%) |
| 5 Years | 0 (0.0%) | 0 (0.0%) |
| 6 to 11 Years | 39 (100.0%) | 14 (56.0%) |
| 12 to 14 Years | 19 (100.0%) | 13 (50.0%) |
| 15 Years | 0 (0.0%) | 0 (0.0%) |
| 16 and 17 Years | 0 (0.0%) | 13 (100.0%) |
| 18 to 24 Years | 177 (100.0%) | 74 (100.0%) |
| 25 to 34 Years | 33 (63.5%) | 35 (100.0%) |
| 35 to 44 Years | 32 (71.1%) | 76 (78.3%) |
| 45 to 54 Years | 76 (73.8%) | 18 (100.0%) |
| 55 to 64 Years | 73 (85.9%) | 76 (55.5%) |
| 65 to 74 Years | 170 (100.0%) | 83 (100.0%) |
| 75 Years and over | 53 (82.8%) | 30 (100.0%) |
| Total | 711 (89.7%) | 478 (80.2%) |
Income Below Poverty Among Married-Couple Families in Hays
The poverty statistics for married-couple families in Hays show that 8.8% or 35 of the total 396 families live below the poverty line. Families with 1 or 2 children have the highest poverty rate of 17.1%, comprising of 35 families. On the other hand, families with no children have the lowest poverty rate of 0.0%, which includes 0 families.
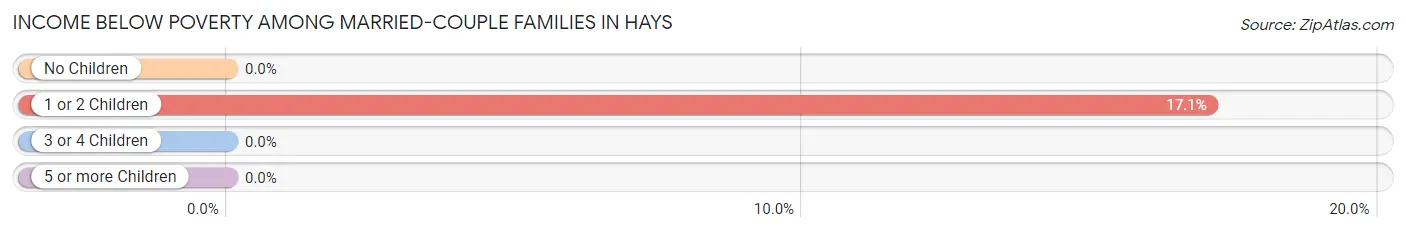
| Children | Above Poverty | Below Poverty |
| No Children | 173 (100.0%) | 0 (0.0%) |
| 1 or 2 Children | 170 (82.9%) | 35 (17.1%) |
| 3 or 4 Children | 18 (100.0%) | 0 (0.0%) |
| 5 or more Children | 0 (0.0%) | 0 (0.0%) |
| Total | 361 (91.2%) | 35 (8.8%) |
Income Below Poverty Among Single-Parent Households in Hays
| Children | Single Father | Single Mother |
| No Children | 0 (0.0%) | 0 (0.0%) |
| 1 or 2 Children | 0 (0.0%) | 0 (0.0%) |
| 3 or 4 Children | 0 (0.0%) | 0 (0.0%) |
| 5 or more Children | 0 (0.0%) | 0 (0.0%) |
| Total | 0 (0.0%) | 0 (0.0%) |
Income Below Poverty Among Married-Couple vs Single-Parent Households in Hays
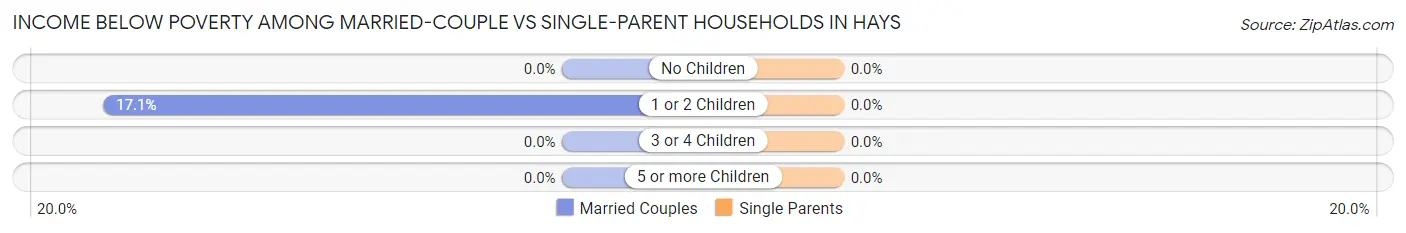
| Children | Married-Couple Families | Single-Parent Households |
| No Children | 0 (0.0%) | 0 (0.0%) |
| 1 or 2 Children | 35 (17.1%) | 0 (0.0%) |
| 3 or 4 Children | 0 (0.0%) | 0 (0.0%) |
| 5 or more Children | 0 (0.0%) | 0 (0.0%) |
| Total | 35 (8.8%) | 0 (0.0%) |
Race in Hays
The most populous races in Hays are White / Caucasian (1,129 | 81.3%), Hispanic or Latino (225 | 16.2%), and Two or more Races (218 | 15.7%).
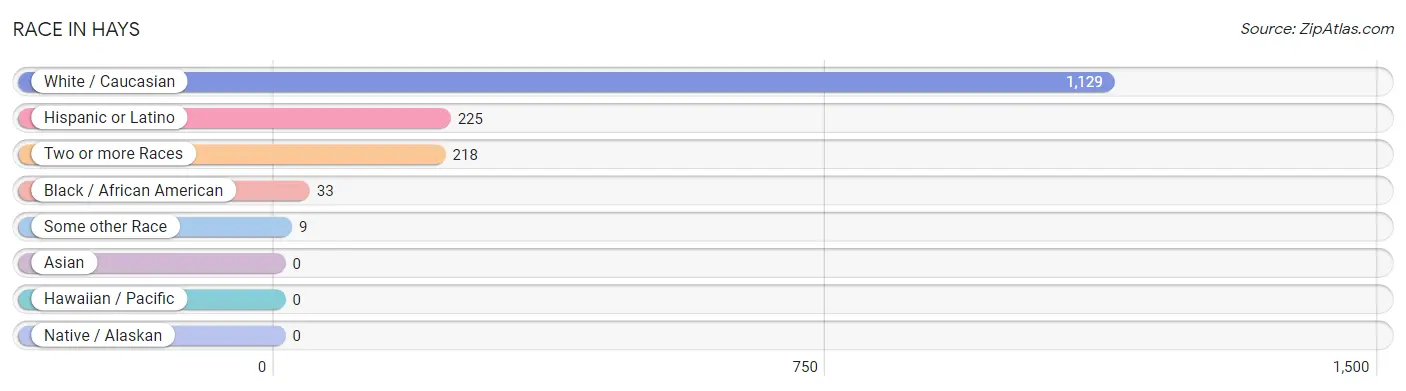
| Race | # Population | % Population |
| Asian | 0 | 0.0% |
| Black / African American | 33 | 2.4% |
| Hawaiian / Pacific | 0 | 0.0% |
| Hispanic or Latino | 225 | 16.2% |
| Native / Alaskan | 0 | 0.0% |
| White / Caucasian | 1,129 | 81.3% |
| Two or more Races | 218 | 15.7% |
| Some other Race | 9 | 0.6% |
| Total | 1,389 | 100.0% |
Ancestry in Hays
The most populous ancestries reported in Hays are Irish (157 | 11.3%), American (144 | 10.4%), Central American (144 | 10.4%), Honduran (144 | 10.4%), and Scottish (106 | 7.6%), together accounting for 50.0% of all Hays residents.
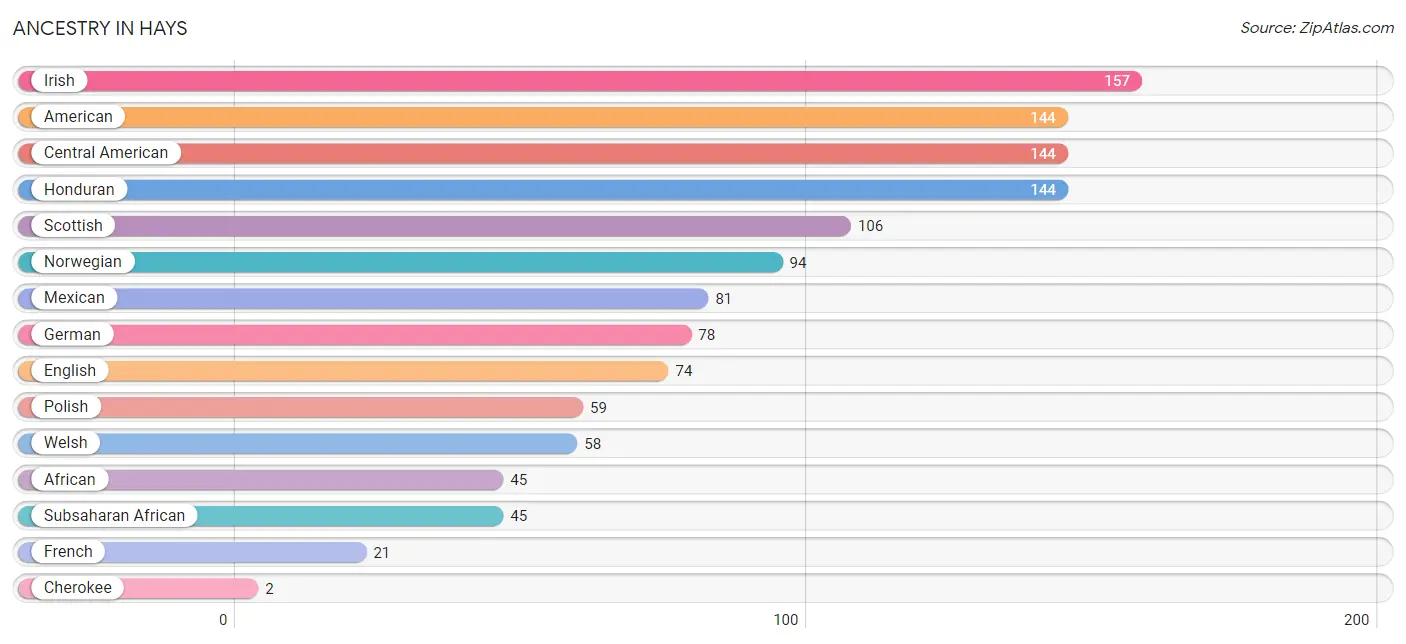
| Ancestry | # Population | % Population |
| African | 45 | 3.2% |
| American | 144 | 10.4% |
| Central American | 144 | 10.4% |
| Cherokee | 2 | 0.1% |
| English | 74 | 5.3% |
| French | 21 | 1.5% |
| German | 78 | 5.6% |
| Honduran | 144 | 10.4% |
| Irish | 157 | 11.3% |
| Italian | 2 | 0.1% |
| Mexican | 81 | 5.8% |
| Norwegian | 94 | 6.8% |
| Polish | 59 | 4.3% |
| Scottish | 106 | 7.6% |
| Subsaharan African | 45 | 3.2% |
| Welsh | 58 | 4.2% | View All 16 Rows |
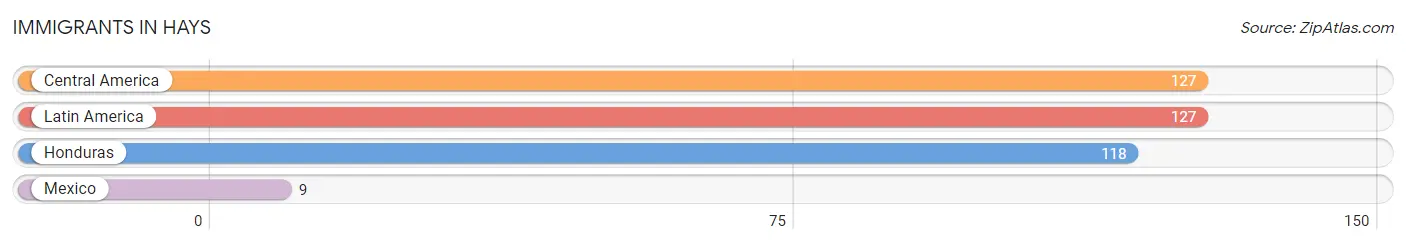
Immigrants in Hays
The most numerous immigrant groups reported in Hays came from Central America (127 | 9.1%), Latin America (127 | 9.1%), Honduras (118 | 8.5%), and Mexico (9 | 0.6%), together accounting for 27.4% of all Hays residents.
| Immigration Origin | # Population | % Population |
| Central America | 127 | 9.1% |
| Honduras | 118 | 8.5% |
| Latin America | 127 | 9.1% |
| Mexico | 9 | 0.6% | View All 4 Rows |
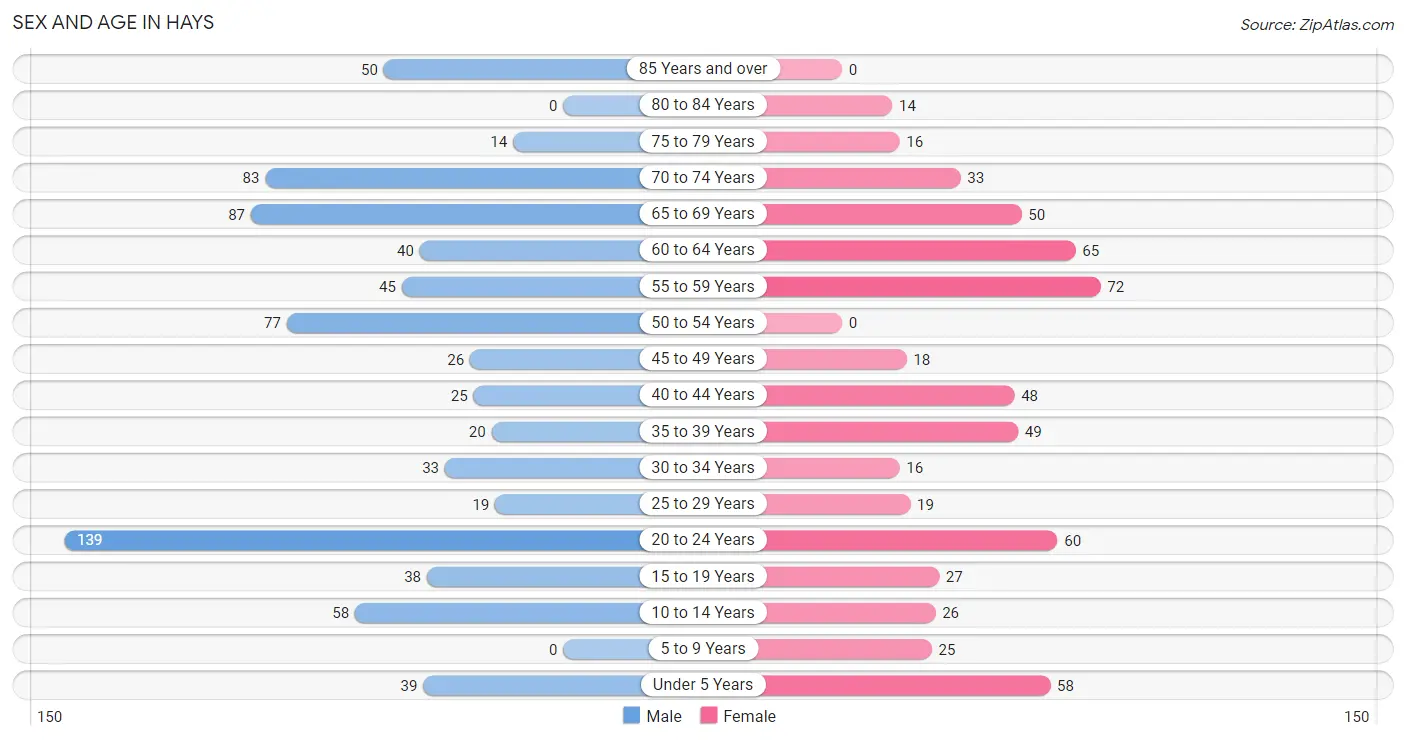
Sex and Age in Hays
Sex and Age in Hays
The most populous age groups in Hays are 20 to 24 Years (139 | 17.5%) for men and 55 to 59 Years (72 | 12.1%) for women.
| Age Bracket | Male | Female |
| Under 5 Years | 39 (4.9%) | 58 (9.7%) |
| 5 to 9 Years | 0 (0.0%) | 25 (4.2%) |
| 10 to 14 Years | 58 (7.3%) | 26 (4.4%) |
| 15 to 19 Years | 38 (4.8%) | 27 (4.5%) |
| 20 to 24 Years | 139 (17.5%) | 60 (10.1%) |
| 25 to 29 Years | 19 (2.4%) | 19 (3.2%) |
| 30 to 34 Years | 33 (4.2%) | 16 (2.7%) |
| 35 to 39 Years | 20 (2.5%) | 49 (8.2%) |
| 40 to 44 Years | 25 (3.2%) | 48 (8.1%) |
| 45 to 49 Years | 26 (3.3%) | 18 (3.0%) |
| 50 to 54 Years | 77 (9.7%) | 0 (0.0%) |
| 55 to 59 Years | 45 (5.7%) | 72 (12.1%) |
| 60 to 64 Years | 40 (5.0%) | 65 (10.9%) |
| 65 to 69 Years | 87 (11.0%) | 50 (8.4%) |
| 70 to 74 Years | 83 (10.5%) | 33 (5.5%) |
| 75 to 79 Years | 14 (1.8%) | 16 (2.7%) |
| 80 to 84 Years | 0 (0.0%) | 14 (2.4%) |
| 85 Years and over | 50 (6.3%) | 0 (0.0%) |
| Total | 793 (100.0%) | 596 (100.0%) |
Families and Households in Hays
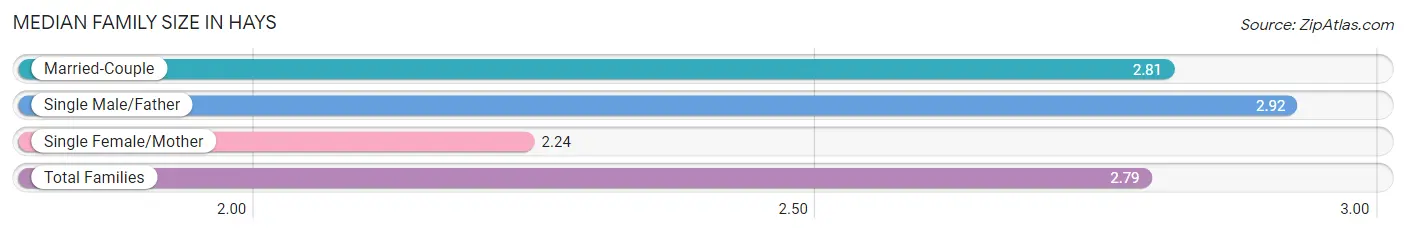
Median Family Size in Hays
The median family size in Hays is 2.79 persons per family, with single male/father families (12 | 2.8%) accounting for the largest median family size of 2.92 persons per family. On the other hand, single female/mother families (17 | 4.0%) represent the smallest median family size with 2.24 persons per family.
| Family Type | # Families | Family Size |
| Married-Couple | 396 (93.2%) | 2.81 |
| Single Male/Father | 12 (2.8%) | 2.92 |
| Single Female/Mother | 17 (4.0%) | 2.24 |
| Total Families | 425 (100.0%) | 2.79 |
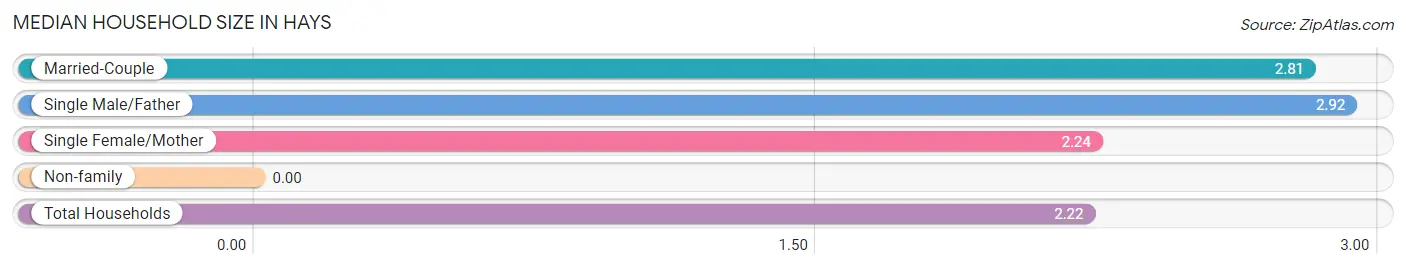
Median Household Size in Hays
| Household Type | # Households | Household Size |
| Married-Couple | 396 (63.2%) | 2.81 |
| Single Male/Father | 12 (1.9%) | 2.92 |
| Single Female/Mother | 17 (2.7%) | 2.24 |
| Non-family | 202 (32.2%) | - |
| Total Households | 627 (100.0%) | 2.22 |
Household Size by Marriage Status in Hays
Out of a total of 627 households in Hays, 425 (67.8%) are family households, while 202 (32.2%) are nonfamily households. The most numerous type of family households are 2-person households, comprising 176, and the most common type of nonfamily households are 1-person households, comprising 202.
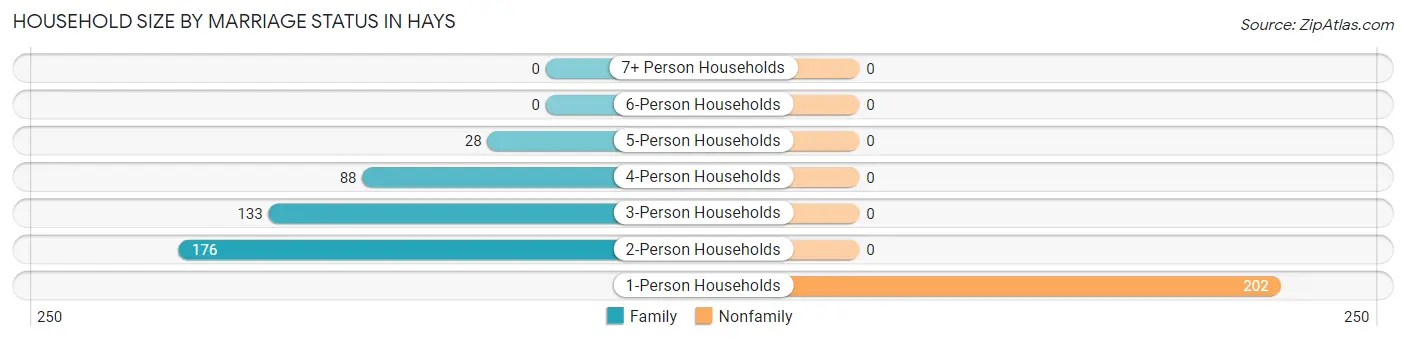
| Household Size | Family Households | Nonfamily Households |
| 1-Person Households | - | 202 (32.2%) |
| 2-Person Households | 176 (28.1%) | 0 (0.0%) |
| 3-Person Households | 133 (21.2%) | 0 (0.0%) |
| 4-Person Households | 88 (14.0%) | 0 (0.0%) |
| 5-Person Households | 28 (4.5%) | 0 (0.0%) |
| 6-Person Households | 0 (0.0%) | 0 (0.0%) |
| 7+ Person Households | 0 (0.0%) | 0 (0.0%) |
| Total | 425 (67.8%) | 202 (32.2%) |
Female Fertility in Hays
Fertility by Age in Hays
Average fertility rate in Hays is 105.0 births per 1,000 women. Women in the age bracket of 20 to 34 years have the highest fertility rate with 168.0 births per 1,000 women. Women in the age bracket of 20 to 34 years acount for 64.0% of all women with births.
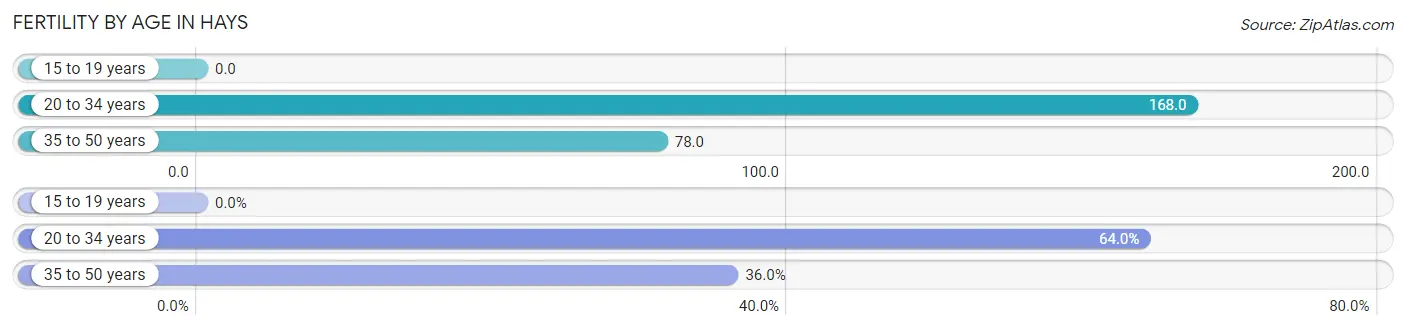
| Age Bracket | Women with Births | Births / 1,000 Women |
| 15 to 19 years | 0 (0.0%) | 0.0 |
| 20 to 34 years | 16 (64.0%) | 168.0 |
| 35 to 50 years | 9 (36.0%) | 78.0 |
| Total | 25 (100.0%) | 105.0 |
Fertility by Age by Marriage Status in Hays
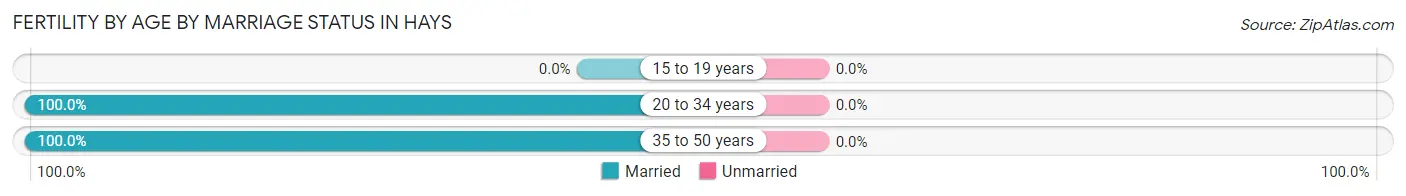
| Age Bracket | Married | Unmarried |
| 15 to 19 years | 0 (0.0%) | 0 (0.0%) |
| 20 to 34 years | 16 (100.0%) | 0 (0.0%) |
| 35 to 50 years | 9 (100.0%) | 0 (0.0%) |
| Total | 25 (100.0%) | 0 (0.0%) |
Fertility by Education in Hays
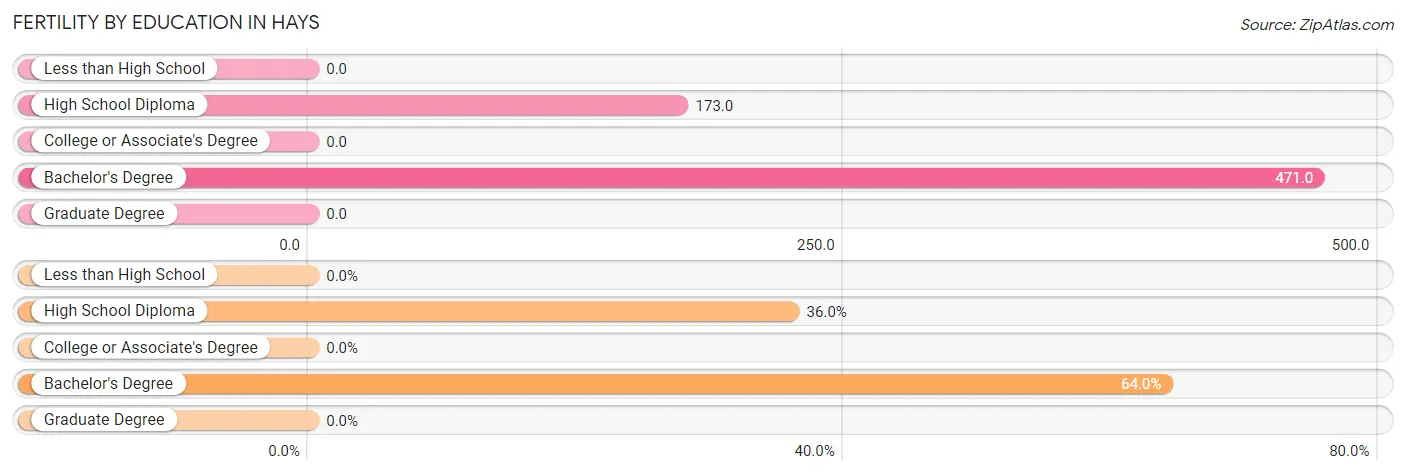
| Educational Attainment | Women with Births | Births / 1,000 Women |
| Less than High School | 0 (0.0%) | 0.0 |
| High School Diploma | 9 (36.0%) | 173.0 |
| College or Associate's Degree | 0 (0.0%) | 0.0 |
| Bachelor's Degree | 16 (64.0%) | 471.0 |
| Graduate Degree | 0 (0.0%) | 0.0 |
| Total | 25 (100.0%) | 105.0 |
Fertility by Education by Marriage Status in Hays
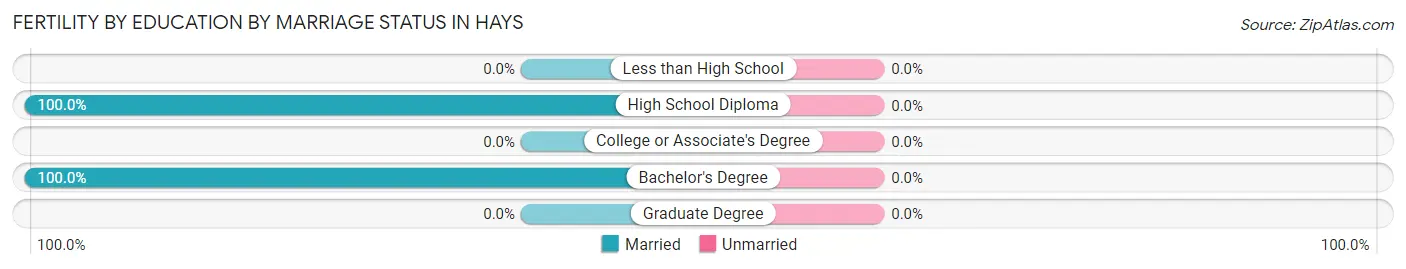
| Educational Attainment | Married | Unmarried |
| Less than High School | 0 (0.0%) | 0 (0.0%) |
| High School Diploma | 9 (100.0%) | 0 (0.0%) |
| College or Associate's Degree | 0 (0.0%) | 0 (0.0%) |
| Bachelor's Degree | 16 (100.0%) | 0 (0.0%) |
| Graduate Degree | 0 (0.0%) | 0 (0.0%) |
| Total | 25 (100.0%) | 0 (0.0%) |
Employment Characteristics in Hays
Employment by Class of Employer in Hays
Among the 657 employed individuals in Hays, private company employees (479 | 72.9%), self-employed (not incorporated) (82 | 12.5%), and not-for-profit organizations (46 | 7.0%) make up the most common classes of employment.
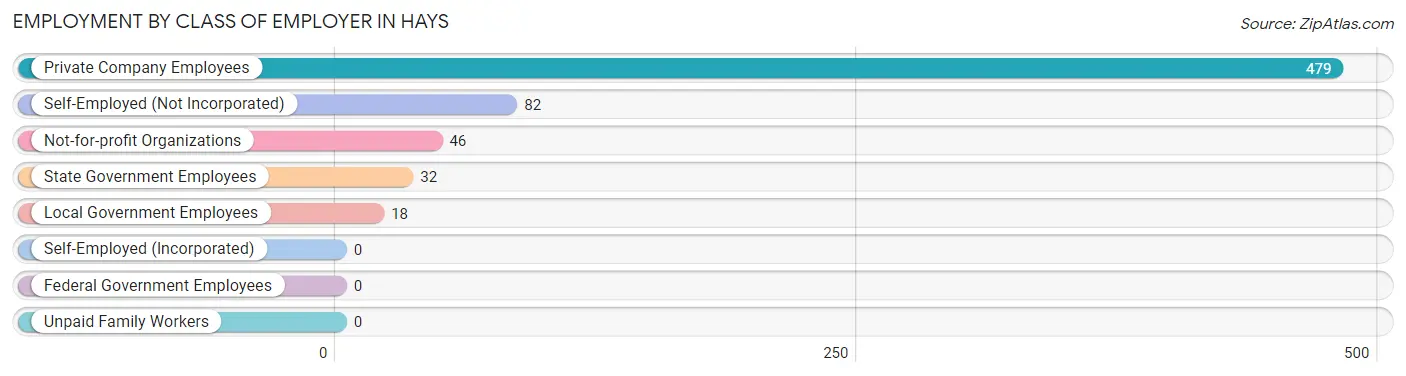
| Employer Class | # Employees | % Employees |
| Private Company Employees | 479 | 72.9% |
| Self-Employed (Incorporated) | 0 | 0.0% |
| Self-Employed (Not Incorporated) | 82 | 12.5% |
| Not-for-profit Organizations | 46 | 7.0% |
| Local Government Employees | 18 | 2.7% |
| State Government Employees | 32 | 4.9% |
| Federal Government Employees | 0 | 0.0% |
| Unpaid Family Workers | 0 | 0.0% |
| Total | 657 | 100.0% |
Employment Status by Age in Hays
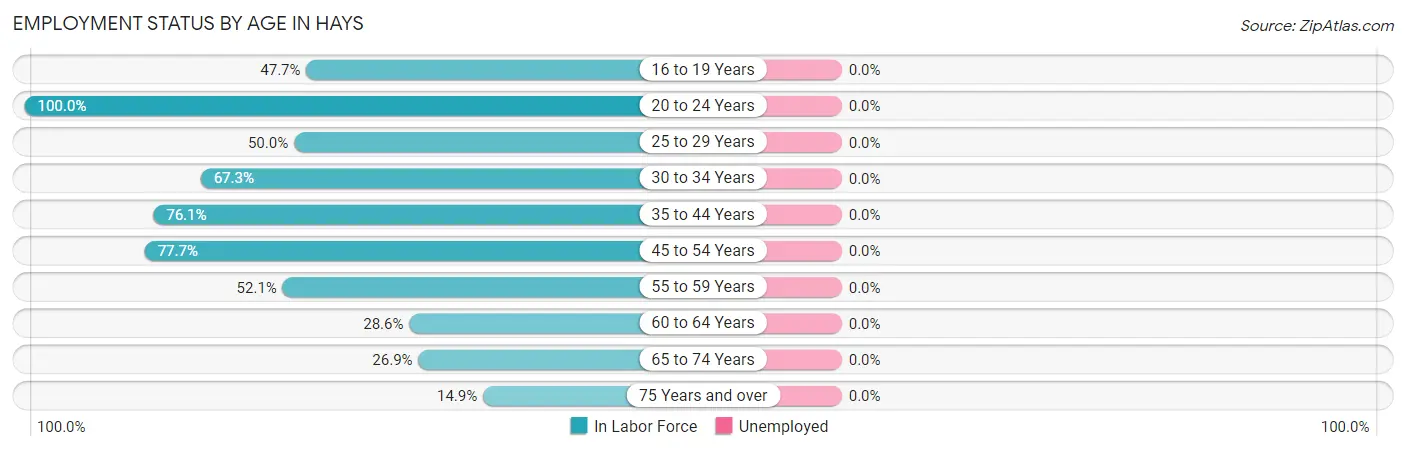
| Age Bracket | In Labor Force | Unemployed |
| 16 to 19 Years | 31 (47.7%) | 0 (0.0%) |
| 20 to 24 Years | 199 (100.0%) | 0 (0.0%) |
| 25 to 29 Years | 19 (50.0%) | 0 (0.0%) |
| 30 to 34 Years | 33 (67.3%) | 0 (0.0%) |
| 35 to 44 Years | 108 (76.1%) | 0 (0.0%) |
| 45 to 54 Years | 94 (77.7%) | 0 (0.0%) |
| 55 to 59 Years | 61 (52.1%) | 0 (0.0%) |
| 60 to 64 Years | 30 (28.6%) | 0 (0.0%) |
| 65 to 74 Years | 68 (26.9%) | 0 (0.0%) |
| 75 Years and over | 14 (14.9%) | 0 (0.0%) |
| Total | 657 (55.5%) | 0 (0.0%) |
Employment Status by Educational Attainment in Hays
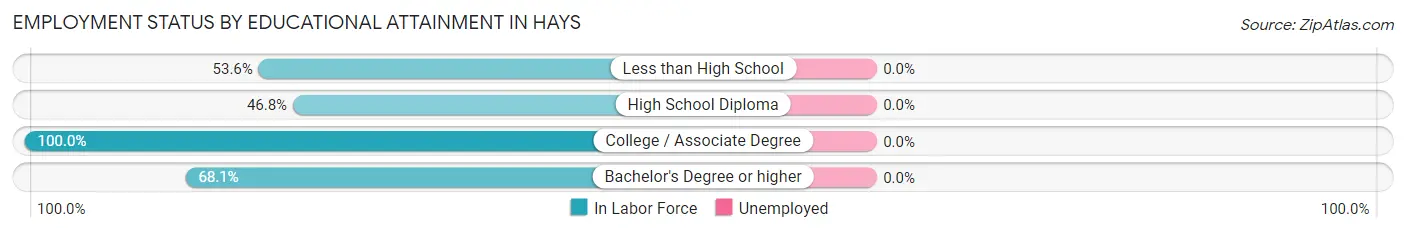
| Educational Attainment | In Labor Force | Unemployed |
| Less than High School | 15 (53.6%) | 0 (0.0%) |
| High School Diploma | 163 (46.8%) | 0 (0.0%) |
| College / Associate Degree | 105 (100.0%) | 0 (0.0%) |
| Bachelor's Degree or higher | 62 (68.1%) | 0 (0.0%) |
| Total | 345 (60.3%) | 0 (0.0%) |
Employment Occupations by Sex in Hays
Management, Business, Science and Arts Occupations
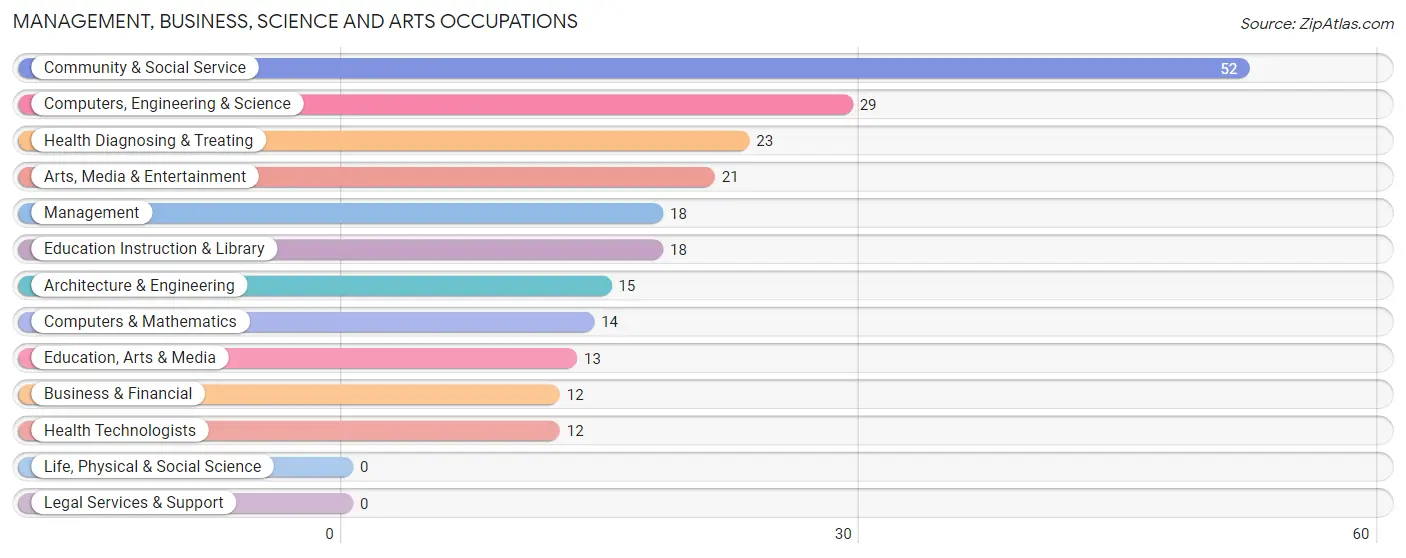
The most common Management, Business, Science and Arts occupations in Hays are Community & Social Service (52 | 7.9%), Computers, Engineering & Science (29 | 4.4%), Health Diagnosing & Treating (23 | 3.5%), Arts, Media & Entertainment (21 | 3.2%), and Management (18 | 2.7%).
Management, Business, Science and Arts Occupations by Sex
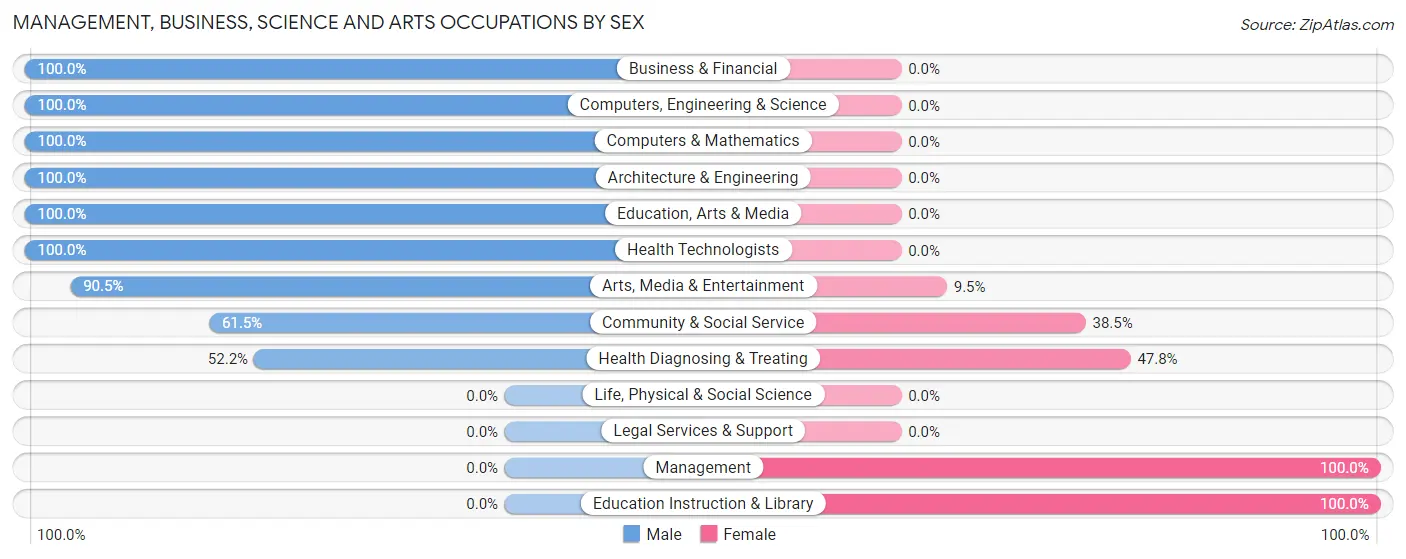
Within the Management, Business, Science and Arts occupations in Hays, the most male-oriented occupations are Business & Financial (100.0%), Computers, Engineering & Science (100.0%), and Computers & Mathematics (100.0%), while the most female-oriented occupations are Management (100.0%), Education Instruction & Library (100.0%), and Health Diagnosing & Treating (47.8%).
| Occupation | Male | Female |
| Management | 0 (0.0%) | 18 (100.0%) |
| Business & Financial | 12 (100.0%) | 0 (0.0%) |
| Computers, Engineering & Science | 29 (100.0%) | 0 (0.0%) |
| Computers & Mathematics | 14 (100.0%) | 0 (0.0%) |
| Architecture & Engineering | 15 (100.0%) | 0 (0.0%) |
| Life, Physical & Social Science | 0 (0.0%) | 0 (0.0%) |
| Community & Social Service | 32 (61.5%) | 20 (38.5%) |
| Education, Arts & Media | 13 (100.0%) | 0 (0.0%) |
| Legal Services & Support | 0 (0.0%) | 0 (0.0%) |
| Education Instruction & Library | 0 (0.0%) | 18 (100.0%) |
| Arts, Media & Entertainment | 19 (90.5%) | 2 (9.5%) |
| Health Diagnosing & Treating | 12 (52.2%) | 11 (47.8%) |
| Health Technologists | 12 (100.0%) | 0 (0.0%) |
| Total (Category) | 85 (63.4%) | 49 (36.6%) |
| Total (Overall) | 441 (67.1%) | 216 (32.9%) |
Services Occupations
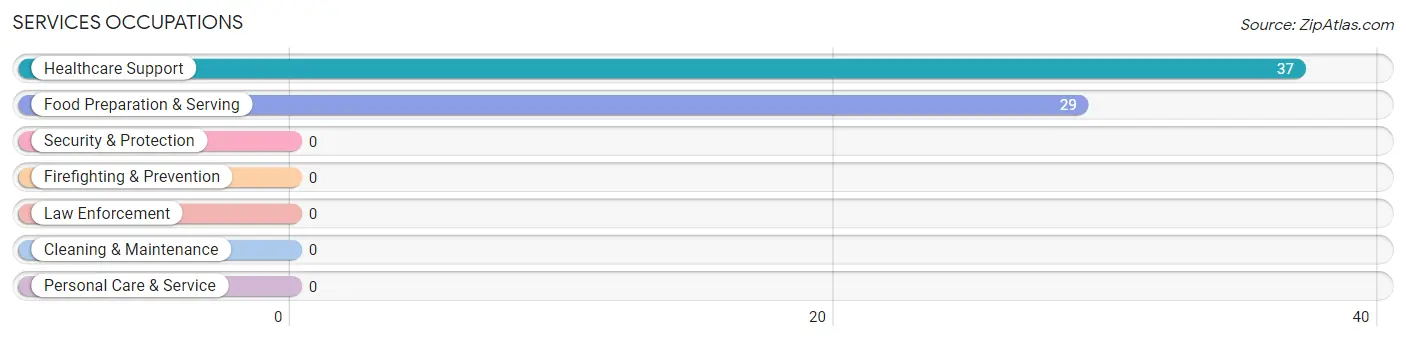
The most common Services occupations in Hays are Healthcare Support (37 | 5.6%), and Food Preparation & Serving (29 | 4.4%).
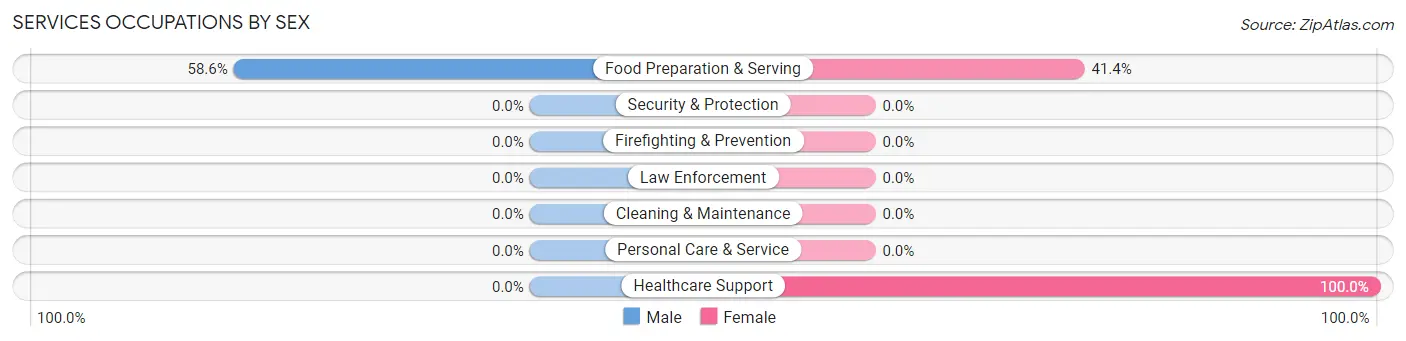
Services Occupations by Sex
| Occupation | Male | Female |
| Healthcare Support | 0 (0.0%) | 37 (100.0%) |
| Security & Protection | 0 (0.0%) | 0 (0.0%) |
| Firefighting & Prevention | 0 (0.0%) | 0 (0.0%) |
| Law Enforcement | 0 (0.0%) | 0 (0.0%) |
| Food Preparation & Serving | 17 (58.6%) | 12 (41.4%) |
| Cleaning & Maintenance | 0 (0.0%) | 0 (0.0%) |
| Personal Care & Service | 0 (0.0%) | 0 (0.0%) |
| Total (Category) | 17 (25.8%) | 49 (74.2%) |
| Total (Overall) | 441 (67.1%) | 216 (32.9%) |
Sales and Office Occupations
The most common Sales and Office occupations in Hays are Office & Administration (72 | 11.0%), and Sales & Related (10 | 1.5%).
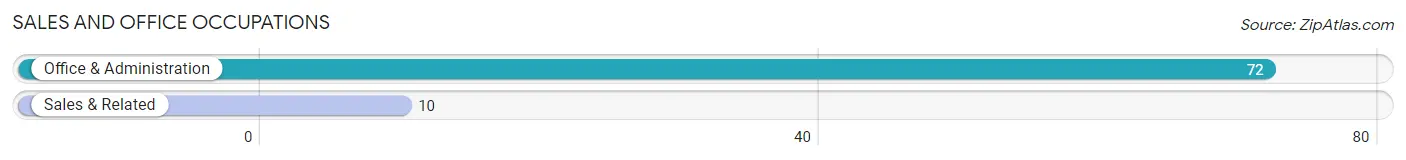
Sales and Office Occupations by Sex
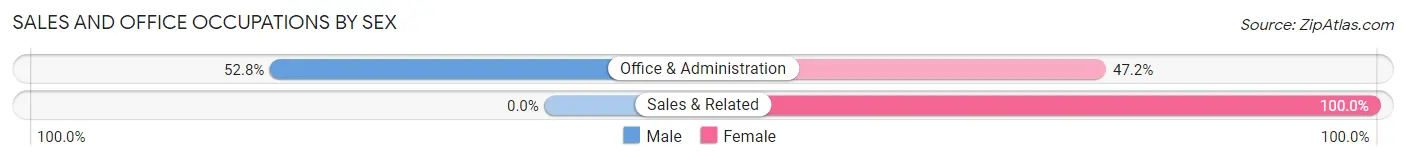
| Occupation | Male | Female |
| Sales & Related | 0 (0.0%) | 10 (100.0%) |
| Office & Administration | 38 (52.8%) | 34 (47.2%) |
| Total (Category) | 38 (46.3%) | 44 (53.7%) |
| Total (Overall) | 441 (67.1%) | 216 (32.9%) |
Natural Resources, Construction and Maintenance Occupations
The most common Natural Resources, Construction and Maintenance occupations in Hays are Installation, Maintenance & Repair (116 | 17.7%), Construction & Extraction (36 | 5.5%), and Farming, Fishing & Forestry (12 | 1.8%).
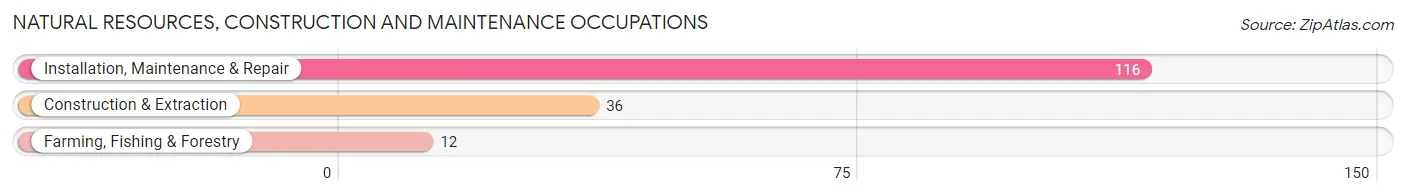
Natural Resources, Construction and Maintenance Occupations by Sex
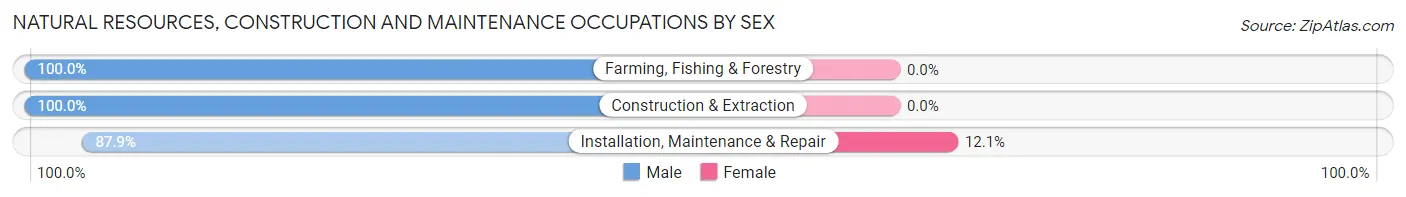
| Occupation | Male | Female |
| Farming, Fishing & Forestry | 12 (100.0%) | 0 (0.0%) |
| Construction & Extraction | 36 (100.0%) | 0 (0.0%) |
| Installation, Maintenance & Repair | 102 (87.9%) | 14 (12.1%) |
| Total (Category) | 150 (91.5%) | 14 (8.5%) |
| Total (Overall) | 441 (67.1%) | 216 (32.9%) |
Production, Transportation and Moving Occupations
The most common Production, Transportation and Moving occupations in Hays are Production (196 | 29.8%), and Transportation (15 | 2.3%).
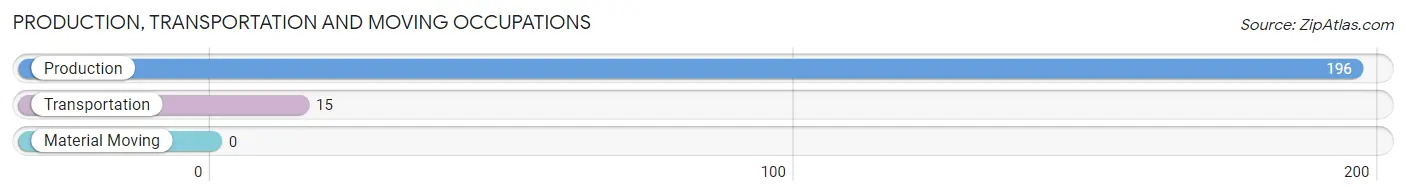
Production, Transportation and Moving Occupations by Sex
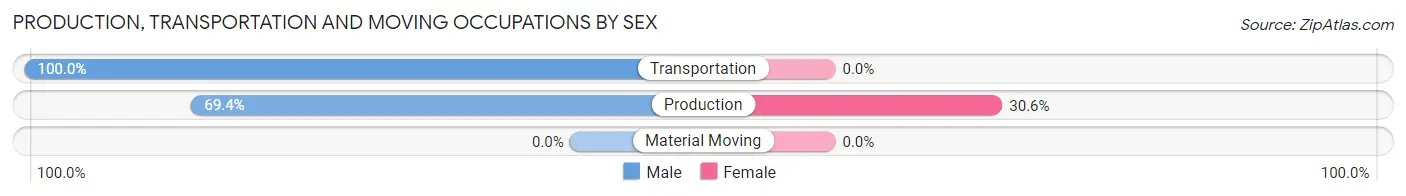
| Occupation | Male | Female |
| Production | 136 (69.4%) | 60 (30.6%) |
| Transportation | 15 (100.0%) | 0 (0.0%) |
| Material Moving | 0 (0.0%) | 0 (0.0%) |
| Total (Category) | 151 (71.6%) | 60 (28.4%) |
| Total (Overall) | 441 (67.1%) | 216 (32.9%) |
Employment Industries by Sex in Hays
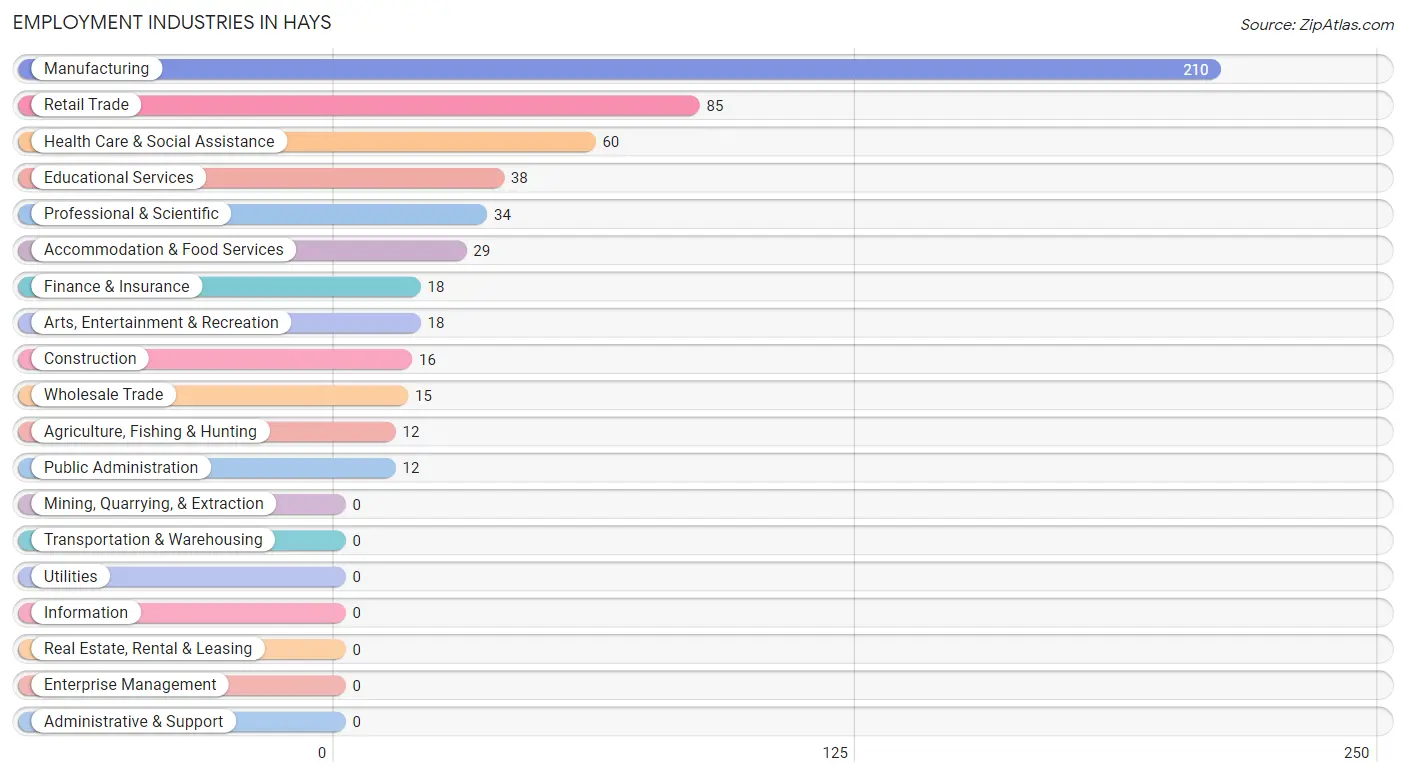
Employment Industries in Hays
The major employment industries in Hays include Manufacturing (210 | 32.0%), Retail Trade (85 | 12.9%), Health Care & Social Assistance (60 | 9.1%), Educational Services (38 | 5.8%), and Professional & Scientific (34 | 5.2%).
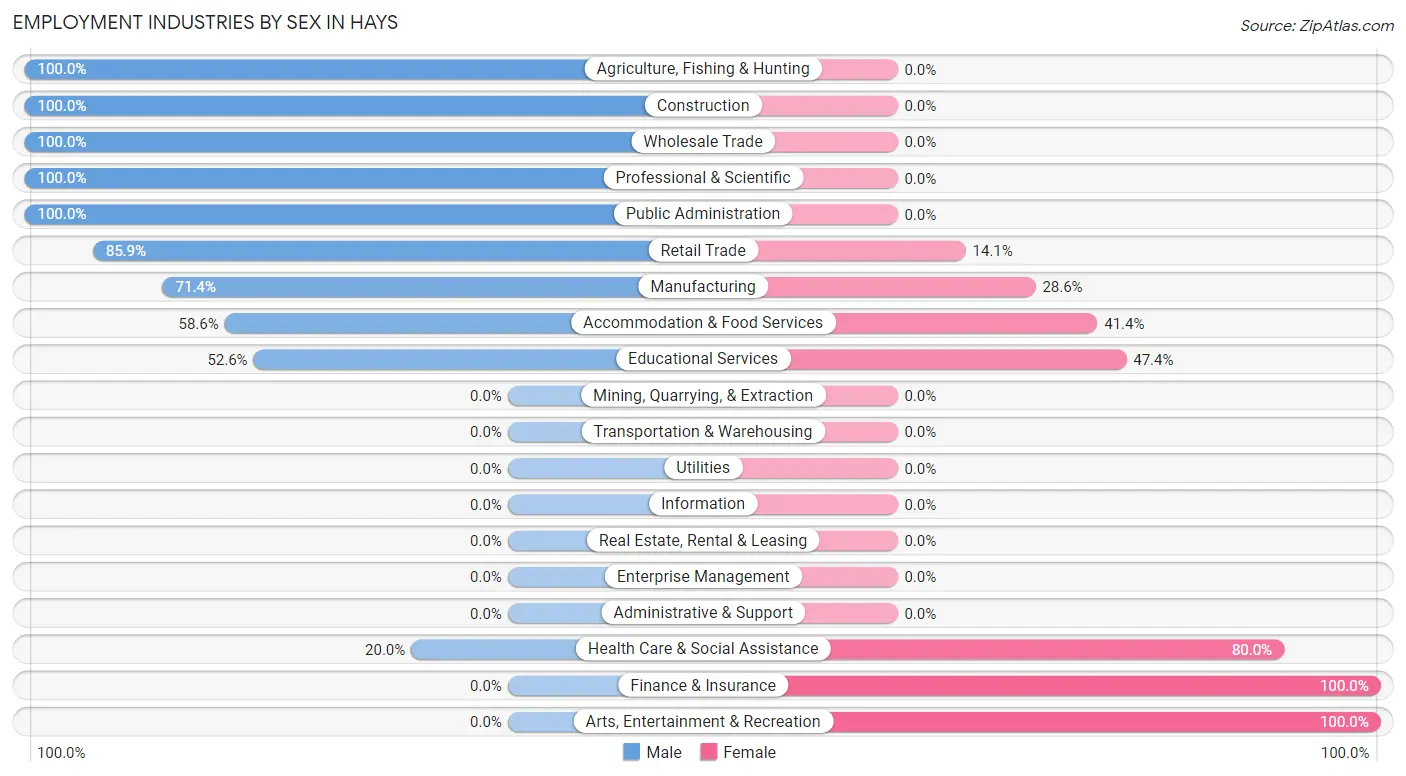
Employment Industries by Sex in Hays
The Hays industries that see more men than women are Agriculture, Fishing & Hunting (100.0%), Construction (100.0%), and Wholesale Trade (100.0%), whereas the industries that tend to have a higher number of women are Finance & Insurance (100.0%), Arts, Entertainment & Recreation (100.0%), and Health Care & Social Assistance (80.0%).
| Industry | Male | Female |
| Agriculture, Fishing & Hunting | 12 (100.0%) | 0 (0.0%) |
| Mining, Quarrying, & Extraction | 0 (0.0%) | 0 (0.0%) |
| Construction | 16 (100.0%) | 0 (0.0%) |
| Manufacturing | 150 (71.4%) | 60 (28.6%) |
| Wholesale Trade | 15 (100.0%) | 0 (0.0%) |
| Retail Trade | 73 (85.9%) | 12 (14.1%) |
| Transportation & Warehousing | 0 (0.0%) | 0 (0.0%) |
| Utilities | 0 (0.0%) | 0 (0.0%) |
| Information | 0 (0.0%) | 0 (0.0%) |
| Finance & Insurance | 0 (0.0%) | 18 (100.0%) |
| Real Estate, Rental & Leasing | 0 (0.0%) | 0 (0.0%) |
| Professional & Scientific | 34 (100.0%) | 0 (0.0%) |
| Enterprise Management | 0 (0.0%) | 0 (0.0%) |
| Administrative & Support | 0 (0.0%) | 0 (0.0%) |
| Educational Services | 20 (52.6%) | 18 (47.4%) |
| Health Care & Social Assistance | 12 (20.0%) | 48 (80.0%) |
| Arts, Entertainment & Recreation | 0 (0.0%) | 18 (100.0%) |
| Accommodation & Food Services | 17 (58.6%) | 12 (41.4%) |
| Public Administration | 12 (100.0%) | 0 (0.0%) |
| Total | 441 (67.1%) | 216 (32.9%) |
Education in Hays
School Enrollment in Hays
The most common levels of schooling among the 202 students in Hays are middle school (84 | 41.6%), college / undergraduate (52 | 25.7%), and nursery / preschool (28 | 13.9%).
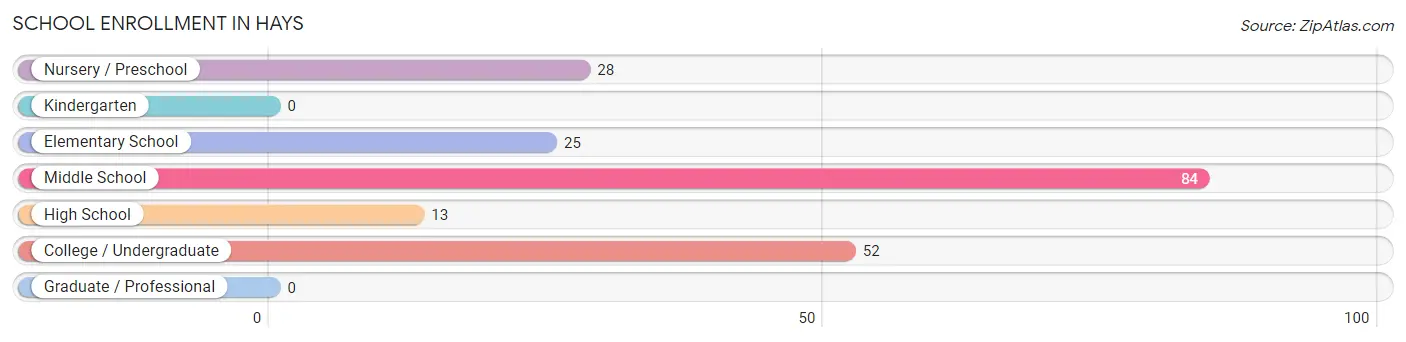
| School Level | # Students | % Students |
| Nursery / Preschool | 28 | 13.9% |
| Kindergarten | 0 | 0.0% |
| Elementary School | 25 | 12.4% |
| Middle School | 84 | 41.6% |
| High School | 13 | 6.4% |
| College / Undergraduate | 52 | 25.7% |
| Graduate / Professional | 0 | 0.0% |
| Total | 202 | 100.0% |
School Enrollment by Age by Funding Source in Hays
Out of a total of 202 students who are enrolled in schools in Hays, 29 (14.4%) attend a private institution, while the remaining 173 (85.6%) are enrolled in public schools. The age group of 5 to 9 year old has the highest likelihood of being enrolled in private schools, with 14 (56.0% in the age bracket) enrolled. Conversely, the age group of 10 to 14 year olds has the lowest likelihood of being enrolled in a private school, with 84 (100.0% in the age bracket) attending a public institution.
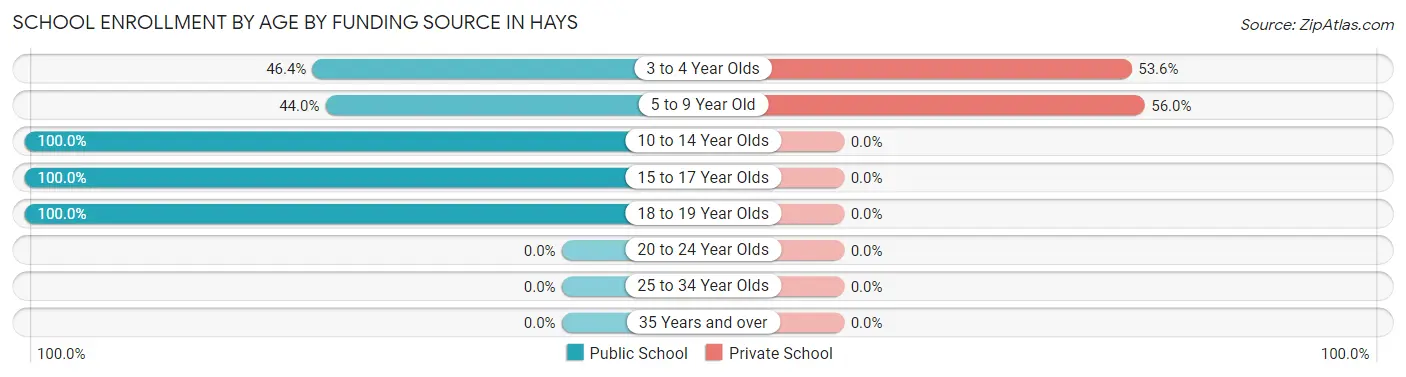
| Age Bracket | Public School | Private School |
| 3 to 4 Year Olds | 13 (46.4%) | 15 (53.6%) |
| 5 to 9 Year Old | 11 (44.0%) | 14 (56.0%) |
| 10 to 14 Year Olds | 84 (100.0%) | 0 (0.0%) |
| 15 to 17 Year Olds | 13 (100.0%) | 0 (0.0%) |
| 18 to 19 Year Olds | 52 (100.0%) | 0 (0.0%) |
| 20 to 24 Year Olds | 0 (0.0%) | 0 (0.0%) |
| 25 to 34 Year Olds | 0 (0.0%) | 0 (0.0%) |
| 35 Years and over | 0 (0.0%) | 0 (0.0%) |
| Total | 173 (85.6%) | 29 (14.4%) |
Educational Attainment by Field of Study in Hays
Business (31 | 34.1%), science & technology (16 | 17.6%), education (16 | 17.6%), engineering (15 | 16.5%), and physical & health sciences (13 | 14.3%) are the most common fields of study among 91 individuals in Hays who have obtained a bachelor's degree or higher.
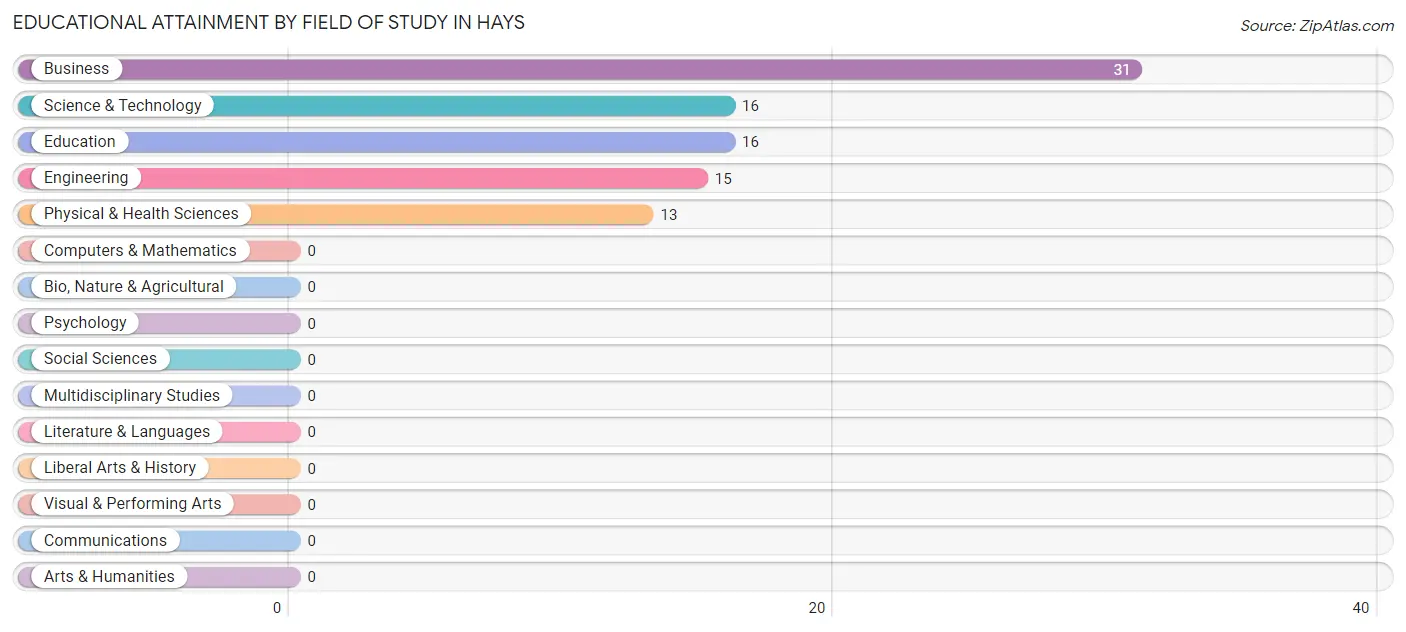
| Field of Study | # Graduates | % Graduates |
| Computers & Mathematics | 0 | 0.0% |
| Bio, Nature & Agricultural | 0 | 0.0% |
| Physical & Health Sciences | 13 | 14.3% |
| Psychology | 0 | 0.0% |
| Social Sciences | 0 | 0.0% |
| Engineering | 15 | 16.5% |
| Multidisciplinary Studies | 0 | 0.0% |
| Science & Technology | 16 | 17.6% |
| Business | 31 | 34.1% |
| Education | 16 | 17.6% |
| Literature & Languages | 0 | 0.0% |
| Liberal Arts & History | 0 | 0.0% |
| Visual & Performing Arts | 0 | 0.0% |
| Communications | 0 | 0.0% |
| Arts & Humanities | 0 | 0.0% |
| Total | 91 | 100.0% |
Transportation & Commute in Hays
Vehicle Availability by Sex in Hays
The most prevalent vehicle ownership categories in Hays are males with 2 vehicles (136, accounting for 30.8%) and females with 2 vehicles (78, making up 63.0%).
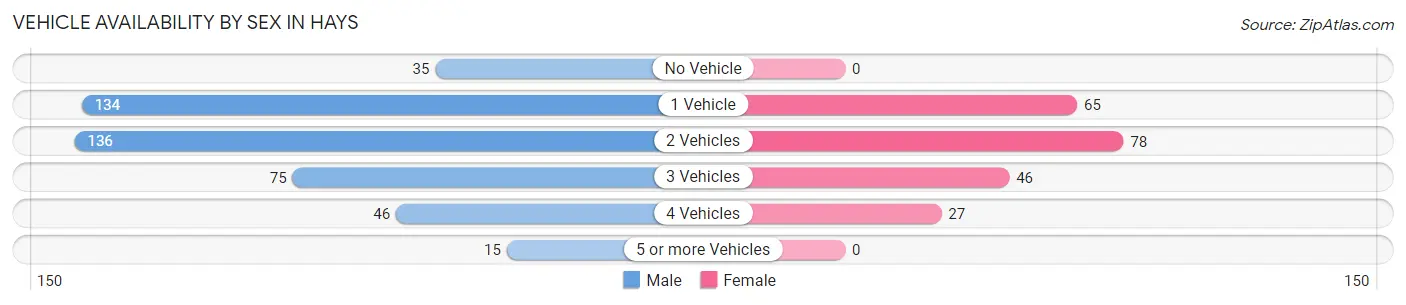
| Vehicles Available | Male | Female |
| No Vehicle | 35 (7.9%) | 0 (0.0%) |
| 1 Vehicle | 134 (30.4%) | 65 (30.1%) |
| 2 Vehicles | 136 (30.8%) | 78 (36.1%) |
| 3 Vehicles | 75 (17.0%) | 46 (21.3%) |
| 4 Vehicles | 46 (10.4%) | 27 (12.5%) |
| 5 or more Vehicles | 15 (3.4%) | 0 (0.0%) |
| Total | 441 (100.0%) | 216 (100.0%) |
Commute Time in Hays
The most frequently occuring commute durations in Hays are 30 to 34 minutes (283 commuters, 43.2%), 20 to 24 minutes (124 commuters, 18.9%), and 15 to 19 minutes (74 commuters, 11.3%).
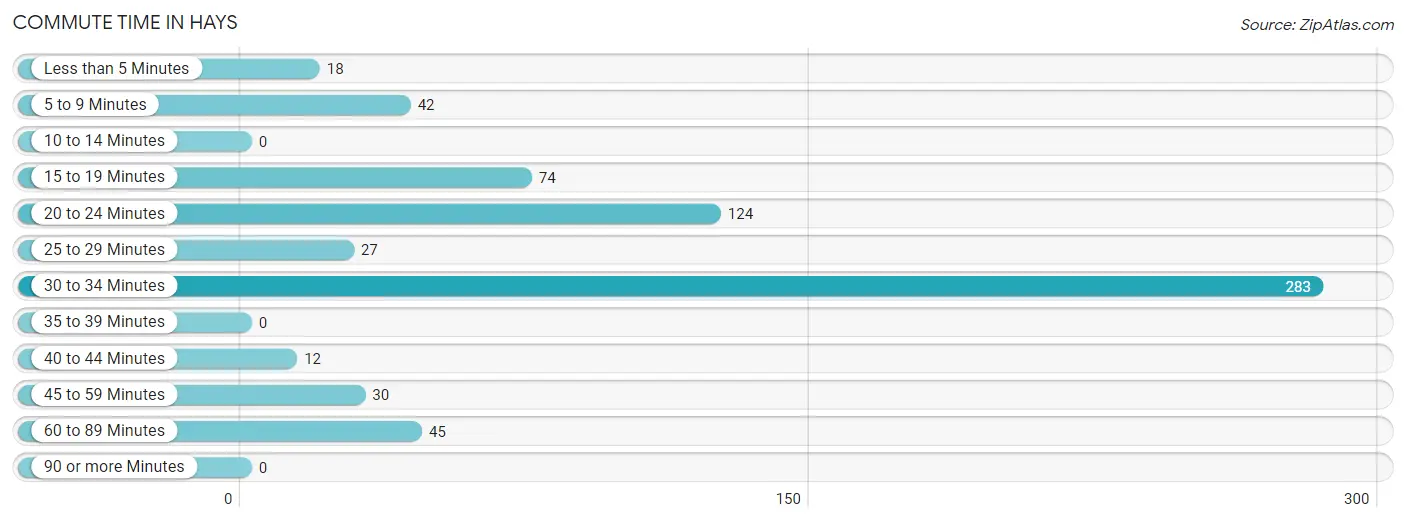
| Commute Time | # Commuters | % Commuters |
| Less than 5 Minutes | 18 | 2.8% |
| 5 to 9 Minutes | 42 | 6.4% |
| 10 to 14 Minutes | 0 | 0.0% |
| 15 to 19 Minutes | 74 | 11.3% |
| 20 to 24 Minutes | 124 | 18.9% |
| 25 to 29 Minutes | 27 | 4.1% |
| 30 to 34 Minutes | 283 | 43.2% |
| 35 to 39 Minutes | 0 | 0.0% |
| 40 to 44 Minutes | 12 | 1.8% |
| 45 to 59 Minutes | 30 | 4.6% |
| 60 to 89 Minutes | 45 | 6.9% |
| 90 or more Minutes | 0 | 0.0% |
Commute Time by Sex in Hays
The most common commute times in Hays are 30 to 34 minutes (265 commuters, 60.1%) for males and 20 to 24 minutes (109 commuters, 50.9%) for females.
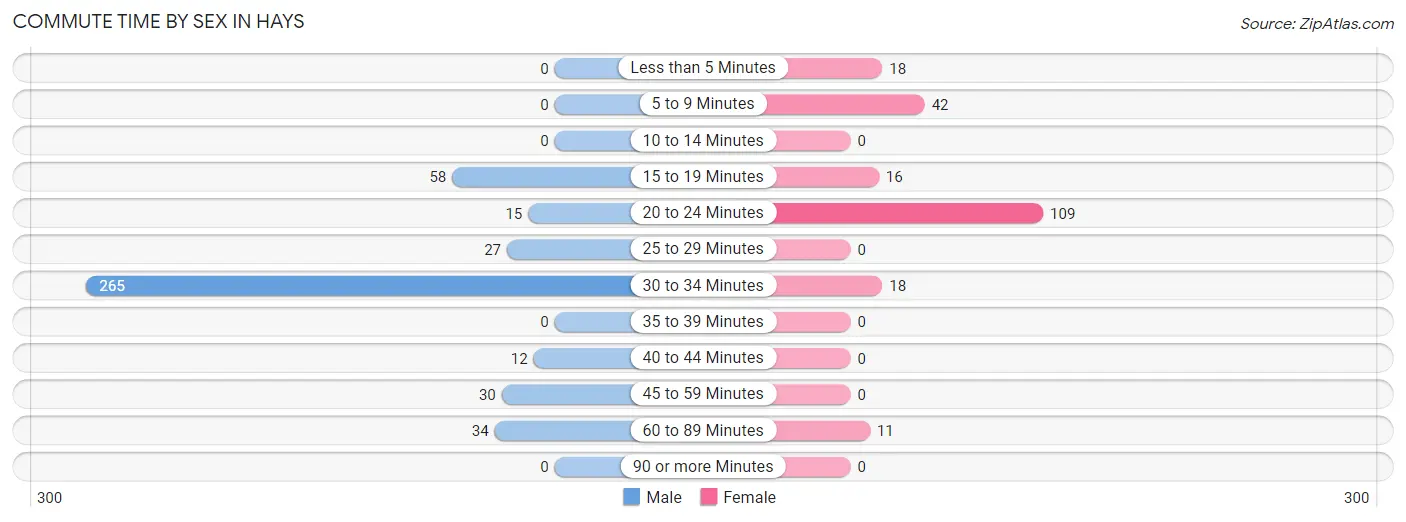
| Commute Time | Male | Female |
| Less than 5 Minutes | 0 (0.0%) | 18 (8.4%) |
| 5 to 9 Minutes | 0 (0.0%) | 42 (19.6%) |
| 10 to 14 Minutes | 0 (0.0%) | 0 (0.0%) |
| 15 to 19 Minutes | 58 (13.2%) | 16 (7.5%) |
| 20 to 24 Minutes | 15 (3.4%) | 109 (50.9%) |
| 25 to 29 Minutes | 27 (6.1%) | 0 (0.0%) |
| 30 to 34 Minutes | 265 (60.1%) | 18 (8.4%) |
| 35 to 39 Minutes | 0 (0.0%) | 0 (0.0%) |
| 40 to 44 Minutes | 12 (2.7%) | 0 (0.0%) |
| 45 to 59 Minutes | 30 (6.8%) | 0 (0.0%) |
| 60 to 89 Minutes | 34 (7.7%) | 11 (5.1%) |
| 90 or more Minutes | 0 (0.0%) | 0 (0.0%) |
Time of Departure to Work by Sex in Hays
The most frequent times of departure to work in Hays are 8:30 AM to 8:59 AM (131, 29.7%) for males and 5:00 AM to 5:29 AM (78, 36.4%) for females.
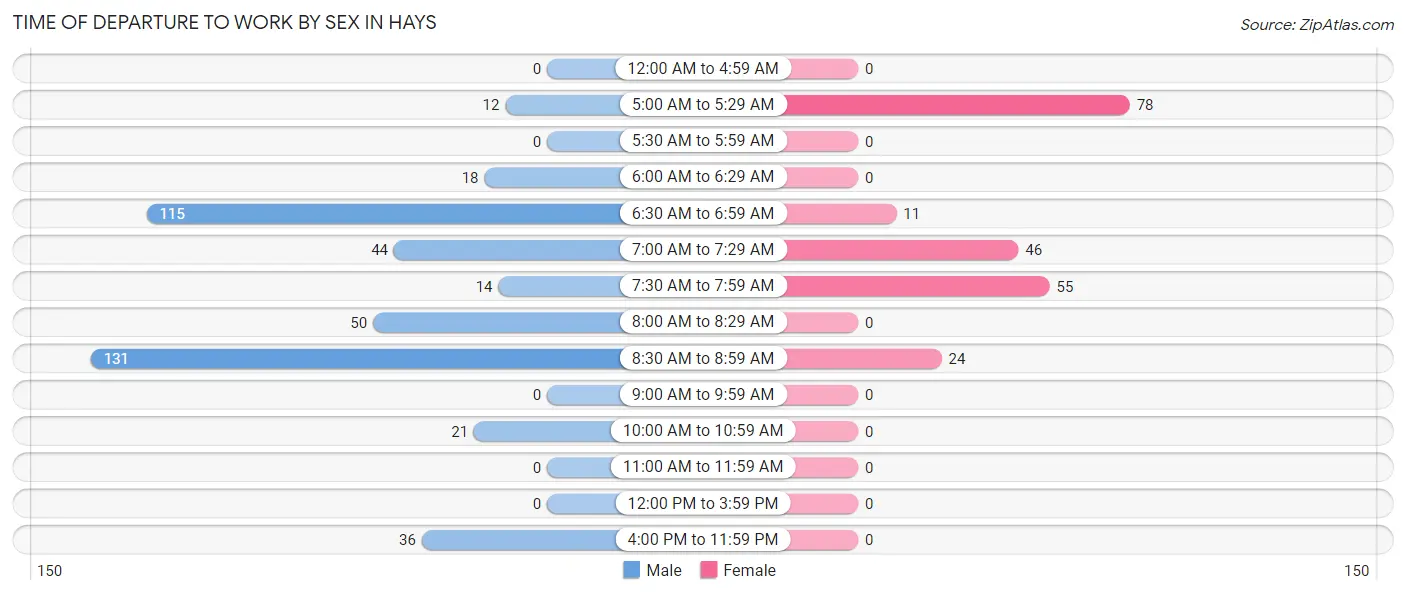
| Time of Departure | Male | Female |
| 12:00 AM to 4:59 AM | 0 (0.0%) | 0 (0.0%) |
| 5:00 AM to 5:29 AM | 12 (2.7%) | 78 (36.4%) |
| 5:30 AM to 5:59 AM | 0 (0.0%) | 0 (0.0%) |
| 6:00 AM to 6:29 AM | 18 (4.1%) | 0 (0.0%) |
| 6:30 AM to 6:59 AM | 115 (26.1%) | 11 (5.1%) |
| 7:00 AM to 7:29 AM | 44 (10.0%) | 46 (21.5%) |
| 7:30 AM to 7:59 AM | 14 (3.2%) | 55 (25.7%) |
| 8:00 AM to 8:29 AM | 50 (11.3%) | 0 (0.0%) |
| 8:30 AM to 8:59 AM | 131 (29.7%) | 24 (11.2%) |
| 9:00 AM to 9:59 AM | 0 (0.0%) | 0 (0.0%) |
| 10:00 AM to 10:59 AM | 21 (4.8%) | 0 (0.0%) |
| 11:00 AM to 11:59 AM | 0 (0.0%) | 0 (0.0%) |
| 12:00 PM to 3:59 PM | 0 (0.0%) | 0 (0.0%) |
| 4:00 PM to 11:59 PM | 36 (8.2%) | 0 (0.0%) |
| Total | 441 (100.0%) | 214 (100.0%) |
Housing Occupancy in Hays
Occupancy by Ownership in Hays
Of the total 627 dwellings in Hays, owner-occupied units account for 510 (81.3%), while renter-occupied units make up 117 (18.7%).
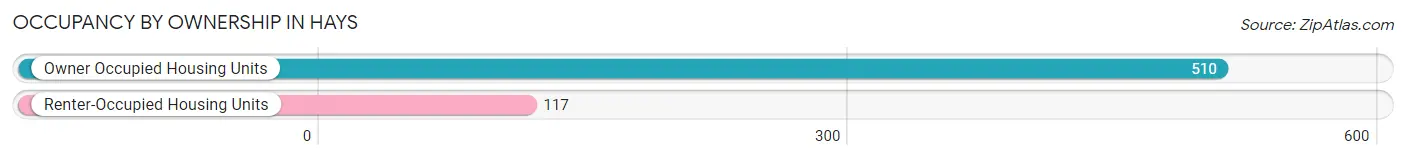
| Occupancy | # Housing Units | % Housing Units |
| Owner Occupied Housing Units | 510 | 81.3% |
| Renter-Occupied Housing Units | 117 | 18.7% |
| Total Occupied Housing Units | 627 | 100.0% |
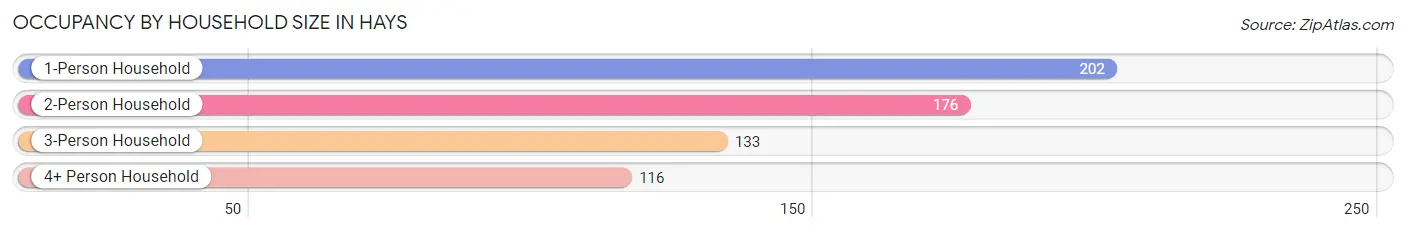
Occupancy by Household Size in Hays
| Household Size | # Housing Units | % Housing Units |
| 1-Person Household | 202 | 32.2% |
| 2-Person Household | 176 | 28.1% |
| 3-Person Household | 133 | 21.2% |
| 4+ Person Household | 116 | 18.5% |
| Total Housing Units | 627 | 100.0% |
Occupancy by Ownership by Household Size in Hays
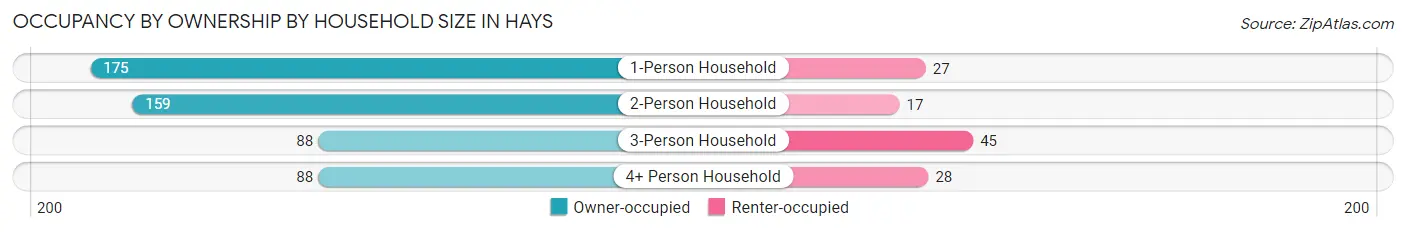
| Household Size | Owner-occupied | Renter-occupied |
| 1-Person Household | 175 (86.6%) | 27 (13.4%) |
| 2-Person Household | 159 (90.3%) | 17 (9.7%) |
| 3-Person Household | 88 (66.2%) | 45 (33.8%) |
| 4+ Person Household | 88 (75.9%) | 28 (24.1%) |
| Total Housing Units | 510 (81.3%) | 117 (18.7%) |
Occupancy by Educational Attainment in Hays

| Household Size | Owner-occupied | Renter-occupied |
| Less than High School | 95 (70.4%) | 40 (29.6%) |
| High School Diploma | 171 (69.0%) | 77 (31.0%) |
| College/Associate Degree | 199 (100.0%) | 0 (0.0%) |
| Bachelor's Degree or higher | 45 (100.0%) | 0 (0.0%) |
Occupancy by Age of Householder in Hays
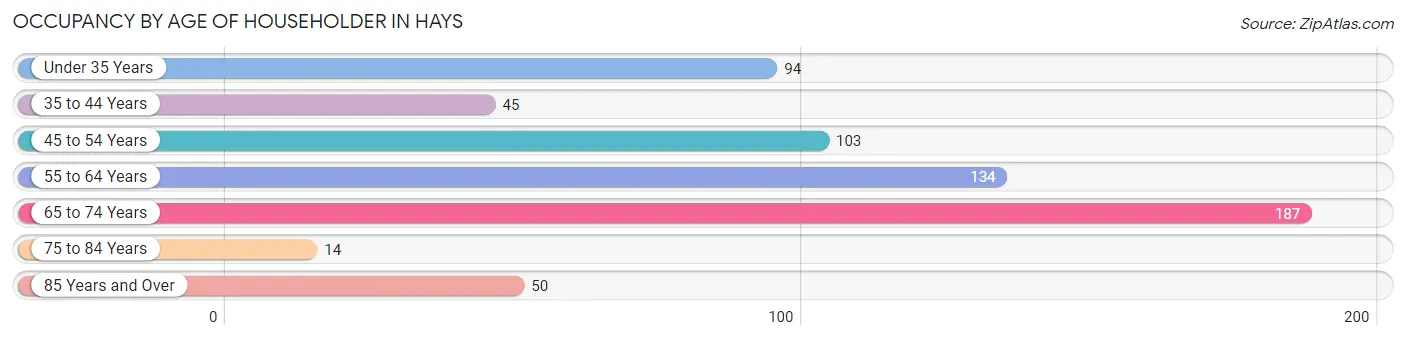
| Age Bracket | # Households | % Households |
| Under 35 Years | 94 | 15.0% |
| 35 to 44 Years | 45 | 7.2% |
| 45 to 54 Years | 103 | 16.4% |
| 55 to 64 Years | 134 | 21.4% |
| 65 to 74 Years | 187 | 29.8% |
| 75 to 84 Years | 14 | 2.2% |
| 85 Years and Over | 50 | 8.0% |
| Total | 627 | 100.0% |
Housing Finances in Hays
Median Income by Occupancy in Hays
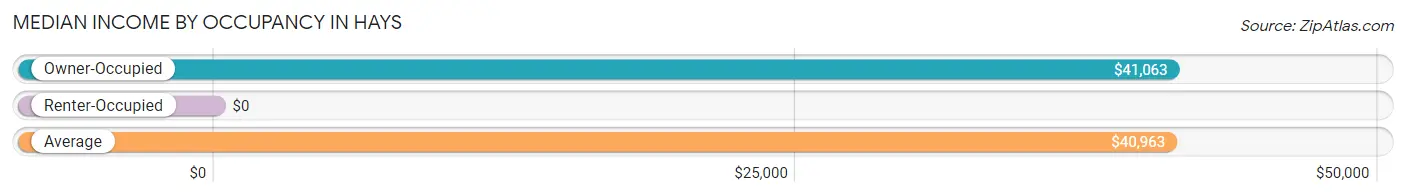
| Occupancy Type | # Households | Median Income |
| Owner-Occupied | 510 (81.3%) | $41,063 |
| Renter-Occupied | 117 (18.7%) | $0 |
| Average | 627 (100.0%) | $40,963 |
Occupancy by Householder Income Bracket in Hays
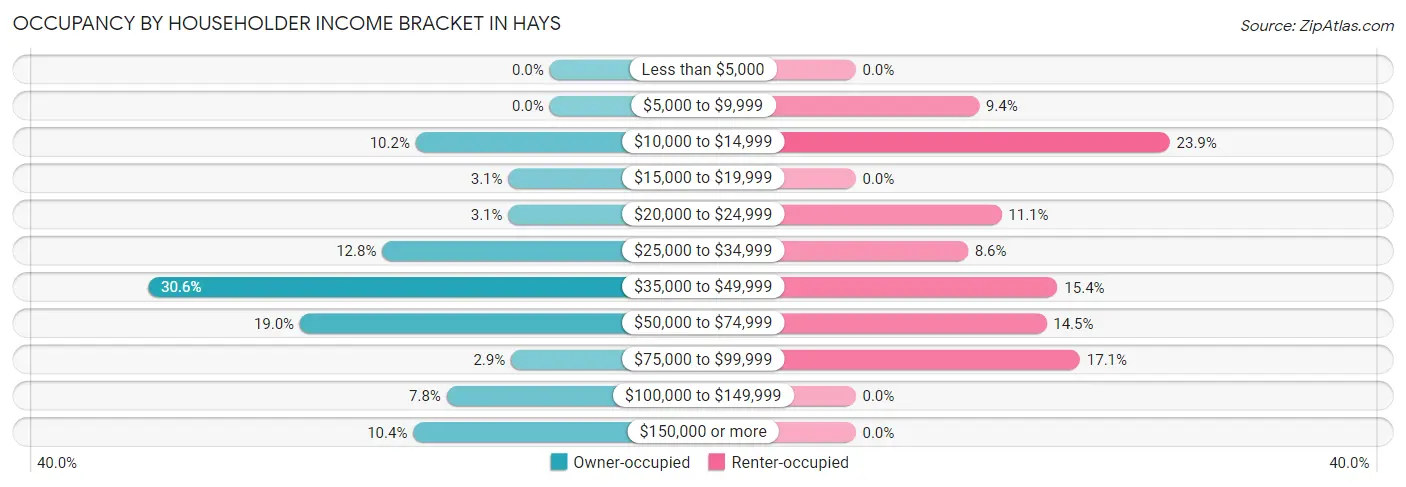
| Income Bracket | Owner-occupied | Renter-occupied |
| Less than $5,000 | 0 (0.0%) | 0 (0.0%) |
| $5,000 to $9,999 | 0 (0.0%) | 11 (9.4%) |
| $10,000 to $14,999 | 52 (10.2%) | 28 (23.9%) |
| $15,000 to $19,999 | 16 (3.1%) | 0 (0.0%) |
| $20,000 to $24,999 | 16 (3.1%) | 13 (11.1%) |
| $25,000 to $34,999 | 65 (12.8%) | 10 (8.6%) |
| $35,000 to $49,999 | 156 (30.6%) | 18 (15.4%) |
| $50,000 to $74,999 | 97 (19.0%) | 17 (14.5%) |
| $75,000 to $99,999 | 15 (2.9%) | 20 (17.1%) |
| $100,000 to $149,999 | 40 (7.8%) | 0 (0.0%) |
| $150,000 or more | 53 (10.4%) | 0 (0.0%) |
| Total | 510 (100.0%) | 117 (100.0%) |
Monthly Housing Cost Tiers in Hays
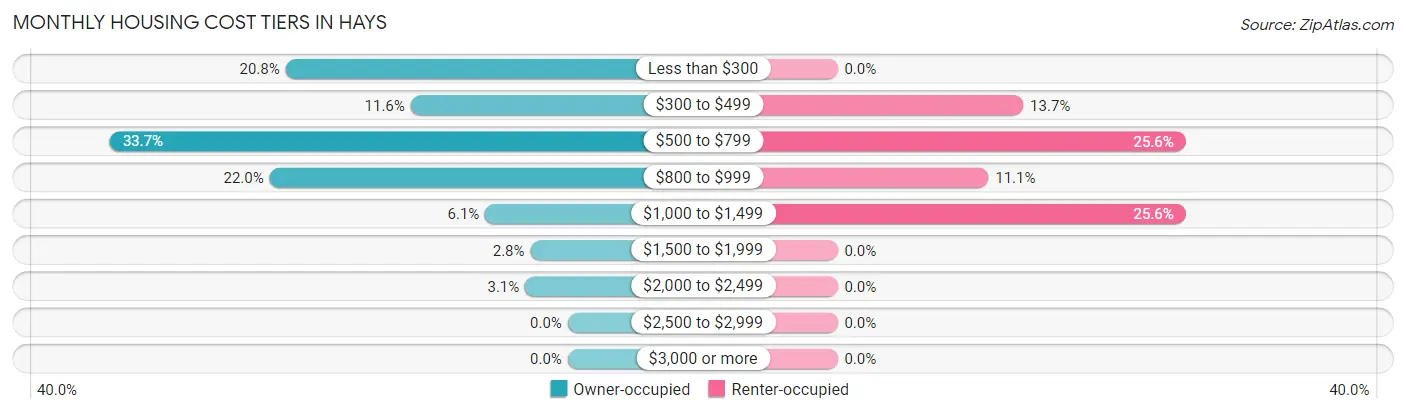
| Monthly Cost | Owner-occupied | Renter-occupied |
| Less than $300 | 106 (20.8%) | 0 (0.0%) |
| $300 to $499 | 59 (11.6%) | 16 (13.7%) |
| $500 to $799 | 172 (33.7%) | 30 (25.6%) |
| $800 to $999 | 112 (22.0%) | 13 (11.1%) |
| $1,000 to $1,499 | 31 (6.1%) | 30 (25.6%) |
| $1,500 to $1,999 | 14 (2.8%) | 0 (0.0%) |
| $2,000 to $2,499 | 16 (3.1%) | 0 (0.0%) |
| $2,500 to $2,999 | 0 (0.0%) | 0 (0.0%) |
| $3,000 or more | 0 (0.0%) | 0 (0.0%) |
| Total | 510 (100.0%) | 117 (100.0%) |
Physical Housing Characteristics in Hays
Housing Structures in Hays
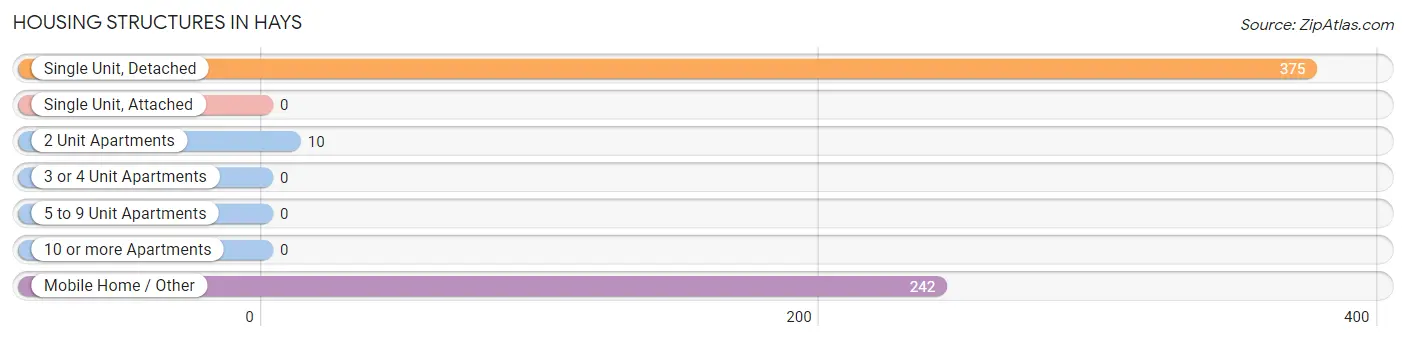
| Structure Type | # Housing Units | % Housing Units |
| Single Unit, Detached | 375 | 59.8% |
| Single Unit, Attached | 0 | 0.0% |
| 2 Unit Apartments | 10 | 1.6% |
| 3 or 4 Unit Apartments | 0 | 0.0% |
| 5 to 9 Unit Apartments | 0 | 0.0% |
| 10 or more Apartments | 0 | 0.0% |
| Mobile Home / Other | 242 | 38.6% |
| Total | 627 | 100.0% |
Housing Structures by Occupancy in Hays
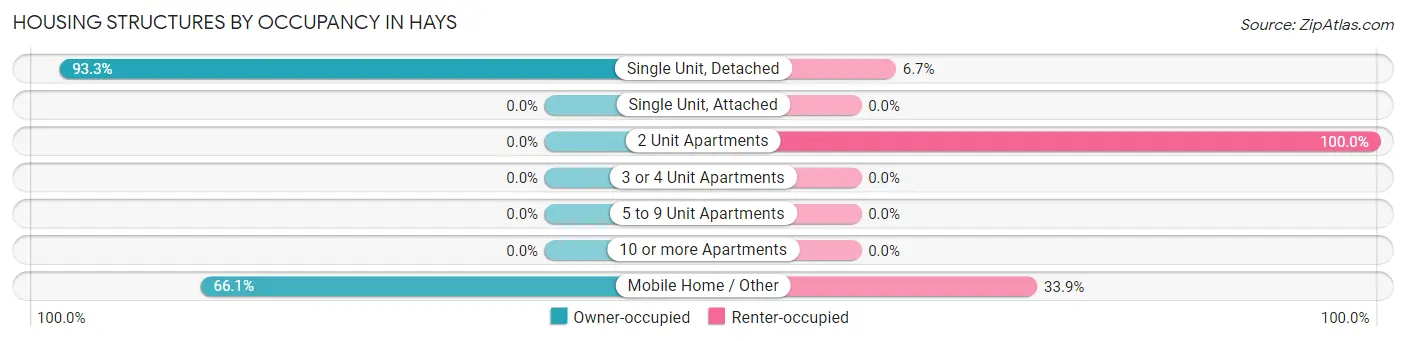
| Structure Type | Owner-occupied | Renter-occupied |
| Single Unit, Detached | 350 (93.3%) | 25 (6.7%) |
| Single Unit, Attached | 0 (0.0%) | 0 (0.0%) |
| 2 Unit Apartments | 0 (0.0%) | 10 (100.0%) |
| 3 or 4 Unit Apartments | 0 (0.0%) | 0 (0.0%) |
| 5 to 9 Unit Apartments | 0 (0.0%) | 0 (0.0%) |
| 10 or more Apartments | 0 (0.0%) | 0 (0.0%) |
| Mobile Home / Other | 160 (66.1%) | 82 (33.9%) |
| Total | 510 (81.3%) | 117 (18.7%) |
Housing Structures by Number of Rooms in Hays
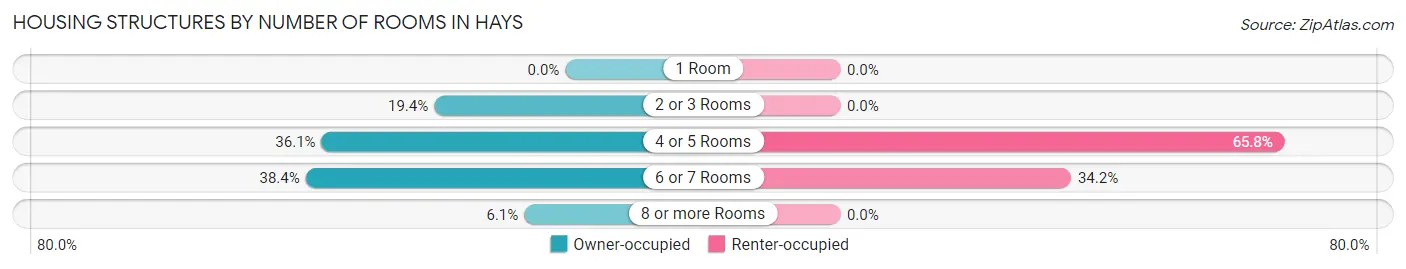
| Number of Rooms | Owner-occupied | Renter-occupied |
| 1 Room | 0 (0.0%) | 0 (0.0%) |
| 2 or 3 Rooms | 99 (19.4%) | 0 (0.0%) |
| 4 or 5 Rooms | 184 (36.1%) | 77 (65.8%) |
| 6 or 7 Rooms | 196 (38.4%) | 40 (34.2%) |
| 8 or more Rooms | 31 (6.1%) | 0 (0.0%) |
| Total | 510 (100.0%) | 117 (100.0%) |
Housing Structure by Heating Type in Hays
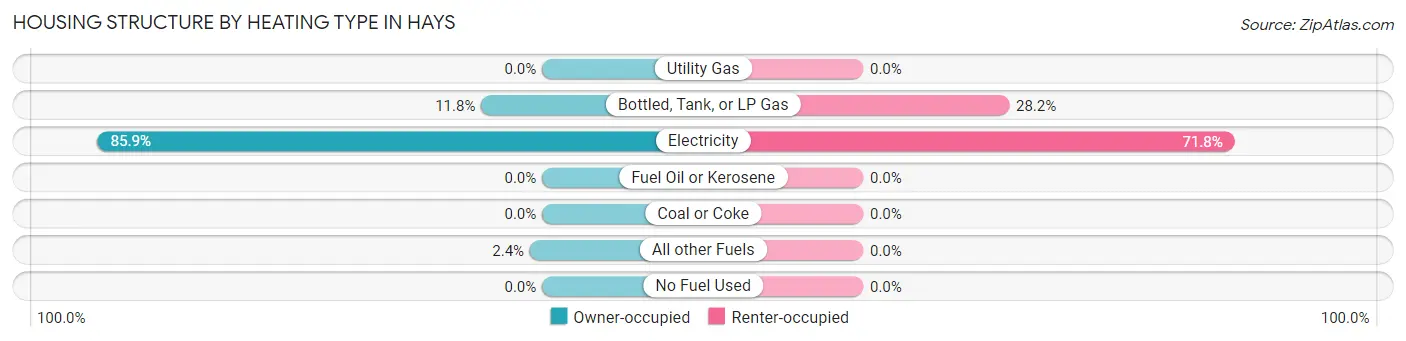
| Heating Type | Owner-occupied | Renter-occupied |
| Utility Gas | 0 (0.0%) | 0 (0.0%) |
| Bottled, Tank, or LP Gas | 60 (11.8%) | 33 (28.2%) |
| Electricity | 438 (85.9%) | 84 (71.8%) |
| Fuel Oil or Kerosene | 0 (0.0%) | 0 (0.0%) |
| Coal or Coke | 0 (0.0%) | 0 (0.0%) |
| All other Fuels | 12 (2.4%) | 0 (0.0%) |
| No Fuel Used | 0 (0.0%) | 0 (0.0%) |
| Total | 510 (100.0%) | 117 (100.0%) |
Household Vehicle Usage in Hays
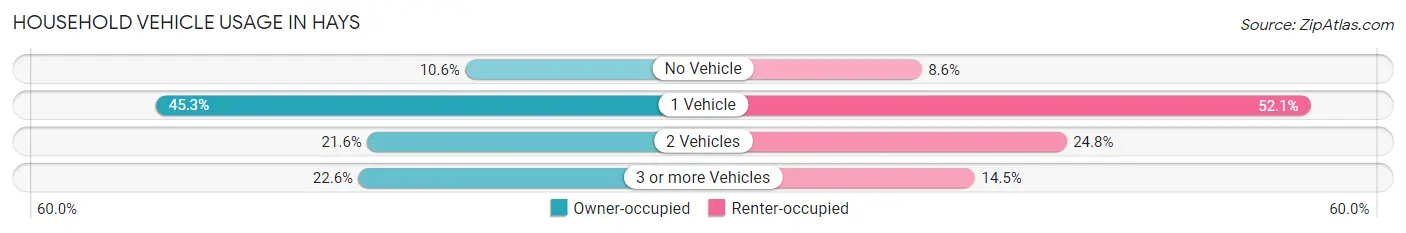
| Vehicles per Household | Owner-occupied | Renter-occupied |
| No Vehicle | 54 (10.6%) | 10 (8.6%) |
| 1 Vehicle | 231 (45.3%) | 61 (52.1%) |
| 2 Vehicles | 110 (21.6%) | 29 (24.8%) |
| 3 or more Vehicles | 115 (22.6%) | 17 (14.5%) |
| Total | 510 (100.0%) | 117 (100.0%) |
Real Estate & Mortgages in Hays
Real Estate and Mortgage Overview in Hays
| Characteristic | Without Mortgage | With Mortgage |
| Housing Units | 225 | 285 |
| Median Property Value | - | - |
| Median Household Income | $41,079 | $14 |
| Monthly Housing Costs | $307 | $0 |
| Real Estate Taxes | - | - |
Property Value by Mortgage Status in Hays
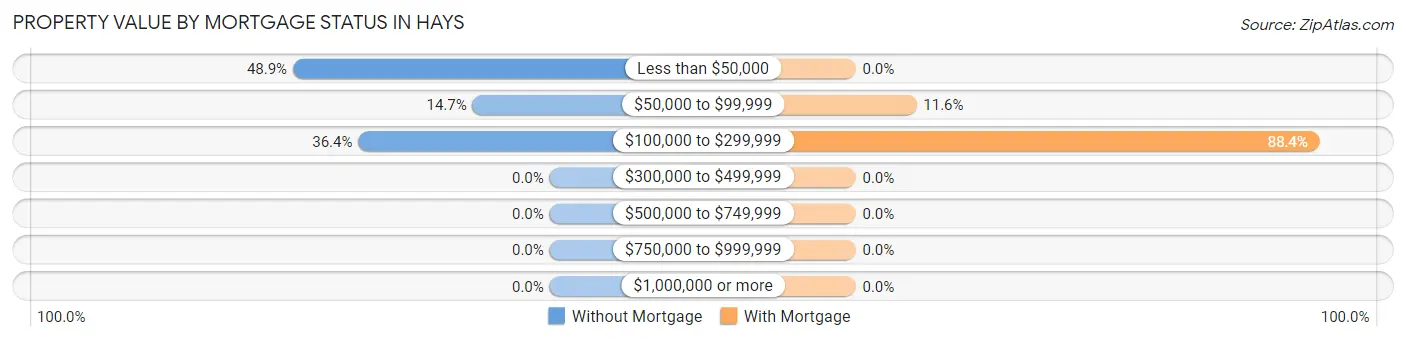
| Property Value | Without Mortgage | With Mortgage |
| Less than $50,000 | 110 (48.9%) | 0 (0.0%) |
| $50,000 to $99,999 | 33 (14.7%) | 33 (11.6%) |
| $100,000 to $299,999 | 82 (36.4%) | 252 (88.4%) |
| $300,000 to $499,999 | 0 (0.0%) | 0 (0.0%) |
| $500,000 to $749,999 | 0 (0.0%) | 0 (0.0%) |
| $750,000 to $999,999 | 0 (0.0%) | 0 (0.0%) |
| $1,000,000 or more | 0 (0.0%) | 0 (0.0%) |
| Total | 225 (100.0%) | 285 (100.0%) |
Household Income by Mortgage Status in Hays
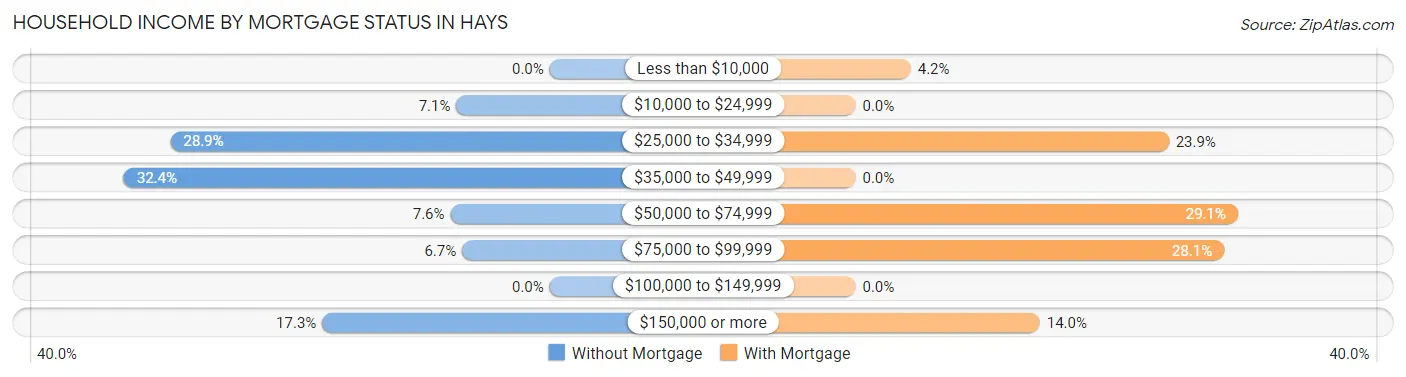
| Household Income | Without Mortgage | With Mortgage |
| Less than $10,000 | 0 (0.0%) | 12 (4.2%) |
| $10,000 to $24,999 | 16 (7.1%) | 0 (0.0%) |
| $25,000 to $34,999 | 65 (28.9%) | 68 (23.9%) |
| $35,000 to $49,999 | 73 (32.4%) | 0 (0.0%) |
| $50,000 to $74,999 | 17 (7.6%) | 83 (29.1%) |
| $75,000 to $99,999 | 15 (6.7%) | 80 (28.1%) |
| $100,000 to $149,999 | 0 (0.0%) | 0 (0.0%) |
| $150,000 or more | 39 (17.3%) | 40 (14.0%) |
| Total | 225 (100.0%) | 285 (100.0%) |
Property Value to Household Income Ratio in Hays
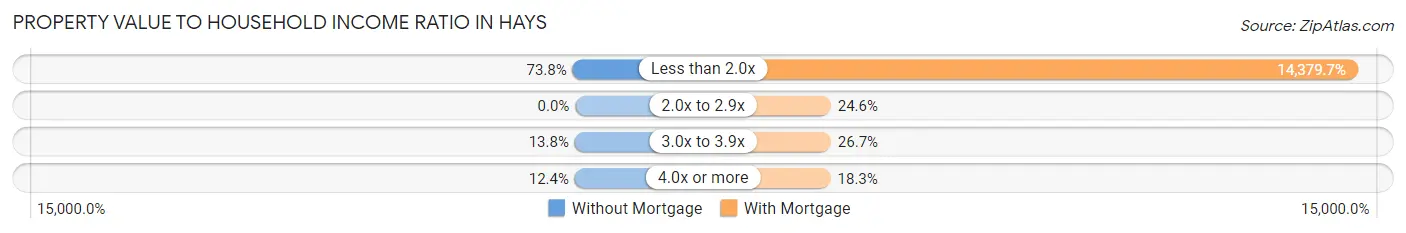
| Value-to-Income Ratio | Without Mortgage | With Mortgage |
| Less than 2.0x | 166 (73.8%) | 40,982 (14,379.7%) |
| 2.0x to 2.9x | 0 (0.0%) | 70 (24.6%) |
| 3.0x to 3.9x | 31 (13.8%) | 76 (26.7%) |
| 4.0x or more | 28 (12.4%) | 52 (18.2%) |
| Total | 225 (100.0%) | 285 (100.0%) |
Real Estate Taxes by Mortgage Status in Hays
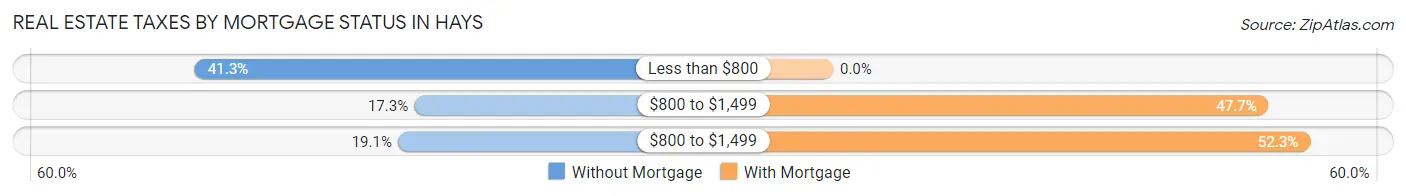
| Property Taxes | Without Mortgage | With Mortgage |
| Less than $800 | 93 (41.3%) | 0 (0.0%) |
| $800 to $1,499 | 39 (17.3%) | 136 (47.7%) |
| $800 to $1,499 | 43 (19.1%) | 149 (52.3%) |
| Total | 225 (100.0%) | 285 (100.0%) |
Health & Disability in Hays
Health Insurance Coverage by Age in Hays
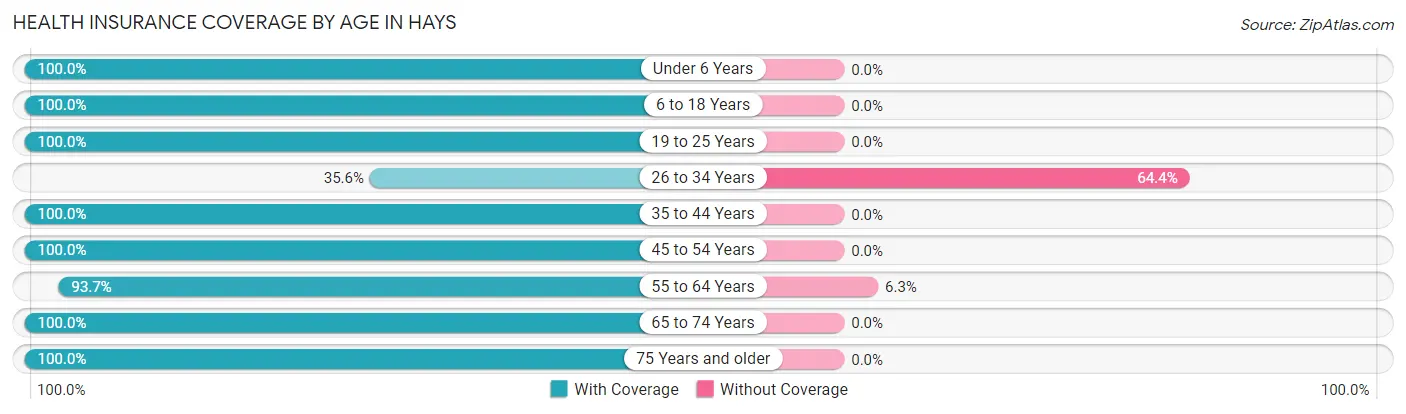
| Age Bracket | With Coverage | Without Coverage |
| Under 6 Years | 97 (100.0%) | 0 (0.0%) |
| 6 to 18 Years | 162 (100.0%) | 0 (0.0%) |
| 19 to 25 Years | 211 (100.0%) | 0 (0.0%) |
| 26 to 34 Years | 31 (35.6%) | 56 (64.4%) |
| 35 to 44 Years | 142 (100.0%) | 0 (0.0%) |
| 45 to 54 Years | 121 (100.0%) | 0 (0.0%) |
| 55 to 64 Years | 208 (93.7%) | 14 (6.3%) |
| 65 to 74 Years | 253 (100.0%) | 0 (0.0%) |
| 75 Years and older | 94 (100.0%) | 0 (0.0%) |
| Total | 1,319 (95.0%) | 70 (5.0%) |
Health Insurance Coverage by Citizenship Status in Hays
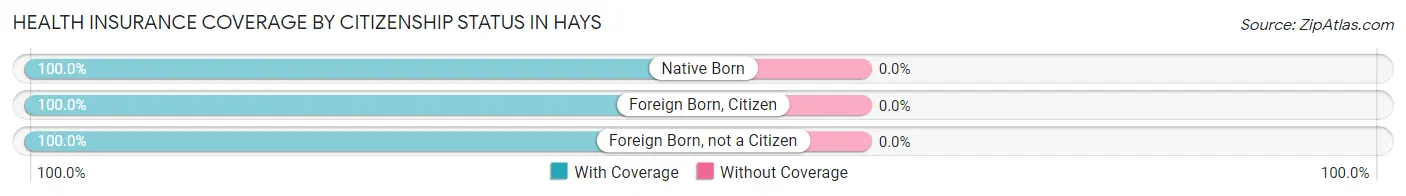
| Citizenship Status | With Coverage | Without Coverage |
| Native Born | 97 (100.0%) | 0 (0.0%) |
| Foreign Born, Citizen | 162 (100.0%) | 0 (0.0%) |
| Foreign Born, not a Citizen | 211 (100.0%) | 0 (0.0%) |
Health Insurance Coverage by Household Income in Hays
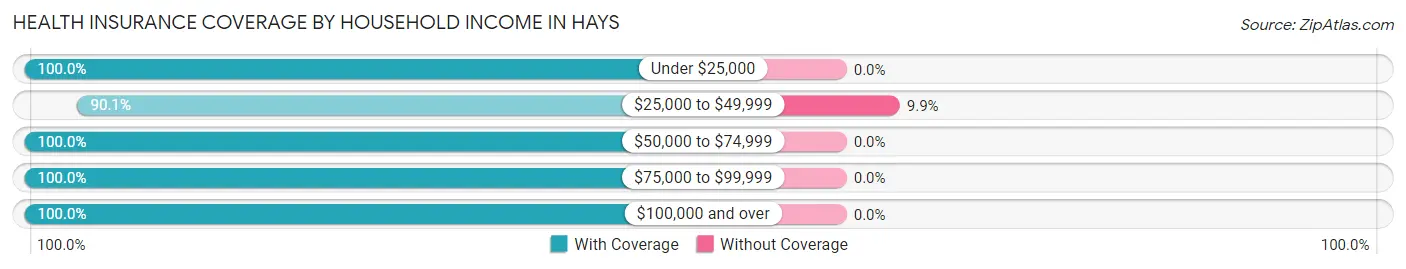
| Household Income | With Coverage | Without Coverage |
| Under $25,000 | 184 (100.0%) | 0 (0.0%) |
| $25,000 to $49,999 | 634 (90.1%) | 70 (9.9%) |
| $50,000 to $74,999 | 211 (100.0%) | 0 (0.0%) |
| $75,000 to $99,999 | 86 (100.0%) | 0 (0.0%) |
| $100,000 and over | 204 (100.0%) | 0 (0.0%) |
Public vs Private Health Insurance Coverage by Age in Hays
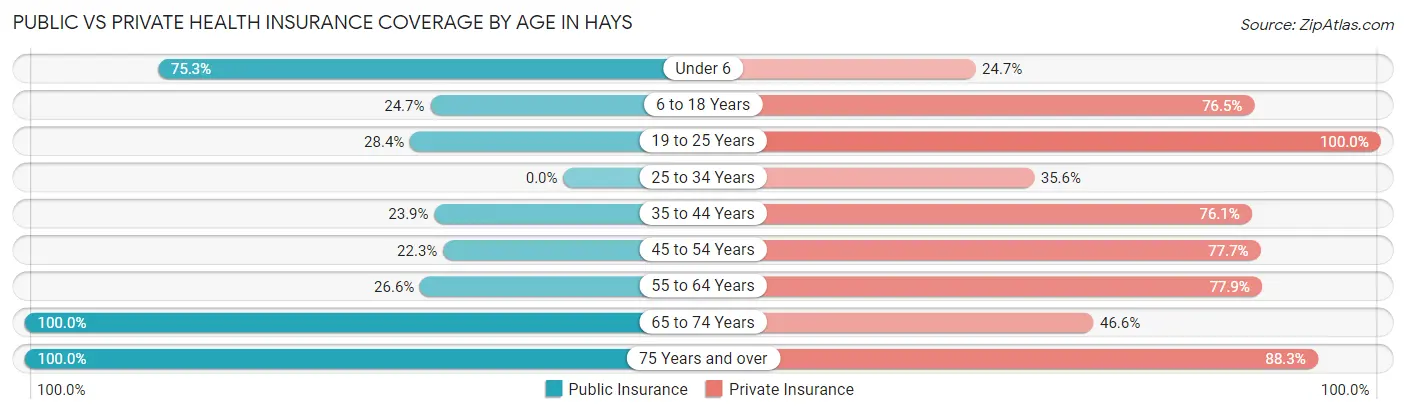
| Age Bracket | Public Insurance | Private Insurance |
| Under 6 | 73 (75.3%) | 24 (24.7%) |
| 6 to 18 Years | 40 (24.7%) | 124 (76.5%) |
| 19 to 25 Years | 60 (28.4%) | 211 (100.0%) |
| 25 to 34 Years | 0 (0.0%) | 31 (35.6%) |
| 35 to 44 Years | 34 (23.9%) | 108 (76.1%) |
| 45 to 54 Years | 27 (22.3%) | 94 (77.7%) |
| 55 to 64 Years | 59 (26.6%) | 173 (77.9%) |
| 65 to 74 Years | 253 (100.0%) | 118 (46.6%) |
| 75 Years and over | 94 (100.0%) | 83 (88.3%) |
| Total | 640 (46.1%) | 966 (69.6%) |
Disability Status by Sex by Age in Hays
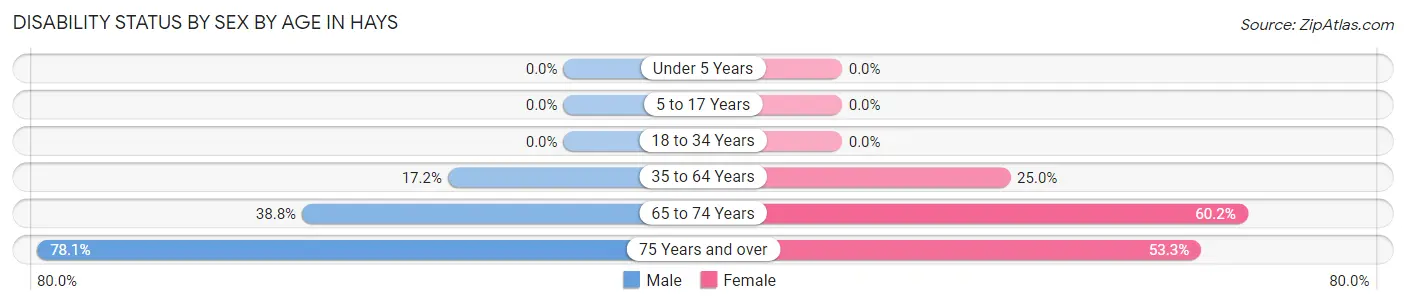
| Age Bracket | Male | Female |
| Under 5 Years | 0 (0.0%) | 0 (0.0%) |
| 5 to 17 Years | 0 (0.0%) | 0 (0.0%) |
| 18 to 34 Years | 0 (0.0%) | 0 (0.0%) |
| 35 to 64 Years | 40 (17.2%) | 63 (25.0%) |
| 65 to 74 Years | 66 (38.8%) | 50 (60.2%) |
| 75 Years and over | 50 (78.1%) | 16 (53.3%) |
Disability Class by Sex by Age in Hays
Disability Class: Hearing Difficulty
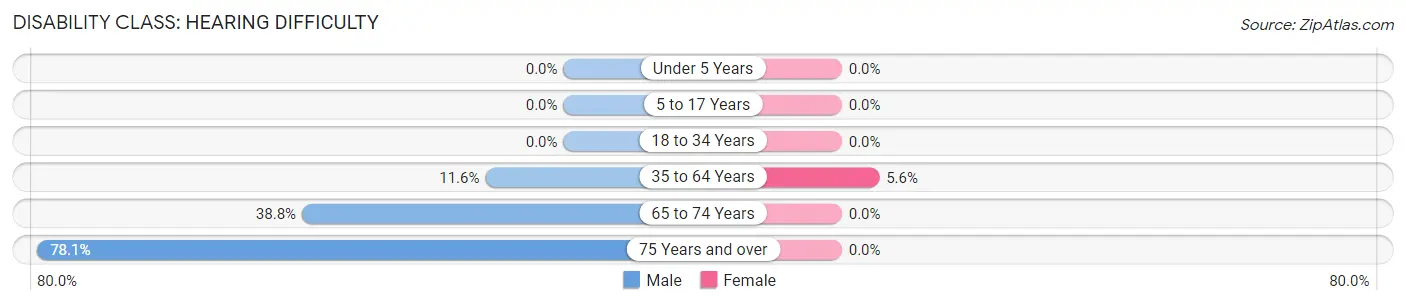
| Age Bracket | Male | Female |
| Under 5 Years | 0 (0.0%) | 0 (0.0%) |
| 5 to 17 Years | 0 (0.0%) | 0 (0.0%) |
| 18 to 34 Years | 0 (0.0%) | 0 (0.0%) |
| 35 to 64 Years | 27 (11.6%) | 14 (5.6%) |
| 65 to 74 Years | 66 (38.8%) | 0 (0.0%) |
| 75 Years and over | 50 (78.1%) | 0 (0.0%) |
Disability Class: Vision Difficulty
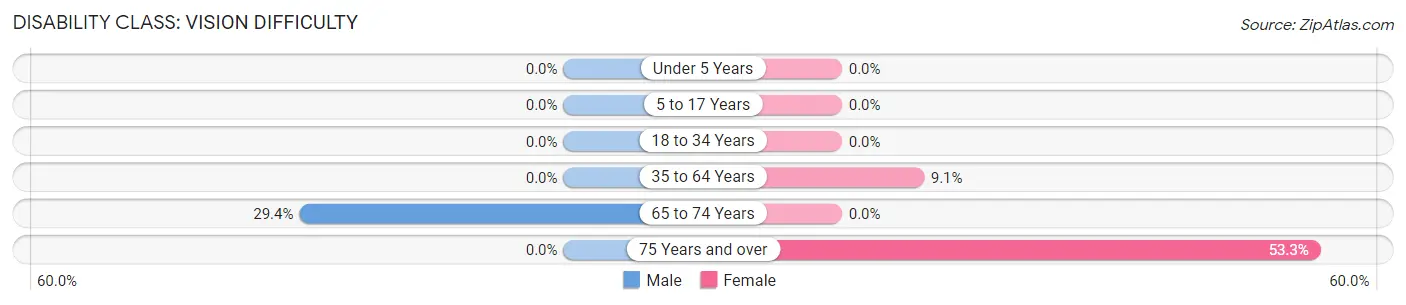
| Age Bracket | Male | Female |
| Under 5 Years | 0 (0.0%) | 0 (0.0%) |
| 5 to 17 Years | 0 (0.0%) | 0 (0.0%) |
| 18 to 34 Years | 0 (0.0%) | 0 (0.0%) |
| 35 to 64 Years | 0 (0.0%) | 23 (9.1%) |
| 65 to 74 Years | 50 (29.4%) | 0 (0.0%) |
| 75 Years and over | 0 (0.0%) | 16 (53.3%) |
Disability Class: Cognitive Difficulty
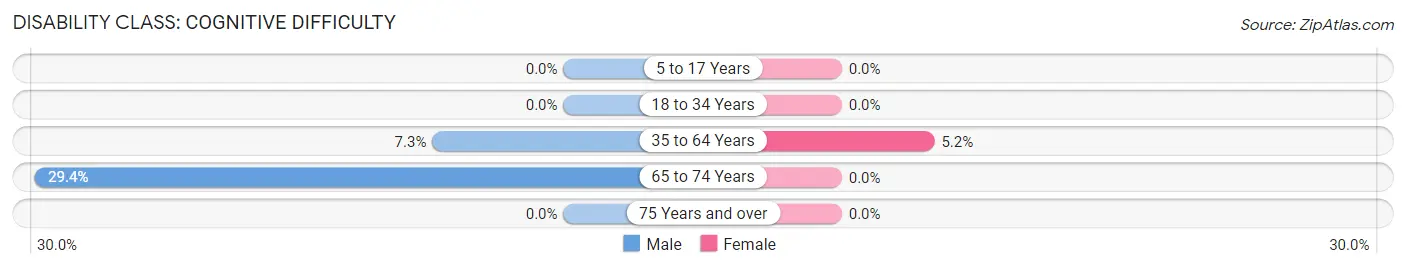
| Age Bracket | Male | Female |
| 5 to 17 Years | 0 (0.0%) | 0 (0.0%) |
| 18 to 34 Years | 0 (0.0%) | 0 (0.0%) |
| 35 to 64 Years | 17 (7.3%) | 13 (5.2%) |
| 65 to 74 Years | 50 (29.4%) | 0 (0.0%) |
| 75 Years and over | 0 (0.0%) | 0 (0.0%) |
Disability Class: Ambulatory Difficulty
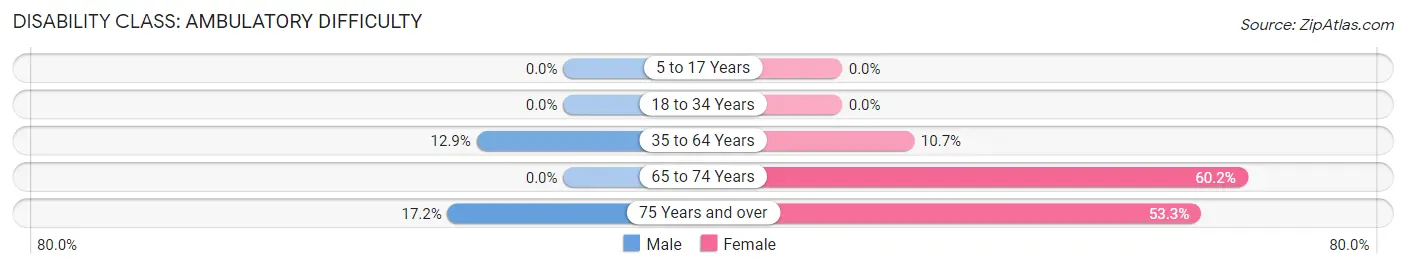
| Age Bracket | Male | Female |
| 5 to 17 Years | 0 (0.0%) | 0 (0.0%) |
| 18 to 34 Years | 0 (0.0%) | 0 (0.0%) |
| 35 to 64 Years | 30 (12.9%) | 27 (10.7%) |
| 65 to 74 Years | 0 (0.0%) | 50 (60.2%) |
| 75 Years and over | 11 (17.2%) | 16 (53.3%) |
Disability Class: Self-Care Difficulty
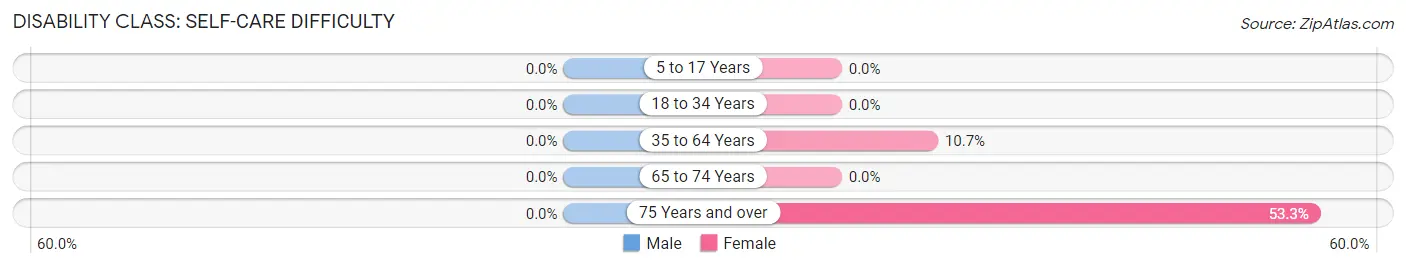
| Age Bracket | Male | Female |
| 5 to 17 Years | 0 (0.0%) | 0 (0.0%) |
| 18 to 34 Years | 0 (0.0%) | 0 (0.0%) |
| 35 to 64 Years | 0 (0.0%) | 27 (10.7%) |
| 65 to 74 Years | 0 (0.0%) | 0 (0.0%) |
| 75 Years and over | 0 (0.0%) | 16 (53.3%) |
Technology Access in Hays
Computing Device Access in Hays
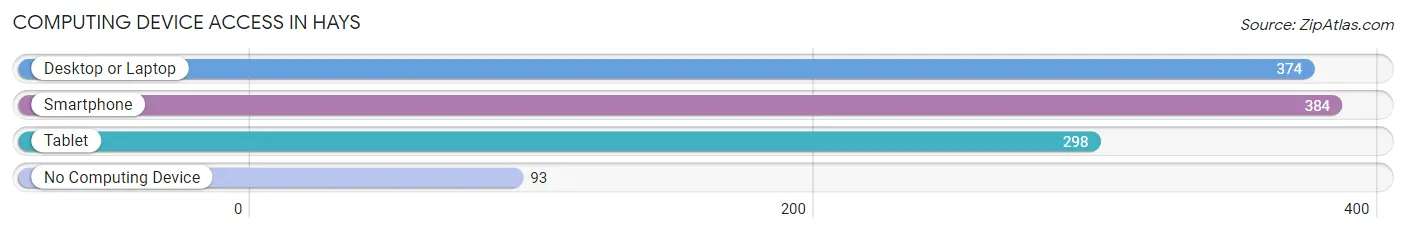
| Device Type | # Households | % Households |
| Desktop or Laptop | 374 | 59.7% |
| Smartphone | 384 | 61.2% |
| Tablet | 298 | 47.5% |
| No Computing Device | 93 | 14.8% |
| Total | 627 | 100.0% |
Internet Access in Hays
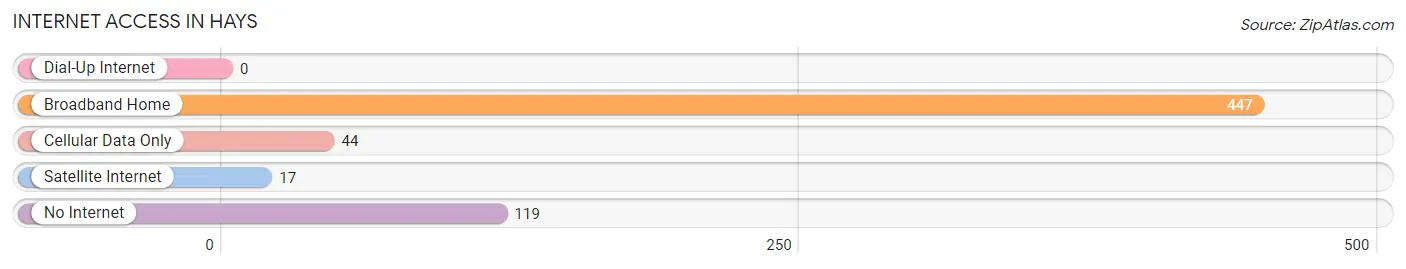
| Internet Type | # Households | % Households |
| Dial-Up Internet | 0 | 0.0% |
| Broadband Home | 447 | 71.3% |
| Cellular Data Only | 44 | 7.0% |
| Satellite Internet | 17 | 2.7% |
| No Internet | 119 | 19.0% |
| Total | 627 | 100.0% |
Hays Summary
Hays is a small town located in the foothills of the Blue Ridge Mountains in western North Carolina. It is situated in the Catawba County, and is part of the Hickory-Lenoir-Morganton Metropolitan Statistical Area. The town has a population of approximately 1,500 people, and is known for its rural charm and small-town atmosphere.
Geography
Hays is located in the foothills of the Blue Ridge Mountains, and is situated in the Catawba River Valley. The town is located at an elevation of 1,000 feet, and is surrounded by rolling hills and lush forests. The Catawba River runs through the town, and is a popular spot for fishing and boating. The town is also home to several small lakes, including Lake Hickory and Lake Rhodhiss.
The climate in Hays is mild and humid, with hot summers and cool winters. The average annual temperature is around 60 degrees Fahrenheit, and the average annual precipitation is around 45 inches.
Economy
The economy of Hays is largely based on agriculture and tourism. The town is home to several farms, and the surrounding area is known for its production of apples, peaches, and other fruits and vegetables. The town is also home to several wineries, and is a popular destination for wine tasting and tours.
Tourism is also an important part of the local economy. The town is home to several historic sites, including the Hays House, which was built in the early 1800s. The town is also home to several parks and outdoor recreation areas, including the Catawba River State Park and the Hickory Nut Gorge State Park.
Demographics
As of the 2010 census, the population of Hays was 1,521. The racial makeup of the town was 95.3% White, 1.2% African American, 0.3% Native American, 0.3% Asian, 0.1% Pacific Islander, and 2.8% from other races. The median household income was $37,917, and the median family income was $45,938.
Hays is a small town with a close-knit community. The town is home to several churches, and is known for its friendly atmosphere and welcoming attitude. The town is also home to several small businesses, including restaurants, shops, and other services.
Common Questions
What is Per Capita Income in Hays?
Per Capita income in Hays is $26,301.
What is the Median Family Income in Hays?
Median Family Income in Hays is $41,250.
What is the Median Household income in Hays?
Median Household Income in Hays is $40,963.
What is Family Income Deficit in Hays?
Family Income Deficit in Hays is $4,206.
Families that are below poverty line in Hays earn $4,206 less on average than the poverty threshold level.
What is Inequality or Gini Index in Hays?
Inequality or Gini Index in Hays is 0.41.
What is the Total Population of Hays?
Total Population of Hays is 1,389.
What is the Total Male Population of Hays?
Total Male Population of Hays is 793.
What is the Total Female Population of Hays?
Total Female Population of Hays is 596.
What is the Ratio of Males per 100 Females in Hays?
There are 133.05 Males per 100 Females in Hays.
What is the Ratio of Females per 100 Males in Hays?
There are 75.16 Females per 100 Males in Hays.
What is the Median Population Age in Hays?
Median Population Age in Hays is 44.6 Years.
What is the Average Family Size in Hays
Average Family Size in Hays is 2.8 People.
What is the Average Household Size in Hays
Average Household Size in Hays is 2.2 People.
How Large is the Labor Force in Hays?
There are 657 People in the Labor Forcein in Hays.
What is the Percentage of People in the Labor Force in Hays?
55.5% of People are in the Labor Force in Hays.