Wahpeton, IA Map & Demographics
Wahpeton Map
Wahpeton Overview
$60,617
PER CAPITA INCOME
$140,139
AVG FAMILY INCOME
$93,750
AVG HOUSEHOLD INCOME
31.2%
WAGE / INCOME GAP [ % ]
68.8¢/ $1
WAGE / INCOME GAP [ $ ]
0.42
INEQUALITY / GINI INDEX
403
TOTAL POPULATION
214
MALE POPULATION
189
FEMALE POPULATION
113.23
MALES / 100 FEMALES
88.32
FEMALES / 100 MALES
60.0
MEDIAN AGE
2.4
AVG FAMILY SIZE
2.1
AVG HOUSEHOLD SIZE
174
LABOR FORCE [ PEOPLE ]
51.6%
PERCENT IN LABOR FORCE
Income in Wahpeton
Income Overview in Wahpeton
Per Capita Income in Wahpeton is $60,617, while median incomes of families and households are $140,139 and $93,750 respectively.
| Characteristic | Number | Measure |
| Per Capita Income | 403 | $60,617 |
| Median Family Income | 139 | $140,139 |
| Mean Family Income | 139 | $146,739 |
| Median Household Income | 190 | $93,750 |
| Mean Household Income | 190 | $128,406 |
| Income Deficit | 139 | $0 |
| Wage / Income Gap (%) | 403 | 31.21% |
| Wage / Income Gap ($) | 403 | 68.79¢ per $1 |
| Gini / Inequality Index | 403 | 0.42 |
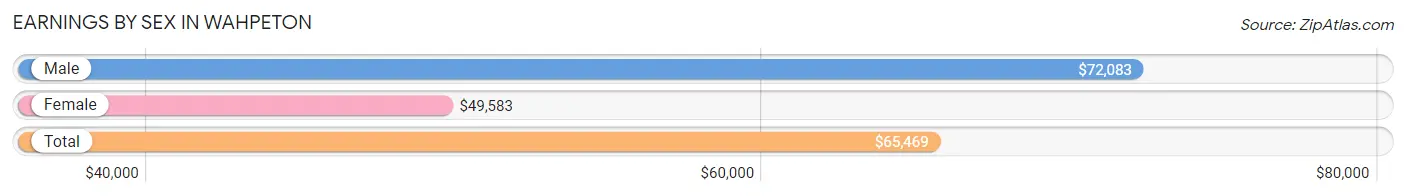
Earnings by Sex in Wahpeton
Average Earnings in Wahpeton are $65,469, $72,083 for men and $49,583 for women, a difference of 31.2%.
| Sex | Number | Average Earnings |
| Male | 116 (62.7%) | $72,083 |
| Female | 69 (37.3%) | $49,583 |
| Total | 185 (100.0%) | $65,469 |
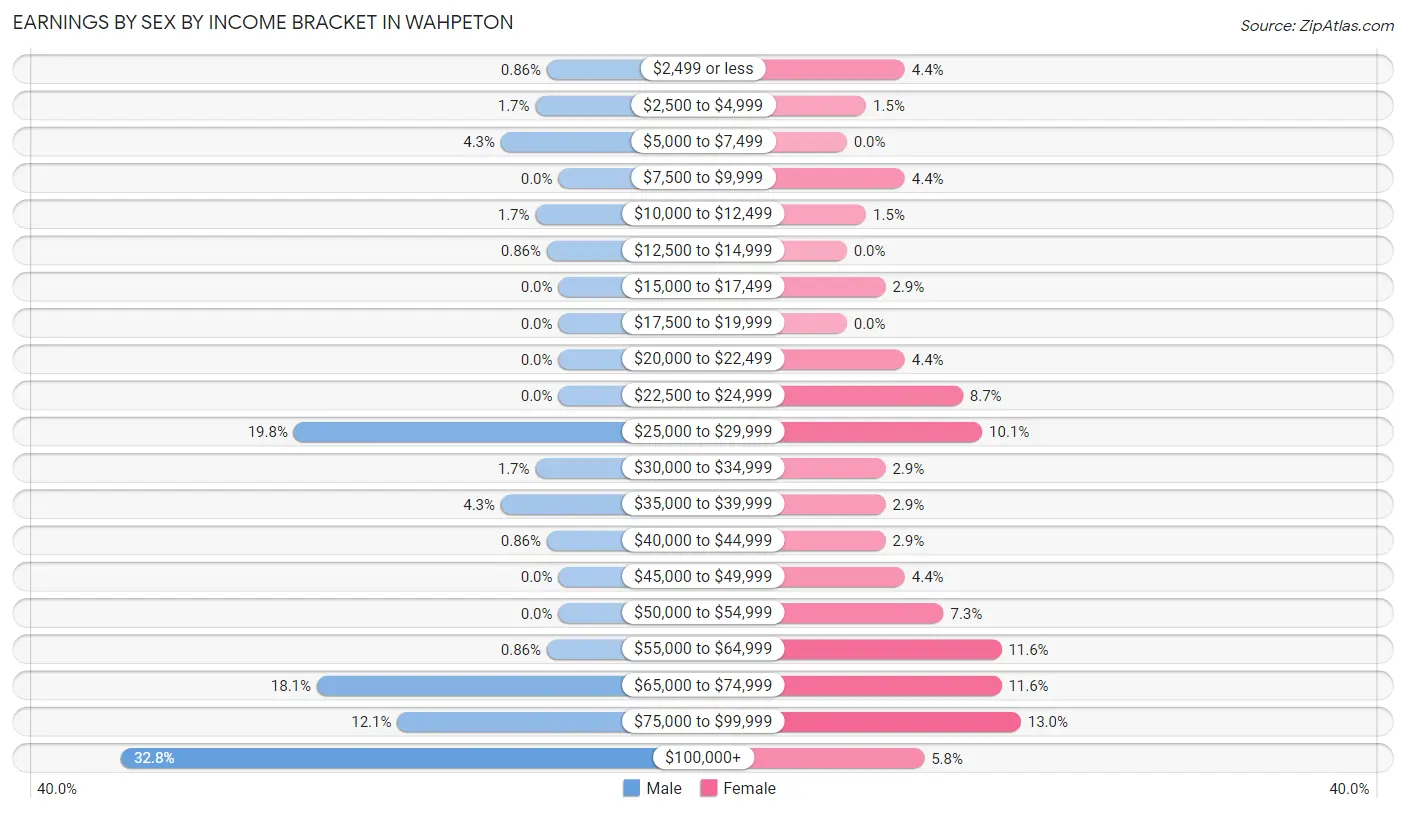
Earnings by Sex by Income Bracket in Wahpeton
The most common earnings brackets in Wahpeton are $100,000+ for men (38 | 32.8%) and $75,000 to $99,999 for women (9 | 13.0%).
| Income | Male | Female |
| $2,499 or less | 1 (0.9%) | 3 (4.3%) |
| $2,500 to $4,999 | 2 (1.7%) | 1 (1.5%) |
| $5,000 to $7,499 | 5 (4.3%) | 0 (0.0%) |
| $7,500 to $9,999 | 0 (0.0%) | 3 (4.3%) |
| $10,000 to $12,499 | 2 (1.7%) | 1 (1.5%) |
| $12,500 to $14,999 | 1 (0.9%) | 0 (0.0%) |
| $15,000 to $17,499 | 0 (0.0%) | 2 (2.9%) |
| $17,500 to $19,999 | 0 (0.0%) | 0 (0.0%) |
| $20,000 to $22,499 | 0 (0.0%) | 3 (4.3%) |
| $22,500 to $24,999 | 0 (0.0%) | 6 (8.7%) |
| $25,000 to $29,999 | 23 (19.8%) | 7 (10.1%) |
| $30,000 to $34,999 | 2 (1.7%) | 2 (2.9%) |
| $35,000 to $39,999 | 5 (4.3%) | 2 (2.9%) |
| $40,000 to $44,999 | 1 (0.9%) | 2 (2.9%) |
| $45,000 to $49,999 | 0 (0.0%) | 3 (4.3%) |
| $50,000 to $54,999 | 0 (0.0%) | 5 (7.2%) |
| $55,000 to $64,999 | 1 (0.9%) | 8 (11.6%) |
| $65,000 to $74,999 | 21 (18.1%) | 8 (11.6%) |
| $75,000 to $99,999 | 14 (12.1%) | 9 (13.0%) |
| $100,000+ | 38 (32.8%) | 4 (5.8%) |
| Total | 116 (100.0%) | 69 (100.0%) |
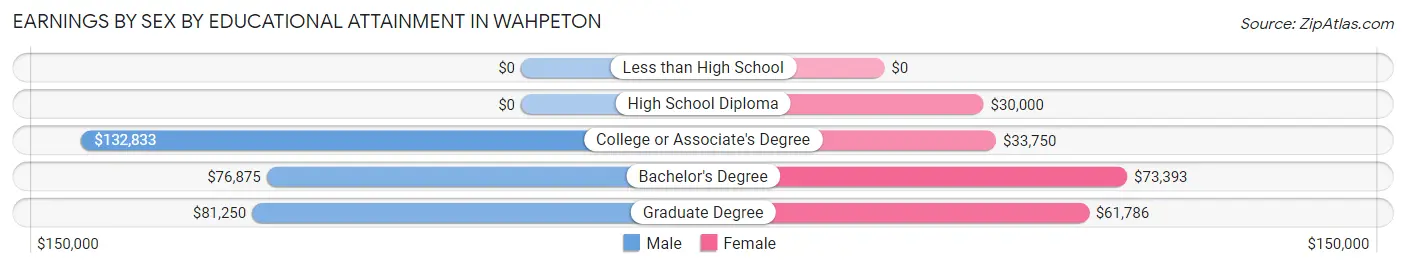
Earnings by Sex by Educational Attainment in Wahpeton
Average earnings in Wahpeton are $87,500 for men and $51,250 for women, a difference of 41.4%. Men with an educational attainment of college or associate's degree enjoy the highest average annual earnings of $132,833, while those with bachelor's degree education earn the least with $76,875. Women with an educational attainment of bachelor's degree earn the most with the average annual earnings of $73,393, while those with high school diploma education have the smallest earnings of $30,000.
| Educational Attainment | Male Income | Female Income |
| Less than High School | - | - |
| High School Diploma | - | - |
| College or Associate's Degree | $132,833 | $33,750 |
| Bachelor's Degree | $76,875 | $73,393 |
| Graduate Degree | $81,250 | $61,786 |
| Total | $87,500 | $51,250 |
Family Income in Wahpeton
Family Income Brackets in Wahpeton
According to the Wahpeton family income data, there are 31 families falling into the $200,000+ income range, which is the most common income bracket and makes up 22.3% of all families.
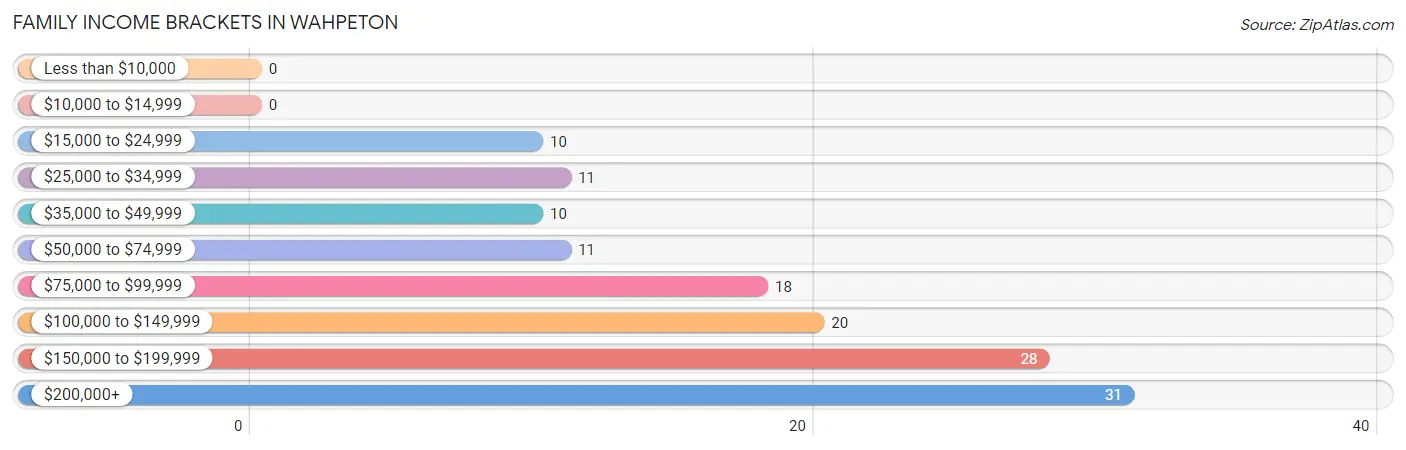
| Income Bracket | # Families | % Families |
| Less than $10,000 | 0 | 0.0% |
| $10,000 to $14,999 | 0 | 0.0% |
| $15,000 to $24,999 | 10 | 7.2% |
| $25,000 to $34,999 | 11 | 7.9% |
| $35,000 to $49,999 | 10 | 7.2% |
| $50,000 to $74,999 | 11 | 7.9% |
| $75,000 to $99,999 | 18 | 12.9% |
| $100,000 to $149,999 | 20 | 14.4% |
| $150,000 to $199,999 | 28 | 20.1% |
| $200,000+ | 31 | 22.3% |
Family Income by Famaliy Size in Wahpeton
3-person families (23 | 16.6%) account for the highest median family income in Wahpeton with $161,250 per family, while 2-person families (101 | 72.7%) have the highest median income of $64,688 per family member.
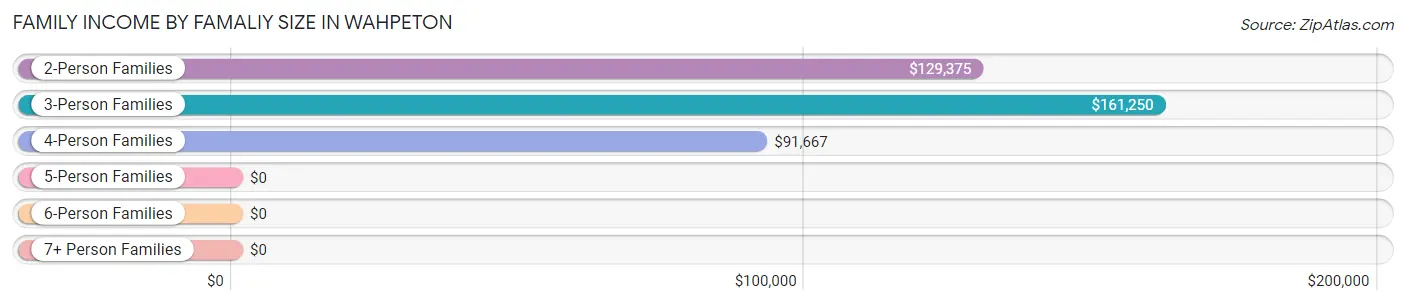
| Income Bracket | # Families | Median Income |
| 2-Person Families | 101 (72.7%) | $129,375 |
| 3-Person Families | 23 (16.6%) | $161,250 |
| 4-Person Families | 8 (5.8%) | $91,667 |
| 5-Person Families | 7 (5.0%) | $0 |
| 6-Person Families | 0 (0.0%) | $0 |
| 7+ Person Families | 0 (0.0%) | $0 |
| Total | 139 (100.0%) | $140,139 |
Family Income by Number of Earners in Wahpeton
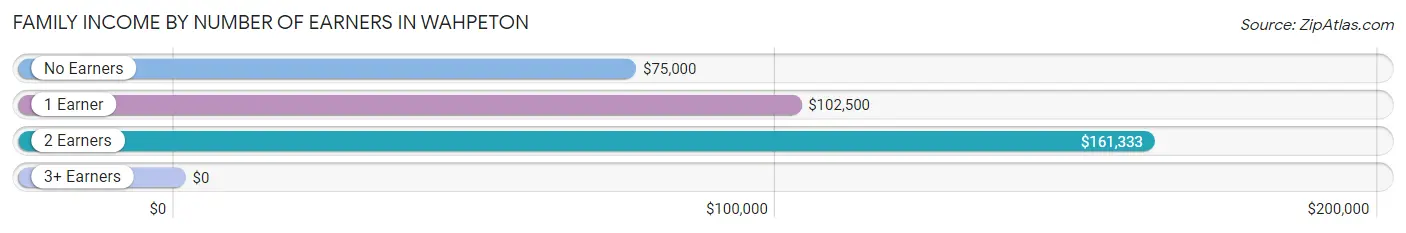
| Number of Earners | # Families | Median Income |
| No Earners | 42 (30.2%) | $75,000 |
| 1 Earner | 48 (34.5%) | $102,500 |
| 2 Earners | 48 (34.5%) | $161,333 |
| 3+ Earners | 1 (0.7%) | $0 |
| Total | 139 (100.0%) | $140,139 |
Household Income in Wahpeton
Household Income Brackets in Wahpeton
With 33 households falling in the category, the $200,000+ income range is the most frequent in Wahpeton, accounting for 17.4% of all households. In contrast, only 1 households (0.5%) fall into the less than $10,000 income bracket, making it the least populous group.
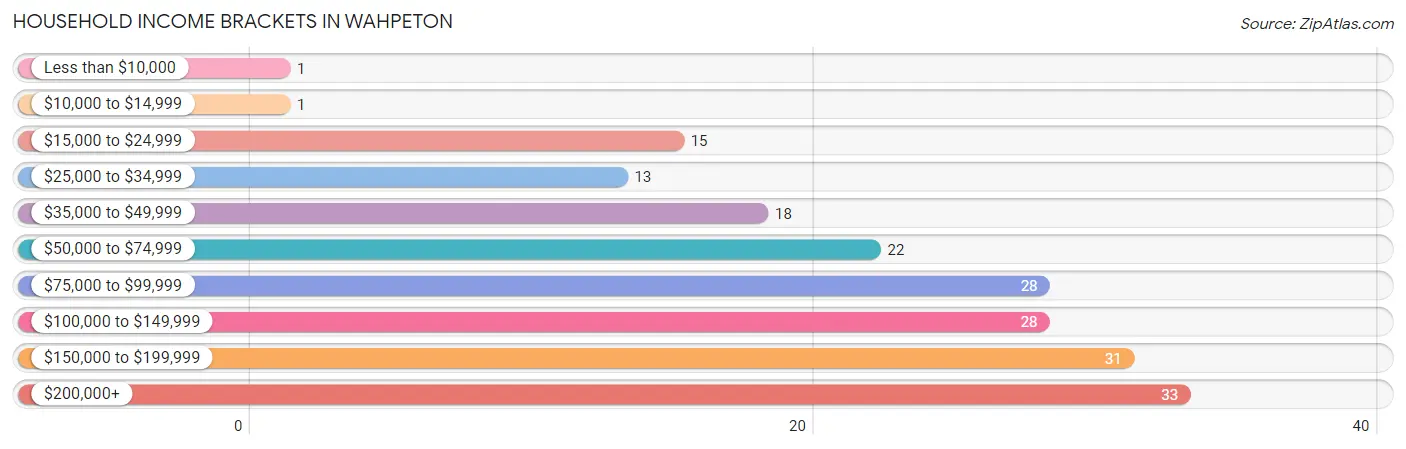
| Income Bracket | # Households | % Households |
| Less than $10,000 | 1 | 0.5% |
| $10,000 to $14,999 | 1 | 0.5% |
| $15,000 to $24,999 | 15 | 7.9% |
| $25,000 to $34,999 | 13 | 6.8% |
| $35,000 to $49,999 | 18 | 9.5% |
| $50,000 to $74,999 | 22 | 11.6% |
| $75,000 to $99,999 | 28 | 14.7% |
| $100,000 to $149,999 | 28 | 14.7% |
| $150,000 to $199,999 | 31 | 16.3% |
| $200,000+ | 33 | 17.4% |
Household Income by Householder Age in Wahpeton
The median household income in Wahpeton is $93,750, with the highest median household income of $160,167 found in the 45 to 64 years age bracket for the primary householder. A total of 58 households (30.5%) fall into this category. Meanwhile, the 15 to 24 years age bracket for the primary householder has the lowest median household income of $0, with 7 households (3.7%) in this group.
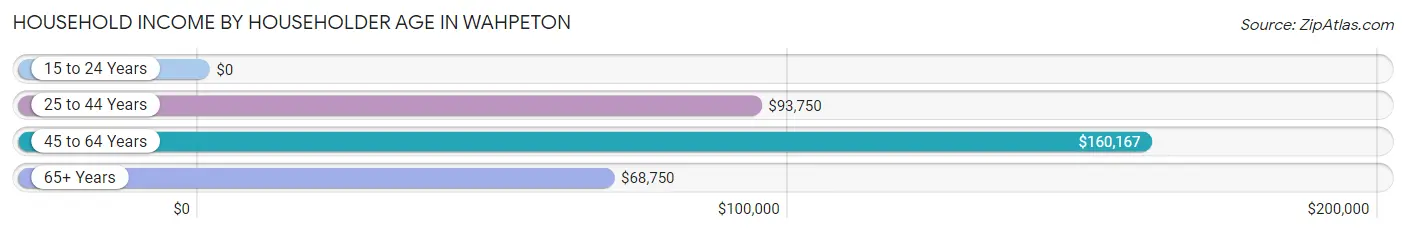
| Income Bracket | # Households | Median Income |
| 15 to 24 Years | 7 (3.7%) | $0 |
| 25 to 44 Years | 28 (14.7%) | $93,750 |
| 45 to 64 Years | 58 (30.5%) | $160,167 |
| 65+ Years | 97 (51.0%) | $68,750 |
| Total | 190 (100.0%) | $93,750 |
Poverty in Wahpeton
Income Below Poverty by Sex and Age in Wahpeton
With 4.7% poverty level for males and 3.2% for females among the residents of Wahpeton, under 5 year old males and under 5 year old females are the most vulnerable to poverty, with 5 males (35.7%) and 2 females (100.0%) in their respective age groups living below the poverty level.
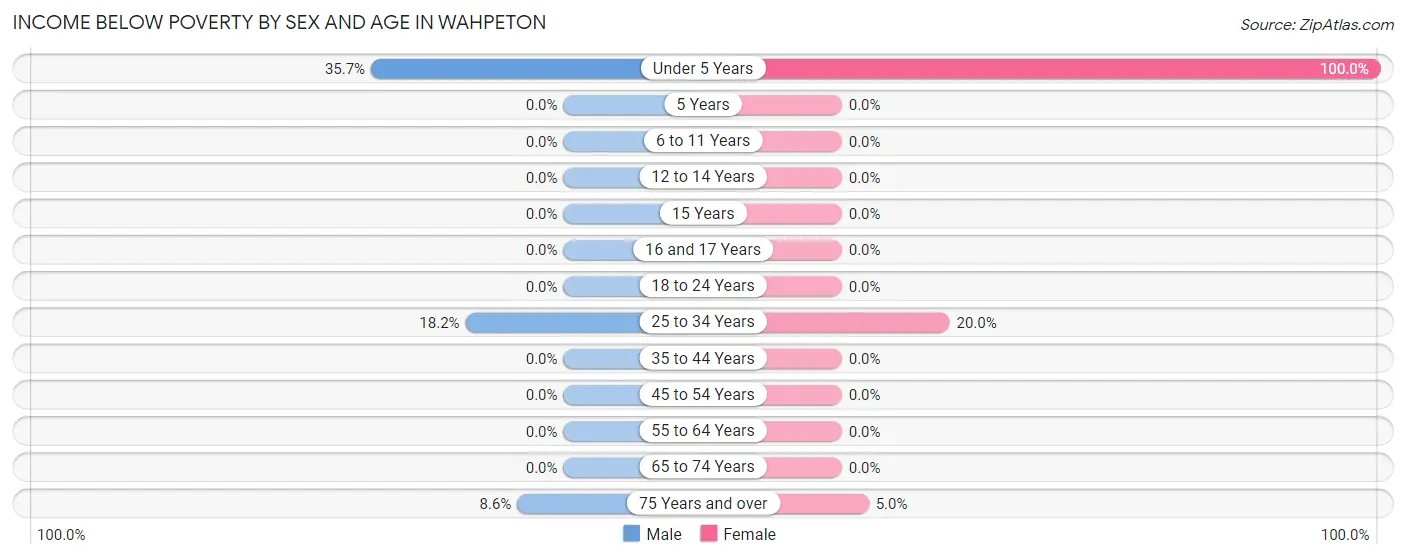
| Age Bracket | Male | Female |
| Under 5 Years | 5 (35.7%) | 2 (100.0%) |
| 5 Years | 0 (0.0%) | 0 (0.0%) |
| 6 to 11 Years | 0 (0.0%) | 0 (0.0%) |
| 12 to 14 Years | 0 (0.0%) | 0 (0.0%) |
| 15 Years | 0 (0.0%) | 0 (0.0%) |
| 16 and 17 Years | 0 (0.0%) | 0 (0.0%) |
| 18 to 24 Years | 0 (0.0%) | 0 (0.0%) |
| 25 to 34 Years | 2 (18.2%) | 2 (20.0%) |
| 35 to 44 Years | 0 (0.0%) | 0 (0.0%) |
| 45 to 54 Years | 0 (0.0%) | 0 (0.0%) |
| 55 to 64 Years | 0 (0.0%) | 0 (0.0%) |
| 65 to 74 Years | 0 (0.0%) | 0 (0.0%) |
| 75 Years and over | 3 (8.6%) | 2 (5.0%) |
| Total | 10 (4.7%) | 6 (3.2%) |
Income Above Poverty by Sex and Age in Wahpeton
According to the poverty statistics in Wahpeton, males aged 6 to 11 years and females aged 6 to 11 years are the age groups that are most secure financially, with 100.0% of males and 100.0% of females in these age groups living above the poverty line.
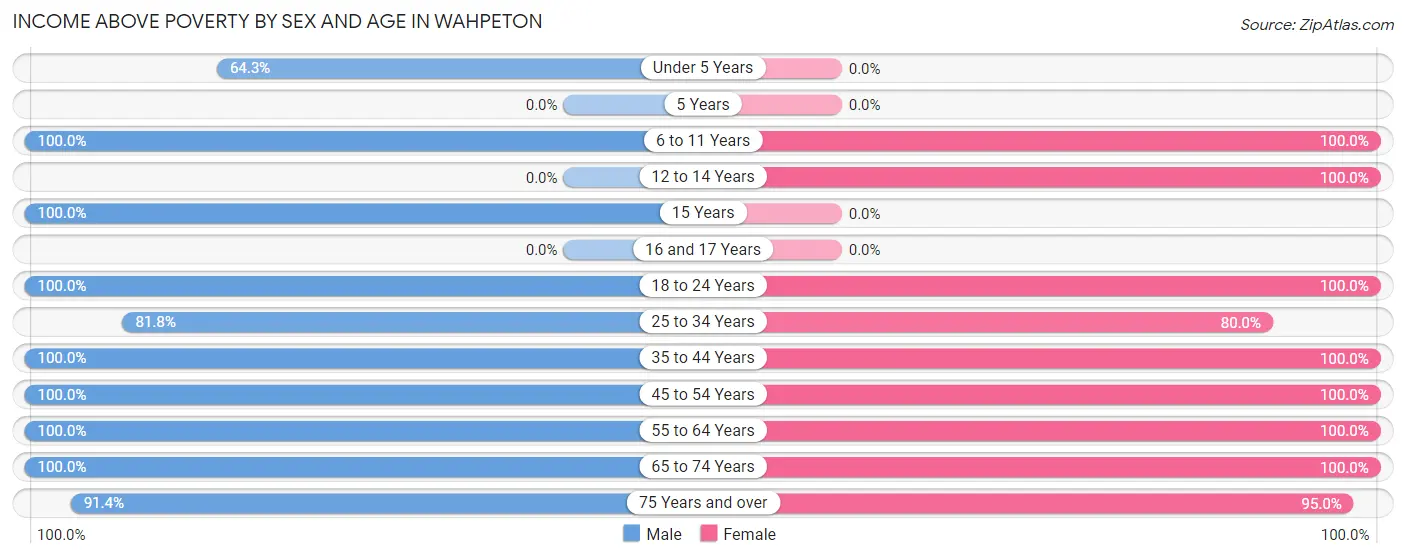
| Age Bracket | Male | Female |
| Under 5 Years | 9 (64.3%) | 0 (0.0%) |
| 5 Years | 0 (0.0%) | 0 (0.0%) |
| 6 to 11 Years | 10 (100.0%) | 15 (100.0%) |
| 12 to 14 Years | 0 (0.0%) | 6 (100.0%) |
| 15 Years | 14 (100.0%) | 0 (0.0%) |
| 16 and 17 Years | 0 (0.0%) | 0 (0.0%) |
| 18 to 24 Years | 29 (100.0%) | 3 (100.0%) |
| 25 to 34 Years | 9 (81.8%) | 8 (80.0%) |
| 35 to 44 Years | 14 (100.0%) | 21 (100.0%) |
| 45 to 54 Years | 20 (100.0%) | 5 (100.0%) |
| 55 to 64 Years | 26 (100.0%) | 34 (100.0%) |
| 65 to 74 Years | 39 (100.0%) | 50 (100.0%) |
| 75 Years and over | 32 (91.4%) | 38 (95.0%) |
| Total | 202 (95.3%) | 180 (96.8%) |
Income Below Poverty Among Married-Couple Families in Wahpeton
The poverty statistics for married-couple families in Wahpeton show that 1.8% or 2 of the total 113 families live below the poverty line. Families with 3 or 4 children have the highest poverty rate of 28.6%, comprising of 2 families. On the other hand, families with no children have the lowest poverty rate of 0.0%, which includes 0 families.
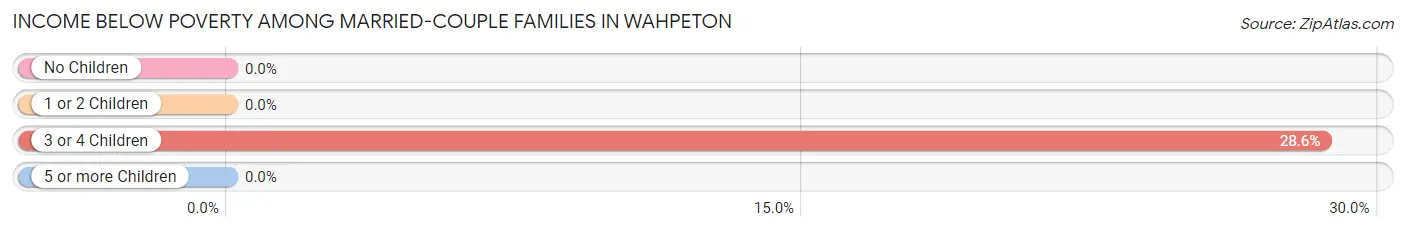
| Children | Above Poverty | Below Poverty |
| No Children | 98 (100.0%) | 0 (0.0%) |
| 1 or 2 Children | 8 (100.0%) | 0 (0.0%) |
| 3 or 4 Children | 5 (71.4%) | 2 (28.6%) |
| 5 or more Children | 0 (0.0%) | 0 (0.0%) |
| Total | 111 (98.2%) | 2 (1.8%) |
Income Below Poverty Among Single-Parent Households in Wahpeton
| Children | Single Father | Single Mother |
| No Children | 0 (0.0%) | 0 (0.0%) |
| 1 or 2 Children | 0 (0.0%) | 0 (0.0%) |
| 3 or 4 Children | 0 (0.0%) | 0 (0.0%) |
| 5 or more Children | 0 (0.0%) | 0 (0.0%) |
| Total | 0 (0.0%) | 0 (0.0%) |
Income Below Poverty Among Married-Couple vs Single-Parent Households in Wahpeton
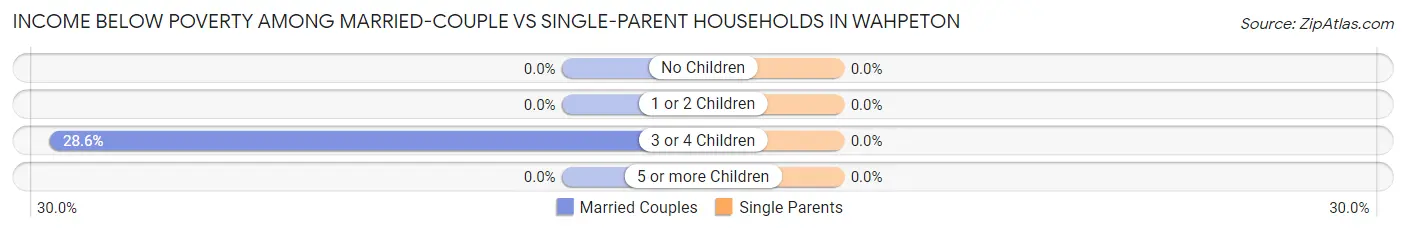
| Children | Married-Couple Families | Single-Parent Households |
| No Children | 0 (0.0%) | 0 (0.0%) |
| 1 or 2 Children | 0 (0.0%) | 0 (0.0%) |
| 3 or 4 Children | 2 (28.6%) | 0 (0.0%) |
| 5 or more Children | 0 (0.0%) | 0 (0.0%) |
| Total | 2 (1.8%) | 0 (0.0%) |
Race in Wahpeton
The most populous races in Wahpeton are White / Caucasian (394 | 97.8%), Two or more Races (5 | 1.2%), and Asian (3 | 0.7%).
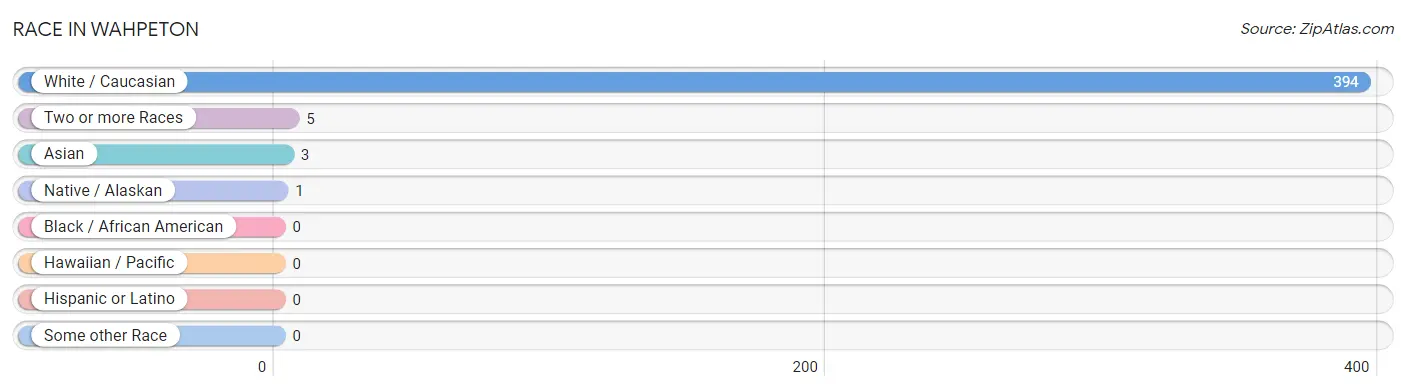
| Race | # Population | % Population |
| Asian | 3 | 0.7% |
| Black / African American | 0 | 0.0% |
| Hawaiian / Pacific | 0 | 0.0% |
| Hispanic or Latino | 0 | 0.0% |
| Native / Alaskan | 1 | 0.3% |
| White / Caucasian | 394 | 97.8% |
| Two or more Races | 5 | 1.2% |
| Some other Race | 0 | 0.0% |
| Total | 403 | 100.0% |
Ancestry in Wahpeton
The most populous ancestries reported in Wahpeton are German (192 | 47.6%), English (83 | 20.6%), Irish (60 | 14.9%), Norwegian (37 | 9.2%), and French (34 | 8.4%), together accounting for 100.8% of all Wahpeton residents.
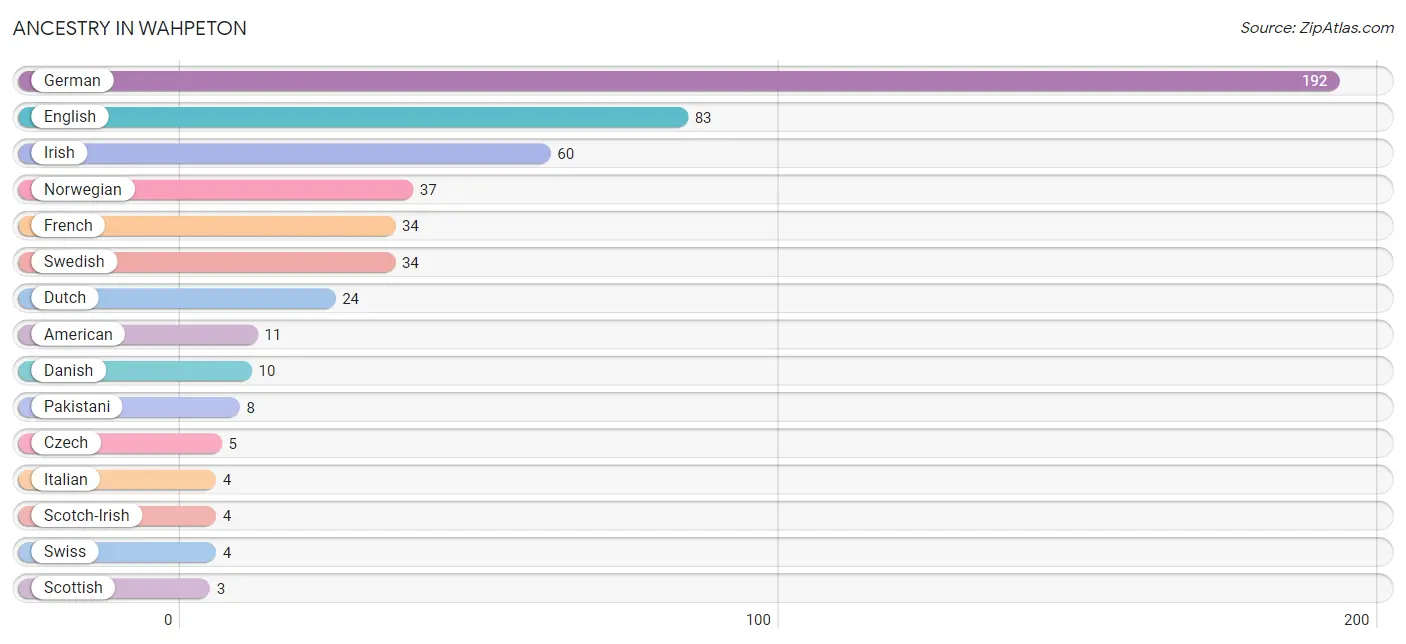
| Ancestry | # Population | % Population |
| American | 11 | 2.7% |
| Arab | 2 | 0.5% |
| Australian | 2 | 0.5% |
| British | 1 | 0.3% |
| Chippewa | 1 | 0.3% |
| Czech | 5 | 1.2% |
| Danish | 10 | 2.5% |
| Dutch | 24 | 6.0% |
| English | 83 | 20.6% |
| Finnish | 2 | 0.5% |
| French | 34 | 8.4% |
| German | 192 | 47.6% |
| Irish | 60 | 14.9% |
| Italian | 4 | 1.0% |
| Lebanese | 2 | 0.5% |
| Norwegian | 37 | 9.2% |
| Pakistani | 8 | 2.0% |
| Russian | 2 | 0.5% |
| Scotch-Irish | 4 | 1.0% |
| Scottish | 3 | 0.7% |
| Slovene | 2 | 0.5% |
| Swedish | 34 | 8.4% |
| Swiss | 4 | 1.0% |
| Welsh | 3 | 0.7% | View All 24 Rows |
Immigrants in Wahpeton
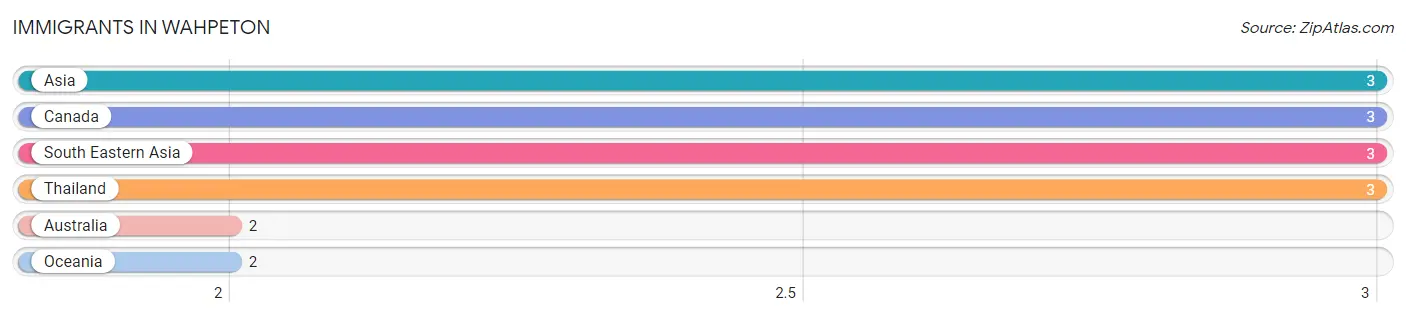
The most numerous immigrant groups reported in Wahpeton came from Asia (3 | 0.7%), Canada (3 | 0.7%), South Eastern Asia (3 | 0.7%), Thailand (3 | 0.7%), and Australia (2 | 0.5%), together accounting for 3.5% of all Wahpeton residents.
| Immigration Origin | # Population | % Population |
| Asia | 3 | 0.7% |
| Australia | 2 | 0.5% |
| Canada | 3 | 0.7% |
| Oceania | 2 | 0.5% |
| South Eastern Asia | 3 | 0.7% |
| Thailand | 3 | 0.7% | View All 6 Rows |
Sex and Age in Wahpeton
Sex and Age in Wahpeton
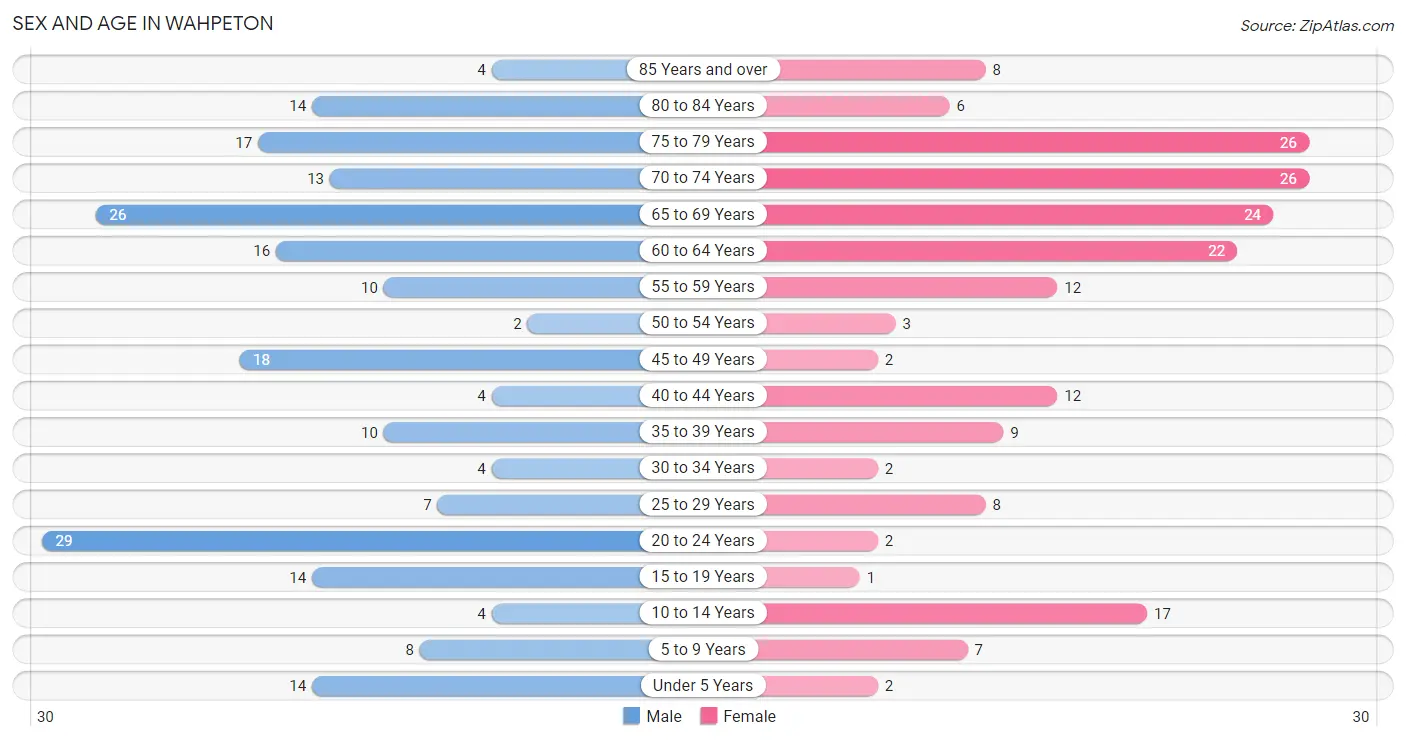
The most populous age groups in Wahpeton are 20 to 24 Years (29 | 13.6%) for men and 70 to 74 Years (26 | 13.8%) for women.
| Age Bracket | Male | Female |
| Under 5 Years | 14 (6.5%) | 2 (1.1%) |
| 5 to 9 Years | 8 (3.7%) | 7 (3.7%) |
| 10 to 14 Years | 4 (1.9%) | 17 (9.0%) |
| 15 to 19 Years | 14 (6.5%) | 1 (0.5%) |
| 20 to 24 Years | 29 (13.6%) | 2 (1.1%) |
| 25 to 29 Years | 7 (3.3%) | 8 (4.2%) |
| 30 to 34 Years | 4 (1.9%) | 2 (1.1%) |
| 35 to 39 Years | 10 (4.7%) | 9 (4.8%) |
| 40 to 44 Years | 4 (1.9%) | 12 (6.4%) |
| 45 to 49 Years | 18 (8.4%) | 2 (1.1%) |
| 50 to 54 Years | 2 (0.9%) | 3 (1.6%) |
| 55 to 59 Years | 10 (4.7%) | 12 (6.4%) |
| 60 to 64 Years | 16 (7.5%) | 22 (11.6%) |
| 65 to 69 Years | 26 (12.1%) | 24 (12.7%) |
| 70 to 74 Years | 13 (6.1%) | 26 (13.8%) |
| 75 to 79 Years | 17 (7.9%) | 26 (13.8%) |
| 80 to 84 Years | 14 (6.5%) | 6 (3.2%) |
| 85 Years and over | 4 (1.9%) | 8 (4.2%) |
| Total | 214 (100.0%) | 189 (100.0%) |
Families and Households in Wahpeton
Median Family Size in Wahpeton
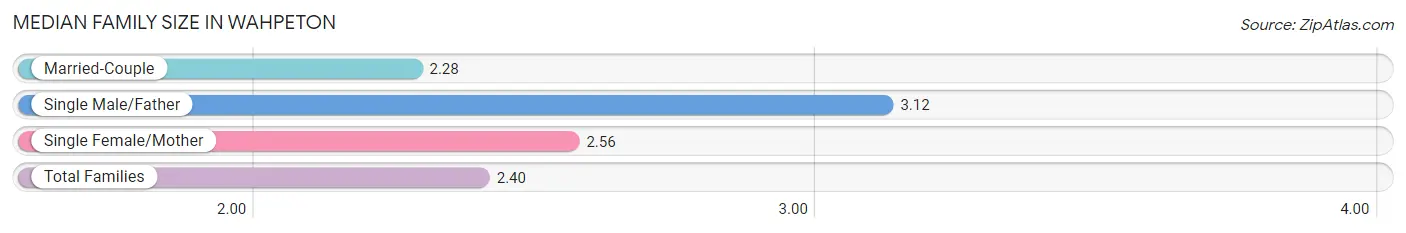
The median family size in Wahpeton is 2.40 persons per family, with single male/father families (17 | 12.2%) accounting for the largest median family size of 3.12 persons per family. On the other hand, married-couple families (113 | 81.3%) represent the smallest median family size with 2.28 persons per family.
| Family Type | # Families | Family Size |
| Married-Couple | 113 (81.3%) | 2.28 |
| Single Male/Father | 17 (12.2%) | 3.12 |
| Single Female/Mother | 9 (6.5%) | 2.56 |
| Total Families | 139 (100.0%) | 2.40 |
Median Household Size in Wahpeton
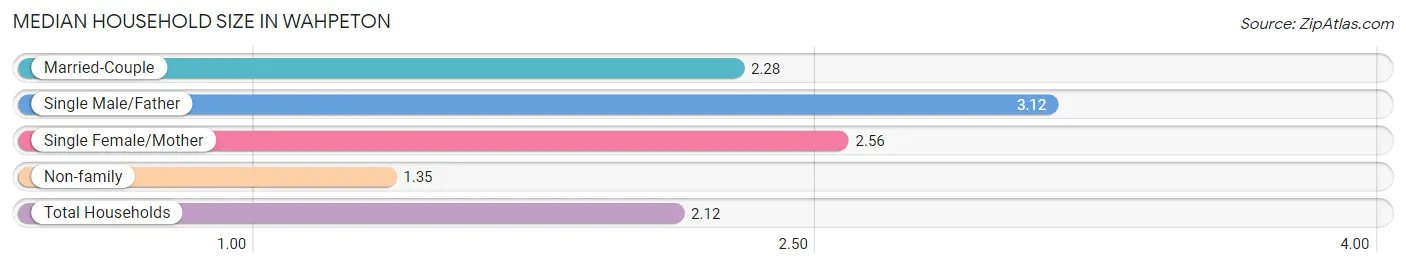
The median household size in Wahpeton is 2.12 persons per household, with single male/father households (17 | 8.9%) accounting for the largest median household size of 3.12 persons per household. non-family households (51 | 26.8%) represent the smallest median household size with 1.35 persons per household.
| Household Type | # Households | Household Size |
| Married-Couple | 113 (59.5%) | 2.28 |
| Single Male/Father | 17 (8.9%) | 3.12 |
| Single Female/Mother | 9 (4.7%) | 2.56 |
| Non-family | 51 (26.8%) | 1.35 |
| Total Households | 190 (100.0%) | 2.12 |
Household Size by Marriage Status in Wahpeton
Out of a total of 190 households in Wahpeton, 139 (73.2%) are family households, while 51 (26.8%) are nonfamily households. The most numerous type of family households are 2-person households, comprising 101, and the most common type of nonfamily households are 1-person households, comprising 43.
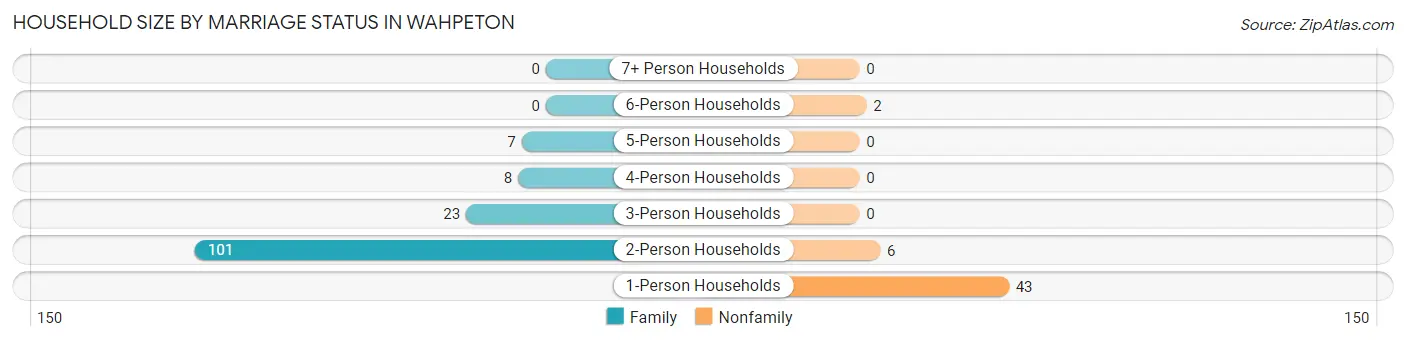
| Household Size | Family Households | Nonfamily Households |
| 1-Person Households | - | 43 (22.6%) |
| 2-Person Households | 101 (53.2%) | 6 (3.2%) |
| 3-Person Households | 23 (12.1%) | 0 (0.0%) |
| 4-Person Households | 8 (4.2%) | 0 (0.0%) |
| 5-Person Households | 7 (3.7%) | 0 (0.0%) |
| 6-Person Households | 0 (0.0%) | 2 (1.1%) |
| 7+ Person Households | 0 (0.0%) | 0 (0.0%) |
| Total | 139 (73.2%) | 51 (26.8%) |
Female Fertility in Wahpeton
Fertility by Age in Wahpeton
Average fertility rate in Wahpeton is 194.0 births per 1,000 women. Women in the age bracket of 35 to 50 years have the highest fertility rate with 217.0 births per 1,000 women. Women in the age bracket of 35 to 50 years acount for 71.4% of all women with births.
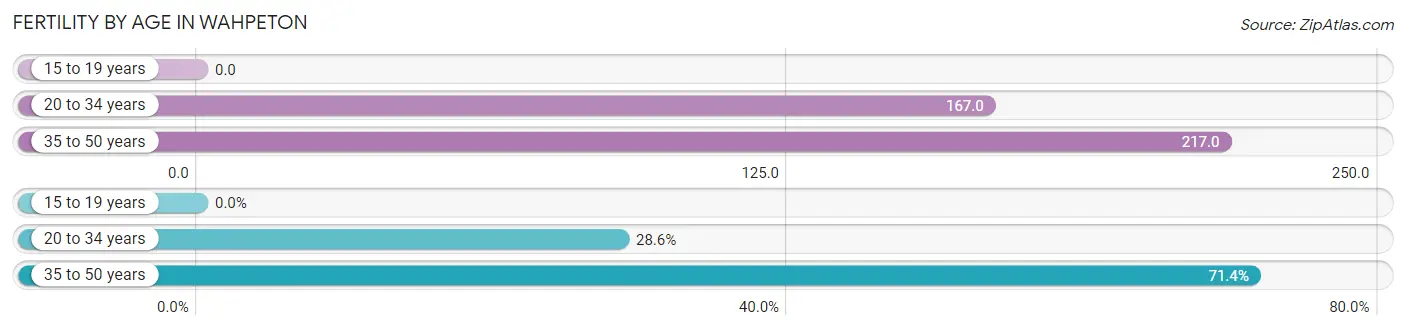
| Age Bracket | Women with Births | Births / 1,000 Women |
| 15 to 19 years | 0 (0.0%) | 0.0 |
| 20 to 34 years | 2 (28.6%) | 167.0 |
| 35 to 50 years | 5 (71.4%) | 217.0 |
| Total | 7 (100.0%) | 194.0 |
Fertility by Age by Marriage Status in Wahpeton
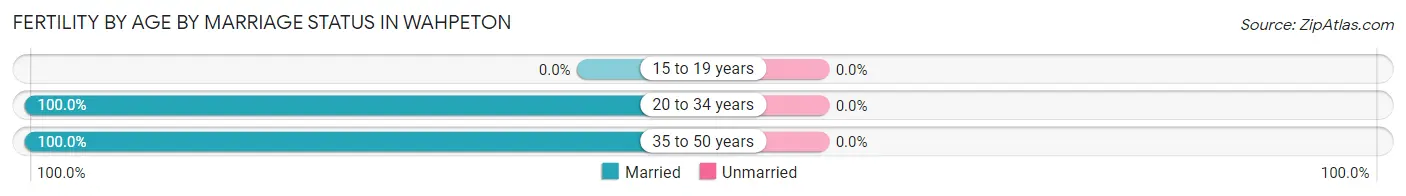
| Age Bracket | Married | Unmarried |
| 15 to 19 years | 0 (0.0%) | 0 (0.0%) |
| 20 to 34 years | 2 (100.0%) | 0 (0.0%) |
| 35 to 50 years | 5 (100.0%) | 0 (0.0%) |
| Total | 7 (100.0%) | 0 (0.0%) |
Fertility by Education in Wahpeton
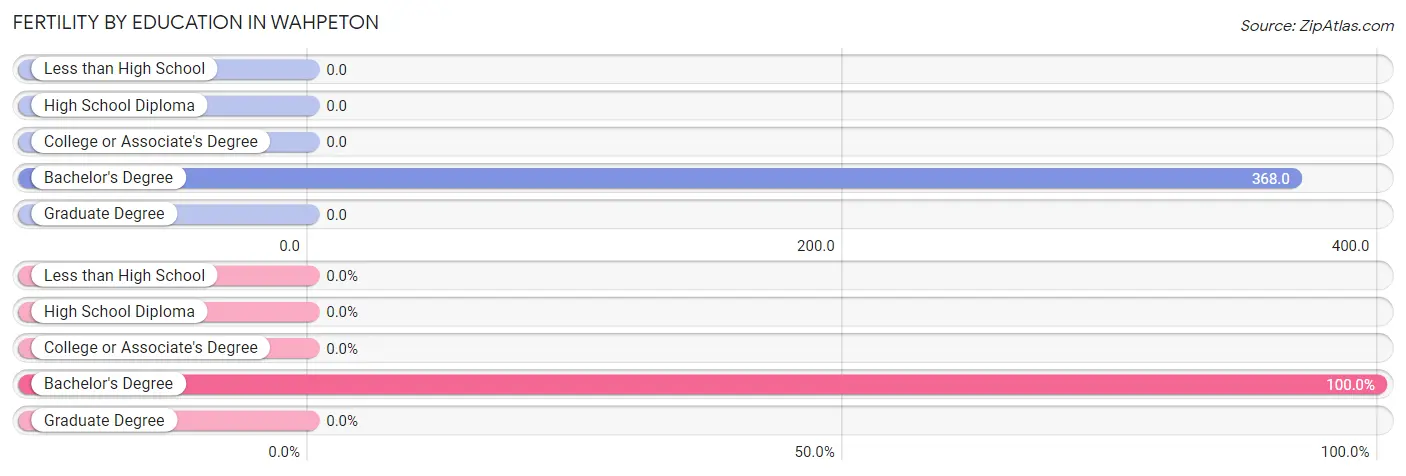
| Educational Attainment | Women with Births | Births / 1,000 Women |
| Less than High School | 0 (0.0%) | 0.0 |
| High School Diploma | 0 (0.0%) | 0.0 |
| College or Associate's Degree | 0 (0.0%) | 0.0 |
| Bachelor's Degree | 7 (100.0%) | 368.0 |
| Graduate Degree | 0 (0.0%) | 0.0 |
| Total | 7 (100.0%) | 194.0 |
Fertility by Education by Marriage Status in Wahpeton
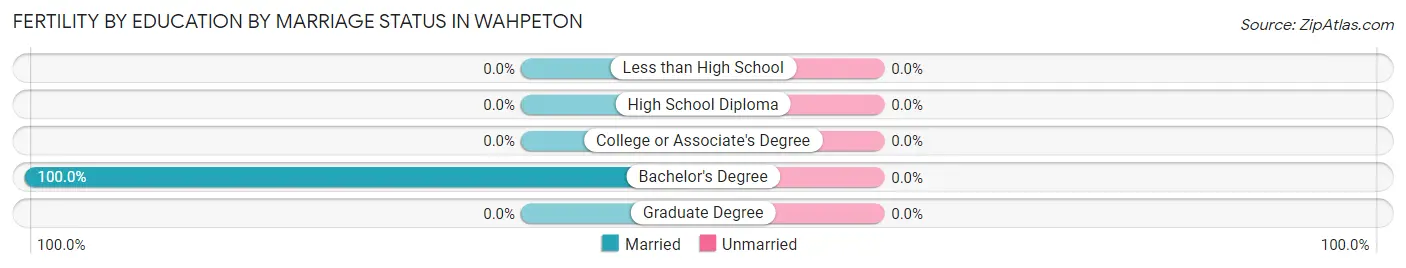
| Educational Attainment | Married | Unmarried |
| Less than High School | 0 (0.0%) | 0 (0.0%) |
| High School Diploma | 0 (0.0%) | 0 (0.0%) |
| College or Associate's Degree | 0 (0.0%) | 0 (0.0%) |
| Bachelor's Degree | 7 (100.0%) | 0 (0.0%) |
| Graduate Degree | 0 (0.0%) | 0 (0.0%) |
| Total | 7 (100.0%) | 0 (0.0%) |
Employment Characteristics in Wahpeton
Employment by Class of Employer in Wahpeton
Among the 174 employed individuals in Wahpeton, private company employees (100 | 57.5%), not-for-profit organizations (33 | 19.0%), and state government employees (18 | 10.3%) make up the most common classes of employment.
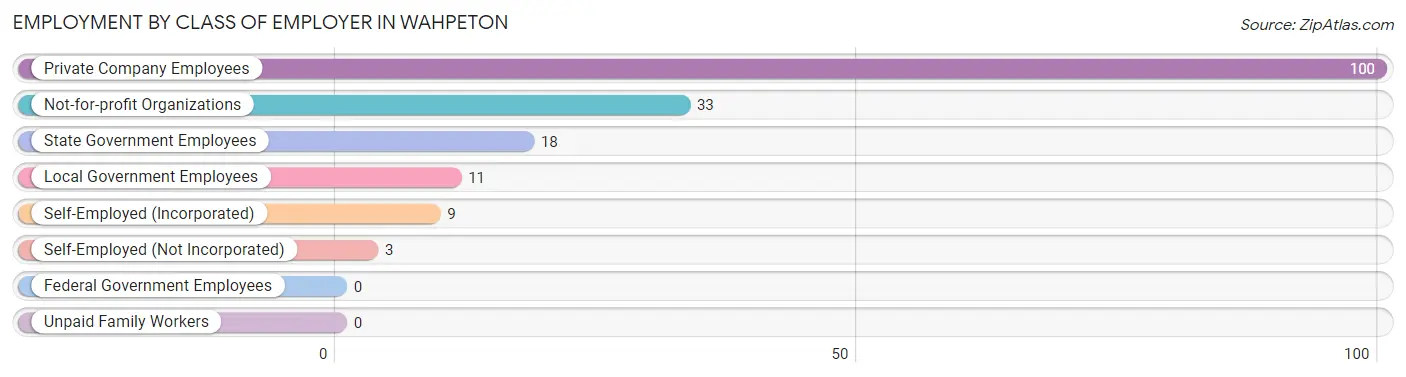
| Employer Class | # Employees | % Employees |
| Private Company Employees | 100 | 57.5% |
| Self-Employed (Incorporated) | 9 | 5.2% |
| Self-Employed (Not Incorporated) | 3 | 1.7% |
| Not-for-profit Organizations | 33 | 19.0% |
| Local Government Employees | 11 | 6.3% |
| State Government Employees | 18 | 10.3% |
| Federal Government Employees | 0 | 0.0% |
| Unpaid Family Workers | 0 | 0.0% |
| Total | 174 | 100.0% |
Employment Status by Age in Wahpeton
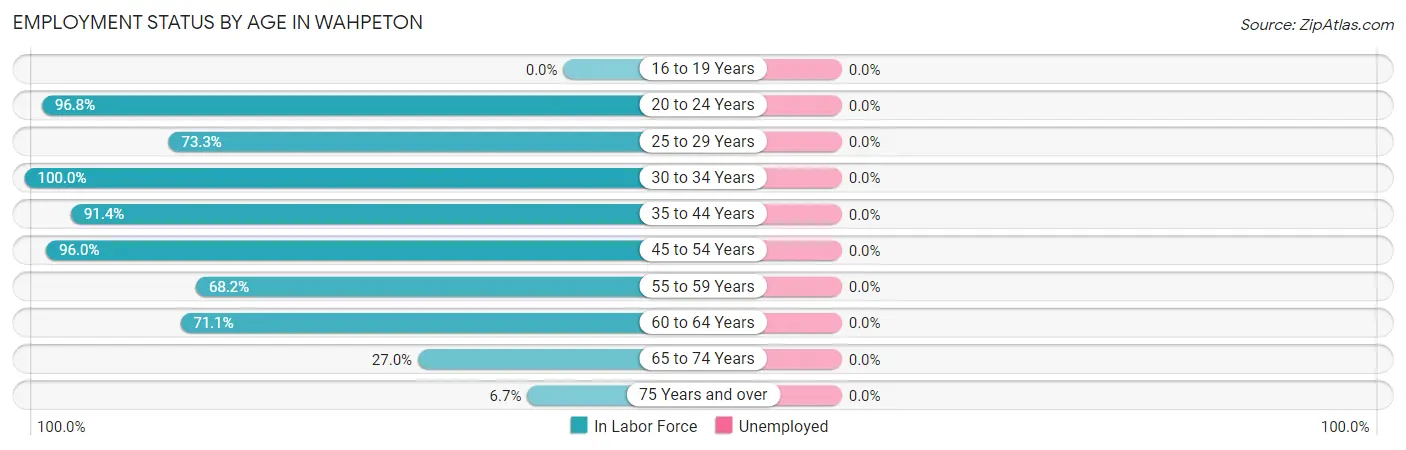
| Age Bracket | In Labor Force | Unemployed |
| 16 to 19 Years | 0 (0.0%) | 0 (0.0%) |
| 20 to 24 Years | 30 (96.8%) | 0 (0.0%) |
| 25 to 29 Years | 11 (73.3%) | 0 (0.0%) |
| 30 to 34 Years | 6 (100.0%) | 0 (0.0%) |
| 35 to 44 Years | 32 (91.4%) | 0 (0.0%) |
| 45 to 54 Years | 24 (96.0%) | 0 (0.0%) |
| 55 to 59 Years | 15 (68.2%) | 0 (0.0%) |
| 60 to 64 Years | 27 (71.1%) | 0 (0.0%) |
| 65 to 74 Years | 24 (27.0%) | 0 (0.0%) |
| 75 Years and over | 5 (6.7%) | 0 (0.0%) |
| Total | 174 (51.6%) | 0 (0.0%) |
Employment Status by Educational Attainment in Wahpeton
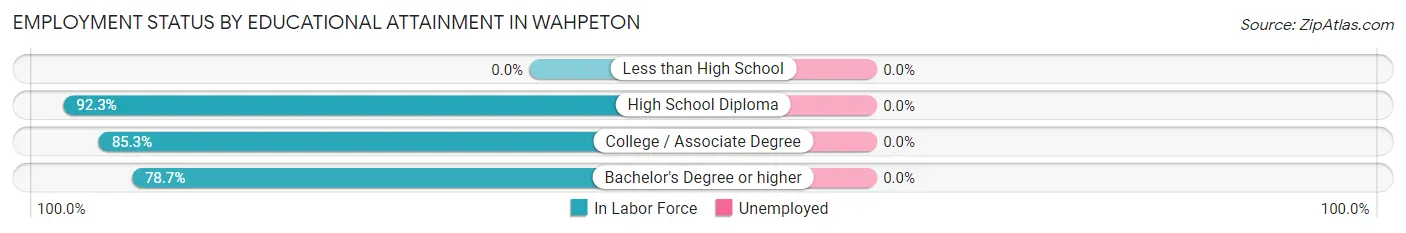
| Educational Attainment | In Labor Force | Unemployed |
| Less than High School | 0 (0.0%) | 0 (0.0%) |
| High School Diploma | 12 (92.3%) | 0 (0.0%) |
| College / Associate Degree | 29 (85.3%) | 0 (0.0%) |
| Bachelor's Degree or higher | 74 (78.7%) | 0 (0.0%) |
| Total | 115 (81.6%) | 0 (0.0%) |
Employment Occupations by Sex in Wahpeton
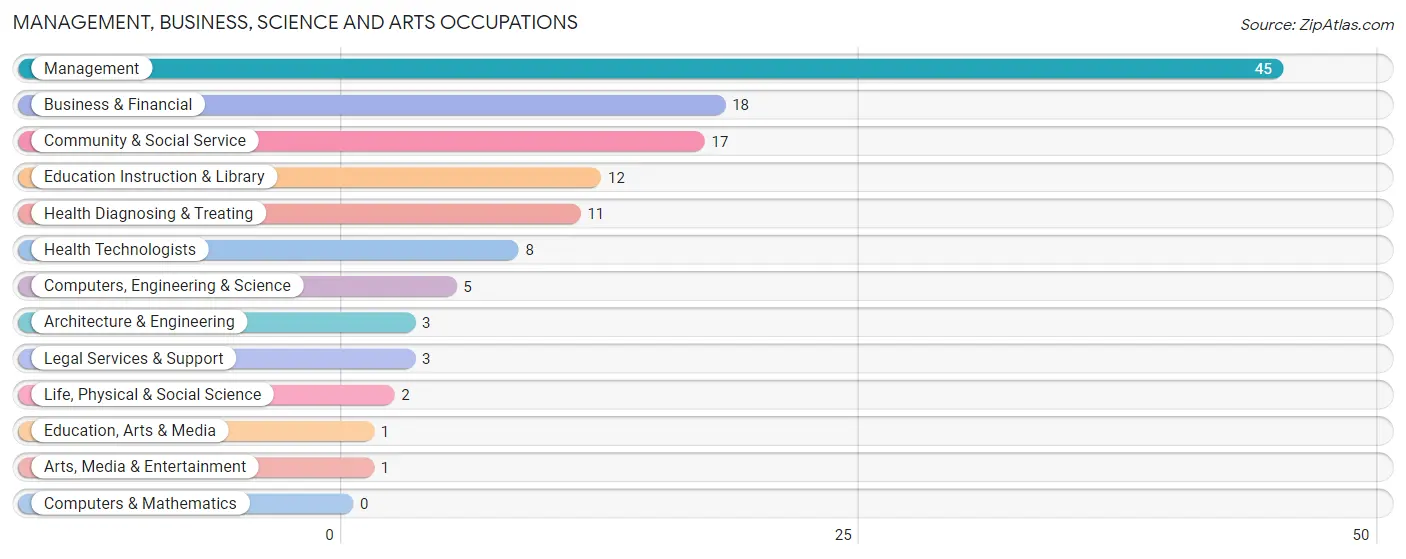
Management, Business, Science and Arts Occupations
The most common Management, Business, Science and Arts occupations in Wahpeton are Management (45 | 25.9%), Business & Financial (18 | 10.3%), Community & Social Service (17 | 9.8%), Education Instruction & Library (12 | 6.9%), and Health Diagnosing & Treating (11 | 6.3%).
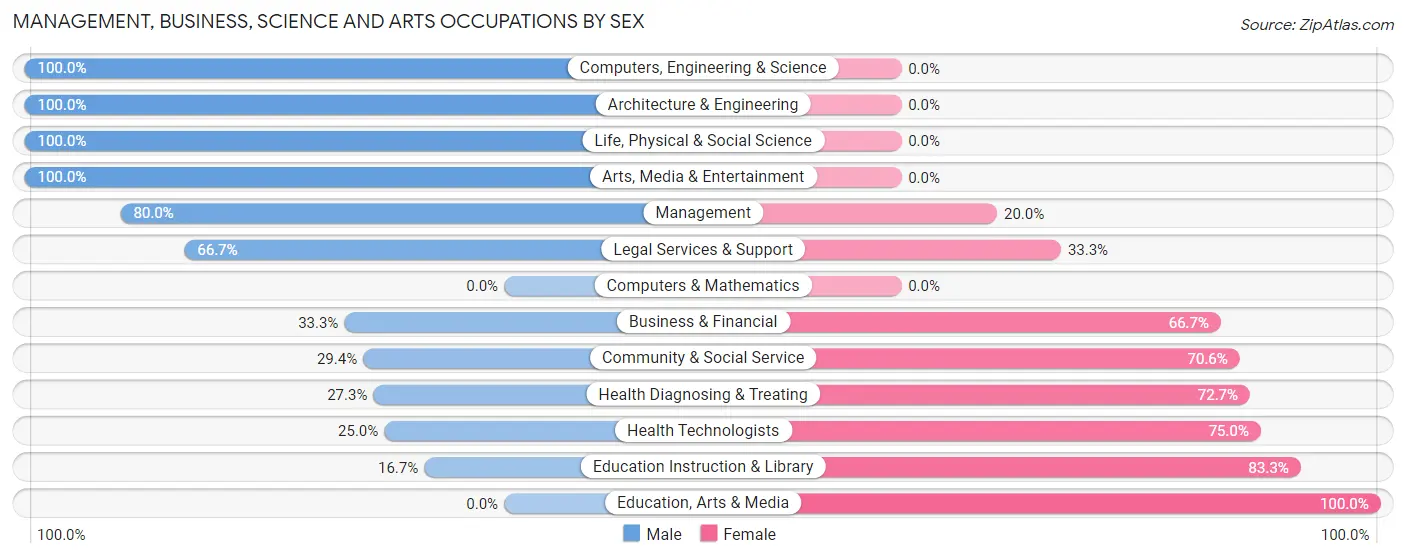
Management, Business, Science and Arts Occupations by Sex
Within the Management, Business, Science and Arts occupations in Wahpeton, the most male-oriented occupations are Computers, Engineering & Science (100.0%), Architecture & Engineering (100.0%), and Life, Physical & Social Science (100.0%), while the most female-oriented occupations are Education, Arts & Media (100.0%), Education Instruction & Library (83.3%), and Health Technologists (75.0%).
| Occupation | Male | Female |
| Management | 36 (80.0%) | 9 (20.0%) |
| Business & Financial | 6 (33.3%) | 12 (66.7%) |
| Computers, Engineering & Science | 5 (100.0%) | 0 (0.0%) |
| Computers & Mathematics | 0 (0.0%) | 0 (0.0%) |
| Architecture & Engineering | 3 (100.0%) | 0 (0.0%) |
| Life, Physical & Social Science | 2 (100.0%) | 0 (0.0%) |
| Community & Social Service | 5 (29.4%) | 12 (70.6%) |
| Education, Arts & Media | 0 (0.0%) | 1 (100.0%) |
| Legal Services & Support | 2 (66.7%) | 1 (33.3%) |
| Education Instruction & Library | 2 (16.7%) | 10 (83.3%) |
| Arts, Media & Entertainment | 1 (100.0%) | 0 (0.0%) |
| Health Diagnosing & Treating | 3 (27.3%) | 8 (72.7%) |
| Health Technologists | 2 (25.0%) | 6 (75.0%) |
| Total (Category) | 55 (57.3%) | 41 (42.7%) |
| Total (Overall) | 107 (61.5%) | 67 (38.5%) |
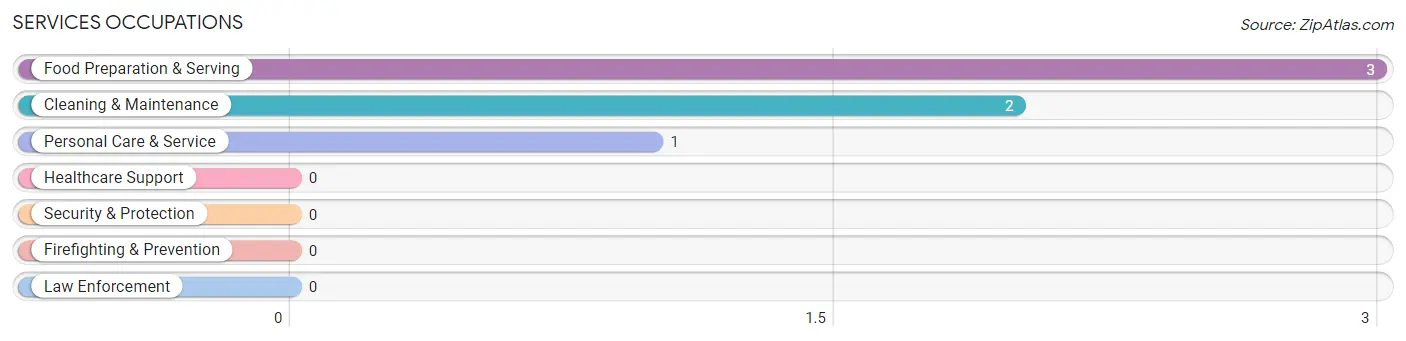
Services Occupations
The most common Services occupations in Wahpeton are Food Preparation & Serving (3 | 1.7%), Cleaning & Maintenance (2 | 1.1%), and Personal Care & Service (1 | 0.6%).
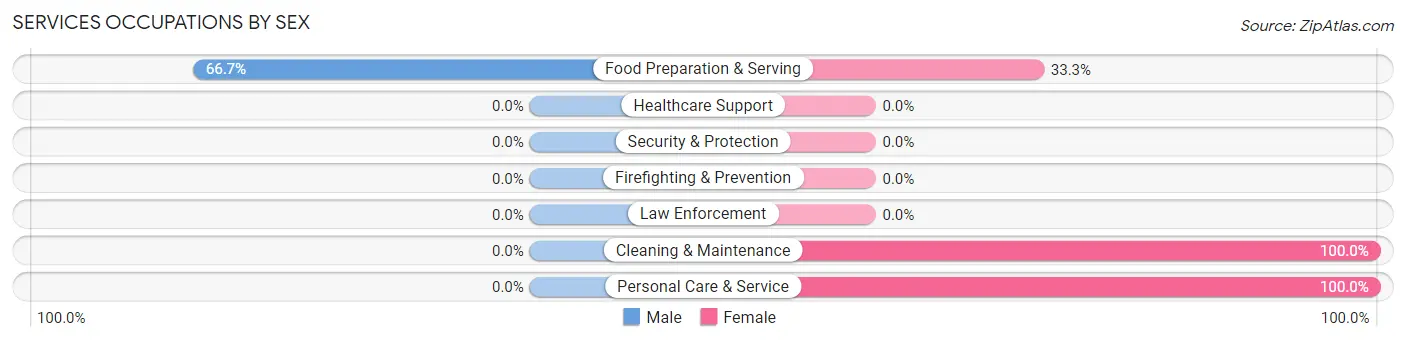
Services Occupations by Sex
| Occupation | Male | Female |
| Healthcare Support | 0 (0.0%) | 0 (0.0%) |
| Security & Protection | 0 (0.0%) | 0 (0.0%) |
| Firefighting & Prevention | 0 (0.0%) | 0 (0.0%) |
| Law Enforcement | 0 (0.0%) | 0 (0.0%) |
| Food Preparation & Serving | 2 (66.7%) | 1 (33.3%) |
| Cleaning & Maintenance | 0 (0.0%) | 2 (100.0%) |
| Personal Care & Service | 0 (0.0%) | 1 (100.0%) |
| Total (Category) | 2 (33.3%) | 4 (66.7%) |
| Total (Overall) | 107 (61.5%) | 67 (38.5%) |
Sales and Office Occupations
The most common Sales and Office occupations in Wahpeton are Office & Administration (20 | 11.5%), and Sales & Related (12 | 6.9%).
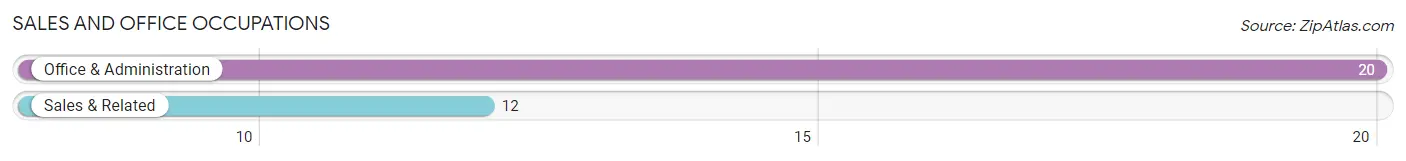
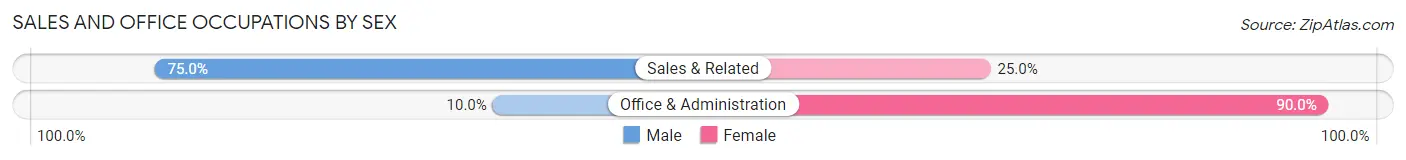
Sales and Office Occupations by Sex
| Occupation | Male | Female |
| Sales & Related | 9 (75.0%) | 3 (25.0%) |
| Office & Administration | 2 (10.0%) | 18 (90.0%) |
| Total (Category) | 11 (34.4%) | 21 (65.6%) |
| Total (Overall) | 107 (61.5%) | 67 (38.5%) |
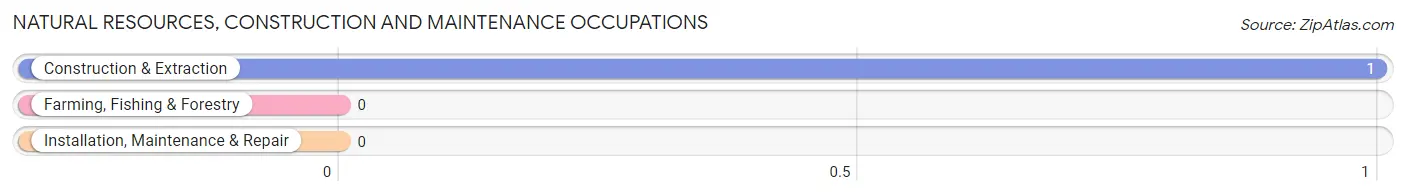
Natural Resources, Construction and Maintenance Occupations
The most common Natural Resources, Construction and Maintenance occupations in Wahpeton are , and Construction & Extraction (1 | 0.6%).
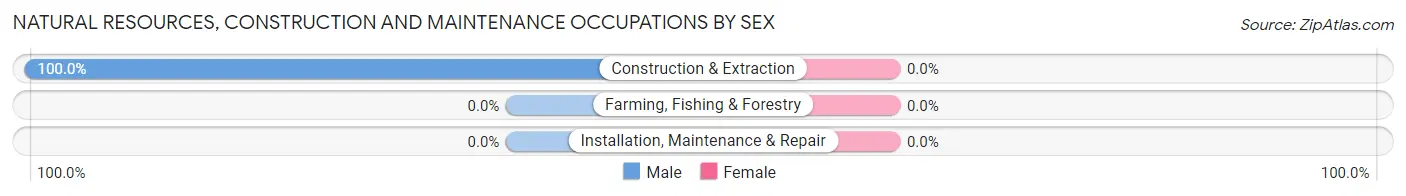
Natural Resources, Construction and Maintenance Occupations by Sex
| Occupation | Male | Female |
| Farming, Fishing & Forestry | 0 (0.0%) | 0 (0.0%) |
| Construction & Extraction | 1 (100.0%) | 0 (0.0%) |
| Installation, Maintenance & Repair | 0 (0.0%) | 0 (0.0%) |
| Total (Category) | 1 (100.0%) | 0 (0.0%) |
| Total (Overall) | 107 (61.5%) | 67 (38.5%) |
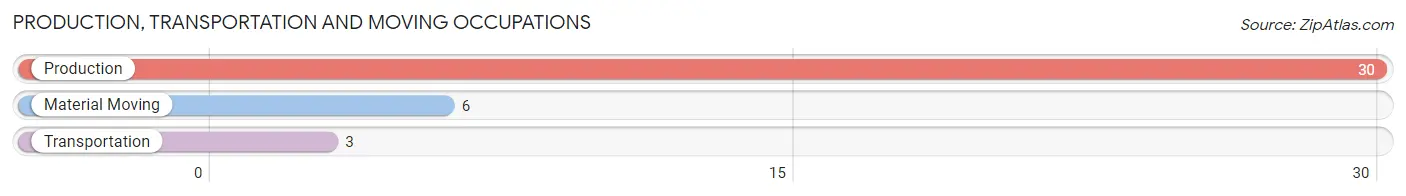
Production, Transportation and Moving Occupations
The most common Production, Transportation and Moving occupations in Wahpeton are Production (30 | 17.2%), Material Moving (6 | 3.5%), and Transportation (3 | 1.7%).
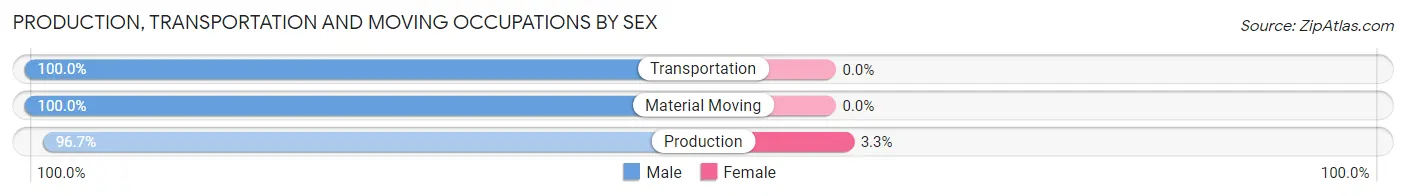
Production, Transportation and Moving Occupations by Sex
| Occupation | Male | Female |
| Production | 29 (96.7%) | 1 (3.3%) |
| Transportation | 3 (100.0%) | 0 (0.0%) |
| Material Moving | 6 (100.0%) | 0 (0.0%) |
| Total (Category) | 38 (97.4%) | 1 (2.6%) |
| Total (Overall) | 107 (61.5%) | 67 (38.5%) |
Employment Industries by Sex in Wahpeton
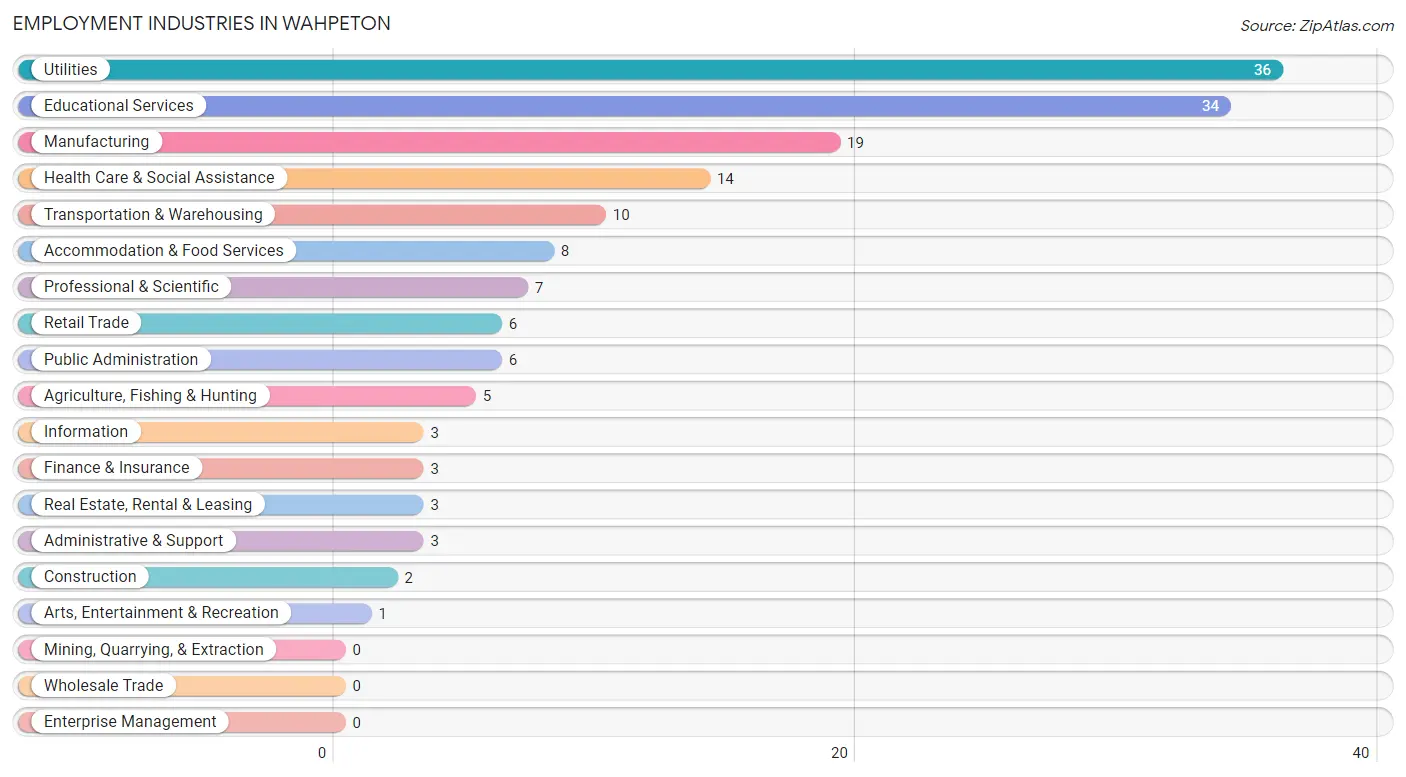
Employment Industries in Wahpeton
The major employment industries in Wahpeton include Utilities (36 | 20.7%), Educational Services (34 | 19.5%), Manufacturing (19 | 10.9%), Health Care & Social Assistance (14 | 8.1%), and Transportation & Warehousing (10 | 5.8%).
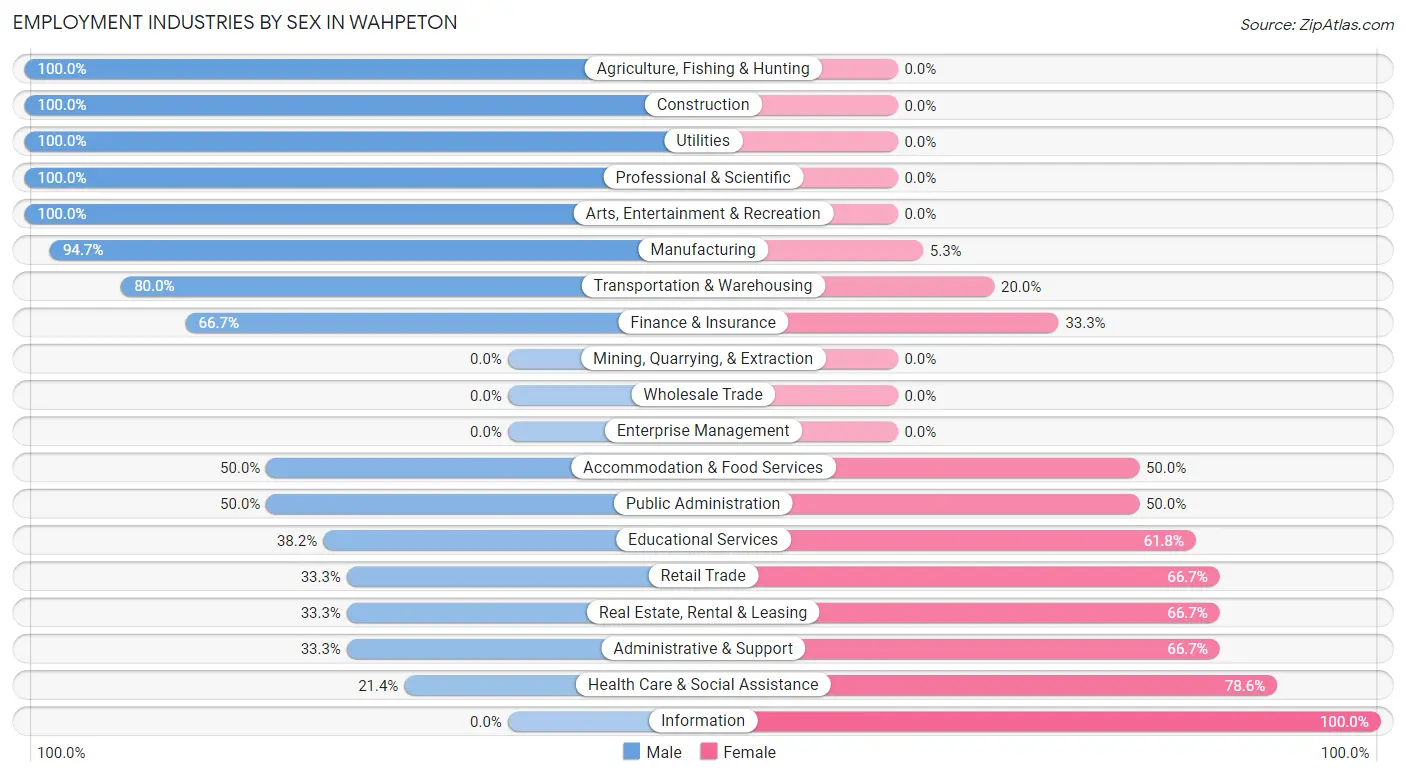
Employment Industries by Sex in Wahpeton
The Wahpeton industries that see more men than women are Agriculture, Fishing & Hunting (100.0%), Construction (100.0%), and Utilities (100.0%), whereas the industries that tend to have a higher number of women are Information (100.0%), Health Care & Social Assistance (78.6%), and Retail Trade (66.7%).
| Industry | Male | Female |
| Agriculture, Fishing & Hunting | 5 (100.0%) | 0 (0.0%) |
| Mining, Quarrying, & Extraction | 0 (0.0%) | 0 (0.0%) |
| Construction | 2 (100.0%) | 0 (0.0%) |
| Manufacturing | 18 (94.7%) | 1 (5.3%) |
| Wholesale Trade | 0 (0.0%) | 0 (0.0%) |
| Retail Trade | 2 (33.3%) | 4 (66.7%) |
| Transportation & Warehousing | 8 (80.0%) | 2 (20.0%) |
| Utilities | 36 (100.0%) | 0 (0.0%) |
| Information | 0 (0.0%) | 3 (100.0%) |
| Finance & Insurance | 2 (66.7%) | 1 (33.3%) |
| Real Estate, Rental & Leasing | 1 (33.3%) | 2 (66.7%) |
| Professional & Scientific | 7 (100.0%) | 0 (0.0%) |
| Enterprise Management | 0 (0.0%) | 0 (0.0%) |
| Administrative & Support | 1 (33.3%) | 2 (66.7%) |
| Educational Services | 13 (38.2%) | 21 (61.8%) |
| Health Care & Social Assistance | 3 (21.4%) | 11 (78.6%) |
| Arts, Entertainment & Recreation | 1 (100.0%) | 0 (0.0%) |
| Accommodation & Food Services | 4 (50.0%) | 4 (50.0%) |
| Public Administration | 3 (50.0%) | 3 (50.0%) |
| Total | 107 (61.5%) | 67 (38.5%) |
Education in Wahpeton
School Enrollment in Wahpeton
The most common levels of schooling among the 54 students in Wahpeton are middle school (19 | 35.2%), elementary school (15 | 27.8%), and high school (15 | 27.8%).
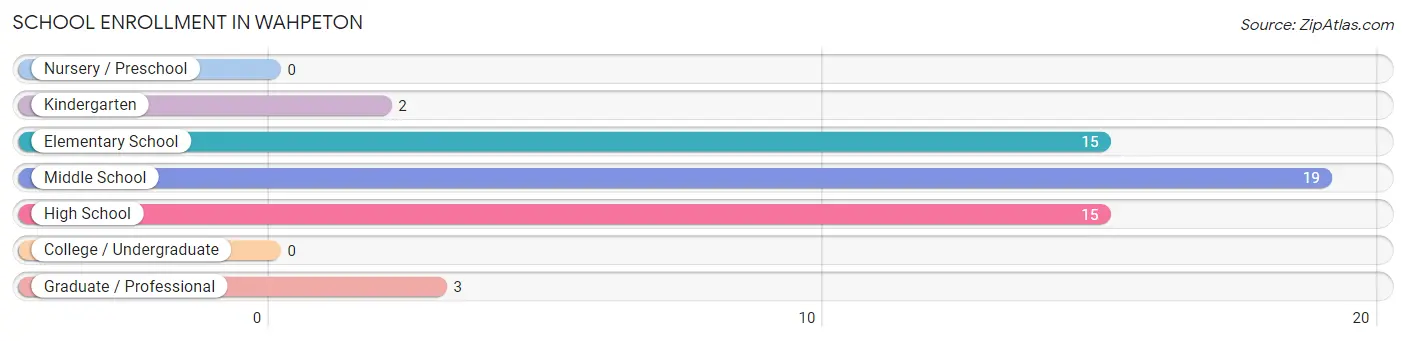
| School Level | # Students | % Students |
| Nursery / Preschool | 0 | 0.0% |
| Kindergarten | 2 | 3.7% |
| Elementary School | 15 | 27.8% |
| Middle School | 19 | 35.2% |
| High School | 15 | 27.8% |
| College / Undergraduate | 0 | 0.0% |
| Graduate / Professional | 3 | 5.6% |
| Total | 54 | 100.0% |
School Enrollment by Age by Funding Source in Wahpeton
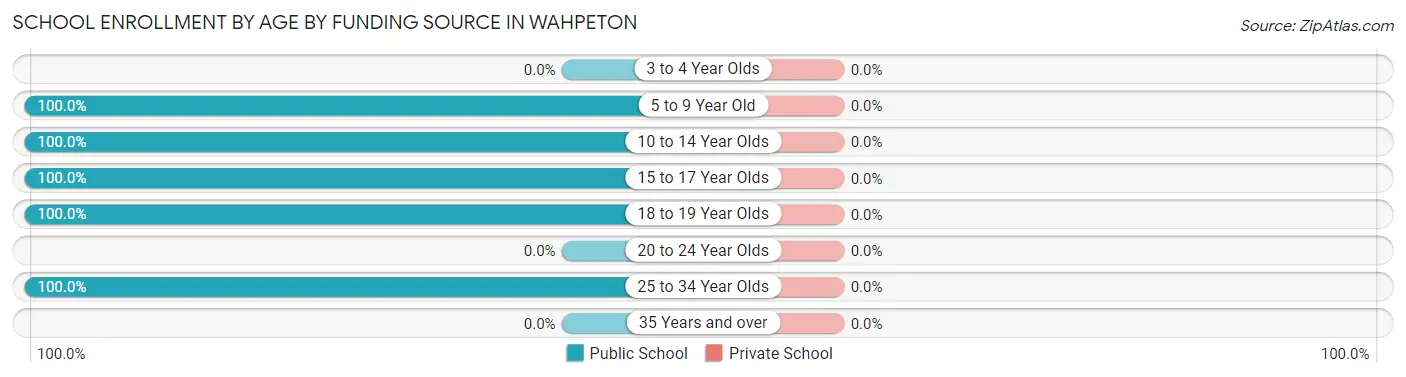
| Age Bracket | Public School | Private School |
| 3 to 4 Year Olds | 0 (0.0%) | 0 (0.0%) |
| 5 to 9 Year Old | 15 (100.0%) | 0 (0.0%) |
| 10 to 14 Year Olds | 21 (100.0%) | 0 (0.0%) |
| 15 to 17 Year Olds | 14 (100.0%) | 0 (0.0%) |
| 18 to 19 Year Olds | 1 (100.0%) | 0 (0.0%) |
| 20 to 24 Year Olds | 0 (0.0%) | 0 (0.0%) |
| 25 to 34 Year Olds | 3 (100.0%) | 0 (0.0%) |
| 35 Years and over | 0 (0.0%) | 0 (0.0%) |
| Total | 54 (100.0%) | 0 (0.0%) |
Educational Attainment by Field of Study in Wahpeton
Business (31 | 18.0%), education (29 | 16.9%), science & technology (20 | 11.6%), psychology (18 | 10.5%), and bio, nature & agricultural (17 | 9.9%) are the most common fields of study among 172 individuals in Wahpeton who have obtained a bachelor's degree or higher.
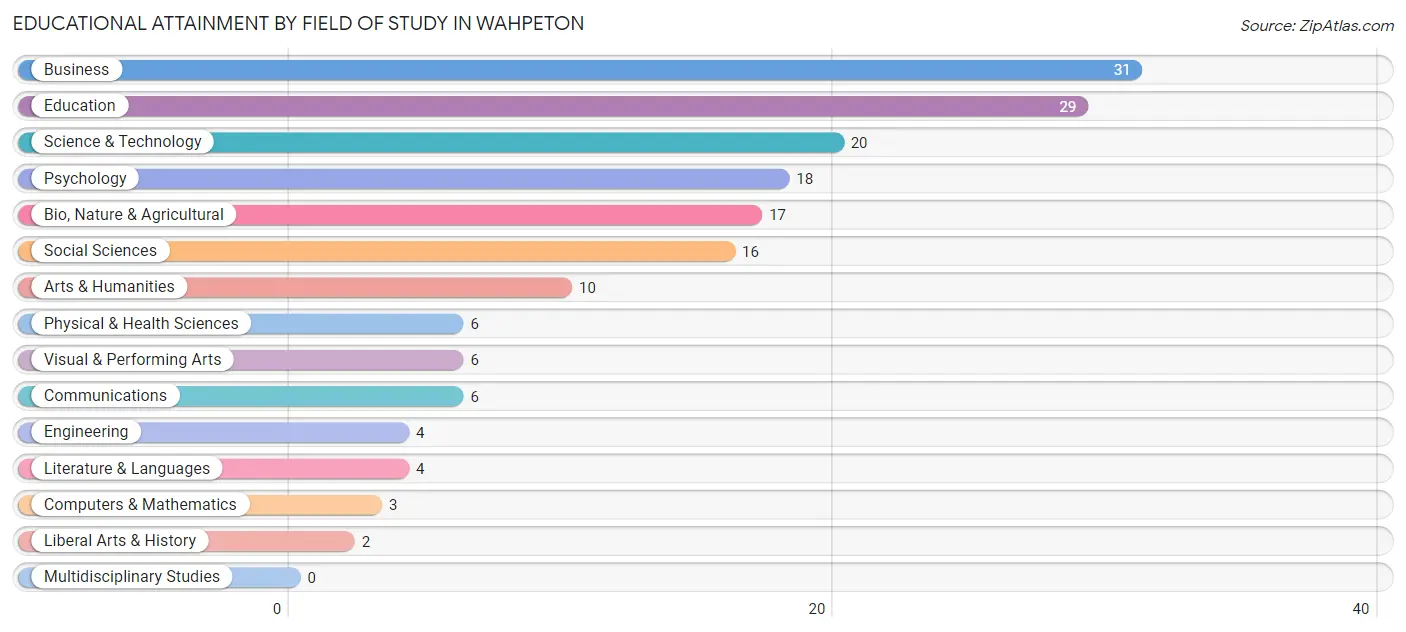
| Field of Study | # Graduates | % Graduates |
| Computers & Mathematics | 3 | 1.7% |
| Bio, Nature & Agricultural | 17 | 9.9% |
| Physical & Health Sciences | 6 | 3.5% |
| Psychology | 18 | 10.5% |
| Social Sciences | 16 | 9.3% |
| Engineering | 4 | 2.3% |
| Multidisciplinary Studies | 0 | 0.0% |
| Science & Technology | 20 | 11.6% |
| Business | 31 | 18.0% |
| Education | 29 | 16.9% |
| Literature & Languages | 4 | 2.3% |
| Liberal Arts & History | 2 | 1.2% |
| Visual & Performing Arts | 6 | 3.5% |
| Communications | 6 | 3.5% |
| Arts & Humanities | 10 | 5.8% |
| Total | 172 | 100.0% |
Transportation & Commute in Wahpeton
Vehicle Availability by Sex in Wahpeton
The most prevalent vehicle ownership categories in Wahpeton are males with 2 vehicles (42, accounting for 39.3%) and females with 2 vehicles (34, making up 62.7%).
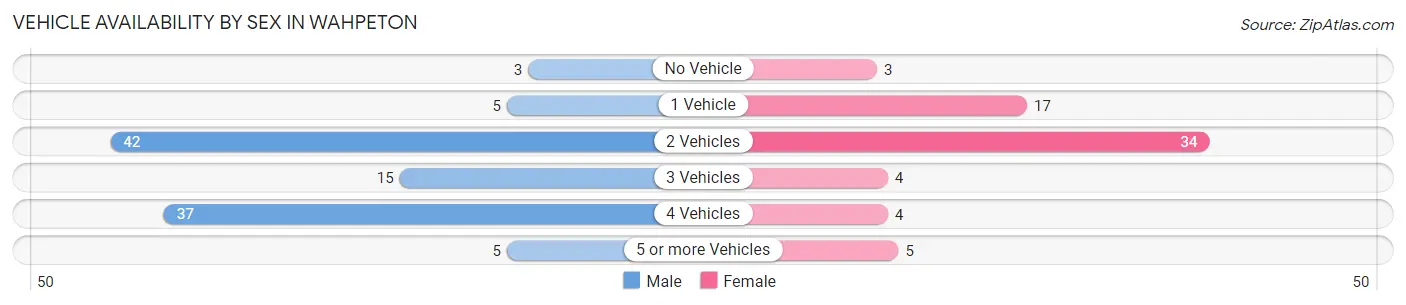
| Vehicles Available | Male | Female |
| No Vehicle | 3 (2.8%) | 3 (4.5%) |
| 1 Vehicle | 5 (4.7%) | 17 (25.4%) |
| 2 Vehicles | 42 (39.3%) | 34 (50.7%) |
| 3 Vehicles | 15 (14.0%) | 4 (6.0%) |
| 4 Vehicles | 37 (34.6%) | 4 (6.0%) |
| 5 or more Vehicles | 5 (4.7%) | 5 (7.5%) |
| Total | 107 (100.0%) | 67 (100.0%) |
Commute Time in Wahpeton
The most frequently occuring commute durations in Wahpeton are 15 to 19 minutes (48 commuters, 32.0%), 10 to 14 minutes (33 commuters, 22.0%), and 5 to 9 minutes (27 commuters, 18.0%).
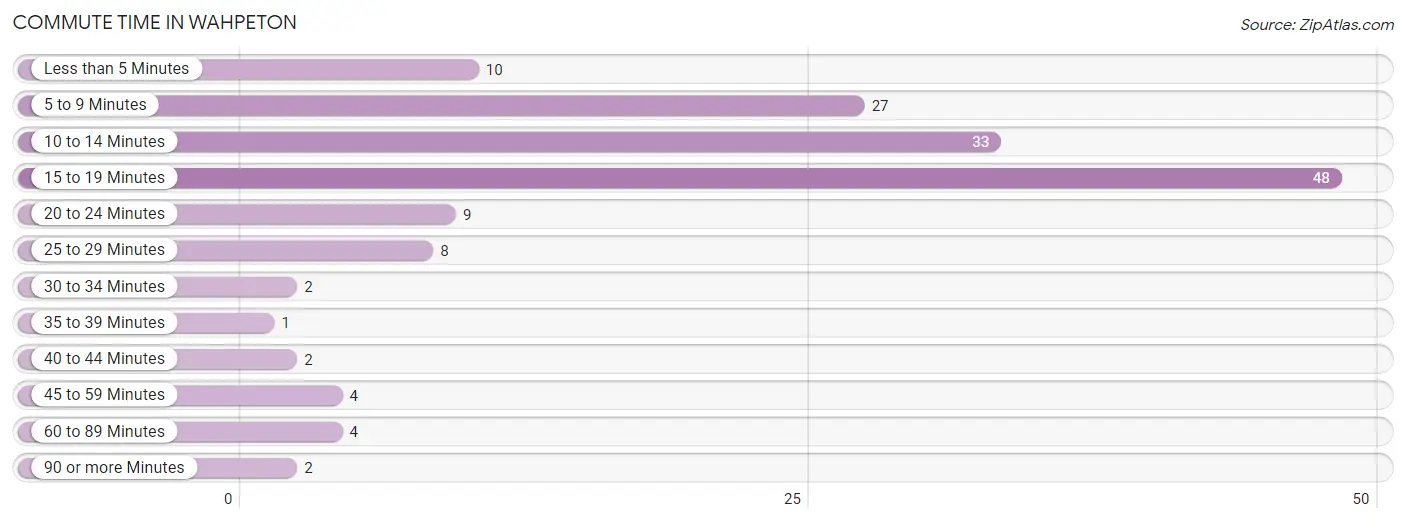
| Commute Time | # Commuters | % Commuters |
| Less than 5 Minutes | 10 | 6.7% |
| 5 to 9 Minutes | 27 | 18.0% |
| 10 to 14 Minutes | 33 | 22.0% |
| 15 to 19 Minutes | 48 | 32.0% |
| 20 to 24 Minutes | 9 | 6.0% |
| 25 to 29 Minutes | 8 | 5.3% |
| 30 to 34 Minutes | 2 | 1.3% |
| 35 to 39 Minutes | 1 | 0.7% |
| 40 to 44 Minutes | 2 | 1.3% |
| 45 to 59 Minutes | 4 | 2.7% |
| 60 to 89 Minutes | 4 | 2.7% |
| 90 or more Minutes | 2 | 1.3% |
Commute Time by Sex in Wahpeton
The most common commute times in Wahpeton are 15 to 19 minutes (42 commuters, 41.2%) for males and 5 to 9 minutes (14 commuters, 29.2%) for females.
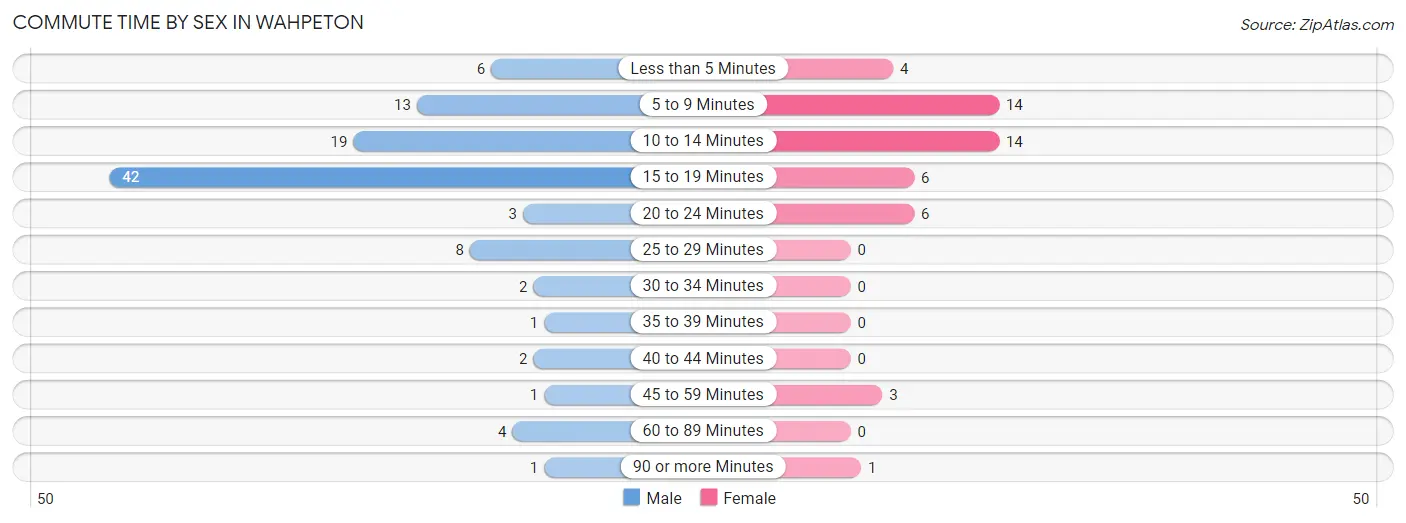
| Commute Time | Male | Female |
| Less than 5 Minutes | 6 (5.9%) | 4 (8.3%) |
| 5 to 9 Minutes | 13 (12.8%) | 14 (29.2%) |
| 10 to 14 Minutes | 19 (18.6%) | 14 (29.2%) |
| 15 to 19 Minutes | 42 (41.2%) | 6 (12.5%) |
| 20 to 24 Minutes | 3 (2.9%) | 6 (12.5%) |
| 25 to 29 Minutes | 8 (7.8%) | 0 (0.0%) |
| 30 to 34 Minutes | 2 (2.0%) | 0 (0.0%) |
| 35 to 39 Minutes | 1 (1.0%) | 0 (0.0%) |
| 40 to 44 Minutes | 2 (2.0%) | 0 (0.0%) |
| 45 to 59 Minutes | 1 (1.0%) | 3 (6.2%) |
| 60 to 89 Minutes | 4 (3.9%) | 0 (0.0%) |
| 90 or more Minutes | 1 (1.0%) | 1 (2.1%) |
Time of Departure to Work by Sex in Wahpeton
The most frequent times of departure to work in Wahpeton are 7:00 AM to 7:29 AM (46, 45.1%) for males and 8:30 AM to 8:59 AM (13, 27.1%) for females.
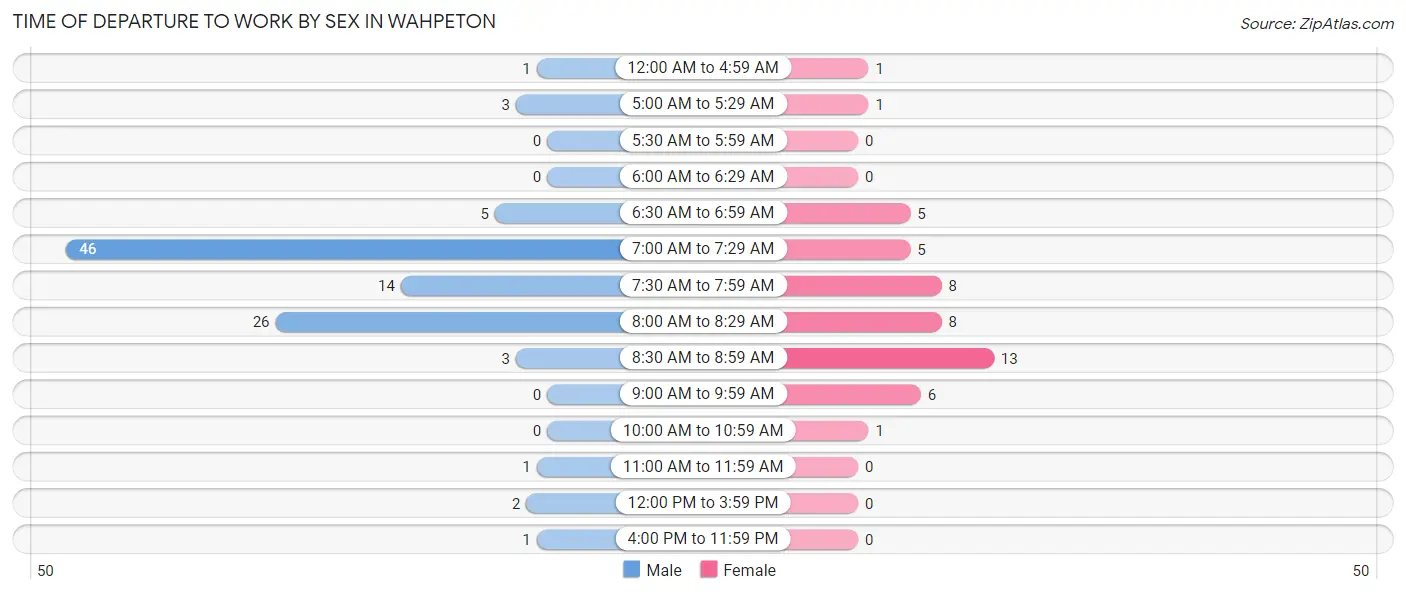
| Time of Departure | Male | Female |
| 12:00 AM to 4:59 AM | 1 (1.0%) | 1 (2.1%) |
| 5:00 AM to 5:29 AM | 3 (2.9%) | 1 (2.1%) |
| 5:30 AM to 5:59 AM | 0 (0.0%) | 0 (0.0%) |
| 6:00 AM to 6:29 AM | 0 (0.0%) | 0 (0.0%) |
| 6:30 AM to 6:59 AM | 5 (4.9%) | 5 (10.4%) |
| 7:00 AM to 7:29 AM | 46 (45.1%) | 5 (10.4%) |
| 7:30 AM to 7:59 AM | 14 (13.7%) | 8 (16.7%) |
| 8:00 AM to 8:29 AM | 26 (25.5%) | 8 (16.7%) |
| 8:30 AM to 8:59 AM | 3 (2.9%) | 13 (27.1%) |
| 9:00 AM to 9:59 AM | 0 (0.0%) | 6 (12.5%) |
| 10:00 AM to 10:59 AM | 0 (0.0%) | 1 (2.1%) |
| 11:00 AM to 11:59 AM | 1 (1.0%) | 0 (0.0%) |
| 12:00 PM to 3:59 PM | 2 (2.0%) | 0 (0.0%) |
| 4:00 PM to 11:59 PM | 1 (1.0%) | 0 (0.0%) |
| Total | 102 (100.0%) | 48 (100.0%) |
Housing Occupancy in Wahpeton
Occupancy by Ownership in Wahpeton
Of the total 190 dwellings in Wahpeton, owner-occupied units account for 159 (83.7%), while renter-occupied units make up 31 (16.3%).
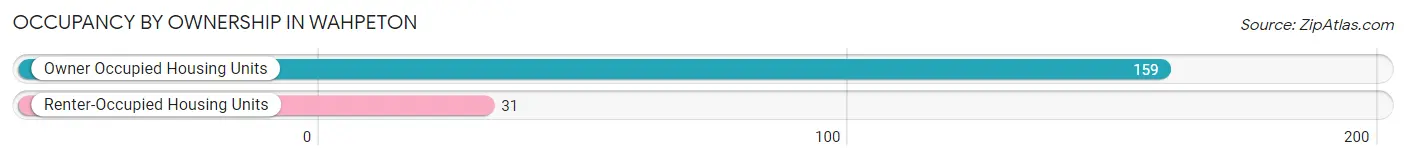
| Occupancy | # Housing Units | % Housing Units |
| Owner Occupied Housing Units | 159 | 83.7% |
| Renter-Occupied Housing Units | 31 | 16.3% |
| Total Occupied Housing Units | 190 | 100.0% |
Occupancy by Household Size in Wahpeton
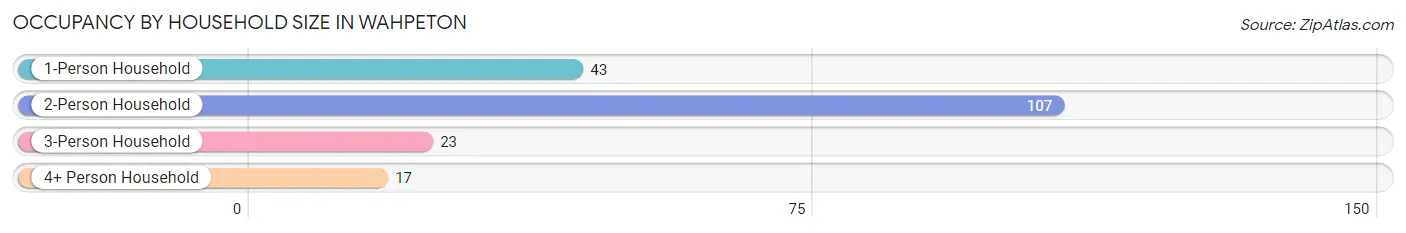
| Household Size | # Housing Units | % Housing Units |
| 1-Person Household | 43 | 22.6% |
| 2-Person Household | 107 | 56.3% |
| 3-Person Household | 23 | 12.1% |
| 4+ Person Household | 17 | 8.9% |
| Total Housing Units | 190 | 100.0% |
Occupancy by Ownership by Household Size in Wahpeton
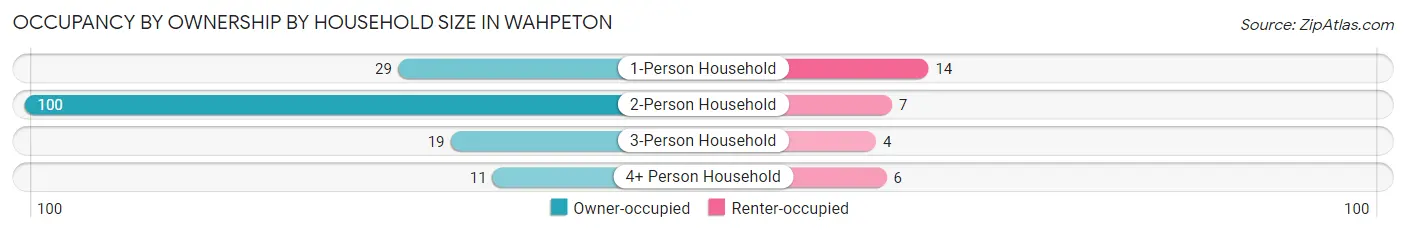
| Household Size | Owner-occupied | Renter-occupied |
| 1-Person Household | 29 (67.4%) | 14 (32.6%) |
| 2-Person Household | 100 (93.5%) | 7 (6.5%) |
| 3-Person Household | 19 (82.6%) | 4 (17.4%) |
| 4+ Person Household | 11 (64.7%) | 6 (35.3%) |
| Total Housing Units | 159 (83.7%) | 31 (16.3%) |
Occupancy by Educational Attainment in Wahpeton
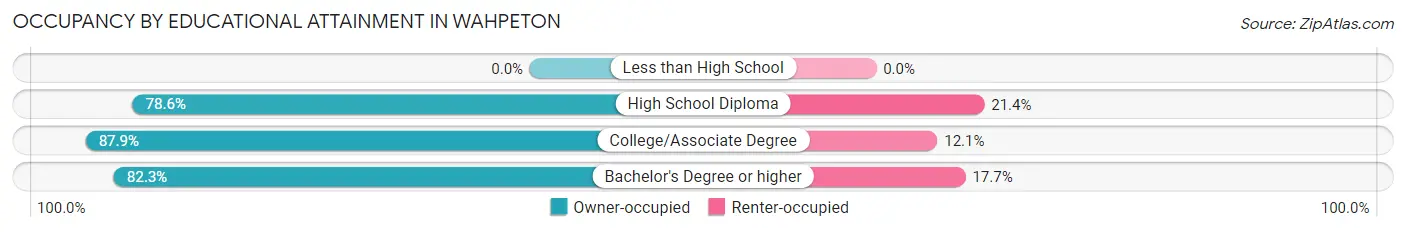
| Household Size | Owner-occupied | Renter-occupied |
| Less than High School | 0 (0.0%) | 0 (0.0%) |
| High School Diploma | 22 (78.6%) | 6 (21.4%) |
| College/Associate Degree | 58 (87.9%) | 8 (12.1%) |
| Bachelor's Degree or higher | 79 (82.3%) | 17 (17.7%) |
Occupancy by Age of Householder in Wahpeton
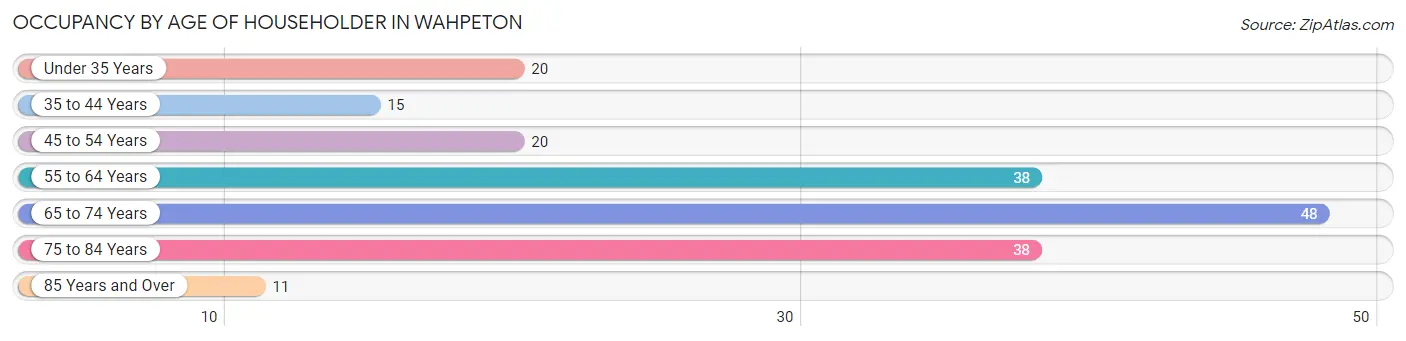
| Age Bracket | # Households | % Households |
| Under 35 Years | 20 | 10.5% |
| 35 to 44 Years | 15 | 7.9% |
| 45 to 54 Years | 20 | 10.5% |
| 55 to 64 Years | 38 | 20.0% |
| 65 to 74 Years | 48 | 25.3% |
| 75 to 84 Years | 38 | 20.0% |
| 85 Years and Over | 11 | 5.8% |
| Total | 190 | 100.0% |
Housing Finances in Wahpeton
Median Income by Occupancy in Wahpeton
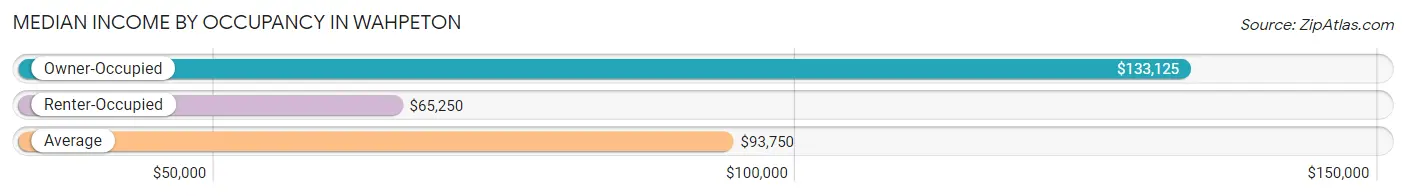
| Occupancy Type | # Households | Median Income |
| Owner-Occupied | 159 (83.7%) | $133,125 |
| Renter-Occupied | 31 (16.3%) | $65,250 |
| Average | 190 (100.0%) | $93,750 |
Occupancy by Householder Income Bracket in Wahpeton
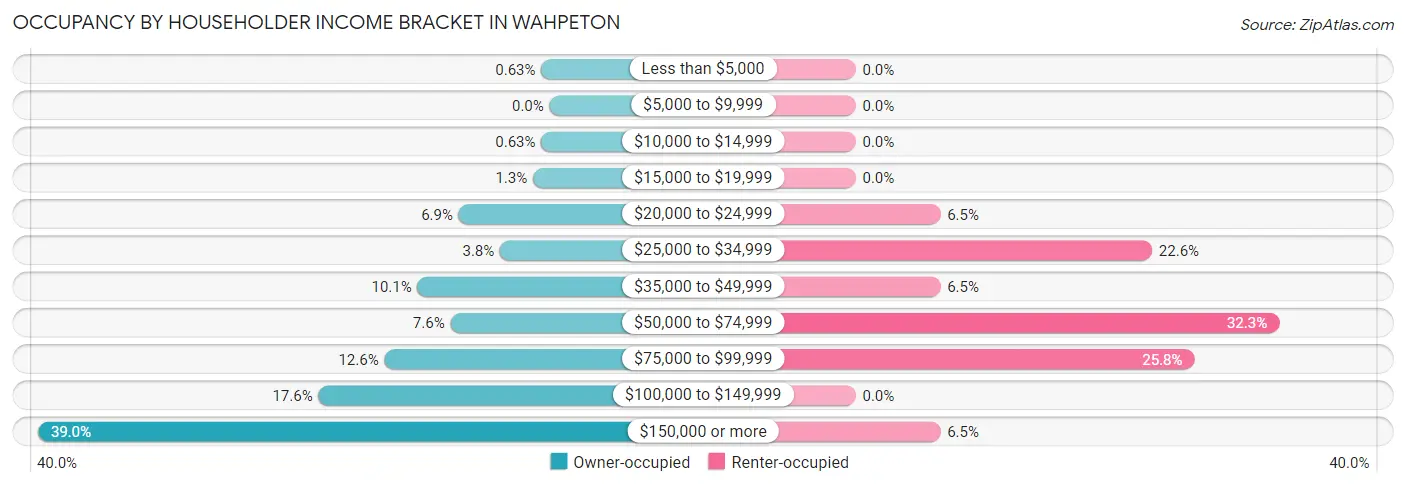
| Income Bracket | Owner-occupied | Renter-occupied |
| Less than $5,000 | 1 (0.6%) | 0 (0.0%) |
| $5,000 to $9,999 | 0 (0.0%) | 0 (0.0%) |
| $10,000 to $14,999 | 1 (0.6%) | 0 (0.0%) |
| $15,000 to $19,999 | 2 (1.3%) | 0 (0.0%) |
| $20,000 to $24,999 | 11 (6.9%) | 2 (6.5%) |
| $25,000 to $34,999 | 6 (3.8%) | 7 (22.6%) |
| $35,000 to $49,999 | 16 (10.1%) | 2 (6.5%) |
| $50,000 to $74,999 | 12 (7.5%) | 10 (32.3%) |
| $75,000 to $99,999 | 20 (12.6%) | 8 (25.8%) |
| $100,000 to $149,999 | 28 (17.6%) | 0 (0.0%) |
| $150,000 or more | 62 (39.0%) | 2 (6.5%) |
| Total | 159 (100.0%) | 31 (100.0%) |
Monthly Housing Cost Tiers in Wahpeton
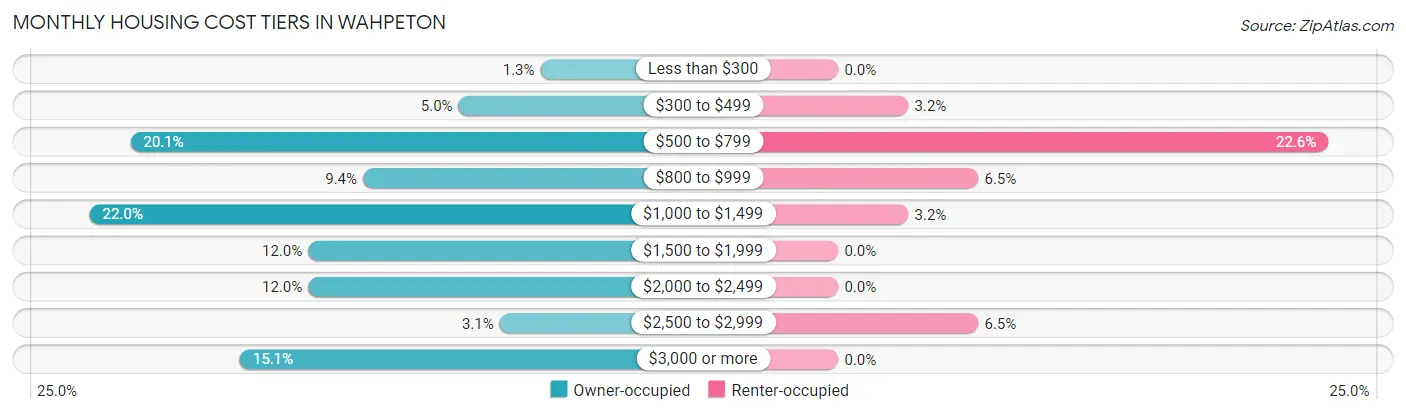
| Monthly Cost | Owner-occupied | Renter-occupied |
| Less than $300 | 2 (1.3%) | 0 (0.0%) |
| $300 to $499 | 8 (5.0%) | 1 (3.2%) |
| $500 to $799 | 32 (20.1%) | 7 (22.6%) |
| $800 to $999 | 15 (9.4%) | 2 (6.5%) |
| $1,000 to $1,499 | 35 (22.0%) | 1 (3.2%) |
| $1,500 to $1,999 | 19 (11.9%) | 0 (0.0%) |
| $2,000 to $2,499 | 19 (11.9%) | 0 (0.0%) |
| $2,500 to $2,999 | 5 (3.1%) | 2 (6.5%) |
| $3,000 or more | 24 (15.1%) | 0 (0.0%) |
| Total | 159 (100.0%) | 31 (100.0%) |
Physical Housing Characteristics in Wahpeton
Housing Structures in Wahpeton
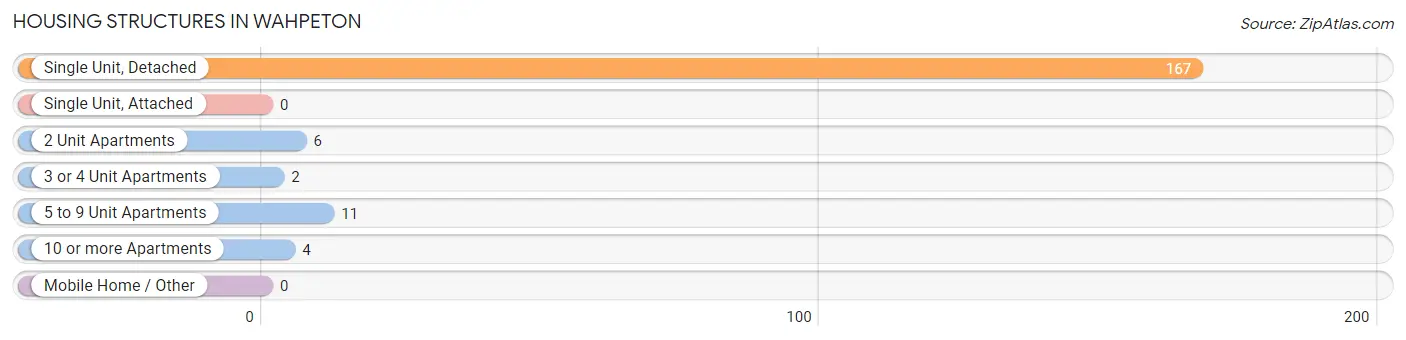
| Structure Type | # Housing Units | % Housing Units |
| Single Unit, Detached | 167 | 87.9% |
| Single Unit, Attached | 0 | 0.0% |
| 2 Unit Apartments | 6 | 3.2% |
| 3 or 4 Unit Apartments | 2 | 1.1% |
| 5 to 9 Unit Apartments | 11 | 5.8% |
| 10 or more Apartments | 4 | 2.1% |
| Mobile Home / Other | 0 | 0.0% |
| Total | 190 | 100.0% |
Housing Structures by Occupancy in Wahpeton
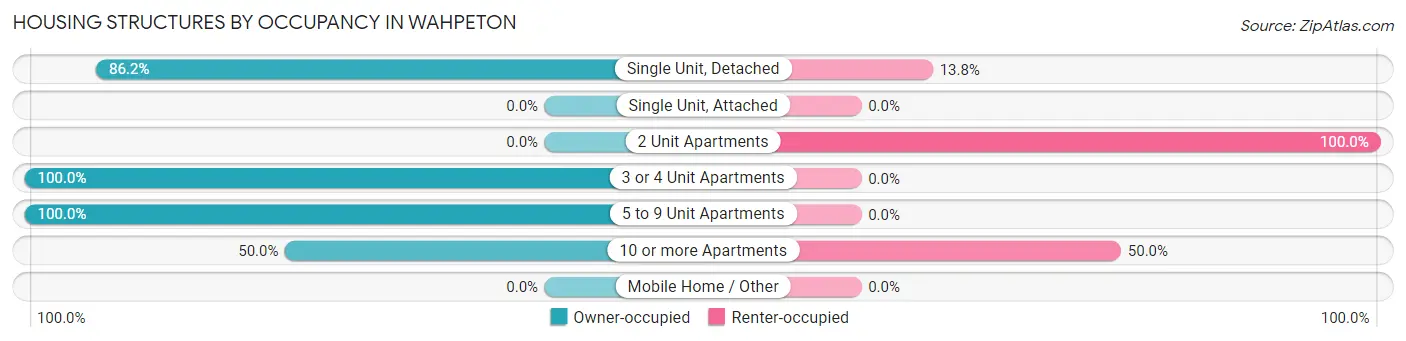
| Structure Type | Owner-occupied | Renter-occupied |
| Single Unit, Detached | 144 (86.2%) | 23 (13.8%) |
| Single Unit, Attached | 0 (0.0%) | 0 (0.0%) |
| 2 Unit Apartments | 0 (0.0%) | 6 (100.0%) |
| 3 or 4 Unit Apartments | 2 (100.0%) | 0 (0.0%) |
| 5 to 9 Unit Apartments | 11 (100.0%) | 0 (0.0%) |
| 10 or more Apartments | 2 (50.0%) | 2 (50.0%) |
| Mobile Home / Other | 0 (0.0%) | 0 (0.0%) |
| Total | 159 (83.7%) | 31 (16.3%) |
Housing Structures by Number of Rooms in Wahpeton
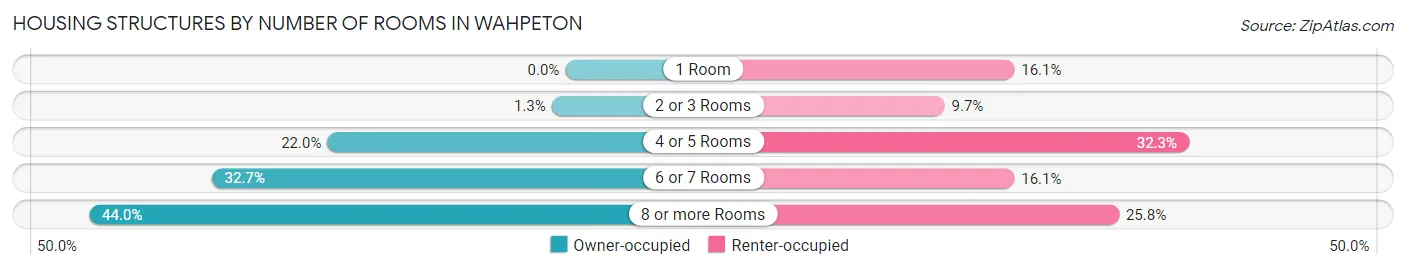
| Number of Rooms | Owner-occupied | Renter-occupied |
| 1 Room | 0 (0.0%) | 5 (16.1%) |
| 2 or 3 Rooms | 2 (1.3%) | 3 (9.7%) |
| 4 or 5 Rooms | 35 (22.0%) | 10 (32.3%) |
| 6 or 7 Rooms | 52 (32.7%) | 5 (16.1%) |
| 8 or more Rooms | 70 (44.0%) | 8 (25.8%) |
| Total | 159 (100.0%) | 31 (100.0%) |
Housing Structure by Heating Type in Wahpeton
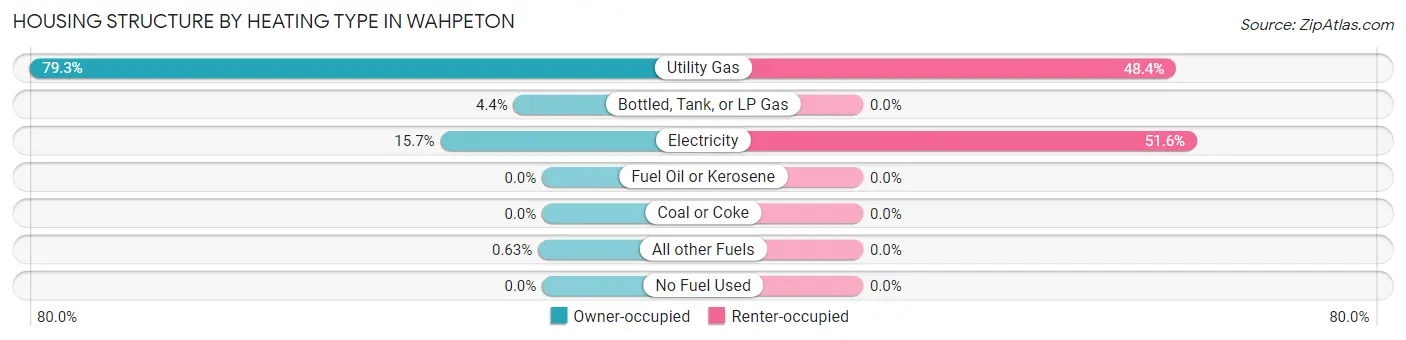
| Heating Type | Owner-occupied | Renter-occupied |
| Utility Gas | 126 (79.2%) | 15 (48.4%) |
| Bottled, Tank, or LP Gas | 7 (4.4%) | 0 (0.0%) |
| Electricity | 25 (15.7%) | 16 (51.6%) |
| Fuel Oil or Kerosene | 0 (0.0%) | 0 (0.0%) |
| Coal or Coke | 0 (0.0%) | 0 (0.0%) |
| All other Fuels | 1 (0.6%) | 0 (0.0%) |
| No Fuel Used | 0 (0.0%) | 0 (0.0%) |
| Total | 159 (100.0%) | 31 (100.0%) |
Household Vehicle Usage in Wahpeton
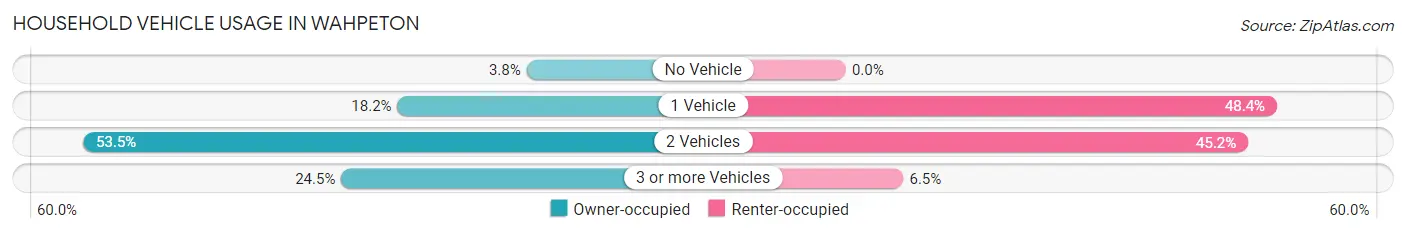
| Vehicles per Household | Owner-occupied | Renter-occupied |
| No Vehicle | 6 (3.8%) | 0 (0.0%) |
| 1 Vehicle | 29 (18.2%) | 15 (48.4%) |
| 2 Vehicles | 85 (53.5%) | 14 (45.2%) |
| 3 or more Vehicles | 39 (24.5%) | 2 (6.5%) |
| Total | 159 (100.0%) | 31 (100.0%) |
Real Estate & Mortgages in Wahpeton
Real Estate and Mortgage Overview in Wahpeton
| Characteristic | Without Mortgage | With Mortgage |
| Housing Units | 88 | 71 |
| Median Property Value | $400,000 | $385,000 |
| Median Household Income | $80,000 | $42 |
| Monthly Housing Costs | $827 | $22 |
| Real Estate Taxes | $3,762 | $0 |
Property Value by Mortgage Status in Wahpeton
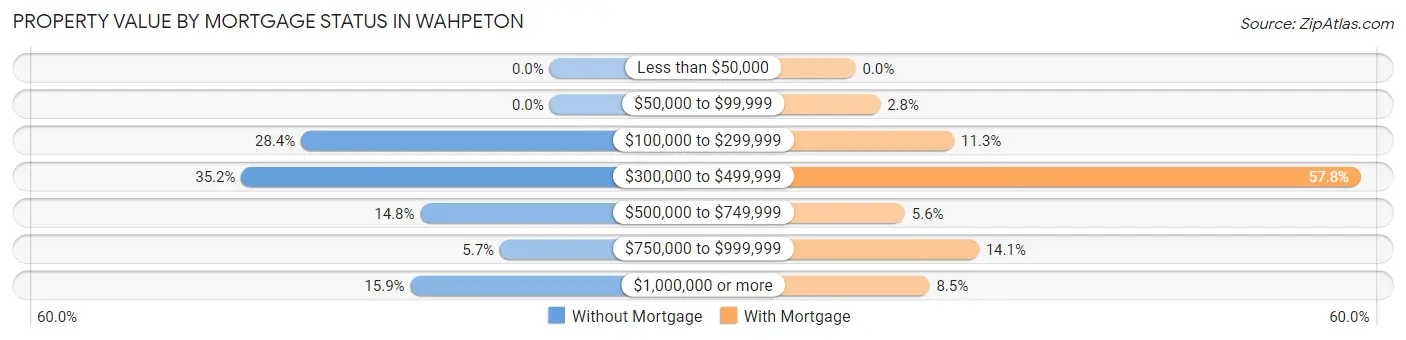
| Property Value | Without Mortgage | With Mortgage |
| Less than $50,000 | 0 (0.0%) | 0 (0.0%) |
| $50,000 to $99,999 | 0 (0.0%) | 2 (2.8%) |
| $100,000 to $299,999 | 25 (28.4%) | 8 (11.3%) |
| $300,000 to $499,999 | 31 (35.2%) | 41 (57.8%) |
| $500,000 to $749,999 | 13 (14.8%) | 4 (5.6%) |
| $750,000 to $999,999 | 5 (5.7%) | 10 (14.1%) |
| $1,000,000 or more | 14 (15.9%) | 6 (8.5%) |
| Total | 88 (100.0%) | 71 (100.0%) |
Household Income by Mortgage Status in Wahpeton
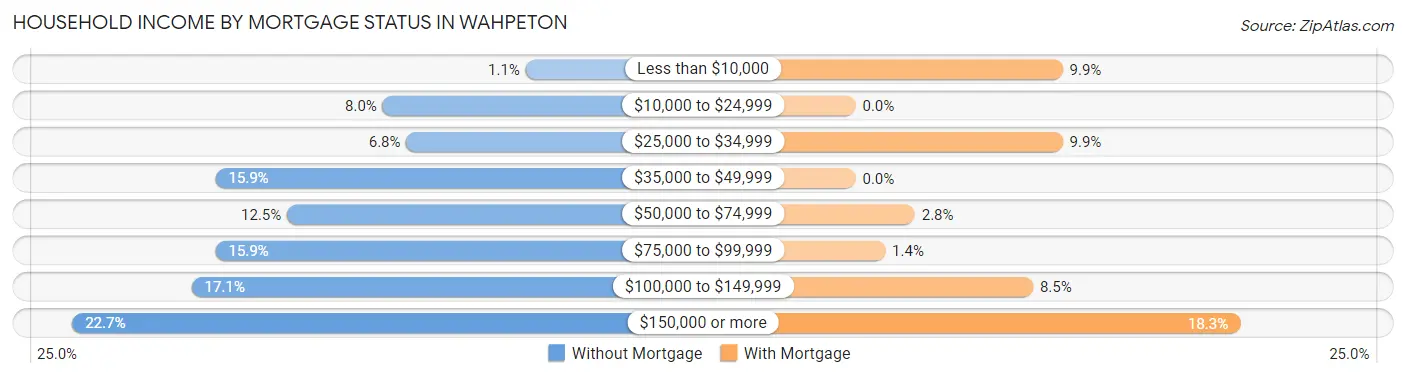
| Household Income | Without Mortgage | With Mortgage |
| Less than $10,000 | 1 (1.1%) | 7 (9.9%) |
| $10,000 to $24,999 | 7 (8.0%) | 0 (0.0%) |
| $25,000 to $34,999 | 6 (6.8%) | 7 (9.9%) |
| $35,000 to $49,999 | 14 (15.9%) | 0 (0.0%) |
| $50,000 to $74,999 | 11 (12.5%) | 2 (2.8%) |
| $75,000 to $99,999 | 14 (15.9%) | 1 (1.4%) |
| $100,000 to $149,999 | 15 (17.1%) | 6 (8.5%) |
| $150,000 or more | 20 (22.7%) | 13 (18.3%) |
| Total | 88 (100.0%) | 71 (100.0%) |
Property Value to Household Income Ratio in Wahpeton
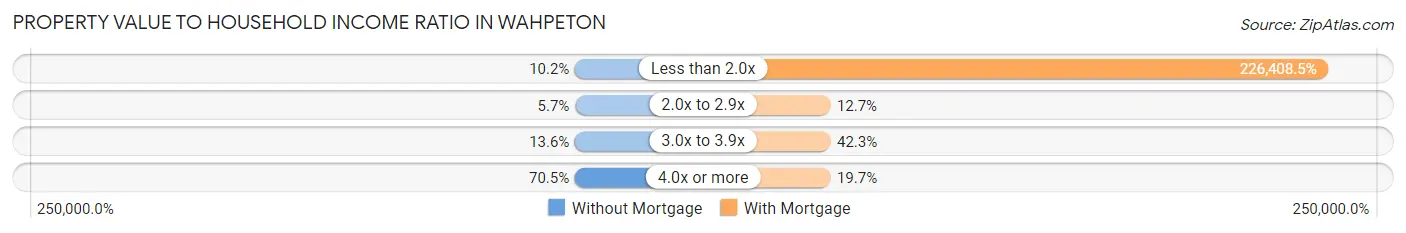
| Value-to-Income Ratio | Without Mortgage | With Mortgage |
| Less than 2.0x | 9 (10.2%) | 160,750 (226,408.4%) |
| 2.0x to 2.9x | 5 (5.7%) | 9 (12.7%) |
| 3.0x to 3.9x | 12 (13.6%) | 30 (42.2%) |
| 4.0x or more | 62 (70.5%) | 14 (19.7%) |
| Total | 88 (100.0%) | 71 (100.0%) |
Real Estate Taxes by Mortgage Status in Wahpeton
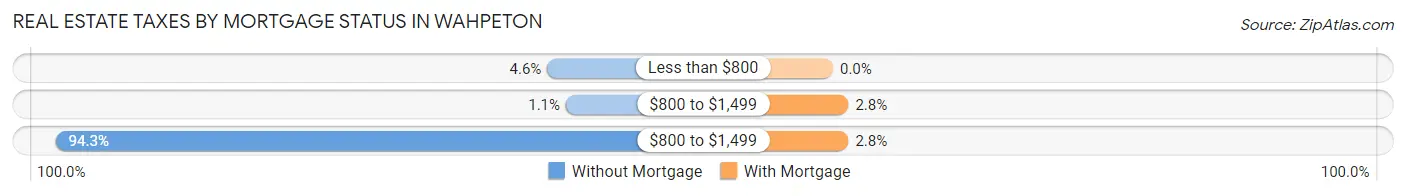
| Property Taxes | Without Mortgage | With Mortgage |
| Less than $800 | 4 (4.5%) | 0 (0.0%) |
| $800 to $1,499 | 1 (1.1%) | 2 (2.8%) |
| $800 to $1,499 | 83 (94.3%) | 2 (2.8%) |
| Total | 88 (100.0%) | 71 (100.0%) |
Health & Disability in Wahpeton
Health Insurance Coverage by Age in Wahpeton
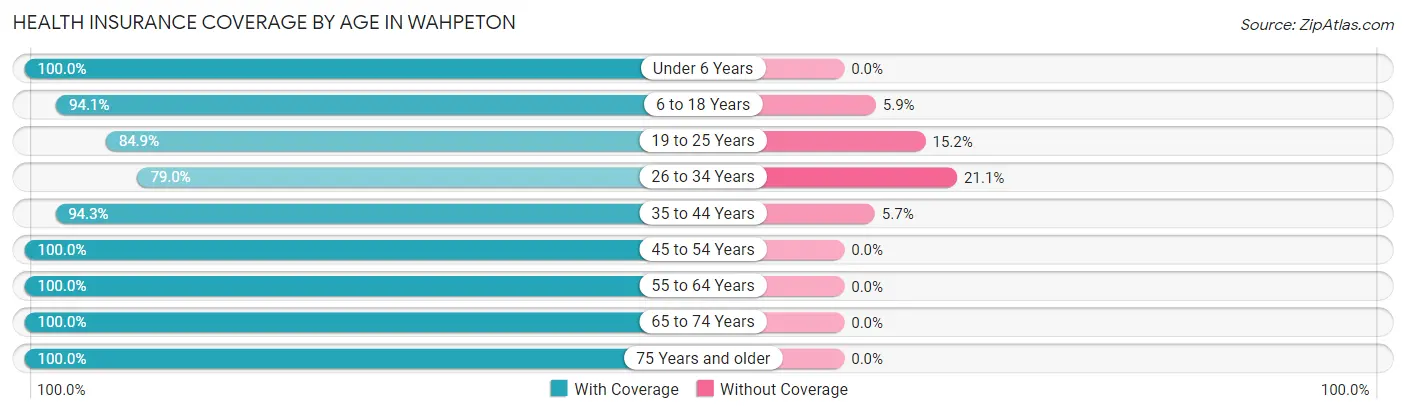
| Age Bracket | With Coverage | Without Coverage |
| Under 6 Years | 16 (100.0%) | 0 (0.0%) |
| 6 to 18 Years | 48 (94.1%) | 3 (5.9%) |
| 19 to 25 Years | 28 (84.9%) | 5 (15.1%) |
| 26 to 34 Years | 15 (78.9%) | 4 (21.0%) |
| 35 to 44 Years | 33 (94.3%) | 2 (5.7%) |
| 45 to 54 Years | 25 (100.0%) | 0 (0.0%) |
| 55 to 64 Years | 60 (100.0%) | 0 (0.0%) |
| 65 to 74 Years | 89 (100.0%) | 0 (0.0%) |
| 75 Years and older | 75 (100.0%) | 0 (0.0%) |
| Total | 389 (96.5%) | 14 (3.5%) |
Health Insurance Coverage by Citizenship Status in Wahpeton
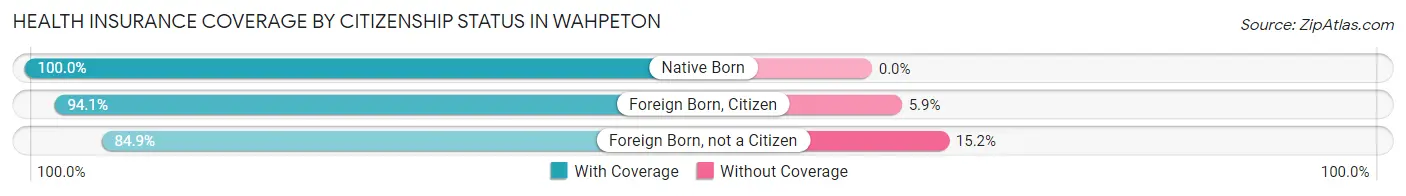
| Citizenship Status | With Coverage | Without Coverage |
| Native Born | 16 (100.0%) | 0 (0.0%) |
| Foreign Born, Citizen | 48 (94.1%) | 3 (5.9%) |
| Foreign Born, not a Citizen | 28 (84.9%) | 5 (15.1%) |
Health Insurance Coverage by Household Income in Wahpeton
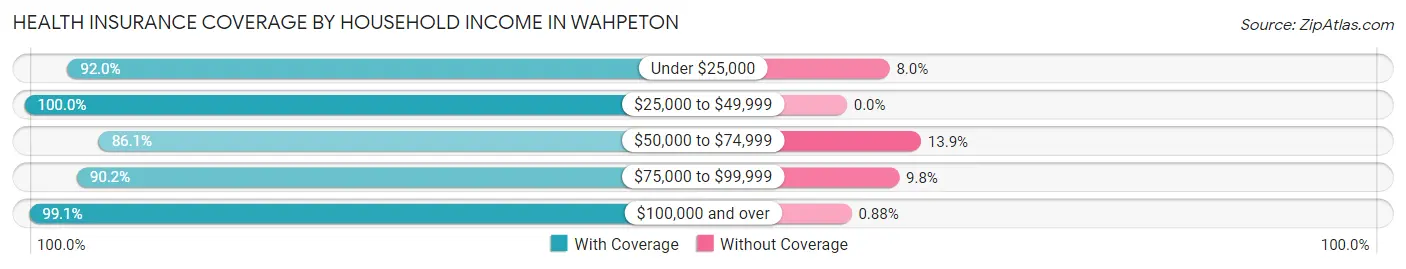
| Household Income | With Coverage | Without Coverage |
| Under $25,000 | 23 (92.0%) | 2 (8.0%) |
| $25,000 to $49,999 | 64 (100.0%) | 0 (0.0%) |
| $50,000 to $74,999 | 31 (86.1%) | 5 (13.9%) |
| $75,000 to $99,999 | 46 (90.2%) | 5 (9.8%) |
| $100,000 and over | 225 (99.1%) | 2 (0.9%) |
Public vs Private Health Insurance Coverage by Age in Wahpeton
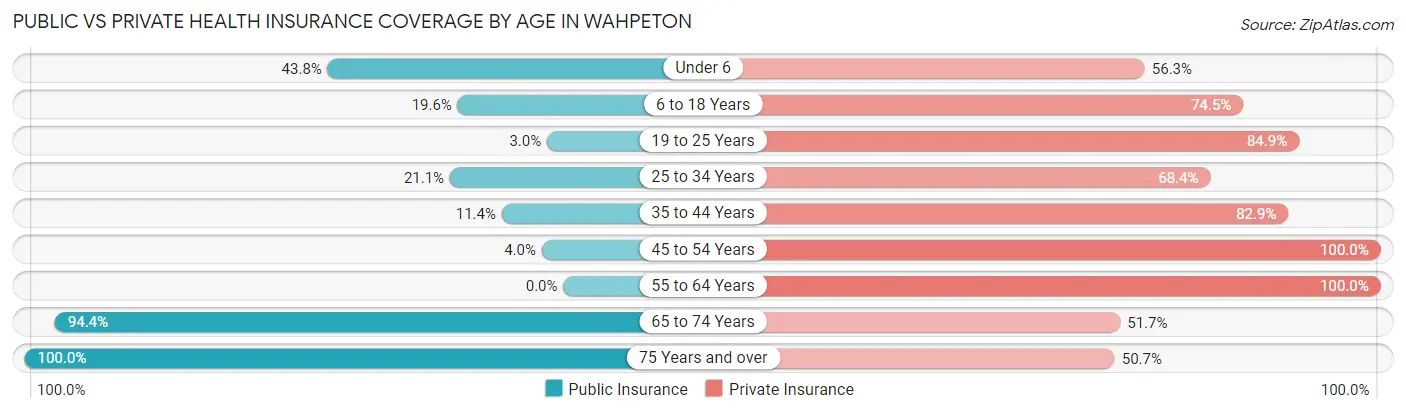
| Age Bracket | Public Insurance | Private Insurance |
| Under 6 | 7 (43.8%) | 9 (56.2%) |
| 6 to 18 Years | 10 (19.6%) | 38 (74.5%) |
| 19 to 25 Years | 1 (3.0%) | 28 (84.9%) |
| 25 to 34 Years | 4 (21.0%) | 13 (68.4%) |
| 35 to 44 Years | 4 (11.4%) | 29 (82.9%) |
| 45 to 54 Years | 1 (4.0%) | 25 (100.0%) |
| 55 to 64 Years | 0 (0.0%) | 60 (100.0%) |
| 65 to 74 Years | 84 (94.4%) | 46 (51.7%) |
| 75 Years and over | 75 (100.0%) | 38 (50.7%) |
| Total | 186 (46.2%) | 286 (71.0%) |
Disability Status by Sex by Age in Wahpeton
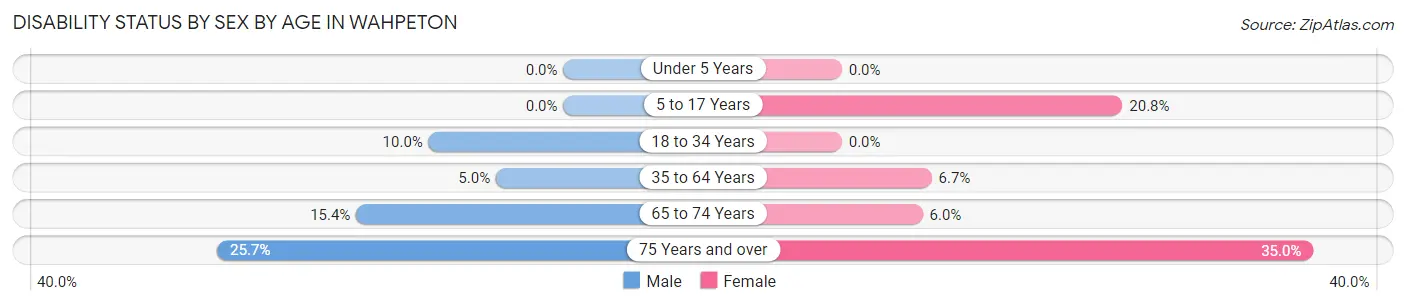
| Age Bracket | Male | Female |
| Under 5 Years | 0 (0.0%) | 0 (0.0%) |
| 5 to 17 Years | 0 (0.0%) | 5 (20.8%) |
| 18 to 34 Years | 4 (10.0%) | 0 (0.0%) |
| 35 to 64 Years | 3 (5.0%) | 4 (6.7%) |
| 65 to 74 Years | 6 (15.4%) | 3 (6.0%) |
| 75 Years and over | 9 (25.7%) | 14 (35.0%) |
Disability Class by Sex by Age in Wahpeton
Disability Class: Hearing Difficulty
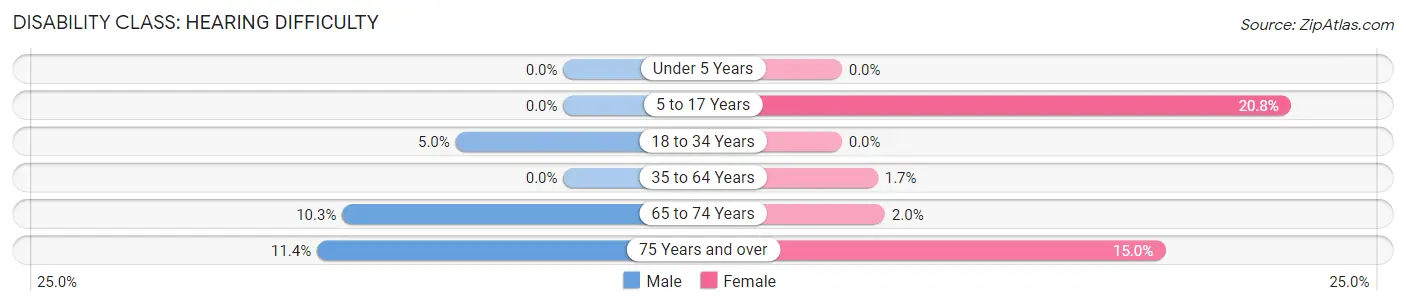
| Age Bracket | Male | Female |
| Under 5 Years | 0 (0.0%) | 0 (0.0%) |
| 5 to 17 Years | 0 (0.0%) | 5 (20.8%) |
| 18 to 34 Years | 2 (5.0%) | 0 (0.0%) |
| 35 to 64 Years | 0 (0.0%) | 1 (1.7%) |
| 65 to 74 Years | 4 (10.3%) | 1 (2.0%) |
| 75 Years and over | 4 (11.4%) | 6 (15.0%) |
Disability Class: Vision Difficulty
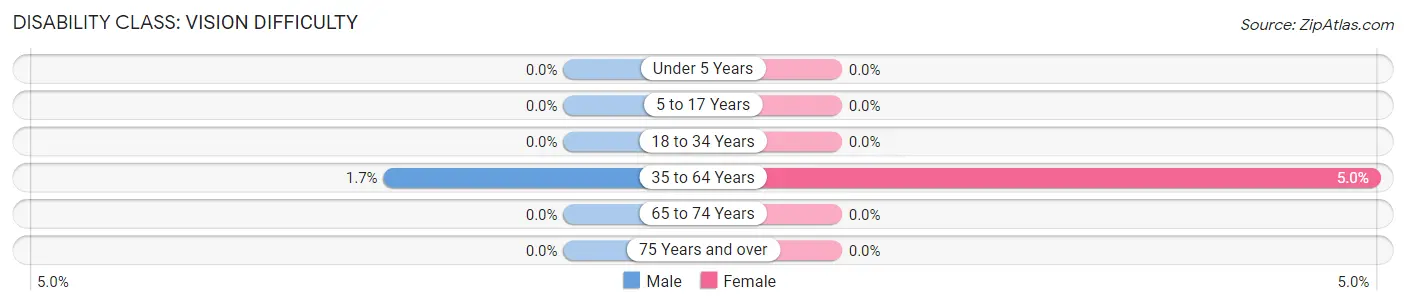
| Age Bracket | Male | Female |
| Under 5 Years | 0 (0.0%) | 0 (0.0%) |
| 5 to 17 Years | 0 (0.0%) | 0 (0.0%) |
| 18 to 34 Years | 0 (0.0%) | 0 (0.0%) |
| 35 to 64 Years | 1 (1.7%) | 3 (5.0%) |
| 65 to 74 Years | 0 (0.0%) | 0 (0.0%) |
| 75 Years and over | 0 (0.0%) | 0 (0.0%) |
Disability Class: Cognitive Difficulty
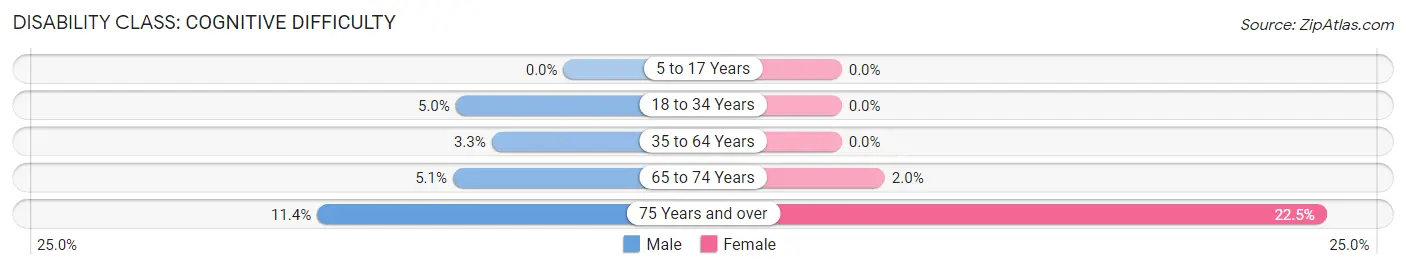
| Age Bracket | Male | Female |
| 5 to 17 Years | 0 (0.0%) | 0 (0.0%) |
| 18 to 34 Years | 2 (5.0%) | 0 (0.0%) |
| 35 to 64 Years | 2 (3.3%) | 0 (0.0%) |
| 65 to 74 Years | 2 (5.1%) | 1 (2.0%) |
| 75 Years and over | 4 (11.4%) | 9 (22.5%) |
Disability Class: Ambulatory Difficulty
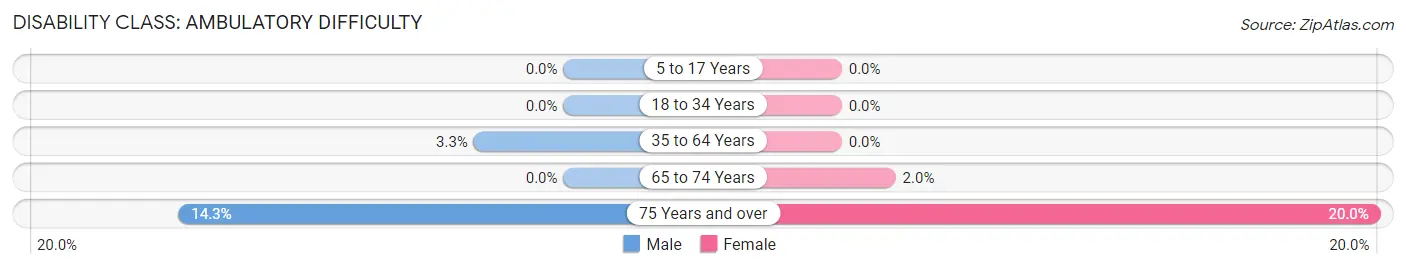
| Age Bracket | Male | Female |
| 5 to 17 Years | 0 (0.0%) | 0 (0.0%) |
| 18 to 34 Years | 0 (0.0%) | 0 (0.0%) |
| 35 to 64 Years | 2 (3.3%) | 0 (0.0%) |
| 65 to 74 Years | 0 (0.0%) | 1 (2.0%) |
| 75 Years and over | 5 (14.3%) | 8 (20.0%) |
Disability Class: Self-Care Difficulty
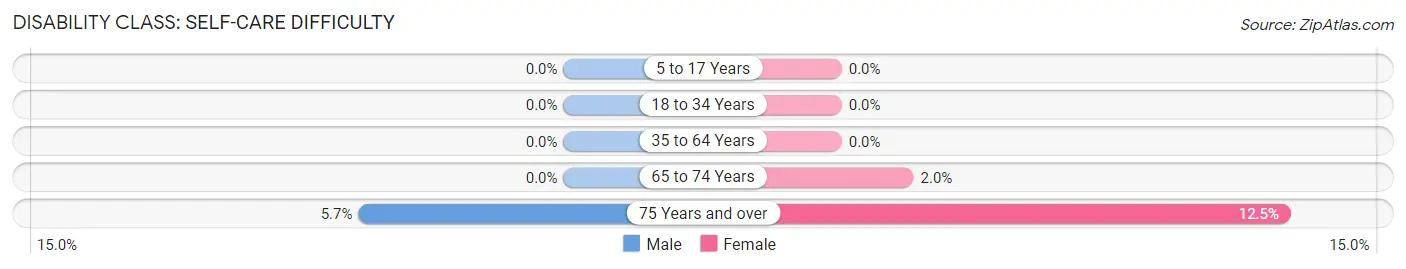
| Age Bracket | Male | Female |
| 5 to 17 Years | 0 (0.0%) | 0 (0.0%) |
| 18 to 34 Years | 0 (0.0%) | 0 (0.0%) |
| 35 to 64 Years | 0 (0.0%) | 0 (0.0%) |
| 65 to 74 Years | 0 (0.0%) | 1 (2.0%) |
| 75 Years and over | 2 (5.7%) | 5 (12.5%) |
Technology Access in Wahpeton
Computing Device Access in Wahpeton
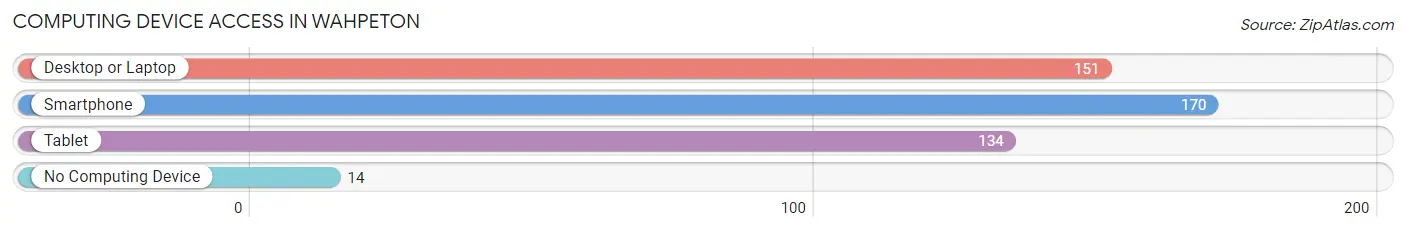
| Device Type | # Households | % Households |
| Desktop or Laptop | 151 | 79.5% |
| Smartphone | 170 | 89.5% |
| Tablet | 134 | 70.5% |
| No Computing Device | 14 | 7.4% |
| Total | 190 | 100.0% |
Internet Access in Wahpeton
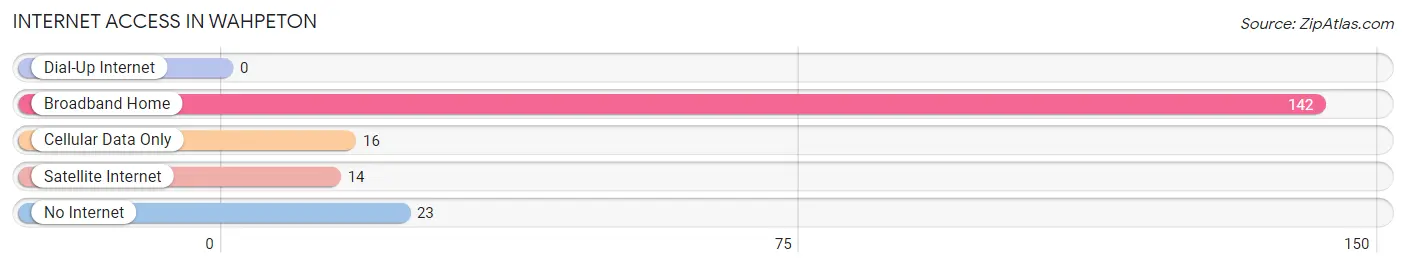
| Internet Type | # Households | % Households |
| Dial-Up Internet | 0 | 0.0% |
| Broadband Home | 142 | 74.7% |
| Cellular Data Only | 16 | 8.4% |
| Satellite Internet | 14 | 7.4% |
| No Internet | 23 | 12.1% |
| Total | 190 | 100.0% |
Wahpeton Summary
Wahpeton is a city located in the state of Iowa, in the United States of America. It is the county seat of Bremer County and is located on the banks of the Cedar River. The city has a population of approximately 2,500 people and is part of the Waterloo-Cedar Falls Metropolitan Statistical Area.
History
The area that is now Wahpeton was first settled in 1845 by a group of settlers from New York. The settlement was originally known as Cedar Rapids, but was later renamed Wahpeton in 1856. The name Wahpeton is derived from the Sioux language and means “place of the red willows”.
The city was officially incorporated in 1858 and was designated as the county seat of Bremer County in 1859. During the Civil War, the city was a major supply center for Union troops. After the war, the city experienced a period of growth and development, with the construction of a railroad line in 1872 and the establishment of a flour mill in 1873.
In the late 19th century, the city became a major center for the lumber industry, with several sawmills and lumber yards located in the area. The city also became a major center for the production of brick and tile, with several brickyards and tile factories located in the area.
Geography
Wahpeton is located in the northeast corner of Iowa, in Bremer County. The city is situated on the banks of the Cedar River, which flows through the city from north to south. The city is located approximately 25 miles east of Waterloo and 40 miles west of Cedar Rapids.
The city has a total area of 2.3 square miles, all of which is land. The city is located at an elevation of 845 feet above sea level.
Economy
The economy of Wahpeton is largely based on agriculture and manufacturing. The city is home to several large agricultural operations, including a large hog farm and several grain elevators. The city is also home to several manufacturing companies, including a tile factory, a brickyard, and a lumber mill.
The city is also home to several retail stores, restaurants, and other businesses. The city is served by the Cedar Valley Regional Airport, which is located just outside of town.
Demographics
As of the 2010 census, the population of Wahpeton was 2,500. The racial makeup of the city was 97.2% White, 0.8% African American, 0.4% Native American, 0.2% Asian, 0.2% from other races, and 1.2% from two or more races. Hispanic or Latino of any race were 1.2% of the population.
The median income for a household in the city was $41,250, and the median income for a family was $50,000. The per capita income for the city was $20,845. About 8.2% of families and 10.2% of the population were below the poverty line, including 14.2% of those under age 18 and 8.2% of those age 65 or over.
Common Questions
What is Per Capita Income in Wahpeton?
Per Capita income in Wahpeton is $60,617.
What is the Median Family Income in Wahpeton?
Median Family Income in Wahpeton is $140,139.
What is the Median Household income in Wahpeton?
Median Household Income in Wahpeton is $93,750.
What is Income or Wage Gap in Wahpeton?
Income or Wage Gap in Wahpeton is 31.2%.
Women in Wahpeton earn 68.8 cents for every dollar earned by a man.
What is Inequality or Gini Index in Wahpeton?
Inequality or Gini Index in Wahpeton is 0.42.
What is the Total Population of Wahpeton?
Total Population of Wahpeton is 403.
What is the Total Male Population of Wahpeton?
Total Male Population of Wahpeton is 214.
What is the Total Female Population of Wahpeton?
Total Female Population of Wahpeton is 189.
What is the Ratio of Males per 100 Females in Wahpeton?
There are 113.23 Males per 100 Females in Wahpeton.
What is the Ratio of Females per 100 Males in Wahpeton?
There are 88.32 Females per 100 Males in Wahpeton.
What is the Median Population Age in Wahpeton?
Median Population Age in Wahpeton is 60.0 Years.
What is the Average Family Size in Wahpeton
Average Family Size in Wahpeton is 2.4 People.
What is the Average Household Size in Wahpeton
Average Household Size in Wahpeton is 2.1 People.
How Large is the Labor Force in Wahpeton?
There are 174 People in the Labor Forcein in Wahpeton.
What is the Percentage of People in the Labor Force in Wahpeton?
51.6% of People are in the Labor Force in Wahpeton.