West Okoboji, IA Map & Demographics
West Okoboji Map
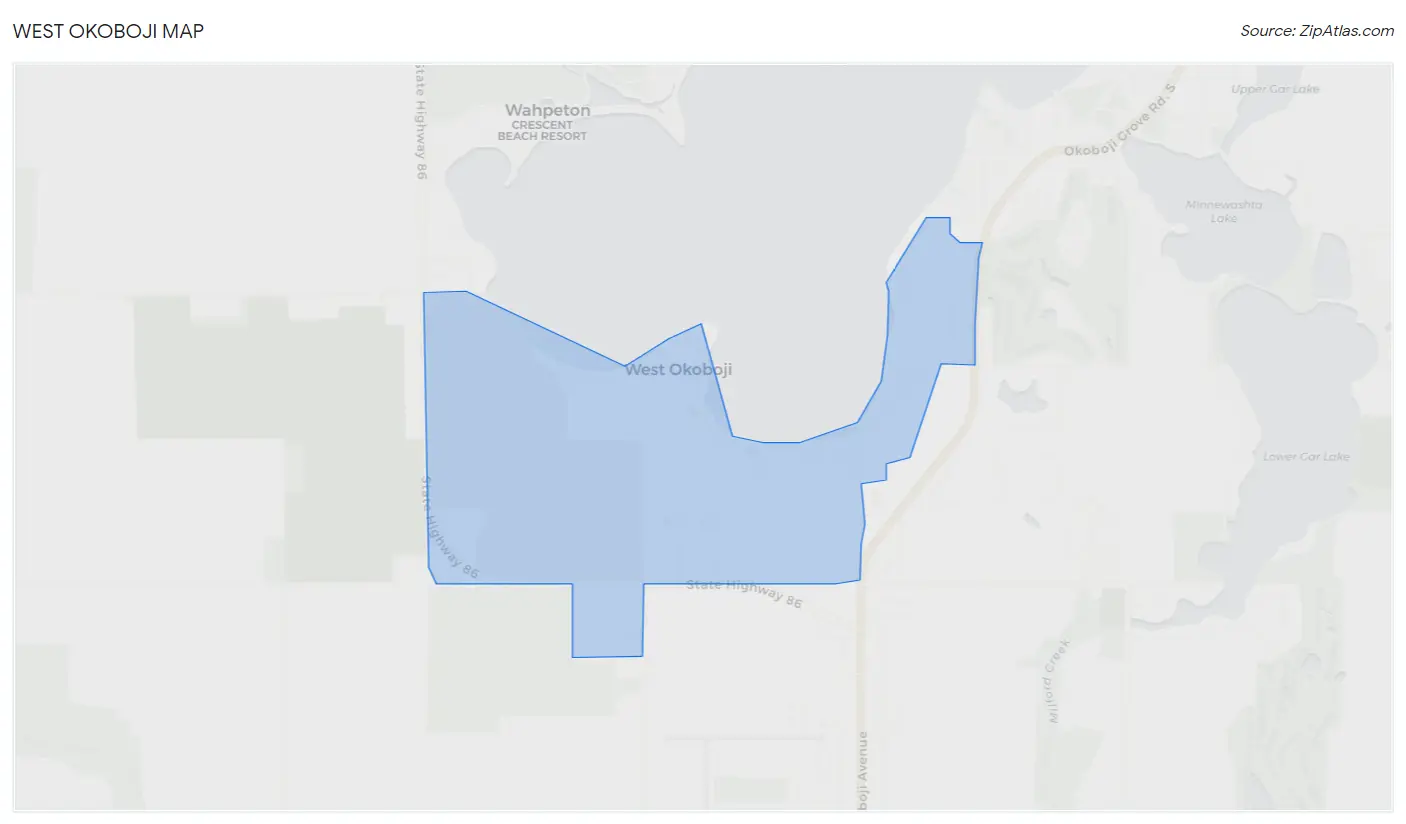
West Okoboji Overview
$67,404
PER CAPITA INCOME
$86,250
AVG FAMILY INCOME
$68,333
AVG HOUSEHOLD INCOME
0.53
INEQUALITY / GINI INDEX
357
TOTAL POPULATION
155
MALE POPULATION
202
FEMALE POPULATION
76.73
MALES / 100 FEMALES
130.32
FEMALES / 100 MALES
63.3
MEDIAN AGE
2.2
AVG FAMILY SIZE
1.9
AVG HOUSEHOLD SIZE
143
LABOR FORCE [ PEOPLE ]
45.3%
PERCENT IN LABOR FORCE
1.4%
UNEMPLOYMENT RATE
Income in West Okoboji
Income Overview in West Okoboji
Per Capita Income in West Okoboji is $67,404, while median incomes of families and households are $86,250 and $68,333 respectively.
| Characteristic | Number | Measure |
| Per Capita Income | 357 | $67,404 |
| Median Family Income | 130 | $86,250 |
| Mean Family Income | 130 | $163,676 |
| Median Household Income | 184 | $68,333 |
| Mean Household Income | 184 | $137,688 |
| Income Deficit | 130 | $0 |
| Wage / Income Gap (%) | 357 | 0.00% |
| Wage / Income Gap ($) | 357 | 100.00¢ per $1 |
| Gini / Inequality Index | 357 | 0.53 |
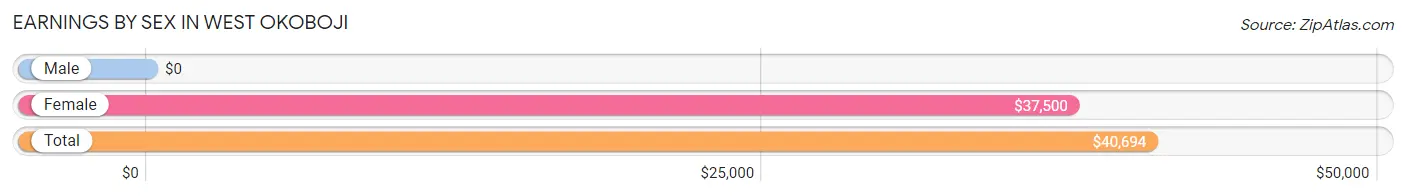
Earnings by Sex in West Okoboji
| Sex | Number | Average Earnings |
| Male | 89 (56.7%) | $0 |
| Female | 68 (43.3%) | $37,500 |
| Total | 157 (100.0%) | $40,694 |
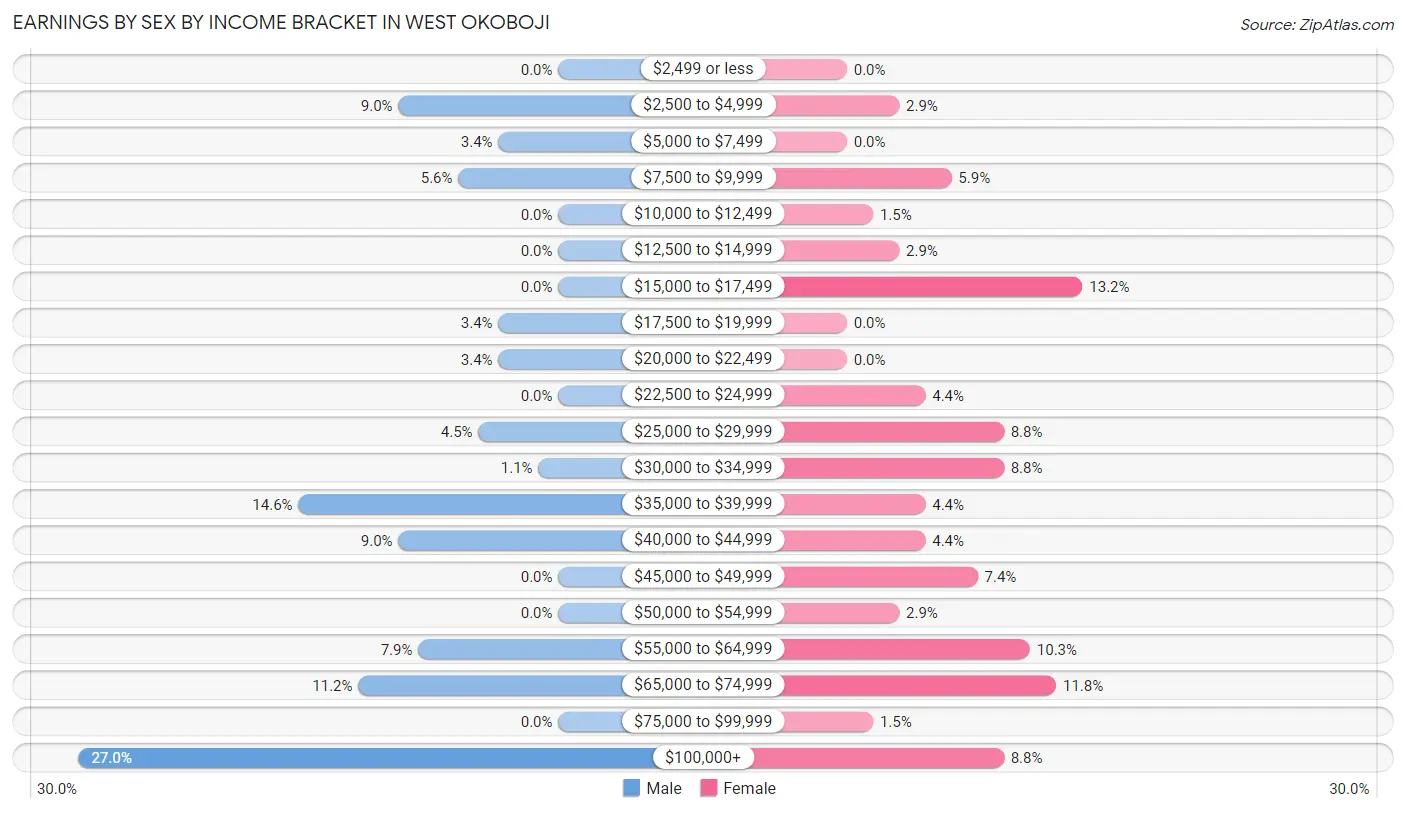
Earnings by Sex by Income Bracket in West Okoboji
The most common earnings brackets in West Okoboji are $100,000+ for men (24 | 27.0%) and $15,000 to $17,499 for women (9 | 13.2%).
| Income | Male | Female |
| $2,499 or less | 0 (0.0%) | 0 (0.0%) |
| $2,500 to $4,999 | 8 (9.0%) | 2 (2.9%) |
| $5,000 to $7,499 | 3 (3.4%) | 0 (0.0%) |
| $7,500 to $9,999 | 5 (5.6%) | 4 (5.9%) |
| $10,000 to $12,499 | 0 (0.0%) | 1 (1.5%) |
| $12,500 to $14,999 | 0 (0.0%) | 2 (2.9%) |
| $15,000 to $17,499 | 0 (0.0%) | 9 (13.2%) |
| $17,500 to $19,999 | 3 (3.4%) | 0 (0.0%) |
| $20,000 to $22,499 | 3 (3.4%) | 0 (0.0%) |
| $22,500 to $24,999 | 0 (0.0%) | 3 (4.4%) |
| $25,000 to $29,999 | 4 (4.5%) | 6 (8.8%) |
| $30,000 to $34,999 | 1 (1.1%) | 6 (8.8%) |
| $35,000 to $39,999 | 13 (14.6%) | 3 (4.4%) |
| $40,000 to $44,999 | 8 (9.0%) | 3 (4.4%) |
| $45,000 to $49,999 | 0 (0.0%) | 5 (7.3%) |
| $50,000 to $54,999 | 0 (0.0%) | 2 (2.9%) |
| $55,000 to $64,999 | 7 (7.9%) | 7 (10.3%) |
| $65,000 to $74,999 | 10 (11.2%) | 8 (11.8%) |
| $75,000 to $99,999 | 0 (0.0%) | 1 (1.5%) |
| $100,000+ | 24 (27.0%) | 6 (8.8%) |
| Total | 89 (100.0%) | 68 (100.0%) |
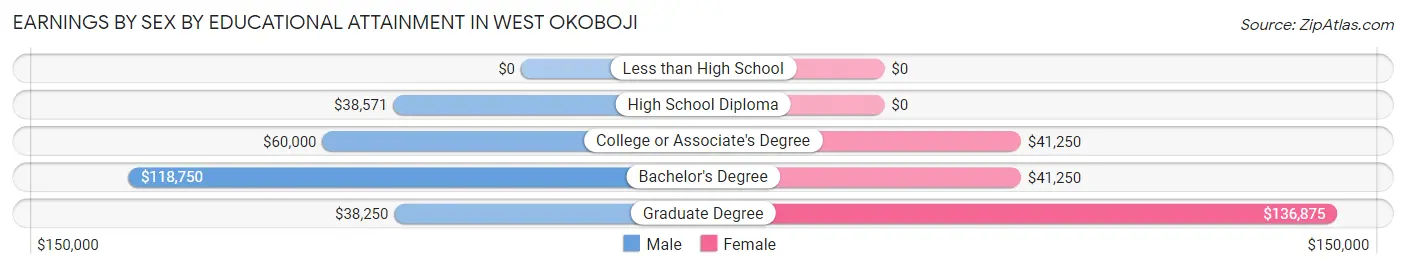
Earnings by Sex by Educational Attainment in West Okoboji
| Educational Attainment | Male Income | Female Income |
| Less than High School | - | - |
| High School Diploma | $38,571 | $0 |
| College or Associate's Degree | $60,000 | $41,250 |
| Bachelor's Degree | $118,750 | $41,250 |
| Graduate Degree | $38,250 | $136,875 |
| Total | - | - |
Family Income in West Okoboji
Family Income Brackets in West Okoboji
According to the West Okoboji family income data, there are 38 families falling into the $50,000 to $74,999 income range, which is the most common income bracket and makes up 29.2% of all families.
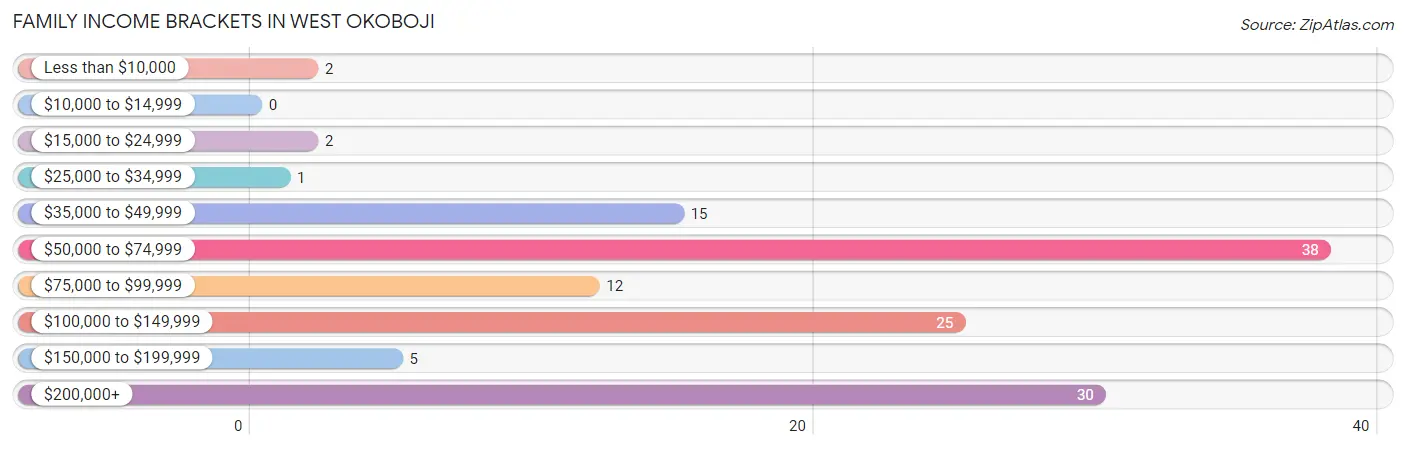
| Income Bracket | # Families | % Families |
| Less than $10,000 | 2 | 1.5% |
| $10,000 to $14,999 | 0 | 0.0% |
| $15,000 to $24,999 | 2 | 1.5% |
| $25,000 to $34,999 | 1 | 0.8% |
| $35,000 to $49,999 | 15 | 11.5% |
| $50,000 to $74,999 | 38 | 29.2% |
| $75,000 to $99,999 | 12 | 9.2% |
| $100,000 to $149,999 | 25 | 19.2% |
| $150,000 to $199,999 | 5 | 3.8% |
| $200,000+ | 30 | 23.1% |
Family Income by Famaliy Size in West Okoboji
4-person families (8 | 6.1%) account for the highest median family income in West Okoboji with $138,750 per family, while 2-person families (100 | 76.9%) have the highest median income of $42,812 per family member.
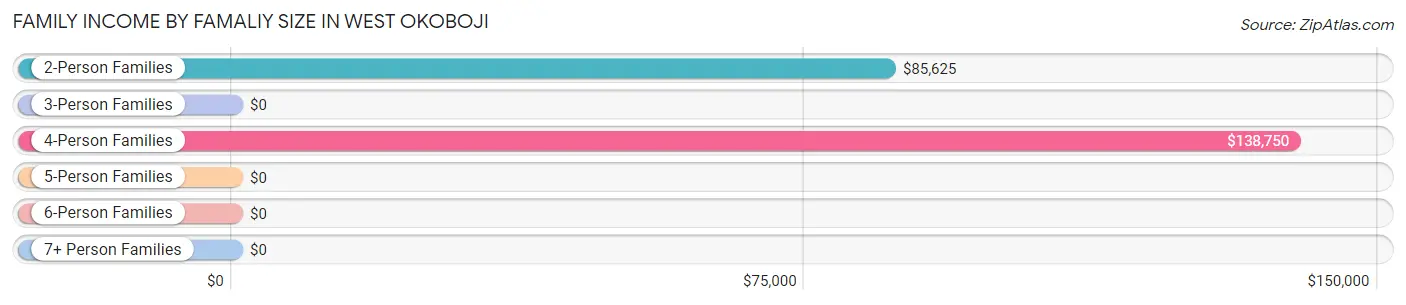
| Income Bracket | # Families | Median Income |
| 2-Person Families | 100 (76.9%) | $85,625 |
| 3-Person Families | 19 (14.6%) | $0 |
| 4-Person Families | 8 (6.1%) | $138,750 |
| 5-Person Families | 2 (1.5%) | $0 |
| 6-Person Families | 1 (0.8%) | $0 |
| 7+ Person Families | 0 (0.0%) | $0 |
| Total | 130 (100.0%) | $86,250 |
Family Income by Number of Earners in West Okoboji
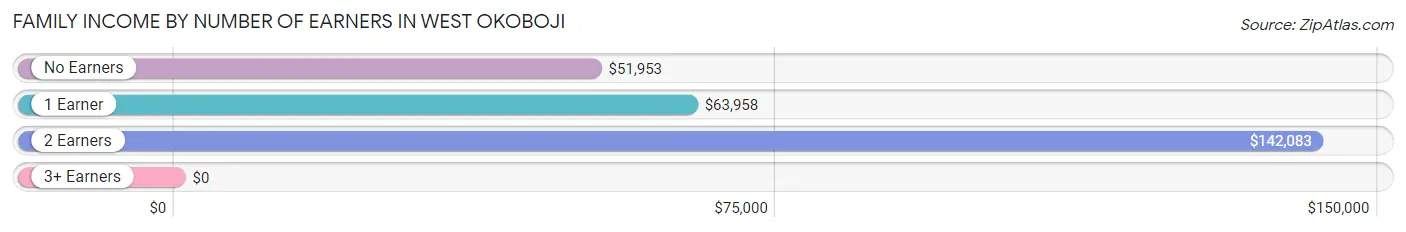
| Number of Earners | # Families | Median Income |
| No Earners | 43 (33.1%) | $51,953 |
| 1 Earner | 45 (34.6%) | $63,958 |
| 2 Earners | 39 (30.0%) | $142,083 |
| 3+ Earners | 3 (2.3%) | $0 |
| Total | 130 (100.0%) | $86,250 |
Household Income in West Okoboji
Household Income Brackets in West Okoboji
With 53 households falling in the category, the $50,000 to $74,999 income range is the most frequent in West Okoboji, accounting for 28.8% of all households. In contrast, only 2 households (1.1%) fall into the $10,000 to $14,999 income bracket, making it the least populous group.
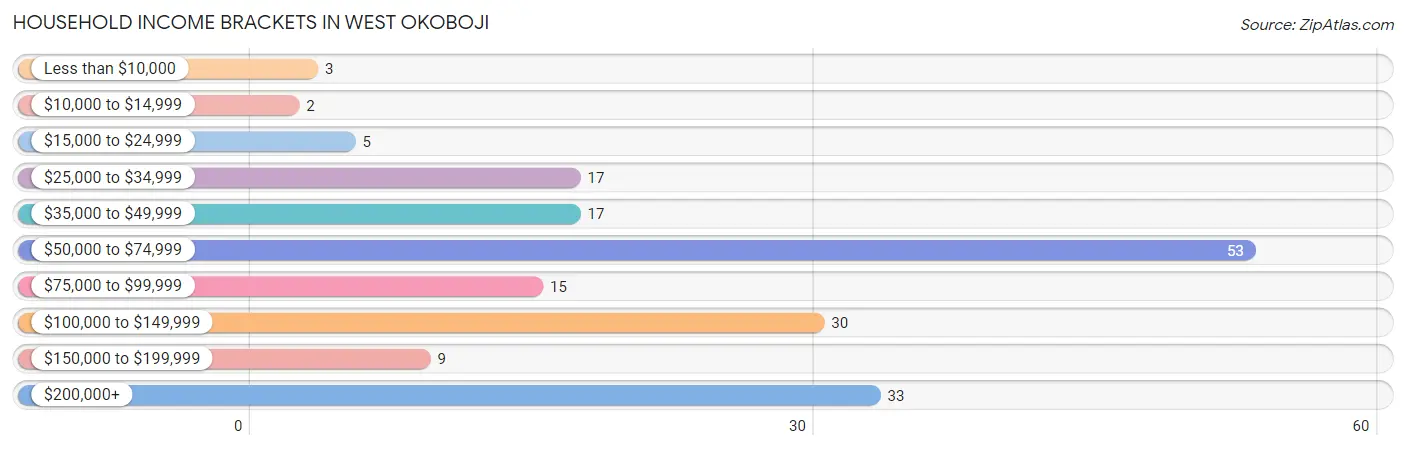
| Income Bracket | # Households | % Households |
| Less than $10,000 | 3 | 1.6% |
| $10,000 to $14,999 | 2 | 1.1% |
| $15,000 to $24,999 | 5 | 2.7% |
| $25,000 to $34,999 | 17 | 9.2% |
| $35,000 to $49,999 | 17 | 9.2% |
| $50,000 to $74,999 | 53 | 28.8% |
| $75,000 to $99,999 | 15 | 8.2% |
| $100,000 to $149,999 | 30 | 16.3% |
| $150,000 to $199,999 | 9 | 4.9% |
| $200,000+ | 33 | 17.9% |
Household Income by Householder Age in West Okoboji
The median household income in West Okoboji is $68,333, with the highest median household income of $76,250 found in the 65+ years age bracket for the primary householder. A total of 94 households (51.1%) fall into this category.
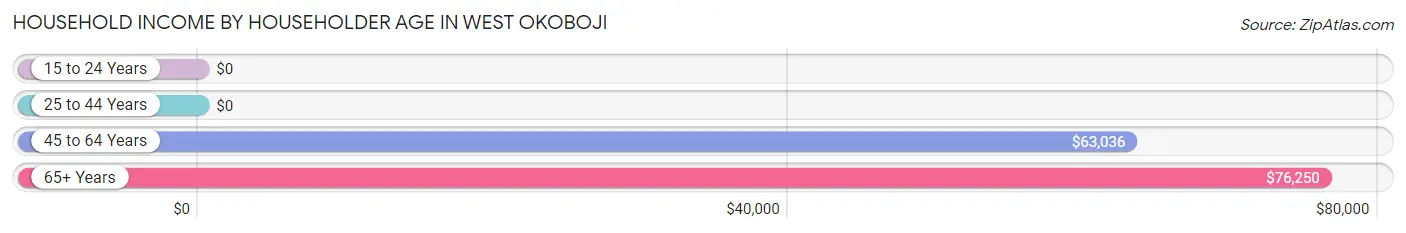
| Income Bracket | # Households | Median Income |
| 15 to 24 Years | 0 (0.0%) | $0 |
| 25 to 44 Years | 25 (13.6%) | $0 |
| 45 to 64 Years | 65 (35.3%) | $63,036 |
| 65+ Years | 94 (51.1%) | $76,250 |
| Total | 184 (100.0%) | $68,333 |
Poverty in West Okoboji
Income Below Poverty by Sex and Age in West Okoboji
With 1.3% poverty level for males and 5.0% for females among the residents of West Okoboji, 16 and 17 year old males and 55 to 64 year old females are the most vulnerable to poverty, with 1 males (100.0%) and 6 females (10.9%) in their respective age groups living below the poverty level.
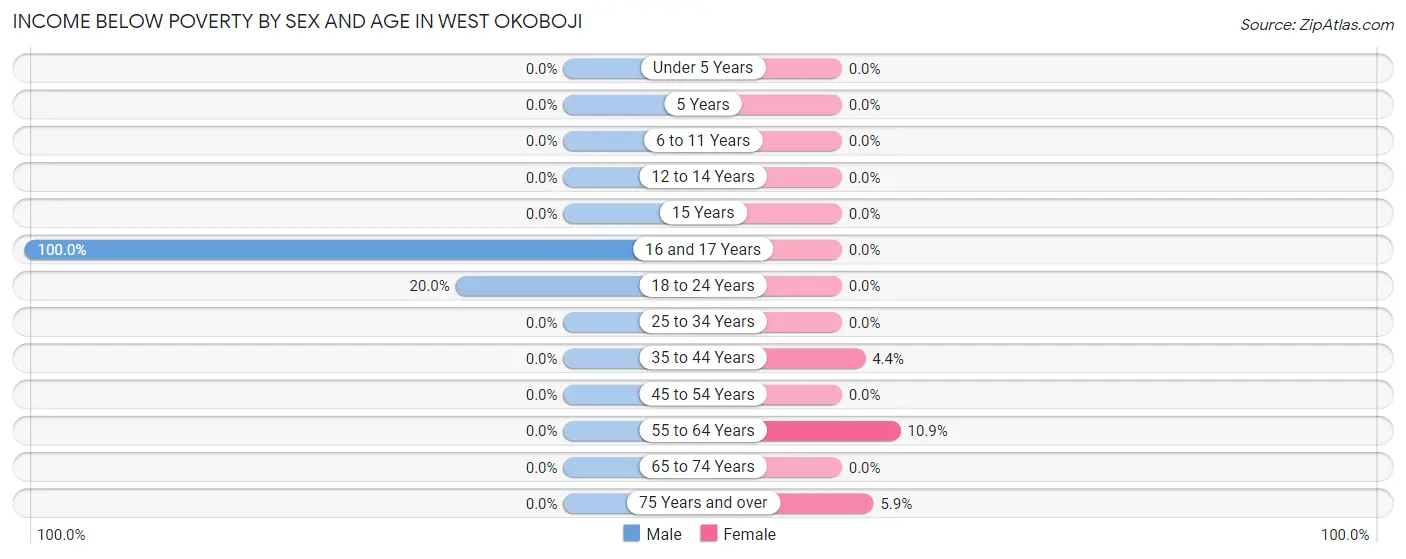
| Age Bracket | Male | Female |
| Under 5 Years | 0 (0.0%) | 0 (0.0%) |
| 5 Years | 0 (0.0%) | 0 (0.0%) |
| 6 to 11 Years | 0 (0.0%) | 0 (0.0%) |
| 12 to 14 Years | 0 (0.0%) | 0 (0.0%) |
| 15 Years | 0 (0.0%) | 0 (0.0%) |
| 16 and 17 Years | 1 (100.0%) | 0 (0.0%) |
| 18 to 24 Years | 1 (20.0%) | 0 (0.0%) |
| 25 to 34 Years | 0 (0.0%) | 0 (0.0%) |
| 35 to 44 Years | 0 (0.0%) | 1 (4.3%) |
| 45 to 54 Years | 0 (0.0%) | 0 (0.0%) |
| 55 to 64 Years | 0 (0.0%) | 6 (10.9%) |
| 65 to 74 Years | 0 (0.0%) | 0 (0.0%) |
| 75 Years and over | 0 (0.0%) | 3 (5.9%) |
| Total | 2 (1.3%) | 10 (5.0%) |
Income Above Poverty by Sex and Age in West Okoboji
According to the poverty statistics in West Okoboji, males aged under 5 years and females aged under 5 years are the age groups that are most secure financially, with 100.0% of males and 100.0% of females in these age groups living above the poverty line.
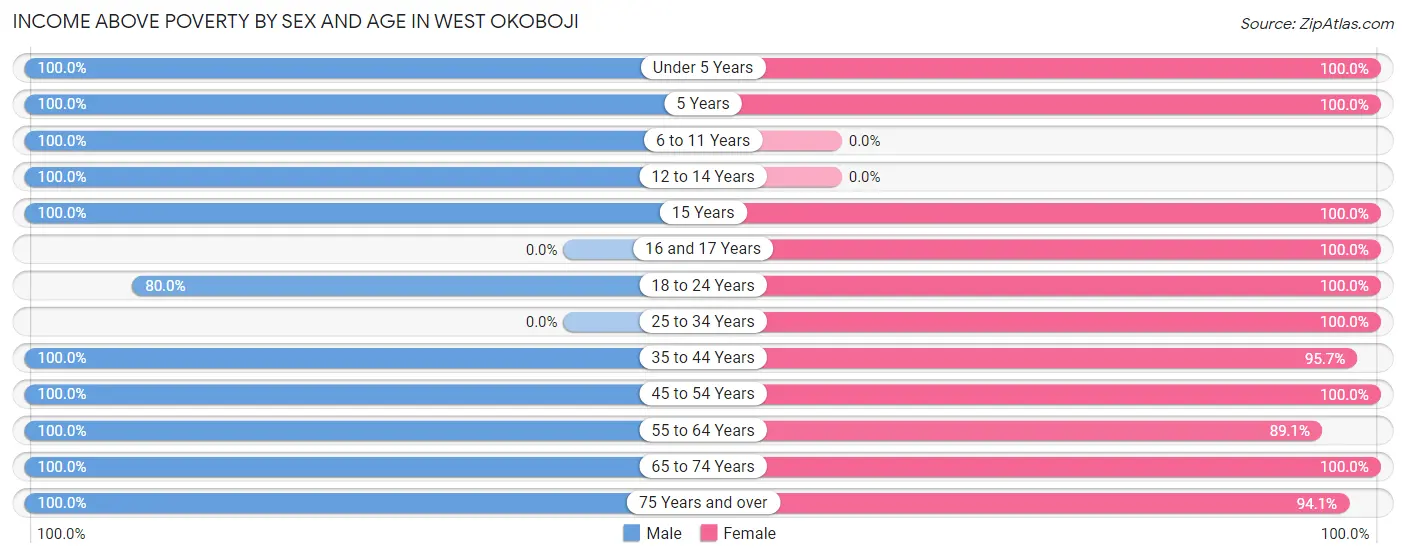
| Age Bracket | Male | Female |
| Under 5 Years | 1 (100.0%) | 8 (100.0%) |
| 5 Years | 1 (100.0%) | 4 (100.0%) |
| 6 to 11 Years | 16 (100.0%) | 0 (0.0%) |
| 12 to 14 Years | 3 (100.0%) | 0 (0.0%) |
| 15 Years | 5 (100.0%) | 1 (100.0%) |
| 16 and 17 Years | 0 (0.0%) | 2 (100.0%) |
| 18 to 24 Years | 4 (80.0%) | 2 (100.0%) |
| 25 to 34 Years | 0 (0.0%) | 11 (100.0%) |
| 35 to 44 Years | 24 (100.0%) | 22 (95.7%) |
| 45 to 54 Years | 6 (100.0%) | 4 (100.0%) |
| 55 to 64 Years | 29 (100.0%) | 49 (89.1%) |
| 65 to 74 Years | 39 (100.0%) | 39 (100.0%) |
| 75 Years and over | 25 (100.0%) | 48 (94.1%) |
| Total | 153 (98.7%) | 190 (95.0%) |
Income Below Poverty Among Married-Couple Families in West Okoboji
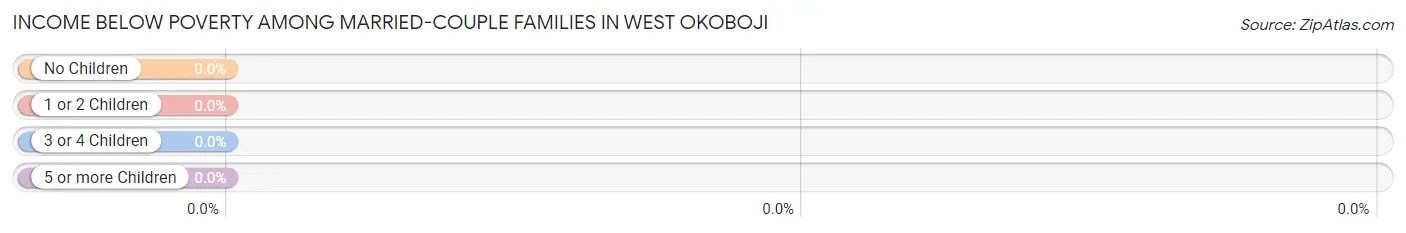
| Children | Above Poverty | Below Poverty |
| No Children | 94 (100.0%) | 0 (0.0%) |
| 1 or 2 Children | 16 (100.0%) | 0 (0.0%) |
| 3 or 4 Children | 2 (100.0%) | 0 (0.0%) |
| 5 or more Children | 0 (0.0%) | 0 (0.0%) |
| Total | 112 (100.0%) | 0 (0.0%) |
Income Below Poverty Among Single-Parent Households in West Okoboji
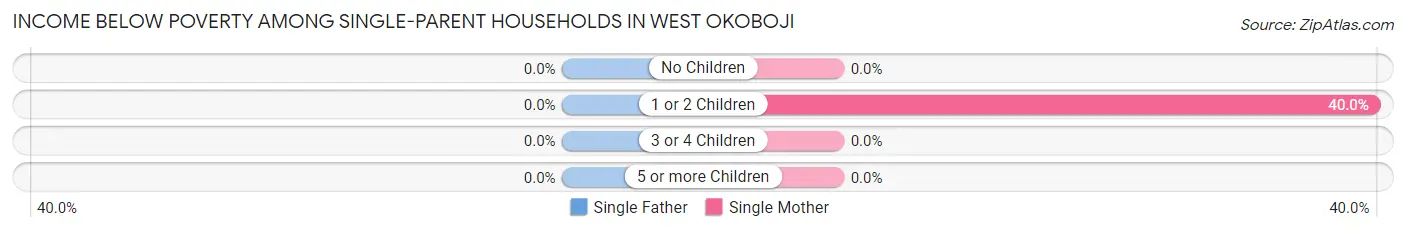
| Children | Single Father | Single Mother |
| No Children | 0 (0.0%) | 0 (0.0%) |
| 1 or 2 Children | 0 (0.0%) | 2 (40.0%) |
| 3 or 4 Children | 0 (0.0%) | 0 (0.0%) |
| 5 or more Children | 0 (0.0%) | 0 (0.0%) |
| Total | 0 (0.0%) | 2 (18.2%) |
Income Below Poverty Among Married-Couple vs Single-Parent Households in West Okoboji
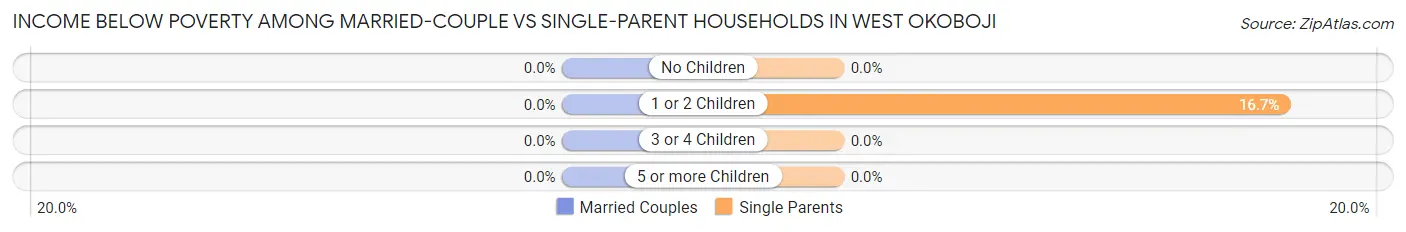
| Children | Married-Couple Families | Single-Parent Households |
| No Children | 0 (0.0%) | 0 (0.0%) |
| 1 or 2 Children | 0 (0.0%) | 2 (16.7%) |
| 3 or 4 Children | 0 (0.0%) | 0 (0.0%) |
| 5 or more Children | 0 (0.0%) | 0 (0.0%) |
| Total | 0 (0.0%) | 2 (11.1%) |
Race in West Okoboji
The most populous races in West Okoboji are White / Caucasian (342 | 95.8%), and Two or more Races (15 | 4.2%).
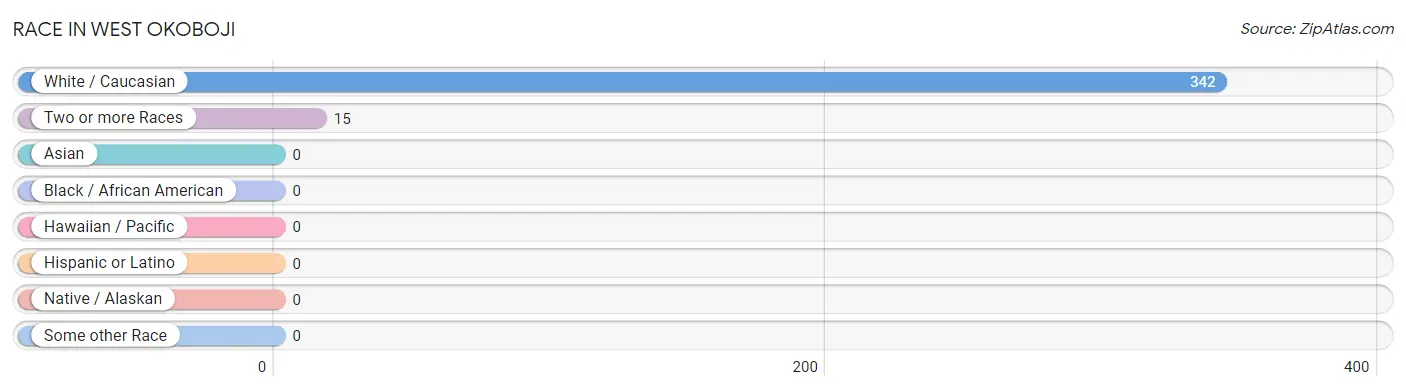
| Race | # Population | % Population |
| Asian | 0 | 0.0% |
| Black / African American | 0 | 0.0% |
| Hawaiian / Pacific | 0 | 0.0% |
| Hispanic or Latino | 0 | 0.0% |
| Native / Alaskan | 0 | 0.0% |
| White / Caucasian | 342 | 95.8% |
| Two or more Races | 15 | 4.2% |
| Some other Race | 0 | 0.0% |
| Total | 357 | 100.0% |
Ancestry in West Okoboji
The most populous ancestries reported in West Okoboji are German (139 | 38.9%), Norwegian (66 | 18.5%), English (57 | 16.0%), Irish (41 | 11.5%), and Swedish (17 | 4.8%), together accounting for 89.6% of all West Okoboji residents.
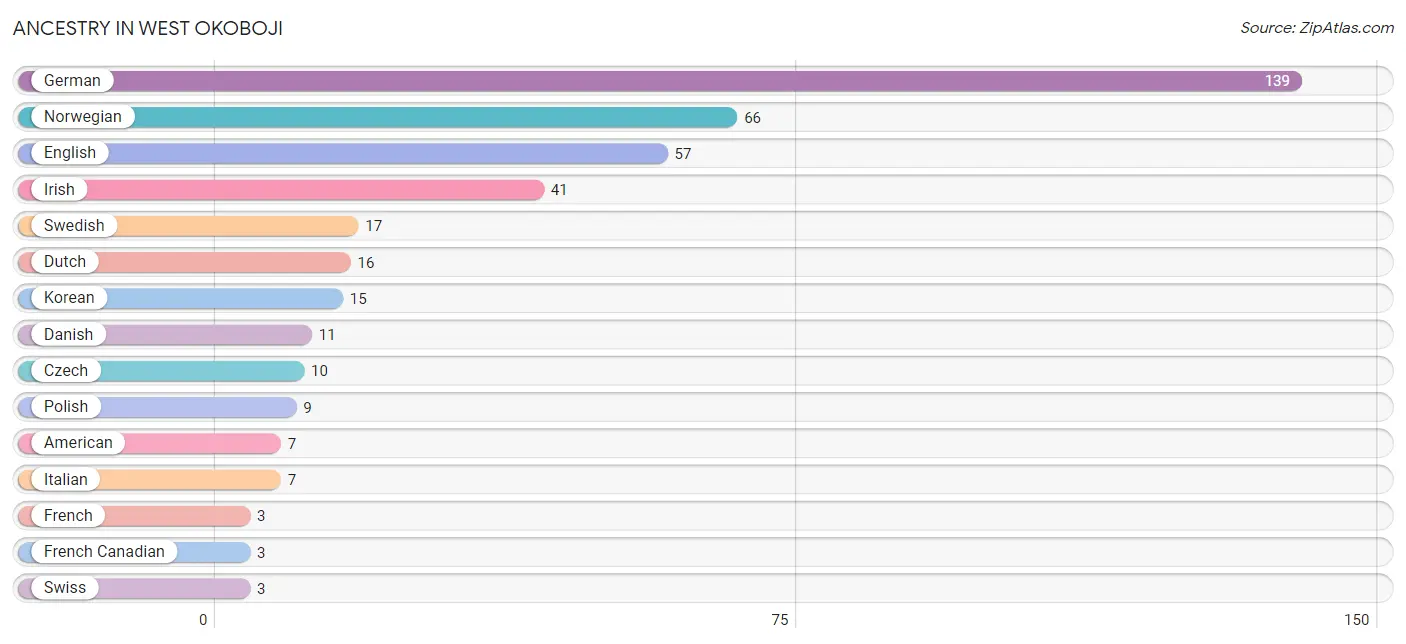
| Ancestry | # Population | % Population |
| American | 7 | 2.0% |
| British | 2 | 0.6% |
| Czech | 10 | 2.8% |
| Danish | 11 | 3.1% |
| Dutch | 16 | 4.5% |
| English | 57 | 16.0% |
| European | 1 | 0.3% |
| Finnish | 2 | 0.6% |
| French | 3 | 0.8% |
| French Canadian | 3 | 0.8% |
| German | 139 | 38.9% |
| Irish | 41 | 11.5% |
| Italian | 7 | 2.0% |
| Korean | 15 | 4.2% |
| Northern European | 2 | 0.6% |
| Norwegian | 66 | 18.5% |
| Polish | 9 | 2.5% |
| Scandinavian | 2 | 0.6% |
| Scottish | 2 | 0.6% |
| Swedish | 17 | 4.8% |
| Swiss | 3 | 0.8% |
| Welsh | 2 | 0.6% | View All 22 Rows |
Immigrants in West Okoboji

| Immigration Origin | # Population | % Population | View All 0 Rows |
Sex and Age in West Okoboji
Sex and Age in West Okoboji
The most populous age groups in West Okoboji are 65 to 69 Years (21 | 13.6%) for men and 60 to 64 Years (38 | 18.8%) for women.
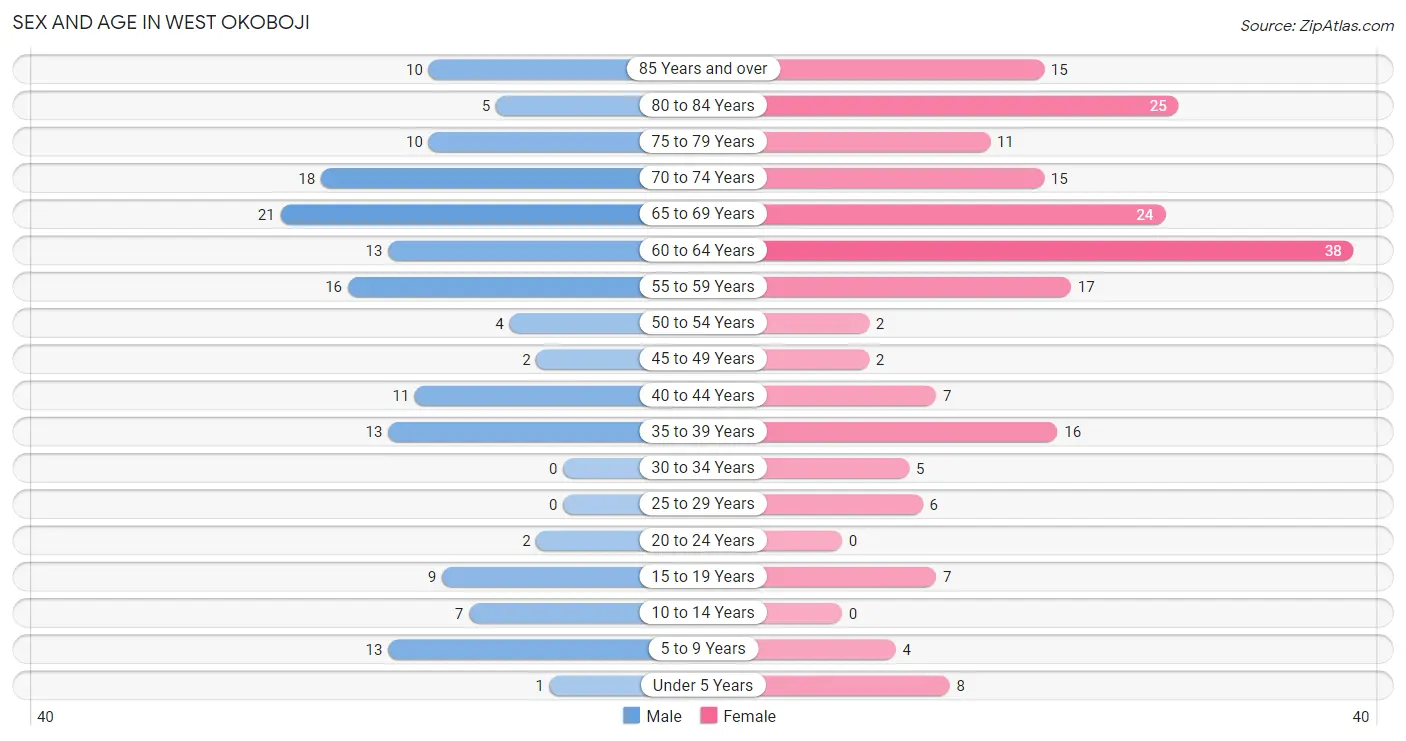
| Age Bracket | Male | Female |
| Under 5 Years | 1 (0.6%) | 8 (4.0%) |
| 5 to 9 Years | 13 (8.4%) | 4 (2.0%) |
| 10 to 14 Years | 7 (4.5%) | 0 (0.0%) |
| 15 to 19 Years | 9 (5.8%) | 7 (3.5%) |
| 20 to 24 Years | 2 (1.3%) | 0 (0.0%) |
| 25 to 29 Years | 0 (0.0%) | 6 (3.0%) |
| 30 to 34 Years | 0 (0.0%) | 5 (2.5%) |
| 35 to 39 Years | 13 (8.4%) | 16 (7.9%) |
| 40 to 44 Years | 11 (7.1%) | 7 (3.5%) |
| 45 to 49 Years | 2 (1.3%) | 2 (1.0%) |
| 50 to 54 Years | 4 (2.6%) | 2 (1.0%) |
| 55 to 59 Years | 16 (10.3%) | 17 (8.4%) |
| 60 to 64 Years | 13 (8.4%) | 38 (18.8%) |
| 65 to 69 Years | 21 (13.6%) | 24 (11.9%) |
| 70 to 74 Years | 18 (11.6%) | 15 (7.4%) |
| 75 to 79 Years | 10 (6.5%) | 11 (5.4%) |
| 80 to 84 Years | 5 (3.2%) | 25 (12.4%) |
| 85 Years and over | 10 (6.5%) | 15 (7.4%) |
| Total | 155 (100.0%) | 202 (100.0%) |
Families and Households in West Okoboji
Median Family Size in West Okoboji
The median family size in West Okoboji is 2.21 persons per family, with single male/father families (7 | 5.4%) accounting for the largest median family size of 2.43 persons per family. On the other hand, single female/mother families (11 | 8.5%) represent the smallest median family size with 1.91 persons per family.
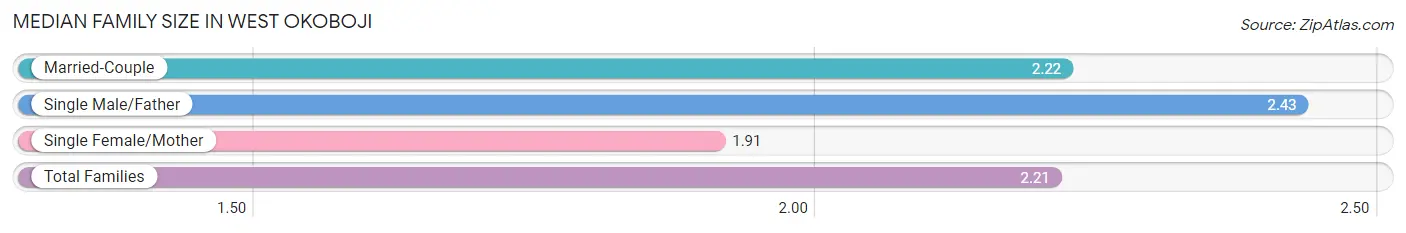
| Family Type | # Families | Family Size |
| Married-Couple | 112 (86.2%) | 2.22 |
| Single Male/Father | 7 (5.4%) | 2.43 |
| Single Female/Mother | 11 (8.5%) | 1.91 |
| Total Families | 130 (100.0%) | 2.21 |
Median Household Size in West Okoboji
The median household size in West Okoboji is 1.93 persons per household, with single male/father households (7 | 3.8%) accounting for the largest median household size of 3.14 persons per household. non-family households (54 | 29.3%) represent the smallest median household size with 1.17 persons per household.
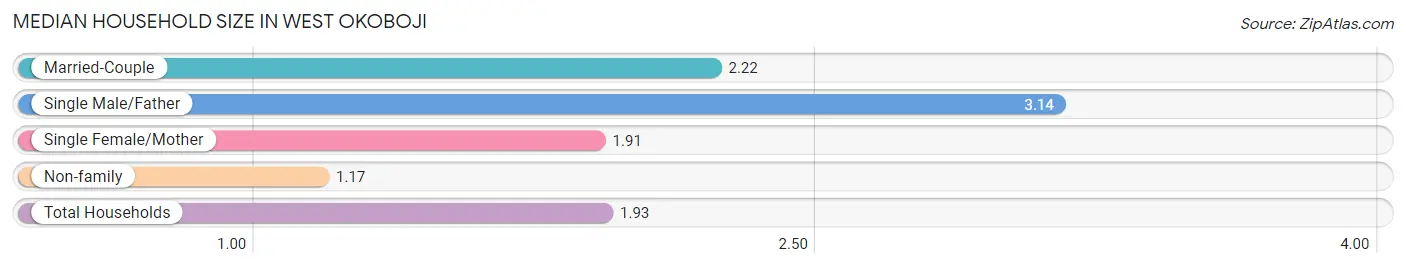
| Household Type | # Households | Household Size |
| Married-Couple | 112 (60.9%) | 2.22 |
| Single Male/Father | 7 (3.8%) | 3.14 |
| Single Female/Mother | 11 (6.0%) | 1.91 |
| Non-family | 54 (29.3%) | 1.17 |
| Total Households | 184 (100.0%) | 1.93 |
Household Size by Marriage Status in West Okoboji
Out of a total of 184 households in West Okoboji, 130 (70.7%) are family households, while 54 (29.3%) are nonfamily households. The most numerous type of family households are 2-person households, comprising 100, and the most common type of nonfamily households are 1-person households, comprising 48.
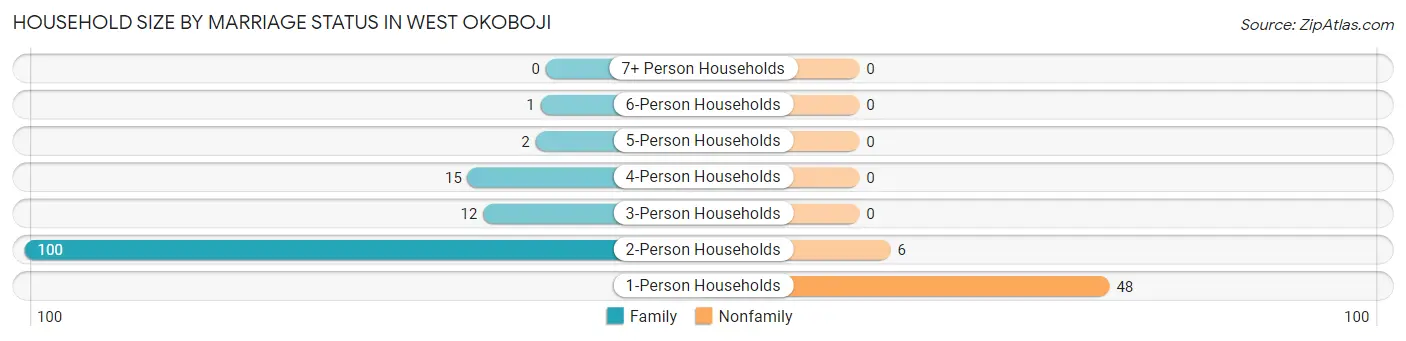
| Household Size | Family Households | Nonfamily Households |
| 1-Person Households | - | 48 (26.1%) |
| 2-Person Households | 100 (54.3%) | 6 (3.3%) |
| 3-Person Households | 12 (6.5%) | 0 (0.0%) |
| 4-Person Households | 15 (8.2%) | 0 (0.0%) |
| 5-Person Households | 2 (1.1%) | 0 (0.0%) |
| 6-Person Households | 1 (0.5%) | 0 (0.0%) |
| 7+ Person Households | 0 (0.0%) | 0 (0.0%) |
| Total | 130 (70.7%) | 54 (29.3%) |
Female Fertility in West Okoboji
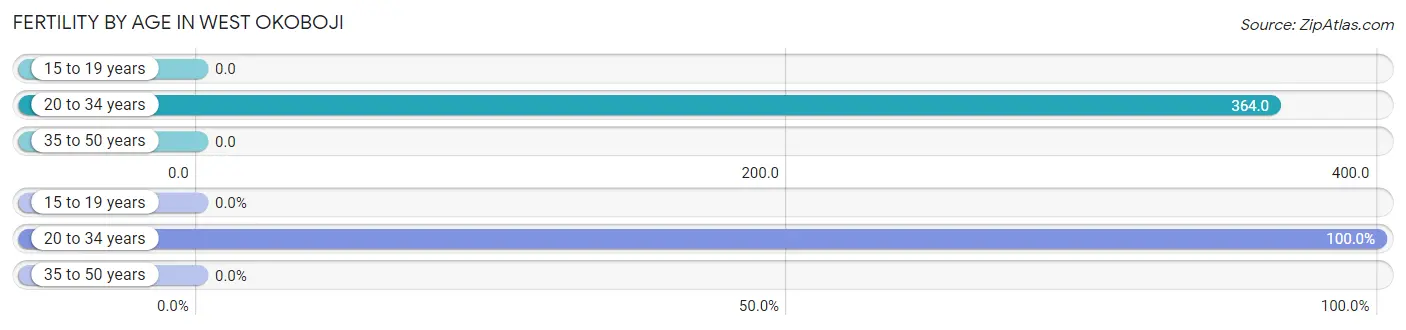
Fertility by Age in West Okoboji
Average fertility rate in West Okoboji is 93.0 births per 1,000 women. Women in the age bracket of 20 to 34 years have the highest fertility rate with 364.0 births per 1,000 women. Women in the age bracket of 20 to 34 years acount for 100.0% of all women with births.
| Age Bracket | Women with Births | Births / 1,000 Women |
| 15 to 19 years | 0 (0.0%) | 0.0 |
| 20 to 34 years | 4 (100.0%) | 364.0 |
| 35 to 50 years | 0 (0.0%) | 0.0 |
| Total | 4 (100.0%) | 93.0 |
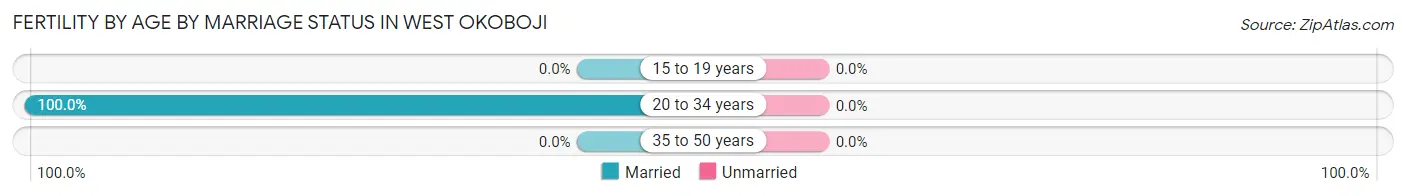
Fertility by Age by Marriage Status in West Okoboji
| Age Bracket | Married | Unmarried |
| 15 to 19 years | 0 (0.0%) | 0 (0.0%) |
| 20 to 34 years | 4 (100.0%) | 0 (0.0%) |
| 35 to 50 years | 0 (0.0%) | 0 (0.0%) |
| Total | 4 (100.0%) | 0 (0.0%) |
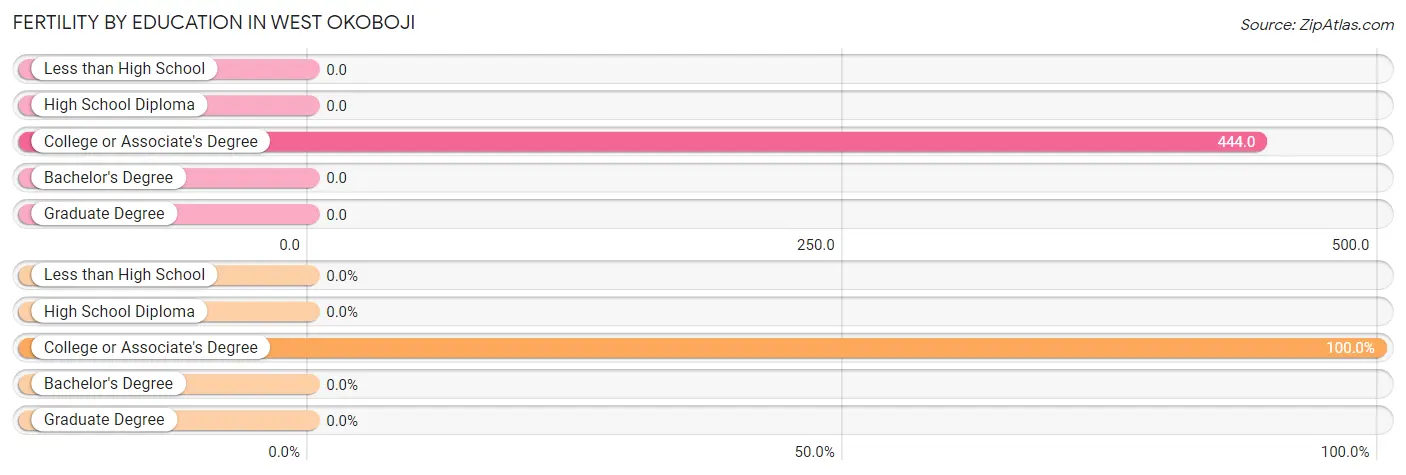
Fertility by Education in West Okoboji
| Educational Attainment | Women with Births | Births / 1,000 Women |
| Less than High School | 0 (0.0%) | 0.0 |
| High School Diploma | 0 (0.0%) | 0.0 |
| College or Associate's Degree | 4 (100.0%) | 444.0 |
| Bachelor's Degree | 0 (0.0%) | 0.0 |
| Graduate Degree | 0 (0.0%) | 0.0 |
| Total | 4 (100.0%) | 93.0 |
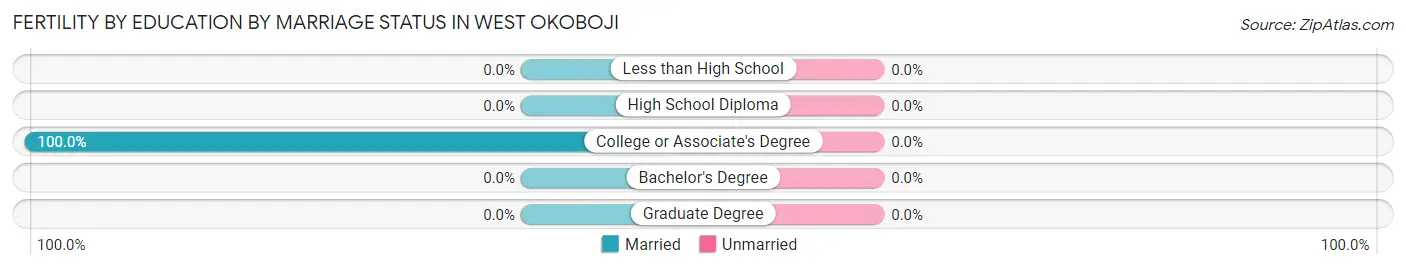
Fertility by Education by Marriage Status in West Okoboji
| Educational Attainment | Married | Unmarried |
| Less than High School | 0 (0.0%) | 0 (0.0%) |
| High School Diploma | 0 (0.0%) | 0 (0.0%) |
| College or Associate's Degree | 4 (100.0%) | 0 (0.0%) |
| Bachelor's Degree | 0 (0.0%) | 0 (0.0%) |
| Graduate Degree | 0 (0.0%) | 0 (0.0%) |
| Total | 4 (100.0%) | 0 (0.0%) |
Employment Characteristics in West Okoboji
Employment by Class of Employer in West Okoboji
Among the 137 employed individuals in West Okoboji, private company employees (65 | 47.4%), self-employed (incorporated) (36 | 26.3%), and self-employed (not incorporated) (16 | 11.7%) make up the most common classes of employment.
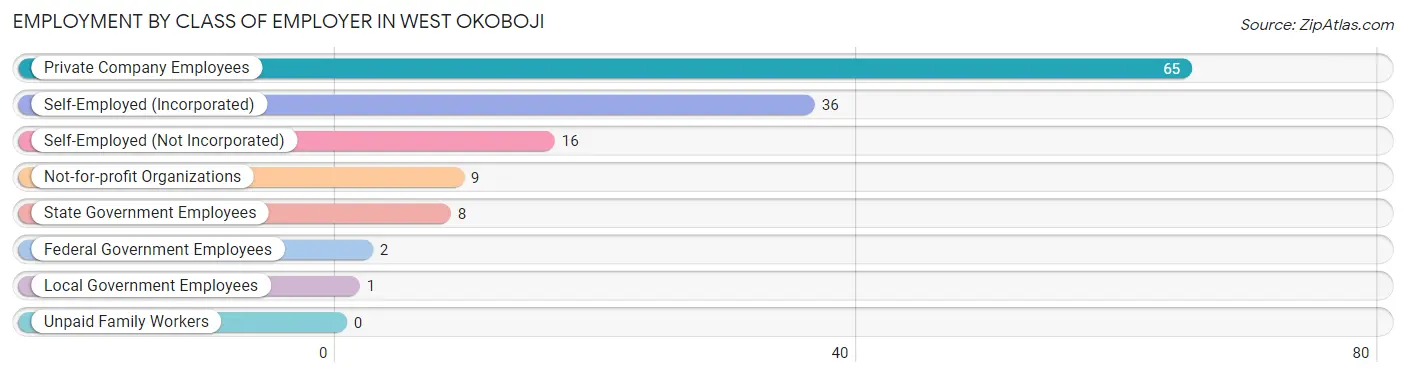
| Employer Class | # Employees | % Employees |
| Private Company Employees | 65 | 47.4% |
| Self-Employed (Incorporated) | 36 | 26.3% |
| Self-Employed (Not Incorporated) | 16 | 11.7% |
| Not-for-profit Organizations | 9 | 6.6% |
| Local Government Employees | 1 | 0.7% |
| State Government Employees | 8 | 5.8% |
| Federal Government Employees | 2 | 1.5% |
| Unpaid Family Workers | 0 | 0.0% |
| Total | 137 | 100.0% |
Employment Status by Age in West Okoboji
According to the labor force statistics for West Okoboji, out of the total population over 16 years of age (316), 45.3% or 143 individuals are in the labor force, with 1.4% or 2 of them unemployed. The age group with the highest labor force participation rate is 25 to 29 years, with 100.0% or 6 individuals in the labor force. Within the labor force, the 35 to 44 years age range has the highest percentage of unemployed individuals, with 5.4% or 2 of them being unemployed.
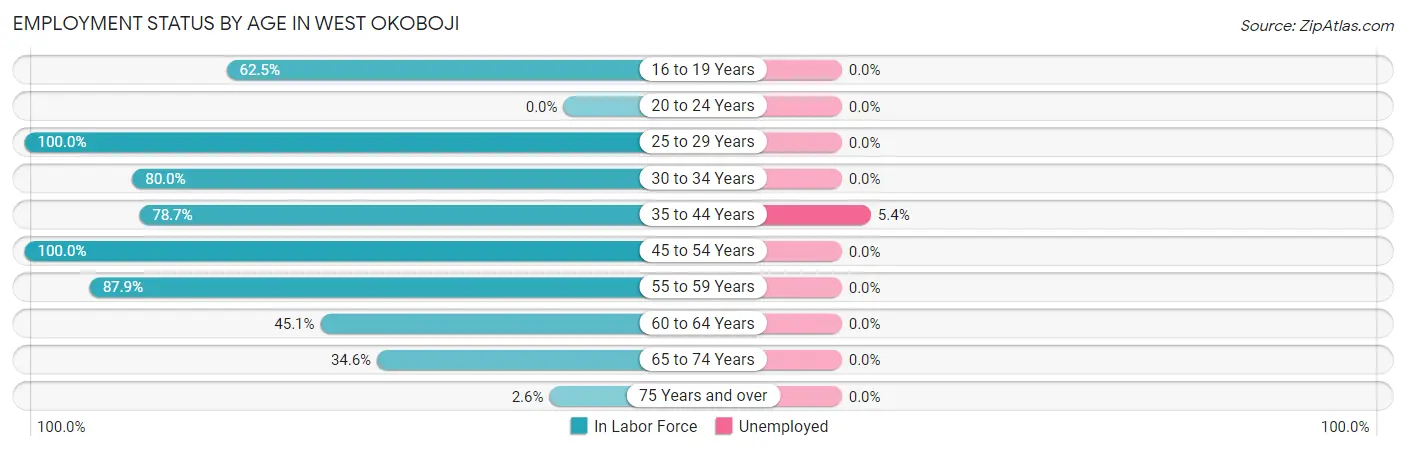
| Age Bracket | In Labor Force | Unemployed |
| 16 to 19 Years | 5 (62.5%) | 0 (0.0%) |
| 20 to 24 Years | 0 (0.0%) | 0 (0.0%) |
| 25 to 29 Years | 6 (100.0%) | 0 (0.0%) |
| 30 to 34 Years | 4 (80.0%) | 0 (0.0%) |
| 35 to 44 Years | 37 (78.7%) | 2 (5.4%) |
| 45 to 54 Years | 10 (100.0%) | 0 (0.0%) |
| 55 to 59 Years | 29 (87.9%) | 0 (0.0%) |
| 60 to 64 Years | 23 (45.1%) | 0 (0.0%) |
| 65 to 74 Years | 27 (34.6%) | 0 (0.0%) |
| 75 Years and over | 2 (2.6%) | 0 (0.0%) |
| Total | 143 (45.3%) | 2 (1.4%) |
Employment Status by Educational Attainment in West Okoboji
According to labor force statistics for West Okoboji, 71.7% of individuals (109) out of the total population between 25 and 64 years of age (152) are in the labor force, with 1.8% or 2 of them being unemployed. The group with the highest labor force participation rate are those with the educational attainment of less than high school, with 100.0% or 3 individuals in the labor force. Within the labor force, individuals with college / associate degree education have the highest percentage of unemployment, with 4.5% or 2 of them being unemployed.
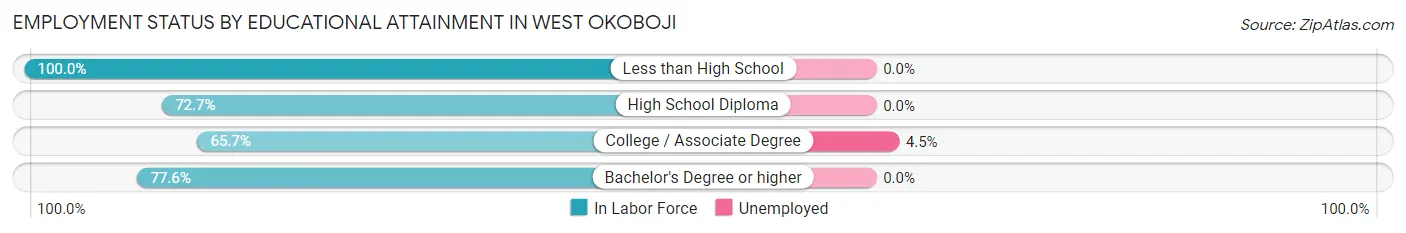
| Educational Attainment | In Labor Force | Unemployed |
| Less than High School | 3 (100.0%) | 0 (0.0%) |
| High School Diploma | 24 (72.7%) | 0 (0.0%) |
| College / Associate Degree | 44 (65.7%) | 3 (4.5%) |
| Bachelor's Degree or higher | 38 (77.6%) | 0 (0.0%) |
| Total | 109 (71.7%) | 3 (1.8%) |
Employment Occupations by Sex in West Okoboji
Management, Business, Science and Arts Occupations
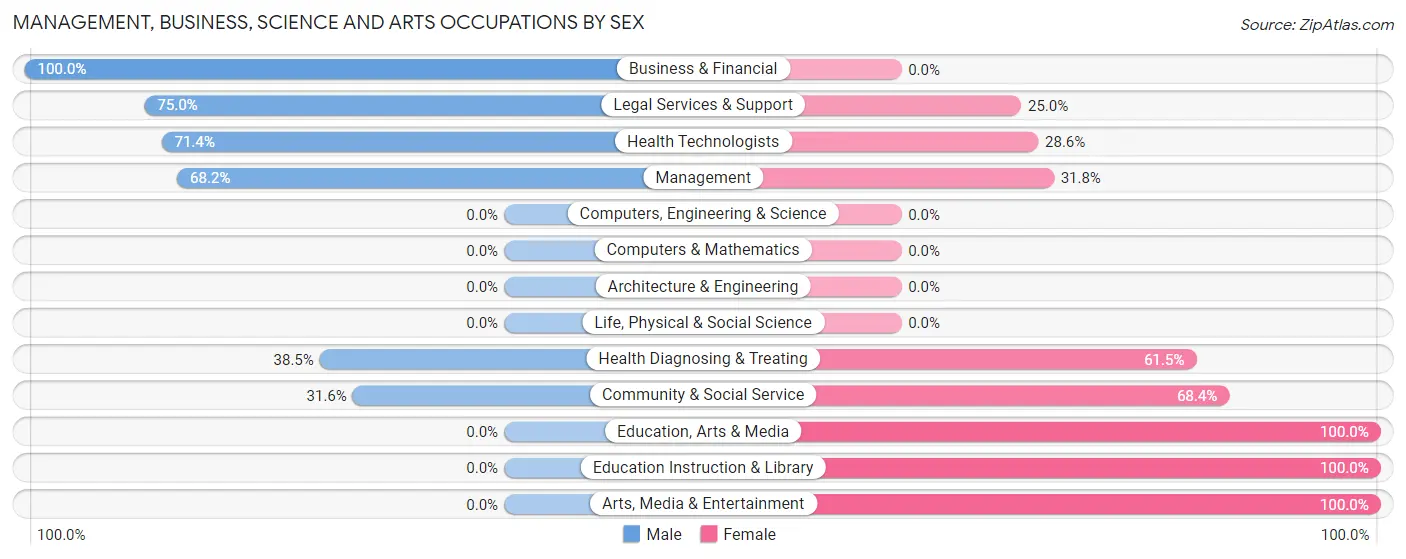
The most common Management, Business, Science and Arts occupations in West Okoboji are Management (22 | 15.6%), Community & Social Service (19 | 13.5%), Health Diagnosing & Treating (13 | 9.2%), Legal Services & Support (8 | 5.7%), and Health Technologists (7 | 5.0%).
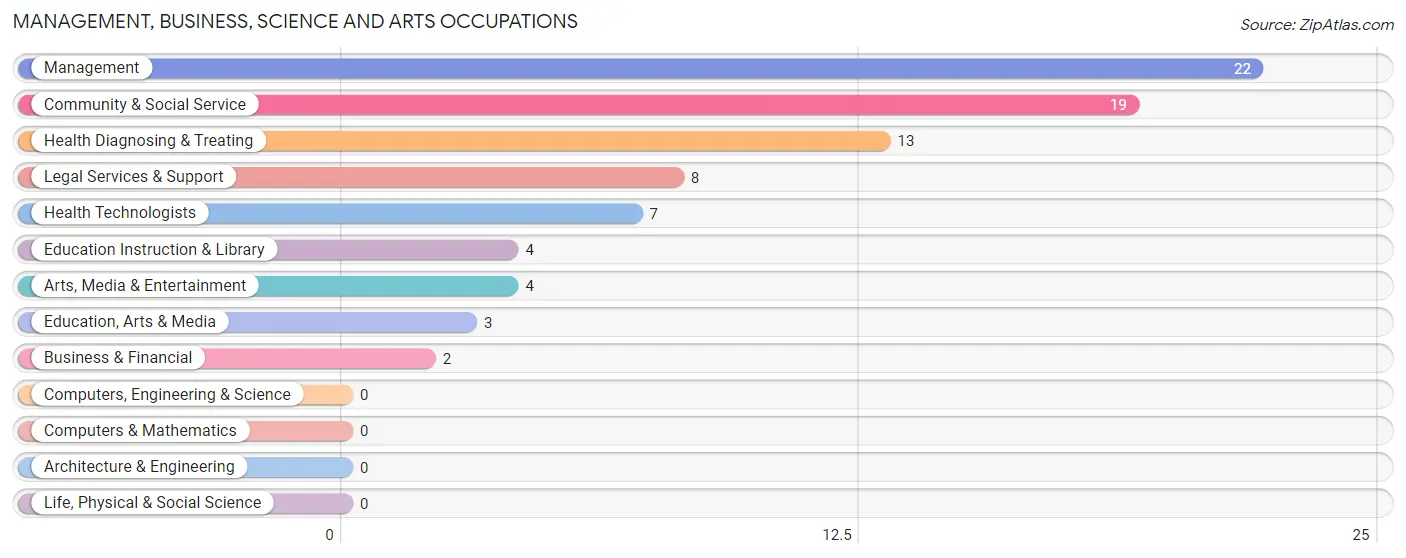
Management, Business, Science and Arts Occupations by Sex
Within the Management, Business, Science and Arts occupations in West Okoboji, the most male-oriented occupations are Business & Financial (100.0%), Legal Services & Support (75.0%), and Health Technologists (71.4%), while the most female-oriented occupations are Education, Arts & Media (100.0%), Education Instruction & Library (100.0%), and Arts, Media & Entertainment (100.0%).
| Occupation | Male | Female |
| Management | 15 (68.2%) | 7 (31.8%) |
| Business & Financial | 2 (100.0%) | 0 (0.0%) |
| Computers, Engineering & Science | 0 (0.0%) | 0 (0.0%) |
| Computers & Mathematics | 0 (0.0%) | 0 (0.0%) |
| Architecture & Engineering | 0 (0.0%) | 0 (0.0%) |
| Life, Physical & Social Science | 0 (0.0%) | 0 (0.0%) |
| Community & Social Service | 6 (31.6%) | 13 (68.4%) |
| Education, Arts & Media | 0 (0.0%) | 3 (100.0%) |
| Legal Services & Support | 6 (75.0%) | 2 (25.0%) |
| Education Instruction & Library | 0 (0.0%) | 4 (100.0%) |
| Arts, Media & Entertainment | 0 (0.0%) | 4 (100.0%) |
| Health Diagnosing & Treating | 5 (38.5%) | 8 (61.5%) |
| Health Technologists | 5 (71.4%) | 2 (28.6%) |
| Total (Category) | 28 (50.0%) | 28 (50.0%) |
| Total (Overall) | 76 (53.9%) | 65 (46.1%) |
Services Occupations
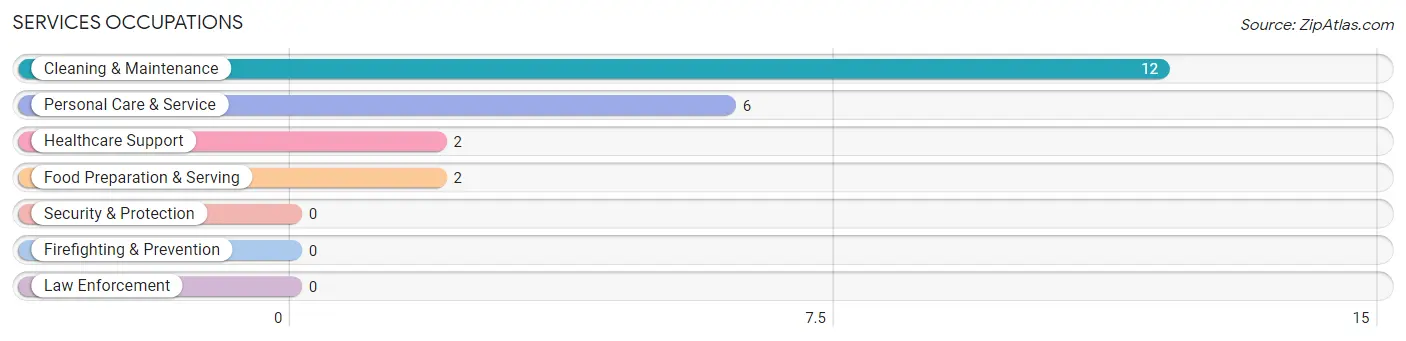
The most common Services occupations in West Okoboji are Cleaning & Maintenance (12 | 8.5%), Personal Care & Service (6 | 4.3%), Healthcare Support (2 | 1.4%), and Food Preparation & Serving (2 | 1.4%).
Services Occupations by Sex
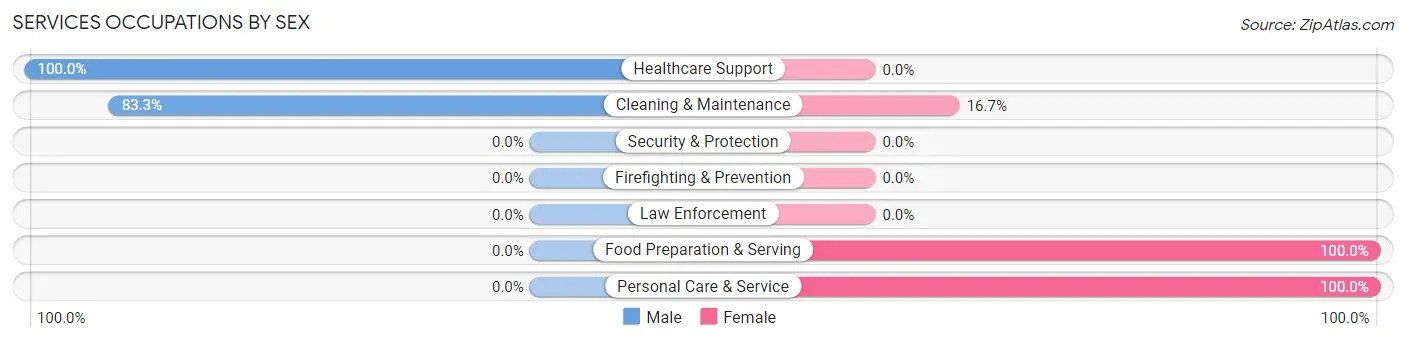
Within the Services occupations in West Okoboji, the most male-oriented occupations are Healthcare Support (100.0%), and Cleaning & Maintenance (83.3%), while the most female-oriented occupations are Food Preparation & Serving (100.0%), Personal Care & Service (100.0%), and Cleaning & Maintenance (16.7%).
| Occupation | Male | Female |
| Healthcare Support | 2 (100.0%) | 0 (0.0%) |
| Security & Protection | 0 (0.0%) | 0 (0.0%) |
| Firefighting & Prevention | 0 (0.0%) | 0 (0.0%) |
| Law Enforcement | 0 (0.0%) | 0 (0.0%) |
| Food Preparation & Serving | 0 (0.0%) | 2 (100.0%) |
| Cleaning & Maintenance | 10 (83.3%) | 2 (16.7%) |
| Personal Care & Service | 0 (0.0%) | 6 (100.0%) |
| Total (Category) | 12 (54.5%) | 10 (45.5%) |
| Total (Overall) | 76 (53.9%) | 65 (46.1%) |
Sales and Office Occupations
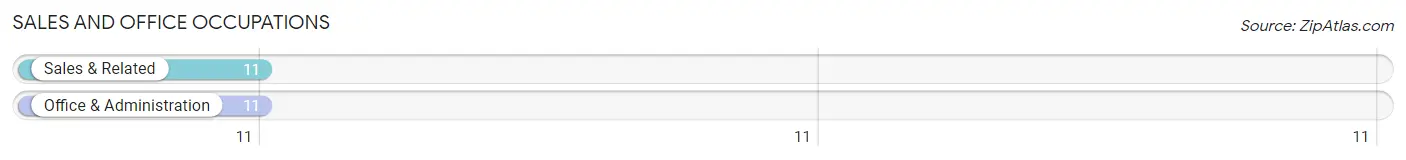
The most common Sales and Office occupations in West Okoboji are Sales & Related (11 | 7.8%), and Office & Administration (11 | 7.8%).
Sales and Office Occupations by Sex
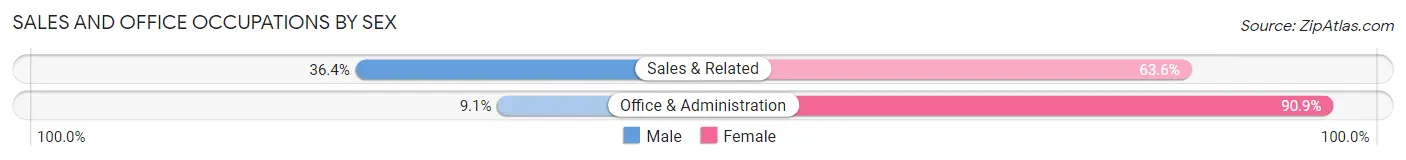
| Occupation | Male | Female |
| Sales & Related | 4 (36.4%) | 7 (63.6%) |
| Office & Administration | 1 (9.1%) | 10 (90.9%) |
| Total (Category) | 5 (22.7%) | 17 (77.3%) |
| Total (Overall) | 76 (53.9%) | 65 (46.1%) |
Natural Resources, Construction and Maintenance Occupations
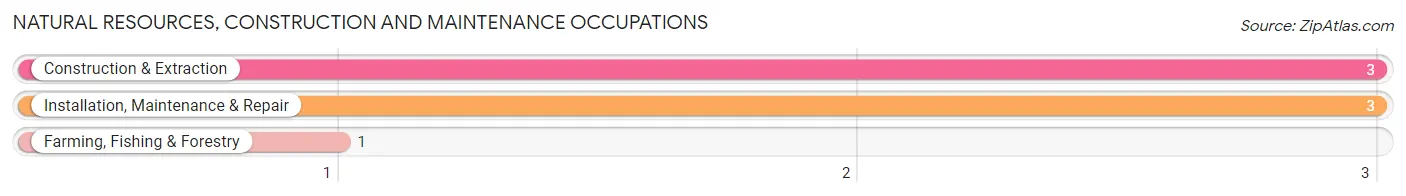
The most common Natural Resources, Construction and Maintenance occupations in West Okoboji are Construction & Extraction (3 | 2.1%), Installation, Maintenance & Repair (3 | 2.1%), and Farming, Fishing & Forestry (1 | 0.7%).
Natural Resources, Construction and Maintenance Occupations by Sex
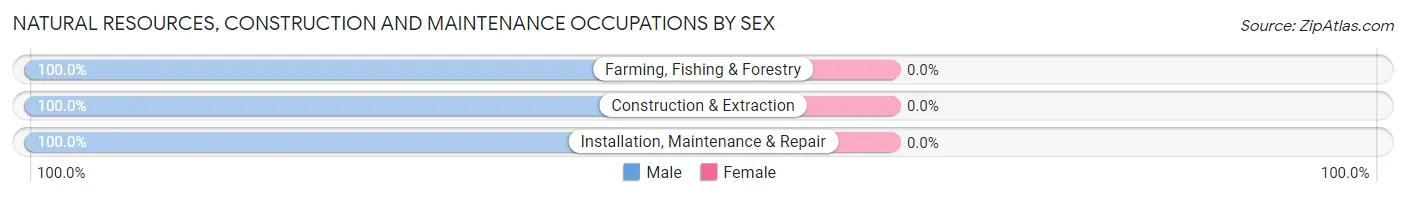
| Occupation | Male | Female |
| Farming, Fishing & Forestry | 1 (100.0%) | 0 (0.0%) |
| Construction & Extraction | 3 (100.0%) | 0 (0.0%) |
| Installation, Maintenance & Repair | 3 (100.0%) | 0 (0.0%) |
| Total (Category) | 7 (100.0%) | 0 (0.0%) |
| Total (Overall) | 76 (53.9%) | 65 (46.1%) |
Production, Transportation and Moving Occupations
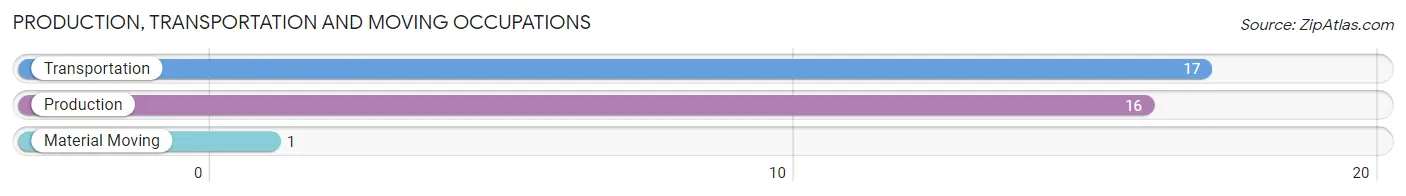
The most common Production, Transportation and Moving occupations in West Okoboji are Transportation (17 | 12.1%), Production (16 | 11.4%), and Material Moving (1 | 0.7%).
Production, Transportation and Moving Occupations by Sex
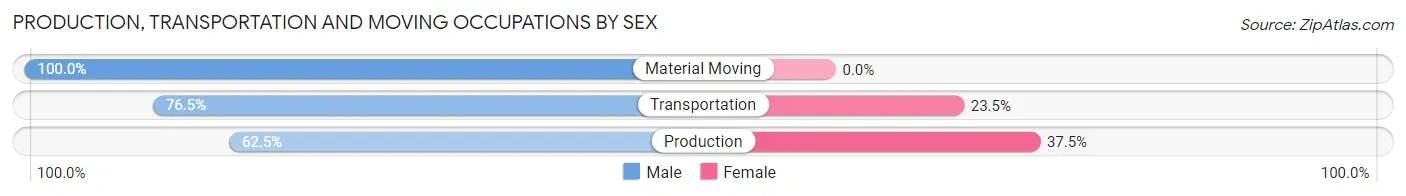
| Occupation | Male | Female |
| Production | 10 (62.5%) | 6 (37.5%) |
| Transportation | 13 (76.5%) | 4 (23.5%) |
| Material Moving | 1 (100.0%) | 0 (0.0%) |
| Total (Category) | 24 (70.6%) | 10 (29.4%) |
| Total (Overall) | 76 (53.9%) | 65 (46.1%) |
Employment Industries by Sex in West Okoboji
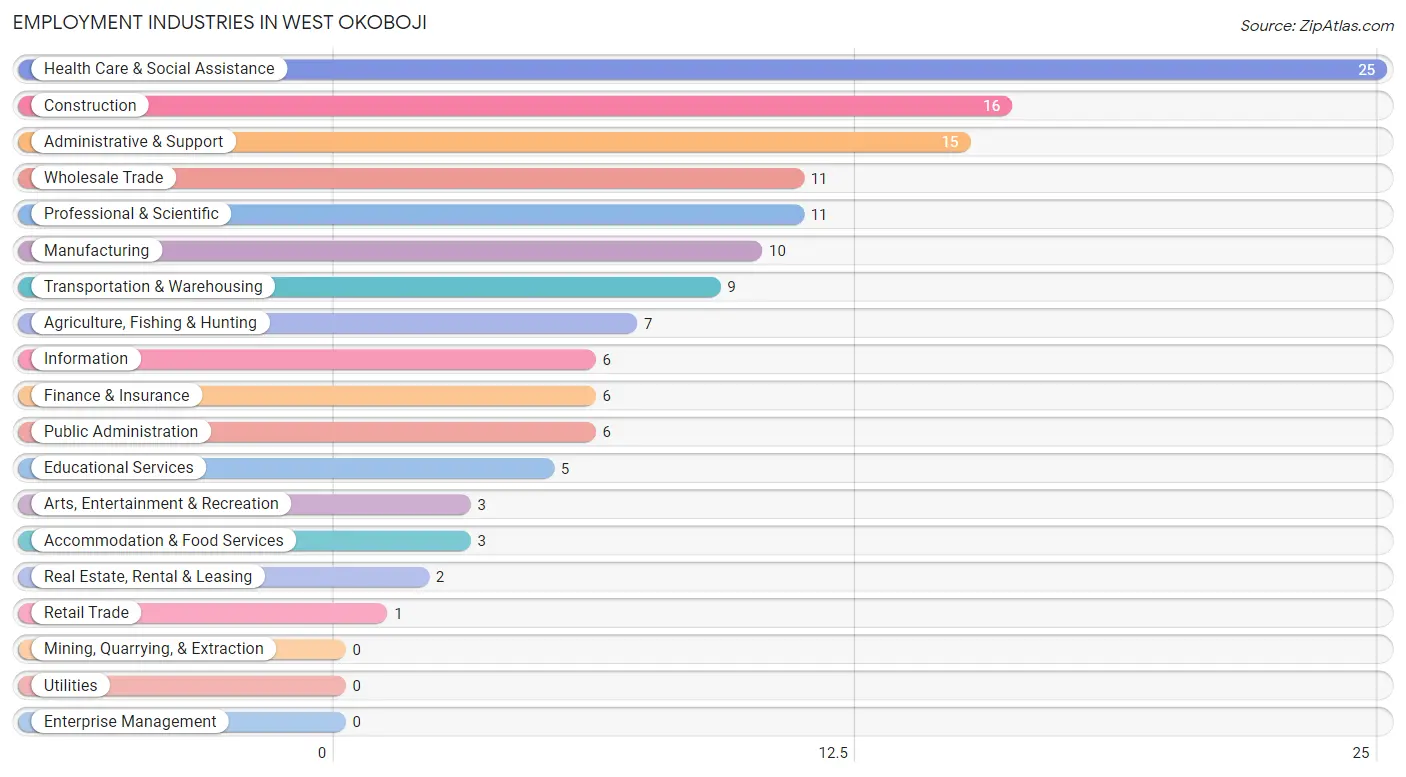
Employment Industries in West Okoboji
The major employment industries in West Okoboji include Health Care & Social Assistance (25 | 17.7%), Construction (16 | 11.4%), Administrative & Support (15 | 10.6%), Wholesale Trade (11 | 7.8%), and Professional & Scientific (11 | 7.8%).
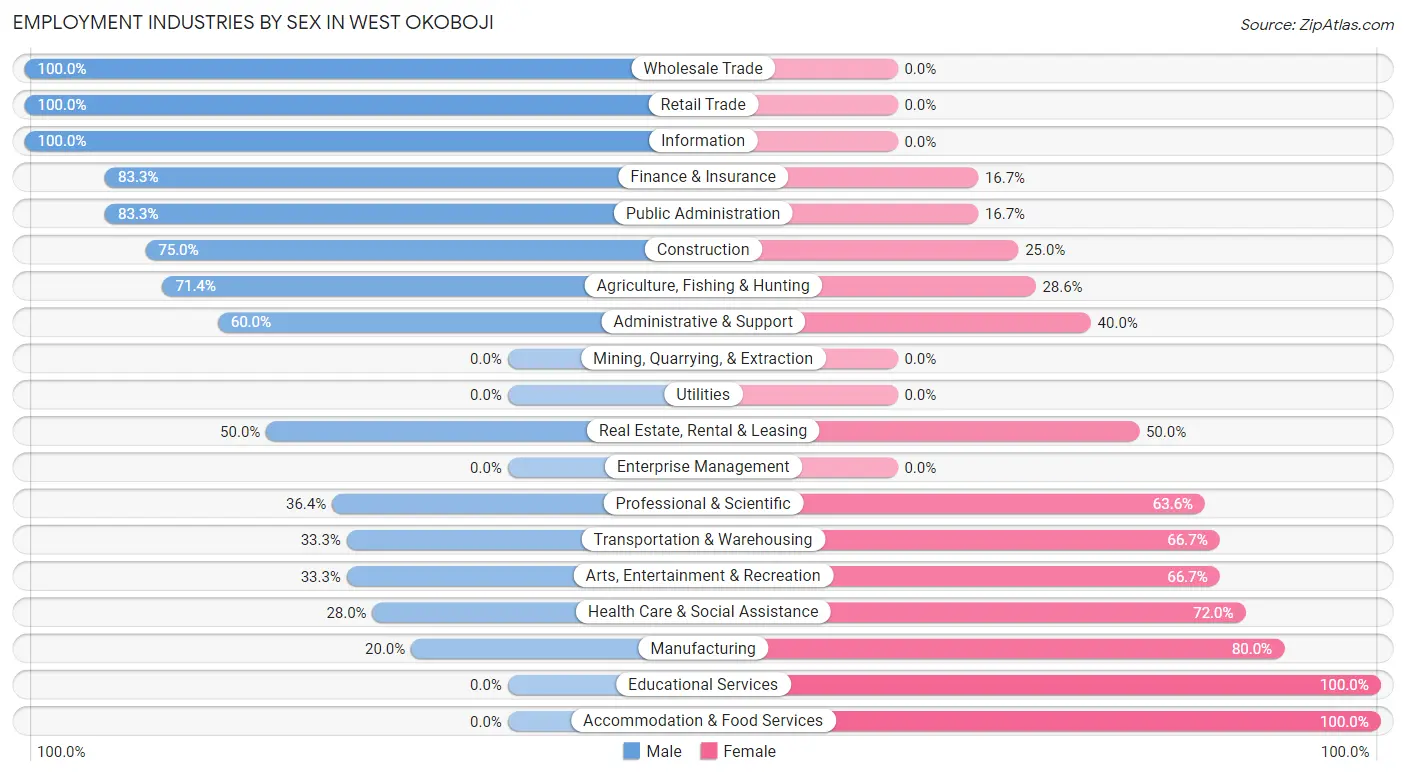
Employment Industries by Sex in West Okoboji
The West Okoboji industries that see more men than women are Wholesale Trade (100.0%), Retail Trade (100.0%), and Information (100.0%), whereas the industries that tend to have a higher number of women are Educational Services (100.0%), Accommodation & Food Services (100.0%), and Manufacturing (80.0%).
| Industry | Male | Female |
| Agriculture, Fishing & Hunting | 5 (71.4%) | 2 (28.6%) |
| Mining, Quarrying, & Extraction | 0 (0.0%) | 0 (0.0%) |
| Construction | 12 (75.0%) | 4 (25.0%) |
| Manufacturing | 2 (20.0%) | 8 (80.0%) |
| Wholesale Trade | 11 (100.0%) | 0 (0.0%) |
| Retail Trade | 1 (100.0%) | 0 (0.0%) |
| Transportation & Warehousing | 3 (33.3%) | 6 (66.7%) |
| Utilities | 0 (0.0%) | 0 (0.0%) |
| Information | 6 (100.0%) | 0 (0.0%) |
| Finance & Insurance | 5 (83.3%) | 1 (16.7%) |
| Real Estate, Rental & Leasing | 1 (50.0%) | 1 (50.0%) |
| Professional & Scientific | 4 (36.4%) | 7 (63.6%) |
| Enterprise Management | 0 (0.0%) | 0 (0.0%) |
| Administrative & Support | 9 (60.0%) | 6 (40.0%) |
| Educational Services | 0 (0.0%) | 5 (100.0%) |
| Health Care & Social Assistance | 7 (28.0%) | 18 (72.0%) |
| Arts, Entertainment & Recreation | 1 (33.3%) | 2 (66.7%) |
| Accommodation & Food Services | 0 (0.0%) | 3 (100.0%) |
| Public Administration | 5 (83.3%) | 1 (16.7%) |
| Total | 76 (53.9%) | 65 (46.1%) |
Education in West Okoboji
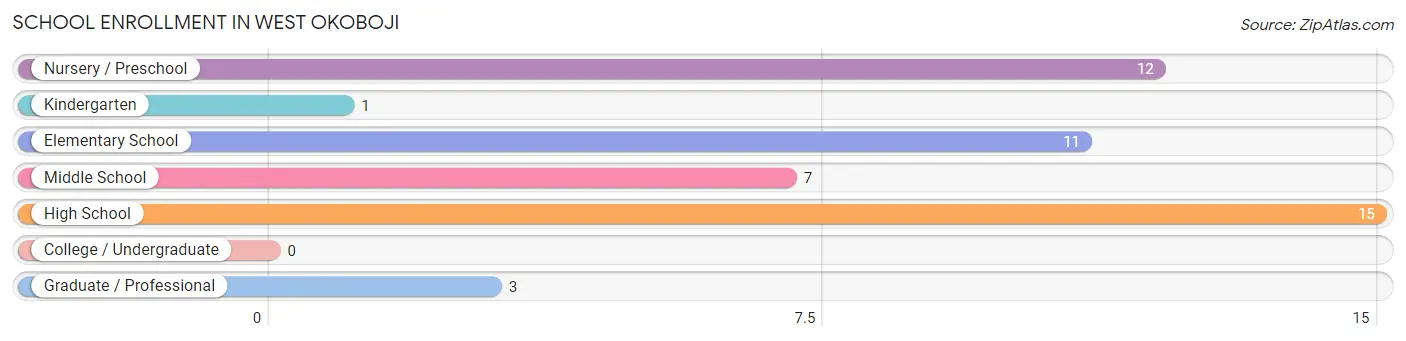
School Enrollment in West Okoboji
The most common levels of schooling among the 49 students in West Okoboji are high school (15 | 30.6%), nursery / preschool (12 | 24.5%), and elementary school (11 | 22.5%).
| School Level | # Students | % Students |
| Nursery / Preschool | 12 | 24.5% |
| Kindergarten | 1 | 2.0% |
| Elementary School | 11 | 22.5% |
| Middle School | 7 | 14.3% |
| High School | 15 | 30.6% |
| College / Undergraduate | 0 | 0.0% |
| Graduate / Professional | 3 | 6.1% |
| Total | 49 | 100.0% |
School Enrollment by Age by Funding Source in West Okoboji
Out of a total of 49 students who are enrolled in schools in West Okoboji, 8 (16.3%) attend a private institution, while the remaining 41 (83.7%) are enrolled in public schools. The age group of 3 to 4 year olds has the highest likelihood of being enrolled in private schools, with 7 (100.0% in the age bracket) enrolled. Conversely, the age group of 5 to 9 year old has the lowest likelihood of being enrolled in a private school, with 17 (100.0% in the age bracket) attending a public institution.
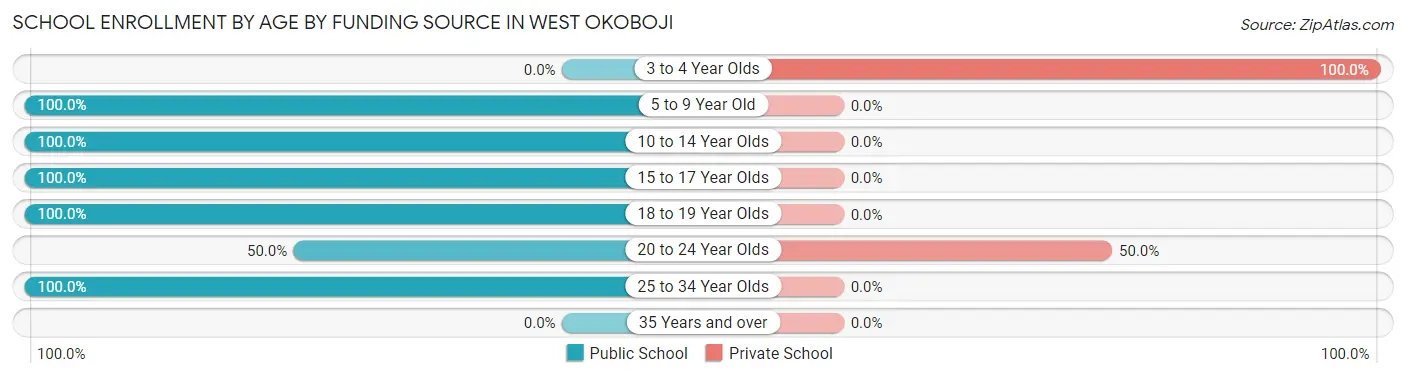
| Age Bracket | Public School | Private School |
| 3 to 4 Year Olds | 0 (0.0%) | 7 (100.0%) |
| 5 to 9 Year Old | 17 (100.0%) | 0 (0.0%) |
| 10 to 14 Year Olds | 7 (100.0%) | 0 (0.0%) |
| 15 to 17 Year Olds | 11 (100.0%) | 0 (0.0%) |
| 18 to 19 Year Olds | 3 (100.0%) | 0 (0.0%) |
| 20 to 24 Year Olds | 1 (50.0%) | 1 (50.0%) |
| 25 to 34 Year Olds | 2 (100.0%) | 0 (0.0%) |
| 35 Years and over | 0 (0.0%) | 0 (0.0%) |
| Total | 41 (83.7%) | 8 (16.3%) |
Educational Attainment by Field of Study in West Okoboji
Education (43 | 32.1%), science & technology (15 | 11.2%), business (14 | 10.4%), psychology (12 | 9.0%), and bio, nature & agricultural (11 | 8.2%) are the most common fields of study among 134 individuals in West Okoboji who have obtained a bachelor's degree or higher.
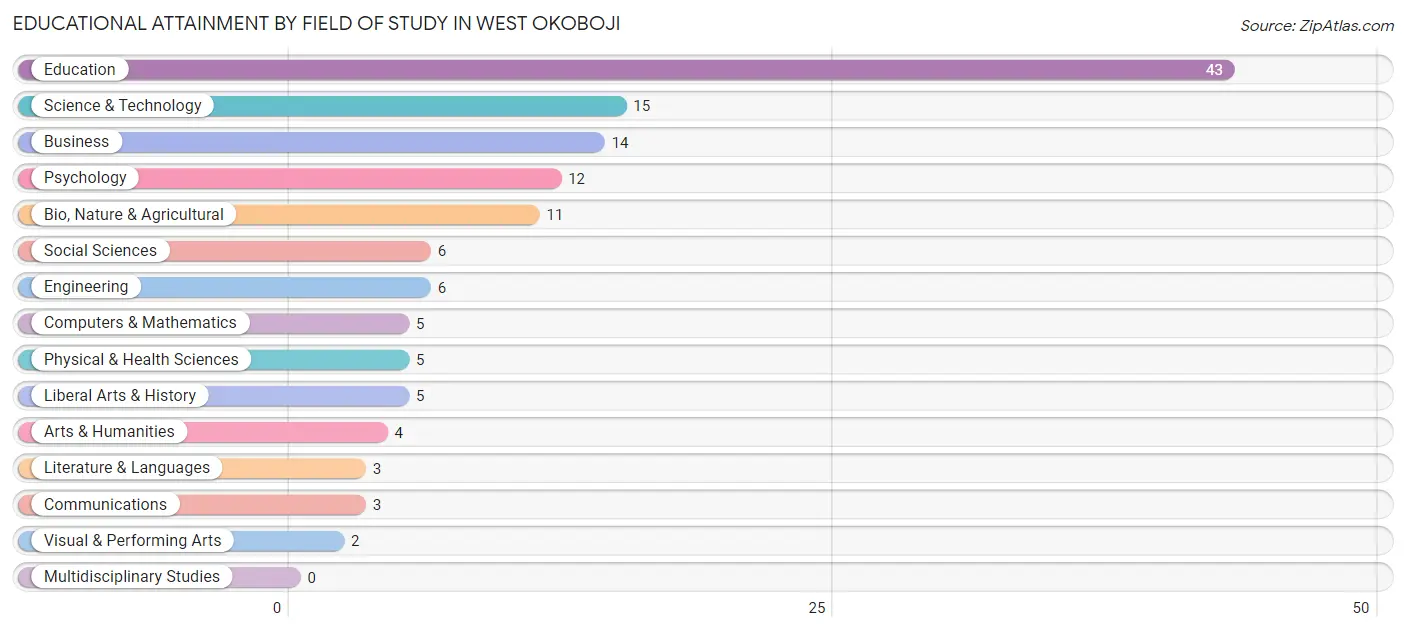
| Field of Study | # Graduates | % Graduates |
| Computers & Mathematics | 5 | 3.7% |
| Bio, Nature & Agricultural | 11 | 8.2% |
| Physical & Health Sciences | 5 | 3.7% |
| Psychology | 12 | 9.0% |
| Social Sciences | 6 | 4.5% |
| Engineering | 6 | 4.5% |
| Multidisciplinary Studies | 0 | 0.0% |
| Science & Technology | 15 | 11.2% |
| Business | 14 | 10.4% |
| Education | 43 | 32.1% |
| Literature & Languages | 3 | 2.2% |
| Liberal Arts & History | 5 | 3.7% |
| Visual & Performing Arts | 2 | 1.5% |
| Communications | 3 | 2.2% |
| Arts & Humanities | 4 | 3.0% |
| Total | 134 | 100.0% |
Transportation & Commute in West Okoboji
Vehicle Availability by Sex in West Okoboji
The most prevalent vehicle ownership categories in West Okoboji are males with 2 vehicles (36, accounting for 48.0%) and females with 2 vehicles (30, making up 58.1%).
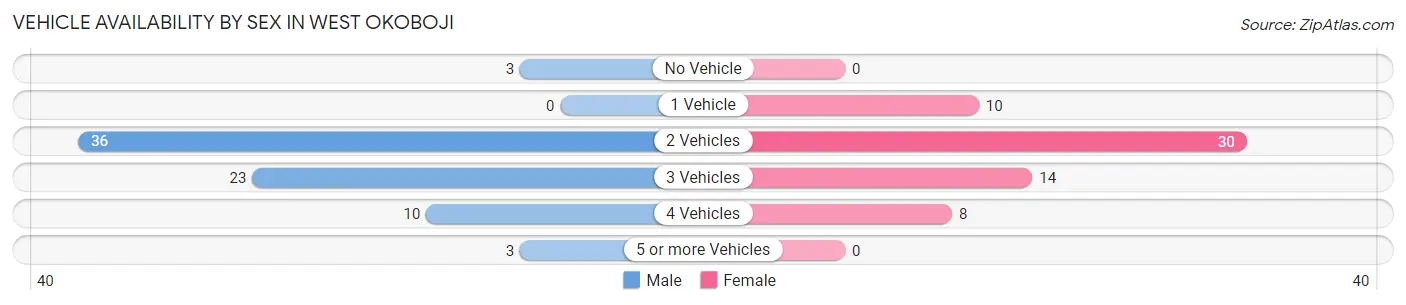
| Vehicles Available | Male | Female |
| No Vehicle | 3 (4.0%) | 0 (0.0%) |
| 1 Vehicle | 0 (0.0%) | 10 (16.1%) |
| 2 Vehicles | 36 (48.0%) | 30 (48.4%) |
| 3 Vehicles | 23 (30.7%) | 14 (22.6%) |
| 4 Vehicles | 10 (13.3%) | 8 (12.9%) |
| 5 or more Vehicles | 3 (4.0%) | 0 (0.0%) |
| Total | 75 (100.0%) | 62 (100.0%) |
Commute Time in West Okoboji
The most frequently occuring commute durations in West Okoboji are 20 to 24 minutes (38 commuters, 31.9%), 10 to 14 minutes (34 commuters, 28.6%), and 5 to 9 minutes (22 commuters, 18.5%).
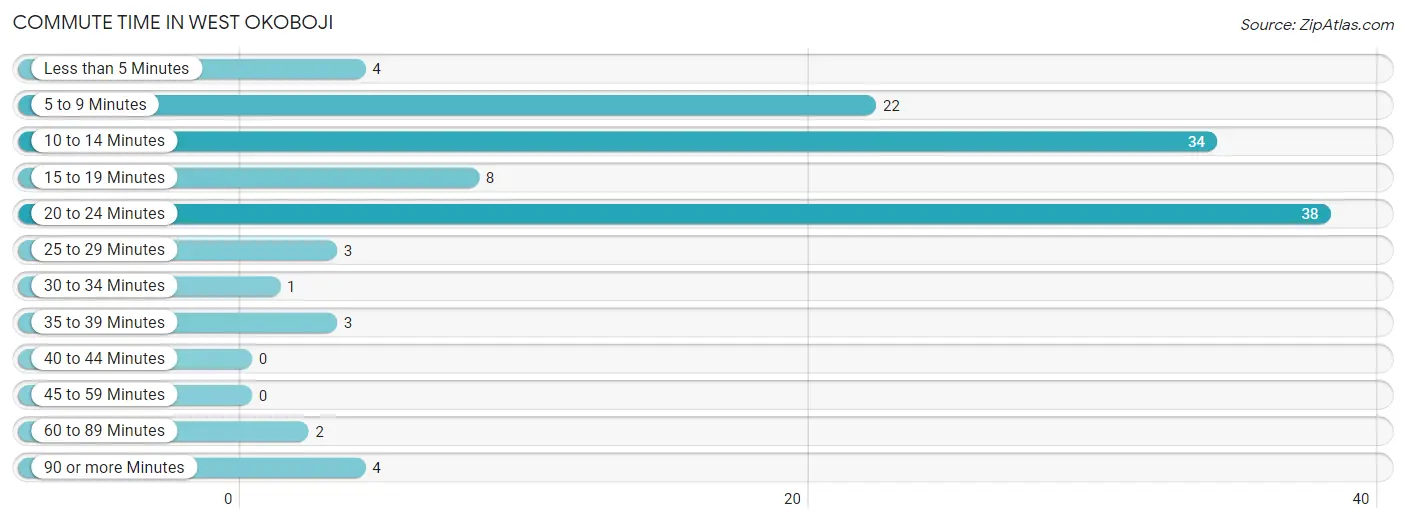
| Commute Time | # Commuters | % Commuters |
| Less than 5 Minutes | 4 | 3.4% |
| 5 to 9 Minutes | 22 | 18.5% |
| 10 to 14 Minutes | 34 | 28.6% |
| 15 to 19 Minutes | 8 | 6.7% |
| 20 to 24 Minutes | 38 | 31.9% |
| 25 to 29 Minutes | 3 | 2.5% |
| 30 to 34 Minutes | 1 | 0.8% |
| 35 to 39 Minutes | 3 | 2.5% |
| 40 to 44 Minutes | 0 | 0.0% |
| 45 to 59 Minutes | 0 | 0.0% |
| 60 to 89 Minutes | 2 | 1.7% |
| 90 or more Minutes | 4 | 3.4% |
Commute Time by Sex in West Okoboji
The most common commute times in West Okoboji are 10 to 14 minutes (29 commuters, 46.0%) for males and 20 to 24 minutes (20 commuters, 35.7%) for females.
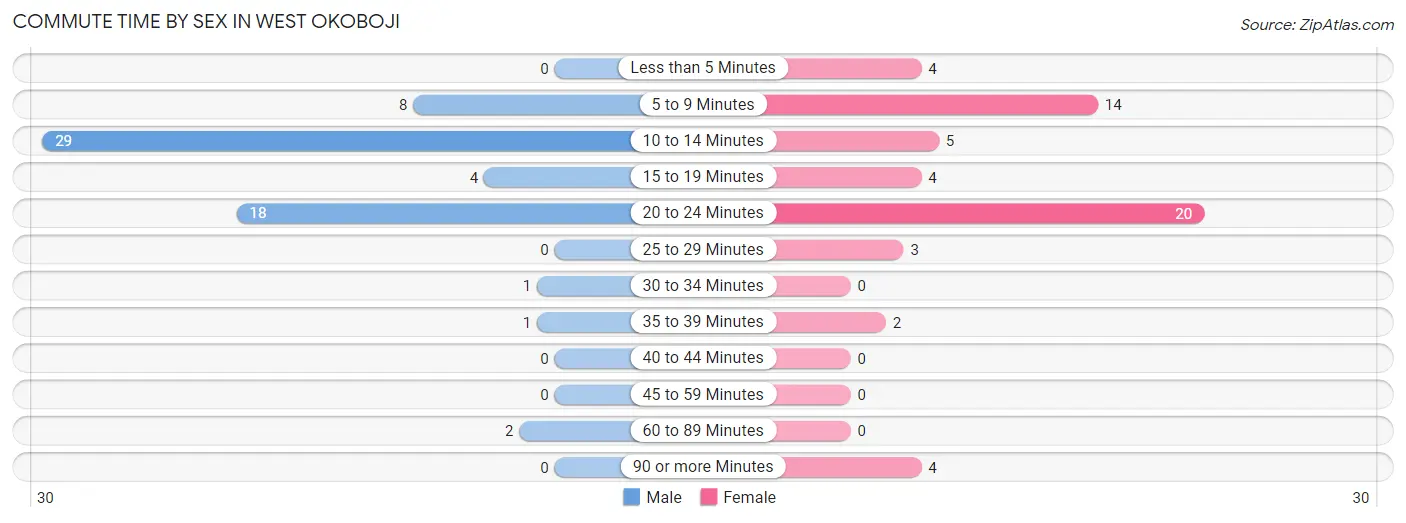
| Commute Time | Male | Female |
| Less than 5 Minutes | 0 (0.0%) | 4 (7.1%) |
| 5 to 9 Minutes | 8 (12.7%) | 14 (25.0%) |
| 10 to 14 Minutes | 29 (46.0%) | 5 (8.9%) |
| 15 to 19 Minutes | 4 (6.4%) | 4 (7.1%) |
| 20 to 24 Minutes | 18 (28.6%) | 20 (35.7%) |
| 25 to 29 Minutes | 0 (0.0%) | 3 (5.4%) |
| 30 to 34 Minutes | 1 (1.6%) | 0 (0.0%) |
| 35 to 39 Minutes | 1 (1.6%) | 2 (3.6%) |
| 40 to 44 Minutes | 0 (0.0%) | 0 (0.0%) |
| 45 to 59 Minutes | 0 (0.0%) | 0 (0.0%) |
| 60 to 89 Minutes | 2 (3.2%) | 0 (0.0%) |
| 90 or more Minutes | 0 (0.0%) | 4 (7.1%) |
Time of Departure to Work by Sex in West Okoboji
The most frequent times of departure to work in West Okoboji are 7:00 AM to 7:29 AM (25, 39.7%) for males and 7:30 AM to 7:59 AM (15, 26.8%) for females.
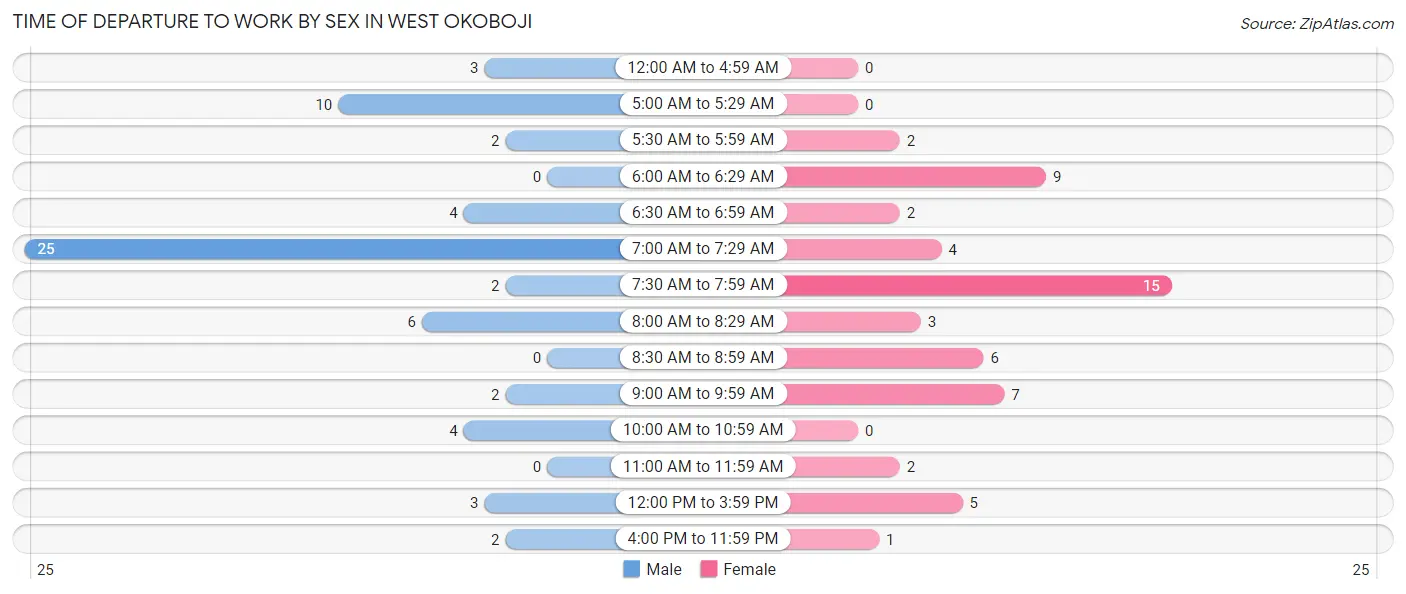
| Time of Departure | Male | Female |
| 12:00 AM to 4:59 AM | 3 (4.8%) | 0 (0.0%) |
| 5:00 AM to 5:29 AM | 10 (15.9%) | 0 (0.0%) |
| 5:30 AM to 5:59 AM | 2 (3.2%) | 2 (3.6%) |
| 6:00 AM to 6:29 AM | 0 (0.0%) | 9 (16.1%) |
| 6:30 AM to 6:59 AM | 4 (6.4%) | 2 (3.6%) |
| 7:00 AM to 7:29 AM | 25 (39.7%) | 4 (7.1%) |
| 7:30 AM to 7:59 AM | 2 (3.2%) | 15 (26.8%) |
| 8:00 AM to 8:29 AM | 6 (9.5%) | 3 (5.4%) |
| 8:30 AM to 8:59 AM | 0 (0.0%) | 6 (10.7%) |
| 9:00 AM to 9:59 AM | 2 (3.2%) | 7 (12.5%) |
| 10:00 AM to 10:59 AM | 4 (6.4%) | 0 (0.0%) |
| 11:00 AM to 11:59 AM | 0 (0.0%) | 2 (3.6%) |
| 12:00 PM to 3:59 PM | 3 (4.8%) | 5 (8.9%) |
| 4:00 PM to 11:59 PM | 2 (3.2%) | 1 (1.8%) |
| Total | 63 (100.0%) | 56 (100.0%) |
Housing Occupancy in West Okoboji
Occupancy by Ownership in West Okoboji
Of the total 184 dwellings in West Okoboji, owner-occupied units account for 138 (75.0%), while renter-occupied units make up 46 (25.0%).
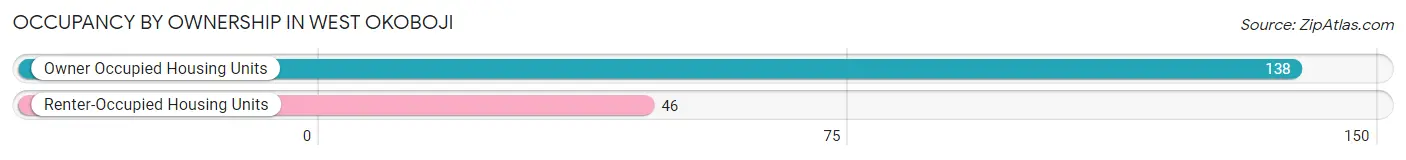
| Occupancy | # Housing Units | % Housing Units |
| Owner Occupied Housing Units | 138 | 75.0% |
| Renter-Occupied Housing Units | 46 | 25.0% |
| Total Occupied Housing Units | 184 | 100.0% |
Occupancy by Household Size in West Okoboji
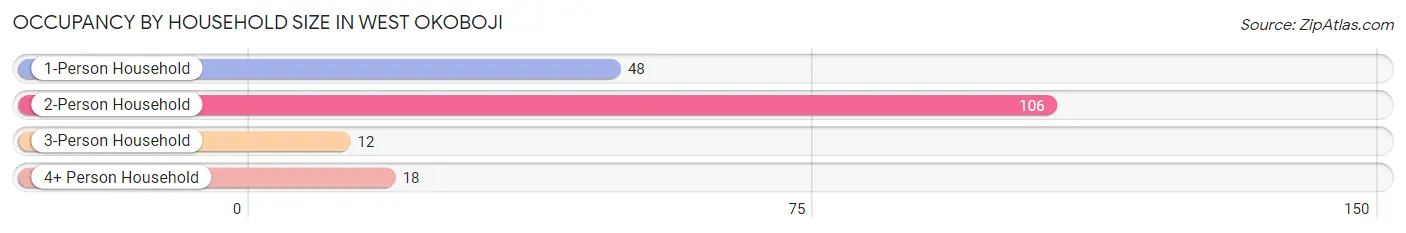
| Household Size | # Housing Units | % Housing Units |
| 1-Person Household | 48 | 26.1% |
| 2-Person Household | 106 | 57.6% |
| 3-Person Household | 12 | 6.5% |
| 4+ Person Household | 18 | 9.8% |
| Total Housing Units | 184 | 100.0% |
Occupancy by Ownership by Household Size in West Okoboji
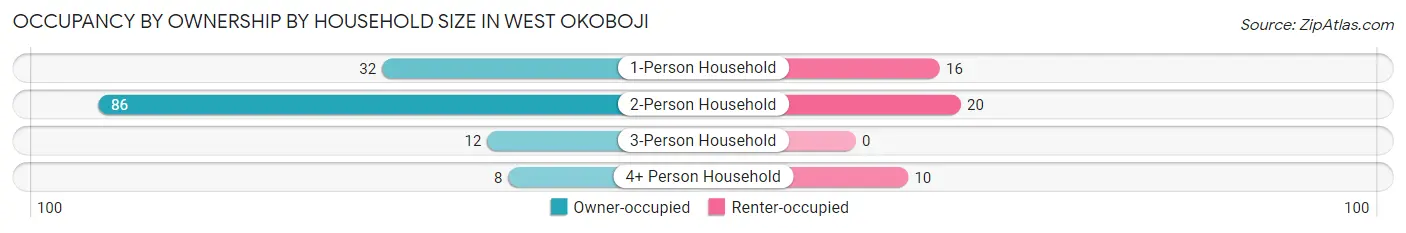
| Household Size | Owner-occupied | Renter-occupied |
| 1-Person Household | 32 (66.7%) | 16 (33.3%) |
| 2-Person Household | 86 (81.1%) | 20 (18.9%) |
| 3-Person Household | 12 (100.0%) | 0 (0.0%) |
| 4+ Person Household | 8 (44.4%) | 10 (55.6%) |
| Total Housing Units | 138 (75.0%) | 46 (25.0%) |
Occupancy by Educational Attainment in West Okoboji
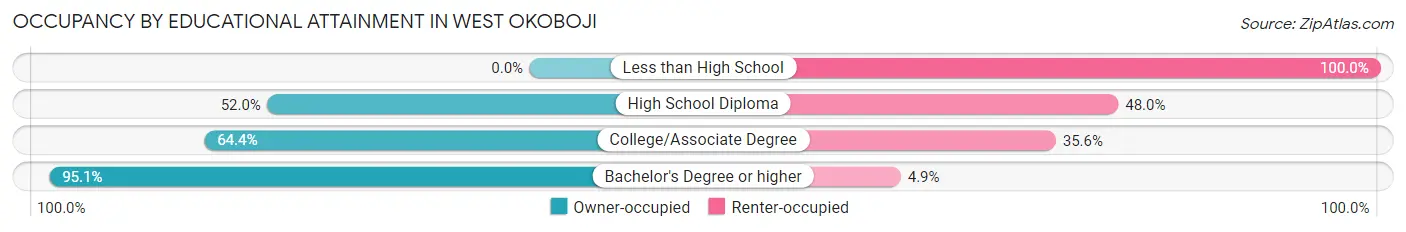
| Household Size | Owner-occupied | Renter-occupied |
| Less than High School | 0 (0.0%) | 4 (100.0%) |
| High School Diploma | 13 (52.0%) | 12 (48.0%) |
| College/Associate Degree | 47 (64.4%) | 26 (35.6%) |
| Bachelor's Degree or higher | 78 (95.1%) | 4 (4.9%) |
Occupancy by Age of Householder in West Okoboji
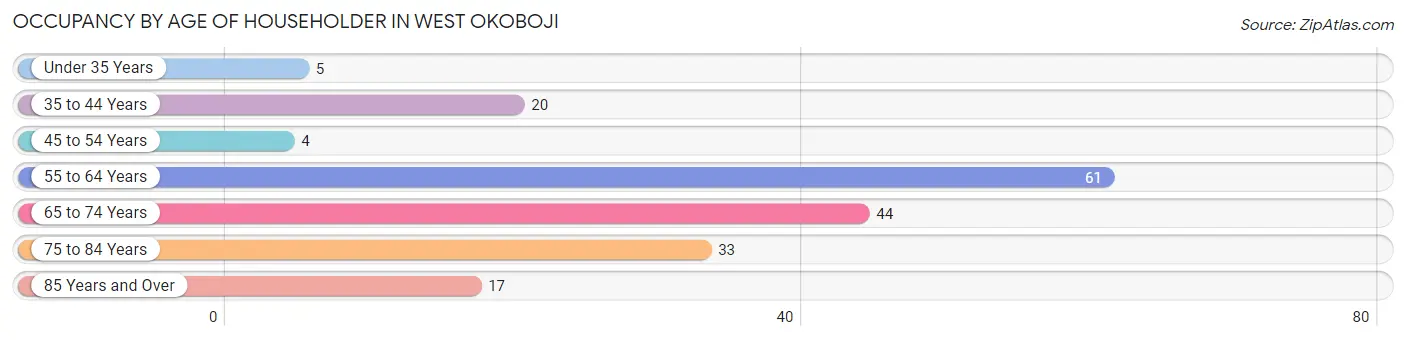
| Age Bracket | # Households | % Households |
| Under 35 Years | 5 | 2.7% |
| 35 to 44 Years | 20 | 10.9% |
| 45 to 54 Years | 4 | 2.2% |
| 55 to 64 Years | 61 | 33.2% |
| 65 to 74 Years | 44 | 23.9% |
| 75 to 84 Years | 33 | 17.9% |
| 85 Years and Over | 17 | 9.2% |
| Total | 184 | 100.0% |
Housing Finances in West Okoboji
Median Income by Occupancy in West Okoboji
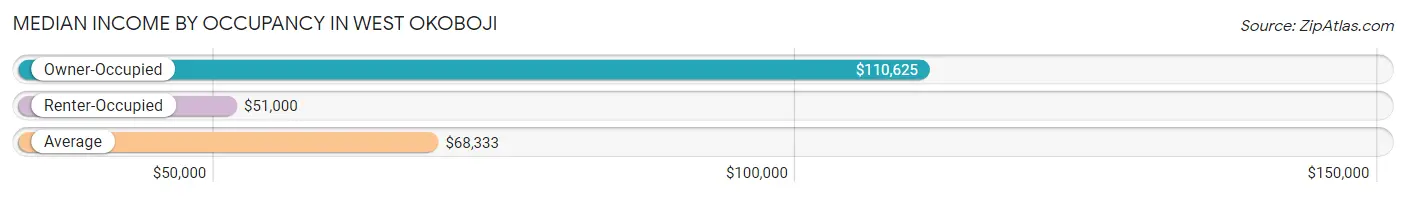
| Occupancy Type | # Households | Median Income |
| Owner-Occupied | 138 (75.0%) | $110,625 |
| Renter-Occupied | 46 (25.0%) | $51,000 |
| Average | 184 (100.0%) | $68,333 |
Occupancy by Householder Income Bracket in West Okoboji
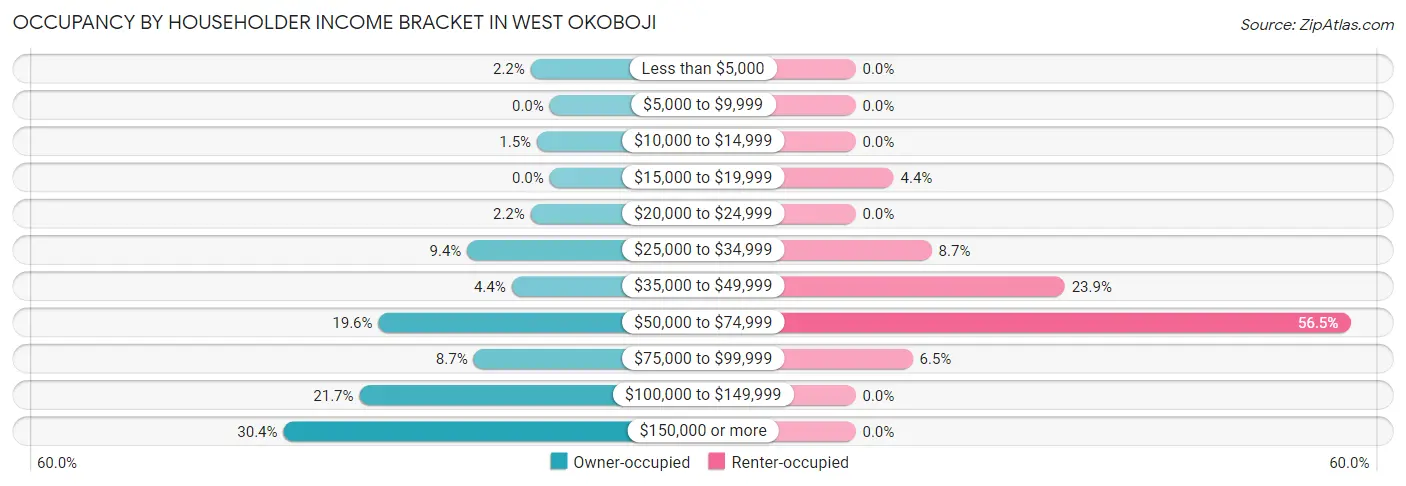
| Income Bracket | Owner-occupied | Renter-occupied |
| Less than $5,000 | 3 (2.2%) | 0 (0.0%) |
| $5,000 to $9,999 | 0 (0.0%) | 0 (0.0%) |
| $10,000 to $14,999 | 2 (1.5%) | 0 (0.0%) |
| $15,000 to $19,999 | 0 (0.0%) | 2 (4.3%) |
| $20,000 to $24,999 | 3 (2.2%) | 0 (0.0%) |
| $25,000 to $34,999 | 13 (9.4%) | 4 (8.7%) |
| $35,000 to $49,999 | 6 (4.3%) | 11 (23.9%) |
| $50,000 to $74,999 | 27 (19.6%) | 26 (56.5%) |
| $75,000 to $99,999 | 12 (8.7%) | 3 (6.5%) |
| $100,000 to $149,999 | 30 (21.7%) | 0 (0.0%) |
| $150,000 or more | 42 (30.4%) | 0 (0.0%) |
| Total | 138 (100.0%) | 46 (100.0%) |
Monthly Housing Cost Tiers in West Okoboji
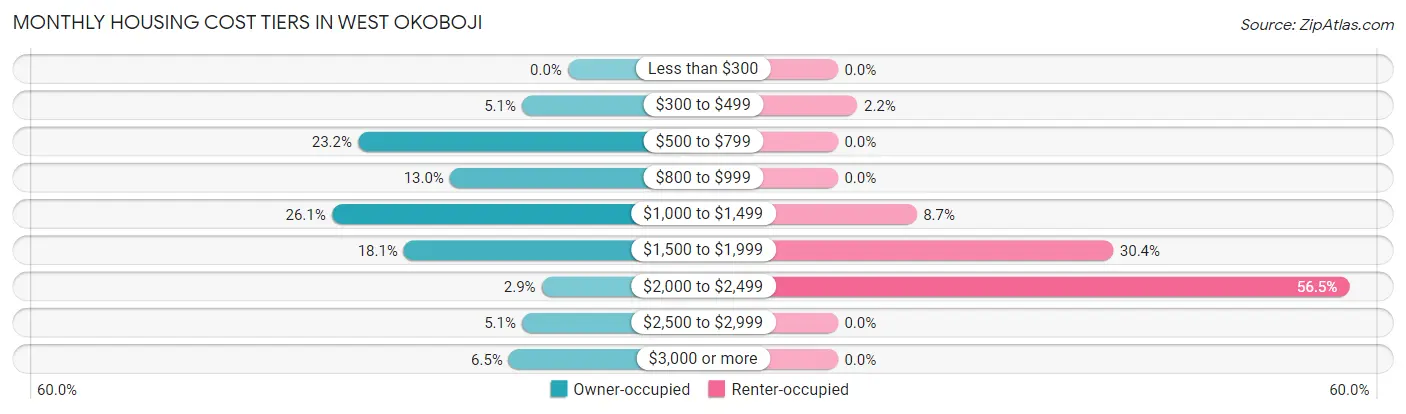
| Monthly Cost | Owner-occupied | Renter-occupied |
| Less than $300 | 0 (0.0%) | 0 (0.0%) |
| $300 to $499 | 7 (5.1%) | 1 (2.2%) |
| $500 to $799 | 32 (23.2%) | 0 (0.0%) |
| $800 to $999 | 18 (13.0%) | 0 (0.0%) |
| $1,000 to $1,499 | 36 (26.1%) | 4 (8.7%) |
| $1,500 to $1,999 | 25 (18.1%) | 14 (30.4%) |
| $2,000 to $2,499 | 4 (2.9%) | 26 (56.5%) |
| $2,500 to $2,999 | 7 (5.1%) | 0 (0.0%) |
| $3,000 or more | 9 (6.5%) | 0 (0.0%) |
| Total | 138 (100.0%) | 46 (100.0%) |
Physical Housing Characteristics in West Okoboji
Housing Structures in West Okoboji
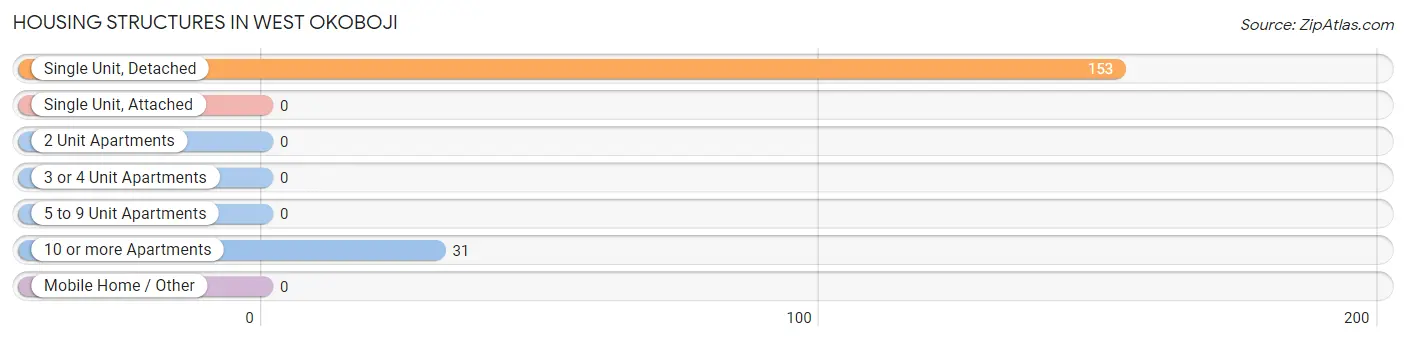
| Structure Type | # Housing Units | % Housing Units |
| Single Unit, Detached | 153 | 83.2% |
| Single Unit, Attached | 0 | 0.0% |
| 2 Unit Apartments | 0 | 0.0% |
| 3 or 4 Unit Apartments | 0 | 0.0% |
| 5 to 9 Unit Apartments | 0 | 0.0% |
| 10 or more Apartments | 31 | 16.9% |
| Mobile Home / Other | 0 | 0.0% |
| Total | 184 | 100.0% |
Housing Structures by Occupancy in West Okoboji
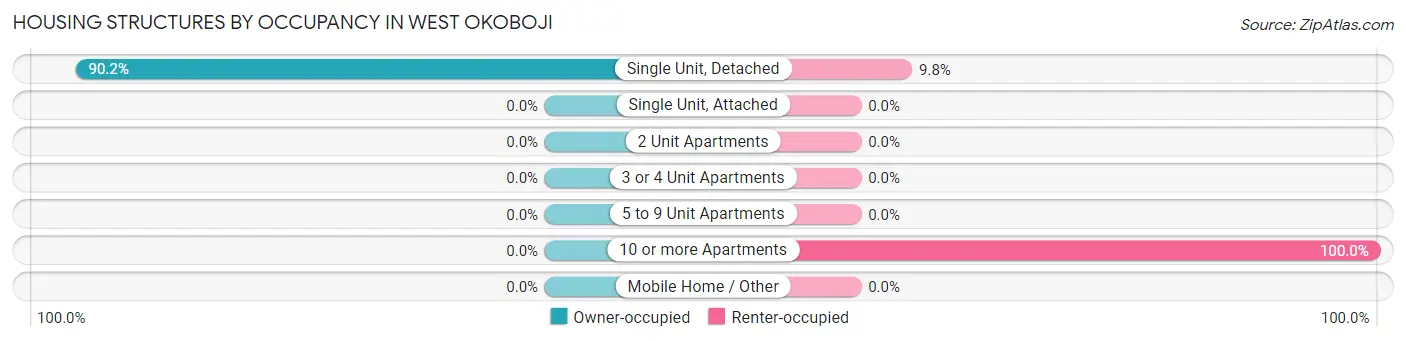
| Structure Type | Owner-occupied | Renter-occupied |
| Single Unit, Detached | 138 (90.2%) | 15 (9.8%) |
| Single Unit, Attached | 0 (0.0%) | 0 (0.0%) |
| 2 Unit Apartments | 0 (0.0%) | 0 (0.0%) |
| 3 or 4 Unit Apartments | 0 (0.0%) | 0 (0.0%) |
| 5 to 9 Unit Apartments | 0 (0.0%) | 0 (0.0%) |
| 10 or more Apartments | 0 (0.0%) | 31 (100.0%) |
| Mobile Home / Other | 0 (0.0%) | 0 (0.0%) |
| Total | 138 (75.0%) | 46 (25.0%) |
Housing Structures by Number of Rooms in West Okoboji
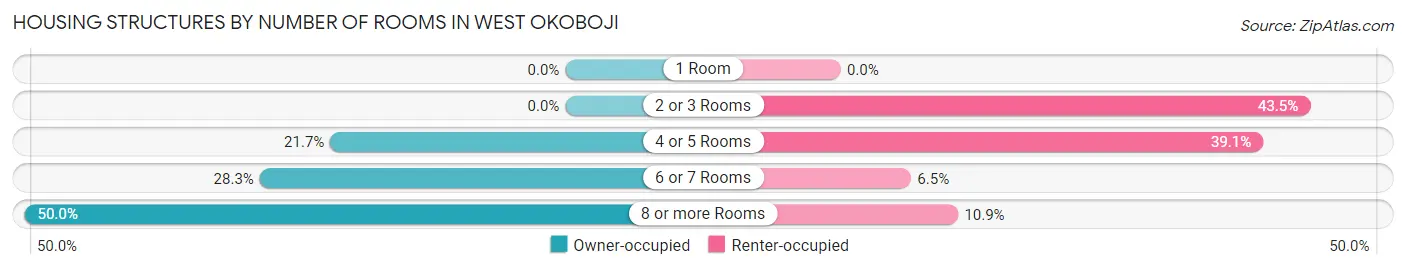
| Number of Rooms | Owner-occupied | Renter-occupied |
| 1 Room | 0 (0.0%) | 0 (0.0%) |
| 2 or 3 Rooms | 0 (0.0%) | 20 (43.5%) |
| 4 or 5 Rooms | 30 (21.7%) | 18 (39.1%) |
| 6 or 7 Rooms | 39 (28.3%) | 3 (6.5%) |
| 8 or more Rooms | 69 (50.0%) | 5 (10.9%) |
| Total | 138 (100.0%) | 46 (100.0%) |
Housing Structure by Heating Type in West Okoboji
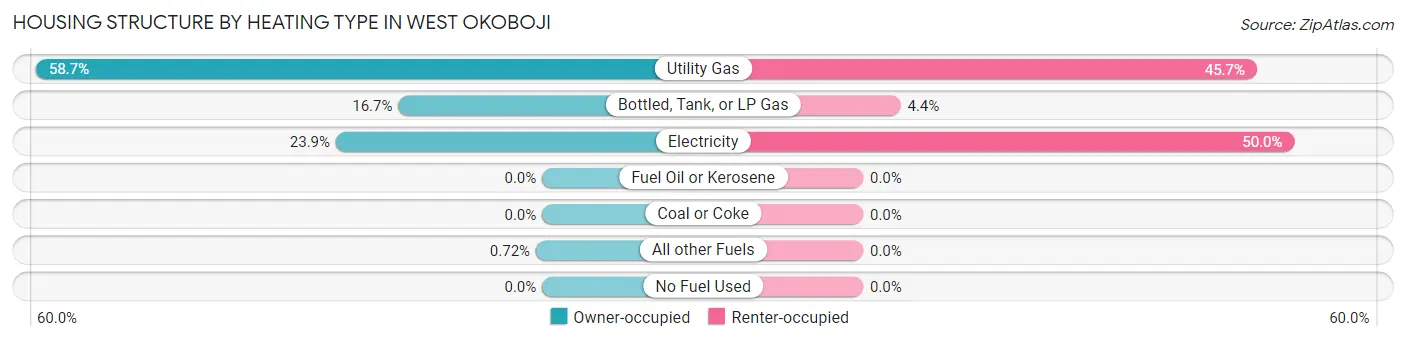
| Heating Type | Owner-occupied | Renter-occupied |
| Utility Gas | 81 (58.7%) | 21 (45.7%) |
| Bottled, Tank, or LP Gas | 23 (16.7%) | 2 (4.3%) |
| Electricity | 33 (23.9%) | 23 (50.0%) |
| Fuel Oil or Kerosene | 0 (0.0%) | 0 (0.0%) |
| Coal or Coke | 0 (0.0%) | 0 (0.0%) |
| All other Fuels | 1 (0.7%) | 0 (0.0%) |
| No Fuel Used | 0 (0.0%) | 0 (0.0%) |
| Total | 138 (100.0%) | 46 (100.0%) |
Household Vehicle Usage in West Okoboji
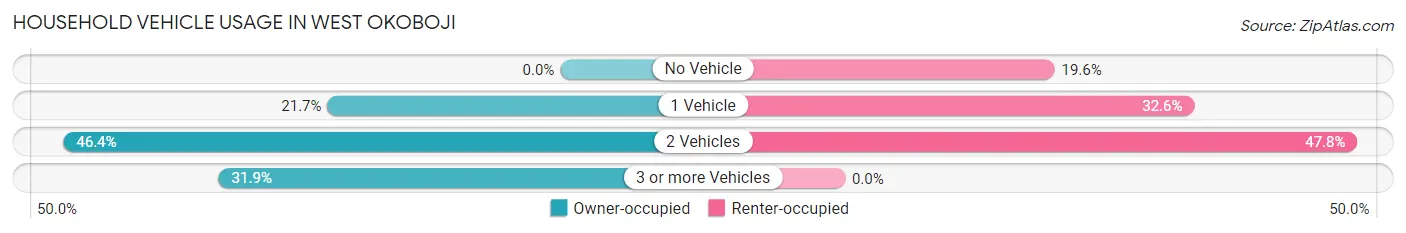
| Vehicles per Household | Owner-occupied | Renter-occupied |
| No Vehicle | 0 (0.0%) | 9 (19.6%) |
| 1 Vehicle | 30 (21.7%) | 15 (32.6%) |
| 2 Vehicles | 64 (46.4%) | 22 (47.8%) |
| 3 or more Vehicles | 44 (31.9%) | 0 (0.0%) |
| Total | 138 (100.0%) | 46 (100.0%) |
Real Estate & Mortgages in West Okoboji
Real Estate and Mortgage Overview in West Okoboji
| Characteristic | Without Mortgage | With Mortgage |
| Housing Units | 102 | 36 |
| Median Property Value | $517,900 | $583,300 |
| Median Household Income | $97,500 | $17 |
| Monthly Housing Costs | $956 | $9 |
| Real Estate Taxes | $5,000 | $0 |
Property Value by Mortgage Status in West Okoboji
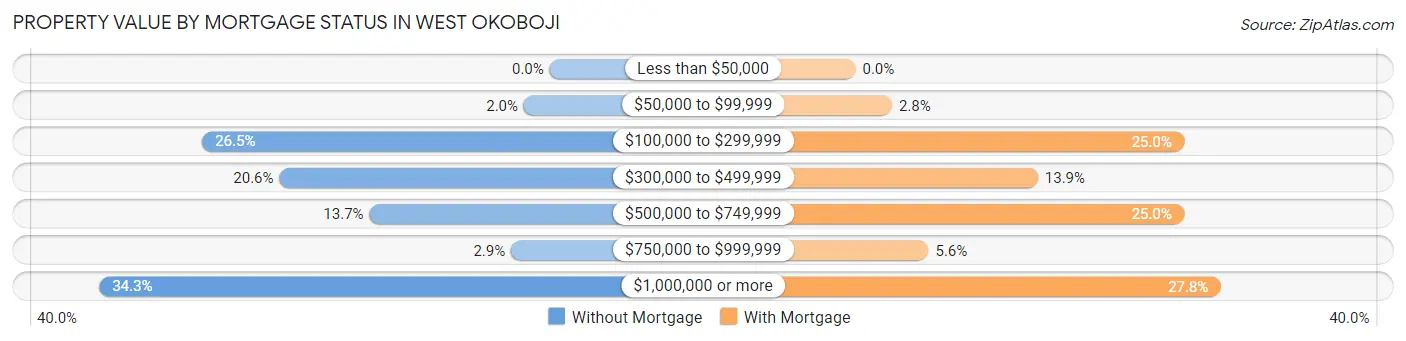
| Property Value | Without Mortgage | With Mortgage |
| Less than $50,000 | 0 (0.0%) | 0 (0.0%) |
| $50,000 to $99,999 | 2 (2.0%) | 1 (2.8%) |
| $100,000 to $299,999 | 27 (26.5%) | 9 (25.0%) |
| $300,000 to $499,999 | 21 (20.6%) | 5 (13.9%) |
| $500,000 to $749,999 | 14 (13.7%) | 9 (25.0%) |
| $750,000 to $999,999 | 3 (2.9%) | 2 (5.6%) |
| $1,000,000 or more | 35 (34.3%) | 10 (27.8%) |
| Total | 102 (100.0%) | 36 (100.0%) |
Household Income by Mortgage Status in West Okoboji
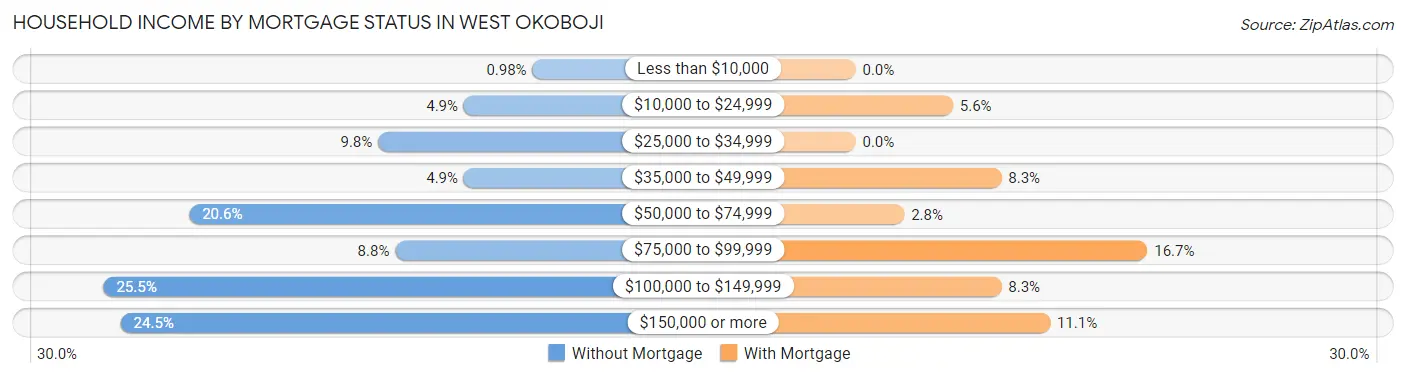
| Household Income | Without Mortgage | With Mortgage |
| Less than $10,000 | 1 (1.0%) | 0 (0.0%) |
| $10,000 to $24,999 | 5 (4.9%) | 2 (5.6%) |
| $25,000 to $34,999 | 10 (9.8%) | 0 (0.0%) |
| $35,000 to $49,999 | 5 (4.9%) | 3 (8.3%) |
| $50,000 to $74,999 | 21 (20.6%) | 1 (2.8%) |
| $75,000 to $99,999 | 9 (8.8%) | 6 (16.7%) |
| $100,000 to $149,999 | 26 (25.5%) | 3 (8.3%) |
| $150,000 or more | 25 (24.5%) | 4 (11.1%) |
| Total | 102 (100.0%) | 36 (100.0%) |
Property Value to Household Income Ratio in West Okoboji
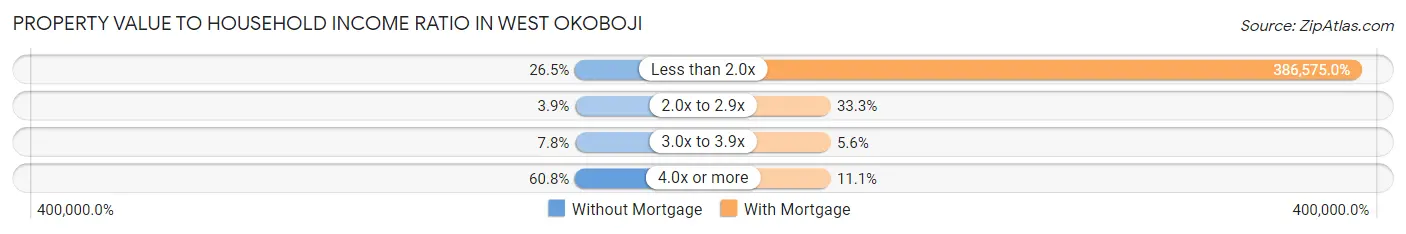
| Value-to-Income Ratio | Without Mortgage | With Mortgage |
| Less than 2.0x | 27 (26.5%) | 139,167 (386,575.0%) |
| 2.0x to 2.9x | 4 (3.9%) | 12 (33.3%) |
| 3.0x to 3.9x | 8 (7.8%) | 2 (5.6%) |
| 4.0x or more | 62 (60.8%) | 4 (11.1%) |
| Total | 102 (100.0%) | 36 (100.0%) |
Real Estate Taxes by Mortgage Status in West Okoboji
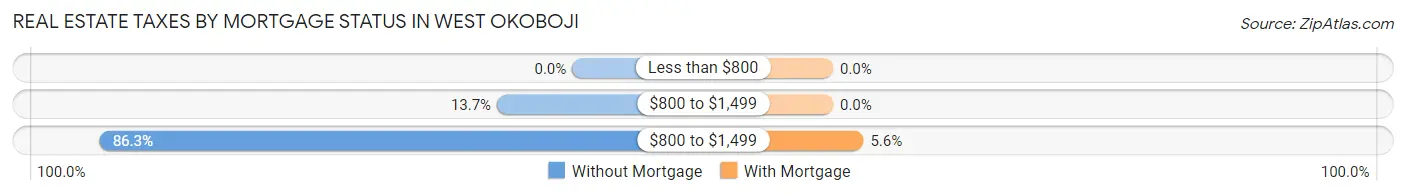
| Property Taxes | Without Mortgage | With Mortgage |
| Less than $800 | 0 (0.0%) | 0 (0.0%) |
| $800 to $1,499 | 14 (13.7%) | 0 (0.0%) |
| $800 to $1,499 | 88 (86.3%) | 2 (5.6%) |
| Total | 102 (100.0%) | 36 (100.0%) |
Health & Disability in West Okoboji
Health Insurance Coverage by Age in West Okoboji
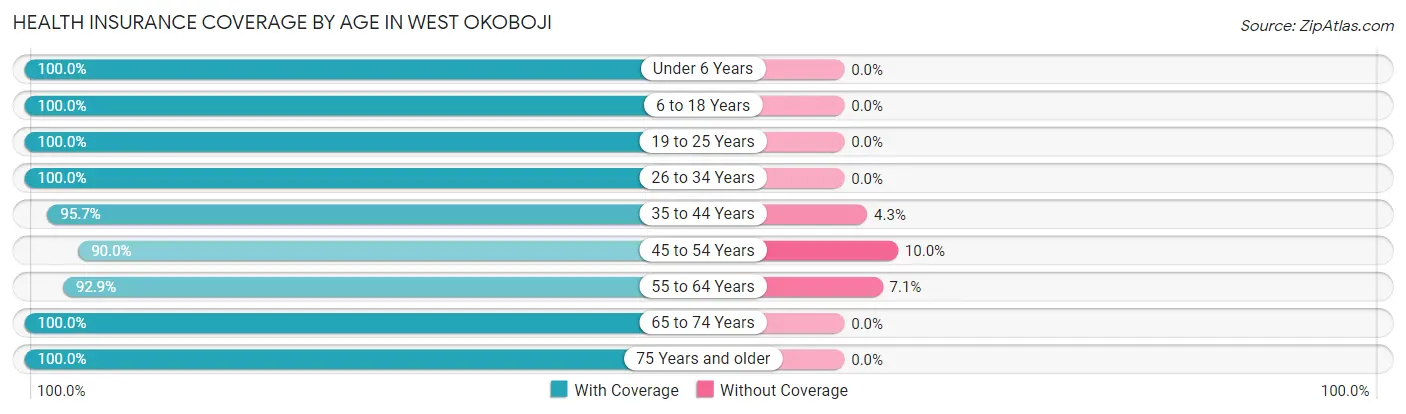
| Age Bracket | With Coverage | Without Coverage |
| Under 6 Years | 14 (100.0%) | 0 (0.0%) |
| 6 to 18 Years | 33 (100.0%) | 0 (0.0%) |
| 19 to 25 Years | 3 (100.0%) | 0 (0.0%) |
| 26 to 34 Years | 10 (100.0%) | 0 (0.0%) |
| 35 to 44 Years | 45 (95.7%) | 2 (4.3%) |
| 45 to 54 Years | 9 (90.0%) | 1 (10.0%) |
| 55 to 64 Years | 78 (92.9%) | 6 (7.1%) |
| 65 to 74 Years | 78 (100.0%) | 0 (0.0%) |
| 75 Years and older | 76 (100.0%) | 0 (0.0%) |
| Total | 346 (97.5%) | 9 (2.5%) |
Health Insurance Coverage by Citizenship Status in West Okoboji
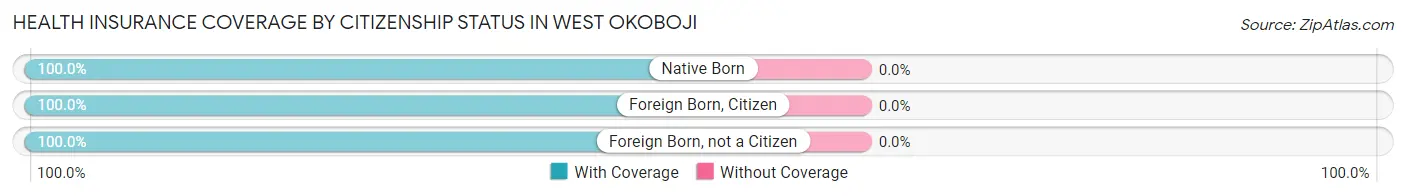
| Citizenship Status | With Coverage | Without Coverage |
| Native Born | 14 (100.0%) | 0 (0.0%) |
| Foreign Born, Citizen | 33 (100.0%) | 0 (0.0%) |
| Foreign Born, not a Citizen | 3 (100.0%) | 0 (0.0%) |
Health Insurance Coverage by Household Income in West Okoboji
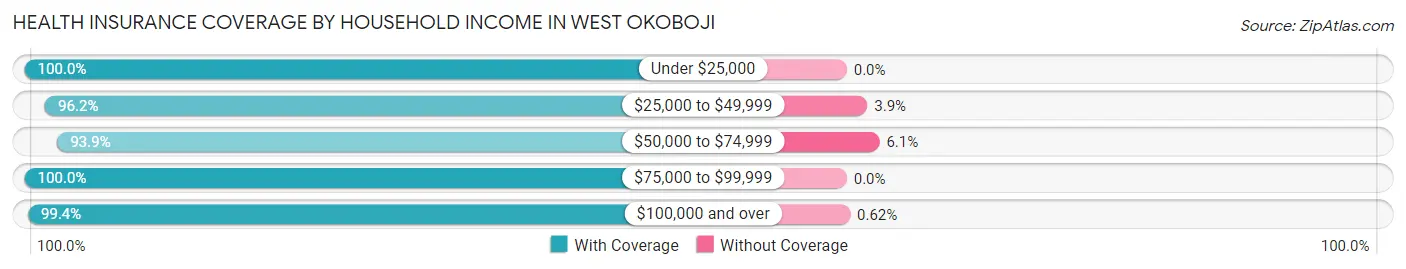
| Household Income | With Coverage | Without Coverage |
| Under $25,000 | 13 (100.0%) | 0 (0.0%) |
| $25,000 to $49,999 | 50 (96.2%) | 2 (3.8%) |
| $50,000 to $74,999 | 92 (93.9%) | 6 (6.1%) |
| $75,000 to $99,999 | 31 (100.0%) | 0 (0.0%) |
| $100,000 and over | 160 (99.4%) | 1 (0.6%) |
Public vs Private Health Insurance Coverage by Age in West Okoboji
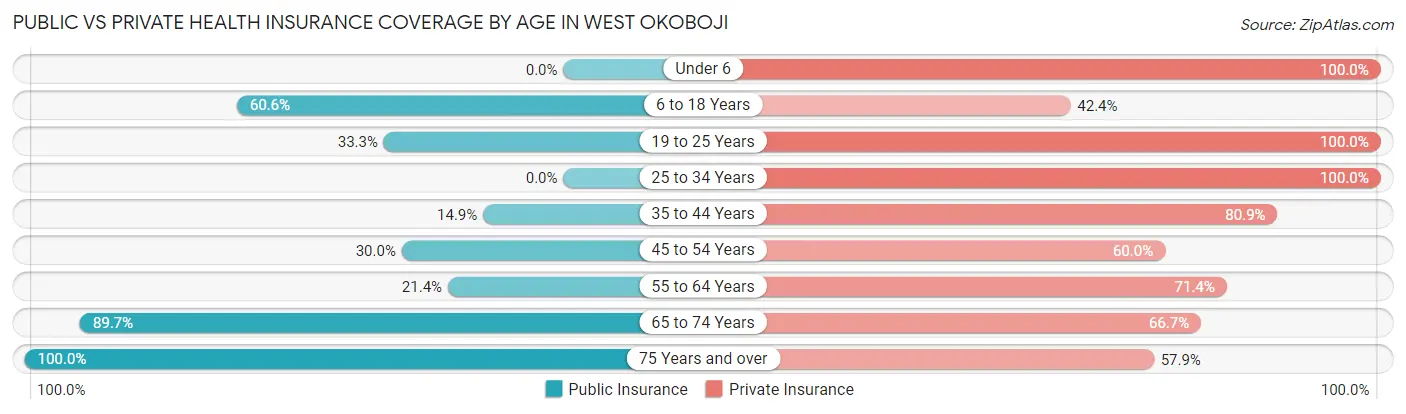
| Age Bracket | Public Insurance | Private Insurance |
| Under 6 | 0 (0.0%) | 14 (100.0%) |
| 6 to 18 Years | 20 (60.6%) | 14 (42.4%) |
| 19 to 25 Years | 1 (33.3%) | 3 (100.0%) |
| 25 to 34 Years | 0 (0.0%) | 10 (100.0%) |
| 35 to 44 Years | 7 (14.9%) | 38 (80.8%) |
| 45 to 54 Years | 3 (30.0%) | 6 (60.0%) |
| 55 to 64 Years | 18 (21.4%) | 60 (71.4%) |
| 65 to 74 Years | 70 (89.7%) | 52 (66.7%) |
| 75 Years and over | 76 (100.0%) | 44 (57.9%) |
| Total | 195 (54.9%) | 241 (67.9%) |
Disability Status by Sex by Age in West Okoboji
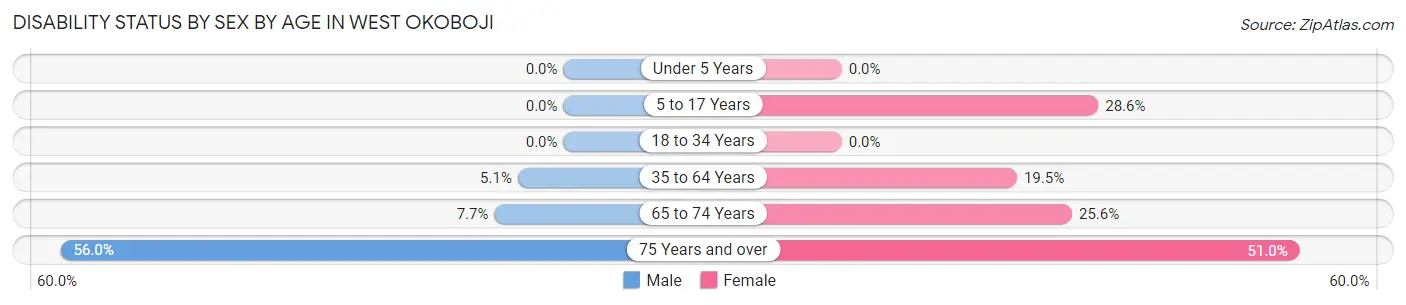
| Age Bracket | Male | Female |
| Under 5 Years | 0 (0.0%) | 0 (0.0%) |
| 5 to 17 Years | 0 (0.0%) | 2 (28.6%) |
| 18 to 34 Years | 0 (0.0%) | 0 (0.0%) |
| 35 to 64 Years | 3 (5.1%) | 16 (19.5%) |
| 65 to 74 Years | 3 (7.7%) | 10 (25.6%) |
| 75 Years and over | 14 (56.0%) | 26 (51.0%) |
Disability Class by Sex by Age in West Okoboji
Disability Class: Hearing Difficulty
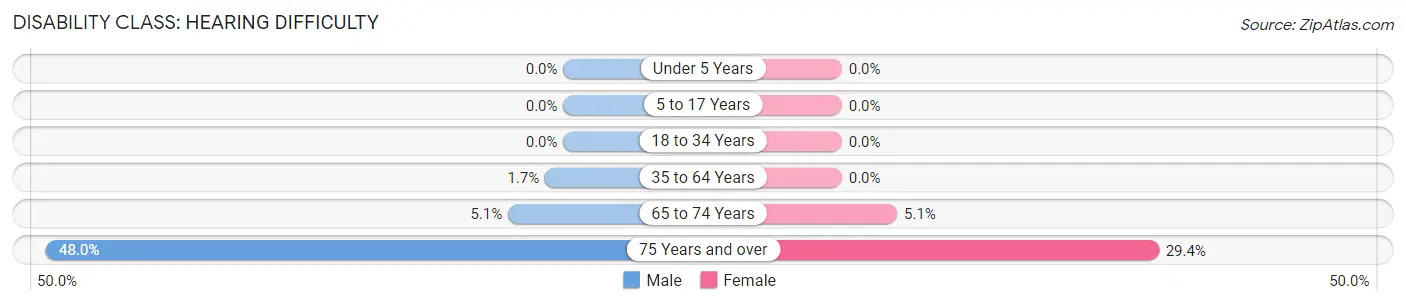
| Age Bracket | Male | Female |
| Under 5 Years | 0 (0.0%) | 0 (0.0%) |
| 5 to 17 Years | 0 (0.0%) | 0 (0.0%) |
| 18 to 34 Years | 0 (0.0%) | 0 (0.0%) |
| 35 to 64 Years | 1 (1.7%) | 0 (0.0%) |
| 65 to 74 Years | 2 (5.1%) | 2 (5.1%) |
| 75 Years and over | 12 (48.0%) | 15 (29.4%) |
Disability Class: Vision Difficulty
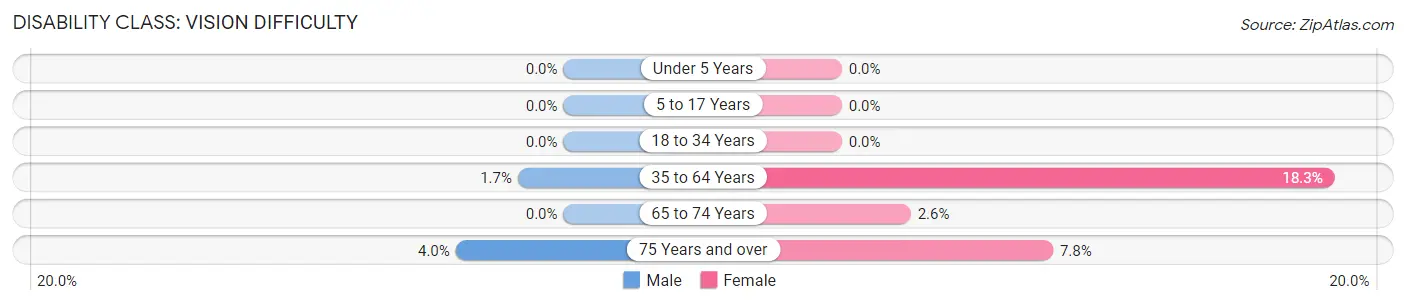
| Age Bracket | Male | Female |
| Under 5 Years | 0 (0.0%) | 0 (0.0%) |
| 5 to 17 Years | 0 (0.0%) | 0 (0.0%) |
| 18 to 34 Years | 0 (0.0%) | 0 (0.0%) |
| 35 to 64 Years | 1 (1.7%) | 15 (18.3%) |
| 65 to 74 Years | 0 (0.0%) | 1 (2.6%) |
| 75 Years and over | 1 (4.0%) | 4 (7.8%) |
Disability Class: Cognitive Difficulty
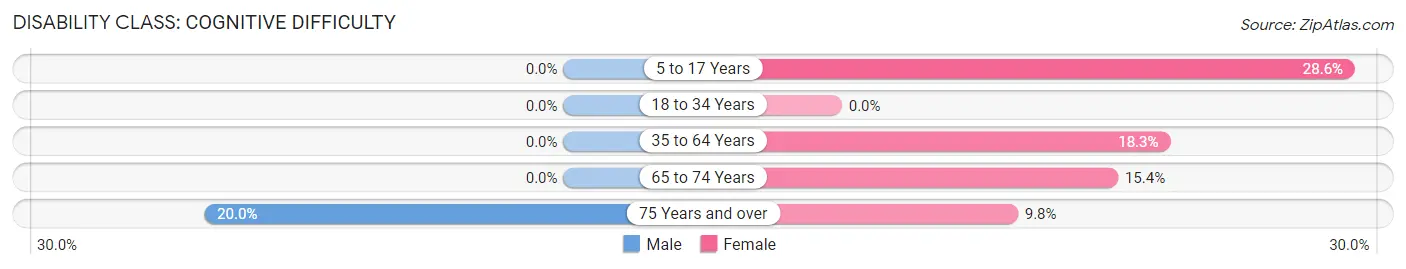
| Age Bracket | Male | Female |
| 5 to 17 Years | 0 (0.0%) | 2 (28.6%) |
| 18 to 34 Years | 0 (0.0%) | 0 (0.0%) |
| 35 to 64 Years | 0 (0.0%) | 15 (18.3%) |
| 65 to 74 Years | 0 (0.0%) | 6 (15.4%) |
| 75 Years and over | 5 (20.0%) | 5 (9.8%) |
Disability Class: Ambulatory Difficulty
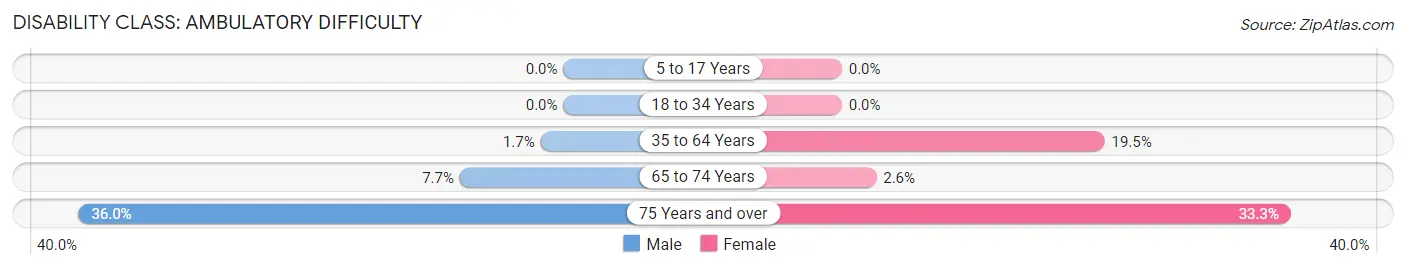
| Age Bracket | Male | Female |
| 5 to 17 Years | 0 (0.0%) | 0 (0.0%) |
| 18 to 34 Years | 0 (0.0%) | 0 (0.0%) |
| 35 to 64 Years | 1 (1.7%) | 16 (19.5%) |
| 65 to 74 Years | 3 (7.7%) | 1 (2.6%) |
| 75 Years and over | 9 (36.0%) | 17 (33.3%) |
Disability Class: Self-Care Difficulty
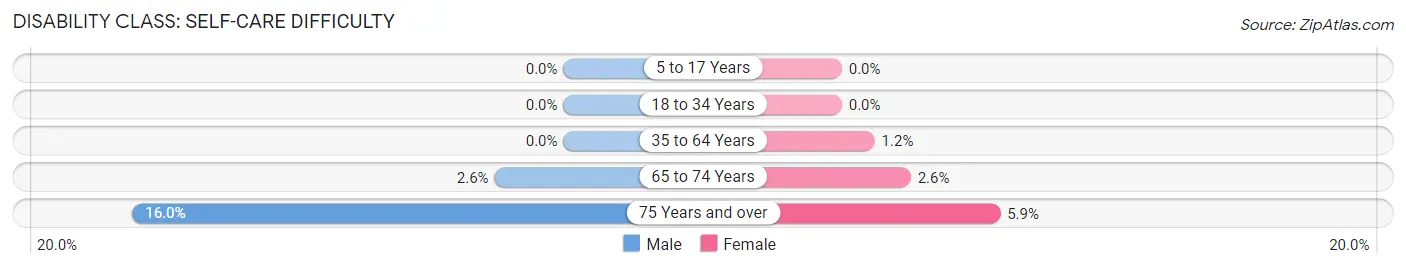
| Age Bracket | Male | Female |
| 5 to 17 Years | 0 (0.0%) | 0 (0.0%) |
| 18 to 34 Years | 0 (0.0%) | 0 (0.0%) |
| 35 to 64 Years | 0 (0.0%) | 1 (1.2%) |
| 65 to 74 Years | 1 (2.6%) | 1 (2.6%) |
| 75 Years and over | 4 (16.0%) | 3 (5.9%) |
Technology Access in West Okoboji
Computing Device Access in West Okoboji
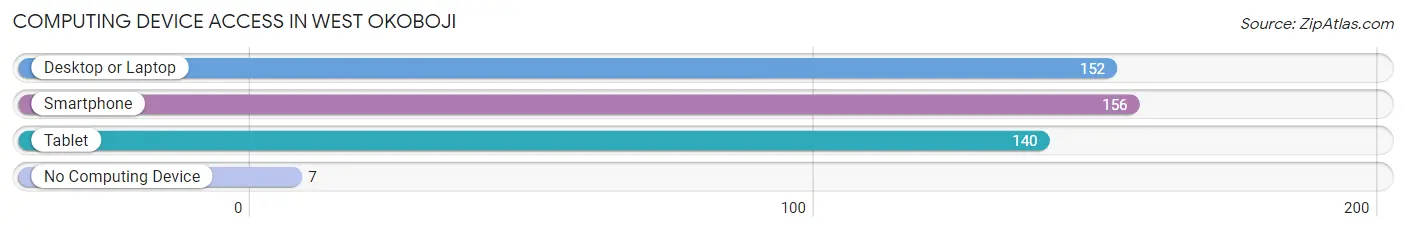
| Device Type | # Households | % Households |
| Desktop or Laptop | 152 | 82.6% |
| Smartphone | 156 | 84.8% |
| Tablet | 140 | 76.1% |
| No Computing Device | 7 | 3.8% |
| Total | 184 | 100.0% |
Internet Access in West Okoboji
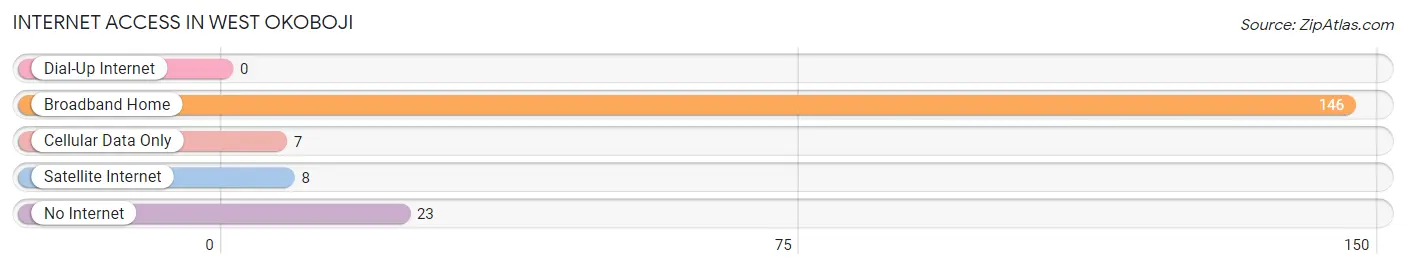
| Internet Type | # Households | % Households |
| Dial-Up Internet | 0 | 0.0% |
| Broadband Home | 146 | 79.3% |
| Cellular Data Only | 7 | 3.8% |
| Satellite Internet | 8 | 4.3% |
| No Internet | 23 | 12.5% |
| Total | 184 | 100.0% |
West Okoboji Summary
Okoboji is a small city located in Dickinson County, Iowa, United States. It is situated on the western shore of West Okoboji Lake, one of the five glacial lakes known as the Iowa Great Lakes. The city is part of the Iowa Great Lakes region, which is a popular tourist destination in the Midwest. The city has a population of 1,845 as of the 2010 census.
History
The area around West Okoboji was first settled by Native Americans, who used the lake for fishing and hunting. The first white settlers arrived in the area in the 1840s, and the town of West Okoboji was officially established in 1856. The town was named after the lake, which was named after the Ojibwe word for “deep water”.
The city was a popular tourist destination in the late 19th and early 20th centuries, and it was home to several resorts and hotels. The city was also home to a number of amusement parks, including the Okoboji Amusement Park, which opened in 1895 and closed in the 1950s.
Geography
West Okoboji is located at 43°25′N 95°20′W (43.4167, -95.3333). The city is situated on the western shore of West Okoboji Lake, which is part of the Iowa Great Lakes. The lake is approximately 5 miles long and 1 mile wide. The city is surrounded by wooded hills and is located in a rural area.
Economy
The economy of West Okoboji is largely based on tourism. The city is a popular destination for fishing, boating, swimming, and other outdoor activities. The city is also home to several resorts and hotels, as well as a number of restaurants and shops.
Demographics
As of the 2010 census, there were 1,845 people, 790 households, and 486 families residing in the city. The population density was 1,092.3 people per square mile (422.2/km2). The racial makeup of the city was 97.2% White, 0.2% African American, 0.2% Native American, 0.7% Asian, 0.1% Pacific Islander, 0.7% from other races, and 0.9% from two or more races. Hispanic or Latino of any race were 1.7% of the population.
The median income for a household in the city was $41,250, and the median income for a family was $50,000. Males had a median income of $35,000 versus $25,000 for females. The per capita income for the city was $20,945. About 5.2% of families and 8.2% of the population were below the poverty line, including 10.2% of those under age 18 and 6.3% of those age 65 or over.
Common Questions
What is Per Capita Income in West Okoboji?
Per Capita income in West Okoboji is $67,404.
What is the Median Family Income in West Okoboji?
Median Family Income in West Okoboji is $86,250.
What is the Median Household income in West Okoboji?
Median Household Income in West Okoboji is $68,333.
What is Inequality or Gini Index in West Okoboji?
Inequality or Gini Index in West Okoboji is 0.53.
What is the Total Population of West Okoboji?
Total Population of West Okoboji is 357.
What is the Total Male Population of West Okoboji?
Total Male Population of West Okoboji is 155.
What is the Total Female Population of West Okoboji?
Total Female Population of West Okoboji is 202.
What is the Ratio of Males per 100 Females in West Okoboji?
There are 76.73 Males per 100 Females in West Okoboji.
What is the Ratio of Females per 100 Males in West Okoboji?
There are 130.32 Females per 100 Males in West Okoboji.
What is the Median Population Age in West Okoboji?
Median Population Age in West Okoboji is 63.3 Years.
What is the Average Family Size in West Okoboji
Average Family Size in West Okoboji is 2.2 People.
What is the Average Household Size in West Okoboji
Average Household Size in West Okoboji is 1.9 People.
How Large is the Labor Force in West Okoboji?
There are 143 People in the Labor Forcein in West Okoboji.
What is the Percentage of People in the Labor Force in West Okoboji?
45.3% of People are in the Labor Force in West Okoboji.
What is the Unemployment Rate in West Okoboji?
Unemployment Rate in West Okoboji is 1.4%.