Zip Codes with the Highest Percentage of Households with Income Above $200,000 in Waterloo, IA
RELATED REPORTS & OPTIONS
Household Income | $200k+
Waterloo
Compare Zip Codes
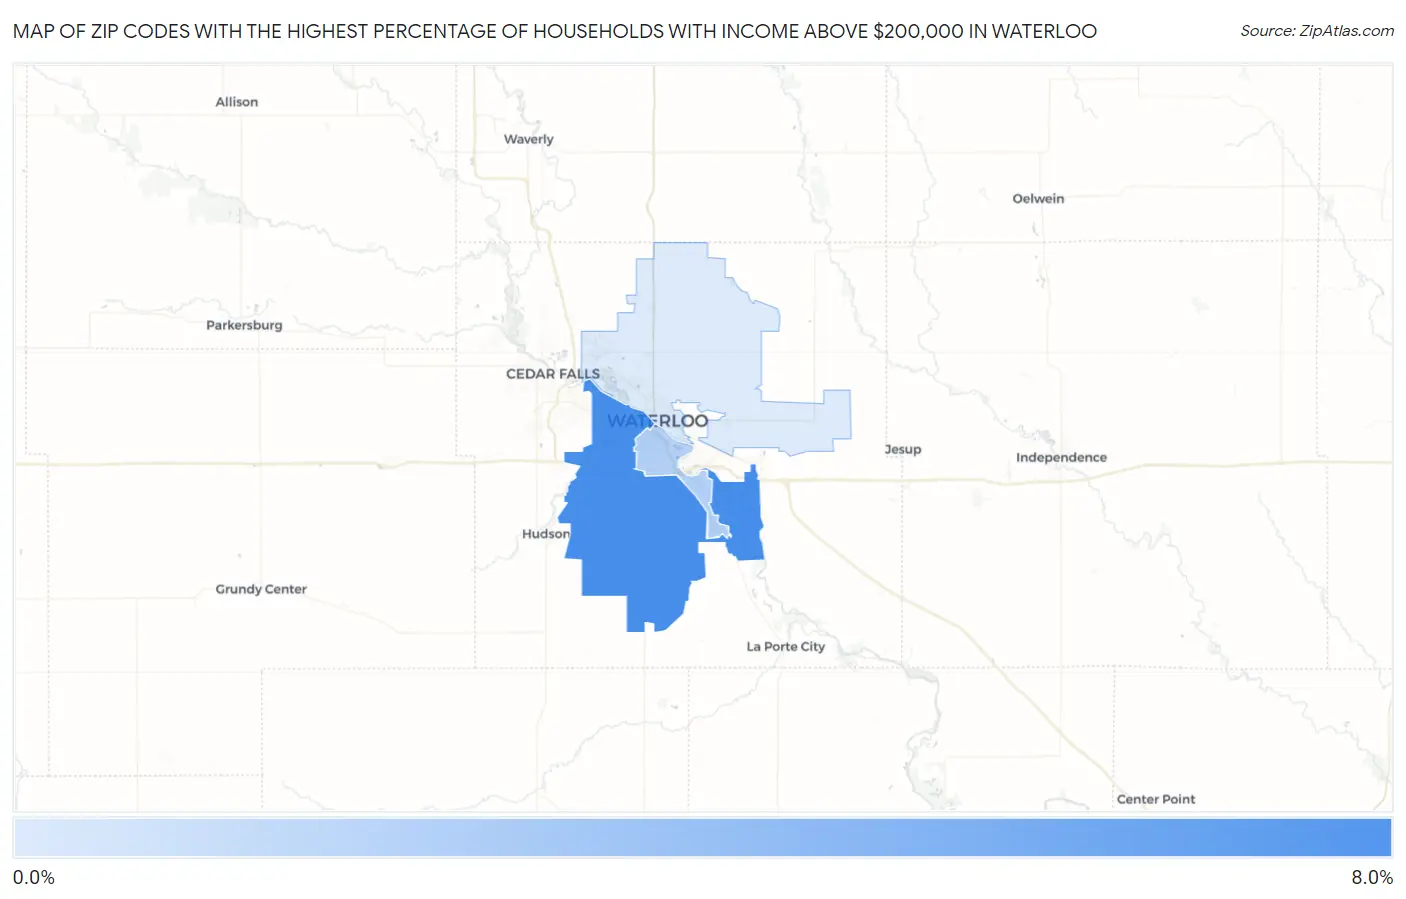
Map of Zip Codes with the Highest Percentage of Households with Income Above $200,000 in Waterloo
1.0%
6.5%
Zip Codes with the Highest Percentage of Households with Income Above $200,000 in Waterloo, IA
| Zip Code | Households with Income > $200k | vs State | vs National | |
| 1. | 50701 | 6.5% | 7.1%(-0.600)#299 | 11.4%(-4.90)#12,565 |
| 2. | 50702 | 2.5% | 7.1%(-4.60)#659 | 11.4%(-8.90)#22,347 |
| 3. | 50703 | 1.0% | 7.1%(-6.10)#764 | 11.4%(-10.4)#26,184 |
1
Common Questions
What are the Top Zip Codes with the Highest Percentage of Households with Income Above $200,000 in Waterloo, IA?
Top Zip Codes with the Highest Percentage of Households with Income Above $200,000 in Waterloo, IA are:
What zip code has the Highest Percentage of Households with Income Above $200,000 in Waterloo, IA?
50701 has the Highest Percentage of Households with Income Above $200,000 in Waterloo, IA with 6.5%.
What is the Percentage of Households with Income Above $200,000 in Waterloo, IA?
Percentage of Households with Income Above $200,000 in Waterloo is 3.6%.
What is the Percentage of Households with Income Above $200,000 in Iowa?
Percentage of Households with Income Above $200,000 in Iowa is 7.1%.
What is the Percentage of Households with Income Above $200,000 in the United States?
Percentage of Households with Income Above $200,000 in the United States is 11.4%.