High Amana, IA Map & Demographics
High Amana Map
High Amana Overview
$91,507
PER CAPITA INCOME
0.54
INEQUALITY / GINI INDEX
92
TOTAL POPULATION
47
MALE POPULATION
45
FEMALE POPULATION
104.44
MALES / 100 FEMALES
95.74
FEMALES / 100 MALES
53.7
MEDIAN AGE
3.2
AVG FAMILY SIZE
2.0
AVG HOUSEHOLD SIZE
81
LABOR FORCE [ PEOPLE ]
88.0%
PERCENT IN LABOR FORCE
Income in High Amana
Income Overview in High Amana
| Characteristic | Number | Measure |
| Per Capita Income | 92 | $91,507 |
| Median Family Income | 21 | $0 |
| Mean Family Income | 21 | $0 |
| Median Household Income | 46 | $0 |
| Mean Household Income | 46 | $183,252 |
| Income Deficit | 21 | $0 |
| Wage / Income Gap (%) | 92 | 0.00% |
| Wage / Income Gap ($) | 92 | 100.00¢ per $1 |
| Gini / Inequality Index | 92 | 0.54 |
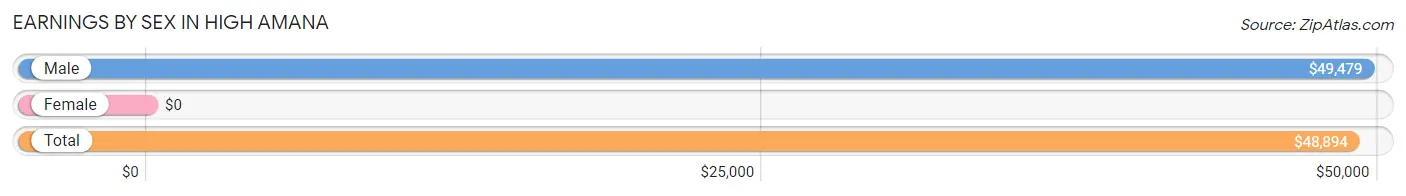
Earnings by Sex in High Amana
| Sex | Number | Average Earnings |
| Male | 47 (58.0%) | $49,479 |
| Female | 34 (42.0%) | $0 |
| Total | 81 (100.0%) | $48,894 |
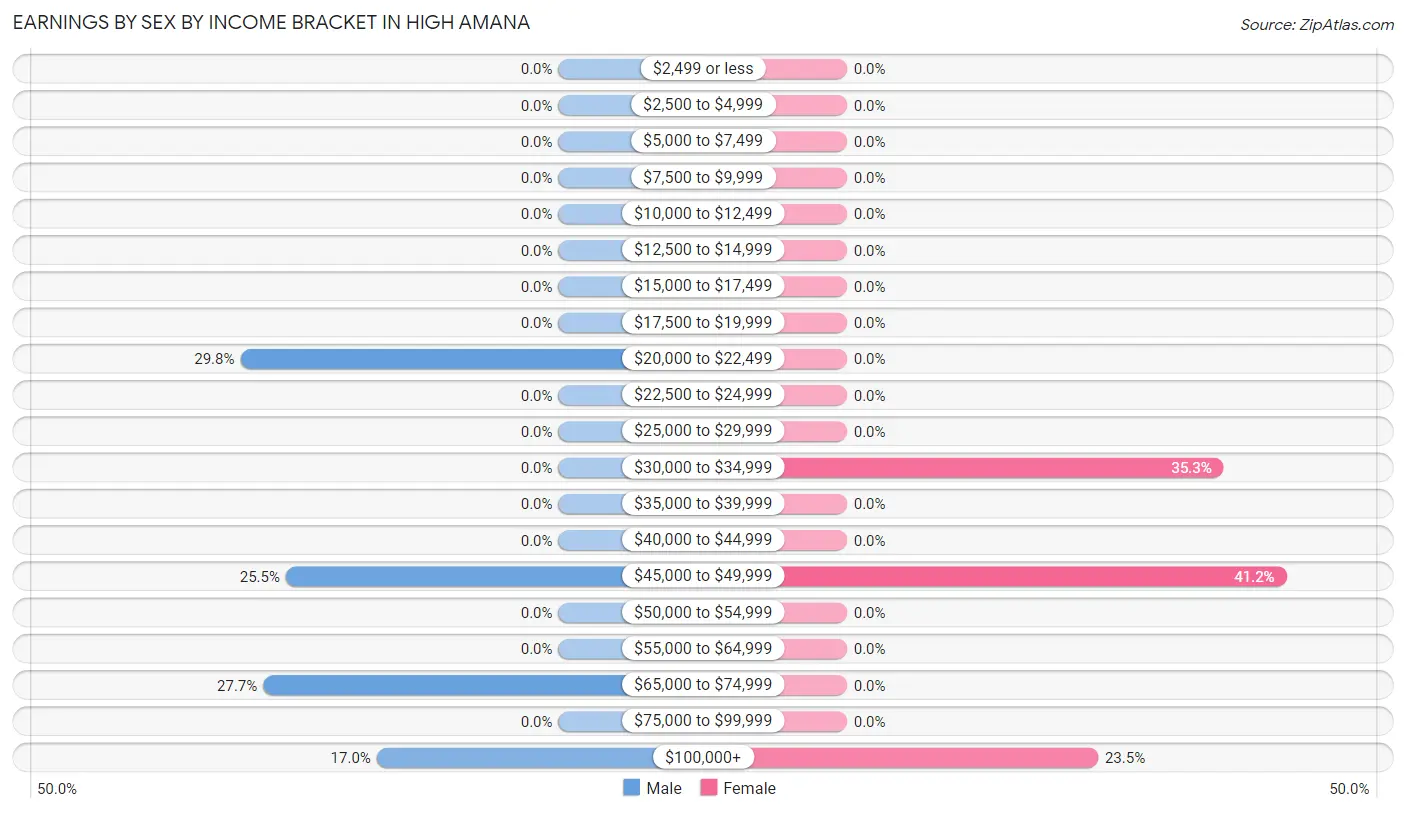
Earnings by Sex by Income Bracket in High Amana
The most common earnings brackets in High Amana are $20,000 to $22,499 for men (14 | 29.8%) and $45,000 to $49,999 for women (14 | 41.2%).
| Income | Male | Female |
| $2,499 or less | 0 (0.0%) | 0 (0.0%) |
| $2,500 to $4,999 | 0 (0.0%) | 0 (0.0%) |
| $5,000 to $7,499 | 0 (0.0%) | 0 (0.0%) |
| $7,500 to $9,999 | 0 (0.0%) | 0 (0.0%) |
| $10,000 to $12,499 | 0 (0.0%) | 0 (0.0%) |
| $12,500 to $14,999 | 0 (0.0%) | 0 (0.0%) |
| $15,000 to $17,499 | 0 (0.0%) | 0 (0.0%) |
| $17,500 to $19,999 | 0 (0.0%) | 0 (0.0%) |
| $20,000 to $22,499 | 14 (29.8%) | 0 (0.0%) |
| $22,500 to $24,999 | 0 (0.0%) | 0 (0.0%) |
| $25,000 to $29,999 | 0 (0.0%) | 0 (0.0%) |
| $30,000 to $34,999 | 0 (0.0%) | 12 (35.3%) |
| $35,000 to $39,999 | 0 (0.0%) | 0 (0.0%) |
| $40,000 to $44,999 | 0 (0.0%) | 0 (0.0%) |
| $45,000 to $49,999 | 12 (25.5%) | 14 (41.2%) |
| $50,000 to $54,999 | 0 (0.0%) | 0 (0.0%) |
| $55,000 to $64,999 | 0 (0.0%) | 0 (0.0%) |
| $65,000 to $74,999 | 13 (27.7%) | 0 (0.0%) |
| $75,000 to $99,999 | 0 (0.0%) | 0 (0.0%) |
| $100,000+ | 8 (17.0%) | 8 (23.5%) |
| Total | 47 (100.0%) | 34 (100.0%) |
Earnings by Sex by Educational Attainment in High Amana
| Educational Attainment | Male Income | Female Income |
| Less than High School | - | - |
| High School Diploma | - | - |
| College or Associate's Degree | - | - |
| Bachelor's Degree | - | - |
| Graduate Degree | - | - |
| Total | $49,479 | $0 |
Family Income in High Amana
Family Income Brackets in High Amana
According to the High Amana family income data, there are 13 families falling into the $150,000 to $199,999 income range, which is the most common income bracket and makes up 61.9% of all families.
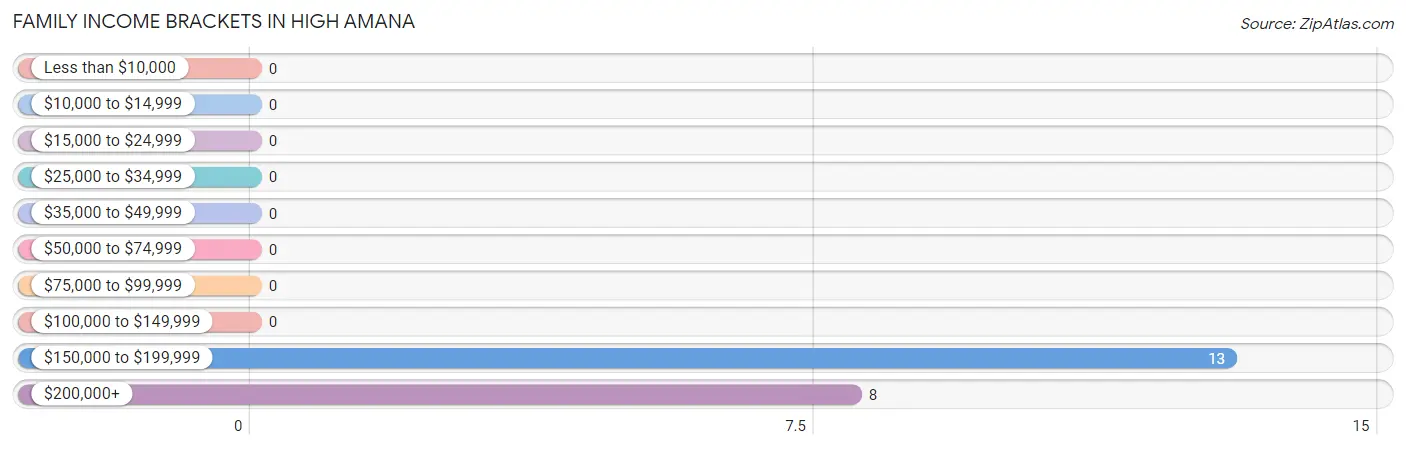
| Income Bracket | # Families | % Families |
| Less than $10,000 | 0 | 0.0% |
| $10,000 to $14,999 | 0 | 0.0% |
| $15,000 to $24,999 | 0 | 0.0% |
| $25,000 to $34,999 | 0 | 0.0% |
| $35,000 to $49,999 | 0 | 0.0% |
| $50,000 to $74,999 | 0 | 0.0% |
| $75,000 to $99,999 | 0 | 0.0% |
| $100,000 to $149,999 | 0 | 0.0% |
| $150,000 to $199,999 | 13 | 61.9% |
| $200,000+ | 8 | 38.1% |
Family Income by Famaliy Size in High Amana
| Income Bracket | # Families | Median Income |
| 2-Person Families | 8 (38.1%) | $0 |
| 3-Person Families | 0 (0.0%) | $0 |
| 4-Person Families | 13 (61.9%) | $0 |
| 5-Person Families | 0 (0.0%) | $0 |
| 6-Person Families | 0 (0.0%) | $0 |
| 7+ Person Families | 0 (0.0%) | $0 |
| Total | 21 (100.0%) | $0 |
Family Income by Number of Earners in High Amana
| Number of Earners | # Families | Median Income |
| No Earners | 0 (0.0%) | $0 |
| 1 Earner | 0 (0.0%) | $0 |
| 2 Earners | 8 (38.1%) | $0 |
| 3+ Earners | 13 (61.9%) | $0 |
| Total | 21 (100.0%) | $0 |
Household Income in High Amana
Household Income Brackets in High Amana
With 13 households falling in the category, the $25,000 to $34,999 income range is the most frequent in High Amana, accounting for 28.3% of all households.
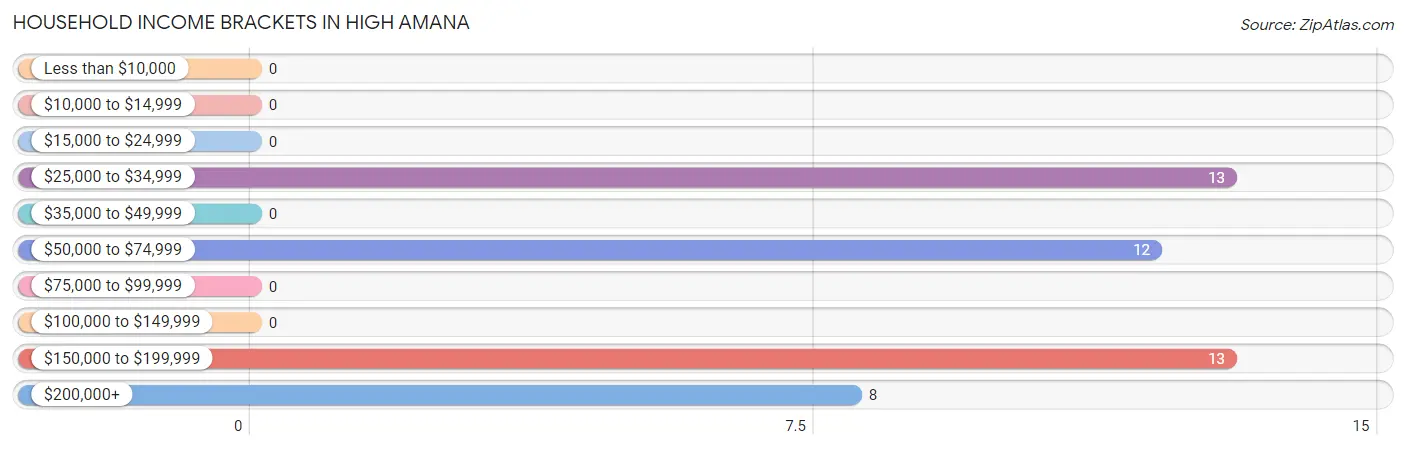
| Income Bracket | # Households | % Households |
| Less than $10,000 | 0 | 0.0% |
| $10,000 to $14,999 | 0 | 0.0% |
| $15,000 to $24,999 | 0 | 0.0% |
| $25,000 to $34,999 | 13 | 28.3% |
| $35,000 to $49,999 | 0 | 0.0% |
| $50,000 to $74,999 | 12 | 26.1% |
| $75,000 to $99,999 | 0 | 0.0% |
| $100,000 to $149,999 | 0 | 0.0% |
| $150,000 to $199,999 | 13 | 28.3% |
| $200,000+ | 8 | 17.4% |
Household Income by Householder Age in High Amana
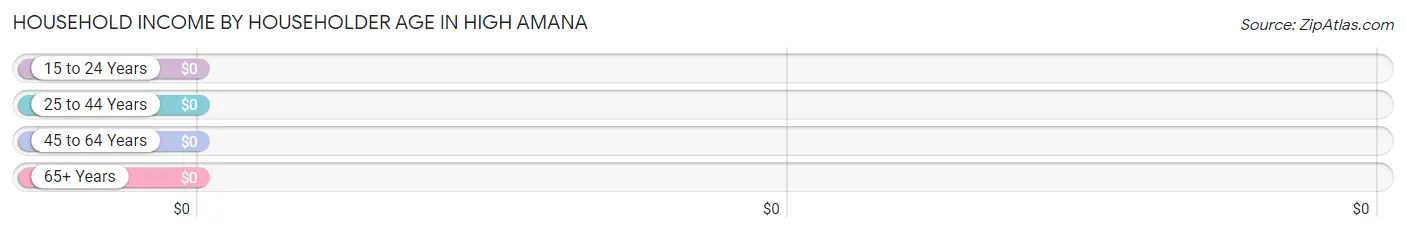
| Income Bracket | # Households | Median Income |
| 15 to 24 Years | 0 (0.0%) | $0 |
| 25 to 44 Years | 12 (26.1%) | $0 |
| 45 to 64 Years | 25 (54.3%) | $0 |
| 65+ Years | 9 (19.6%) | $0 |
| Total | 46 (100.0%) | $0 |
Poverty in High Amana
Income Below Poverty by Sex and Age in High Amana
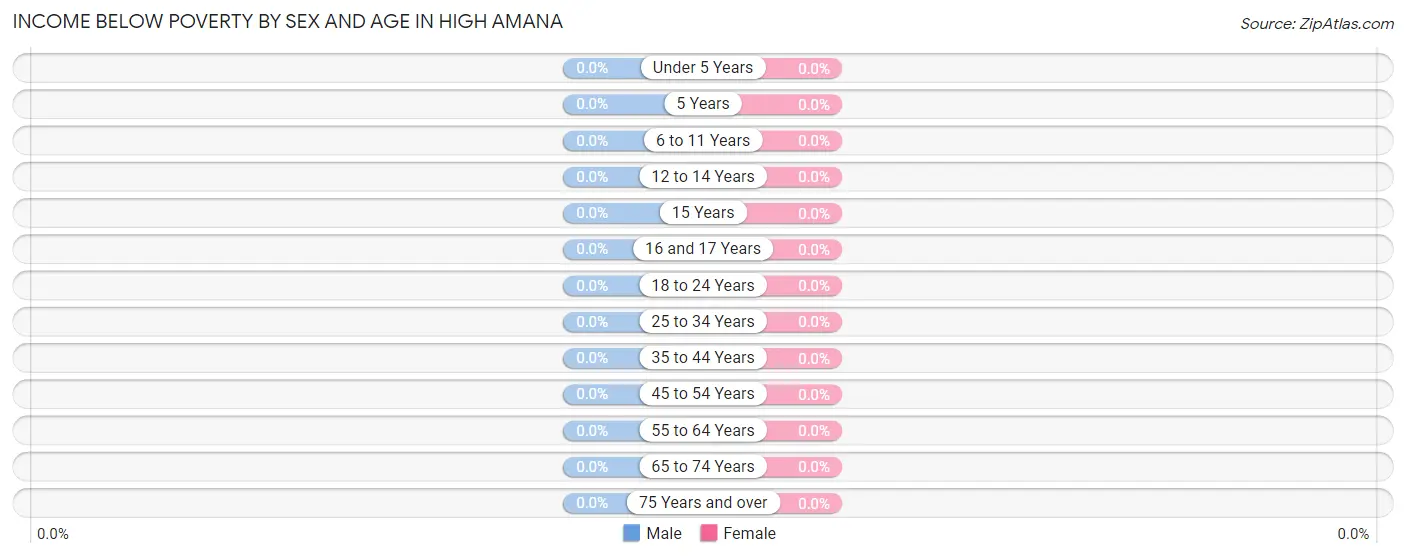
| Age Bracket | Male | Female |
| Under 5 Years | 0 (0.0%) | 0 (0.0%) |
| 5 Years | 0 (0.0%) | 0 (0.0%) |
| 6 to 11 Years | 0 (0.0%) | 0 (0.0%) |
| 12 to 14 Years | 0 (0.0%) | 0 (0.0%) |
| 15 Years | 0 (0.0%) | 0 (0.0%) |
| 16 and 17 Years | 0 (0.0%) | 0 (0.0%) |
| 18 to 24 Years | 0 (0.0%) | 0 (0.0%) |
| 25 to 34 Years | 0 (0.0%) | 0 (0.0%) |
| 35 to 44 Years | 0 (0.0%) | 0 (0.0%) |
| 45 to 54 Years | 0 (0.0%) | 0 (0.0%) |
| 55 to 64 Years | 0 (0.0%) | 0 (0.0%) |
| 65 to 74 Years | 0 (0.0%) | 0 (0.0%) |
| 75 Years and over | 0 (0.0%) | 0 (0.0%) |
| Total | 0 (0.0%) | 0 (0.0%) |
Income Above Poverty by Sex and Age in High Amana
According to the poverty statistics in High Amana, males aged 25 to 34 years and females aged 45 to 54 years are the age groups that are most secure financially, with 100.0% of males and 100.0% of females in these age groups living above the poverty line.
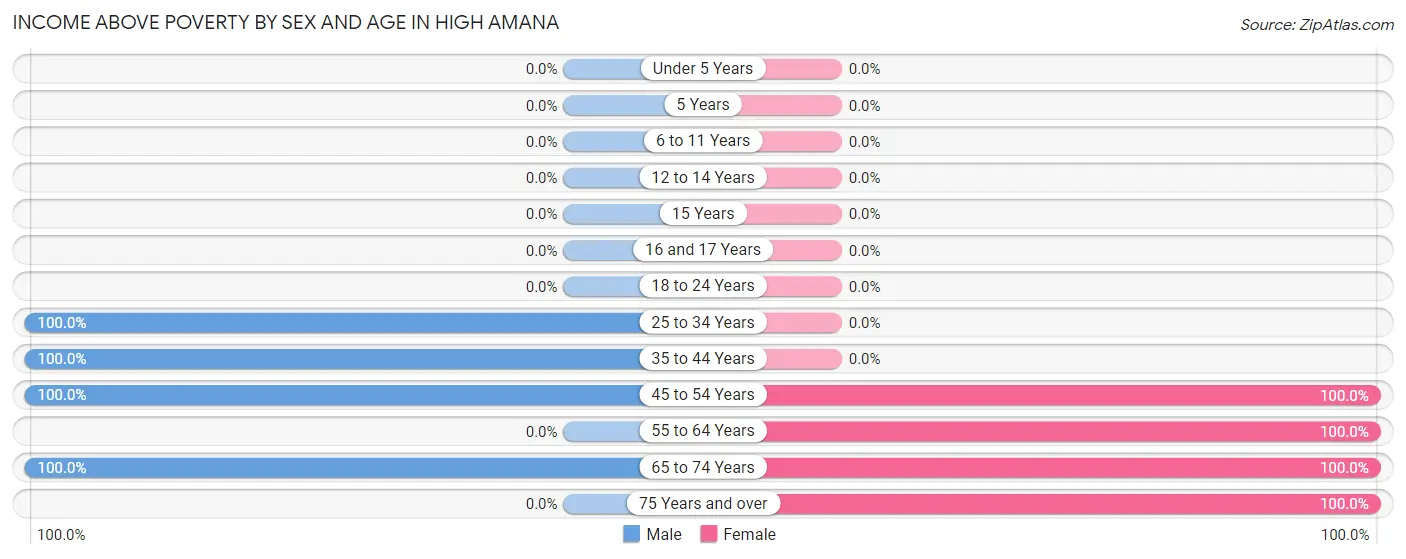
| Age Bracket | Male | Female |
| Under 5 Years | 0 (0.0%) | 0 (0.0%) |
| 5 Years | 0 (0.0%) | 0 (0.0%) |
| 6 to 11 Years | 0 (0.0%) | 0 (0.0%) |
| 12 to 14 Years | 0 (0.0%) | 0 (0.0%) |
| 15 Years | 0 (0.0%) | 0 (0.0%) |
| 16 and 17 Years | 0 (0.0%) | 0 (0.0%) |
| 18 to 24 Years | 0 (0.0%) | 0 (0.0%) |
| 25 to 34 Years | 14 (100.0%) | 0 (0.0%) |
| 35 to 44 Years | 12 (100.0%) | 0 (0.0%) |
| 45 to 54 Years | 13 (100.0%) | 14 (100.0%) |
| 55 to 64 Years | 0 (0.0%) | 12 (100.0%) |
| 65 to 74 Years | 8 (100.0%) | 8 (100.0%) |
| 75 Years and over | 0 (0.0%) | 11 (100.0%) |
| Total | 47 (100.0%) | 45 (100.0%) |
Income Below Poverty Among Married-Couple Families in High Amana
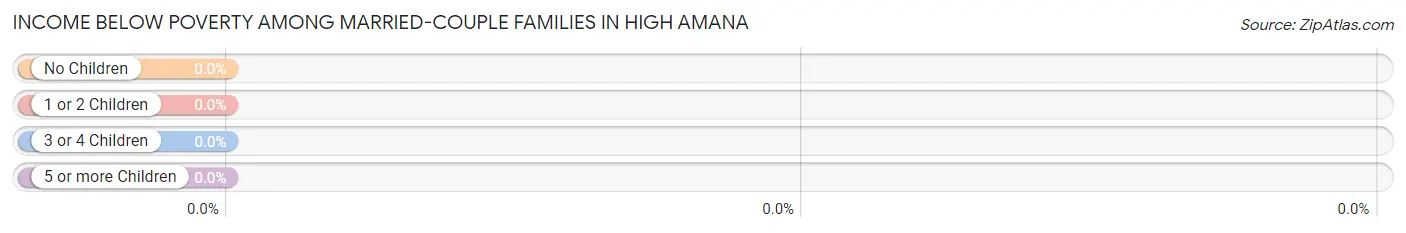
| Children | Above Poverty | Below Poverty |
| No Children | 21 (100.0%) | 0 (0.0%) |
| 1 or 2 Children | 0 (0.0%) | 0 (0.0%) |
| 3 or 4 Children | 0 (0.0%) | 0 (0.0%) |
| 5 or more Children | 0 (0.0%) | 0 (0.0%) |
| Total | 21 (100.0%) | 0 (0.0%) |
Income Below Poverty Among Single-Parent Households in High Amana
| Children | Single Father | Single Mother |
| No Children | 0 (0.0%) | 0 (0.0%) |
| 1 or 2 Children | 0 (0.0%) | 0 (0.0%) |
| 3 or 4 Children | 0 (0.0%) | 0 (0.0%) |
| 5 or more Children | 0 (0.0%) | 0 (0.0%) |
| Total | 0 (0.0%) | 0 (0.0%) |
Income Below Poverty Among Married-Couple vs Single-Parent Households in High Amana
| Children | Married-Couple Families | Single-Parent Households |
| No Children | 0 (0.0%) | 0 (0.0%) |
| 1 or 2 Children | 0 (0.0%) | 0 (0.0%) |
| 3 or 4 Children | 0 (0.0%) | 0 (0.0%) |
| 5 or more Children | 0 (0.0%) | 0 (0.0%) |
| Total | 0 (0.0%) | 0 (0.0%) |
Race in High Amana
The most populous races in High Amana are White / Caucasian (91 | 98.9%), and Two or more Races (1 | 1.1%).
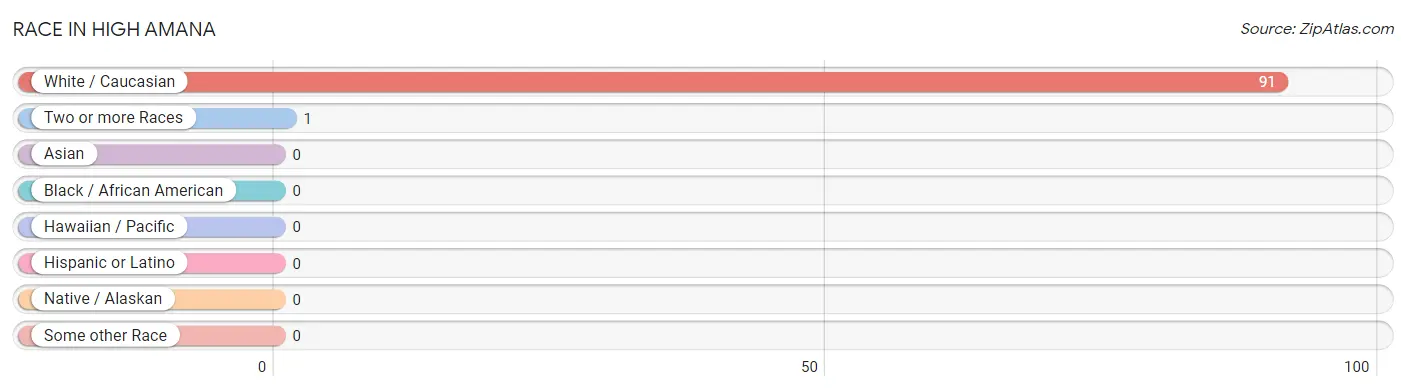
| Race | # Population | % Population |
| Asian | 0 | 0.0% |
| Black / African American | 0 | 0.0% |
| Hawaiian / Pacific | 0 | 0.0% |
| Hispanic or Latino | 0 | 0.0% |
| Native / Alaskan | 0 | 0.0% |
| White / Caucasian | 91 | 98.9% |
| Two or more Races | 1 | 1.1% |
| Some other Race | 0 | 0.0% |
| Total | 92 | 100.0% |
Ancestry in High Amana
The most populous ancestries reported in High Amana are German (12 | 13.0%), and American (1 | 1.1%), together accounting for 14.1% of all High Amana residents.
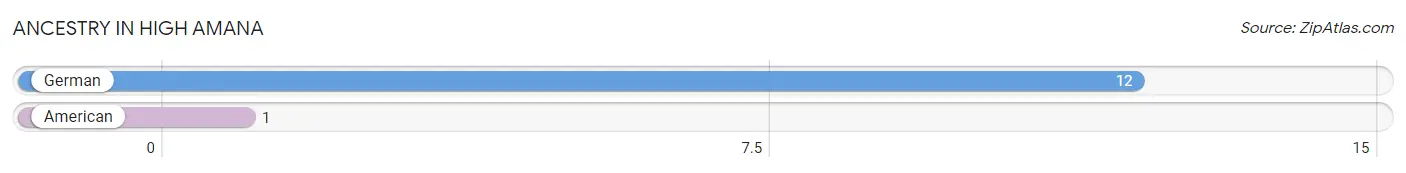
| Ancestry | # Population | % Population |
| American | 1 | 1.1% |
| German | 12 | 13.0% | View All 2 Rows |
Immigrants in High Amana

| Immigration Origin | # Population | % Population | View All 0 Rows |
Sex and Age in High Amana
Sex and Age in High Amana
The most populous age groups in High Amana are 25 to 29 Years (14 | 29.8%) for men and 50 to 54 Years (14 | 31.1%) for women.
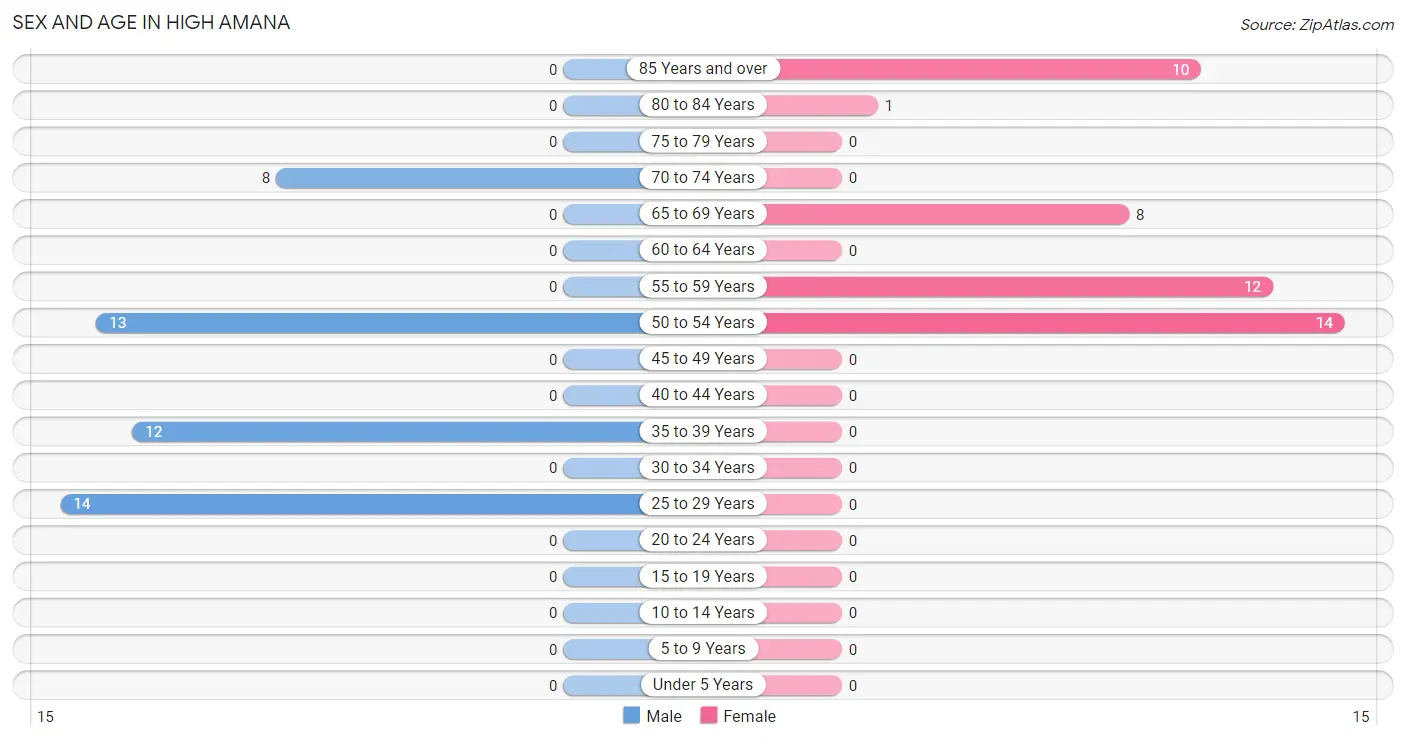
| Age Bracket | Male | Female |
| Under 5 Years | 0 (0.0%) | 0 (0.0%) |
| 5 to 9 Years | 0 (0.0%) | 0 (0.0%) |
| 10 to 14 Years | 0 (0.0%) | 0 (0.0%) |
| 15 to 19 Years | 0 (0.0%) | 0 (0.0%) |
| 20 to 24 Years | 0 (0.0%) | 0 (0.0%) |
| 25 to 29 Years | 14 (29.8%) | 0 (0.0%) |
| 30 to 34 Years | 0 (0.0%) | 0 (0.0%) |
| 35 to 39 Years | 12 (25.5%) | 0 (0.0%) |
| 40 to 44 Years | 0 (0.0%) | 0 (0.0%) |
| 45 to 49 Years | 0 (0.0%) | 0 (0.0%) |
| 50 to 54 Years | 13 (27.7%) | 14 (31.1%) |
| 55 to 59 Years | 0 (0.0%) | 12 (26.7%) |
| 60 to 64 Years | 0 (0.0%) | 0 (0.0%) |
| 65 to 69 Years | 0 (0.0%) | 8 (17.8%) |
| 70 to 74 Years | 8 (17.0%) | 0 (0.0%) |
| 75 to 79 Years | 0 (0.0%) | 0 (0.0%) |
| 80 to 84 Years | 0 (0.0%) | 1 (2.2%) |
| 85 Years and over | 0 (0.0%) | 10 (22.2%) |
| Total | 47 (100.0%) | 45 (100.0%) |
Families and Households in High Amana
Median Family Size in High Amana
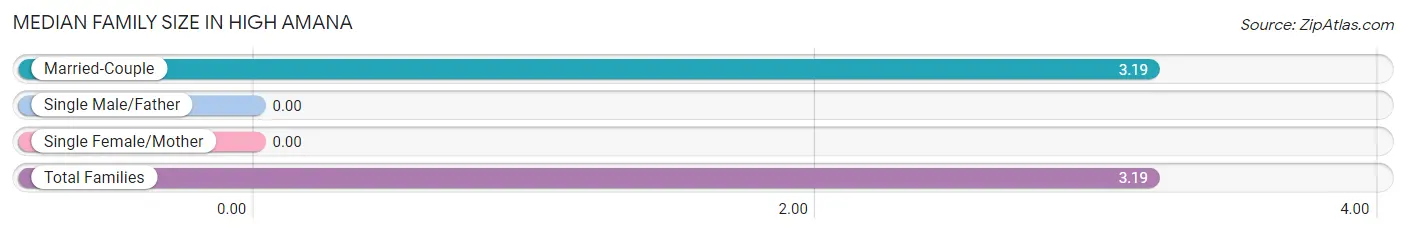
| Family Type | # Families | Family Size |
| Married-Couple | 21 (100.0%) | 3.19 |
| Single Male/Father | 0 (0.0%) | - |
| Single Female/Mother | 0 (0.0%) | - |
| Total Families | 21 (100.0%) | 3.19 |
Median Household Size in High Amana
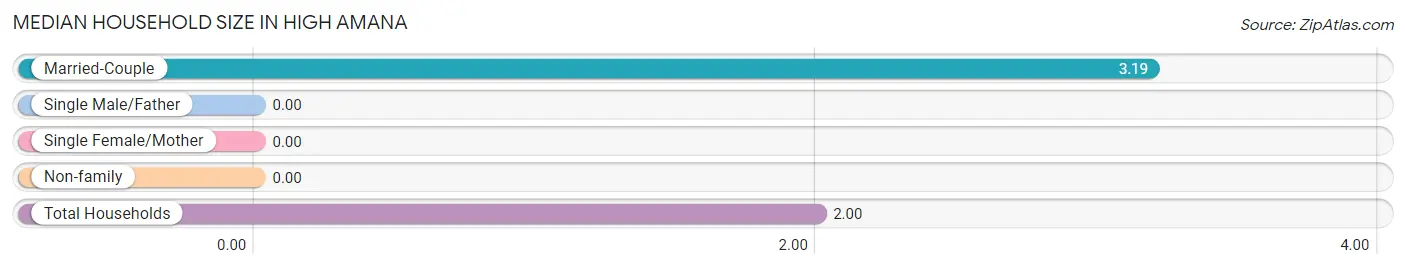
| Household Type | # Households | Household Size |
| Married-Couple | 21 (45.7%) | 3.19 |
| Single Male/Father | 0 (0.0%) | - |
| Single Female/Mother | 0 (0.0%) | - |
| Non-family | 25 (54.3%) | - |
| Total Households | 46 (100.0%) | 2.00 |
Household Size by Marriage Status in High Amana
Out of a total of 46 households in High Amana, 21 (45.7%) are family households, while 25 (54.3%) are nonfamily households. The most numerous type of family households are 4-person households, comprising 13, and the most common type of nonfamily households are 1-person households, comprising 25.
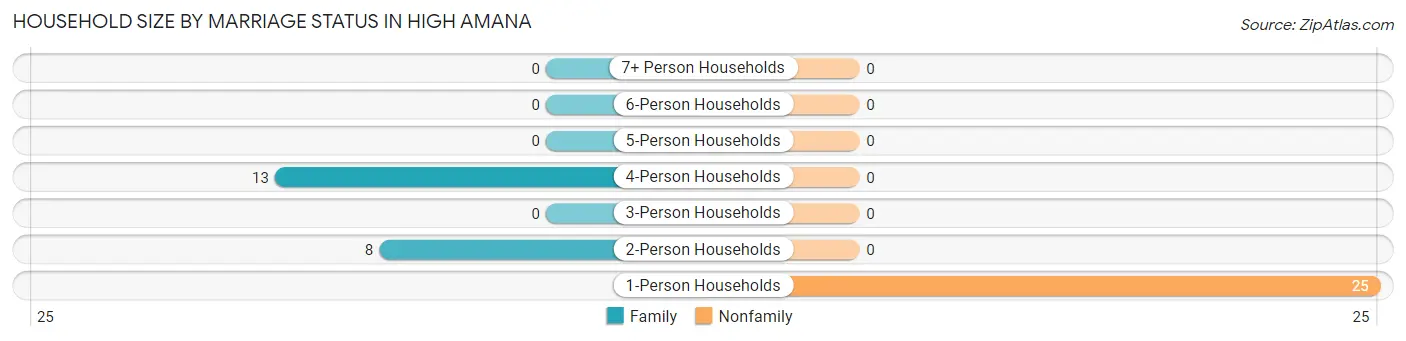
| Household Size | Family Households | Nonfamily Households |
| 1-Person Households | - | 25 (54.3%) |
| 2-Person Households | 8 (17.4%) | 0 (0.0%) |
| 3-Person Households | 0 (0.0%) | 0 (0.0%) |
| 4-Person Households | 13 (28.3%) | 0 (0.0%) |
| 5-Person Households | 0 (0.0%) | 0 (0.0%) |
| 6-Person Households | 0 (0.0%) | 0 (0.0%) |
| 7+ Person Households | 0 (0.0%) | 0 (0.0%) |
| Total | 21 (45.7%) | 25 (54.3%) |
Female Fertility in High Amana
Fertility by Age in High Amana
| Age Bracket | Women with Births | Births / 1,000 Women |
| 15 to 19 years | 0 (0.0%) | 0.0 |
| 20 to 34 years | 0 (0.0%) | 0.0 |
| 35 to 50 years | 0 (0.0%) | 0.0 |
| Total | 0 (0.0%) | 0.0 |
Fertility by Age by Marriage Status in High Amana
| Age Bracket | Married | Unmarried |
| 15 to 19 years | 0 (0.0%) | 0 (0.0%) |
| 20 to 34 years | 0 (0.0%) | 0 (0.0%) |
| 35 to 50 years | 0 (0.0%) | 0 (0.0%) |
| Total | 0 (0.0%) | 0 (0.0%) |
Fertility by Education in High Amana
| Educational Attainment | Women with Births | Births / 1,000 Women |
| Less than High School | 0 (0.0%) | 0.0 |
| High School Diploma | 0 (0.0%) | 0.0 |
| College or Associate's Degree | 0 (0.0%) | 0.0 |
| Bachelor's Degree | 0 (0.0%) | 0.0 |
| Graduate Degree | 0 (0.0%) | 0.0 |
| Total | 0 (0.0%) | 0.0 |
Fertility by Education by Marriage Status in High Amana
| Educational Attainment | Married | Unmarried |
| Less than High School | 0 (0.0%) | 0 (0.0%) |
| High School Diploma | 0 (0.0%) | 0 (0.0%) |
| College or Associate's Degree | 0 (0.0%) | 0 (0.0%) |
| Bachelor's Degree | 0 (0.0%) | 0 (0.0%) |
| Graduate Degree | 0 (0.0%) | 0 (0.0%) |
| Total | 0 (0.0%) | 0 (0.0%) |
Employment Characteristics in High Amana
Employment by Class of Employer in High Amana
Among the 81 employed individuals in High Amana, private company employees (69 | 85.2%), and self-employed (incorporated) (12 | 14.8%) make up the most common classes of employment.
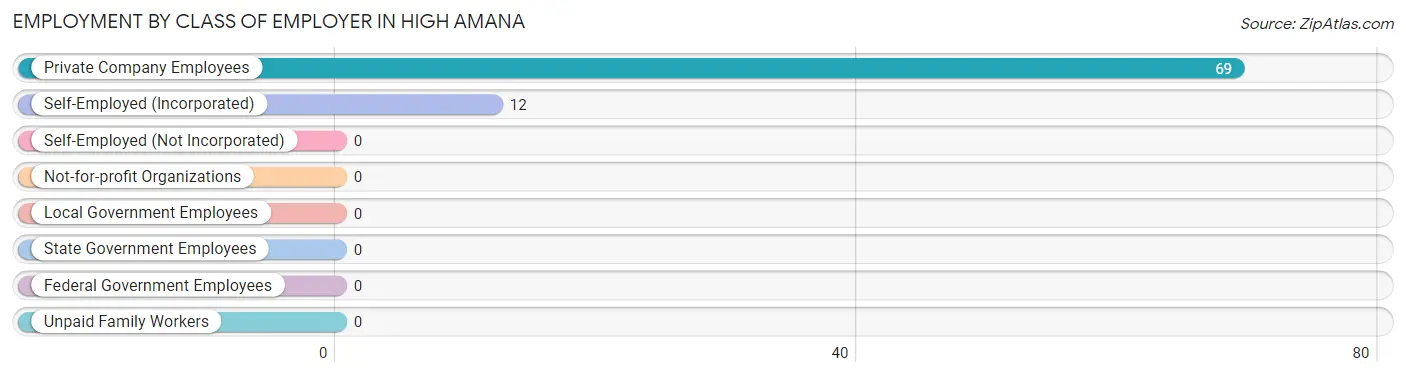
| Employer Class | # Employees | % Employees |
| Private Company Employees | 69 | 85.2% |
| Self-Employed (Incorporated) | 12 | 14.8% |
| Self-Employed (Not Incorporated) | 0 | 0.0% |
| Not-for-profit Organizations | 0 | 0.0% |
| Local Government Employees | 0 | 0.0% |
| State Government Employees | 0 | 0.0% |
| Federal Government Employees | 0 | 0.0% |
| Unpaid Family Workers | 0 | 0.0% |
| Total | 81 | 100.0% |
Employment Status by Age in High Amana
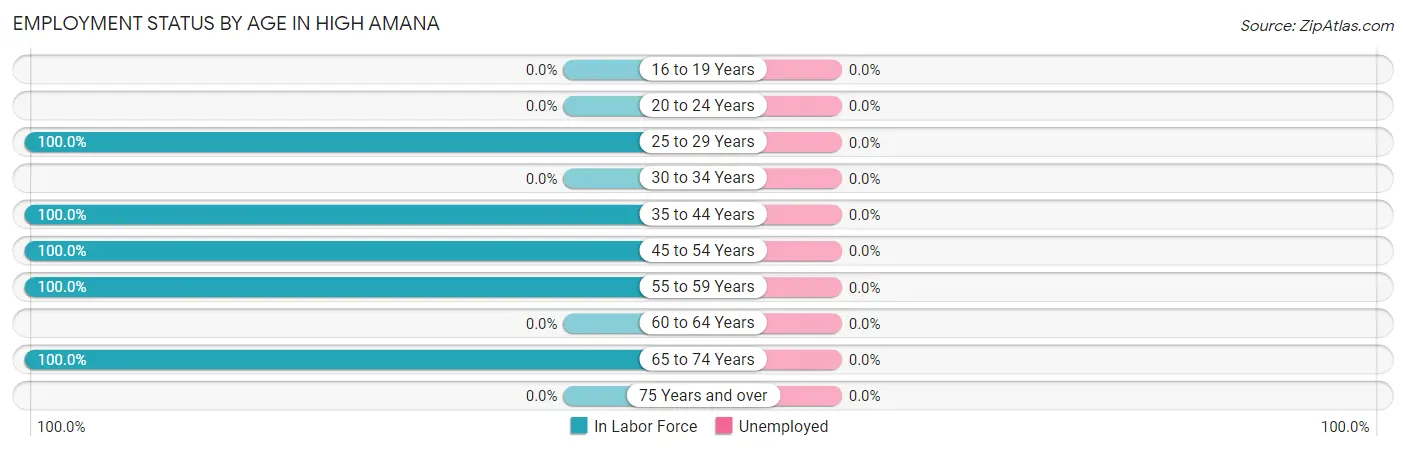
| Age Bracket | In Labor Force | Unemployed |
| 16 to 19 Years | 0 (0.0%) | 0 (0.0%) |
| 20 to 24 Years | 0 (0.0%) | 0 (0.0%) |
| 25 to 29 Years | 14 (100.0%) | 0 (0.0%) |
| 30 to 34 Years | 0 (0.0%) | 0 (0.0%) |
| 35 to 44 Years | 12 (100.0%) | 0 (0.0%) |
| 45 to 54 Years | 27 (100.0%) | 0 (0.0%) |
| 55 to 59 Years | 12 (100.0%) | 0 (0.0%) |
| 60 to 64 Years | 0 (0.0%) | 0 (0.0%) |
| 65 to 74 Years | 16 (100.0%) | 0 (0.0%) |
| 75 Years and over | 0 (0.0%) | 0 (0.0%) |
| Total | 81 (88.0%) | 0 (0.0%) |
Employment Status by Educational Attainment in High Amana
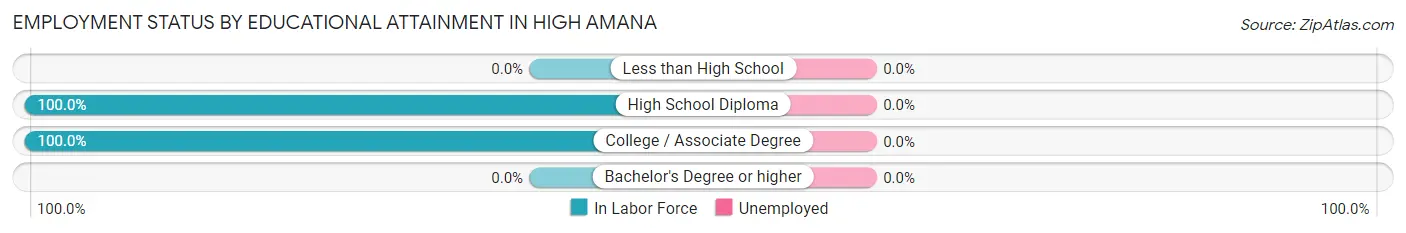
| Educational Attainment | In Labor Force | Unemployed |
| Less than High School | 0 (0.0%) | 0 (0.0%) |
| High School Diploma | 39 (100.0%) | 0 (0.0%) |
| College / Associate Degree | 26 (100.0%) | 0 (0.0%) |
| Bachelor's Degree or higher | 0 (0.0%) | 0 (0.0%) |
| Total | 65 (100.0%) | 0 (0.0%) |
Employment Occupations by Sex in High Amana
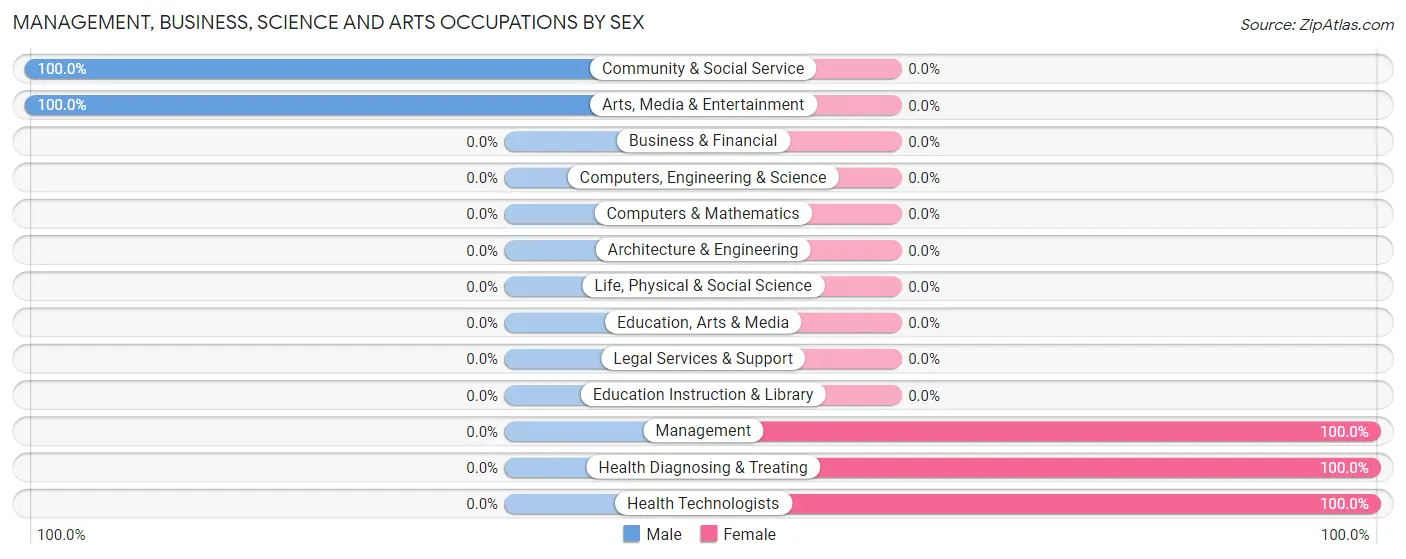
Management, Business, Science and Arts Occupations
The most common Management, Business, Science and Arts occupations in High Amana are Management (22 | 27.2%), Community & Social Service (14 | 17.3%), Arts, Media & Entertainment (14 | 17.3%), Health Diagnosing & Treating (12 | 14.8%), and Health Technologists (12 | 14.8%).
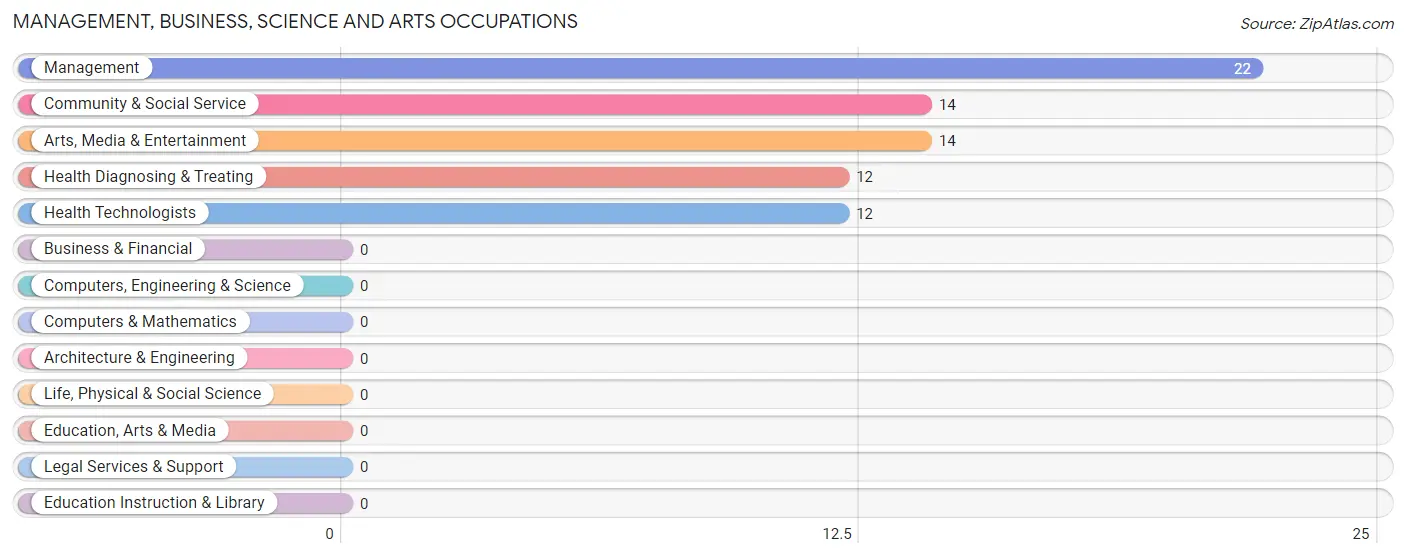
Management, Business, Science and Arts Occupations by Sex
Within the Management, Business, Science and Arts occupations in High Amana, the most male-oriented occupations are Community & Social Service (100.0%), and Arts, Media & Entertainment (100.0%), while the most female-oriented occupations are Management (100.0%), Health Diagnosing & Treating (100.0%), and Health Technologists (100.0%).
| Occupation | Male | Female |
| Management | 0 (0.0%) | 22 (100.0%) |
| Business & Financial | 0 (0.0%) | 0 (0.0%) |
| Computers, Engineering & Science | 0 (0.0%) | 0 (0.0%) |
| Computers & Mathematics | 0 (0.0%) | 0 (0.0%) |
| Architecture & Engineering | 0 (0.0%) | 0 (0.0%) |
| Life, Physical & Social Science | 0 (0.0%) | 0 (0.0%) |
| Community & Social Service | 14 (100.0%) | 0 (0.0%) |
| Education, Arts & Media | 0 (0.0%) | 0 (0.0%) |
| Legal Services & Support | 0 (0.0%) | 0 (0.0%) |
| Education Instruction & Library | 0 (0.0%) | 0 (0.0%) |
| Arts, Media & Entertainment | 14 (100.0%) | 0 (0.0%) |
| Health Diagnosing & Treating | 0 (0.0%) | 12 (100.0%) |
| Health Technologists | 0 (0.0%) | 12 (100.0%) |
| Total (Category) | 14 (29.2%) | 34 (70.8%) |
| Total (Overall) | 47 (58.0%) | 34 (42.0%) |
Services Occupations
Services Occupations by Sex
| Occupation | Male | Female |
| Healthcare Support | 0 (0.0%) | 0 (0.0%) |
| Security & Protection | 0 (0.0%) | 0 (0.0%) |
| Firefighting & Prevention | 0 (0.0%) | 0 (0.0%) |
| Law Enforcement | 0 (0.0%) | 0 (0.0%) |
| Food Preparation & Serving | 0 (0.0%) | 0 (0.0%) |
| Cleaning & Maintenance | 0 (0.0%) | 0 (0.0%) |
| Personal Care & Service | 0 (0.0%) | 0 (0.0%) |
| Total (Category) | 0 (0.0%) | 0 (0.0%) |
| Total (Overall) | 47 (58.0%) | 34 (42.0%) |
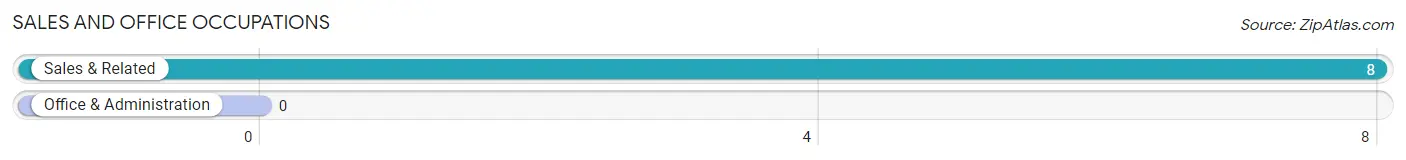
Sales and Office Occupations
The most common Sales and Office occupations in High Amana are , and Sales & Related (8 | 9.9%).
Sales and Office Occupations by Sex
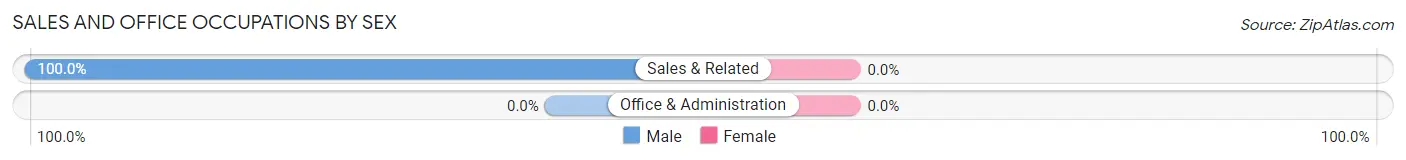
| Occupation | Male | Female |
| Sales & Related | 8 (100.0%) | 0 (0.0%) |
| Office & Administration | 0 (0.0%) | 0 (0.0%) |
| Total (Category) | 8 (100.0%) | 0 (0.0%) |
| Total (Overall) | 47 (58.0%) | 34 (42.0%) |
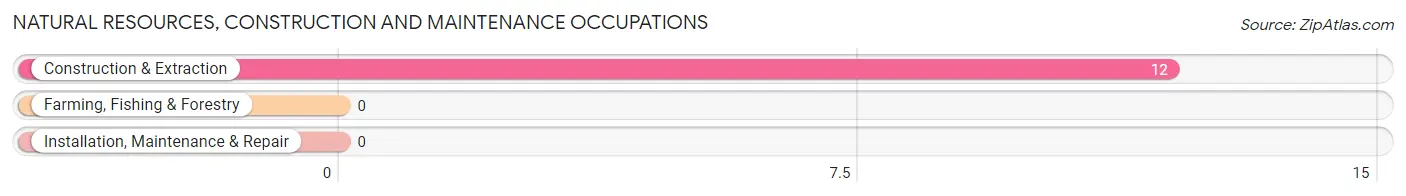
Natural Resources, Construction and Maintenance Occupations
The most common Natural Resources, Construction and Maintenance occupations in High Amana are , and Construction & Extraction (12 | 14.8%).
Natural Resources, Construction and Maintenance Occupations by Sex
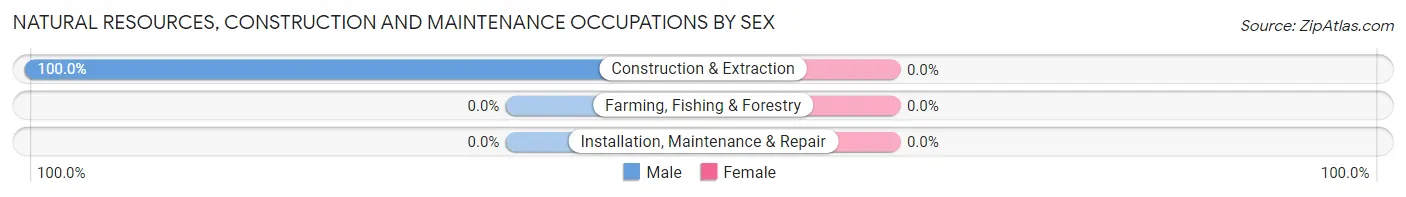
| Occupation | Male | Female |
| Farming, Fishing & Forestry | 0 (0.0%) | 0 (0.0%) |
| Construction & Extraction | 12 (100.0%) | 0 (0.0%) |
| Installation, Maintenance & Repair | 0 (0.0%) | 0 (0.0%) |
| Total (Category) | 12 (100.0%) | 0 (0.0%) |
| Total (Overall) | 47 (58.0%) | 34 (42.0%) |
Production, Transportation and Moving Occupations
The most common Production, Transportation and Moving occupations in High Amana are , and Production (13 | 16.1%).
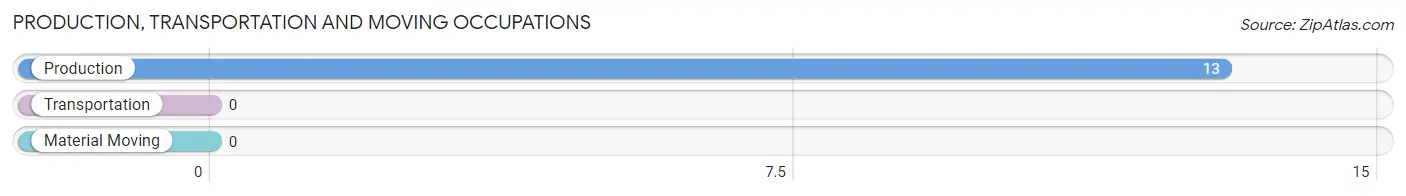
Production, Transportation and Moving Occupations by Sex
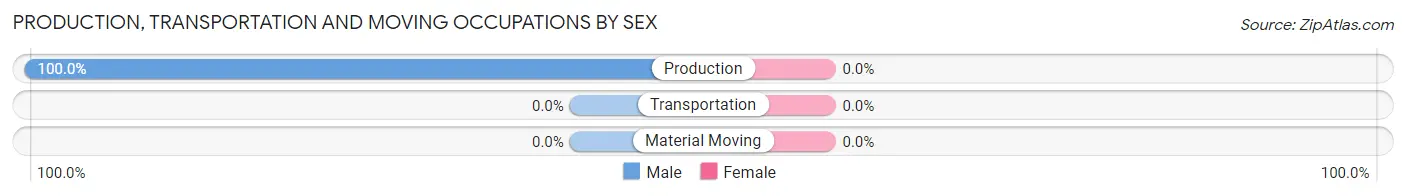
| Occupation | Male | Female |
| Production | 13 (100.0%) | 0 (0.0%) |
| Transportation | 0 (0.0%) | 0 (0.0%) |
| Material Moving | 0 (0.0%) | 0 (0.0%) |
| Total (Category) | 13 (100.0%) | 0 (0.0%) |
| Total (Overall) | 47 (58.0%) | 34 (42.0%) |
Employment Industries by Sex in High Amana
Employment Industries in High Amana
The major employment industries in High Amana include Manufacturing (21 | 25.9%), Retail Trade (14 | 17.3%), Information (14 | 17.3%), Construction (12 | 14.8%), and Health Care & Social Assistance (12 | 14.8%).
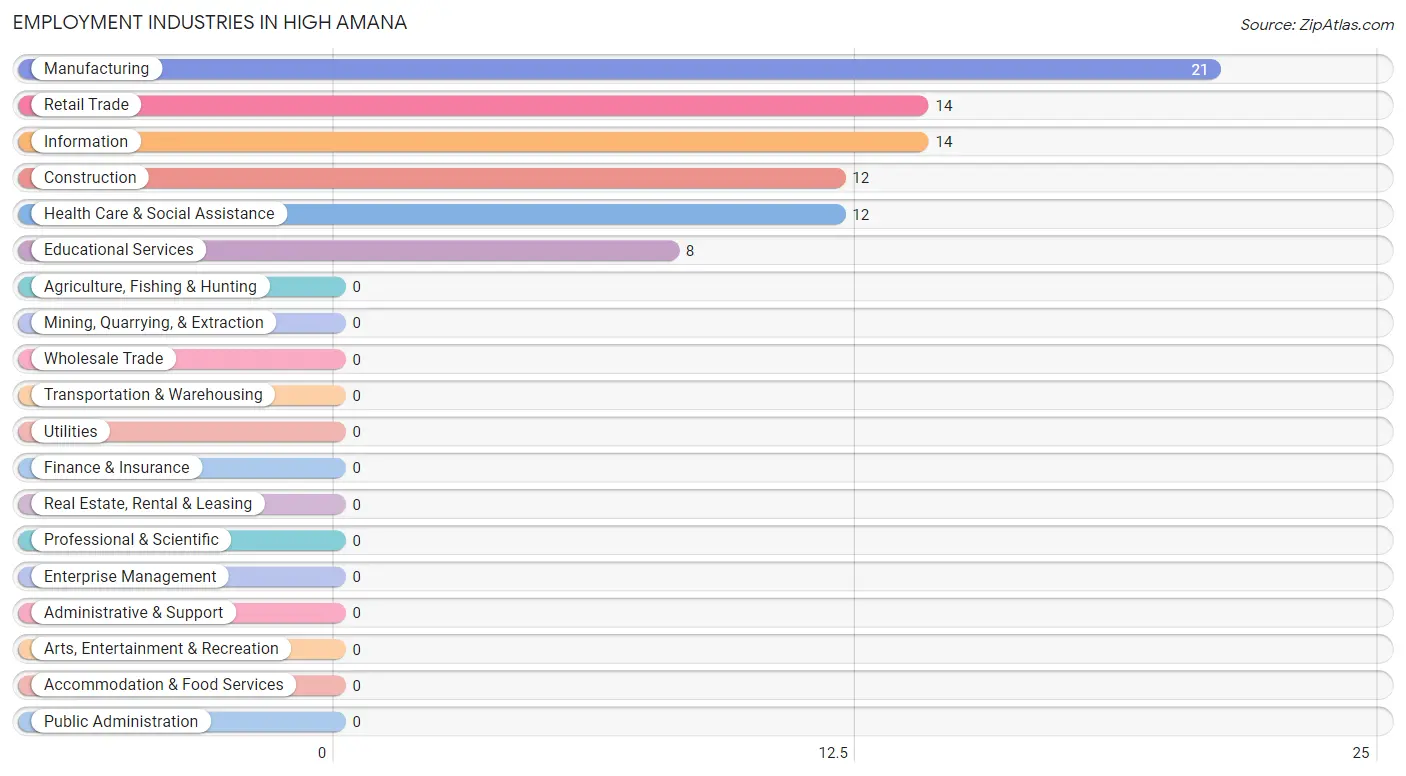
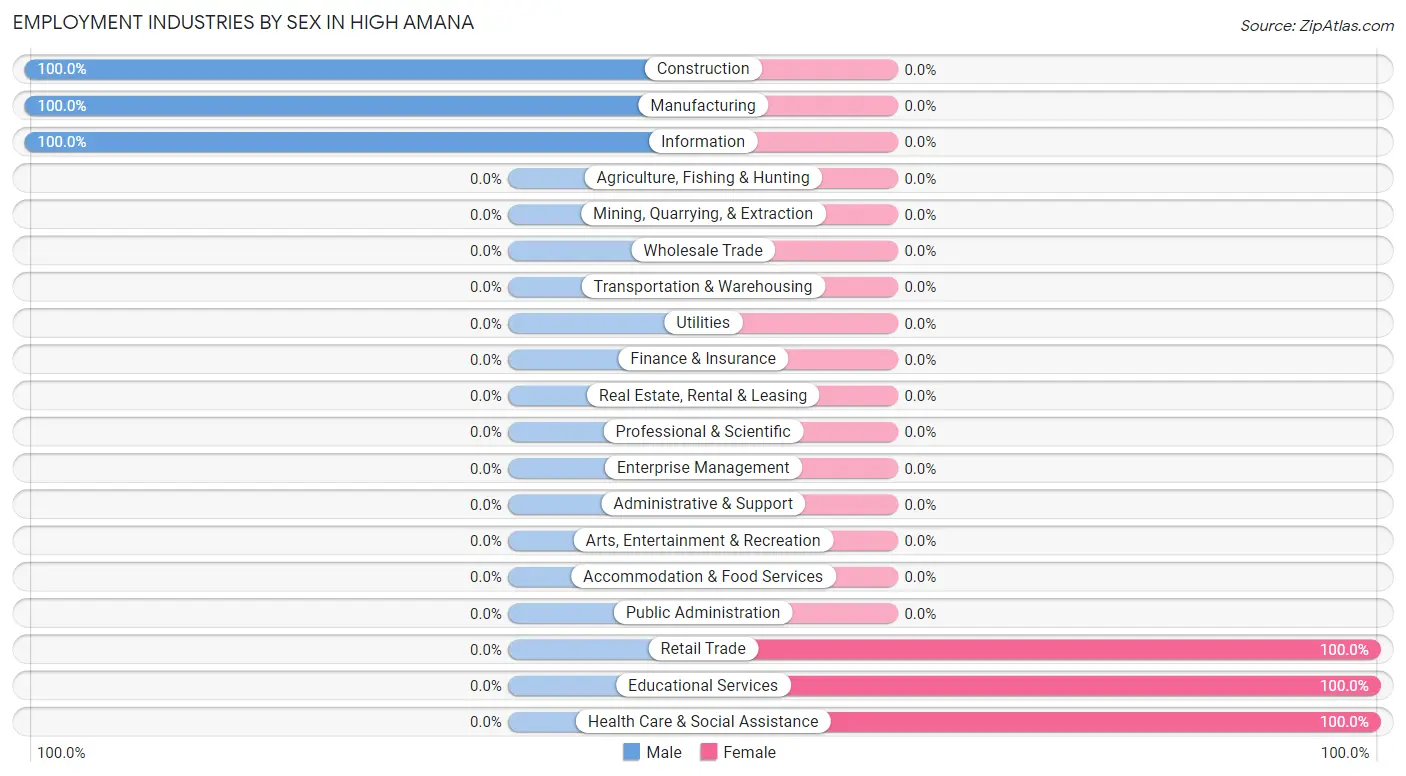
Employment Industries by Sex in High Amana
The High Amana industries that see more men than women are Construction (100.0%), Manufacturing (100.0%), and Information (100.0%), whereas the industries that tend to have a higher number of women are Retail Trade (100.0%), Educational Services (100.0%), and Health Care & Social Assistance (100.0%).
| Industry | Male | Female |
| Agriculture, Fishing & Hunting | 0 (0.0%) | 0 (0.0%) |
| Mining, Quarrying, & Extraction | 0 (0.0%) | 0 (0.0%) |
| Construction | 12 (100.0%) | 0 (0.0%) |
| Manufacturing | 21 (100.0%) | 0 (0.0%) |
| Wholesale Trade | 0 (0.0%) | 0 (0.0%) |
| Retail Trade | 0 (0.0%) | 14 (100.0%) |
| Transportation & Warehousing | 0 (0.0%) | 0 (0.0%) |
| Utilities | 0 (0.0%) | 0 (0.0%) |
| Information | 14 (100.0%) | 0 (0.0%) |
| Finance & Insurance | 0 (0.0%) | 0 (0.0%) |
| Real Estate, Rental & Leasing | 0 (0.0%) | 0 (0.0%) |
| Professional & Scientific | 0 (0.0%) | 0 (0.0%) |
| Enterprise Management | 0 (0.0%) | 0 (0.0%) |
| Administrative & Support | 0 (0.0%) | 0 (0.0%) |
| Educational Services | 0 (0.0%) | 8 (100.0%) |
| Health Care & Social Assistance | 0 (0.0%) | 12 (100.0%) |
| Arts, Entertainment & Recreation | 0 (0.0%) | 0 (0.0%) |
| Accommodation & Food Services | 0 (0.0%) | 0 (0.0%) |
| Public Administration | 0 (0.0%) | 0 (0.0%) |
| Total | 47 (58.0%) | 34 (42.0%) |
Education in High Amana
School Enrollment in High Amana
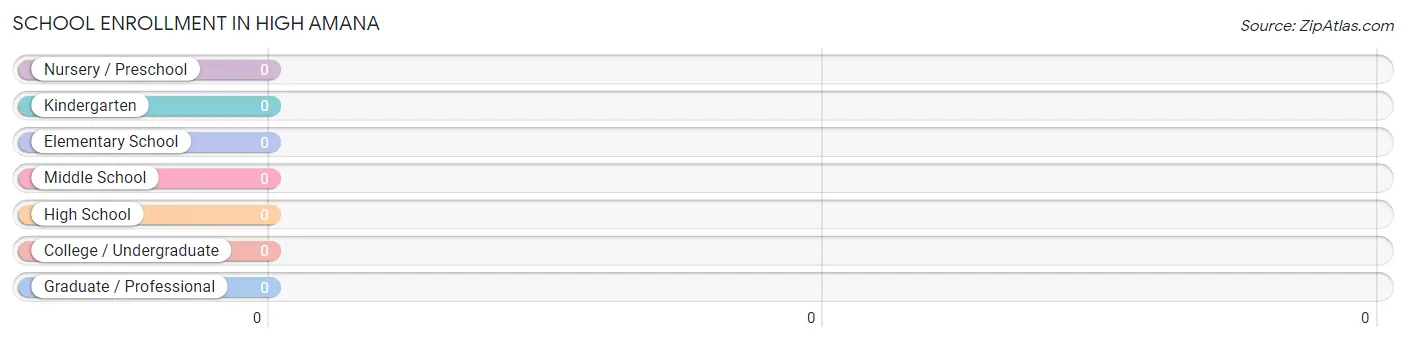
| School Level | # Students | % Students |
| Nursery / Preschool | 0 | 0.0% |
| Kindergarten | 0 | 0.0% |
| Elementary School | 0 | 0.0% |
| Middle School | 0 | 0.0% |
| High School | 0 | 0.0% |
| College / Undergraduate | 0 | 0.0% |
| Graduate / Professional | 0 | 0.0% |
| Total | 0 | 0.0% |
School Enrollment by Age by Funding Source in High Amana
| Age Bracket | Public School | Private School |
| 3 to 4 Year Olds | 0 (0.0%) | 0 (0.0%) |
| 5 to 9 Year Old | 0 (0.0%) | 0 (0.0%) |
| 10 to 14 Year Olds | 0 (0.0%) | 0 (0.0%) |
| 15 to 17 Year Olds | 0 (0.0%) | 0 (0.0%) |
| 18 to 19 Year Olds | 0 (0.0%) | 0 (0.0%) |
| 20 to 24 Year Olds | 0 (0.0%) | 0 (0.0%) |
| 25 to 34 Year Olds | 0 (0.0%) | 0 (0.0%) |
| 35 Years and over | 0 (0.0%) | 0 (0.0%) |
| Total | 0 (0.0%) | 0 (0.0%) |
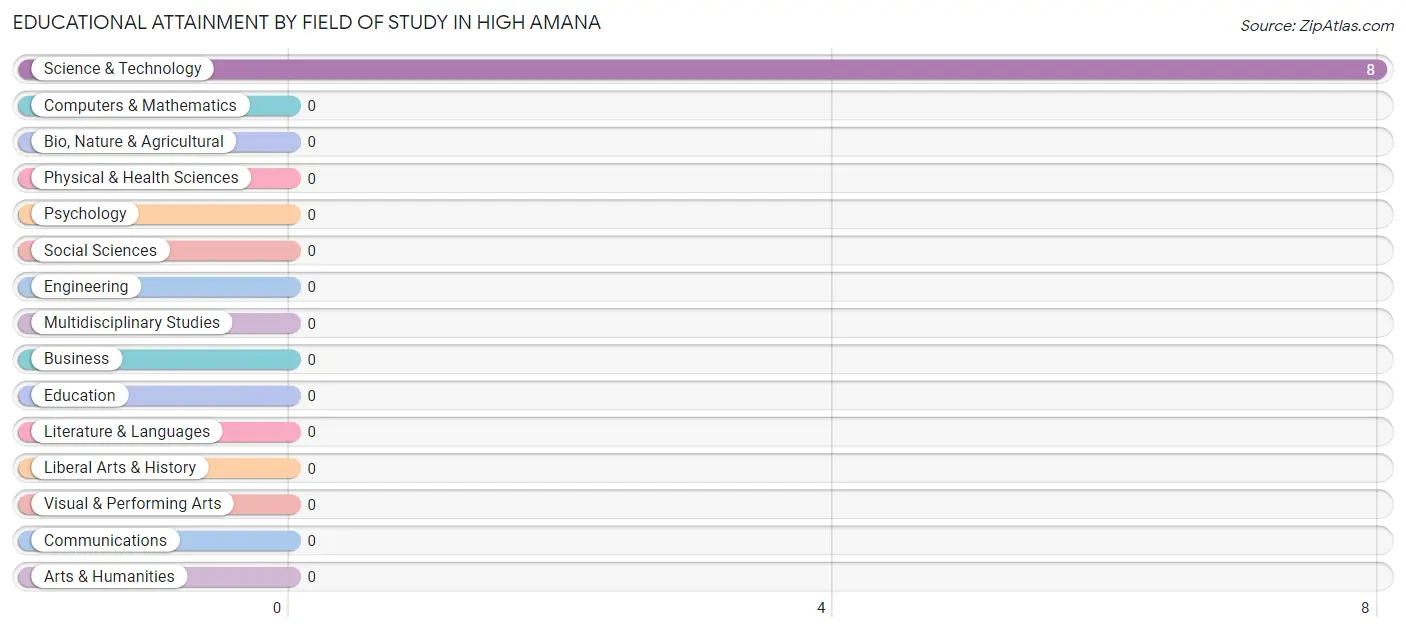
Educational Attainment by Field of Study in High Amana
, and science & technology (8 | 100.0%) are the most common fields of study among 8 individuals in High Amana who have obtained a bachelor's degree or higher.
| Field of Study | # Graduates | % Graduates |
| Computers & Mathematics | 0 | 0.0% |
| Bio, Nature & Agricultural | 0 | 0.0% |
| Physical & Health Sciences | 0 | 0.0% |
| Psychology | 0 | 0.0% |
| Social Sciences | 0 | 0.0% |
| Engineering | 0 | 0.0% |
| Multidisciplinary Studies | 0 | 0.0% |
| Science & Technology | 8 | 100.0% |
| Business | 0 | 0.0% |
| Education | 0 | 0.0% |
| Literature & Languages | 0 | 0.0% |
| Liberal Arts & History | 0 | 0.0% |
| Visual & Performing Arts | 0 | 0.0% |
| Communications | 0 | 0.0% |
| Arts & Humanities | 0 | 0.0% |
| Total | 8 | 100.0% |
Transportation & Commute in High Amana
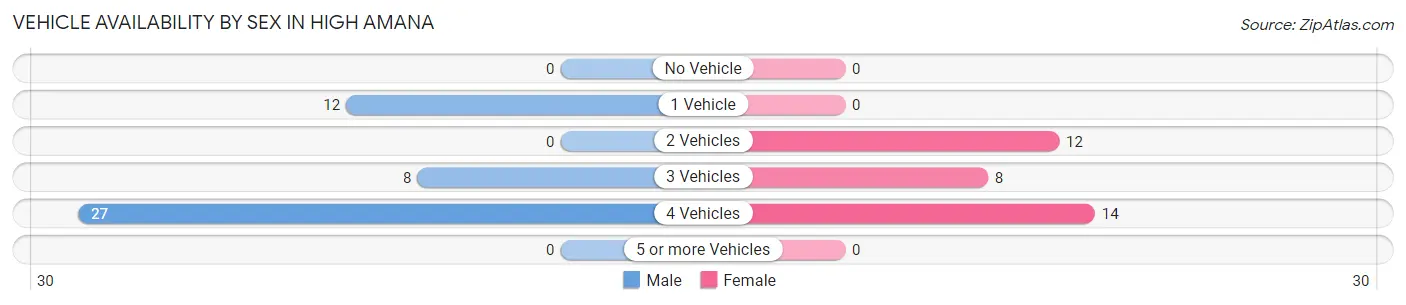
Vehicle Availability by Sex in High Amana
The most prevalent vehicle ownership categories in High Amana are males with 4 vehicles (27, accounting for 57.5%) and females with 4 vehicles (14, making up 79.4%).
| Vehicles Available | Male | Female |
| No Vehicle | 0 (0.0%) | 0 (0.0%) |
| 1 Vehicle | 12 (25.5%) | 0 (0.0%) |
| 2 Vehicles | 0 (0.0%) | 12 (35.3%) |
| 3 Vehicles | 8 (17.0%) | 8 (23.5%) |
| 4 Vehicles | 27 (57.5%) | 14 (41.2%) |
| 5 or more Vehicles | 0 (0.0%) | 0 (0.0%) |
| Total | 47 (100.0%) | 34 (100.0%) |
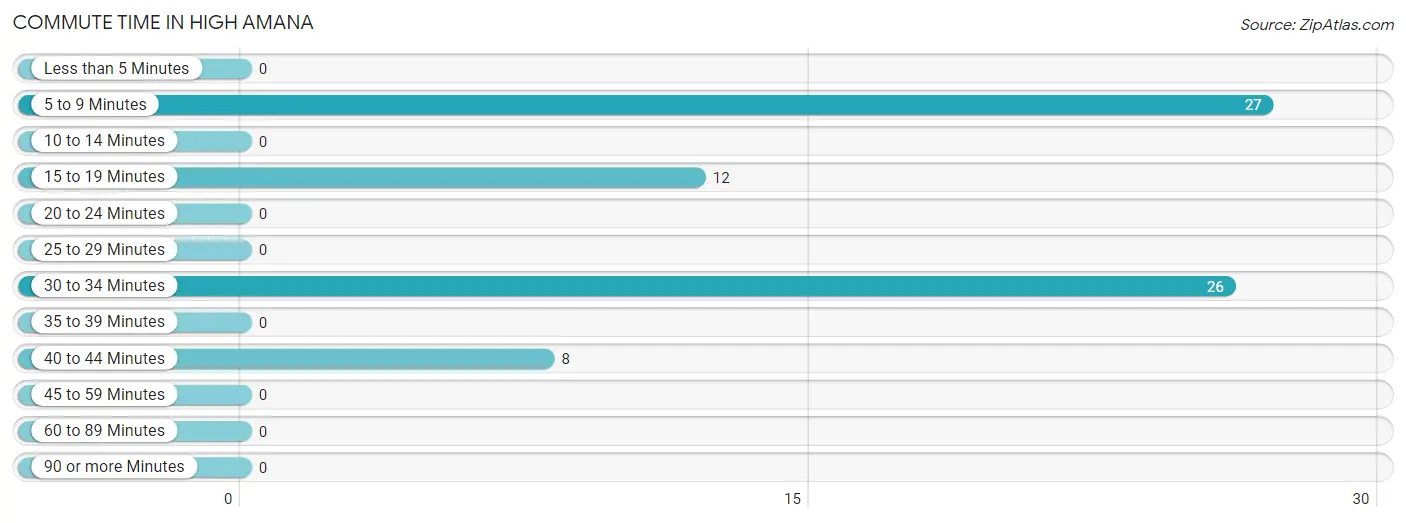
Commute Time in High Amana
The most frequently occuring commute durations in High Amana are 5 to 9 minutes (27 commuters, 37.0%), 30 to 34 minutes (26 commuters, 35.6%), and 15 to 19 minutes (12 commuters, 16.4%).
| Commute Time | # Commuters | % Commuters |
| Less than 5 Minutes | 0 | 0.0% |
| 5 to 9 Minutes | 27 | 37.0% |
| 10 to 14 Minutes | 0 | 0.0% |
| 15 to 19 Minutes | 12 | 16.4% |
| 20 to 24 Minutes | 0 | 0.0% |
| 25 to 29 Minutes | 0 | 0.0% |
| 30 to 34 Minutes | 26 | 35.6% |
| 35 to 39 Minutes | 0 | 0.0% |
| 40 to 44 Minutes | 8 | 11.0% |
| 45 to 59 Minutes | 0 | 0.0% |
| 60 to 89 Minutes | 0 | 0.0% |
| 90 or more Minutes | 0 | 0.0% |
Commute Time by Sex in High Amana
The most common commute times in High Amana are 30 to 34 minutes (26 commuters, 66.7%) for males and 5 to 9 minutes (14 commuters, 41.2%) for females.
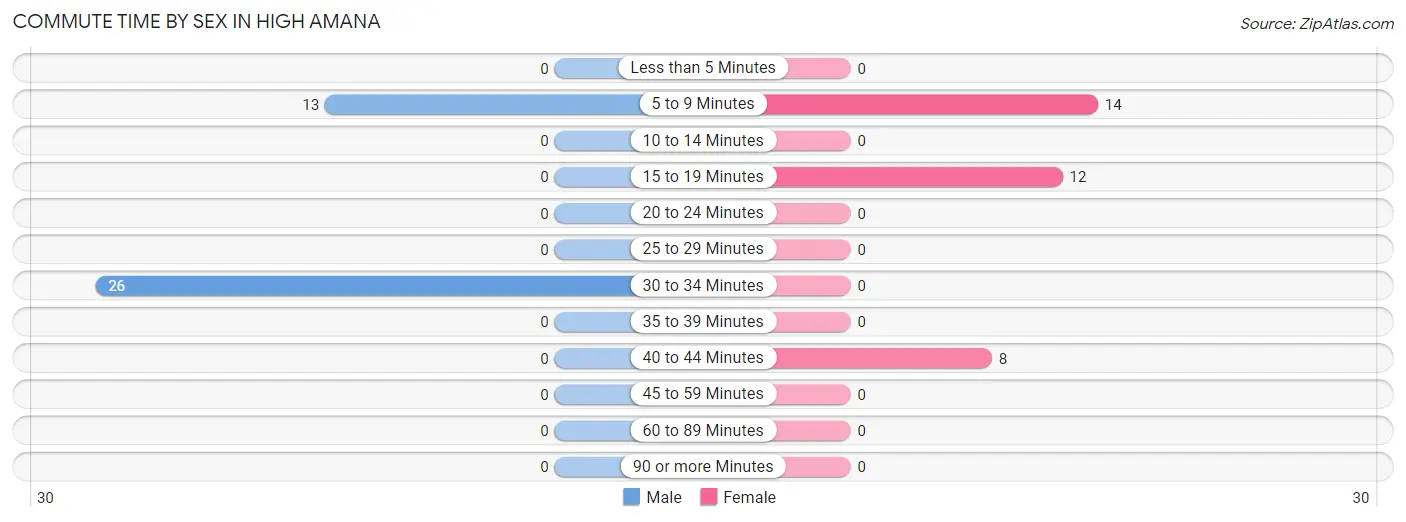
| Commute Time | Male | Female |
| Less than 5 Minutes | 0 (0.0%) | 0 (0.0%) |
| 5 to 9 Minutes | 13 (33.3%) | 14 (41.2%) |
| 10 to 14 Minutes | 0 (0.0%) | 0 (0.0%) |
| 15 to 19 Minutes | 0 (0.0%) | 12 (35.3%) |
| 20 to 24 Minutes | 0 (0.0%) | 0 (0.0%) |
| 25 to 29 Minutes | 0 (0.0%) | 0 (0.0%) |
| 30 to 34 Minutes | 26 (66.7%) | 0 (0.0%) |
| 35 to 39 Minutes | 0 (0.0%) | 0 (0.0%) |
| 40 to 44 Minutes | 0 (0.0%) | 8 (23.5%) |
| 45 to 59 Minutes | 0 (0.0%) | 0 (0.0%) |
| 60 to 89 Minutes | 0 (0.0%) | 0 (0.0%) |
| 90 or more Minutes | 0 (0.0%) | 0 (0.0%) |
Time of Departure to Work by Sex in High Amana
The most frequent times of departure to work in High Amana are 6:00 AM to 6:29 AM (25, 64.1%) for males and 12:00 AM to 4:59 AM (14, 41.2%) for females.
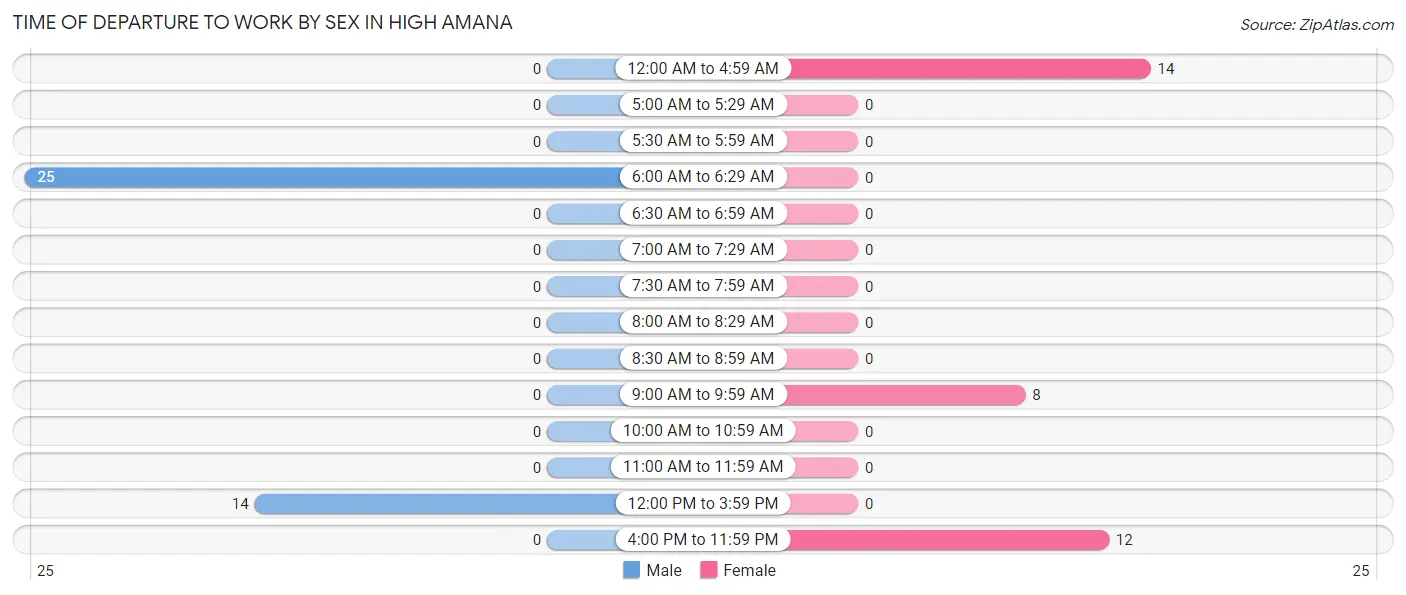
| Time of Departure | Male | Female |
| 12:00 AM to 4:59 AM | 0 (0.0%) | 14 (41.2%) |
| 5:00 AM to 5:29 AM | 0 (0.0%) | 0 (0.0%) |
| 5:30 AM to 5:59 AM | 0 (0.0%) | 0 (0.0%) |
| 6:00 AM to 6:29 AM | 25 (64.1%) | 0 (0.0%) |
| 6:30 AM to 6:59 AM | 0 (0.0%) | 0 (0.0%) |
| 7:00 AM to 7:29 AM | 0 (0.0%) | 0 (0.0%) |
| 7:30 AM to 7:59 AM | 0 (0.0%) | 0 (0.0%) |
| 8:00 AM to 8:29 AM | 0 (0.0%) | 0 (0.0%) |
| 8:30 AM to 8:59 AM | 0 (0.0%) | 0 (0.0%) |
| 9:00 AM to 9:59 AM | 0 (0.0%) | 8 (23.5%) |
| 10:00 AM to 10:59 AM | 0 (0.0%) | 0 (0.0%) |
| 11:00 AM to 11:59 AM | 0 (0.0%) | 0 (0.0%) |
| 12:00 PM to 3:59 PM | 14 (35.9%) | 0 (0.0%) |
| 4:00 PM to 11:59 PM | 0 (0.0%) | 12 (35.3%) |
| Total | 39 (100.0%) | 34 (100.0%) |
Housing Occupancy in High Amana
Occupancy by Ownership in High Amana
Of the total 46 dwellings in High Amana, owner-occupied units account for 46 (100.0%), while renter-occupied units make up 0 (0.0%).
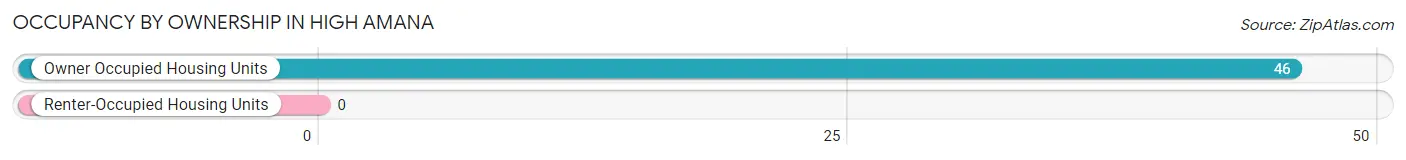
| Occupancy | # Housing Units | % Housing Units |
| Owner Occupied Housing Units | 46 | 100.0% |
| Renter-Occupied Housing Units | 0 | 0.0% |
| Total Occupied Housing Units | 46 | 100.0% |
Occupancy by Household Size in High Amana
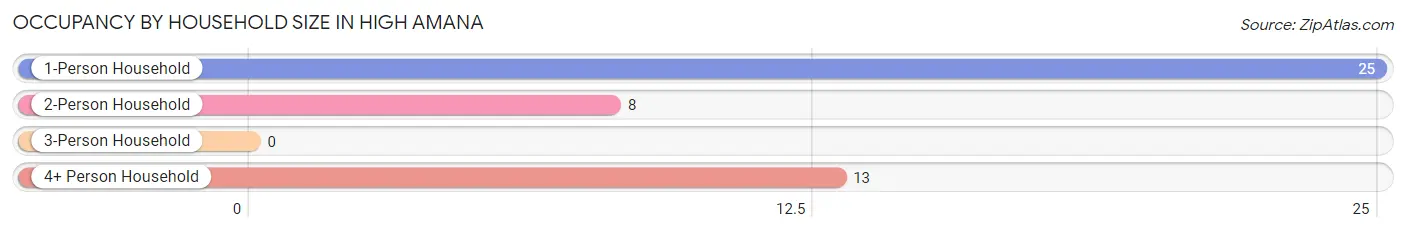
| Household Size | # Housing Units | % Housing Units |
| 1-Person Household | 25 | 54.3% |
| 2-Person Household | 8 | 17.4% |
| 3-Person Household | 0 | 0.0% |
| 4+ Person Household | 13 | 28.3% |
| Total Housing Units | 46 | 100.0% |
Occupancy by Ownership by Household Size in High Amana
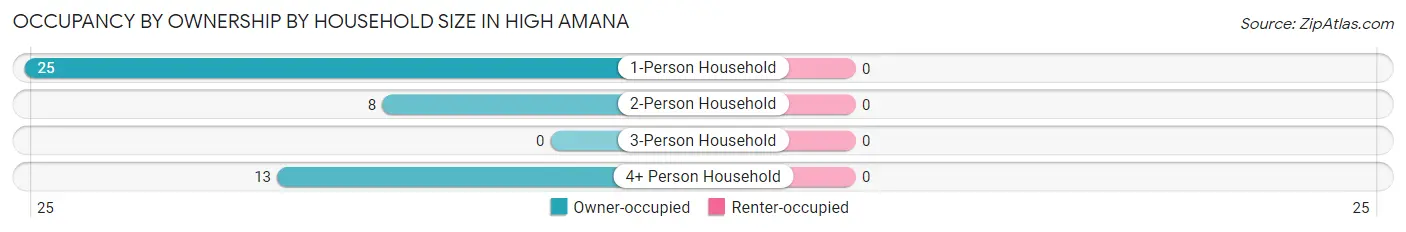
| Household Size | Owner-occupied | Renter-occupied |
| 1-Person Household | 25 (100.0%) | 0 (0.0%) |
| 2-Person Household | 8 (100.0%) | 0 (0.0%) |
| 3-Person Household | 0 (0.0%) | 0 (0.0%) |
| 4+ Person Household | 13 (100.0%) | 0 (0.0%) |
| Total Housing Units | 46 (100.0%) | 0 (0.0%) |
Occupancy by Educational Attainment in High Amana
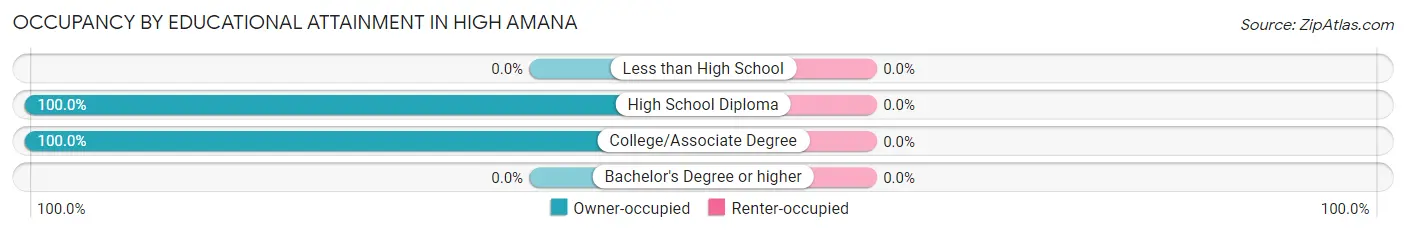
| Household Size | Owner-occupied | Renter-occupied |
| Less than High School | 0 (0.0%) | 0 (0.0%) |
| High School Diploma | 26 (100.0%) | 0 (0.0%) |
| College/Associate Degree | 20 (100.0%) | 0 (0.0%) |
| Bachelor's Degree or higher | 0 (0.0%) | 0 (0.0%) |
Occupancy by Age of Householder in High Amana
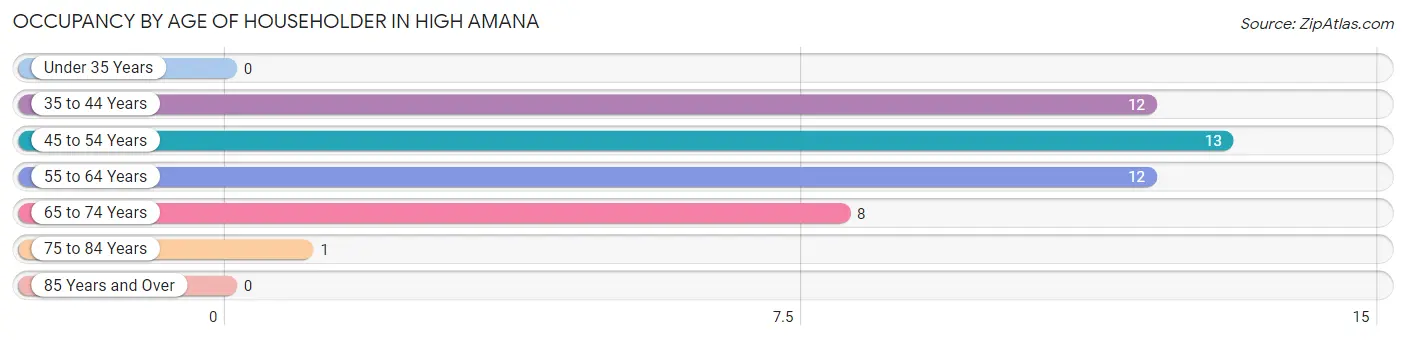
| Age Bracket | # Households | % Households |
| Under 35 Years | 0 | 0.0% |
| 35 to 44 Years | 12 | 26.1% |
| 45 to 54 Years | 13 | 28.3% |
| 55 to 64 Years | 12 | 26.1% |
| 65 to 74 Years | 8 | 17.4% |
| 75 to 84 Years | 1 | 2.2% |
| 85 Years and Over | 0 | 0.0% |
| Total | 46 | 100.0% |
Housing Finances in High Amana
Median Income by Occupancy in High Amana
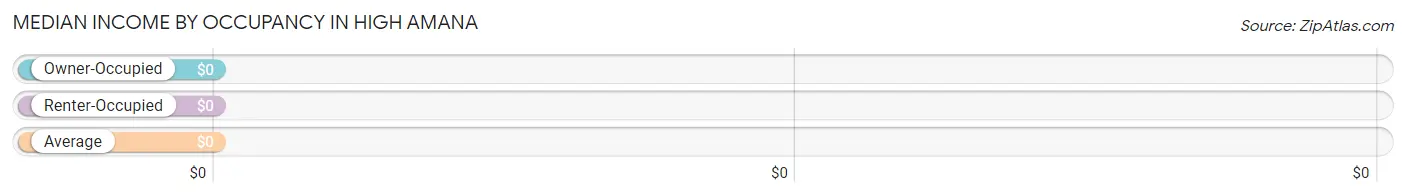
| Occupancy Type | # Households | Median Income |
| Owner-Occupied | 46 (100.0%) | $0 |
| Renter-Occupied | 0 (0.0%) | $0 |
| Average | 46 (100.0%) | $0 |
Occupancy by Householder Income Bracket in High Amana
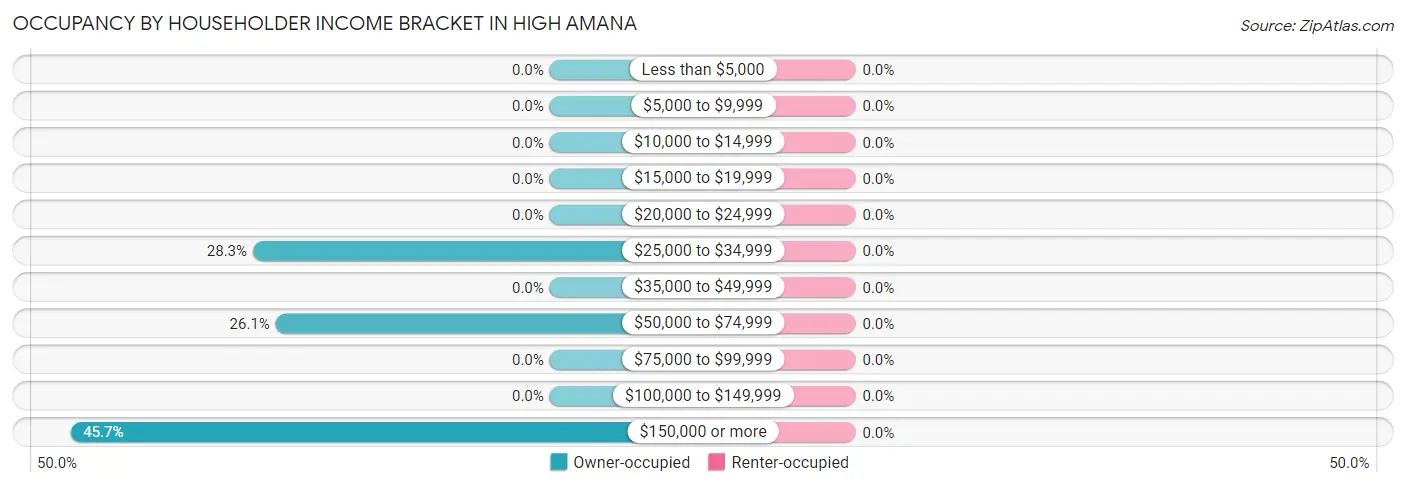
| Income Bracket | Owner-occupied | Renter-occupied |
| Less than $5,000 | 0 (0.0%) | 0 (0.0%) |
| $5,000 to $9,999 | 0 (0.0%) | 0 (0.0%) |
| $10,000 to $14,999 | 0 (0.0%) | 0 (0.0%) |
| $15,000 to $19,999 | 0 (0.0%) | 0 (0.0%) |
| $20,000 to $24,999 | 0 (0.0%) | 0 (0.0%) |
| $25,000 to $34,999 | 13 (28.3%) | 0 (0.0%) |
| $35,000 to $49,999 | 0 (0.0%) | 0 (0.0%) |
| $50,000 to $74,999 | 12 (26.1%) | 0 (0.0%) |
| $75,000 to $99,999 | 0 (0.0%) | 0 (0.0%) |
| $100,000 to $149,999 | 0 (0.0%) | 0 (0.0%) |
| $150,000 or more | 21 (45.7%) | 0 (0.0%) |
| Total | 46 (100.0%) | 0 (0.0%) |
Monthly Housing Cost Tiers in High Amana
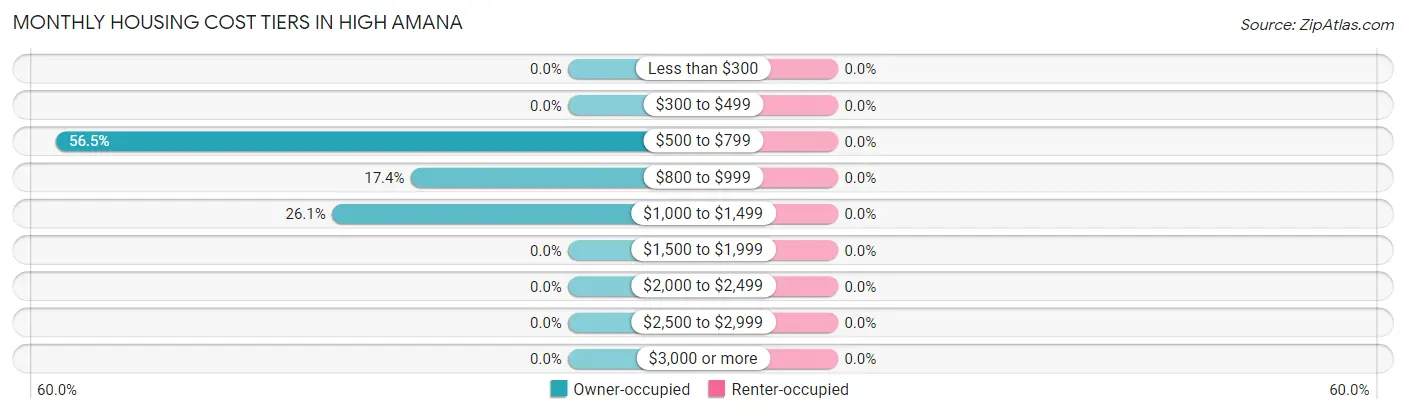
| Monthly Cost | Owner-occupied | Renter-occupied |
| Less than $300 | 0 (0.0%) | 0 (0.0%) |
| $300 to $499 | 0 (0.0%) | 0 (0.0%) |
| $500 to $799 | 26 (56.5%) | 0 (0.0%) |
| $800 to $999 | 8 (17.4%) | 0 (0.0%) |
| $1,000 to $1,499 | 12 (26.1%) | 0 (0.0%) |
| $1,500 to $1,999 | 0 (0.0%) | 0 (0.0%) |
| $2,000 to $2,499 | 0 (0.0%) | 0 (0.0%) |
| $2,500 to $2,999 | 0 (0.0%) | 0 (0.0%) |
| $3,000 or more | 0 (0.0%) | 0 (0.0%) |
| Total | 46 (100.0%) | 0 (0.0%) |
Physical Housing Characteristics in High Amana
Housing Structures in High Amana
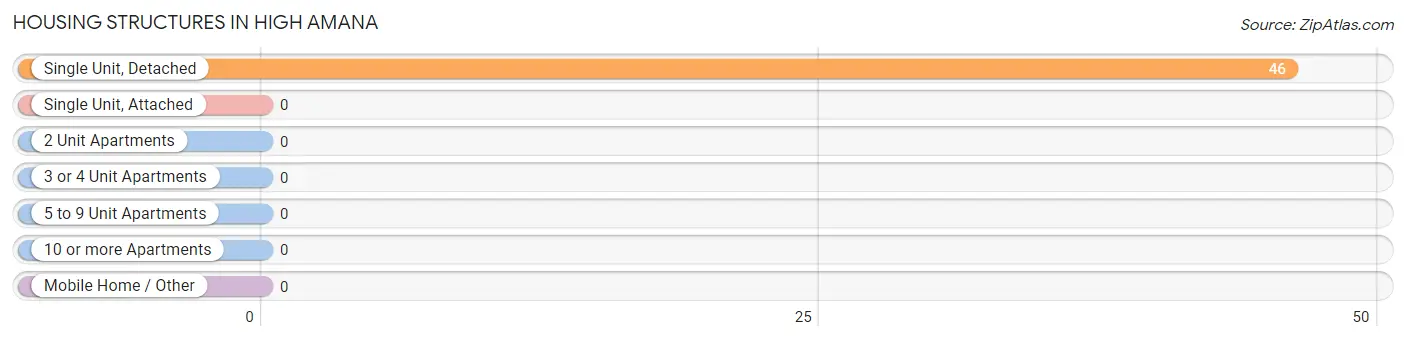
| Structure Type | # Housing Units | % Housing Units |
| Single Unit, Detached | 46 | 100.0% |
| Single Unit, Attached | 0 | 0.0% |
| 2 Unit Apartments | 0 | 0.0% |
| 3 or 4 Unit Apartments | 0 | 0.0% |
| 5 to 9 Unit Apartments | 0 | 0.0% |
| 10 or more Apartments | 0 | 0.0% |
| Mobile Home / Other | 0 | 0.0% |
| Total | 46 | 100.0% |
Housing Structures by Occupancy in High Amana
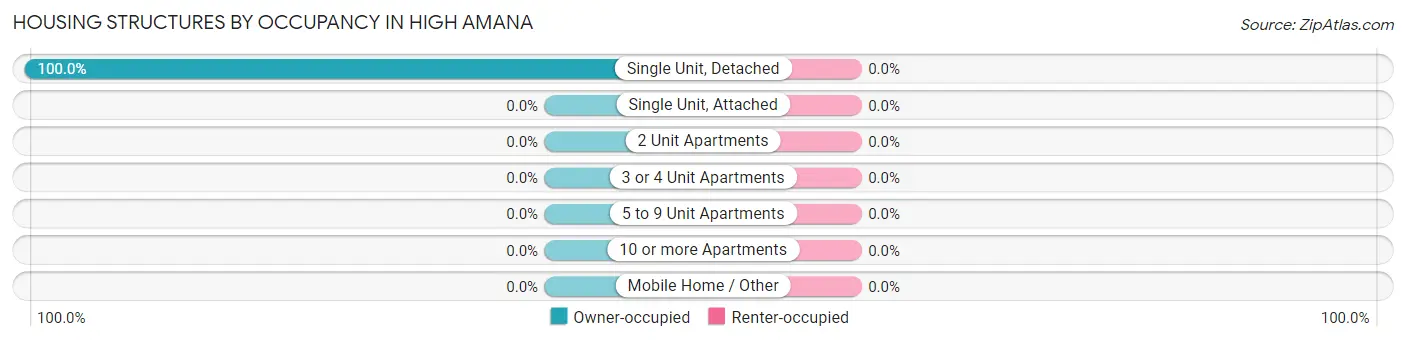
| Structure Type | Owner-occupied | Renter-occupied |
| Single Unit, Detached | 46 (100.0%) | 0 (0.0%) |
| Single Unit, Attached | 0 (0.0%) | 0 (0.0%) |
| 2 Unit Apartments | 0 (0.0%) | 0 (0.0%) |
| 3 or 4 Unit Apartments | 0 (0.0%) | 0 (0.0%) |
| 5 to 9 Unit Apartments | 0 (0.0%) | 0 (0.0%) |
| 10 or more Apartments | 0 (0.0%) | 0 (0.0%) |
| Mobile Home / Other | 0 (0.0%) | 0 (0.0%) |
| Total | 46 (100.0%) | 0 (0.0%) |
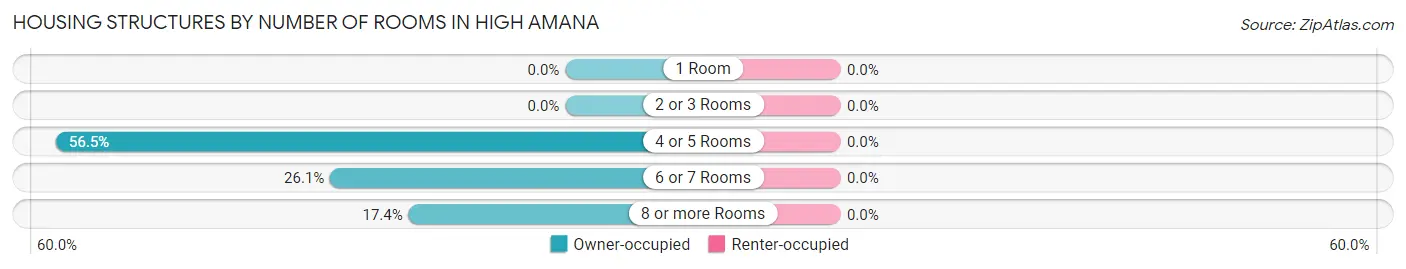
Housing Structures by Number of Rooms in High Amana
| Number of Rooms | Owner-occupied | Renter-occupied |
| 1 Room | 0 (0.0%) | 0 (0.0%) |
| 2 or 3 Rooms | 0 (0.0%) | 0 (0.0%) |
| 4 or 5 Rooms | 26 (56.5%) | 0 (0.0%) |
| 6 or 7 Rooms | 12 (26.1%) | 0 (0.0%) |
| 8 or more Rooms | 8 (17.4%) | 0 (0.0%) |
| Total | 46 (100.0%) | 0 (0.0%) |
Housing Structure by Heating Type in High Amana
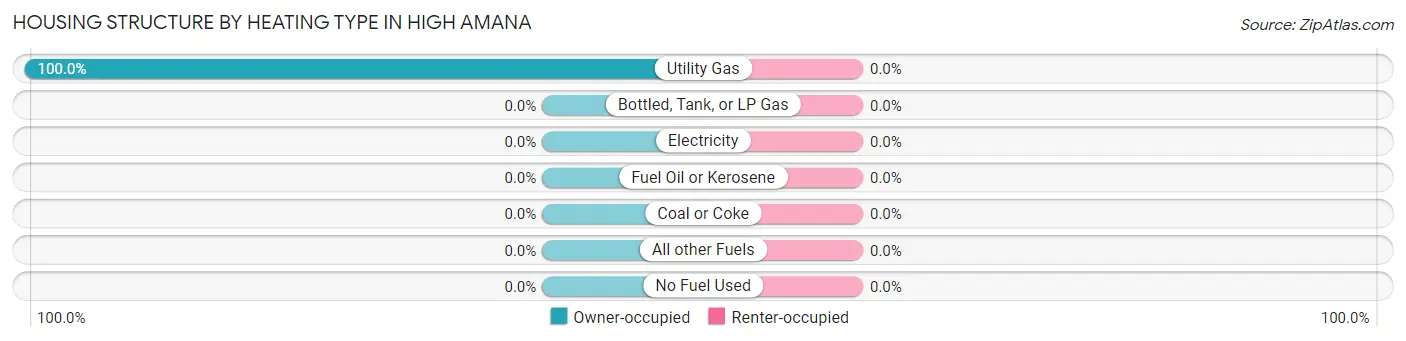
| Heating Type | Owner-occupied | Renter-occupied |
| Utility Gas | 46 (100.0%) | 0 (0.0%) |
| Bottled, Tank, or LP Gas | 0 (0.0%) | 0 (0.0%) |
| Electricity | 0 (0.0%) | 0 (0.0%) |
| Fuel Oil or Kerosene | 0 (0.0%) | 0 (0.0%) |
| Coal or Coke | 0 (0.0%) | 0 (0.0%) |
| All other Fuels | 0 (0.0%) | 0 (0.0%) |
| No Fuel Used | 0 (0.0%) | 0 (0.0%) |
| Total | 46 (100.0%) | 0 (0.0%) |
Household Vehicle Usage in High Amana
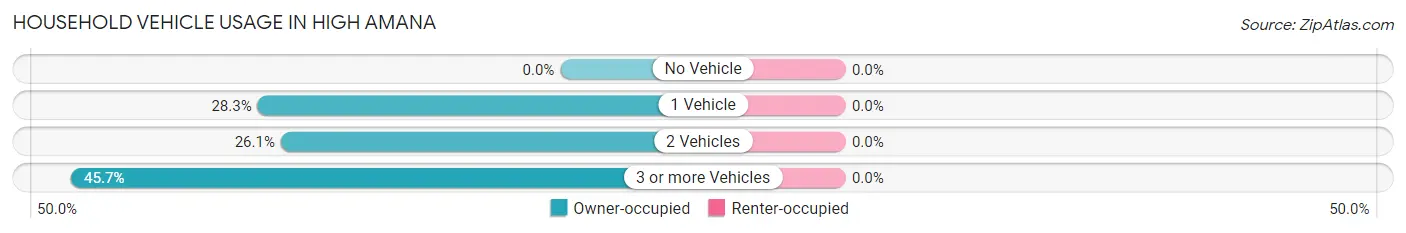
| Vehicles per Household | Owner-occupied | Renter-occupied |
| No Vehicle | 0 (0.0%) | 0 (0.0%) |
| 1 Vehicle | 13 (28.3%) | 0 (0.0%) |
| 2 Vehicles | 12 (26.1%) | 0 (0.0%) |
| 3 or more Vehicles | 21 (45.7%) | 0 (0.0%) |
| Total | 46 (100.0%) | 0 (0.0%) |
Real Estate & Mortgages in High Amana
Real Estate and Mortgage Overview in High Amana
| Characteristic | Without Mortgage | With Mortgage |
| Housing Units | 26 | 20 |
| Median Property Value | $173,100 | $0 |
| Median Household Income | - | - |
| Monthly Housing Costs | $593 | $0 |
| Real Estate Taxes | - | - |
Property Value by Mortgage Status in High Amana
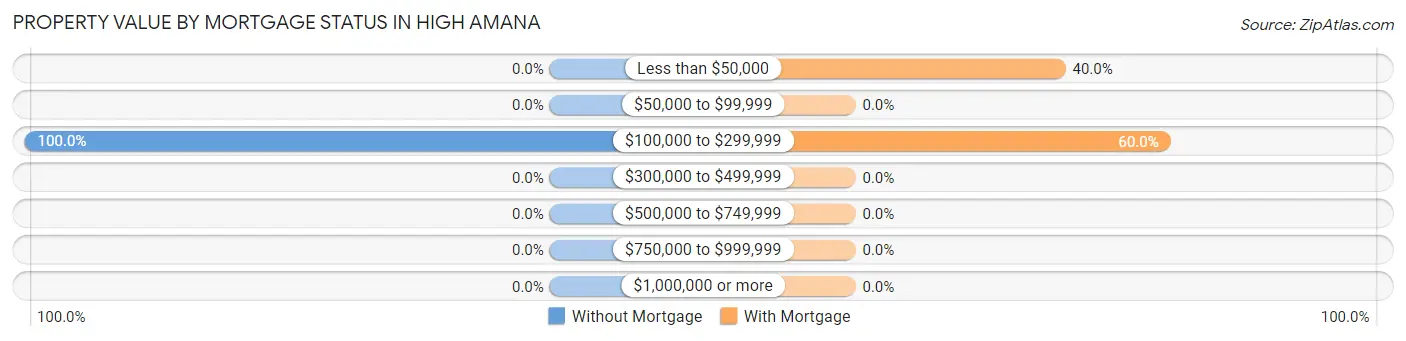
| Property Value | Without Mortgage | With Mortgage |
| Less than $50,000 | 0 (0.0%) | 8 (40.0%) |
| $50,000 to $99,999 | 0 (0.0%) | 0 (0.0%) |
| $100,000 to $299,999 | 26 (100.0%) | 12 (60.0%) |
| $300,000 to $499,999 | 0 (0.0%) | 0 (0.0%) |
| $500,000 to $749,999 | 0 (0.0%) | 0 (0.0%) |
| $750,000 to $999,999 | 0 (0.0%) | 0 (0.0%) |
| $1,000,000 or more | 0 (0.0%) | 0 (0.0%) |
| Total | 26 (100.0%) | 20 (100.0%) |
Household Income by Mortgage Status in High Amana
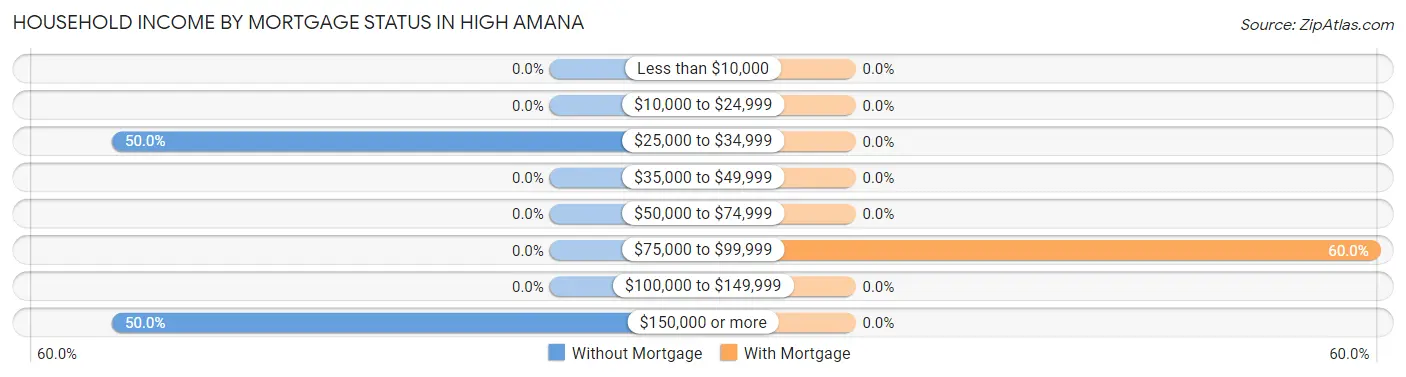
| Household Income | Without Mortgage | With Mortgage |
| Less than $10,000 | 0 (0.0%) | 0 (0.0%) |
| $10,000 to $24,999 | 0 (0.0%) | 0 (0.0%) |
| $25,000 to $34,999 | 13 (50.0%) | 0 (0.0%) |
| $35,000 to $49,999 | 0 (0.0%) | 0 (0.0%) |
| $50,000 to $74,999 | 0 (0.0%) | 0 (0.0%) |
| $75,000 to $99,999 | 0 (0.0%) | 12 (60.0%) |
| $100,000 to $149,999 | 0 (0.0%) | 0 (0.0%) |
| $150,000 or more | 13 (50.0%) | 0 (0.0%) |
| Total | 26 (100.0%) | 20 (100.0%) |
Property Value to Household Income Ratio in High Amana
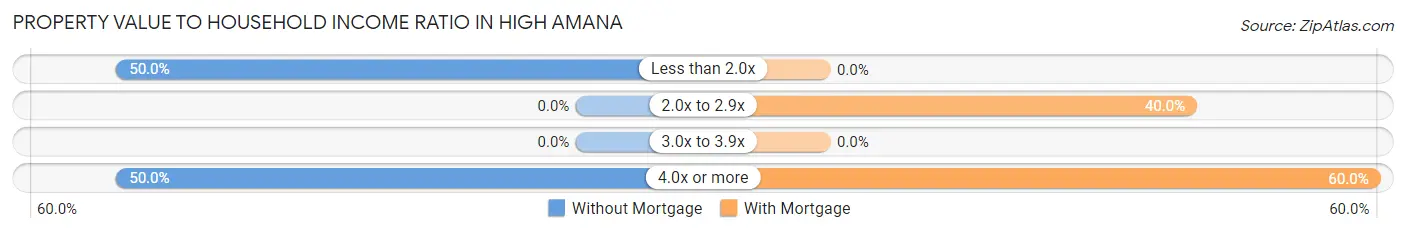
| Value-to-Income Ratio | Without Mortgage | With Mortgage |
| Less than 2.0x | 13 (50.0%) | 0 (0.0%) |
| 2.0x to 2.9x | 0 (0.0%) | 8 (40.0%) |
| 3.0x to 3.9x | 0 (0.0%) | 0 (0.0%) |
| 4.0x or more | 13 (50.0%) | 12 (60.0%) |
| Total | 26 (100.0%) | 20 (100.0%) |
Real Estate Taxes by Mortgage Status in High Amana
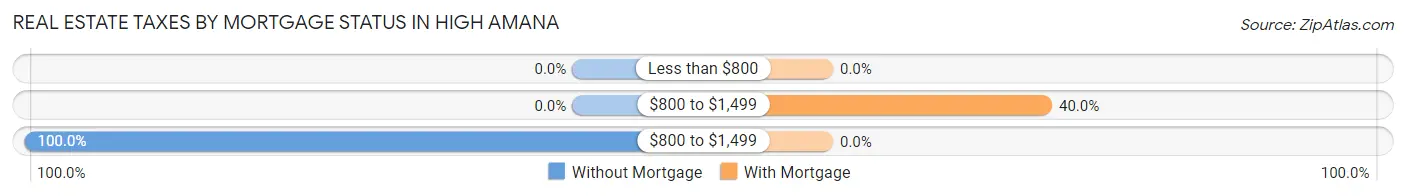
| Property Taxes | Without Mortgage | With Mortgage |
| Less than $800 | 0 (0.0%) | 0 (0.0%) |
| $800 to $1,499 | 0 (0.0%) | 8 (40.0%) |
| $800 to $1,499 | 26 (100.0%) | 0 (0.0%) |
| Total | 26 (100.0%) | 20 (100.0%) |
Health & Disability in High Amana
Health Insurance Coverage by Age in High Amana
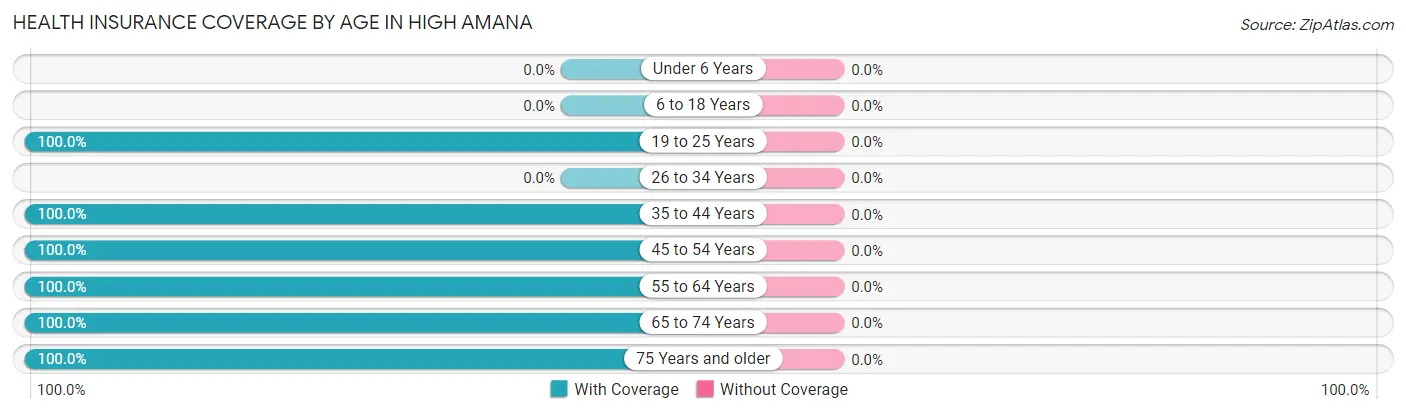
| Age Bracket | With Coverage | Without Coverage |
| Under 6 Years | 0 (0.0%) | 0 (0.0%) |
| 6 to 18 Years | 0 (0.0%) | 0 (0.0%) |
| 19 to 25 Years | 14 (100.0%) | 0 (0.0%) |
| 26 to 34 Years | 0 (0.0%) | 0 (0.0%) |
| 35 to 44 Years | 12 (100.0%) | 0 (0.0%) |
| 45 to 54 Years | 27 (100.0%) | 0 (0.0%) |
| 55 to 64 Years | 12 (100.0%) | 0 (0.0%) |
| 65 to 74 Years | 16 (100.0%) | 0 (0.0%) |
| 75 Years and older | 11 (100.0%) | 0 (0.0%) |
| Total | 92 (100.0%) | 0 (0.0%) |
Health Insurance Coverage by Citizenship Status in High Amana
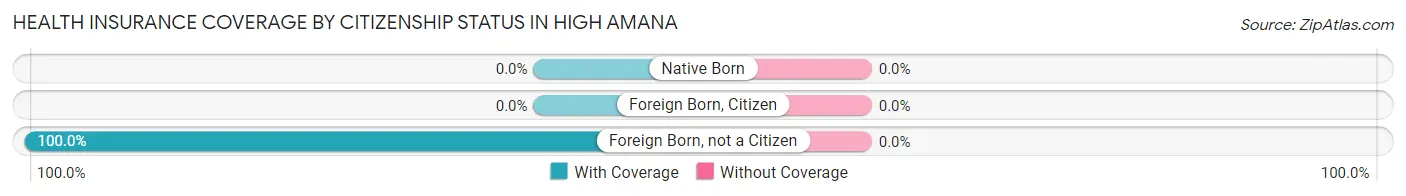
| Citizenship Status | With Coverage | Without Coverage |
| Native Born | 0 (0.0%) | 0 (0.0%) |
| Foreign Born, Citizen | 0 (0.0%) | 0 (0.0%) |
| Foreign Born, not a Citizen | 14 (100.0%) | 0 (0.0%) |
Health Insurance Coverage by Household Income in High Amana
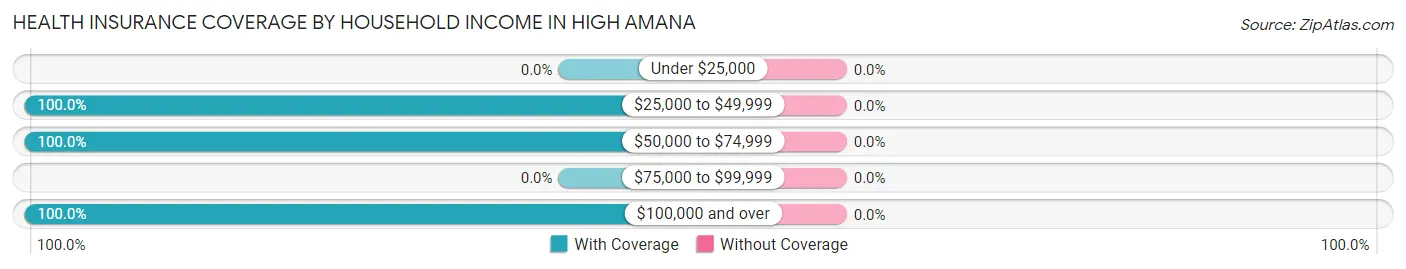
| Household Income | With Coverage | Without Coverage |
| Under $25,000 | 0 (0.0%) | 0 (0.0%) |
| $25,000 to $49,999 | 13 (100.0%) | 0 (0.0%) |
| $50,000 to $74,999 | 12 (100.0%) | 0 (0.0%) |
| $75,000 to $99,999 | 0 (0.0%) | 0 (0.0%) |
| $100,000 and over | 67 (100.0%) | 0 (0.0%) |
Public vs Private Health Insurance Coverage by Age in High Amana
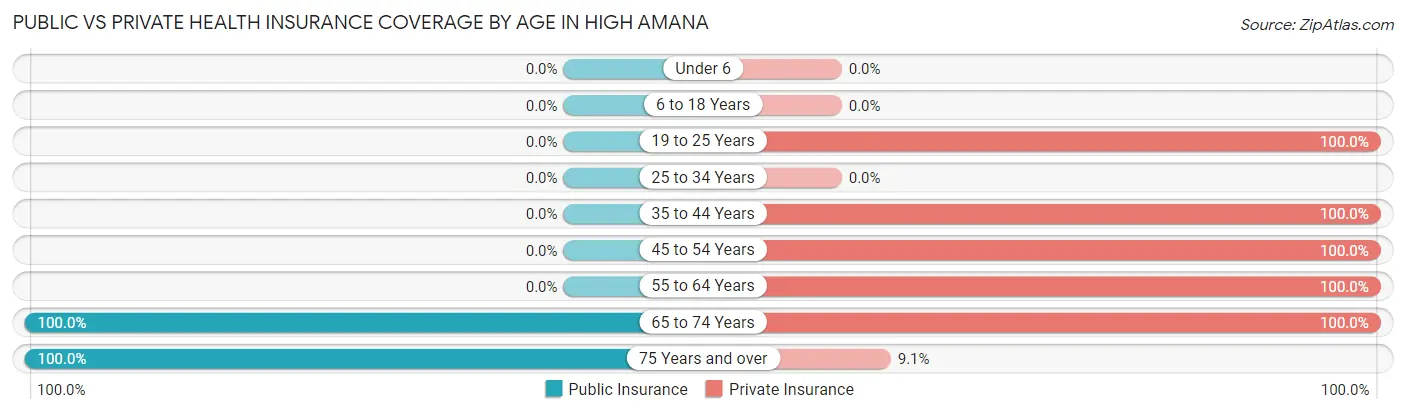
| Age Bracket | Public Insurance | Private Insurance |
| Under 6 | 0 (0.0%) | 0 (0.0%) |
| 6 to 18 Years | 0 (0.0%) | 0 (0.0%) |
| 19 to 25 Years | 0 (0.0%) | 14 (100.0%) |
| 25 to 34 Years | 0 (0.0%) | 0 (0.0%) |
| 35 to 44 Years | 0 (0.0%) | 12 (100.0%) |
| 45 to 54 Years | 0 (0.0%) | 27 (100.0%) |
| 55 to 64 Years | 0 (0.0%) | 12 (100.0%) |
| 65 to 74 Years | 16 (100.0%) | 16 (100.0%) |
| 75 Years and over | 11 (100.0%) | 1 (9.1%) |
| Total | 27 (29.3%) | 82 (89.1%) |
Disability Status by Sex by Age in High Amana
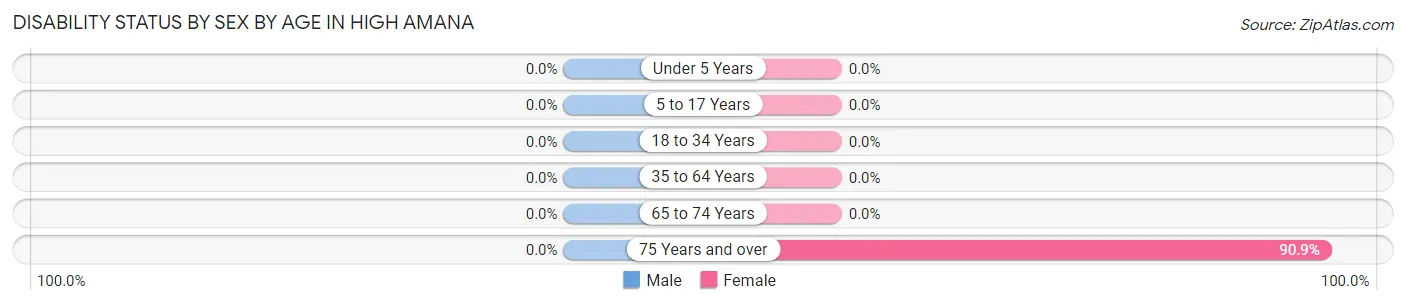
| Age Bracket | Male | Female |
| Under 5 Years | 0 (0.0%) | 0 (0.0%) |
| 5 to 17 Years | 0 (0.0%) | 0 (0.0%) |
| 18 to 34 Years | 0 (0.0%) | 0 (0.0%) |
| 35 to 64 Years | 0 (0.0%) | 0 (0.0%) |
| 65 to 74 Years | 0 (0.0%) | 0 (0.0%) |
| 75 Years and over | 0 (0.0%) | 10 (90.9%) |
Disability Class by Sex by Age in High Amana
Disability Class: Hearing Difficulty
| Age Bracket | Male | Female |
| Under 5 Years | 0 (0.0%) | 0 (0.0%) |
| 5 to 17 Years | 0 (0.0%) | 0 (0.0%) |
| 18 to 34 Years | 0 (0.0%) | 0 (0.0%) |
| 35 to 64 Years | 0 (0.0%) | 0 (0.0%) |
| 65 to 74 Years | 0 (0.0%) | 0 (0.0%) |
| 75 Years and over | 0 (0.0%) | 0 (0.0%) |
Disability Class: Vision Difficulty
| Age Bracket | Male | Female |
| Under 5 Years | 0 (0.0%) | 0 (0.0%) |
| 5 to 17 Years | 0 (0.0%) | 0 (0.0%) |
| 18 to 34 Years | 0 (0.0%) | 0 (0.0%) |
| 35 to 64 Years | 0 (0.0%) | 0 (0.0%) |
| 65 to 74 Years | 0 (0.0%) | 0 (0.0%) |
| 75 Years and over | 0 (0.0%) | 0 (0.0%) |
Disability Class: Cognitive Difficulty
| Age Bracket | Male | Female |
| 5 to 17 Years | 0 (0.0%) | 0 (0.0%) |
| 18 to 34 Years | 0 (0.0%) | 0 (0.0%) |
| 35 to 64 Years | 0 (0.0%) | 0 (0.0%) |
| 65 to 74 Years | 0 (0.0%) | 0 (0.0%) |
| 75 Years and over | 0 (0.0%) | 0 (0.0%) |
Disability Class: Ambulatory Difficulty
| Age Bracket | Male | Female |
| 5 to 17 Years | 0 (0.0%) | 0 (0.0%) |
| 18 to 34 Years | 0 (0.0%) | 0 (0.0%) |
| 35 to 64 Years | 0 (0.0%) | 0 (0.0%) |
| 65 to 74 Years | 0 (0.0%) | 0 (0.0%) |
| 75 Years and over | 0 (0.0%) | 10 (90.9%) |
Disability Class: Self-Care Difficulty
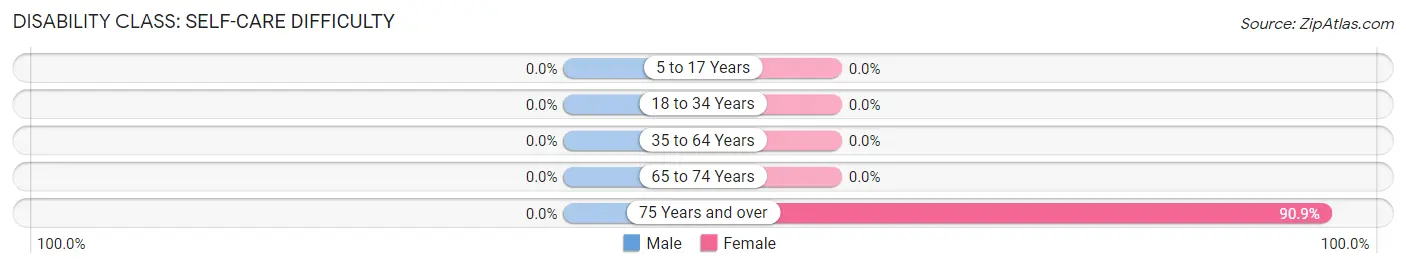
| Age Bracket | Male | Female |
| 5 to 17 Years | 0 (0.0%) | 0 (0.0%) |
| 18 to 34 Years | 0 (0.0%) | 0 (0.0%) |
| 35 to 64 Years | 0 (0.0%) | 0 (0.0%) |
| 65 to 74 Years | 0 (0.0%) | 0 (0.0%) |
| 75 Years and over | 0 (0.0%) | 10 (90.9%) |
Technology Access in High Amana
Computing Device Access in High Amana
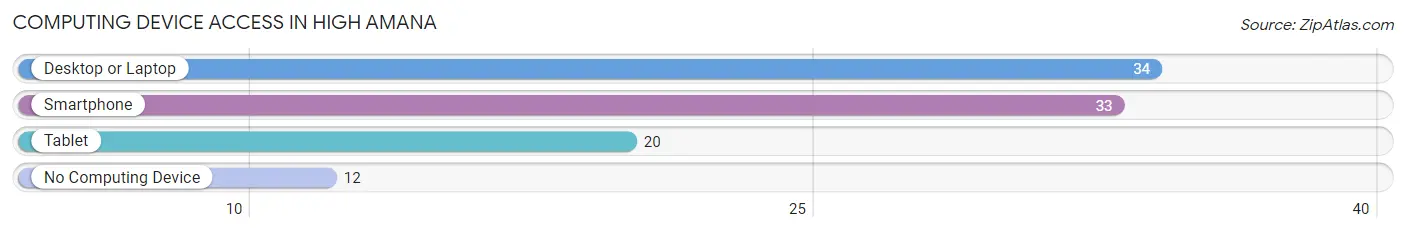
| Device Type | # Households | % Households |
| Desktop or Laptop | 34 | 73.9% |
| Smartphone | 33 | 71.7% |
| Tablet | 20 | 43.5% |
| No Computing Device | 12 | 26.1% |
| Total | 46 | 100.0% |
Internet Access in High Amana
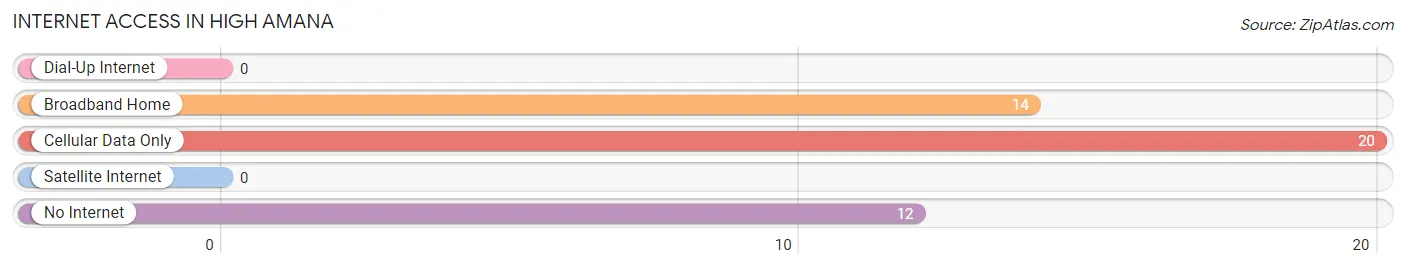
| Internet Type | # Households | % Households |
| Dial-Up Internet | 0 | 0.0% |
| Broadband Home | 14 | 30.4% |
| Cellular Data Only | 20 | 43.5% |
| Satellite Internet | 0 | 0.0% |
| No Internet | 12 | 26.1% |
| Total | 46 | 100.0% |
High Amana Summary
Amana, Iowa is a small town located in Iowa County, Iowa, United States. It is part of the Iowa City, IA Metropolitan Statistical Area. The population was 1,945 at the 2000 census. Amana is a part of the Amana Colonies, a group of seven villages that were founded by German Pietists in the mid-19th century. The Amana Colonies are listed on the National Register of Historic Places and are a National Historic Landmark.
History
The Amana Colonies were founded in 1855 by German Pietists who had emigrated from Germany to the United States in the 1840s. The group was led by Christian Metz, who had been a leader of the Community of True Inspiration, a religious group in Germany. The group had been persecuted in Germany and sought religious freedom in the United States. The group purchased 6,000 acres of land in Iowa and established seven villages: Amana, East Amana, High Amana, Middle Amana, South Amana, West Amana, and Homestead.
The Amana Colonies were established as a communal society, with all property and businesses owned by the community. The community was self-sufficient, with members growing their own food, making their own clothing, and building their own homes. The community was also known for its high quality craftsmanship, particularly in furniture and quilts.
The Amana Colonies were a successful communal society for nearly 80 years. In 1932, the community disbanded the communal system and adopted a more traditional capitalist system. The Amana Colonies are still inhabited today, and many of the original buildings and homes are still standing.
Geography
Amana is located at 41°45'17" North, 91°45'45" West (41.754722, -91.762500). According to the United States Census Bureau, the town has a total area of 0.7 square miles (1.8 km2), all of it land.
Economy
The economy of Amana is largely based on tourism. The Amana Colonies are a popular tourist destination, and the town is home to several restaurants, shops, and other businesses that cater to visitors. The Amana Colonies are also home to several wineries, breweries, and distilleries.
The Amana Colonies are also home to several manufacturing companies, including Amana Refrigeration, Amana Tool, and Amana Furniture. These companies produce a variety of products, including refrigerators, tools, and furniture.
Demographics
As of the census of 2000, there were 1,945 people, 817 households, and 545 families residing in the town. The population density was 2,743.2 people per square mile (1,062.2/km2). There were 862 housing units at an average density of 1,210.2 per square mile (468.2/km2). The racial makeup of the town was 98.46% White, 0.21% African American, 0.10% Native American, 0.21% Asian, 0.05% Pacific Islander, 0.31% from other races, and 0.66% from two or more races. Hispanic or Latino of any race were 0.82% of the population.
There were 817 households, out of which 28.2% had children under the age of 18 living with them, 54.2% were married couples living together, 8.2% had a female householder with no husband present, and 33.7% were non-families. 29.2% of all households were made up of individuals, and 14.2% had someone living alone who was 65 years of age or older. The average household size was 2.37 and the average family size was 2.93.
In the town, the population was spread out, with 24.2% under the age of 18, 6.2% from 18 to 24, 25.2% from 25 to 44, 24.2% from 45 to 64, and 20.2% who were 65 years of age or older. The median age was 41 years. For every 100 females, there were 92.2 males. For every 100 females age 18 and over, there were 88.2 males.
The median income for a household in the town was $41,250, and the median income for a family was $50,000. Males had a median income of $31,250 versus $25,000 for females. The per capita income for the town was $20,945. About 4.2% of families and 6.2% of the population were below the poverty line, including 8.2% of those under age 18 and 5.2% of those age 65 or over.
Common Questions
What is Per Capita Income in High Amana?
Per Capita income in High Amana is $91,507.
What is Inequality or Gini Index in High Amana?
Inequality or Gini Index in High Amana is 0.54.
What is the Total Population of High Amana?
Total Population of High Amana is 92.
What is the Total Male Population of High Amana?
Total Male Population of High Amana is 47.
What is the Total Female Population of High Amana?
Total Female Population of High Amana is 45.
What is the Ratio of Males per 100 Females in High Amana?
There are 104.44 Males per 100 Females in High Amana.
What is the Ratio of Females per 100 Males in High Amana?
There are 95.74 Females per 100 Males in High Amana.
What is the Median Population Age in High Amana?
Median Population Age in High Amana is 53.7 Years.
What is the Average Family Size in High Amana
Average Family Size in High Amana is 3.2 People.
What is the Average Household Size in High Amana
Average Household Size in High Amana is 2.0 People.
How Large is the Labor Force in High Amana?
There are 81 People in the Labor Forcein in High Amana.
What is the Percentage of People in the Labor Force in High Amana?
88.0% of People are in the Labor Force in High Amana.