Grinnell, IA Map & Demographics
Grinnell Map
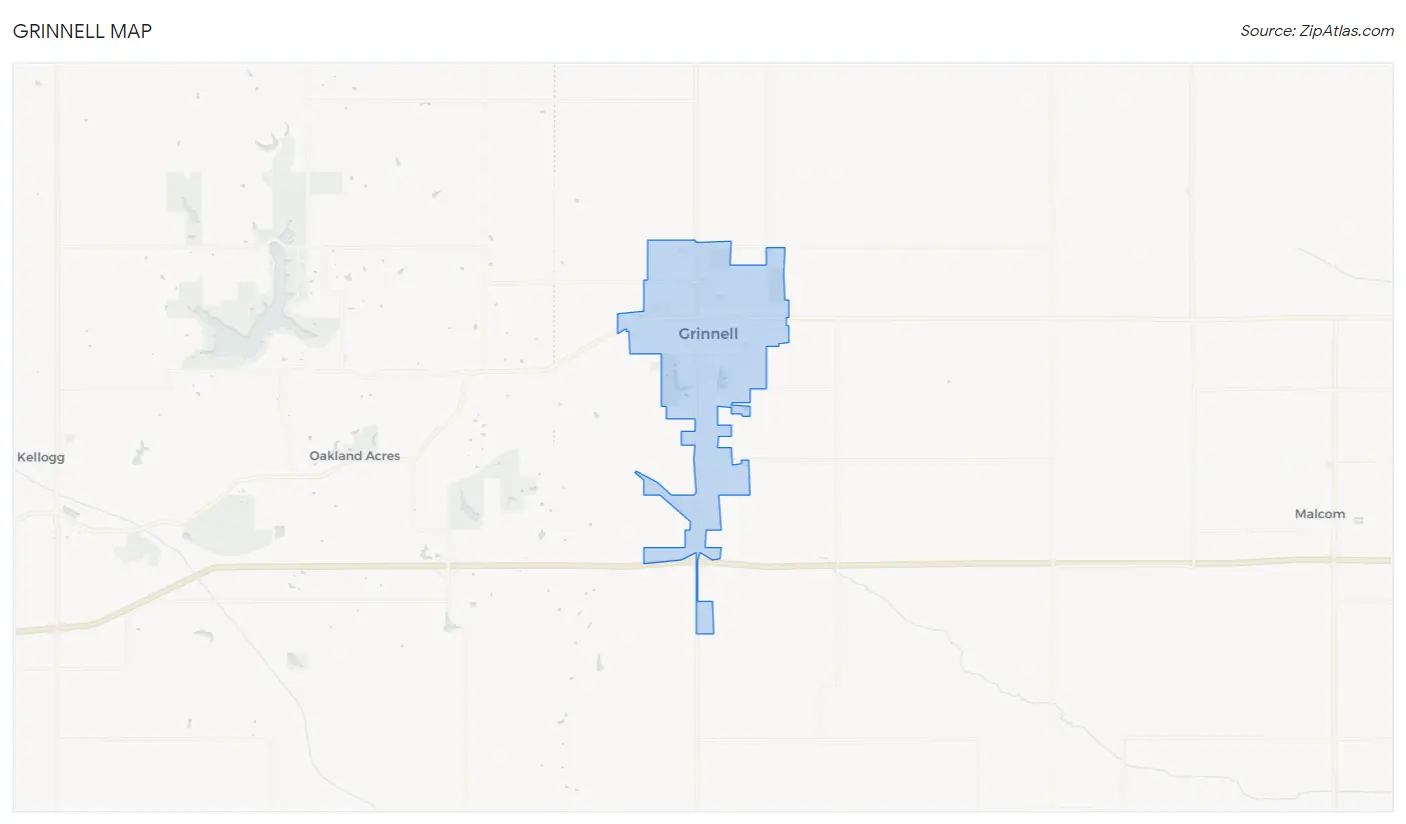
Grinnell Overview
$36,917
PER CAPITA INCOME
$100,985
AVG FAMILY INCOME
$57,813
AVG HOUSEHOLD INCOME
55.5%
WAGE / INCOME GAP [ % ]
44.5¢/ $1
WAGE / INCOME GAP [ $ ]
0.52
INEQUALITY / GINI INDEX
9,511
TOTAL POPULATION
4,352
MALE POPULATION
5,159
FEMALE POPULATION
84.36
MALES / 100 FEMALES
118.54
FEMALES / 100 MALES
39.1
MEDIAN AGE
3.1
AVG FAMILY SIZE
2.1
AVG HOUSEHOLD SIZE
4,756
LABOR FORCE [ PEOPLE ]
59.2%
PERCENT IN LABOR FORCE
4.0%
UNEMPLOYMENT RATE
Grinnell Zip Codes
Grinnell Area Codes
Income in Grinnell
Income Overview in Grinnell
Per Capita Income in Grinnell is $36,917, while median incomes of families and households are $100,985 and $57,813 respectively.
| Characteristic | Number | Measure |
| Per Capita Income | 9,511 | $36,917 |
| Median Family Income | 1,844 | $100,985 |
| Mean Family Income | 1,844 | $137,316 |
| Median Household Income | 3,718 | $57,813 |
| Mean Household Income | 3,718 | $90,744 |
| Income Deficit | 1,844 | $0 |
| Wage / Income Gap (%) | 9,511 | 55.49% |
| Wage / Income Gap ($) | 9,511 | 44.51¢ per $1 |
| Gini / Inequality Index | 9,511 | 0.52 |
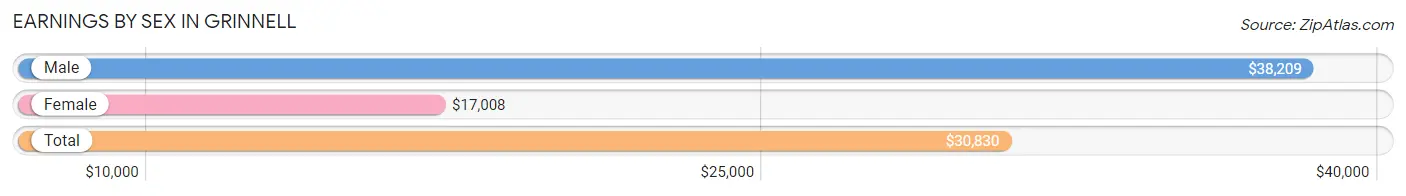
Earnings by Sex in Grinnell
Average Earnings in Grinnell are $30,830, $38,209 for men and $17,008 for women, a difference of 55.5%.
| Sex | Number | Average Earnings |
| Male | 2,624 (49.0%) | $38,209 |
| Female | 2,726 (50.9%) | $17,008 |
| Total | 5,350 (100.0%) | $30,830 |
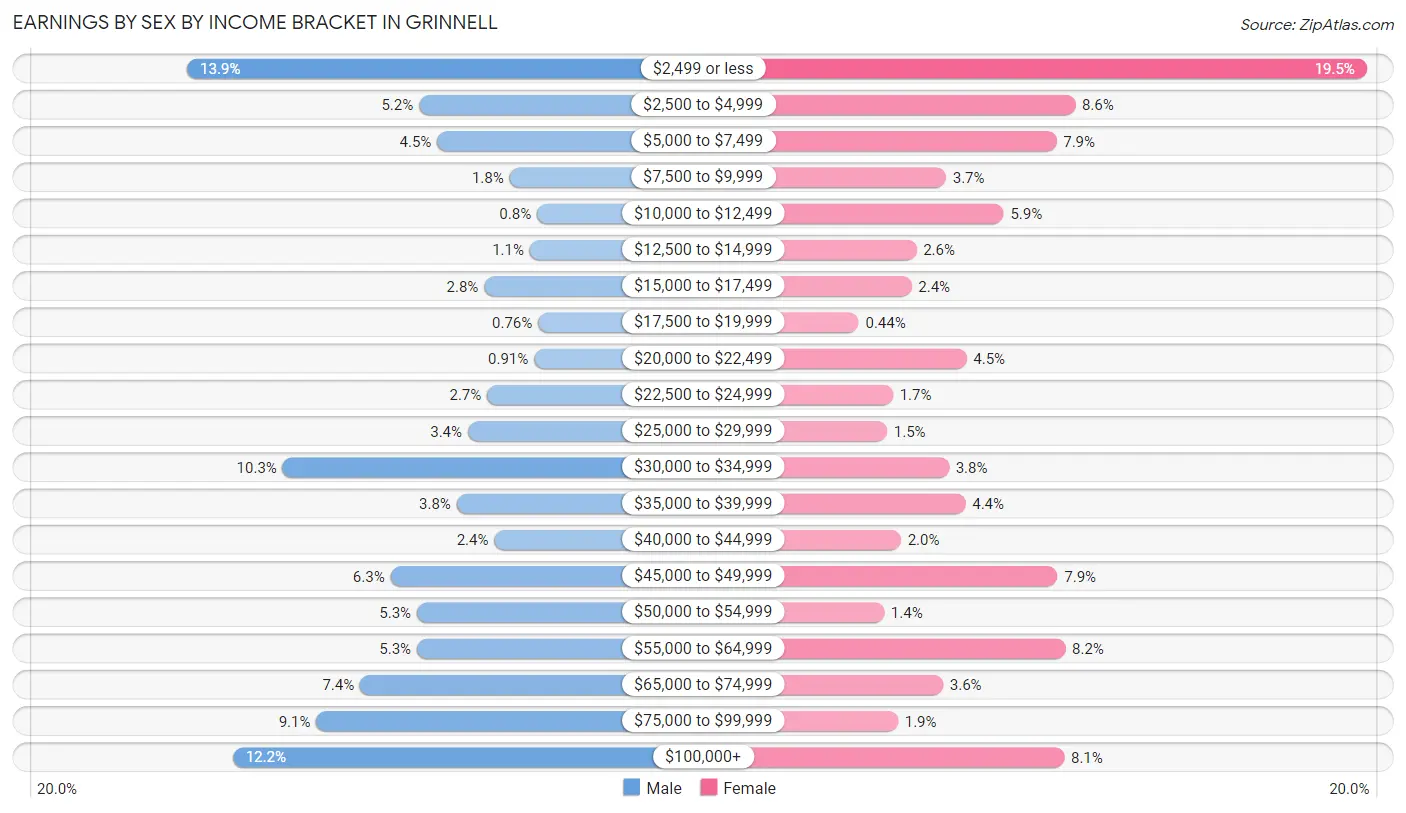
Earnings by Sex by Income Bracket in Grinnell
The most common earnings brackets in Grinnell are $2,499 or less for men (365 | 13.9%) and $2,499 or less for women (531 | 19.5%).
| Income | Male | Female |
| $2,499 or less | 365 (13.9%) | 531 (19.5%) |
| $2,500 to $4,999 | 137 (5.2%) | 233 (8.6%) |
| $5,000 to $7,499 | 119 (4.5%) | 214 (7.9%) |
| $7,500 to $9,999 | 48 (1.8%) | 101 (3.7%) |
| $10,000 to $12,499 | 21 (0.8%) | 160 (5.9%) |
| $12,500 to $14,999 | 28 (1.1%) | 71 (2.6%) |
| $15,000 to $17,499 | 73 (2.8%) | 66 (2.4%) |
| $17,500 to $19,999 | 20 (0.8%) | 12 (0.4%) |
| $20,000 to $22,499 | 24 (0.9%) | 122 (4.5%) |
| $22,500 to $24,999 | 70 (2.7%) | 47 (1.7%) |
| $25,000 to $29,999 | 89 (3.4%) | 41 (1.5%) |
| $30,000 to $34,999 | 271 (10.3%) | 104 (3.8%) |
| $35,000 to $39,999 | 100 (3.8%) | 121 (4.4%) |
| $40,000 to $44,999 | 63 (2.4%) | 55 (2.0%) |
| $45,000 to $49,999 | 165 (6.3%) | 215 (7.9%) |
| $50,000 to $54,999 | 139 (5.3%) | 38 (1.4%) |
| $55,000 to $64,999 | 139 (5.3%) | 223 (8.2%) |
| $65,000 to $74,999 | 195 (7.4%) | 98 (3.6%) |
| $75,000 to $99,999 | 238 (9.1%) | 52 (1.9%) |
| $100,000+ | 320 (12.2%) | 222 (8.1%) |
| Total | 2,624 (100.0%) | 2,726 (100.0%) |
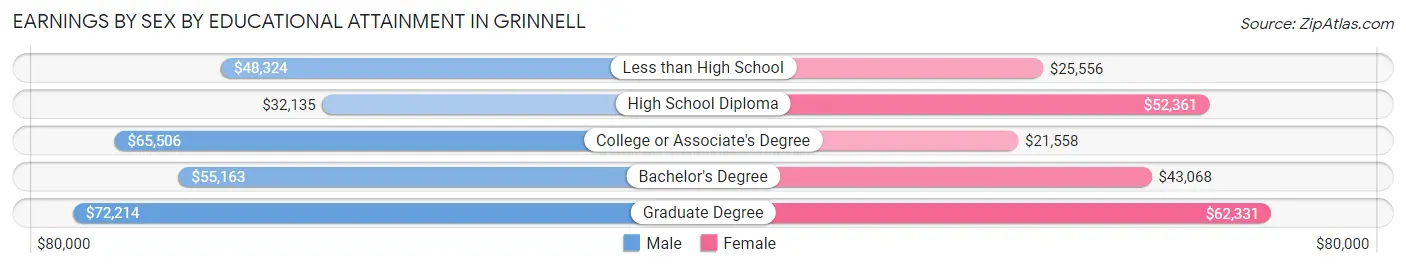
Earnings by Sex by Educational Attainment in Grinnell
Average earnings in Grinnell are $53,527 for men and $45,531 for women, a difference of 14.9%. Men with an educational attainment of graduate degree enjoy the highest average annual earnings of $72,214, while those with high school diploma education earn the least with $32,135. Women with an educational attainment of graduate degree earn the most with the average annual earnings of $62,331, while those with college or associate's degree education have the smallest earnings of $21,558.
| Educational Attainment | Male Income | Female Income |
| Less than High School | $48,324 | $25,556 |
| High School Diploma | $32,135 | $52,361 |
| College or Associate's Degree | $65,506 | $21,558 |
| Bachelor's Degree | $55,163 | $43,068 |
| Graduate Degree | $72,214 | $62,331 |
| Total | $53,527 | $45,531 |
Family Income in Grinnell
Family Income Brackets in Grinnell
According to the Grinnell family income data, there are 494 families falling into the $100,000 to $149,999 income range, which is the most common income bracket and makes up 26.8% of all families. Conversely, the $10,000 to $14,999 income bracket is the least frequent group with only 11 families (0.6%) belonging to this category.
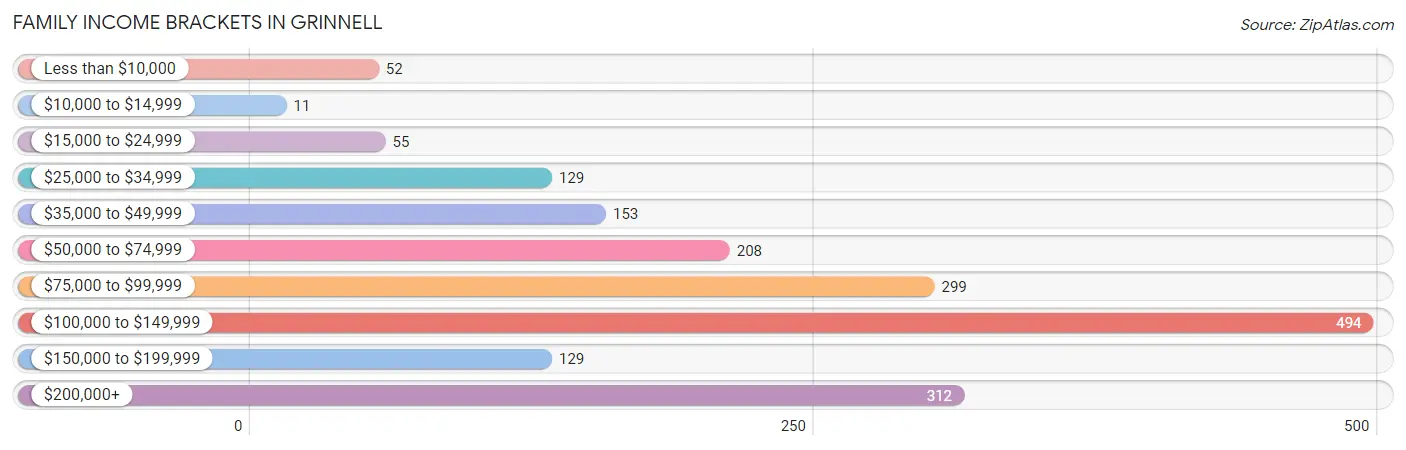
| Income Bracket | # Families | % Families |
| Less than $10,000 | 52 | 2.8% |
| $10,000 to $14,999 | 11 | 0.6% |
| $15,000 to $24,999 | 55 | 3.0% |
| $25,000 to $34,999 | 129 | 7.0% |
| $35,000 to $49,999 | 153 | 8.3% |
| $50,000 to $74,999 | 208 | 11.3% |
| $75,000 to $99,999 | 299 | 16.2% |
| $100,000 to $149,999 | 494 | 26.8% |
| $150,000 to $199,999 | 129 | 7.0% |
| $200,000+ | 312 | 16.9% |
Family Income by Famaliy Size in Grinnell
5-person families (182 | 9.9%) account for the highest median family income in Grinnell with $141,400 per family, while 2-person families (863 | 46.8%) have the highest median income of $43,886 per family member.
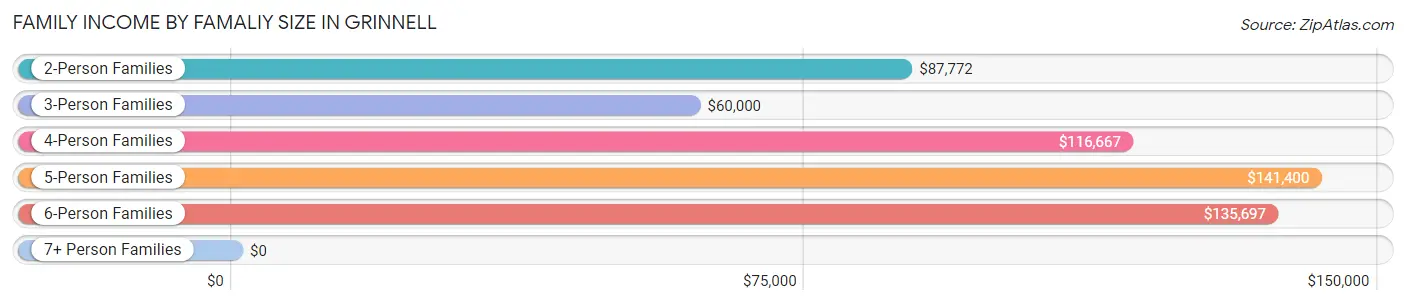
| Income Bracket | # Families | Median Income |
| 2-Person Families | 863 (46.8%) | $87,772 |
| 3-Person Families | 372 (20.2%) | $60,000 |
| 4-Person Families | 330 (17.9%) | $116,667 |
| 5-Person Families | 182 (9.9%) | $141,400 |
| 6-Person Families | 97 (5.3%) | $135,697 |
| 7+ Person Families | 0 (0.0%) | $0 |
| Total | 1,844 (100.0%) | $100,985 |
Family Income by Number of Earners in Grinnell
The median family income in Grinnell is $100,985, with families comprising 3+ earners (174) having the highest median family income of $137,115, while families with no earners (369) have the lowest median family income of $51,295, accounting for 9.4% and 20.0% of families, respectively.
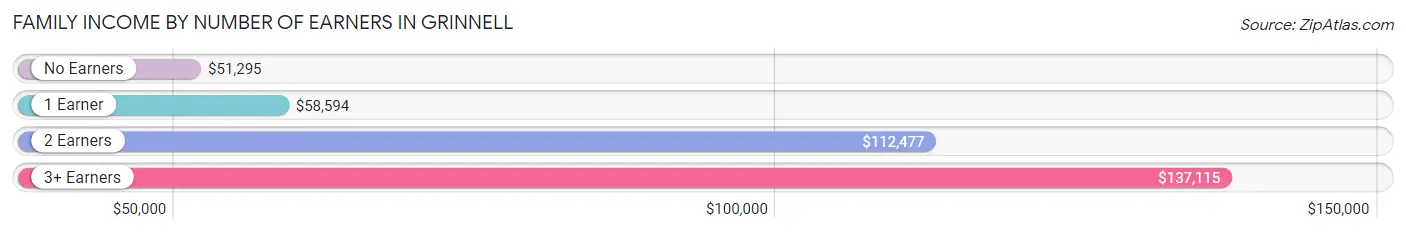
| Number of Earners | # Families | Median Income |
| No Earners | 369 (20.0%) | $51,295 |
| 1 Earner | 394 (21.4%) | $58,594 |
| 2 Earners | 907 (49.2%) | $112,477 |
| 3+ Earners | 174 (9.4%) | $137,115 |
| Total | 1,844 (100.0%) | $100,985 |
Household Income in Grinnell
Household Income Brackets in Grinnell
With 625 households falling in the category, the $100,000 to $149,999 income range is the most frequent in Grinnell, accounting for 16.8% of all households. In contrast, only 145 households (3.9%) fall into the $150,000 to $199,999 income bracket, making it the least populous group.
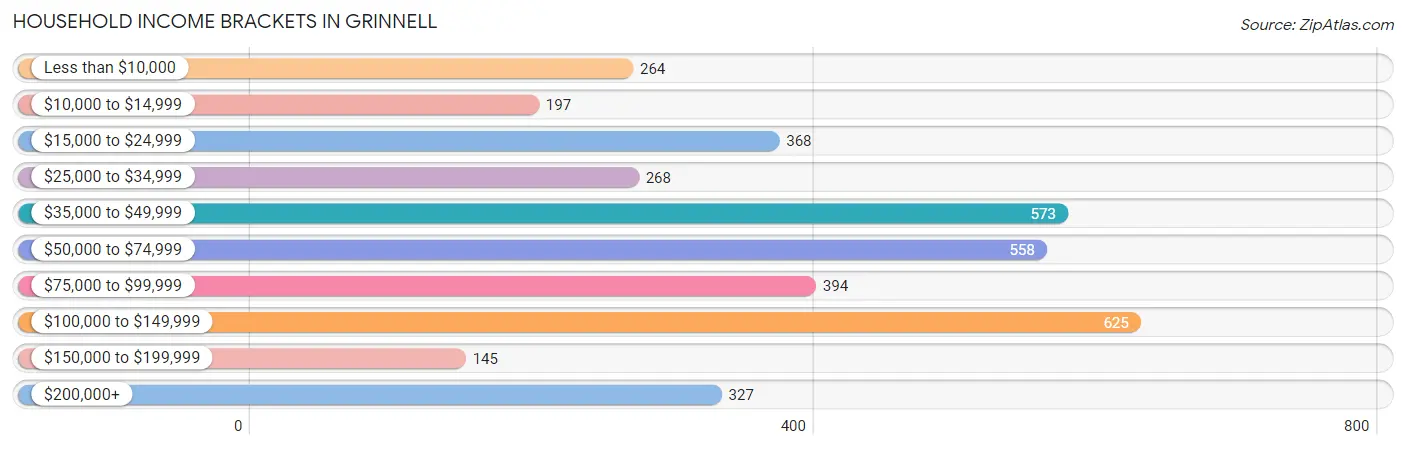
| Income Bracket | # Households | % Households |
| Less than $10,000 | 264 | 7.1% |
| $10,000 to $14,999 | 197 | 5.3% |
| $15,000 to $24,999 | 368 | 9.9% |
| $25,000 to $34,999 | 268 | 7.2% |
| $35,000 to $49,999 | 573 | 15.4% |
| $50,000 to $74,999 | 558 | 15.0% |
| $75,000 to $99,999 | 394 | 10.6% |
| $100,000 to $149,999 | 625 | 16.8% |
| $150,000 to $199,999 | 145 | 3.9% |
| $200,000+ | 327 | 8.8% |
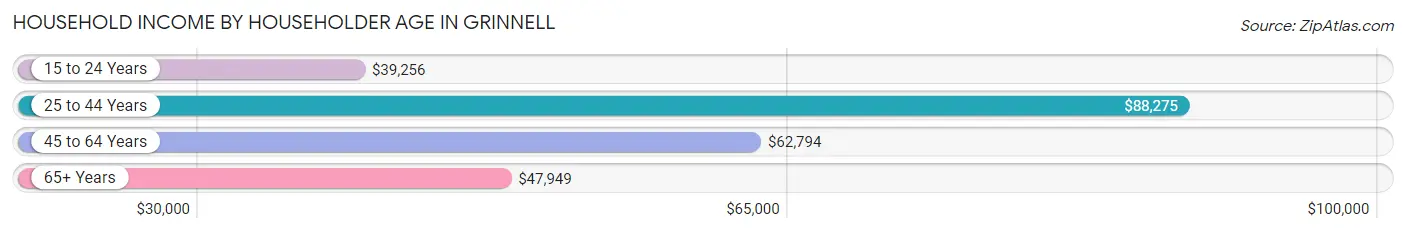
Household Income by Householder Age in Grinnell
The median household income in Grinnell is $57,813, with the highest median household income of $88,275 found in the 25 to 44 years age bracket for the primary householder. A total of 991 households (26.7%) fall into this category. Meanwhile, the 15 to 24 years age bracket for the primary householder has the lowest median household income of $39,256, with 169 households (4.5%) in this group.
| Income Bracket | # Households | Median Income |
| 15 to 24 Years | 169 (4.5%) | $39,256 |
| 25 to 44 Years | 991 (26.7%) | $88,275 |
| 45 to 64 Years | 1,256 (33.8%) | $62,794 |
| 65+ Years | 1,302 (35.0%) | $47,949 |
| Total | 3,718 (100.0%) | $57,813 |
Poverty in Grinnell
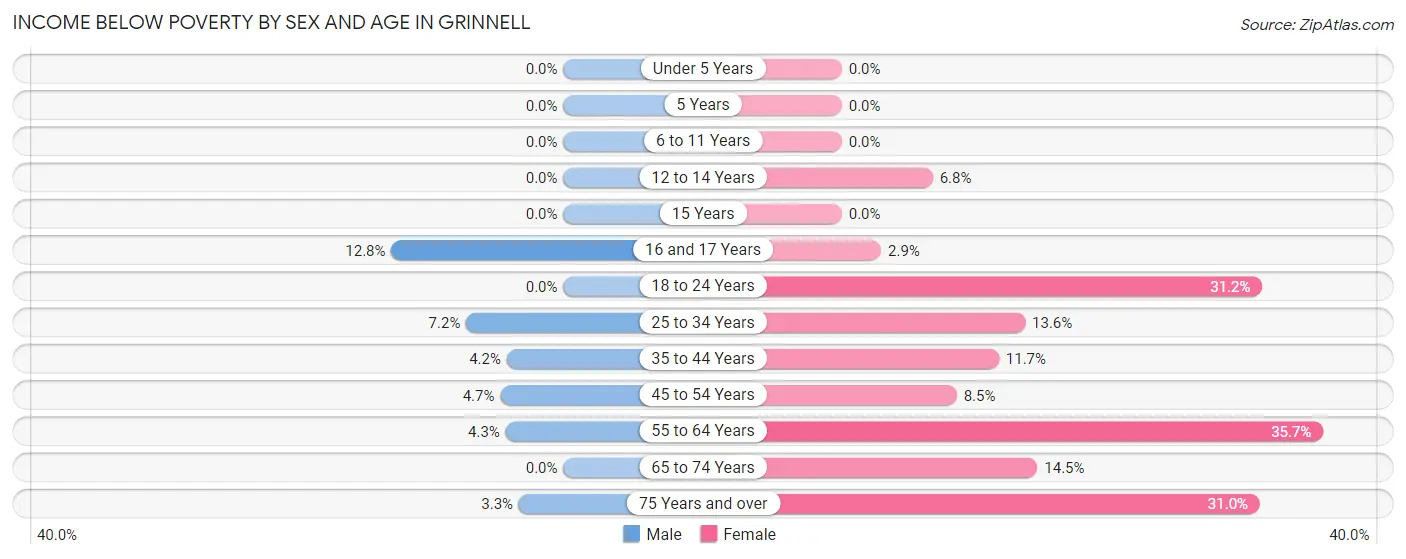
Income Below Poverty by Sex and Age in Grinnell
With 3.2% poverty level for males and 16.6% for females among the residents of Grinnell, 16 and 17 year old males and 55 to 64 year old females are the most vulnerable to poverty, with 24 males (12.8%) and 198 females (35.7%) in their respective age groups living below the poverty level.
| Age Bracket | Male | Female |
| Under 5 Years | 0 (0.0%) | 0 (0.0%) |
| 5 Years | 0 (0.0%) | 0 (0.0%) |
| 6 to 11 Years | 0 (0.0%) | 0 (0.0%) |
| 12 to 14 Years | 0 (0.0%) | 16 (6.8%) |
| 15 Years | 0 (0.0%) | 0 (0.0%) |
| 16 and 17 Years | 24 (12.8%) | 5 (2.9%) |
| 18 to 24 Years | 0 (0.0%) | 64 (31.2%) |
| 25 to 34 Years | 23 (7.2%) | 46 (13.6%) |
| 35 to 44 Years | 22 (4.2%) | 66 (11.7%) |
| 45 to 54 Years | 23 (4.7%) | 43 (8.5%) |
| 55 to 64 Years | 18 (4.3%) | 198 (35.7%) |
| 65 to 74 Years | 0 (0.0%) | 70 (14.5%) |
| 75 Years and over | 11 (3.3%) | 185 (31.0%) |
| Total | 121 (3.2%) | 693 (16.6%) |
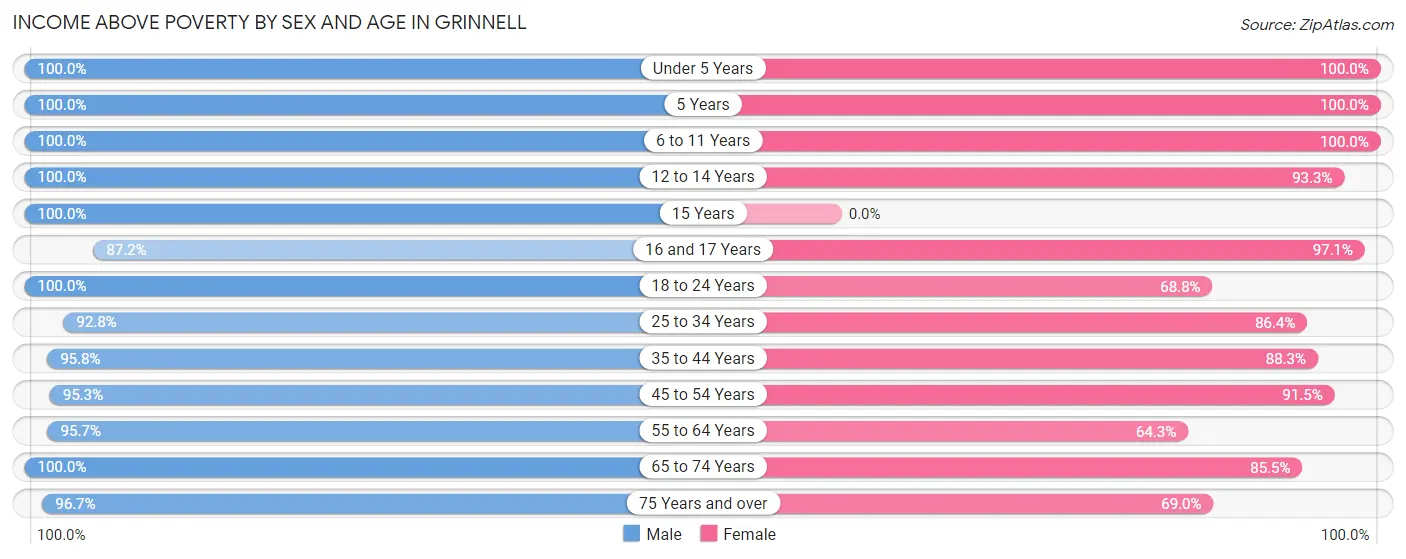
Income Above Poverty by Sex and Age in Grinnell
According to the poverty statistics in Grinnell, males aged under 5 years and females aged under 5 years are the age groups that are most secure financially, with 100.0% of males and 100.0% of females in these age groups living above the poverty line.
| Age Bracket | Male | Female |
| Under 5 Years | 179 (100.0%) | 172 (100.0%) |
| 5 Years | 41 (100.0%) | 8 (100.0%) |
| 6 to 11 Years | 311 (100.0%) | 331 (100.0%) |
| 12 to 14 Years | 155 (100.0%) | 221 (93.2%) |
| 15 Years | 43 (100.0%) | 0 (0.0%) |
| 16 and 17 Years | 164 (87.2%) | 166 (97.1%) |
| 18 to 24 Years | 368 (100.0%) | 141 (68.8%) |
| 25 to 34 Years | 296 (92.8%) | 292 (86.4%) |
| 35 to 44 Years | 502 (95.8%) | 500 (88.3%) |
| 45 to 54 Years | 468 (95.3%) | 461 (91.5%) |
| 55 to 64 Years | 403 (95.7%) | 356 (64.3%) |
| 65 to 74 Years | 451 (100.0%) | 412 (85.5%) |
| 75 Years and over | 322 (96.7%) | 411 (69.0%) |
| Total | 3,703 (96.8%) | 3,471 (83.4%) |
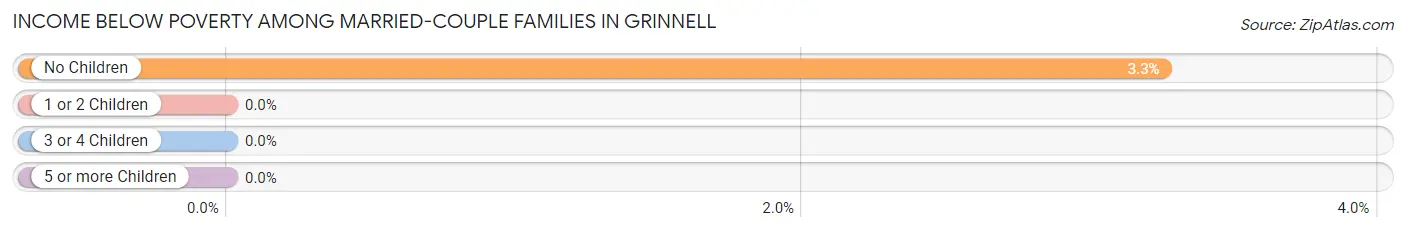
Income Below Poverty Among Married-Couple Families in Grinnell
The poverty statistics for married-couple families in Grinnell show that 1.9% or 29 of the total 1,506 families live below the poverty line. Families with no children have the highest poverty rate of 3.3%, comprising of 29 families. On the other hand, families with 1 or 2 children have the lowest poverty rate of 0.0%, which includes 0 families.
| Children | Above Poverty | Below Poverty |
| No Children | 863 (96.8%) | 29 (3.3%) |
| 1 or 2 Children | 411 (100.0%) | 0 (0.0%) |
| 3 or 4 Children | 203 (100.0%) | 0 (0.0%) |
| 5 or more Children | 0 (0.0%) | 0 (0.0%) |
| Total | 1,477 (98.1%) | 29 (1.9%) |
Income Below Poverty Among Single-Parent Households in Grinnell
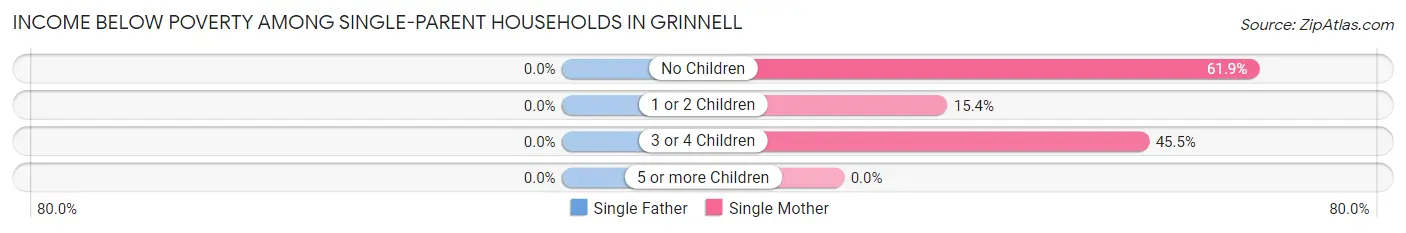
| Children | Single Father | Single Mother |
| No Children | 0 (0.0%) | 52 (61.9%) |
| 1 or 2 Children | 0 (0.0%) | 18 (15.4%) |
| 3 or 4 Children | 0 (0.0%) | 10 (45.5%) |
| 5 or more Children | 0 (0.0%) | 0 (0.0%) |
| Total | 0 (0.0%) | 80 (35.9%) |
Income Below Poverty Among Married-Couple vs Single-Parent Households in Grinnell
The poverty data for Grinnell shows that 29 of the married-couple family households (1.9%) and 80 of the single-parent households (23.7%) are living below the poverty level. Within the married-couple family households, those with no children have the highest poverty rate, with 29 households (3.3%) falling below the poverty line. Among the single-parent households, those with no children have the highest poverty rate, with 52 household (54.2%) living below poverty.
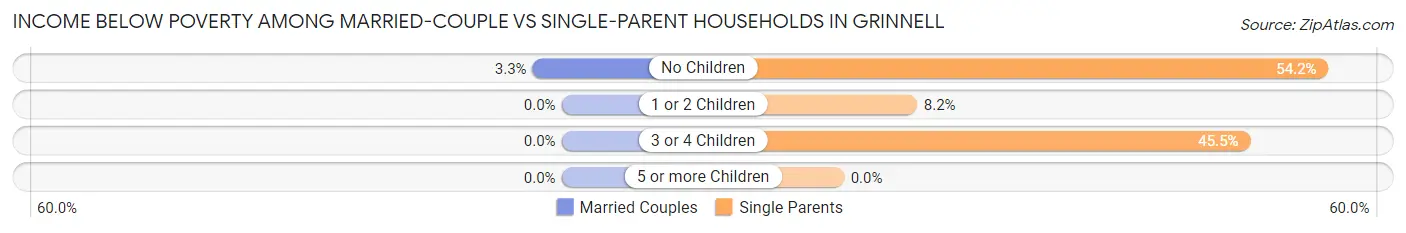
| Children | Married-Couple Families | Single-Parent Households |
| No Children | 29 (3.3%) | 52 (54.2%) |
| 1 or 2 Children | 0 (0.0%) | 18 (8.2%) |
| 3 or 4 Children | 0 (0.0%) | 10 (45.5%) |
| 5 or more Children | 0 (0.0%) | 0 (0.0%) |
| Total | 29 (1.9%) | 80 (23.7%) |
Race in Grinnell
The most populous races in Grinnell are White / Caucasian (8,481 | 89.2%), Asian (401 | 4.2%), and Hispanic or Latino (332 | 3.5%).
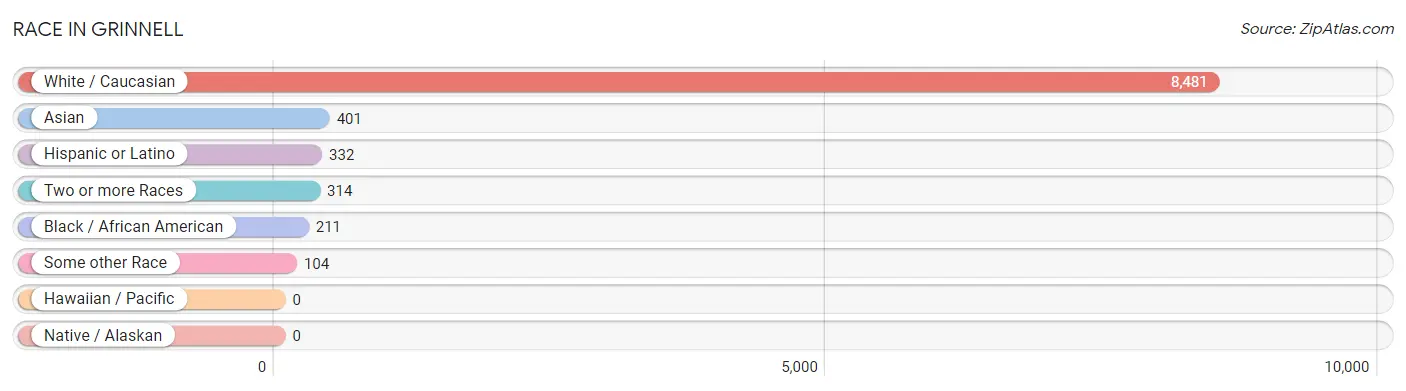
| Race | # Population | % Population |
| Asian | 401 | 4.2% |
| Black / African American | 211 | 2.2% |
| Hawaiian / Pacific | 0 | 0.0% |
| Hispanic or Latino | 332 | 3.5% |
| Native / Alaskan | 0 | 0.0% |
| White / Caucasian | 8,481 | 89.2% |
| Two or more Races | 314 | 3.3% |
| Some other Race | 104 | 1.1% |
| Total | 9,511 | 100.0% |
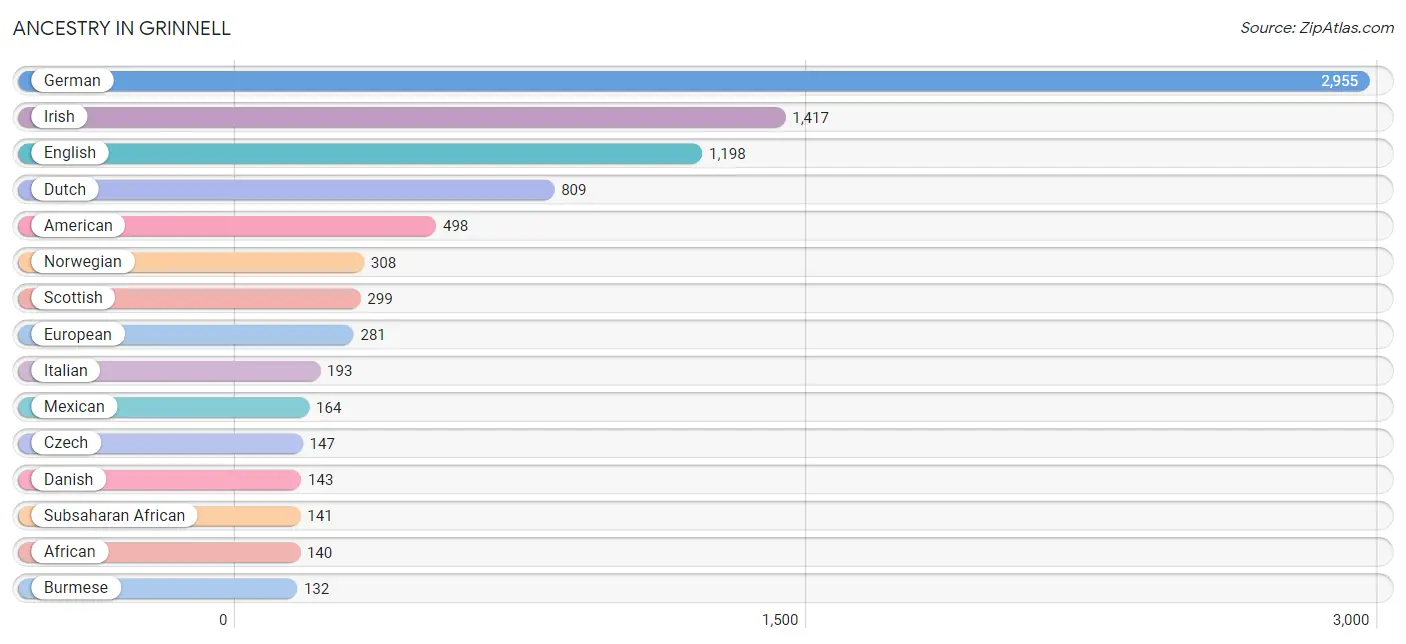
Ancestry in Grinnell
The most populous ancestries reported in Grinnell are German (2,955 | 31.1%), Irish (1,417 | 14.9%), English (1,198 | 12.6%), Dutch (809 | 8.5%), and American (498 | 5.2%), together accounting for 72.3% of all Grinnell residents.
| Ancestry | # Population | % Population |
| African | 140 | 1.5% |
| American | 498 | 5.2% |
| Arab | 14 | 0.2% |
| Austrian | 10 | 0.1% |
| Belgian | 67 | 0.7% |
| Bhutanese | 54 | 0.6% |
| Bolivian | 17 | 0.2% |
| Brazilian | 3 | 0.0% |
| British | 84 | 0.9% |
| Burmese | 132 | 1.4% |
| Canadian | 40 | 0.4% |
| Central American | 37 | 0.4% |
| Cuban | 5 | 0.1% |
| Czech | 147 | 1.5% |
| Danish | 143 | 1.5% |
| Dutch | 809 | 8.5% |
| Eastern European | 106 | 1.1% |
| English | 1,198 | 12.6% |
| European | 281 | 2.9% |
| Filipino | 50 | 0.5% |
| Finnish | 8 | 0.1% |
| French | 117 | 1.2% |
| German | 2,955 | 31.1% |
| Greek | 31 | 0.3% |
| Guyanese | 11 | 0.1% |
| Haitian | 20 | 0.2% |
| Honduran | 37 | 0.4% |
| Indian (Asian) | 106 | 1.1% |
| Irish | 1,417 | 14.9% |
| Italian | 193 | 2.0% |
| Mexican | 164 | 1.7% |
| Moroccan | 9 | 0.1% |
| Northern European | 14 | 0.2% |
| Norwegian | 308 | 3.2% |
| Palestinian | 5 | 0.1% |
| Polish | 108 | 1.1% |
| Portuguese | 18 | 0.2% |
| Puerto Rican | 47 | 0.5% |
| Russian | 80 | 0.8% |
| Scandinavian | 11 | 0.1% |
| Scotch-Irish | 95 | 1.0% |
| Scottish | 299 | 3.1% |
| South American | 17 | 0.2% |
| Spaniard | 4 | 0.0% |
| Sri Lankan | 17 | 0.2% |
| Subsaharan African | 141 | 1.5% |
| Swedish | 93 | 1.0% |
| Swiss | 17 | 0.2% |
| Thai | 97 | 1.0% |
| Trinidadian and Tobagonian | 11 | 0.1% |
| Ukrainian | 4 | 0.0% |
| Welsh | 37 | 0.4% |
| Zimbabwean | 1 | 0.0% | View All 53 Rows |
Immigrants in Grinnell
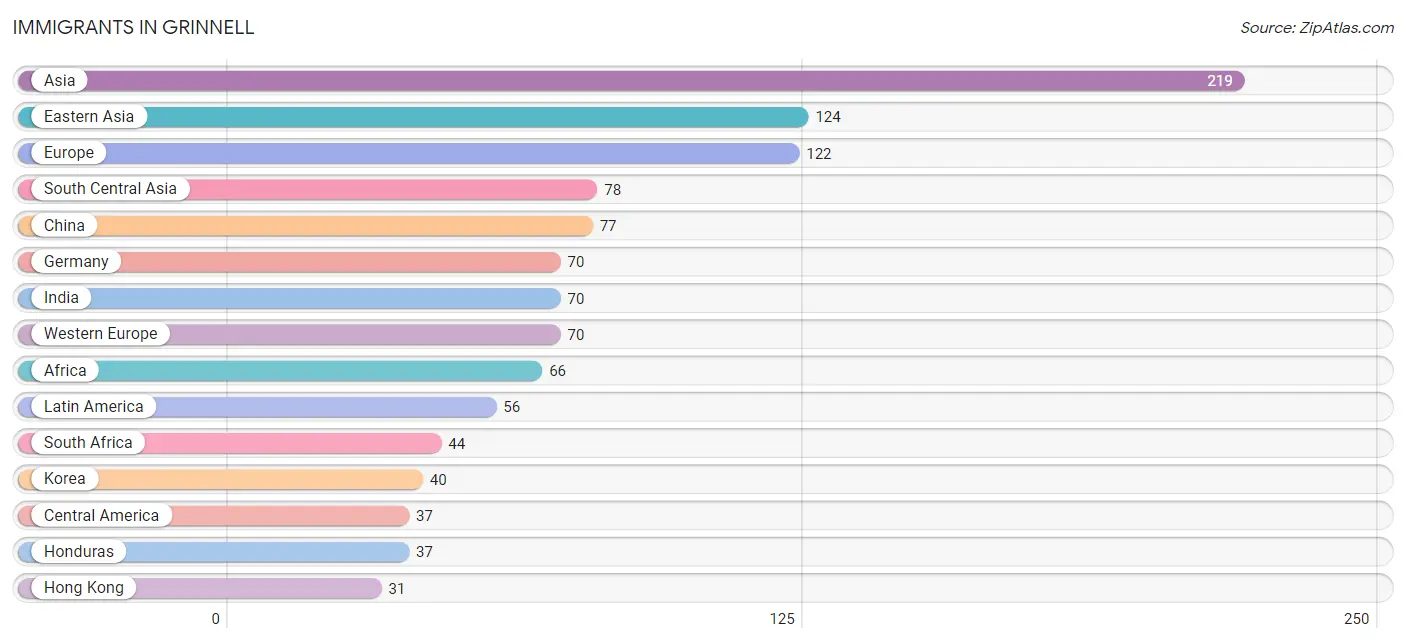
The most numerous immigrant groups reported in Grinnell came from Asia (219 | 2.3%), Eastern Asia (124 | 1.3%), Europe (122 | 1.3%), South Central Asia (78 | 0.8%), and China (77 | 0.8%), together accounting for 6.5% of all Grinnell residents.
| Immigration Origin | # Population | % Population |
| Africa | 66 | 0.7% |
| Asia | 219 | 2.3% |
| Brazil | 18 | 0.2% |
| Canada | 25 | 0.3% |
| Caribbean | 1 | 0.0% |
| Central America | 37 | 0.4% |
| China | 77 | 0.8% |
| Eastern Africa | 9 | 0.1% |
| Eastern Asia | 124 | 1.3% |
| Egypt | 1 | 0.0% |
| Europe | 122 | 1.3% |
| Germany | 70 | 0.7% |
| Ghana | 3 | 0.0% |
| Greece | 27 | 0.3% |
| Haiti | 1 | 0.0% |
| Honduras | 37 | 0.4% |
| Hong Kong | 31 | 0.3% |
| India | 70 | 0.7% |
| Korea | 40 | 0.4% |
| Latin America | 56 | 0.6% |
| Morocco | 9 | 0.1% |
| Nepal | 4 | 0.0% |
| Northern Africa | 10 | 0.1% |
| Northern Europe | 21 | 0.2% |
| Pakistan | 4 | 0.0% |
| Somalia | 9 | 0.1% |
| South Africa | 44 | 0.5% |
| South America | 18 | 0.2% |
| South Central Asia | 78 | 0.8% |
| South Eastern Asia | 17 | 0.2% |
| Southern Europe | 31 | 0.3% |
| Spain | 4 | 0.0% |
| Vietnam | 17 | 0.2% |
| Western Africa | 3 | 0.0% |
| Western Europe | 70 | 0.7% | View All 35 Rows |
Sex and Age in Grinnell
Sex and Age in Grinnell
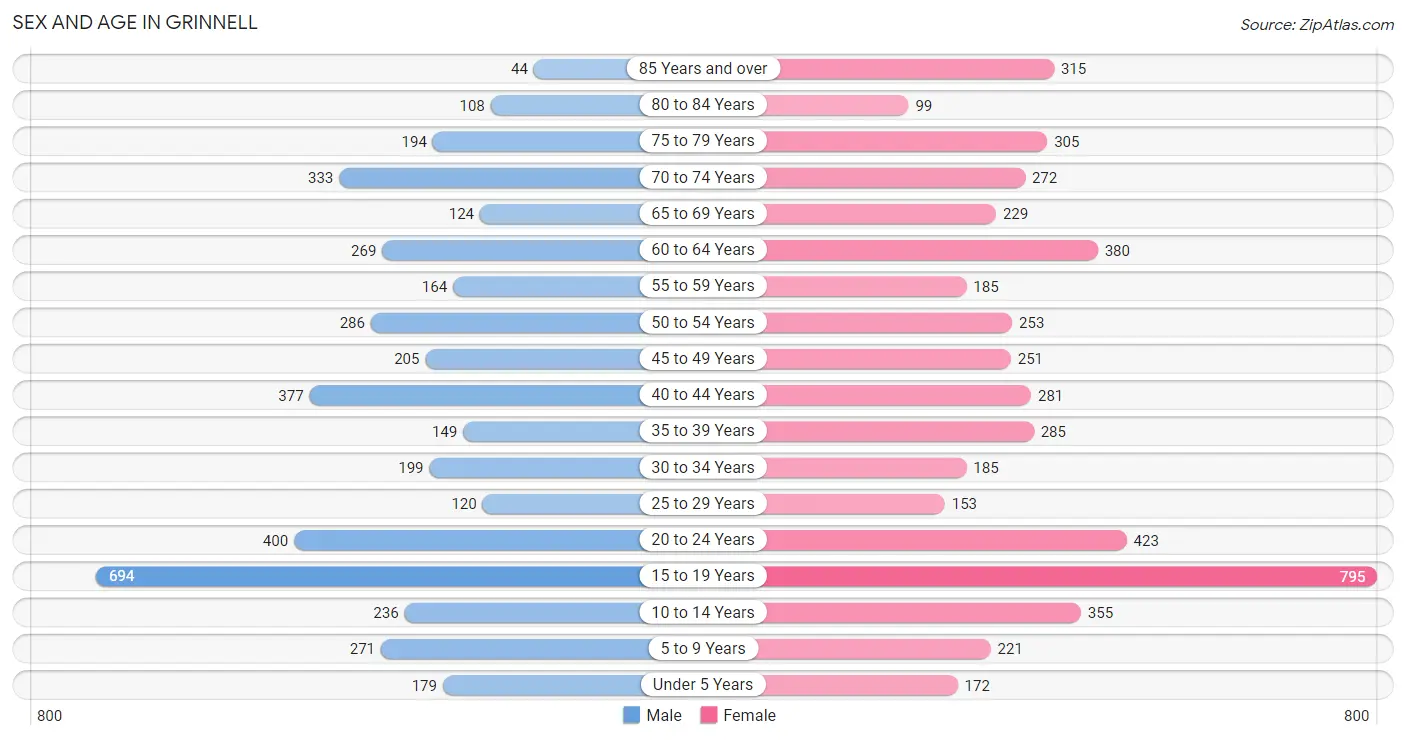
The most populous age groups in Grinnell are 15 to 19 Years (694 | 16.0%) for men and 15 to 19 Years (795 | 15.4%) for women.
| Age Bracket | Male | Female |
| Under 5 Years | 179 (4.1%) | 172 (3.3%) |
| 5 to 9 Years | 271 (6.2%) | 221 (4.3%) |
| 10 to 14 Years | 236 (5.4%) | 355 (6.9%) |
| 15 to 19 Years | 694 (16.0%) | 795 (15.4%) |
| 20 to 24 Years | 400 (9.2%) | 423 (8.2%) |
| 25 to 29 Years | 120 (2.8%) | 153 (3.0%) |
| 30 to 34 Years | 199 (4.6%) | 185 (3.6%) |
| 35 to 39 Years | 149 (3.4%) | 285 (5.5%) |
| 40 to 44 Years | 377 (8.7%) | 281 (5.4%) |
| 45 to 49 Years | 205 (4.7%) | 251 (4.9%) |
| 50 to 54 Years | 286 (6.6%) | 253 (4.9%) |
| 55 to 59 Years | 164 (3.8%) | 185 (3.6%) |
| 60 to 64 Years | 269 (6.2%) | 380 (7.4%) |
| 65 to 69 Years | 124 (2.9%) | 229 (4.4%) |
| 70 to 74 Years | 333 (7.6%) | 272 (5.3%) |
| 75 to 79 Years | 194 (4.5%) | 305 (5.9%) |
| 80 to 84 Years | 108 (2.5%) | 99 (1.9%) |
| 85 Years and over | 44 (1.0%) | 315 (6.1%) |
| Total | 4,352 (100.0%) | 5,159 (100.0%) |
Families and Households in Grinnell
Median Family Size in Grinnell
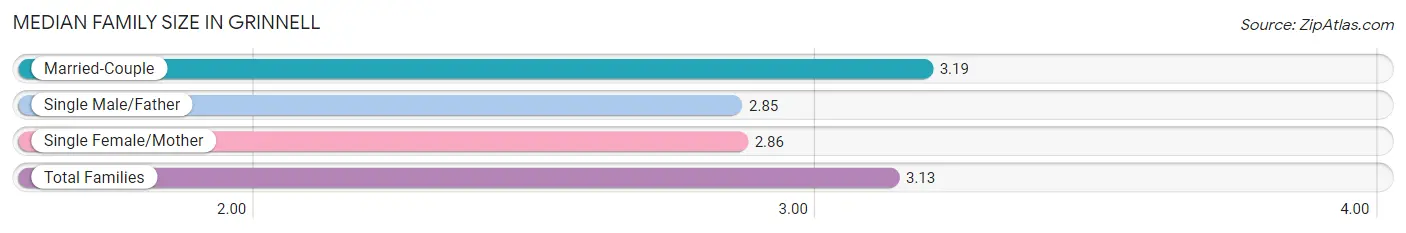
The median family size in Grinnell is 3.13 persons per family, with married-couple families (1,506 | 81.7%) accounting for the largest median family size of 3.19 persons per family. On the other hand, single male/father families (115 | 6.2%) represent the smallest median family size with 2.85 persons per family.
| Family Type | # Families | Family Size |
| Married-Couple | 1,506 (81.7%) | 3.19 |
| Single Male/Father | 115 (6.2%) | 2.85 |
| Single Female/Mother | 223 (12.1%) | 2.86 |
| Total Families | 1,844 (100.0%) | 3.13 |
Median Household Size in Grinnell
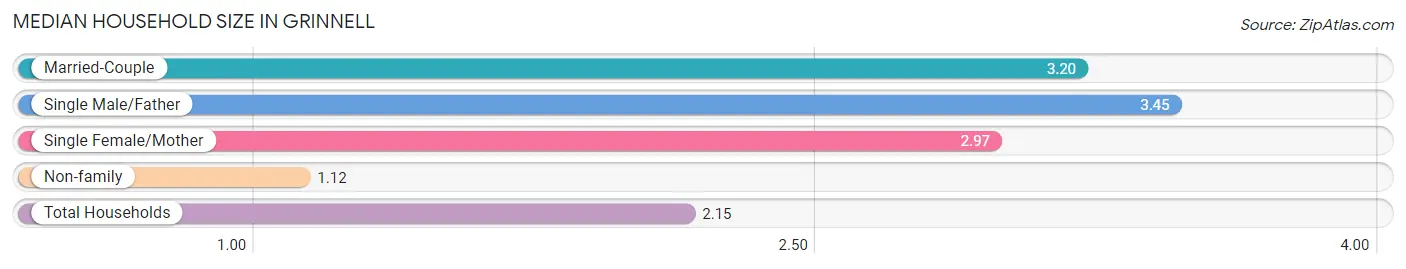
The median household size in Grinnell is 2.15 persons per household, with single male/father households (115 | 3.1%) accounting for the largest median household size of 3.45 persons per household. non-family households (1,874 | 50.4%) represent the smallest median household size with 1.12 persons per household.
| Household Type | # Households | Household Size |
| Married-Couple | 1,506 (40.5%) | 3.20 |
| Single Male/Father | 115 (3.1%) | 3.45 |
| Single Female/Mother | 223 (6.0%) | 2.97 |
| Non-family | 1,874 (50.4%) | 1.12 |
| Total Households | 3,718 (100.0%) | 2.15 |
Household Size by Marriage Status in Grinnell
Out of a total of 3,718 households in Grinnell, 1,844 (49.6%) are family households, while 1,874 (50.4%) are nonfamily households. The most numerous type of family households are 2-person households, comprising 844, and the most common type of nonfamily households are 1-person households, comprising 1,641.
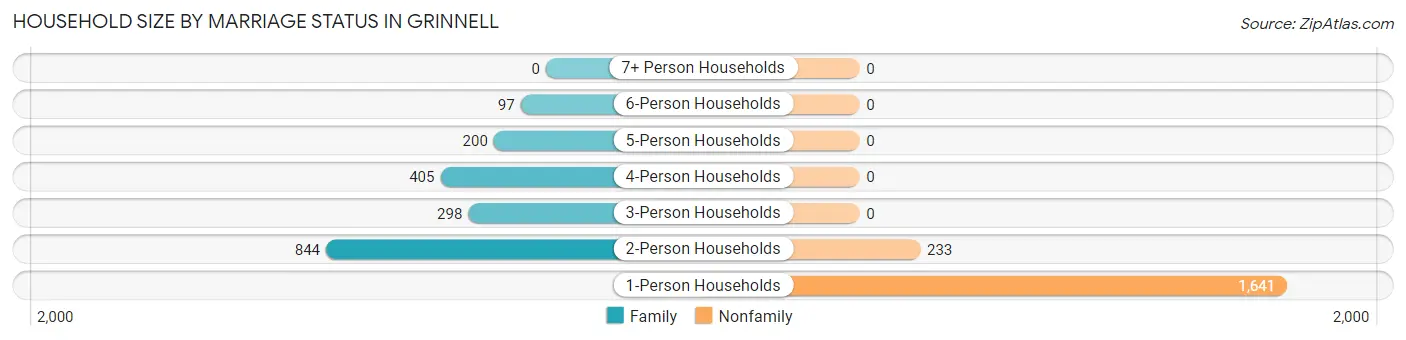
| Household Size | Family Households | Nonfamily Households |
| 1-Person Households | - | 1,641 (44.1%) |
| 2-Person Households | 844 (22.7%) | 233 (6.3%) |
| 3-Person Households | 298 (8.0%) | 0 (0.0%) |
| 4-Person Households | 405 (10.9%) | 0 (0.0%) |
| 5-Person Households | 200 (5.4%) | 0 (0.0%) |
| 6-Person Households | 97 (2.6%) | 0 (0.0%) |
| 7+ Person Households | 0 (0.0%) | 0 (0.0%) |
| Total | 1,844 (49.6%) | 1,874 (50.4%) |
Female Fertility in Grinnell
Fertility by Age in Grinnell
Average fertility rate in Grinnell is 14.0 births per 1,000 women. Women in the age bracket of 20 to 34 years have the highest fertility rate with 43.0 births per 1,000 women. Women in the age bracket of 20 to 34 years acount for 100.0% of all women with births.
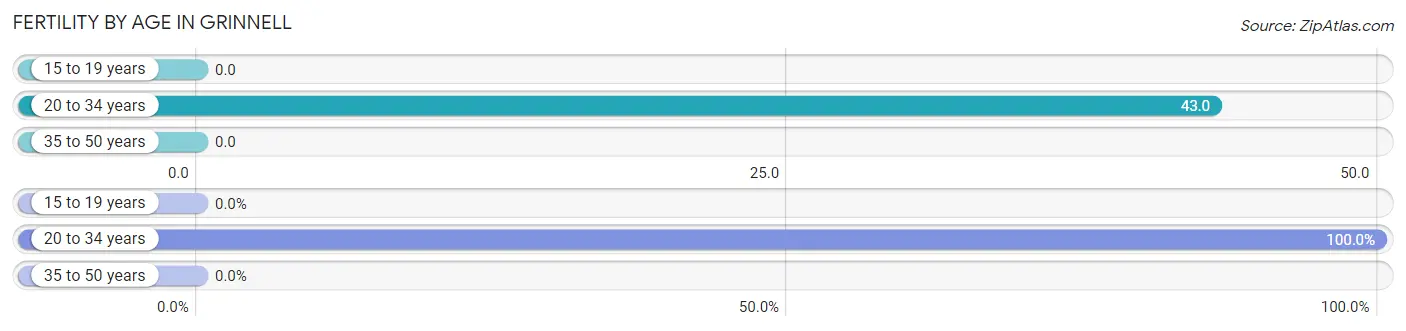
| Age Bracket | Women with Births | Births / 1,000 Women |
| 15 to 19 years | 0 (0.0%) | 0.0 |
| 20 to 34 years | 33 (100.0%) | 43.0 |
| 35 to 50 years | 0 (0.0%) | 0.0 |
| Total | 33 (100.0%) | 14.0 |
Fertility by Age by Marriage Status in Grinnell
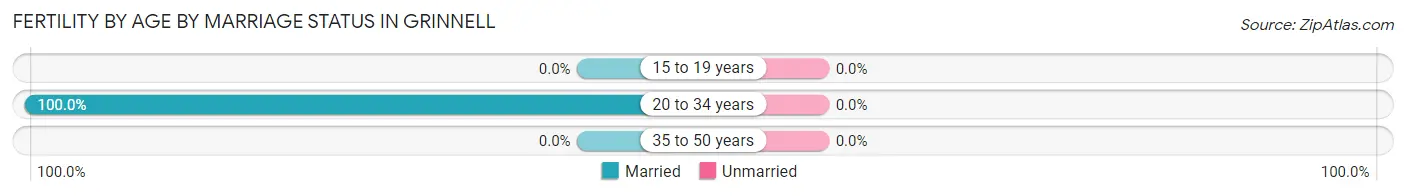
| Age Bracket | Married | Unmarried |
| 15 to 19 years | 0 (0.0%) | 0 (0.0%) |
| 20 to 34 years | 33 (100.0%) | 0 (0.0%) |
| 35 to 50 years | 0 (0.0%) | 0 (0.0%) |
| Total | 33 (100.0%) | 0 (0.0%) |
Fertility by Education in Grinnell
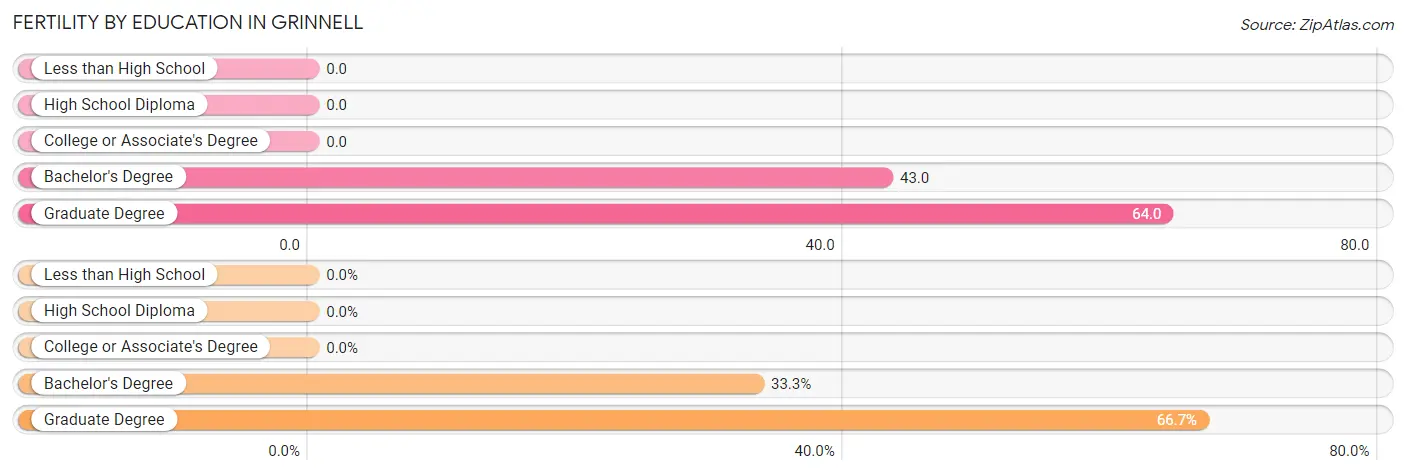
| Educational Attainment | Women with Births | Births / 1,000 Women |
| Less than High School | 0 (0.0%) | 0.0 |
| High School Diploma | 0 (0.0%) | 0.0 |
| College or Associate's Degree | 0 (0.0%) | 0.0 |
| Bachelor's Degree | 11 (33.3%) | 43.0 |
| Graduate Degree | 22 (66.7%) | 64.0 |
| Total | 33 (100.0%) | 14.0 |
Fertility by Education by Marriage Status in Grinnell
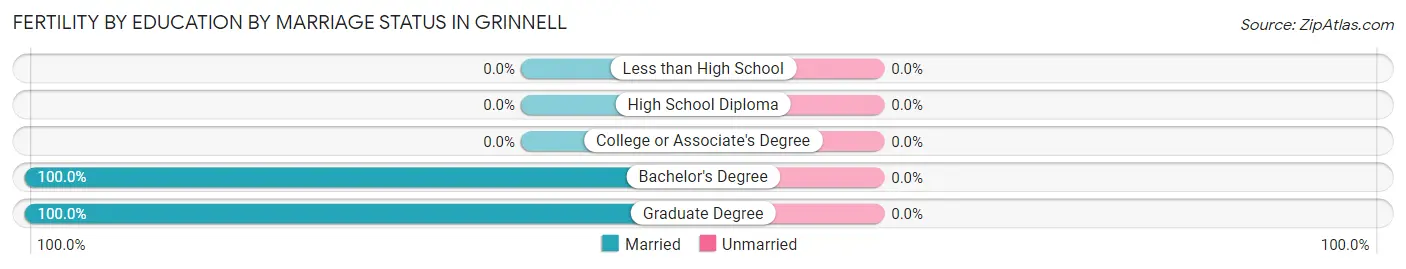
| Educational Attainment | Married | Unmarried |
| Less than High School | 0 (0.0%) | 0 (0.0%) |
| High School Diploma | 0 (0.0%) | 0 (0.0%) |
| College or Associate's Degree | 0 (0.0%) | 0 (0.0%) |
| Bachelor's Degree | 11 (100.0%) | 0 (0.0%) |
| Graduate Degree | 22 (100.0%) | 0 (0.0%) |
| Total | 33 (100.0%) | 0 (0.0%) |
Employment Characteristics in Grinnell
Employment by Class of Employer in Grinnell
Among the 4,414 employed individuals in Grinnell, private company employees (2,340 | 53.0%), not-for-profit organizations (1,028 | 23.3%), and local government employees (355 | 8.0%) make up the most common classes of employment.
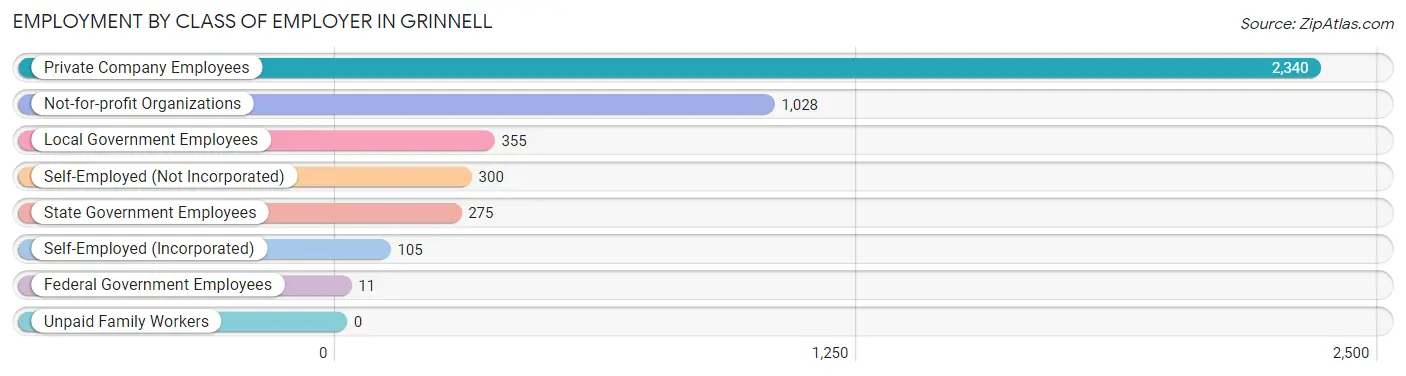
| Employer Class | # Employees | % Employees |
| Private Company Employees | 2,340 | 53.0% |
| Self-Employed (Incorporated) | 105 | 2.4% |
| Self-Employed (Not Incorporated) | 300 | 6.8% |
| Not-for-profit Organizations | 1,028 | 23.3% |
| Local Government Employees | 355 | 8.0% |
| State Government Employees | 275 | 6.2% |
| Federal Government Employees | 11 | 0.3% |
| Unpaid Family Workers | 0 | 0.0% |
| Total | 4,414 | 100.0% |
Employment Status by Age in Grinnell
According to the labor force statistics for Grinnell, out of the total population over 16 years of age (8,034), 59.2% or 4,756 individuals are in the labor force, with 4.0% or 190 of them unemployed. The age group with the highest labor force participation rate is 35 to 44 years, with 94.1% or 1,028 individuals in the labor force. Within the labor force, the 65 to 74 years age range has the highest percentage of unemployed individuals, with 27.4% or 80 of them being unemployed.
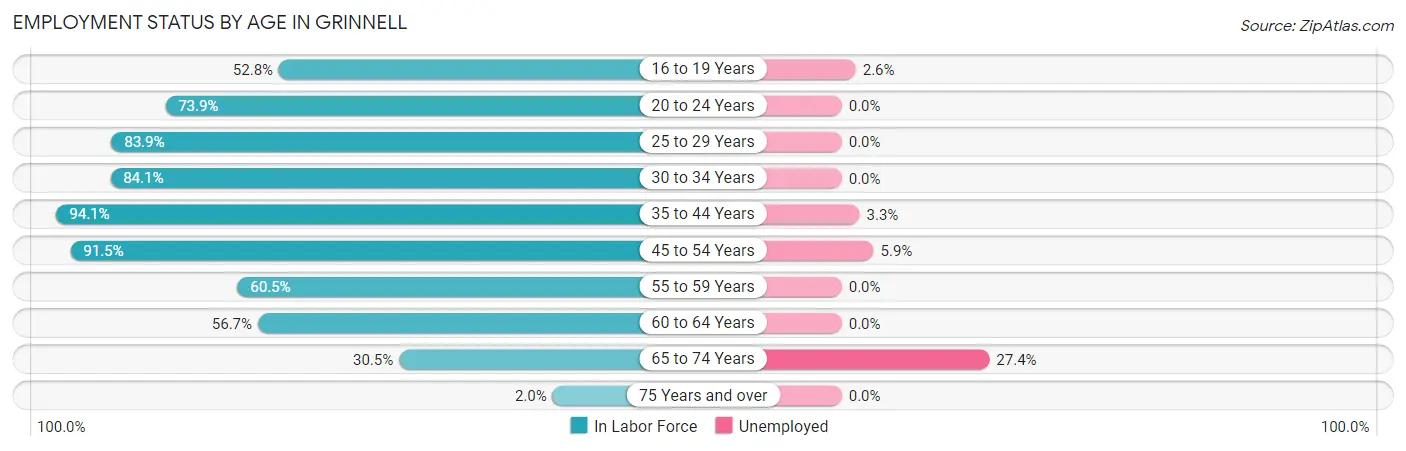
| Age Bracket | In Labor Force | Unemployed |
| 16 to 19 Years | 763 (52.8%) | 20 (2.6%) |
| 20 to 24 Years | 608 (73.9%) | 0 (0.0%) |
| 25 to 29 Years | 229 (83.9%) | 0 (0.0%) |
| 30 to 34 Years | 323 (84.1%) | 0 (0.0%) |
| 35 to 44 Years | 1,028 (94.1%) | 34 (3.3%) |
| 45 to 54 Years | 910 (91.5%) | 54 (5.9%) |
| 55 to 59 Years | 211 (60.5%) | 0 (0.0%) |
| 60 to 64 Years | 368 (56.7%) | 0 (0.0%) |
| 65 to 74 Years | 292 (30.5%) | 80 (27.4%) |
| 75 Years and over | 21 (2.0%) | 0 (0.0%) |
| Total | 4,756 (59.2%) | 190 (4.0%) |
Employment Status by Educational Attainment in Grinnell
According to labor force statistics for Grinnell, 82.0% of individuals (3,068) out of the total population between 25 and 64 years of age (3,742) are in the labor force, with 2.9% or 89 of them being unemployed. The group with the highest labor force participation rate are those with the educational attainment of bachelor's degree or higher, with 95.5% or 1,436 individuals in the labor force. Within the labor force, individuals with college / associate degree education have the highest percentage of unemployment, with 10.2% or 73 of them being unemployed.
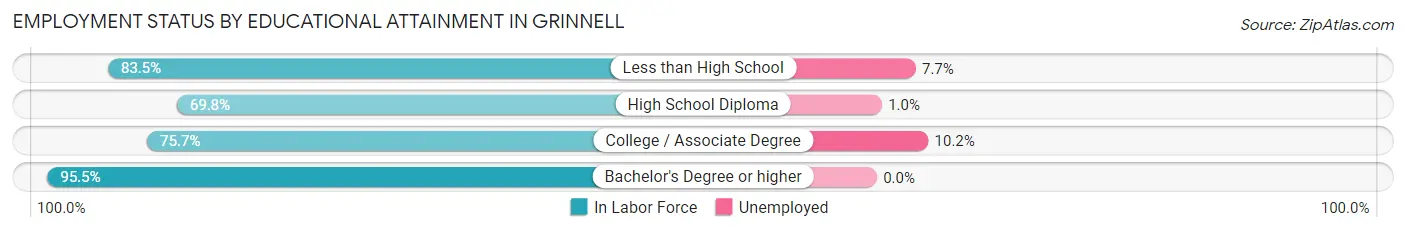
| Educational Attainment | In Labor Force | Unemployed |
| Less than High School | 91 (83.5%) | 8 (7.7%) |
| High School Diploma | 827 (69.8%) | 12 (1.0%) |
| College / Associate Degree | 715 (75.7%) | 96 (10.2%) |
| Bachelor's Degree or higher | 1,436 (95.5%) | 0 (0.0%) |
| Total | 3,068 (82.0%) | 109 (2.9%) |
Employment Occupations by Sex in Grinnell
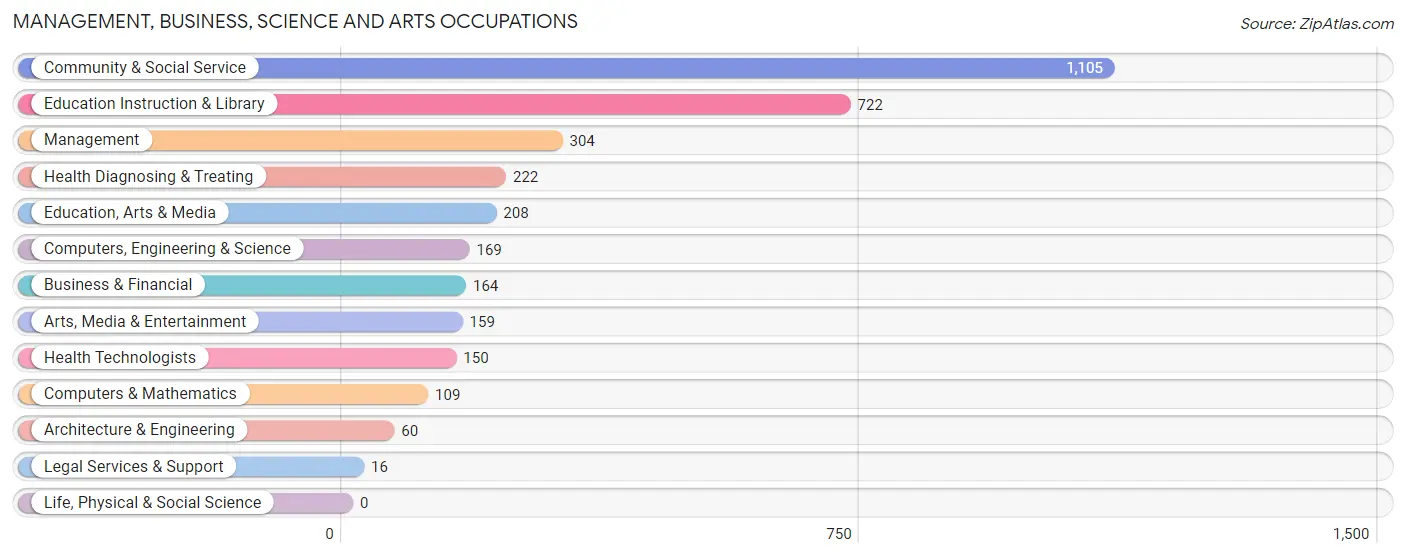
Management, Business, Science and Arts Occupations
The most common Management, Business, Science and Arts occupations in Grinnell are Community & Social Service (1,105 | 24.2%), Education Instruction & Library (722 | 15.8%), Management (304 | 6.7%), Health Diagnosing & Treating (222 | 4.9%), and Education, Arts & Media (208 | 4.6%).
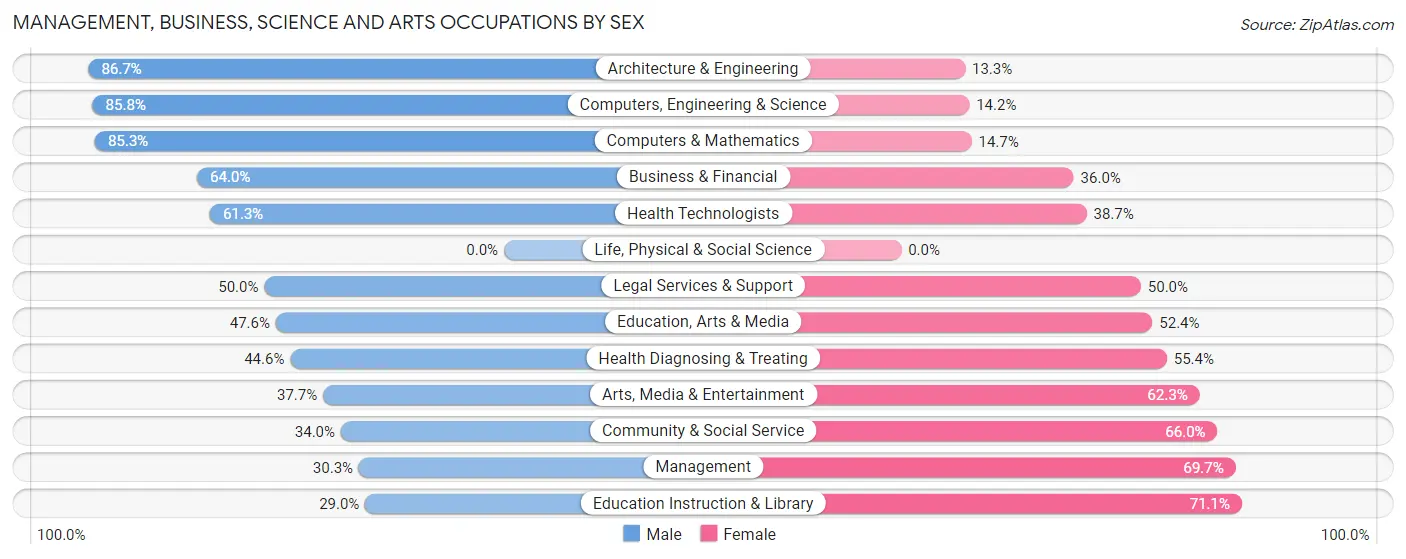
Management, Business, Science and Arts Occupations by Sex
Within the Management, Business, Science and Arts occupations in Grinnell, the most male-oriented occupations are Architecture & Engineering (86.7%), Computers, Engineering & Science (85.8%), and Computers & Mathematics (85.3%), while the most female-oriented occupations are Education Instruction & Library (71.1%), Management (69.7%), and Community & Social Service (66.0%).
| Occupation | Male | Female |
| Management | 92 (30.3%) | 212 (69.7%) |
| Business & Financial | 105 (64.0%) | 59 (36.0%) |
| Computers, Engineering & Science | 145 (85.8%) | 24 (14.2%) |
| Computers & Mathematics | 93 (85.3%) | 16 (14.7%) |
| Architecture & Engineering | 52 (86.7%) | 8 (13.3%) |
| Life, Physical & Social Science | 0 (0.0%) | 0 (0.0%) |
| Community & Social Service | 376 (34.0%) | 729 (66.0%) |
| Education, Arts & Media | 99 (47.6%) | 109 (52.4%) |
| Legal Services & Support | 8 (50.0%) | 8 (50.0%) |
| Education Instruction & Library | 209 (28.9%) | 513 (71.1%) |
| Arts, Media & Entertainment | 60 (37.7%) | 99 (62.3%) |
| Health Diagnosing & Treating | 99 (44.6%) | 123 (55.4%) |
| Health Technologists | 92 (61.3%) | 58 (38.7%) |
| Total (Category) | 817 (41.6%) | 1,147 (58.4%) |
| Total (Overall) | 2,156 (47.2%) | 2,410 (52.8%) |
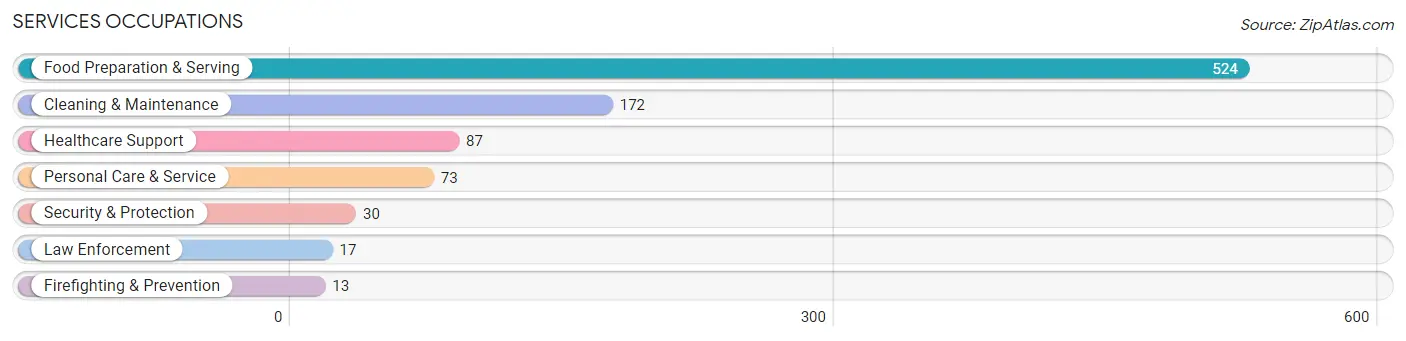
Services Occupations
The most common Services occupations in Grinnell are Food Preparation & Serving (524 | 11.5%), Cleaning & Maintenance (172 | 3.8%), Healthcare Support (87 | 1.9%), Personal Care & Service (73 | 1.6%), and Security & Protection (30 | 0.7%).
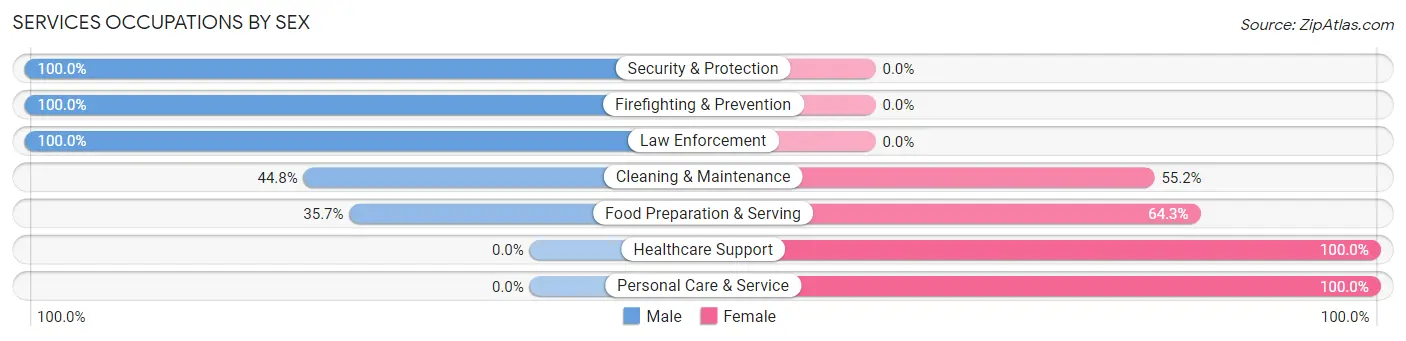
Services Occupations by Sex
Within the Services occupations in Grinnell, the most male-oriented occupations are Security & Protection (100.0%), Firefighting & Prevention (100.0%), and Law Enforcement (100.0%), while the most female-oriented occupations are Healthcare Support (100.0%), Personal Care & Service (100.0%), and Food Preparation & Serving (64.3%).
| Occupation | Male | Female |
| Healthcare Support | 0 (0.0%) | 87 (100.0%) |
| Security & Protection | 30 (100.0%) | 0 (0.0%) |
| Firefighting & Prevention | 13 (100.0%) | 0 (0.0%) |
| Law Enforcement | 17 (100.0%) | 0 (0.0%) |
| Food Preparation & Serving | 187 (35.7%) | 337 (64.3%) |
| Cleaning & Maintenance | 77 (44.8%) | 95 (55.2%) |
| Personal Care & Service | 0 (0.0%) | 73 (100.0%) |
| Total (Category) | 294 (33.2%) | 592 (66.8%) |
| Total (Overall) | 2,156 (47.2%) | 2,410 (52.8%) |
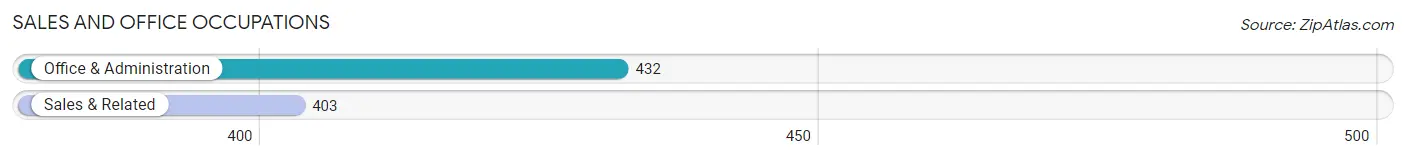
Sales and Office Occupations
The most common Sales and Office occupations in Grinnell are Office & Administration (432 | 9.5%), and Sales & Related (403 | 8.8%).
Sales and Office Occupations by Sex
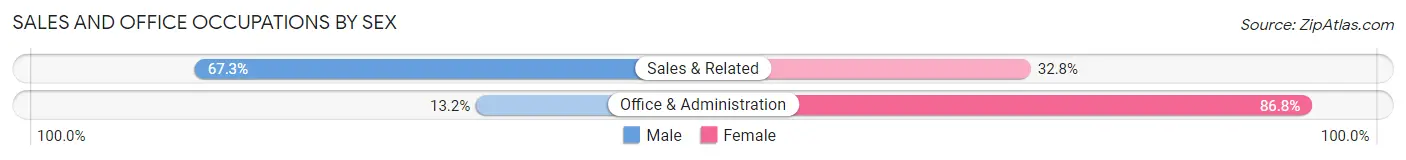
| Occupation | Male | Female |
| Sales & Related | 271 (67.2%) | 132 (32.8%) |
| Office & Administration | 57 (13.2%) | 375 (86.8%) |
| Total (Category) | 328 (39.3%) | 507 (60.7%) |
| Total (Overall) | 2,156 (47.2%) | 2,410 (52.8%) |
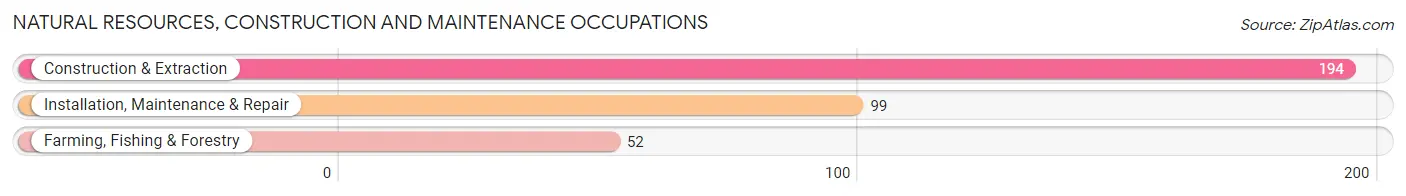
Natural Resources, Construction and Maintenance Occupations
The most common Natural Resources, Construction and Maintenance occupations in Grinnell are Construction & Extraction (194 | 4.3%), Installation, Maintenance & Repair (99 | 2.2%), and Farming, Fishing & Forestry (52 | 1.1%).
Natural Resources, Construction and Maintenance Occupations by Sex
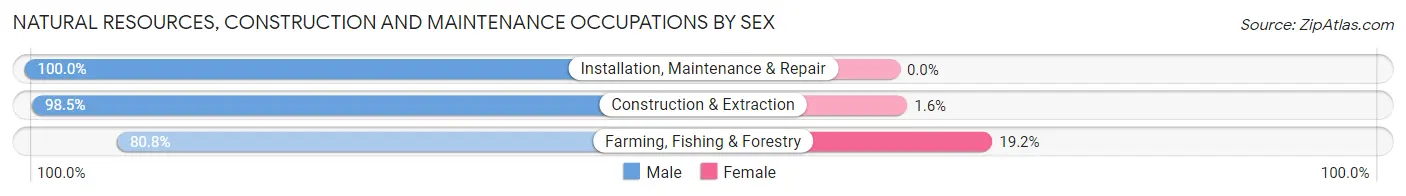
| Occupation | Male | Female |
| Farming, Fishing & Forestry | 42 (80.8%) | 10 (19.2%) |
| Construction & Extraction | 191 (98.5%) | 3 (1.5%) |
| Installation, Maintenance & Repair | 99 (100.0%) | 0 (0.0%) |
| Total (Category) | 332 (96.2%) | 13 (3.8%) |
| Total (Overall) | 2,156 (47.2%) | 2,410 (52.8%) |
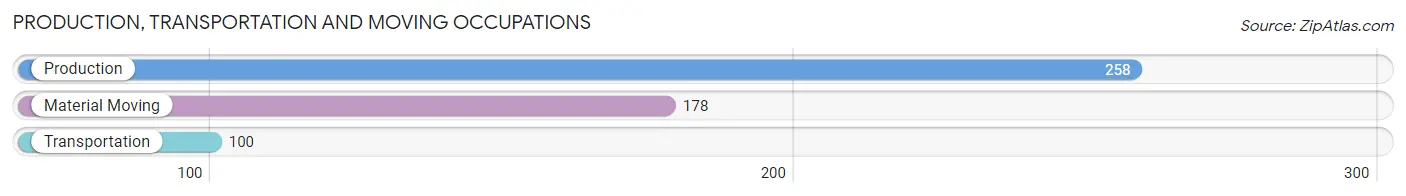
Production, Transportation and Moving Occupations
The most common Production, Transportation and Moving occupations in Grinnell are Production (258 | 5.7%), Material Moving (178 | 3.9%), and Transportation (100 | 2.2%).
Production, Transportation and Moving Occupations by Sex
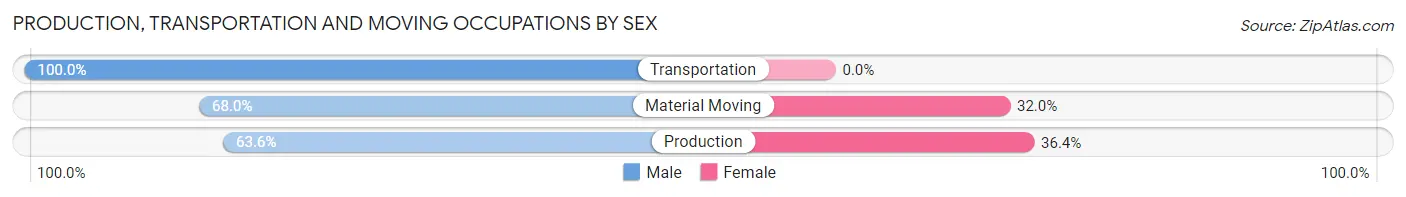
| Occupation | Male | Female |
| Production | 164 (63.6%) | 94 (36.4%) |
| Transportation | 100 (100.0%) | 0 (0.0%) |
| Material Moving | 121 (68.0%) | 57 (32.0%) |
| Total (Category) | 385 (71.8%) | 151 (28.2%) |
| Total (Overall) | 2,156 (47.2%) | 2,410 (52.8%) |
Employment Industries by Sex in Grinnell
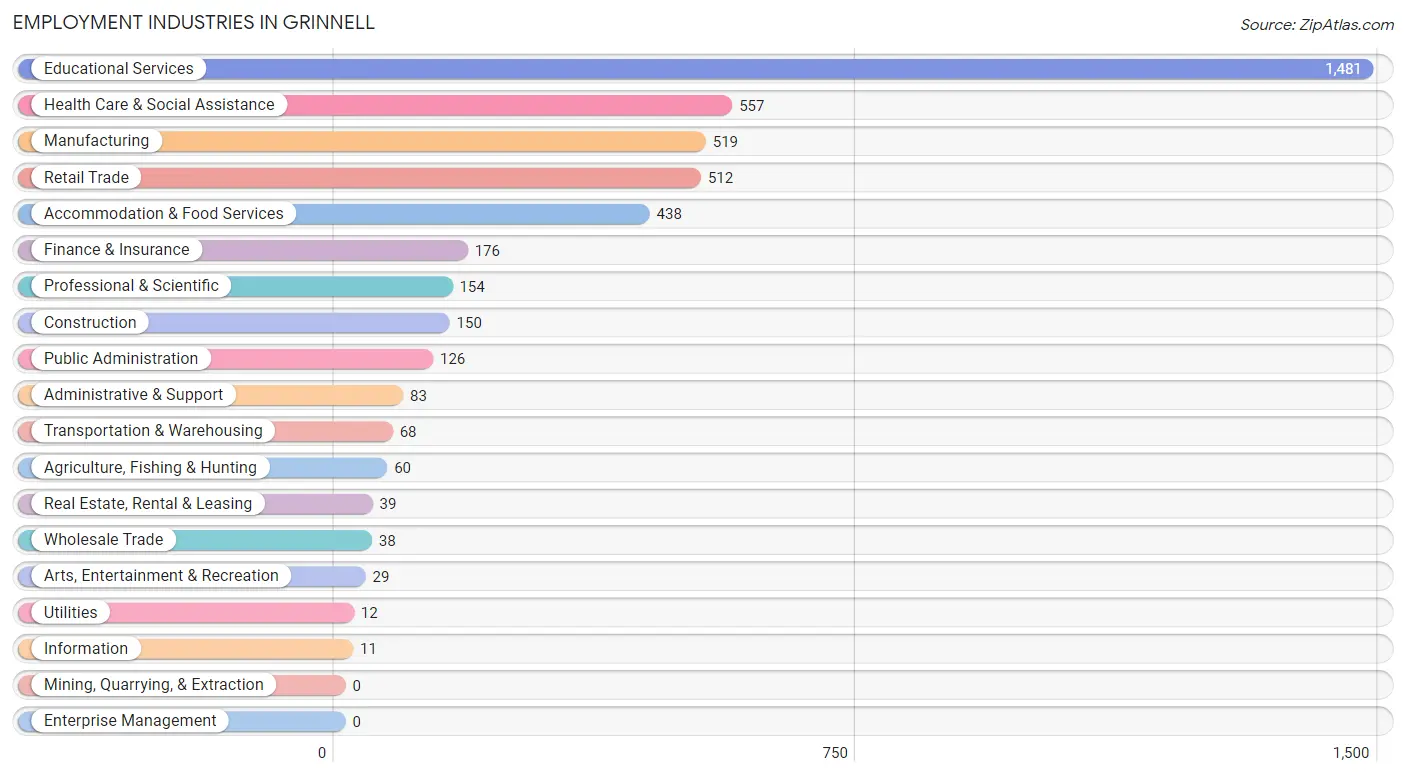
Employment Industries in Grinnell
The major employment industries in Grinnell include Educational Services (1,481 | 32.4%), Health Care & Social Assistance (557 | 12.2%), Manufacturing (519 | 11.4%), Retail Trade (512 | 11.2%), and Accommodation & Food Services (438 | 9.6%).
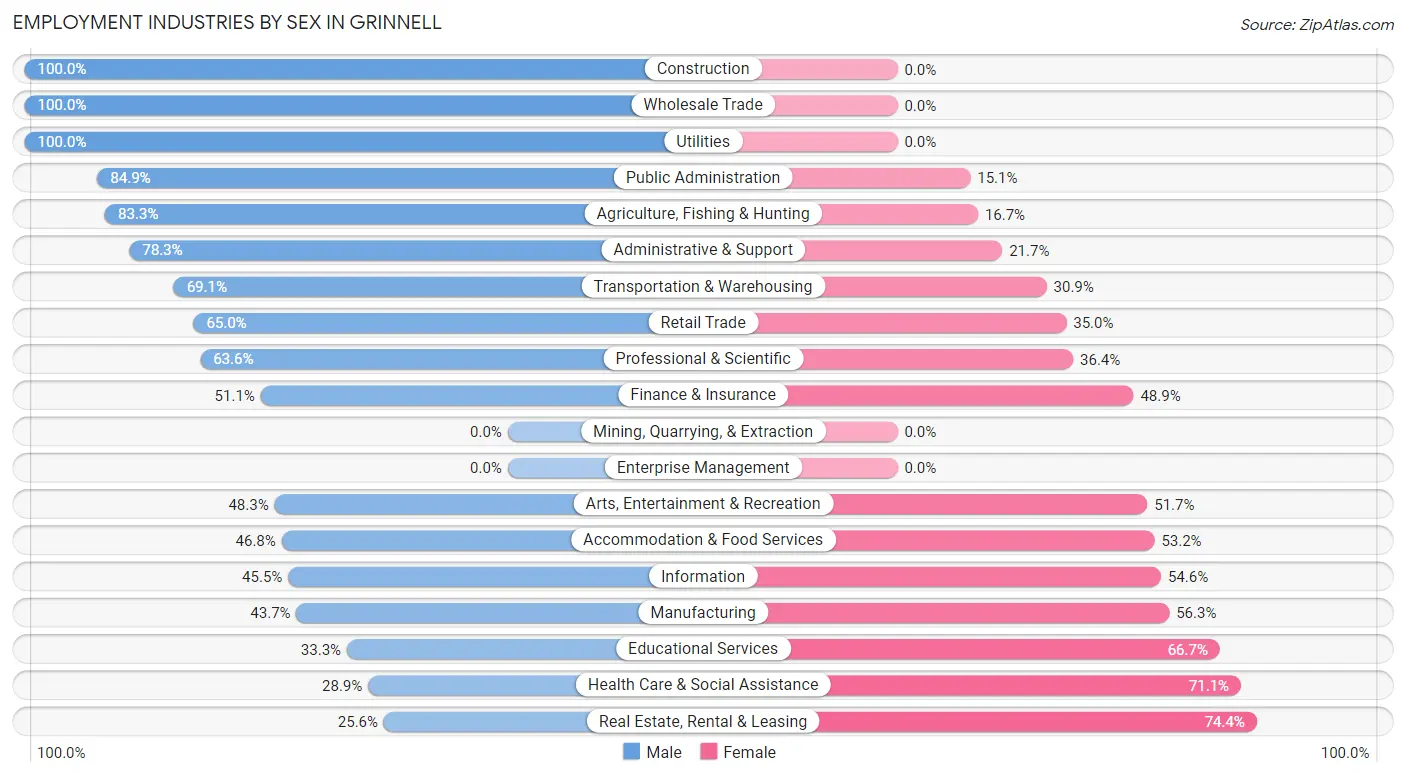
Employment Industries by Sex in Grinnell
The Grinnell industries that see more men than women are Construction (100.0%), Wholesale Trade (100.0%), and Utilities (100.0%), whereas the industries that tend to have a higher number of women are Real Estate, Rental & Leasing (74.4%), Health Care & Social Assistance (71.1%), and Educational Services (66.7%).
| Industry | Male | Female |
| Agriculture, Fishing & Hunting | 50 (83.3%) | 10 (16.7%) |
| Mining, Quarrying, & Extraction | 0 (0.0%) | 0 (0.0%) |
| Construction | 150 (100.0%) | 0 (0.0%) |
| Manufacturing | 227 (43.7%) | 292 (56.3%) |
| Wholesale Trade | 38 (100.0%) | 0 (0.0%) |
| Retail Trade | 333 (65.0%) | 179 (35.0%) |
| Transportation & Warehousing | 47 (69.1%) | 21 (30.9%) |
| Utilities | 12 (100.0%) | 0 (0.0%) |
| Information | 5 (45.5%) | 6 (54.5%) |
| Finance & Insurance | 90 (51.1%) | 86 (48.9%) |
| Real Estate, Rental & Leasing | 10 (25.6%) | 29 (74.4%) |
| Professional & Scientific | 98 (63.6%) | 56 (36.4%) |
| Enterprise Management | 0 (0.0%) | 0 (0.0%) |
| Administrative & Support | 65 (78.3%) | 18 (21.7%) |
| Educational Services | 493 (33.3%) | 988 (66.7%) |
| Health Care & Social Assistance | 161 (28.9%) | 396 (71.1%) |
| Arts, Entertainment & Recreation | 14 (48.3%) | 15 (51.7%) |
| Accommodation & Food Services | 205 (46.8%) | 233 (53.2%) |
| Public Administration | 107 (84.9%) | 19 (15.1%) |
| Total | 2,156 (47.2%) | 2,410 (52.8%) |
Education in Grinnell
School Enrollment in Grinnell
The most common levels of schooling among the 3,284 students in Grinnell are college / undergraduate (1,649 | 50.2%), high school (575 | 17.5%), and elementary school (448 | 13.6%).
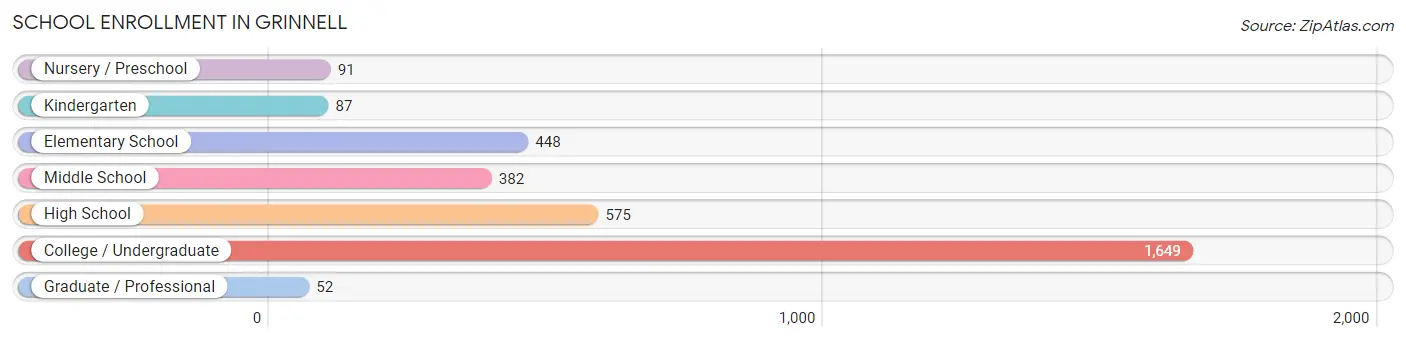
| School Level | # Students | % Students |
| Nursery / Preschool | 91 | 2.8% |
| Kindergarten | 87 | 2.6% |
| Elementary School | 448 | 13.6% |
| Middle School | 382 | 11.6% |
| High School | 575 | 17.5% |
| College / Undergraduate | 1,649 | 50.2% |
| Graduate / Professional | 52 | 1.6% |
| Total | 3,284 | 100.0% |
School Enrollment by Age by Funding Source in Grinnell
Out of a total of 3,284 students who are enrolled in schools in Grinnell, 1,731 (52.7%) attend a private institution, while the remaining 1,553 (47.3%) are enrolled in public schools. The age group of 35 years and over has the highest likelihood of being enrolled in private schools, with 40 (100.0% in the age bracket) enrolled. Conversely, the age group of 25 to 34 year olds has the lowest likelihood of being enrolled in a private school, with 41 (100.0% in the age bracket) attending a public institution.
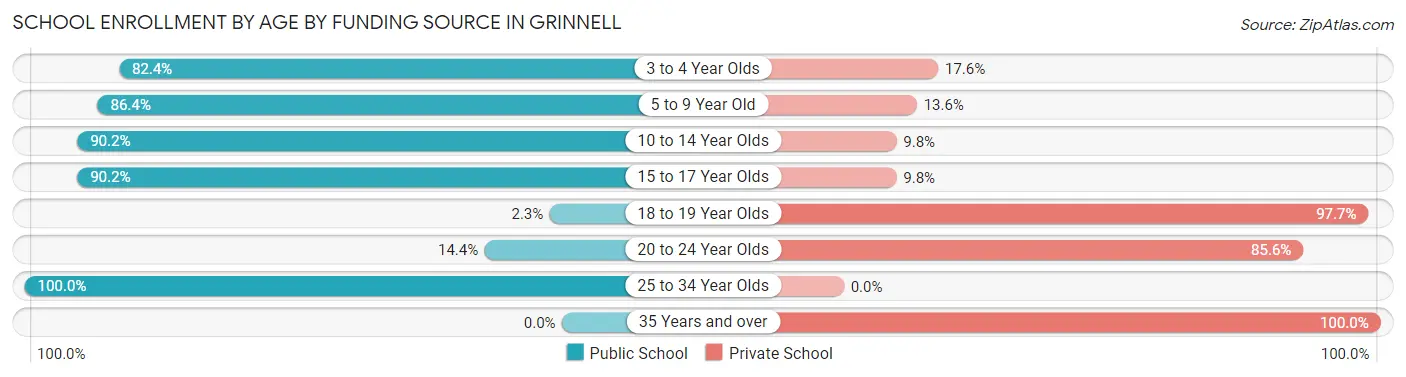
| Age Bracket | Public School | Private School |
| 3 to 4 Year Olds | 75 (82.4%) | 16 (17.6%) |
| 5 to 9 Year Old | 413 (86.4%) | 65 (13.6%) |
| 10 to 14 Year Olds | 533 (90.2%) | 58 (9.8%) |
| 15 to 17 Year Olds | 377 (90.2%) | 41 (9.8%) |
| 18 to 19 Year Olds | 23 (2.3%) | 978 (97.7%) |
| 20 to 24 Year Olds | 90 (14.4%) | 534 (85.6%) |
| 25 to 34 Year Olds | 41 (100.0%) | 0 (0.0%) |
| 35 Years and over | 0 (0.0%) | 40 (100.0%) |
| Total | 1,553 (47.3%) | 1,731 (52.7%) |
Educational Attainment by Field of Study in Grinnell
Social sciences (406 | 16.8%), education (371 | 15.3%), business (298 | 12.3%), literature & languages (267 | 11.0%), and liberal arts & history (222 | 9.2%) are the most common fields of study among 2,421 individuals in Grinnell who have obtained a bachelor's degree or higher.
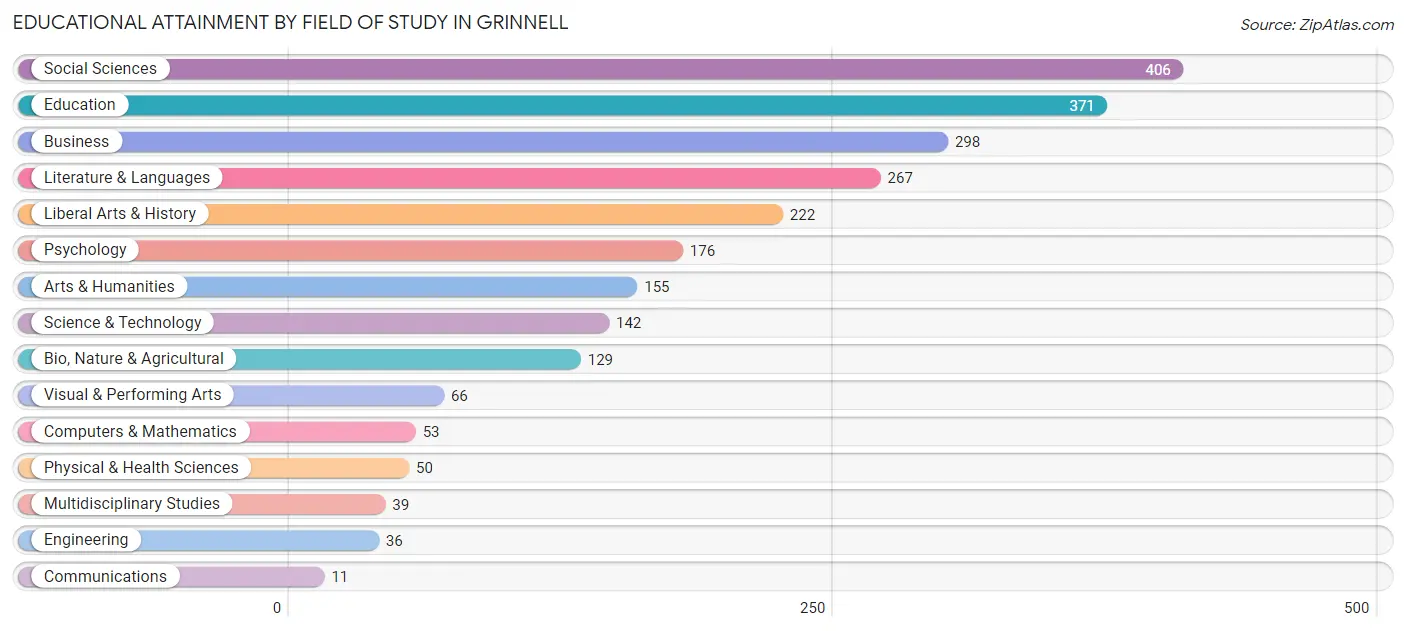
| Field of Study | # Graduates | % Graduates |
| Computers & Mathematics | 53 | 2.2% |
| Bio, Nature & Agricultural | 129 | 5.3% |
| Physical & Health Sciences | 50 | 2.1% |
| Psychology | 176 | 7.3% |
| Social Sciences | 406 | 16.8% |
| Engineering | 36 | 1.5% |
| Multidisciplinary Studies | 39 | 1.6% |
| Science & Technology | 142 | 5.9% |
| Business | 298 | 12.3% |
| Education | 371 | 15.3% |
| Literature & Languages | 267 | 11.0% |
| Liberal Arts & History | 222 | 9.2% |
| Visual & Performing Arts | 66 | 2.7% |
| Communications | 11 | 0.4% |
| Arts & Humanities | 155 | 6.4% |
| Total | 2,421 | 100.0% |
Transportation & Commute in Grinnell
Vehicle Availability by Sex in Grinnell
The most prevalent vehicle ownership categories in Grinnell are males with 2 vehicles (773, accounting for 40.3%) and females with 2 vehicles (687, making up 44.1%).
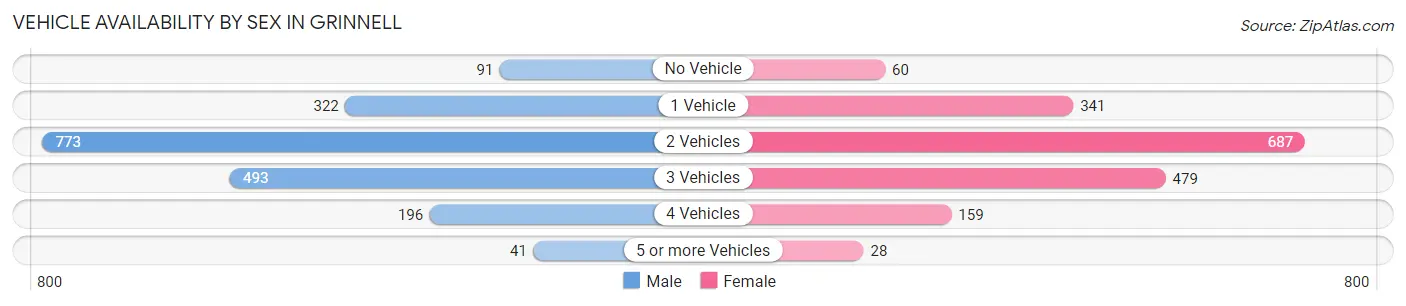
| Vehicles Available | Male | Female |
| No Vehicle | 91 (4.8%) | 60 (3.4%) |
| 1 Vehicle | 322 (16.8%) | 341 (19.4%) |
| 2 Vehicles | 773 (40.3%) | 687 (39.2%) |
| 3 Vehicles | 493 (25.7%) | 479 (27.3%) |
| 4 Vehicles | 196 (10.2%) | 159 (9.1%) |
| 5 or more Vehicles | 41 (2.1%) | 28 (1.6%) |
| Total | 1,916 (100.0%) | 1,754 (100.0%) |
Commute Time in Grinnell
The most frequently occuring commute durations in Grinnell are 5 to 9 minutes (1,628 commuters, 42.4%), less than 5 minutes (678 commuters, 17.6%), and 10 to 14 minutes (630 commuters, 16.4%).
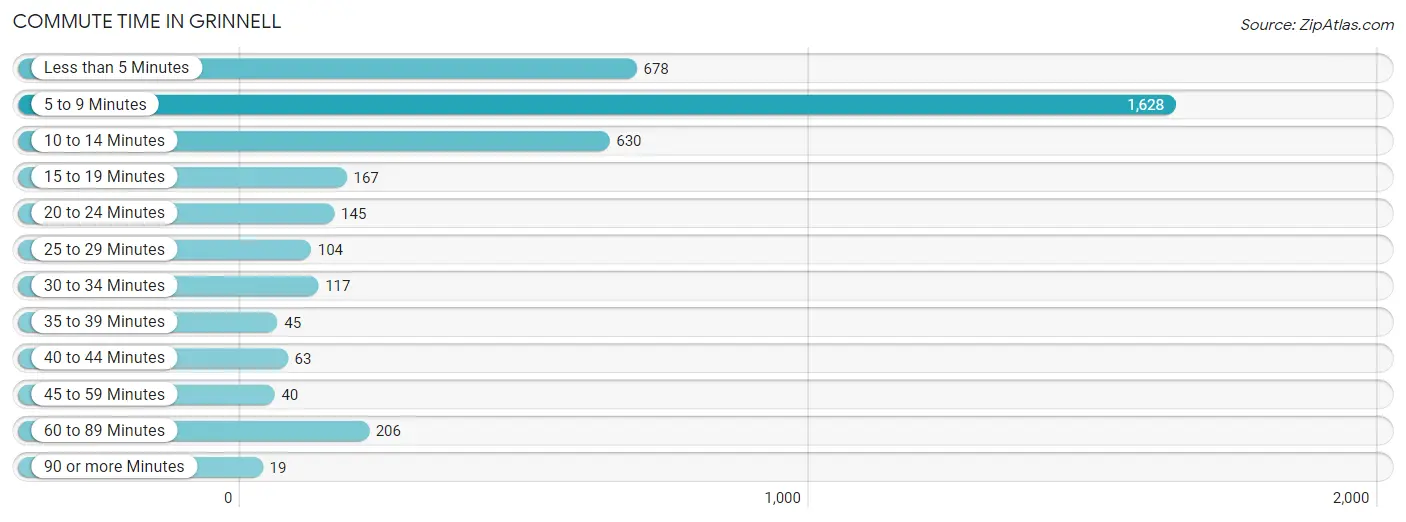
| Commute Time | # Commuters | % Commuters |
| Less than 5 Minutes | 678 | 17.6% |
| 5 to 9 Minutes | 1,628 | 42.4% |
| 10 to 14 Minutes | 630 | 16.4% |
| 15 to 19 Minutes | 167 | 4.3% |
| 20 to 24 Minutes | 145 | 3.8% |
| 25 to 29 Minutes | 104 | 2.7% |
| 30 to 34 Minutes | 117 | 3.0% |
| 35 to 39 Minutes | 45 | 1.2% |
| 40 to 44 Minutes | 63 | 1.6% |
| 45 to 59 Minutes | 40 | 1.0% |
| 60 to 89 Minutes | 206 | 5.4% |
| 90 or more Minutes | 19 | 0.5% |
Commute Time by Sex in Grinnell
The most common commute times in Grinnell are 5 to 9 minutes (766 commuters, 40.5%) for males and 5 to 9 minutes (862 commuters, 44.2%) for females.
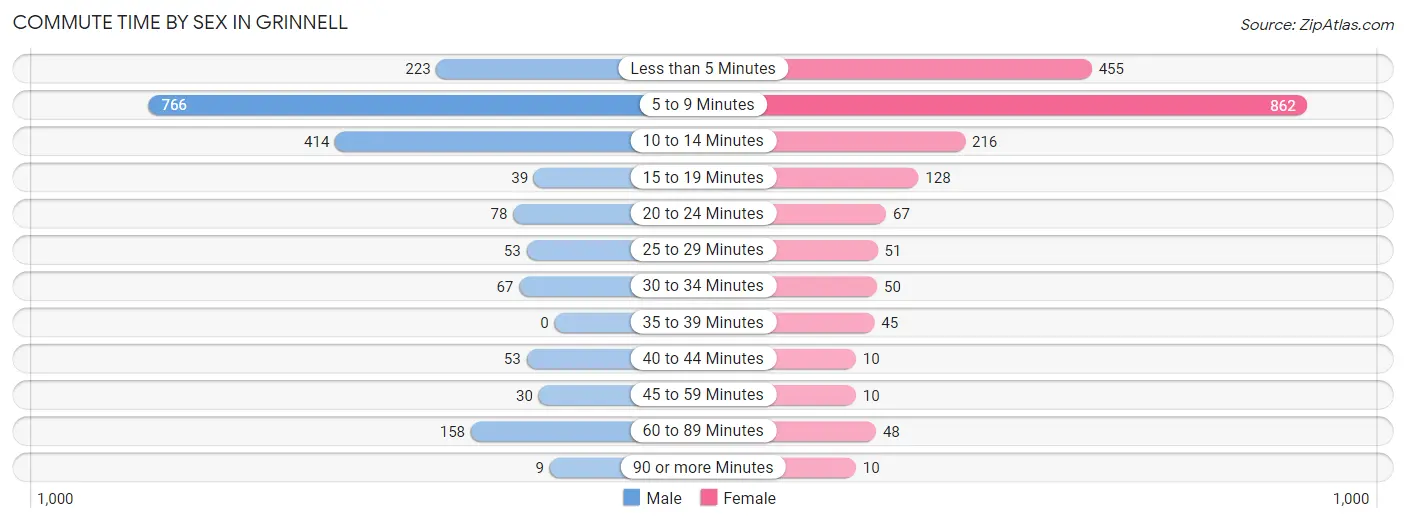
| Commute Time | Male | Female |
| Less than 5 Minutes | 223 (11.8%) | 455 (23.3%) |
| 5 to 9 Minutes | 766 (40.5%) | 862 (44.2%) |
| 10 to 14 Minutes | 414 (21.9%) | 216 (11.1%) |
| 15 to 19 Minutes | 39 (2.1%) | 128 (6.6%) |
| 20 to 24 Minutes | 78 (4.1%) | 67 (3.4%) |
| 25 to 29 Minutes | 53 (2.8%) | 51 (2.6%) |
| 30 to 34 Minutes | 67 (3.5%) | 50 (2.6%) |
| 35 to 39 Minutes | 0 (0.0%) | 45 (2.3%) |
| 40 to 44 Minutes | 53 (2.8%) | 10 (0.5%) |
| 45 to 59 Minutes | 30 (1.6%) | 10 (0.5%) |
| 60 to 89 Minutes | 158 (8.4%) | 48 (2.5%) |
| 90 or more Minutes | 9 (0.5%) | 10 (0.5%) |
Time of Departure to Work by Sex in Grinnell
The most frequent times of departure to work in Grinnell are 7:30 AM to 7:59 AM (374, 19.8%) for males and 7:30 AM to 7:59 AM (495, 25.4%) for females.
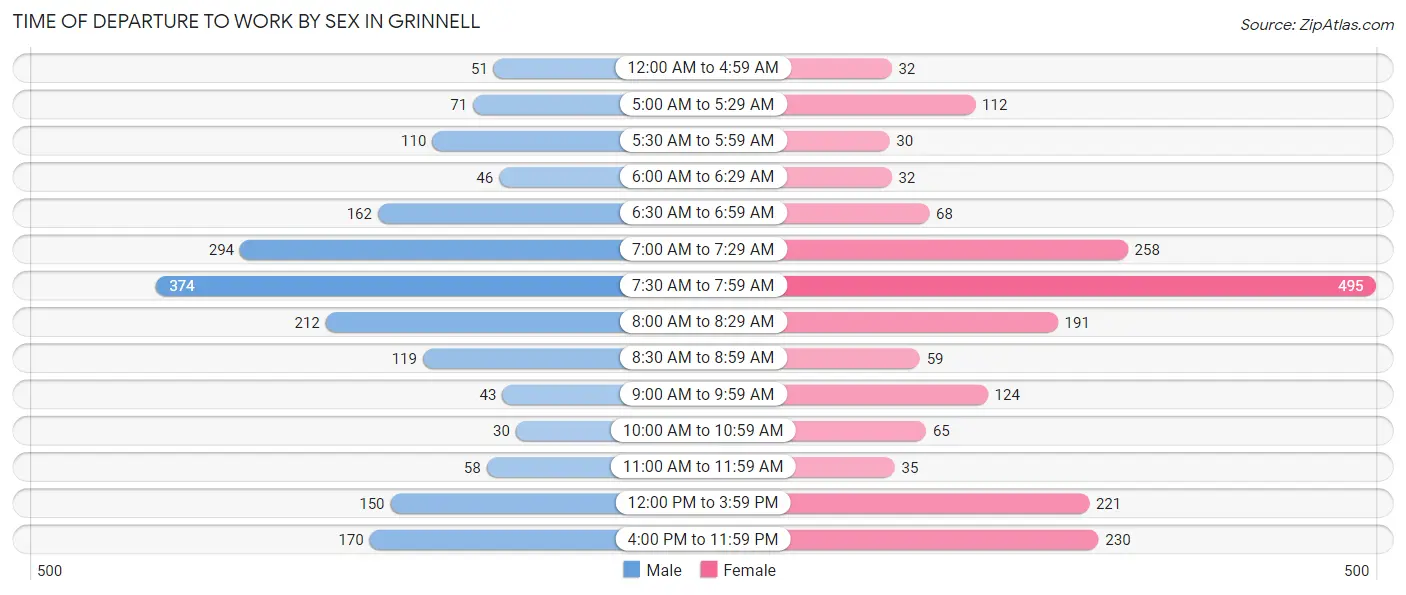
| Time of Departure | Male | Female |
| 12:00 AM to 4:59 AM | 51 (2.7%) | 32 (1.6%) |
| 5:00 AM to 5:29 AM | 71 (3.8%) | 112 (5.7%) |
| 5:30 AM to 5:59 AM | 110 (5.8%) | 30 (1.5%) |
| 6:00 AM to 6:29 AM | 46 (2.4%) | 32 (1.6%) |
| 6:30 AM to 6:59 AM | 162 (8.6%) | 68 (3.5%) |
| 7:00 AM to 7:29 AM | 294 (15.6%) | 258 (13.2%) |
| 7:30 AM to 7:59 AM | 374 (19.8%) | 495 (25.4%) |
| 8:00 AM to 8:29 AM | 212 (11.2%) | 191 (9.8%) |
| 8:30 AM to 8:59 AM | 119 (6.3%) | 59 (3.0%) |
| 9:00 AM to 9:59 AM | 43 (2.3%) | 124 (6.4%) |
| 10:00 AM to 10:59 AM | 30 (1.6%) | 65 (3.3%) |
| 11:00 AM to 11:59 AM | 58 (3.1%) | 35 (1.8%) |
| 12:00 PM to 3:59 PM | 150 (7.9%) | 221 (11.3%) |
| 4:00 PM to 11:59 PM | 170 (9.0%) | 230 (11.8%) |
| Total | 1,890 (100.0%) | 1,952 (100.0%) |
Housing Occupancy in Grinnell
Occupancy by Ownership in Grinnell
Of the total 3,718 dwellings in Grinnell, owner-occupied units account for 2,404 (64.7%), while renter-occupied units make up 1,314 (35.3%).
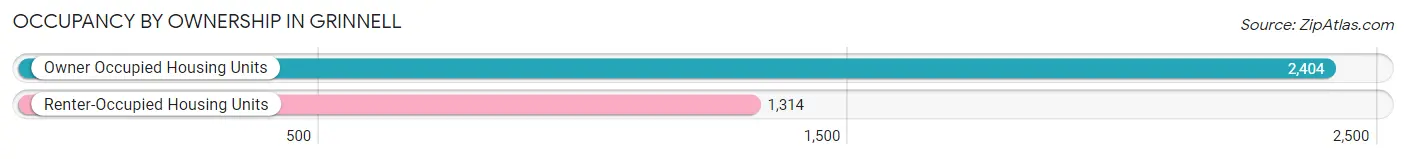
| Occupancy | # Housing Units | % Housing Units |
| Owner Occupied Housing Units | 2,404 | 64.7% |
| Renter-Occupied Housing Units | 1,314 | 35.3% |
| Total Occupied Housing Units | 3,718 | 100.0% |
Occupancy by Household Size in Grinnell
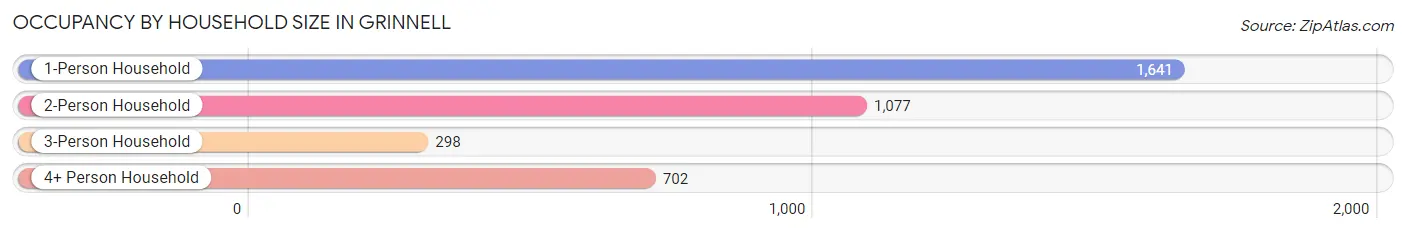
| Household Size | # Housing Units | % Housing Units |
| 1-Person Household | 1,641 | 44.1% |
| 2-Person Household | 1,077 | 29.0% |
| 3-Person Household | 298 | 8.0% |
| 4+ Person Household | 702 | 18.9% |
| Total Housing Units | 3,718 | 100.0% |
Occupancy by Ownership by Household Size in Grinnell
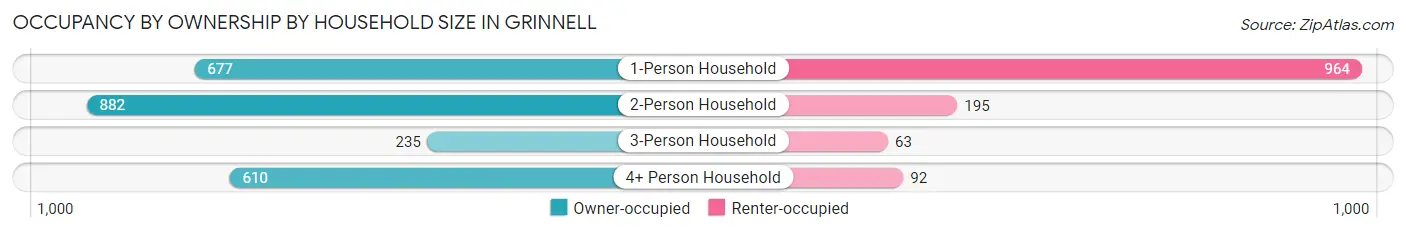
| Household Size | Owner-occupied | Renter-occupied |
| 1-Person Household | 677 (41.3%) | 964 (58.7%) |
| 2-Person Household | 882 (81.9%) | 195 (18.1%) |
| 3-Person Household | 235 (78.9%) | 63 (21.1%) |
| 4+ Person Household | 610 (86.9%) | 92 (13.1%) |
| Total Housing Units | 2,404 (64.7%) | 1,314 (35.3%) |
Occupancy by Educational Attainment in Grinnell
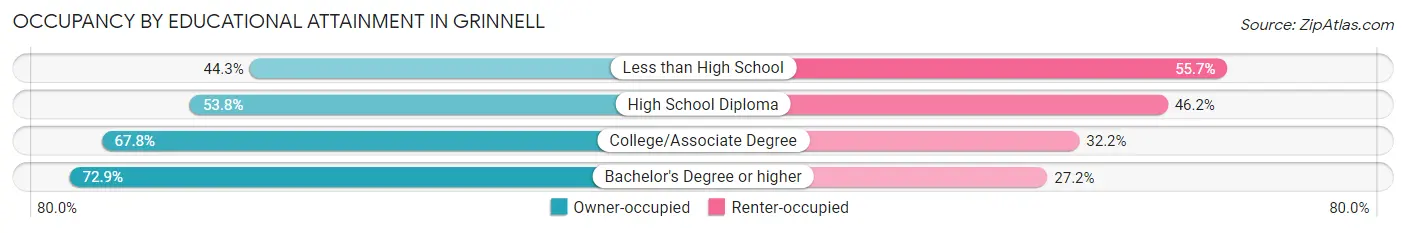
| Household Size | Owner-occupied | Renter-occupied |
| Less than High School | 82 (44.3%) | 103 (55.7%) |
| High School Diploma | 550 (53.8%) | 473 (46.2%) |
| College/Associate Degree | 755 (67.8%) | 359 (32.2%) |
| Bachelor's Degree or higher | 1,017 (72.9%) | 379 (27.2%) |
Occupancy by Age of Householder in Grinnell
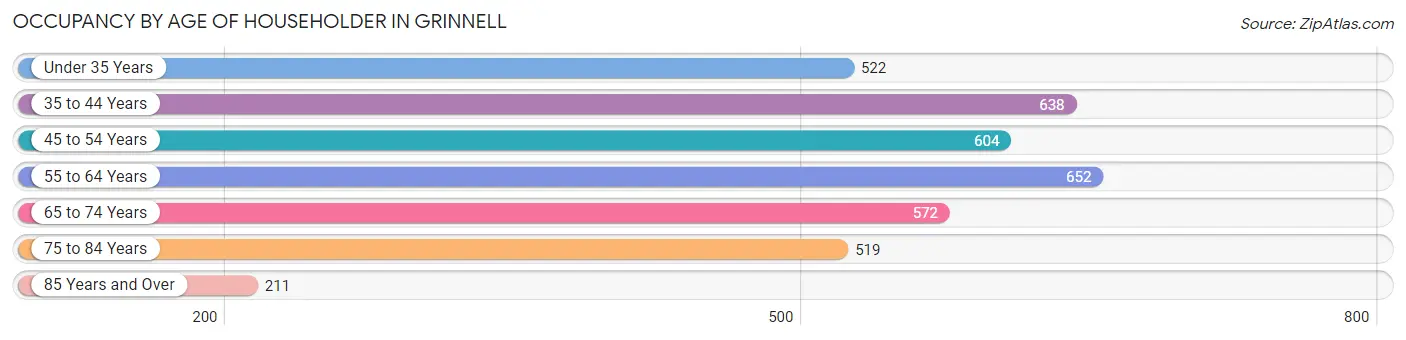
| Age Bracket | # Households | % Households |
| Under 35 Years | 522 | 14.0% |
| 35 to 44 Years | 638 | 17.2% |
| 45 to 54 Years | 604 | 16.3% |
| 55 to 64 Years | 652 | 17.5% |
| 65 to 74 Years | 572 | 15.4% |
| 75 to 84 Years | 519 | 14.0% |
| 85 Years and Over | 211 | 5.7% |
| Total | 3,718 | 100.0% |
Housing Finances in Grinnell
Median Income by Occupancy in Grinnell
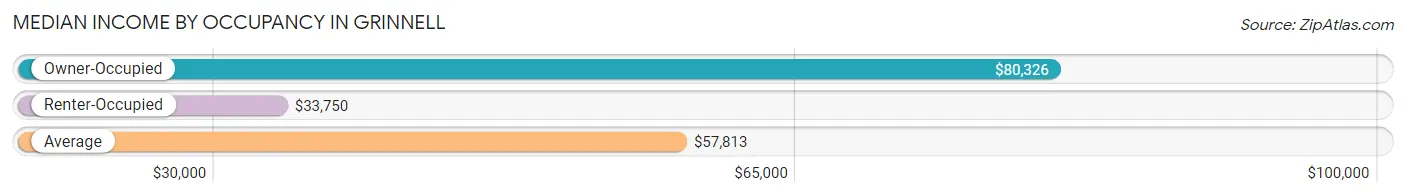
| Occupancy Type | # Households | Median Income |
| Owner-Occupied | 2,404 (64.7%) | $80,326 |
| Renter-Occupied | 1,314 (35.3%) | $33,750 |
| Average | 3,718 (100.0%) | $57,813 |
Occupancy by Householder Income Bracket in Grinnell
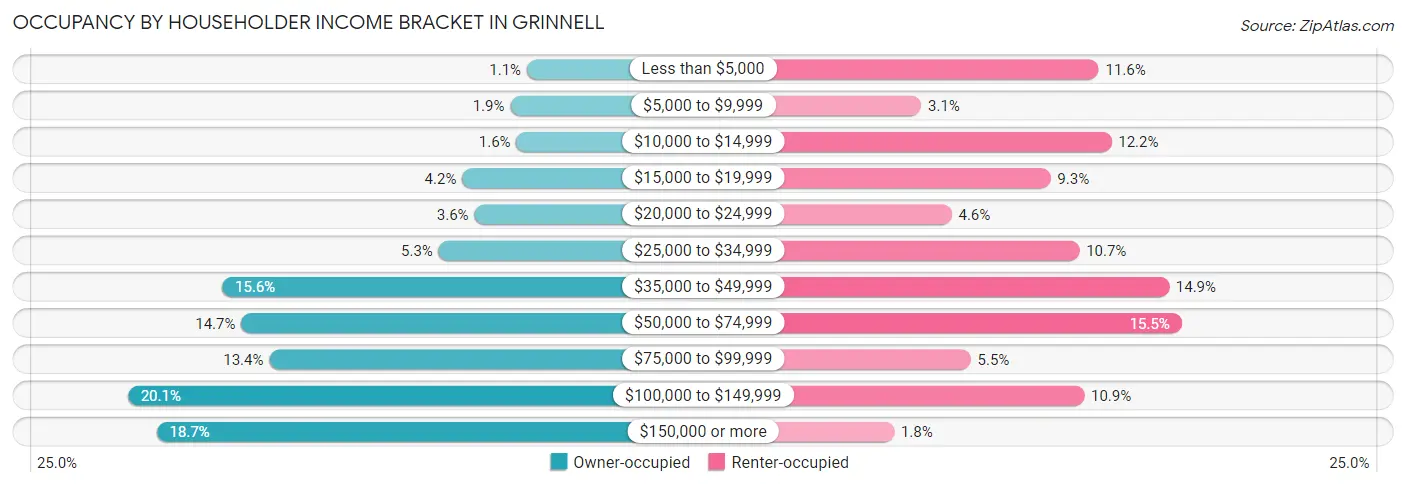
| Income Bracket | Owner-occupied | Renter-occupied |
| Less than $5,000 | 26 (1.1%) | 152 (11.6%) |
| $5,000 to $9,999 | 45 (1.9%) | 41 (3.1%) |
| $10,000 to $14,999 | 38 (1.6%) | 160 (12.2%) |
| $15,000 to $19,999 | 100 (4.2%) | 122 (9.3%) |
| $20,000 to $24,999 | 86 (3.6%) | 60 (4.6%) |
| $25,000 to $34,999 | 127 (5.3%) | 140 (10.6%) |
| $35,000 to $49,999 | 375 (15.6%) | 196 (14.9%) |
| $50,000 to $74,999 | 353 (14.7%) | 204 (15.5%) |
| $75,000 to $99,999 | 321 (13.4%) | 72 (5.5%) |
| $100,000 to $149,999 | 483 (20.1%) | 143 (10.9%) |
| $150,000 or more | 450 (18.7%) | 24 (1.8%) |
| Total | 2,404 (100.0%) | 1,314 (100.0%) |
Monthly Housing Cost Tiers in Grinnell
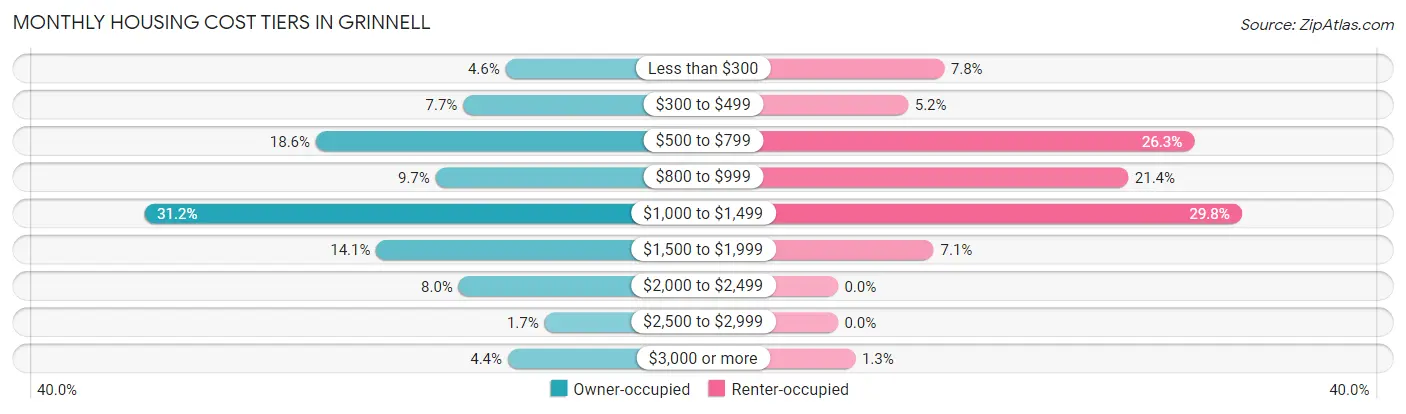
| Monthly Cost | Owner-occupied | Renter-occupied |
| Less than $300 | 110 (4.6%) | 103 (7.8%) |
| $300 to $499 | 185 (7.7%) | 68 (5.2%) |
| $500 to $799 | 446 (18.5%) | 345 (26.3%) |
| $800 to $999 | 234 (9.7%) | 281 (21.4%) |
| $1,000 to $1,499 | 750 (31.2%) | 391 (29.8%) |
| $1,500 to $1,999 | 339 (14.1%) | 93 (7.1%) |
| $2,000 to $2,499 | 193 (8.0%) | 0 (0.0%) |
| $2,500 to $2,999 | 41 (1.7%) | 0 (0.0%) |
| $3,000 or more | 106 (4.4%) | 17 (1.3%) |
| Total | 2,404 (100.0%) | 1,314 (100.0%) |
Physical Housing Characteristics in Grinnell
Housing Structures in Grinnell
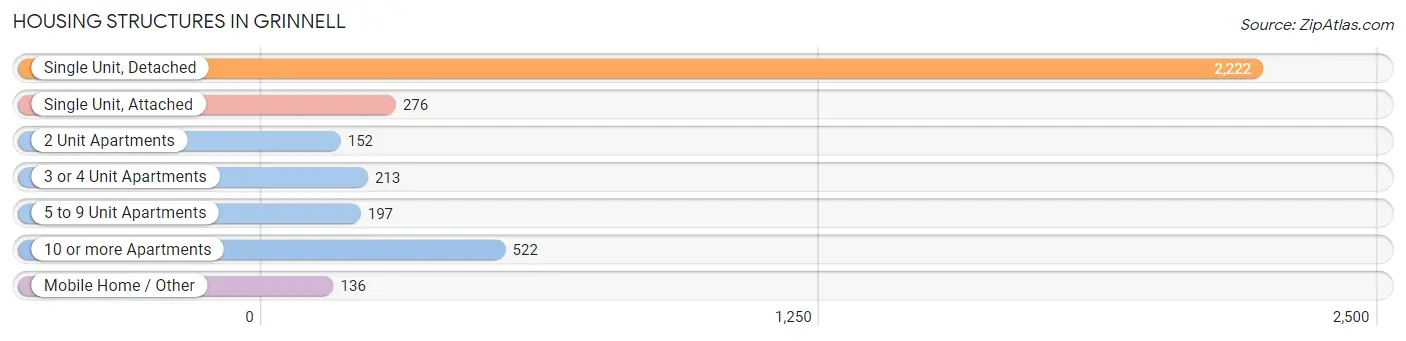
| Structure Type | # Housing Units | % Housing Units |
| Single Unit, Detached | 2,222 | 59.8% |
| Single Unit, Attached | 276 | 7.4% |
| 2 Unit Apartments | 152 | 4.1% |
| 3 or 4 Unit Apartments | 213 | 5.7% |
| 5 to 9 Unit Apartments | 197 | 5.3% |
| 10 or more Apartments | 522 | 14.0% |
| Mobile Home / Other | 136 | 3.7% |
| Total | 3,718 | 100.0% |
Housing Structures by Occupancy in Grinnell
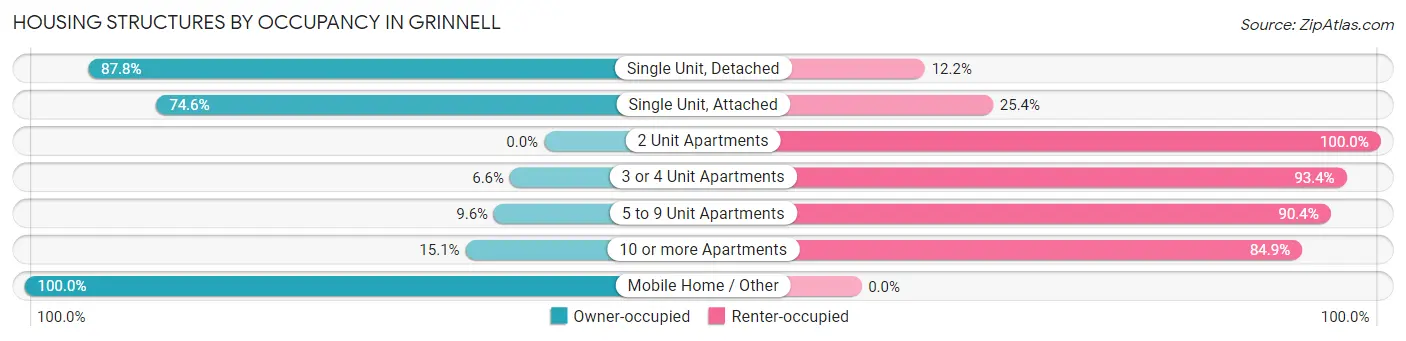
| Structure Type | Owner-occupied | Renter-occupied |
| Single Unit, Detached | 1,950 (87.8%) | 272 (12.2%) |
| Single Unit, Attached | 206 (74.6%) | 70 (25.4%) |
| 2 Unit Apartments | 0 (0.0%) | 152 (100.0%) |
| 3 or 4 Unit Apartments | 14 (6.6%) | 199 (93.4%) |
| 5 to 9 Unit Apartments | 19 (9.6%) | 178 (90.4%) |
| 10 or more Apartments | 79 (15.1%) | 443 (84.9%) |
| Mobile Home / Other | 136 (100.0%) | 0 (0.0%) |
| Total | 2,404 (64.7%) | 1,314 (35.3%) |
Housing Structures by Number of Rooms in Grinnell
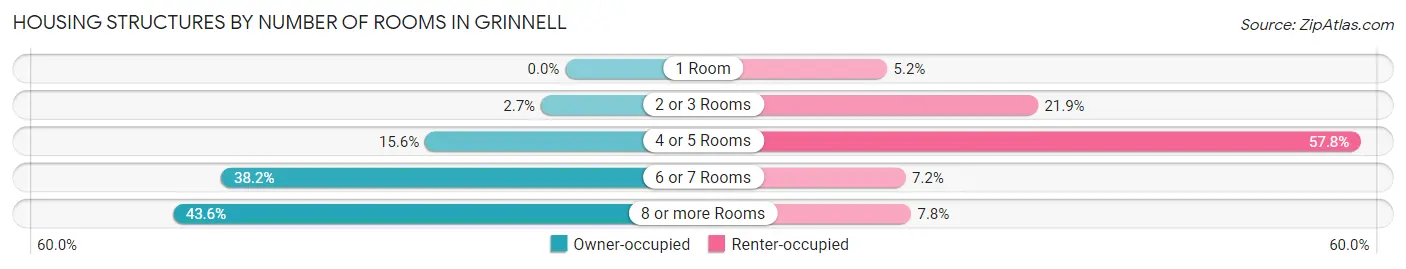
| Number of Rooms | Owner-occupied | Renter-occupied |
| 1 Room | 0 (0.0%) | 68 (5.2%) |
| 2 or 3 Rooms | 65 (2.7%) | 288 (21.9%) |
| 4 or 5 Rooms | 374 (15.6%) | 760 (57.8%) |
| 6 or 7 Rooms | 918 (38.2%) | 95 (7.2%) |
| 8 or more Rooms | 1,047 (43.5%) | 103 (7.8%) |
| Total | 2,404 (100.0%) | 1,314 (100.0%) |
Housing Structure by Heating Type in Grinnell
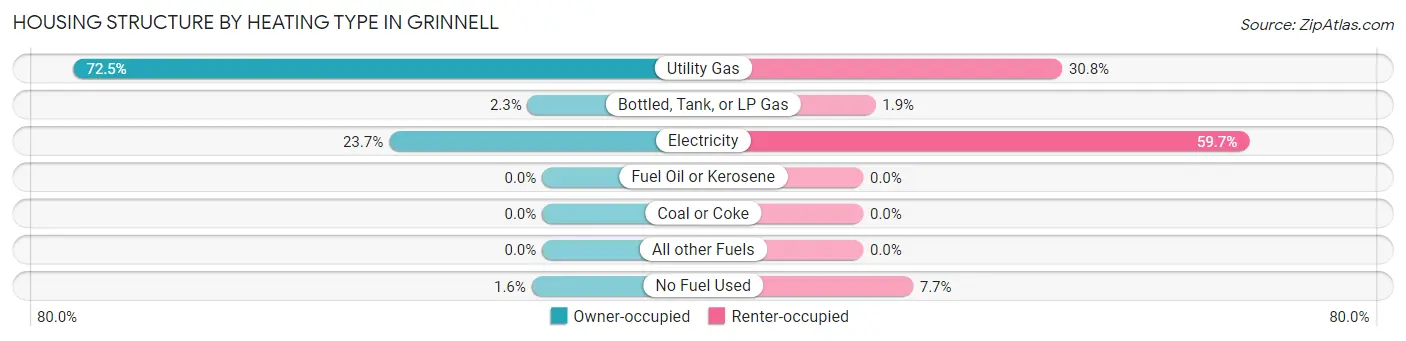
| Heating Type | Owner-occupied | Renter-occupied |
| Utility Gas | 1,742 (72.5%) | 404 (30.7%) |
| Bottled, Tank, or LP Gas | 54 (2.2%) | 25 (1.9%) |
| Electricity | 569 (23.7%) | 784 (59.7%) |
| Fuel Oil or Kerosene | 0 (0.0%) | 0 (0.0%) |
| Coal or Coke | 0 (0.0%) | 0 (0.0%) |
| All other Fuels | 0 (0.0%) | 0 (0.0%) |
| No Fuel Used | 39 (1.6%) | 101 (7.7%) |
| Total | 2,404 (100.0%) | 1,314 (100.0%) |
Household Vehicle Usage in Grinnell
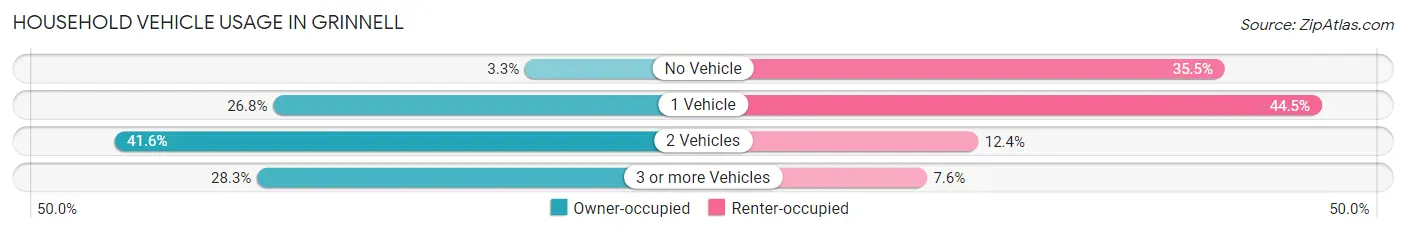
| Vehicles per Household | Owner-occupied | Renter-occupied |
| No Vehicle | 79 (3.3%) | 466 (35.5%) |
| 1 Vehicle | 644 (26.8%) | 585 (44.5%) |
| 2 Vehicles | 1,001 (41.6%) | 163 (12.4%) |
| 3 or more Vehicles | 680 (28.3%) | 100 (7.6%) |
| Total | 2,404 (100.0%) | 1,314 (100.0%) |
Real Estate & Mortgages in Grinnell
Real Estate and Mortgage Overview in Grinnell
| Characteristic | Without Mortgage | With Mortgage |
| Housing Units | 992 | 1,412 |
| Median Property Value | $160,900 | $187,900 |
| Median Household Income | $54,333 | $316 |
| Monthly Housing Costs | $598 | $106 |
| Real Estate Taxes | $2,586 | $13 |
Property Value by Mortgage Status in Grinnell
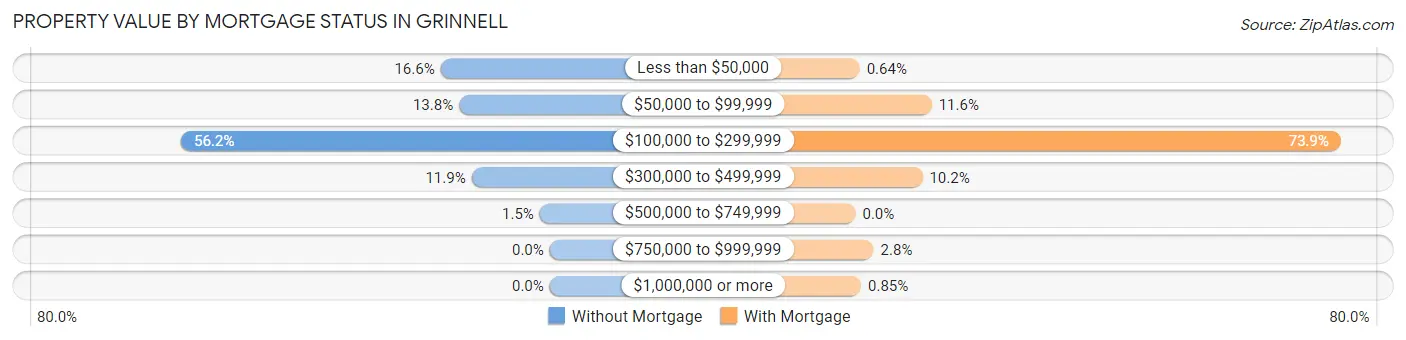
| Property Value | Without Mortgage | With Mortgage |
| Less than $50,000 | 165 (16.6%) | 9 (0.6%) |
| $50,000 to $99,999 | 137 (13.8%) | 164 (11.6%) |
| $100,000 to $299,999 | 557 (56.1%) | 1,044 (73.9%) |
| $300,000 to $499,999 | 118 (11.9%) | 144 (10.2%) |
| $500,000 to $749,999 | 15 (1.5%) | 0 (0.0%) |
| $750,000 to $999,999 | 0 (0.0%) | 39 (2.8%) |
| $1,000,000 or more | 0 (0.0%) | 12 (0.9%) |
| Total | 992 (100.0%) | 1,412 (100.0%) |
Household Income by Mortgage Status in Grinnell
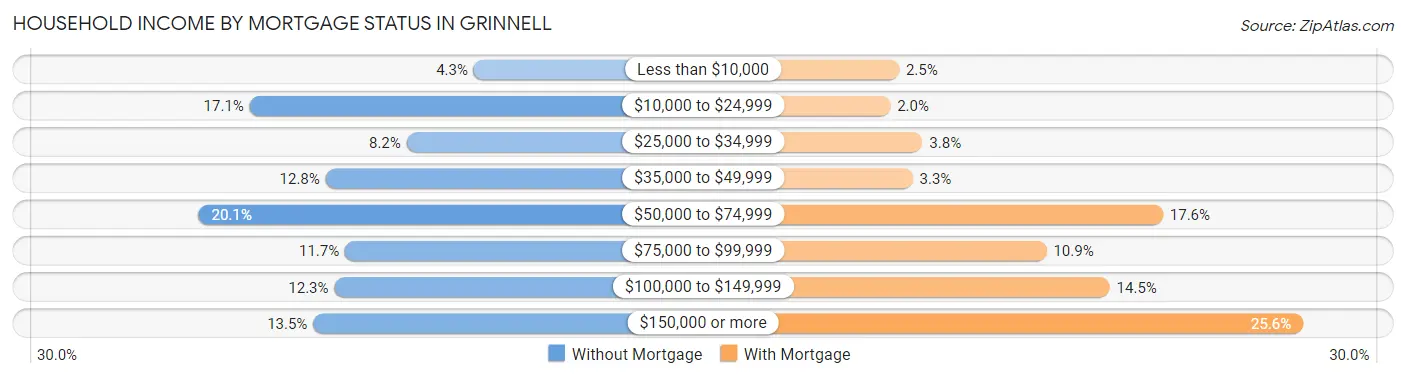
| Household Income | Without Mortgage | With Mortgage |
| Less than $10,000 | 43 (4.3%) | 35 (2.5%) |
| $10,000 to $24,999 | 170 (17.1%) | 28 (2.0%) |
| $25,000 to $34,999 | 81 (8.2%) | 54 (3.8%) |
| $35,000 to $49,999 | 127 (12.8%) | 46 (3.3%) |
| $50,000 to $74,999 | 199 (20.1%) | 248 (17.6%) |
| $75,000 to $99,999 | 116 (11.7%) | 154 (10.9%) |
| $100,000 to $149,999 | 122 (12.3%) | 205 (14.5%) |
| $150,000 or more | 134 (13.5%) | 361 (25.6%) |
| Total | 992 (100.0%) | 1,412 (100.0%) |
Property Value to Household Income Ratio in Grinnell
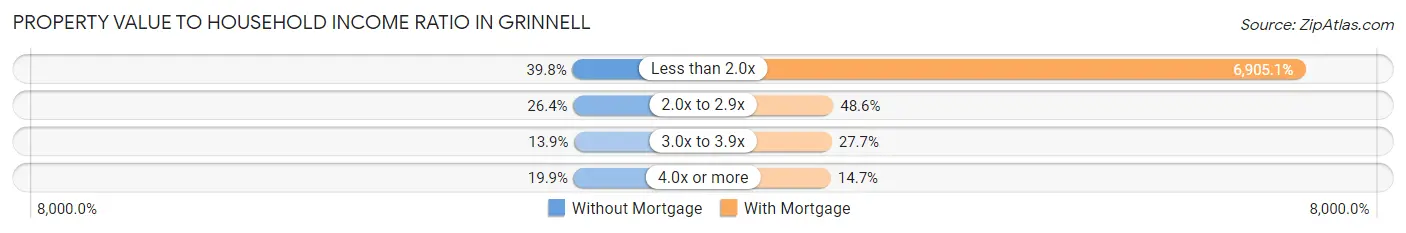
| Value-to-Income Ratio | Without Mortgage | With Mortgage |
| Less than 2.0x | 395 (39.8%) | 97,500 (6,905.1%) |
| 2.0x to 2.9x | 262 (26.4%) | 686 (48.6%) |
| 3.0x to 3.9x | 138 (13.9%) | 391 (27.7%) |
| 4.0x or more | 197 (19.9%) | 208 (14.7%) |
| Total | 992 (100.0%) | 1,412 (100.0%) |
Real Estate Taxes by Mortgage Status in Grinnell
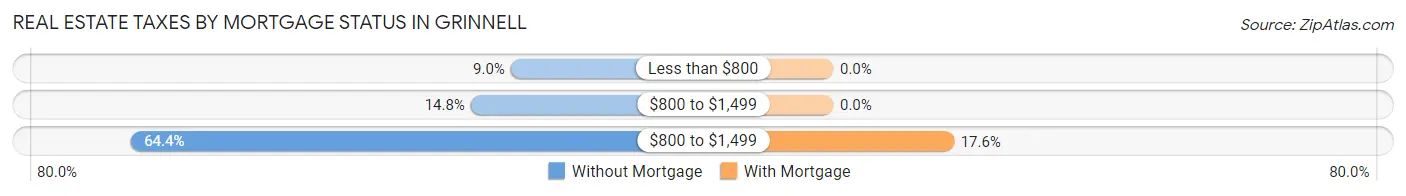
| Property Taxes | Without Mortgage | With Mortgage |
| Less than $800 | 89 (9.0%) | 0 (0.0%) |
| $800 to $1,499 | 147 (14.8%) | 0 (0.0%) |
| $800 to $1,499 | 639 (64.4%) | 249 (17.6%) |
| Total | 992 (100.0%) | 1,412 (100.0%) |
Health & Disability in Grinnell
Health Insurance Coverage by Age in Grinnell
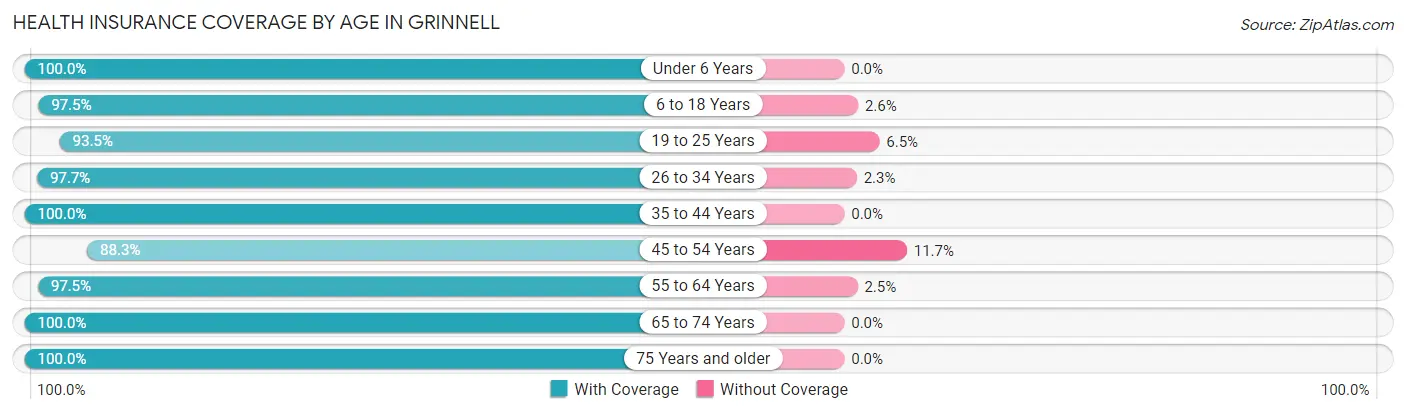
| Age Bracket | With Coverage | Without Coverage |
| Under 6 Years | 400 (100.0%) | 0 (0.0%) |
| 6 to 18 Years | 1,761 (97.5%) | 46 (2.5%) |
| 19 to 25 Years | 1,486 (93.5%) | 104 (6.5%) |
| 26 to 34 Years | 592 (97.7%) | 14 (2.3%) |
| 35 to 44 Years | 1,090 (100.0%) | 0 (0.0%) |
| 45 to 54 Years | 879 (88.3%) | 116 (11.7%) |
| 55 to 64 Years | 951 (97.5%) | 24 (2.5%) |
| 65 to 74 Years | 933 (100.0%) | 0 (0.0%) |
| 75 Years and older | 929 (100.0%) | 0 (0.0%) |
| Total | 9,021 (96.7%) | 304 (3.3%) |
Health Insurance Coverage by Citizenship Status in Grinnell
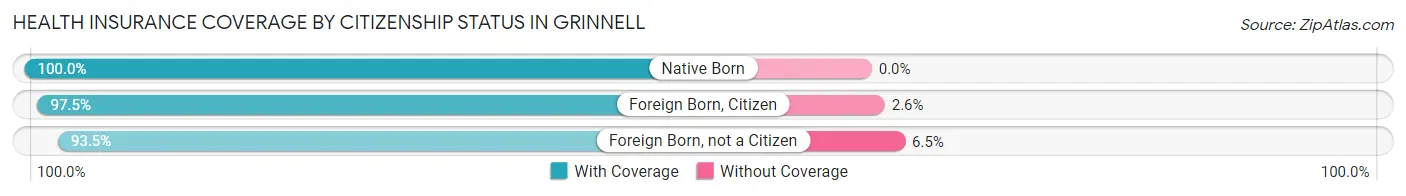
| Citizenship Status | With Coverage | Without Coverage |
| Native Born | 400 (100.0%) | 0 (0.0%) |
| Foreign Born, Citizen | 1,761 (97.5%) | 46 (2.5%) |
| Foreign Born, not a Citizen | 1,486 (93.5%) | 104 (6.5%) |
Health Insurance Coverage by Household Income in Grinnell
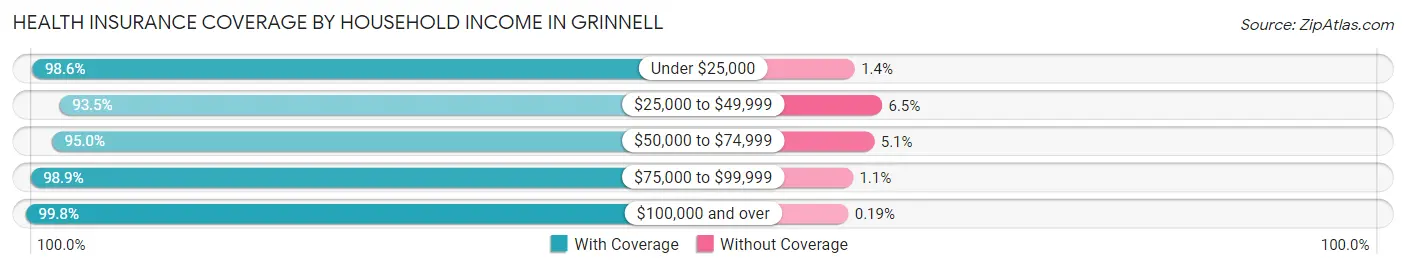
| Household Income | With Coverage | Without Coverage |
| Under $25,000 | 991 (98.6%) | 14 (1.4%) |
| $25,000 to $49,999 | 1,306 (93.5%) | 91 (6.5%) |
| $50,000 to $74,999 | 921 (95.0%) | 49 (5.1%) |
| $75,000 to $99,999 | 932 (98.9%) | 10 (1.1%) |
| $100,000 and over | 3,655 (99.8%) | 7 (0.2%) |
Public vs Private Health Insurance Coverage by Age in Grinnell
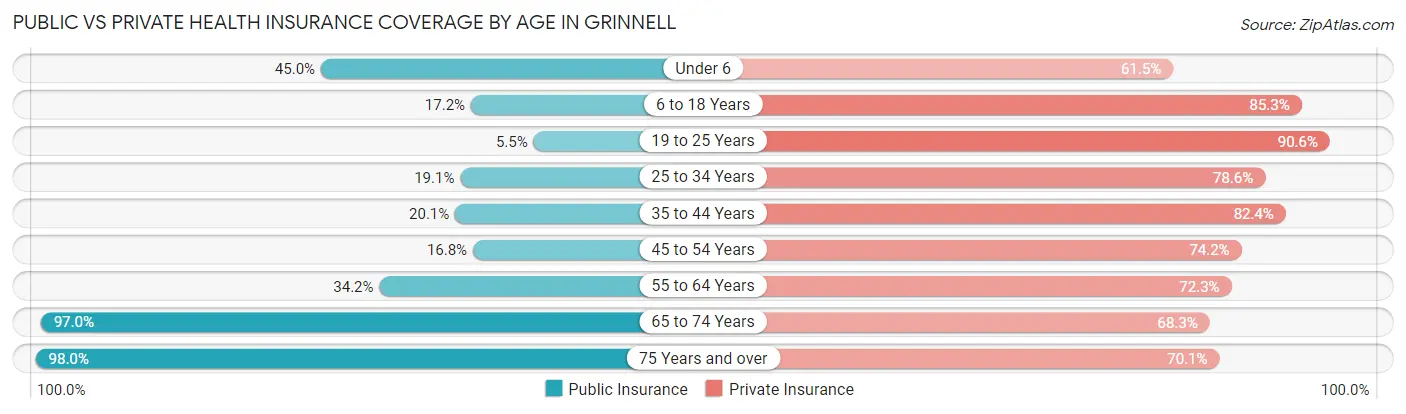
| Age Bracket | Public Insurance | Private Insurance |
| Under 6 | 180 (45.0%) | 246 (61.5%) |
| 6 to 18 Years | 310 (17.2%) | 1,542 (85.3%) |
| 19 to 25 Years | 88 (5.5%) | 1,440 (90.6%) |
| 25 to 34 Years | 116 (19.1%) | 476 (78.5%) |
| 35 to 44 Years | 219 (20.1%) | 898 (82.4%) |
| 45 to 54 Years | 167 (16.8%) | 738 (74.2%) |
| 55 to 64 Years | 333 (34.2%) | 705 (72.3%) |
| 65 to 74 Years | 905 (97.0%) | 637 (68.3%) |
| 75 Years and over | 910 (98.0%) | 651 (70.1%) |
| Total | 3,228 (34.6%) | 7,333 (78.6%) |
Disability Status by Sex by Age in Grinnell
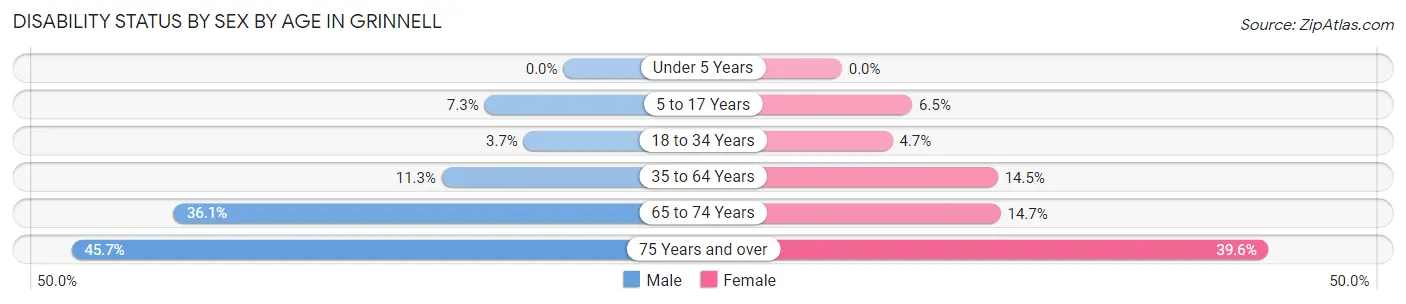
| Age Bracket | Male | Female |
| Under 5 Years | 0 (0.0%) | 0 (0.0%) |
| 5 to 17 Years | 55 (7.3%) | 49 (6.5%) |
| 18 to 34 Years | 43 (3.7%) | 65 (4.7%) |
| 35 to 64 Years | 162 (11.3%) | 235 (14.5%) |
| 65 to 74 Years | 163 (36.1%) | 71 (14.7%) |
| 75 Years and over | 152 (45.7%) | 236 (39.6%) |
Disability Class by Sex by Age in Grinnell
Disability Class: Hearing Difficulty
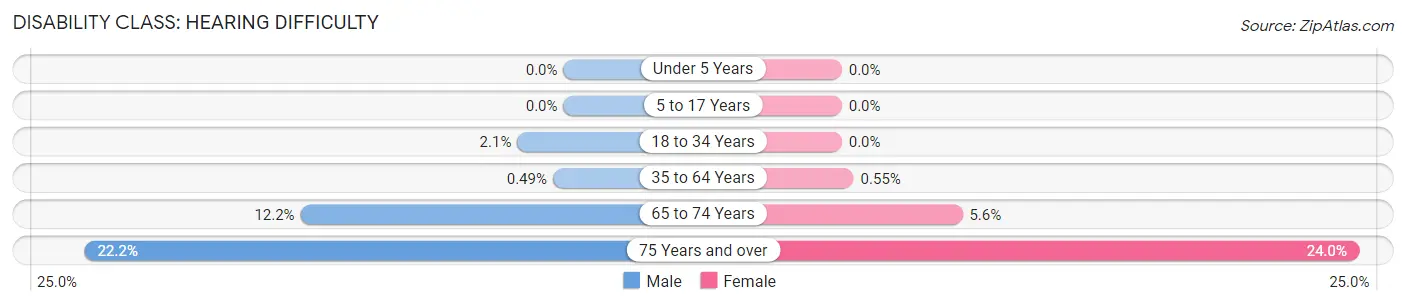
| Age Bracket | Male | Female |
| Under 5 Years | 0 (0.0%) | 0 (0.0%) |
| 5 to 17 Years | 0 (0.0%) | 0 (0.0%) |
| 18 to 34 Years | 25 (2.1%) | 0 (0.0%) |
| 35 to 64 Years | 7 (0.5%) | 9 (0.5%) |
| 65 to 74 Years | 55 (12.2%) | 27 (5.6%) |
| 75 Years and over | 74 (22.2%) | 143 (24.0%) |
Disability Class: Vision Difficulty
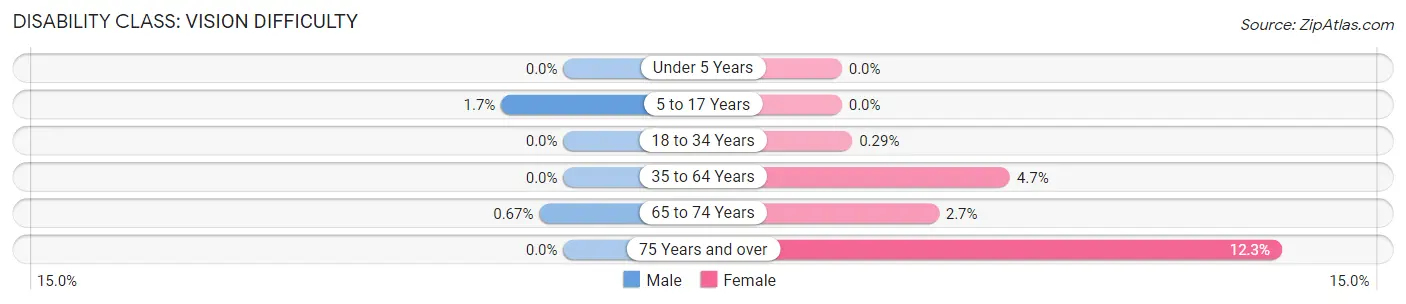
| Age Bracket | Male | Female |
| Under 5 Years | 0 (0.0%) | 0 (0.0%) |
| 5 to 17 Years | 13 (1.7%) | 0 (0.0%) |
| 18 to 34 Years | 0 (0.0%) | 4 (0.3%) |
| 35 to 64 Years | 0 (0.0%) | 76 (4.7%) |
| 65 to 74 Years | 3 (0.7%) | 13 (2.7%) |
| 75 Years and over | 0 (0.0%) | 73 (12.2%) |
Disability Class: Cognitive Difficulty
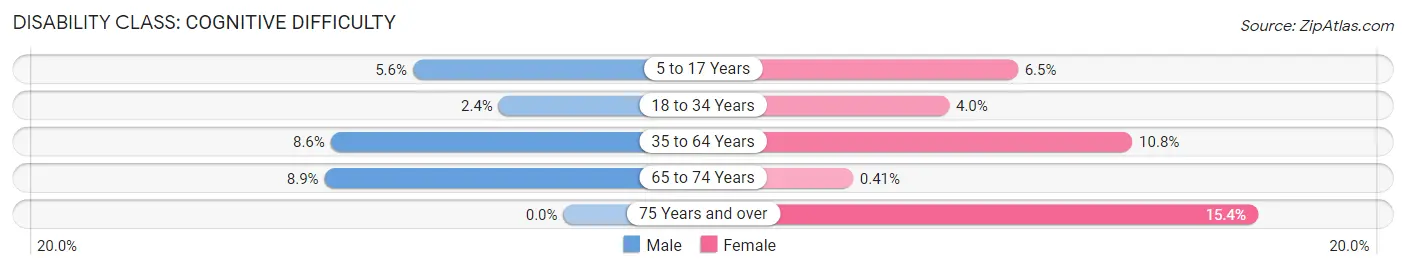
| Age Bracket | Male | Female |
| 5 to 17 Years | 42 (5.6%) | 49 (6.5%) |
| 18 to 34 Years | 28 (2.4%) | 55 (4.0%) |
| 35 to 64 Years | 124 (8.6%) | 175 (10.8%) |
| 65 to 74 Years | 40 (8.9%) | 2 (0.4%) |
| 75 Years and over | 0 (0.0%) | 92 (15.4%) |
Disability Class: Ambulatory Difficulty
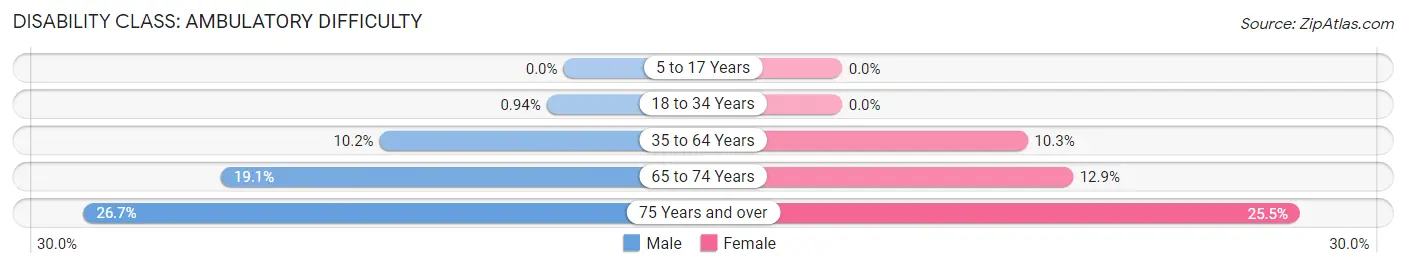
| Age Bracket | Male | Female |
| 5 to 17 Years | 0 (0.0%) | 0 (0.0%) |
| 18 to 34 Years | 11 (0.9%) | 0 (0.0%) |
| 35 to 64 Years | 147 (10.2%) | 168 (10.3%) |
| 65 to 74 Years | 86 (19.1%) | 62 (12.9%) |
| 75 Years and over | 89 (26.7%) | 152 (25.5%) |
Disability Class: Self-Care Difficulty
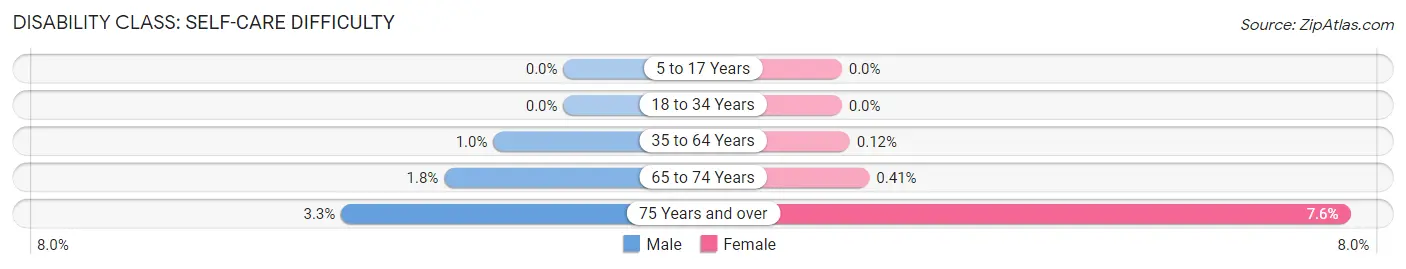
| Age Bracket | Male | Female |
| 5 to 17 Years | 0 (0.0%) | 0 (0.0%) |
| 18 to 34 Years | 0 (0.0%) | 0 (0.0%) |
| 35 to 64 Years | 15 (1.0%) | 2 (0.1%) |
| 65 to 74 Years | 8 (1.8%) | 2 (0.4%) |
| 75 Years and over | 11 (3.3%) | 45 (7.5%) |
Technology Access in Grinnell
Computing Device Access in Grinnell
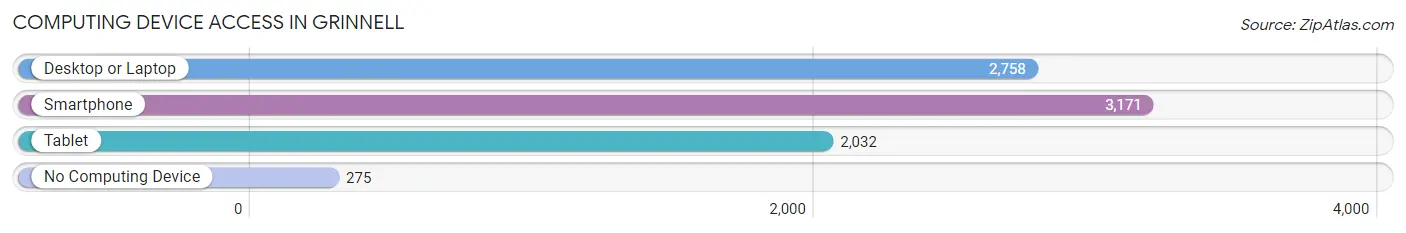
| Device Type | # Households | % Households |
| Desktop or Laptop | 2,758 | 74.2% |
| Smartphone | 3,171 | 85.3% |
| Tablet | 2,032 | 54.6% |
| No Computing Device | 275 | 7.4% |
| Total | 3,718 | 100.0% |
Internet Access in Grinnell
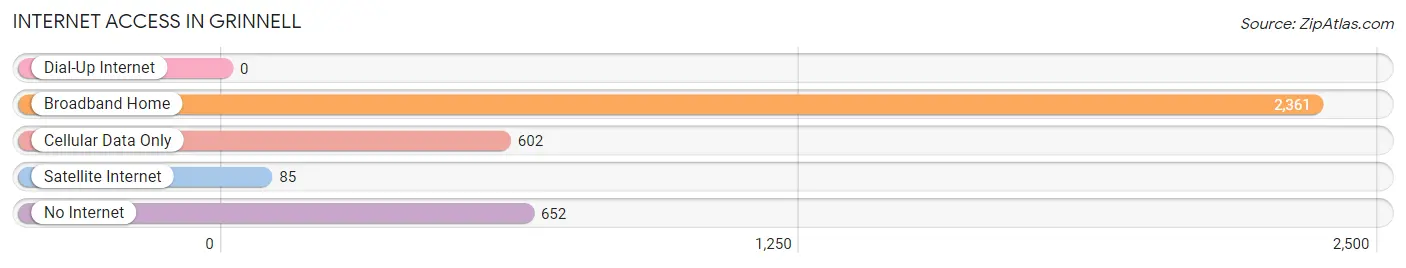
| Internet Type | # Households | % Households |
| Dial-Up Internet | 0 | 0.0% |
| Broadband Home | 2,361 | 63.5% |
| Cellular Data Only | 602 | 16.2% |
| Satellite Internet | 85 | 2.3% |
| No Internet | 652 | 17.5% |
| Total | 3,718 | 100.0% |
Grinnell Summary
Grinnell, Iowa is a small city located in Poweshiek County in the state of Iowa. It is situated in the center of the state, approximately halfway between Des Moines and Iowa City. The city has a population of approximately 9,218 people, according to the 2010 census.
History
Grinnell was founded in 1854 by Josiah B. Grinnell, a Congregational minister from Vermont. He was inspired by the beauty of the area and the potential for a prosperous community. He purchased the land from the local Native American tribes and began to develop the town. The first settlers arrived in 1855 and the town was officially incorporated in 1857.
Grinnell quickly became a thriving community, with a variety of businesses and industries. The railroad arrived in 1867, connecting Grinnell to the rest of the state and the nation. This allowed for the growth of the town and the development of new industries.
In the late 19th century, Grinnell was home to a number of prominent citizens, including the first president of Grinnell College, George Magoun. The college was founded in 1846 and is still in operation today.
Geography
Grinnell is located in the center of Iowa, approximately halfway between Des Moines and Iowa City. The city is situated on the banks of the Iowa River, which flows through the city. The city is surrounded by rolling hills and farmland, with the Des Moines River to the east and the Cedar River to the west.
The city has a total area of 5.3 square miles, all of which is land. The average elevation is 890 feet above sea level.
Economy
Grinnell has a diverse economy, with a variety of businesses and industries. The city is home to Grinnell College, which is a major employer in the area. Other major employers include Grinnell Regional Medical Center, Grinnell Mutual Reinsurance Company, and the Grinnell Corporation.
The city also has a number of small businesses, including restaurants, retail stores, and professional services. The city is also home to a number of manufacturing companies, including Grinnell Manufacturing, which produces a variety of products, including fire protection systems and industrial valves.
Demographics
As of the 2010 census, Grinnell had a population of 9,218 people. The racial makeup of the city was 90.2% White, 4.2% African American, 0.4% Native American, 1.7% Asian, 0.1% Pacific Islander, 1.3% from other races, and 2.1% from two or more races. Hispanic or Latino of any race were 3.3% of the population.
The median income for a household in Grinnell was $41,945, and the median income for a family was $54,945. The per capita income for the city was $22,945. About 8.2% of families and 11.7% of the population were below the poverty line, including 15.2% of those under age 18 and 6.2% of those age 65 or over.
Common Questions
What is Per Capita Income in Grinnell?
Per Capita income in Grinnell is $36,917.
What is the Median Family Income in Grinnell?
Median Family Income in Grinnell is $100,985.
What is the Median Household income in Grinnell?
Median Household Income in Grinnell is $57,813.
What is Income or Wage Gap in Grinnell?
Income or Wage Gap in Grinnell is 55.5%.
Women in Grinnell earn 44.5 cents for every dollar earned by a man.
What is Inequality or Gini Index in Grinnell?
Inequality or Gini Index in Grinnell is 0.52.
What is the Total Population of Grinnell?
Total Population of Grinnell is 9,511.
What is the Total Male Population of Grinnell?
Total Male Population of Grinnell is 4,352.
What is the Total Female Population of Grinnell?
Total Female Population of Grinnell is 5,159.
What is the Ratio of Males per 100 Females in Grinnell?
There are 84.36 Males per 100 Females in Grinnell.
What is the Ratio of Females per 100 Males in Grinnell?
There are 118.54 Females per 100 Males in Grinnell.
What is the Median Population Age in Grinnell?
Median Population Age in Grinnell is 39.1 Years.
What is the Average Family Size in Grinnell
Average Family Size in Grinnell is 3.1 People.
What is the Average Household Size in Grinnell
Average Household Size in Grinnell is 2.1 People.
How Large is the Labor Force in Grinnell?
There are 4,756 People in the Labor Forcein in Grinnell.
What is the Percentage of People in the Labor Force in Grinnell?
59.2% of People are in the Labor Force in Grinnell.
What is the Unemployment Rate in Grinnell?
Unemployment Rate in Grinnell is 4.0%.