Zip Codes with the Highest Percentage of Households with Income Above $200,000 in Davenport, IA
RELATED REPORTS & OPTIONS
Household Income | $200k+
Davenport
Compare Zip Codes
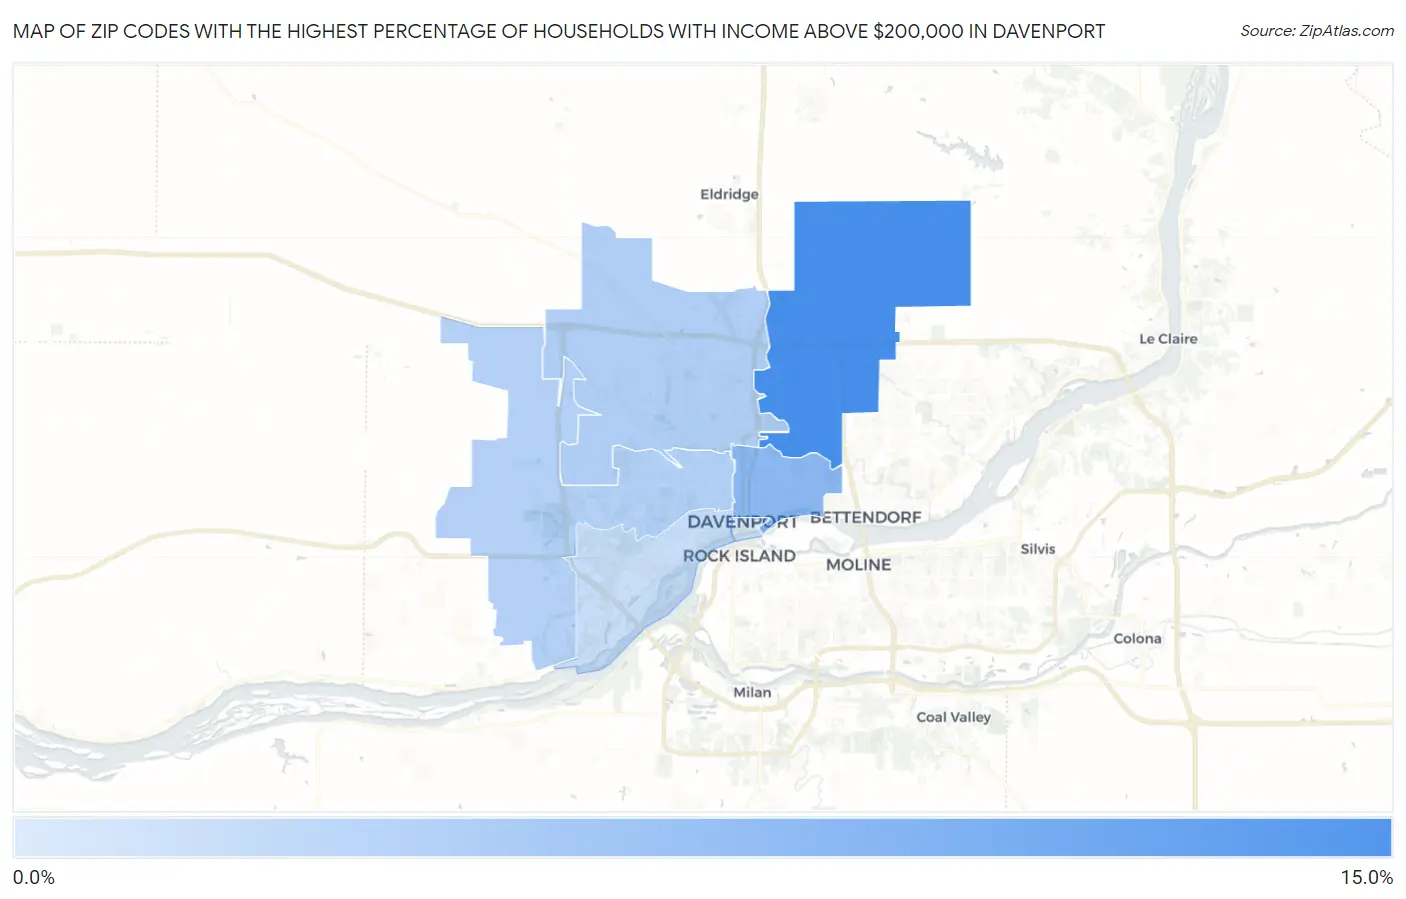
Map of Zip Codes with the Highest Percentage of Households with Income Above $200,000 in Davenport
1.1%
10.7%
Zip Codes with the Highest Percentage of Households with Income Above $200,000 in Davenport, IA
| Zip Code | Households with Income > $200k | vs State | vs National | |
| 1. | 52807 | 10.7% | 7.1%(+3.60)#131 | 11.4%(-0.700)#7,632 |
| 2. | 52803 | 6.2% | 7.1%(-0.900)#318 | 11.4%(-5.20)#13,092 |
| 3. | 52806 | 4.0% | 7.1%(-3.10)#496 | 11.4%(-7.40)#18,100 |
| 4. | 52804 | 3.6% | 7.1%(-3.50)#535 | 11.4%(-7.80)#19,161 |
| 5. | 52802 | 2.4% | 7.1%(-4.70)#669 | 11.4%(-9.00)#22,671 |
| 6. | 52801 | 1.1% | 7.1%(-6.00)#759 | 11.4%(-10.3)#26,067 |
1
Common Questions
What are the Top 5 Zip Codes with the Highest Percentage of Households with Income Above $200,000 in Davenport, IA?
Top 5 Zip Codes with the Highest Percentage of Households with Income Above $200,000 in Davenport, IA are:
What zip code has the Highest Percentage of Households with Income Above $200,000 in Davenport, IA?
52807 has the Highest Percentage of Households with Income Above $200,000 in Davenport, IA with 10.7%.
What is the Percentage of Households with Income Above $200,000 in Davenport, IA?
Percentage of Households with Income Above $200,000 in Davenport is 5.2%.
What is the Percentage of Households with Income Above $200,000 in Iowa?
Percentage of Households with Income Above $200,000 in Iowa is 7.1%.
What is the Percentage of Households with Income Above $200,000 in the United States?
Percentage of Households with Income Above $200,000 in the United States is 11.4%.