Solon, IA Map & Demographics
Solon Map
Solon Overview
$41,158
PER CAPITA INCOME
$137,546
AVG FAMILY INCOME
$114,936
AVG HOUSEHOLD INCOME
51.4%
WAGE / INCOME GAP [ % ]
48.6¢/ $1
WAGE / INCOME GAP [ $ ]
0.33
INEQUALITY / GINI INDEX
3,020
TOTAL POPULATION
1,261
MALE POPULATION
1,759
FEMALE POPULATION
71.69
MALES / 100 FEMALES
139.49
FEMALES / 100 MALES
36.8
MEDIAN AGE
3.4
AVG FAMILY SIZE
2.8
AVG HOUSEHOLD SIZE
1,693
LABOR FORCE [ PEOPLE ]
74.0%
PERCENT IN LABOR FORCE
1.2%
UNEMPLOYMENT RATE
Solon Zip Codes
Solon Area Codes
Income in Solon
Income Overview in Solon
Per Capita Income in Solon is $41,158, while median incomes of families and households are $137,546 and $114,936 respectively.
| Characteristic | Number | Measure |
| Per Capita Income | 3,020 | $41,158 |
| Median Family Income | 731 | $137,546 |
| Mean Family Income | 731 | $132,487 |
| Median Household Income | 1,034 | $114,936 |
| Mean Household Income | 1,034 | $116,352 |
| Income Deficit | 731 | $0 |
| Wage / Income Gap (%) | 3,020 | 51.35% |
| Wage / Income Gap ($) | 3,020 | 48.65¢ per $1 |
| Gini / Inequality Index | 3,020 | 0.33 |
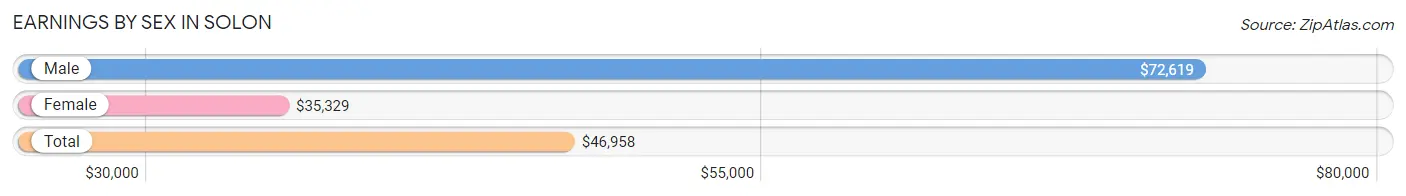
Earnings by Sex in Solon
Average Earnings in Solon are $46,958, $72,619 for men and $35,329 for women, a difference of 51.3%.
| Sex | Number | Average Earnings |
| Male | 768 (42.8%) | $72,619 |
| Female | 1,025 (57.2%) | $35,329 |
| Total | 1,793 (100.0%) | $46,958 |
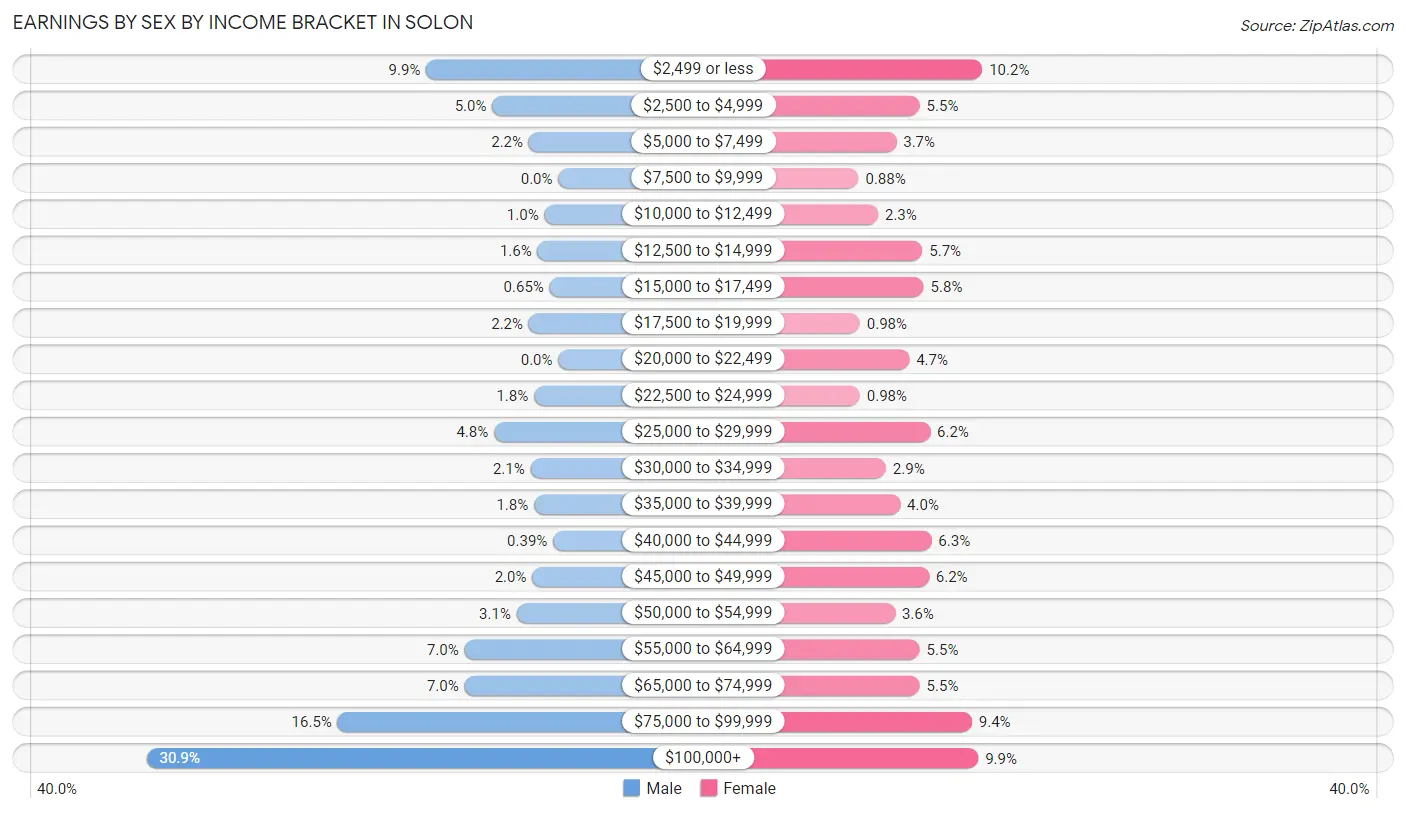
Earnings by Sex by Income Bracket in Solon
The most common earnings brackets in Solon are $100,000+ for men (237 | 30.9%) and $2,499 or less for women (104 | 10.2%).
| Income | Male | Female |
| $2,499 or less | 76 (9.9%) | 104 (10.2%) |
| $2,500 to $4,999 | 38 (5.0%) | 56 (5.5%) |
| $5,000 to $7,499 | 17 (2.2%) | 38 (3.7%) |
| $7,500 to $9,999 | 0 (0.0%) | 9 (0.9%) |
| $10,000 to $12,499 | 8 (1.0%) | 24 (2.3%) |
| $12,500 to $14,999 | 12 (1.6%) | 58 (5.7%) |
| $15,000 to $17,499 | 5 (0.6%) | 59 (5.8%) |
| $17,500 to $19,999 | 17 (2.2%) | 10 (1.0%) |
| $20,000 to $22,499 | 0 (0.0%) | 48 (4.7%) |
| $22,500 to $24,999 | 14 (1.8%) | 10 (1.0%) |
| $25,000 to $29,999 | 37 (4.8%) | 64 (6.2%) |
| $30,000 to $34,999 | 16 (2.1%) | 30 (2.9%) |
| $35,000 to $39,999 | 14 (1.8%) | 41 (4.0%) |
| $40,000 to $44,999 | 3 (0.4%) | 65 (6.3%) |
| $45,000 to $49,999 | 15 (1.9%) | 63 (6.1%) |
| $50,000 to $54,999 | 24 (3.1%) | 37 (3.6%) |
| $55,000 to $64,999 | 54 (7.0%) | 56 (5.5%) |
| $65,000 to $74,999 | 54 (7.0%) | 56 (5.5%) |
| $75,000 to $99,999 | 127 (16.5%) | 96 (9.4%) |
| $100,000+ | 237 (30.9%) | 101 (9.9%) |
| Total | 768 (100.0%) | 1,025 (100.0%) |
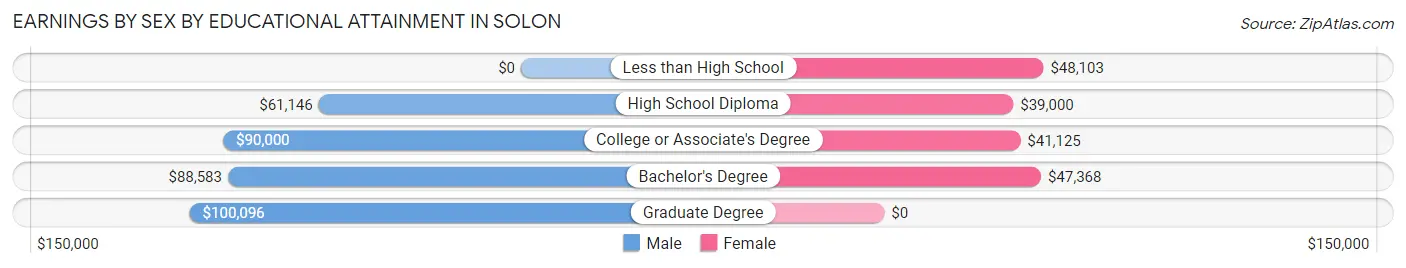
Earnings by Sex by Educational Attainment in Solon
Average earnings in Solon are $87,697 for men and $43,875 for women, a difference of 50.0%. Men with an educational attainment of graduate degree enjoy the highest average annual earnings of $100,096, while those with high school diploma education earn the least with $61,146. Women with an educational attainment of less than high school earn the most with the average annual earnings of $48,103, while those with high school diploma education have the smallest earnings of $39,000.
| Educational Attainment | Male Income | Female Income |
| Less than High School | - | - |
| High School Diploma | $61,146 | $39,000 |
| College or Associate's Degree | $90,000 | $41,125 |
| Bachelor's Degree | $88,583 | $47,368 |
| Graduate Degree | $100,096 | $0 |
| Total | $87,697 | $43,875 |
Family Income in Solon
Family Income Brackets in Solon
According to the Solon family income data, there are 275 families falling into the $100,000 to $149,999 income range, which is the most common income bracket and makes up 37.6% of all families.
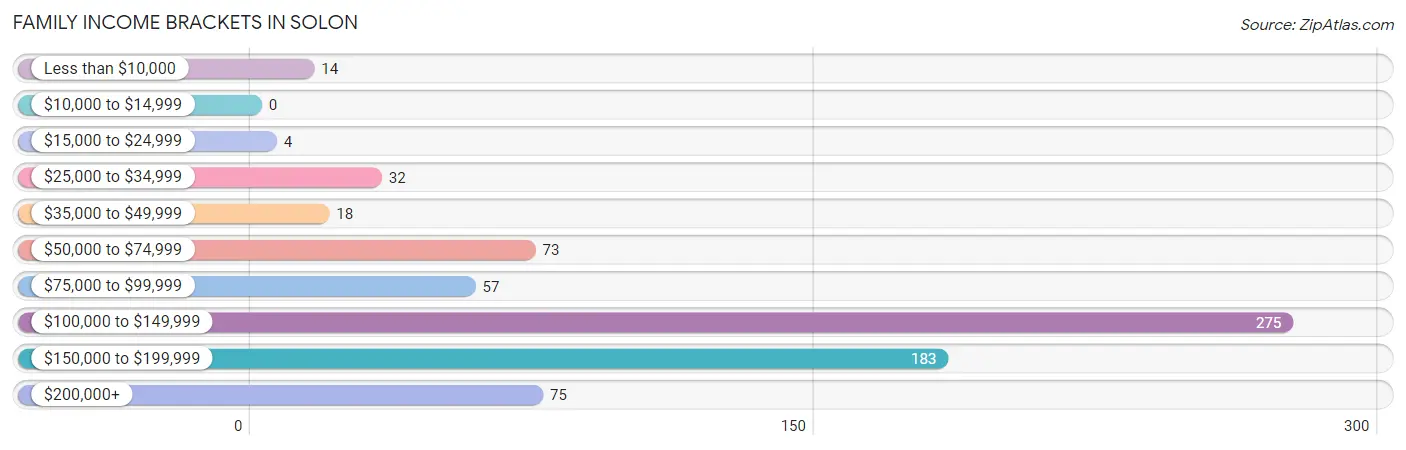
| Income Bracket | # Families | % Families |
| Less than $10,000 | 14 | 1.9% |
| $10,000 to $14,999 | 0 | 0.0% |
| $15,000 to $24,999 | 4 | 0.5% |
| $25,000 to $34,999 | 32 | 4.4% |
| $35,000 to $49,999 | 18 | 2.5% |
| $50,000 to $74,999 | 73 | 10.0% |
| $75,000 to $99,999 | 57 | 7.8% |
| $100,000 to $149,999 | 275 | 37.6% |
| $150,000 to $199,999 | 183 | 25.0% |
| $200,000+ | 75 | 10.3% |
Family Income by Famaliy Size in Solon
4-person families (185 | 25.3%) account for the highest median family income in Solon with $160,938 per family, while 2-person families (259 | 35.4%) have the highest median income of $60,208 per family member.
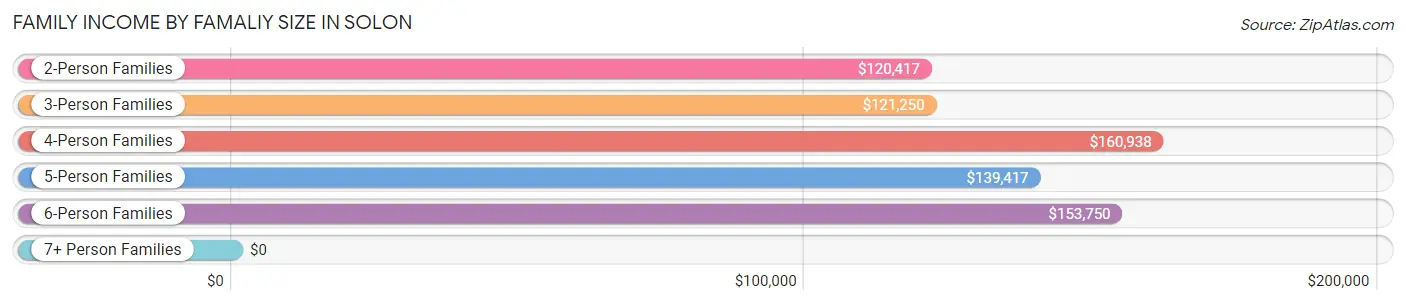
| Income Bracket | # Families | Median Income |
| 2-Person Families | 259 (35.4%) | $120,417 |
| 3-Person Families | 189 (25.9%) | $121,250 |
| 4-Person Families | 185 (25.3%) | $160,938 |
| 5-Person Families | 63 (8.6%) | $139,417 |
| 6-Person Families | 24 (3.3%) | $153,750 |
| 7+ Person Families | 11 (1.5%) | $0 |
| Total | 731 (100.0%) | $137,546 |
Family Income by Number of Earners in Solon
The median family income in Solon is $137,546, with families comprising 2 earners (383) having the highest median family income of $144,688, while families with 1 earner (138) have the lowest median family income of $78,750, accounting for 52.4% and 18.9% of families, respectively.
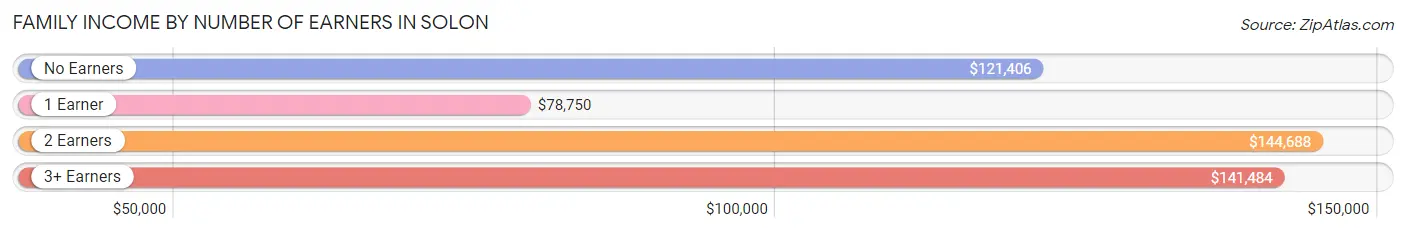
| Number of Earners | # Families | Median Income |
| No Earners | 31 (4.2%) | $121,406 |
| 1 Earner | 138 (18.9%) | $78,750 |
| 2 Earners | 383 (52.4%) | $144,688 |
| 3+ Earners | 179 (24.5%) | $141,484 |
| Total | 731 (100.0%) | $137,546 |
Household Income in Solon
Household Income Brackets in Solon
With 282 households falling in the category, the $100,000 to $149,999 income range is the most frequent in Solon, accounting for 27.3% of all households. In contrast, only 17 households (1.6%) fall into the $10,000 to $14,999 income bracket, making it the least populous group.
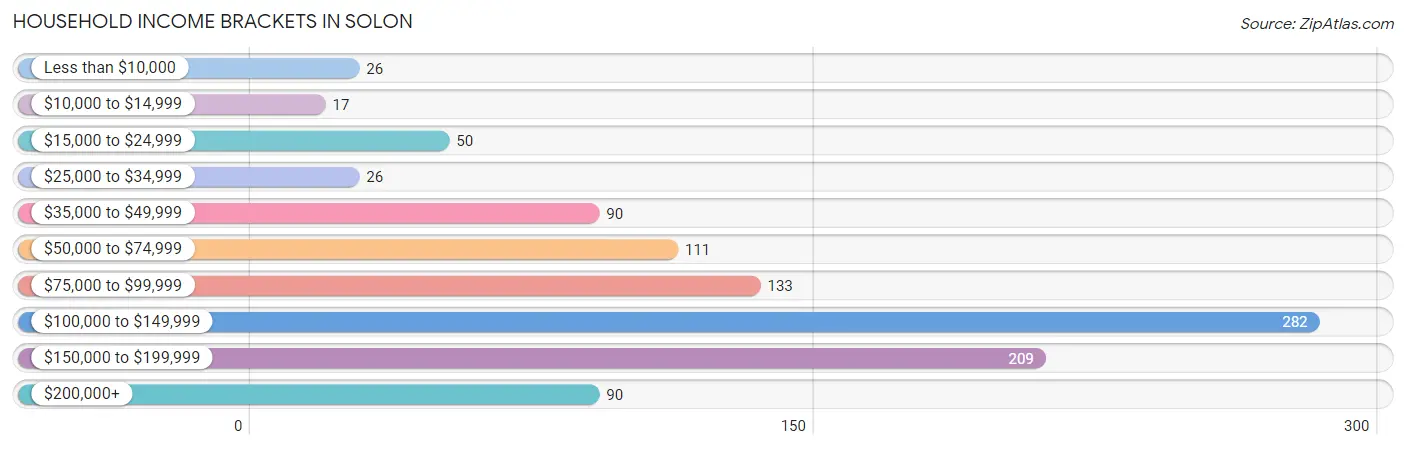
| Income Bracket | # Households | % Households |
| Less than $10,000 | 26 | 2.5% |
| $10,000 to $14,999 | 17 | 1.6% |
| $15,000 to $24,999 | 50 | 4.8% |
| $25,000 to $34,999 | 26 | 2.5% |
| $35,000 to $49,999 | 90 | 8.7% |
| $50,000 to $74,999 | 111 | 10.7% |
| $75,000 to $99,999 | 133 | 12.9% |
| $100,000 to $149,999 | 282 | 27.3% |
| $150,000 to $199,999 | 209 | 20.2% |
| $200,000+ | 90 | 8.7% |
Household Income by Householder Age in Solon
The median household income in Solon is $114,936, with the highest median household income of $142,344 found in the 45 to 64 years age bracket for the primary householder. A total of 370 households (35.8%) fall into this category. Meanwhile, the 15 to 24 years age bracket for the primary householder has the lowest median household income of $0, with 42 households (4.1%) in this group.
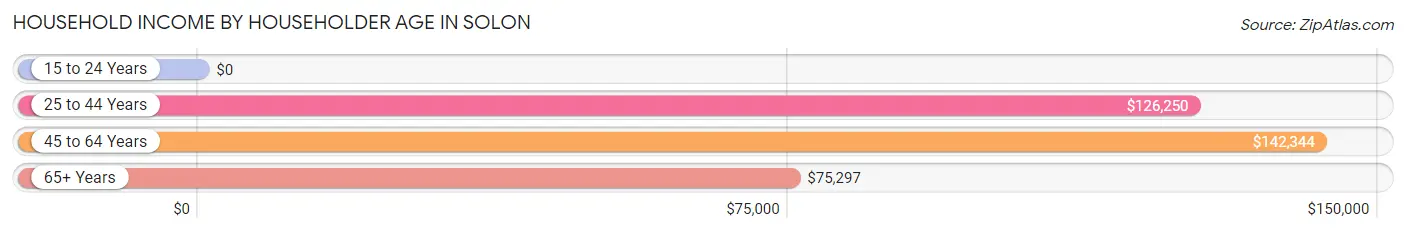
| Income Bracket | # Households | Median Income |
| 15 to 24 Years | 42 (4.1%) | $0 |
| 25 to 44 Years | 338 (32.7%) | $126,250 |
| 45 to 64 Years | 370 (35.8%) | $142,344 |
| 65+ Years | 284 (27.5%) | $75,297 |
| Total | 1,034 (100.0%) | $114,936 |
Poverty in Solon
Income Below Poverty by Sex and Age in Solon
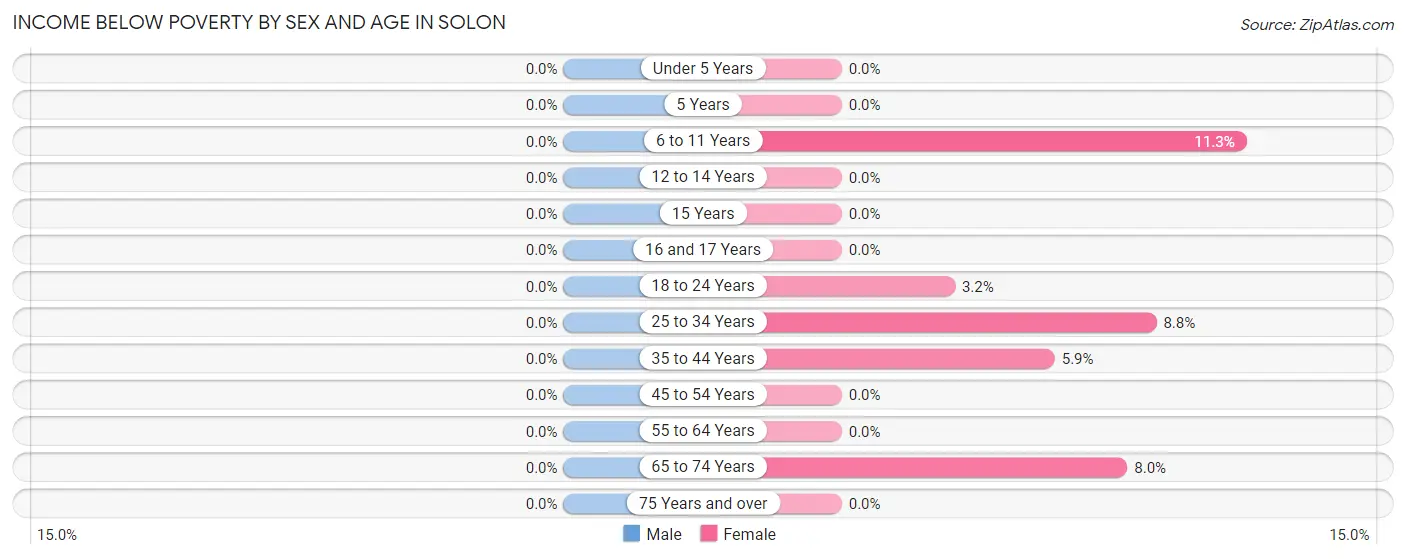
| Age Bracket | Male | Female |
| Under 5 Years | 0 (0.0%) | 0 (0.0%) |
| 5 Years | 0 (0.0%) | 0 (0.0%) |
| 6 to 11 Years | 0 (0.0%) | 16 (11.3%) |
| 12 to 14 Years | 0 (0.0%) | 0 (0.0%) |
| 15 Years | 0 (0.0%) | 0 (0.0%) |
| 16 and 17 Years | 0 (0.0%) | 0 (0.0%) |
| 18 to 24 Years | 0 (0.0%) | 4 (3.2%) |
| 25 to 34 Years | 0 (0.0%) | 12 (8.8%) |
| 35 to 44 Years | 0 (0.0%) | 14 (5.9%) |
| 45 to 54 Years | 0 (0.0%) | 0 (0.0%) |
| 55 to 64 Years | 0 (0.0%) | 0 (0.0%) |
| 65 to 74 Years | 0 (0.0%) | 12 (8.0%) |
| 75 Years and over | 0 (0.0%) | 0 (0.0%) |
| Total | 0 (0.0%) | 58 (3.4%) |
Income Above Poverty by Sex and Age in Solon
According to the poverty statistics in Solon, males aged under 5 years and females aged under 5 years are the age groups that are most secure financially, with 100.0% of males and 100.0% of females in these age groups living above the poverty line.
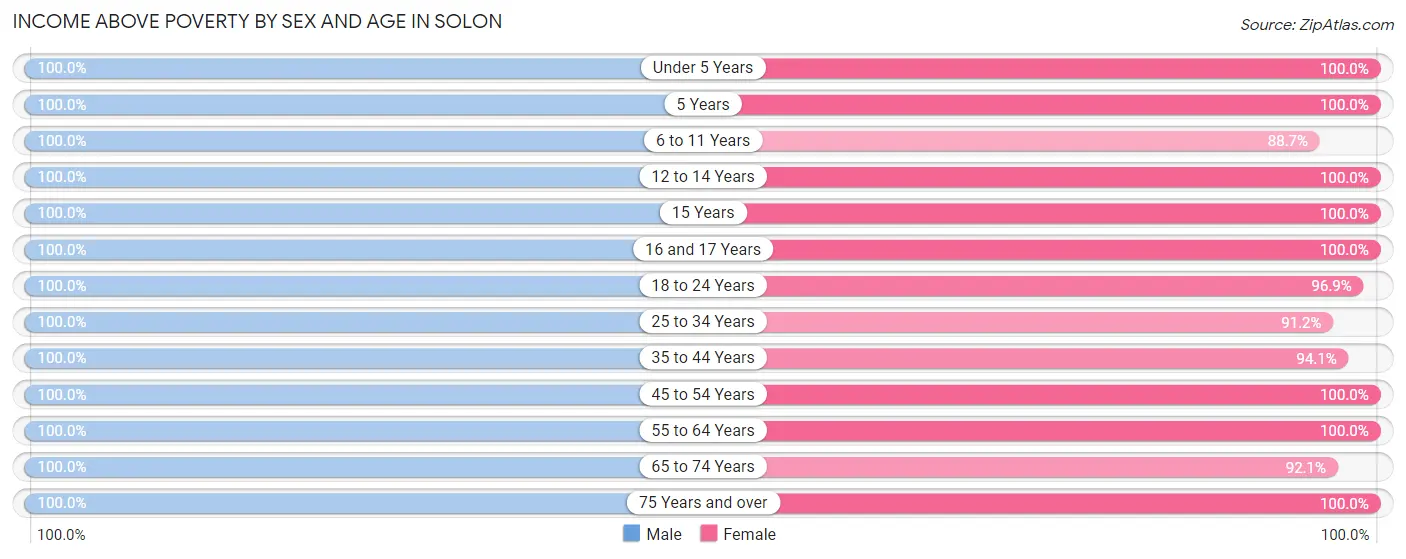
| Age Bracket | Male | Female |
| Under 5 Years | 62 (100.0%) | 80 (100.0%) |
| 5 Years | 16 (100.0%) | 11 (100.0%) |
| 6 to 11 Years | 112 (100.0%) | 126 (88.7%) |
| 12 to 14 Years | 77 (100.0%) | 150 (100.0%) |
| 15 Years | 39 (100.0%) | 43 (100.0%) |
| 16 and 17 Years | 81 (100.0%) | 117 (100.0%) |
| 18 to 24 Years | 183 (100.0%) | 123 (96.9%) |
| 25 to 34 Years | 67 (100.0%) | 125 (91.2%) |
| 35 to 44 Years | 200 (100.0%) | 222 (94.1%) |
| 45 to 54 Years | 148 (100.0%) | 237 (100.0%) |
| 55 to 64 Years | 135 (100.0%) | 160 (100.0%) |
| 65 to 74 Years | 60 (100.0%) | 139 (92.0%) |
| 75 Years and over | 40 (100.0%) | 125 (100.0%) |
| Total | 1,220 (100.0%) | 1,658 (96.6%) |
Income Below Poverty Among Married-Couple Families in Solon
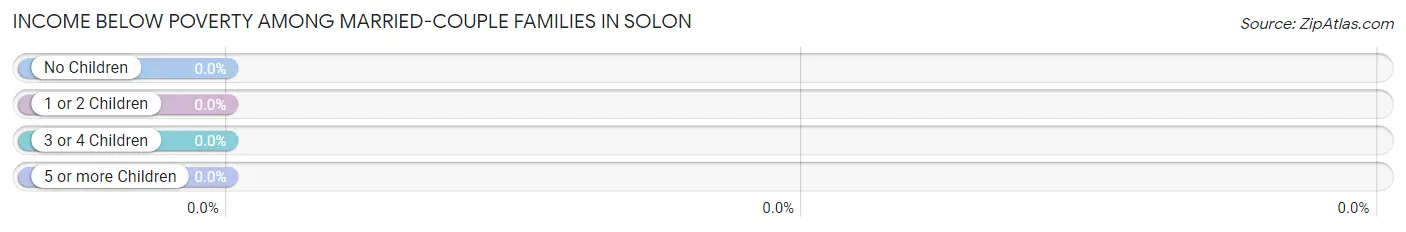
| Children | Above Poverty | Below Poverty |
| No Children | 275 (100.0%) | 0 (0.0%) |
| 1 or 2 Children | 210 (100.0%) | 0 (0.0%) |
| 3 or 4 Children | 55 (100.0%) | 0 (0.0%) |
| 5 or more Children | 11 (100.0%) | 0 (0.0%) |
| Total | 551 (100.0%) | 0 (0.0%) |
Income Below Poverty Among Single-Parent Households in Solon
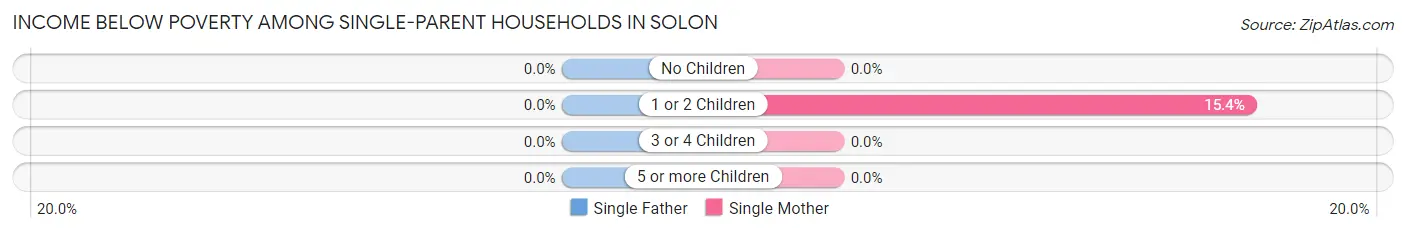
| Children | Single Father | Single Mother |
| No Children | 0 (0.0%) | 0 (0.0%) |
| 1 or 2 Children | 0 (0.0%) | 14 (15.4%) |
| 3 or 4 Children | 0 (0.0%) | 0 (0.0%) |
| 5 or more Children | 0 (0.0%) | 0 (0.0%) |
| Total | 0 (0.0%) | 14 (12.3%) |
Income Below Poverty Among Married-Couple vs Single-Parent Households in Solon
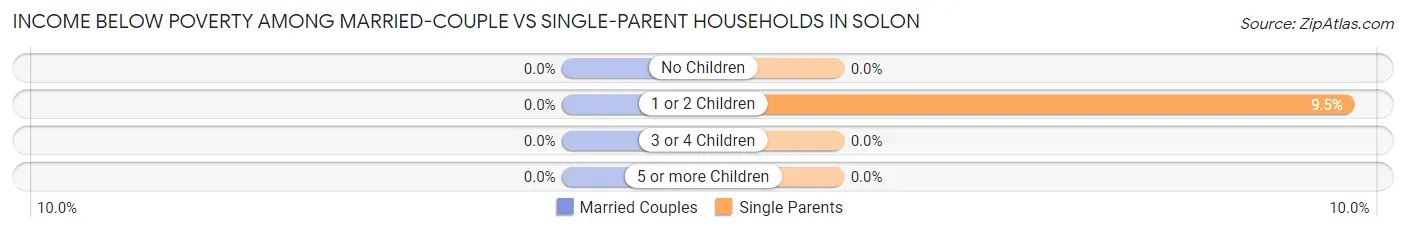
| Children | Married-Couple Families | Single-Parent Households |
| No Children | 0 (0.0%) | 0 (0.0%) |
| 1 or 2 Children | 0 (0.0%) | 14 (9.5%) |
| 3 or 4 Children | 0 (0.0%) | 0 (0.0%) |
| 5 or more Children | 0 (0.0%) | 0 (0.0%) |
| Total | 0 (0.0%) | 14 (7.8%) |
Race in Solon
The most populous races in Solon are White / Caucasian (2,909 | 96.3%), Two or more Races (83 | 2.8%), and Hispanic or Latino (32 | 1.1%).
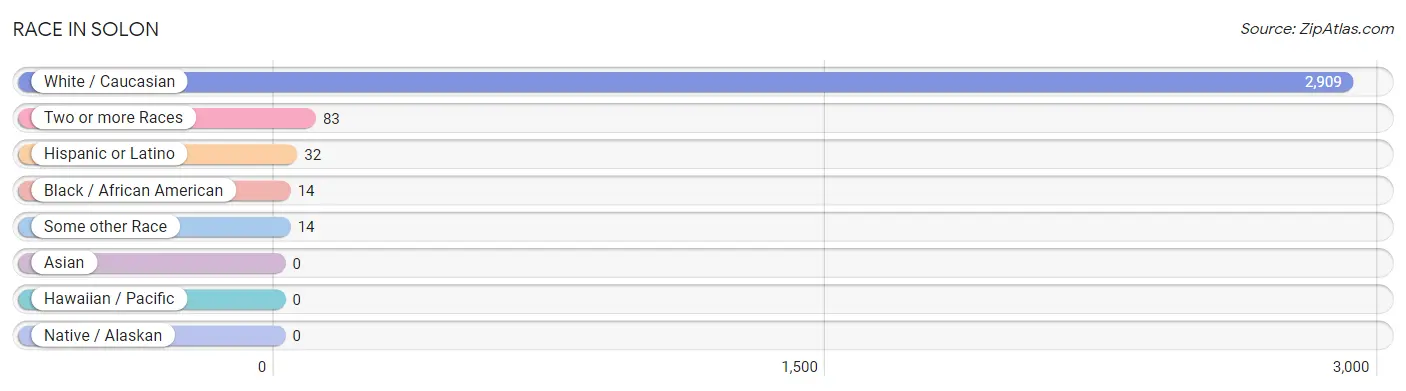
| Race | # Population | % Population |
| Asian | 0 | 0.0% |
| Black / African American | 14 | 0.5% |
| Hawaiian / Pacific | 0 | 0.0% |
| Hispanic or Latino | 32 | 1.1% |
| Native / Alaskan | 0 | 0.0% |
| White / Caucasian | 2,909 | 96.3% |
| Two or more Races | 83 | 2.8% |
| Some other Race | 14 | 0.5% |
| Total | 3,020 | 100.0% |
Ancestry in Solon
The most populous ancestries reported in Solon are German (1,412 | 46.8%), Irish (546 | 18.1%), English (350 | 11.6%), Czech (223 | 7.4%), and Norwegian (172 | 5.7%), together accounting for 89.5% of all Solon residents.
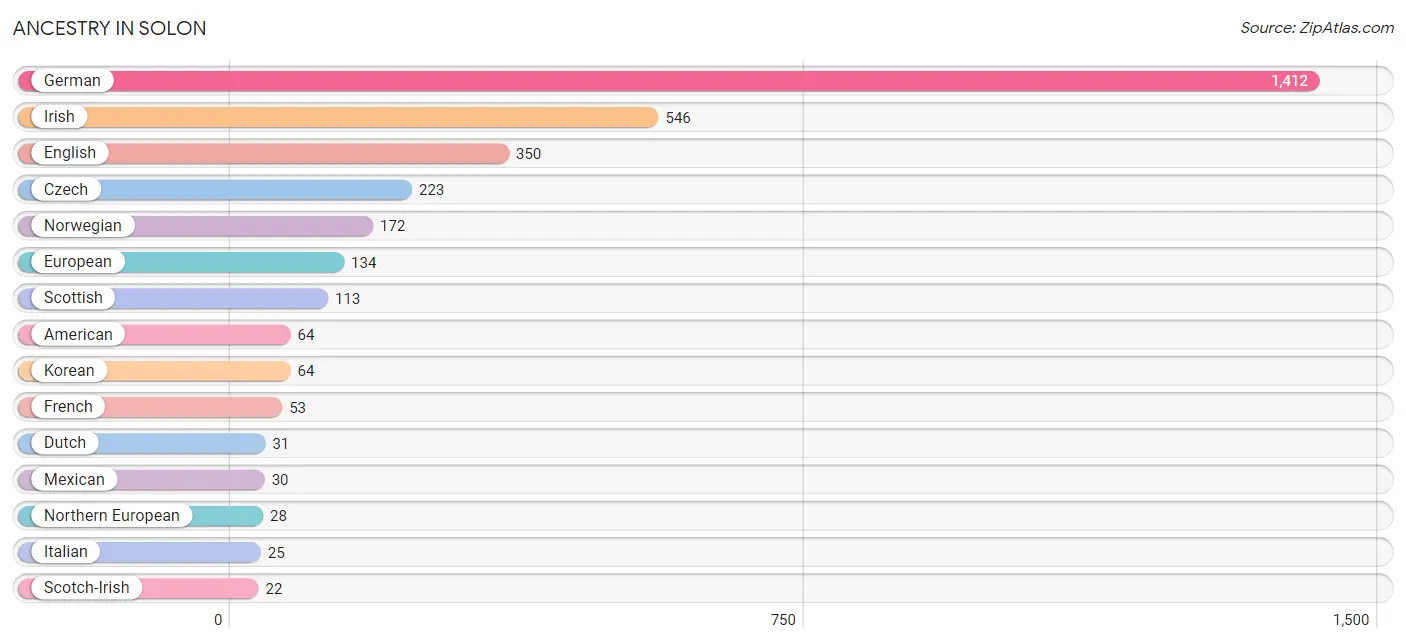
| Ancestry | # Population | % Population |
| American | 64 | 2.1% |
| Arab | 15 | 0.5% |
| Belgian | 4 | 0.1% |
| British | 4 | 0.1% |
| Croatian | 6 | 0.2% |
| Czech | 223 | 7.4% |
| Danish | 8 | 0.3% |
| Dutch | 31 | 1.0% |
| English | 350 | 11.6% |
| European | 134 | 4.4% |
| Finnish | 4 | 0.1% |
| French | 53 | 1.8% |
| German | 1,412 | 46.8% |
| Greek | 7 | 0.2% |
| Irish | 546 | 18.1% |
| Italian | 25 | 0.8% |
| Jordanian | 15 | 0.5% |
| Korean | 64 | 2.1% |
| Mexican | 30 | 1.0% |
| Northern European | 28 | 0.9% |
| Norwegian | 172 | 5.7% |
| Pennsylvania German | 4 | 0.1% |
| Peruvian | 2 | 0.1% |
| Russian | 15 | 0.5% |
| Scotch-Irish | 22 | 0.7% |
| Scottish | 113 | 3.7% |
| South American | 2 | 0.1% |
| Swedish | 21 | 0.7% |
| Swiss | 3 | 0.1% |
| Welsh | 10 | 0.3% | View All 30 Rows |
Immigrants in Solon
The most numerous immigrant groups reported in Solon came from Asia (7 | 0.2%), Kazakhstan (7 | 0.2%), South Central Asia (7 | 0.2%), Latin America (2 | 0.1%), and Peru (2 | 0.1%), together accounting for 0.8% of all Solon residents.
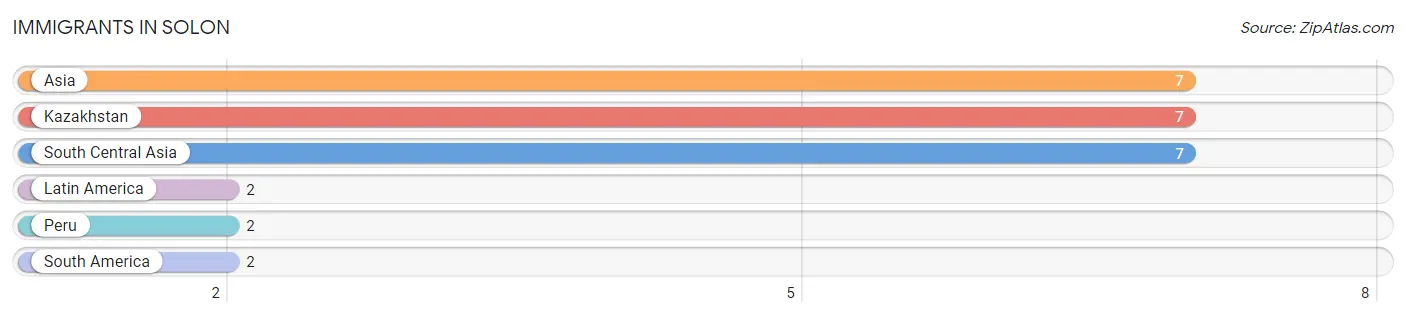
| Immigration Origin | # Population | % Population |
| Asia | 7 | 0.2% |
| Kazakhstan | 7 | 0.2% |
| Latin America | 2 | 0.1% |
| Peru | 2 | 0.1% |
| South America | 2 | 0.1% |
| South Central Asia | 7 | 0.2% | View All 6 Rows |
Sex and Age in Solon
Sex and Age in Solon
The most populous age groups in Solon are 15 to 19 Years (183 | 14.5%) for men and 10 to 14 Years (227 | 12.9%) for women.
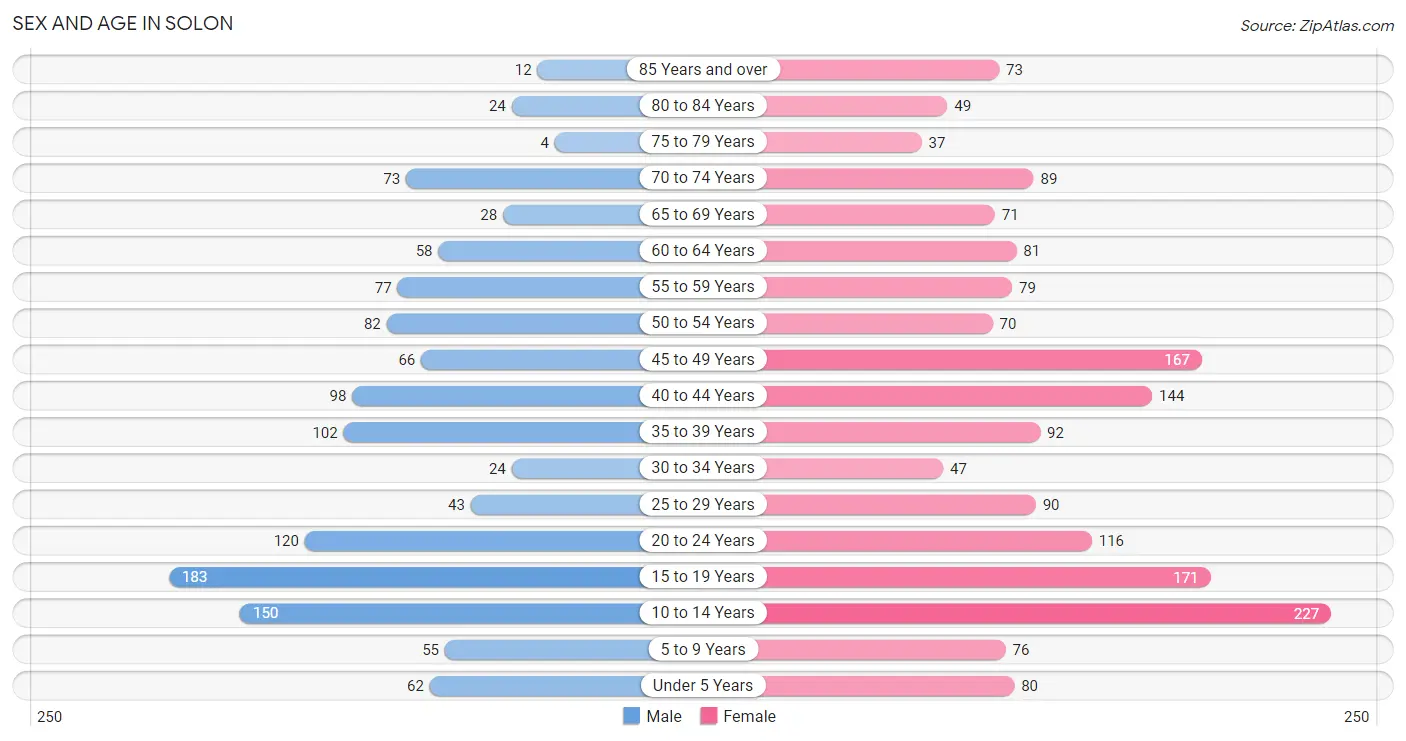
| Age Bracket | Male | Female |
| Under 5 Years | 62 (4.9%) | 80 (4.5%) |
| 5 to 9 Years | 55 (4.4%) | 76 (4.3%) |
| 10 to 14 Years | 150 (11.9%) | 227 (12.9%) |
| 15 to 19 Years | 183 (14.5%) | 171 (9.7%) |
| 20 to 24 Years | 120 (9.5%) | 116 (6.6%) |
| 25 to 29 Years | 43 (3.4%) | 90 (5.1%) |
| 30 to 34 Years | 24 (1.9%) | 47 (2.7%) |
| 35 to 39 Years | 102 (8.1%) | 92 (5.2%) |
| 40 to 44 Years | 98 (7.8%) | 144 (8.2%) |
| 45 to 49 Years | 66 (5.2%) | 167 (9.5%) |
| 50 to 54 Years | 82 (6.5%) | 70 (4.0%) |
| 55 to 59 Years | 77 (6.1%) | 79 (4.5%) |
| 60 to 64 Years | 58 (4.6%) | 81 (4.6%) |
| 65 to 69 Years | 28 (2.2%) | 71 (4.0%) |
| 70 to 74 Years | 73 (5.8%) | 89 (5.1%) |
| 75 to 79 Years | 4 (0.3%) | 37 (2.1%) |
| 80 to 84 Years | 24 (1.9%) | 49 (2.8%) |
| 85 Years and over | 12 (0.9%) | 73 (4.2%) |
| Total | 1,261 (100.0%) | 1,759 (100.0%) |
Families and Households in Solon
Median Family Size in Solon
The median family size in Solon is 3.41 persons per family, with married-couple families (551 | 75.4%) accounting for the largest median family size of 3.53 persons per family. On the other hand, single female/mother families (114 | 15.6%) represent the smallest median family size with 2.87 persons per family.
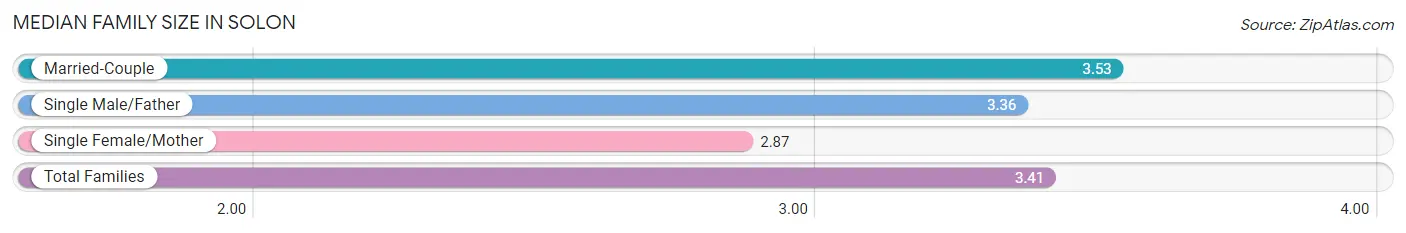
| Family Type | # Families | Family Size |
| Married-Couple | 551 (75.4%) | 3.53 |
| Single Male/Father | 66 (9.0%) | 3.36 |
| Single Female/Mother | 114 (15.6%) | 2.87 |
| Total Families | 731 (100.0%) | 3.41 |
Median Household Size in Solon
The median household size in Solon is 2.84 persons per household, with single male/father households (66 | 6.4%) accounting for the largest median household size of 4.76 persons per household. non-family households (303 | 29.3%) represent the smallest median household size with 1.10 persons per household.
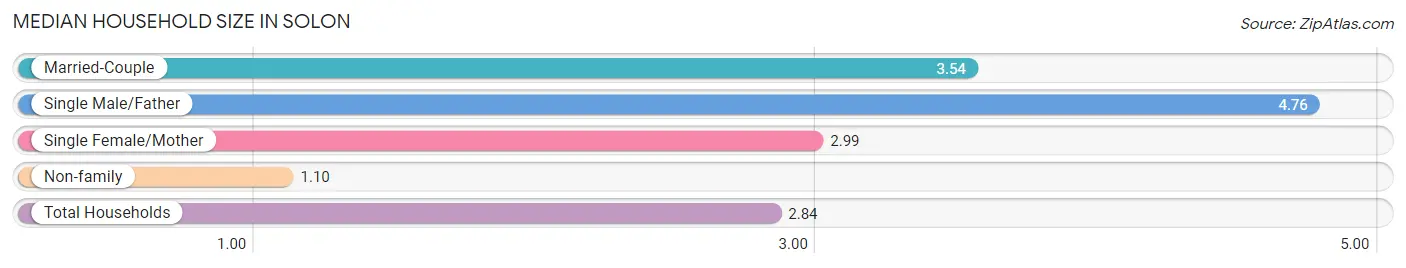
| Household Type | # Households | Household Size |
| Married-Couple | 551 (53.3%) | 3.54 |
| Single Male/Father | 66 (6.4%) | 4.76 |
| Single Female/Mother | 114 (11.0%) | 2.99 |
| Non-family | 303 (29.3%) | 1.10 |
| Total Households | 1,034 (100.0%) | 2.84 |
Household Size by Marriage Status in Solon
Out of a total of 1,034 households in Solon, 731 (70.7%) are family households, while 303 (29.3%) are nonfamily households. The most numerous type of family households are 2-person households, comprising 227, and the most common type of nonfamily households are 1-person households, comprising 281.
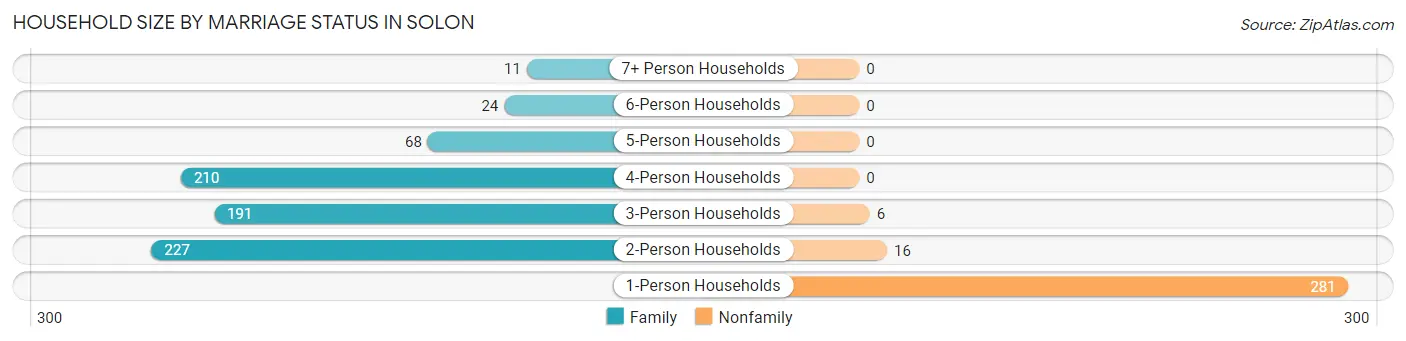
| Household Size | Family Households | Nonfamily Households |
| 1-Person Households | - | 281 (27.2%) |
| 2-Person Households | 227 (22.0%) | 16 (1.5%) |
| 3-Person Households | 191 (18.5%) | 6 (0.6%) |
| 4-Person Households | 210 (20.3%) | 0 (0.0%) |
| 5-Person Households | 68 (6.6%) | 0 (0.0%) |
| 6-Person Households | 24 (2.3%) | 0 (0.0%) |
| 7+ Person Households | 11 (1.1%) | 0 (0.0%) |
| Total | 731 (70.7%) | 303 (29.3%) |
Female Fertility in Solon
Fertility by Age in Solon
Average fertility rate in Solon is 17.0 births per 1,000 women. Women in the age bracket of 20 to 34 years have the highest fertility rate with 47.0 births per 1,000 women. Women in the age bracket of 20 to 34 years acount for 80.0% of all women with births.
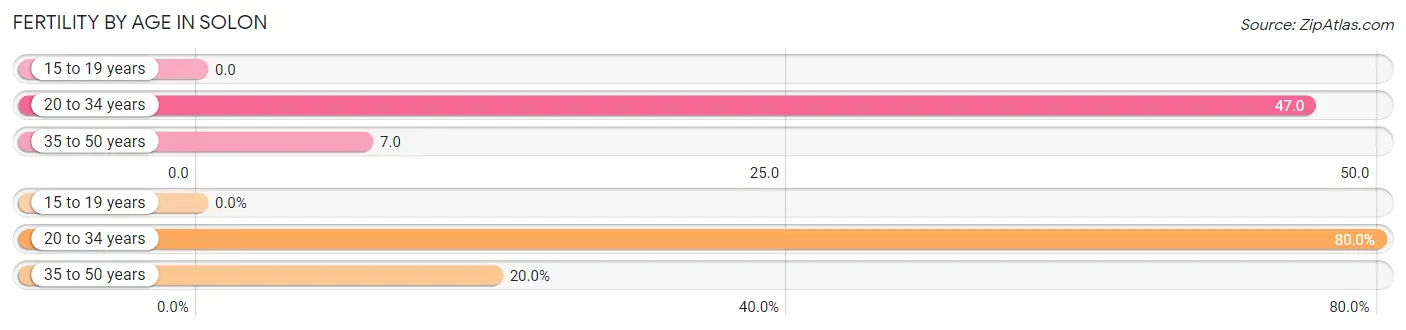
| Age Bracket | Women with Births | Births / 1,000 Women |
| 15 to 19 years | 0 (0.0%) | 0.0 |
| 20 to 34 years | 12 (80.0%) | 47.0 |
| 35 to 50 years | 3 (20.0%) | 7.0 |
| Total | 15 (100.0%) | 17.0 |
Fertility by Age by Marriage Status in Solon
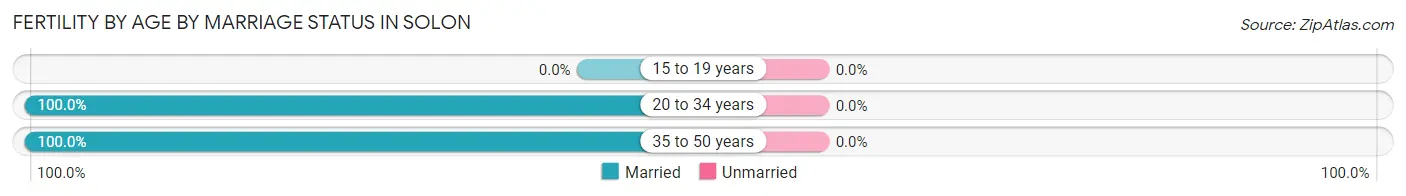
| Age Bracket | Married | Unmarried |
| 15 to 19 years | 0 (0.0%) | 0 (0.0%) |
| 20 to 34 years | 12 (100.0%) | 0 (0.0%) |
| 35 to 50 years | 3 (100.0%) | 0 (0.0%) |
| Total | 15 (100.0%) | 0 (0.0%) |
Fertility by Education in Solon
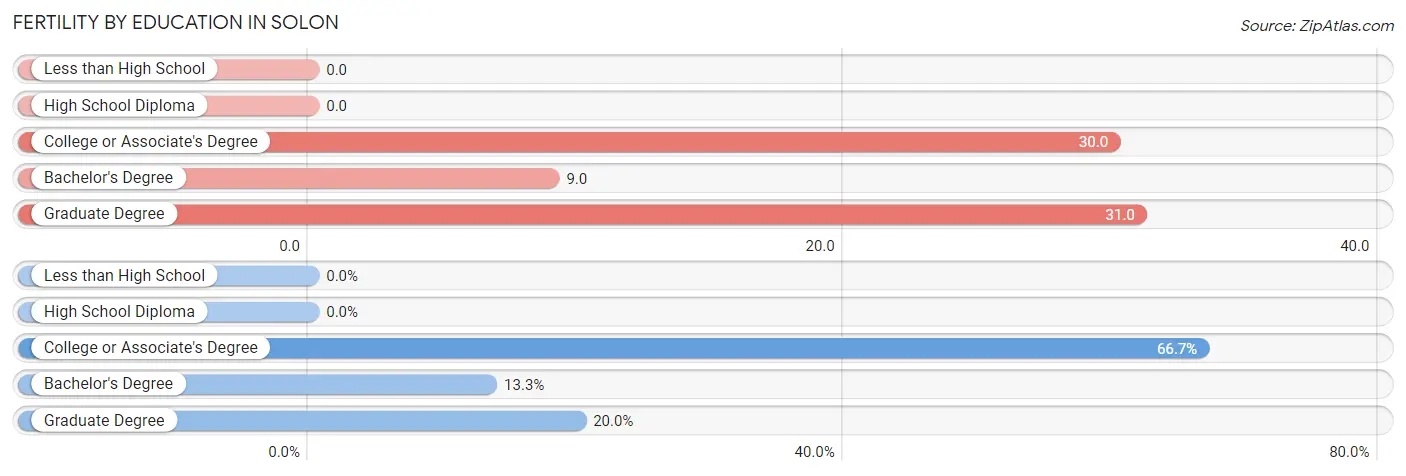
| Educational Attainment | Women with Births | Births / 1,000 Women |
| Less than High School | 0 (0.0%) | 0.0 |
| High School Diploma | 0 (0.0%) | 0.0 |
| College or Associate's Degree | 10 (66.7%) | 30.0 |
| Bachelor's Degree | 2 (13.3%) | 9.0 |
| Graduate Degree | 3 (20.0%) | 31.0 |
| Total | 15 (100.0%) | 17.0 |
Fertility by Education by Marriage Status in Solon
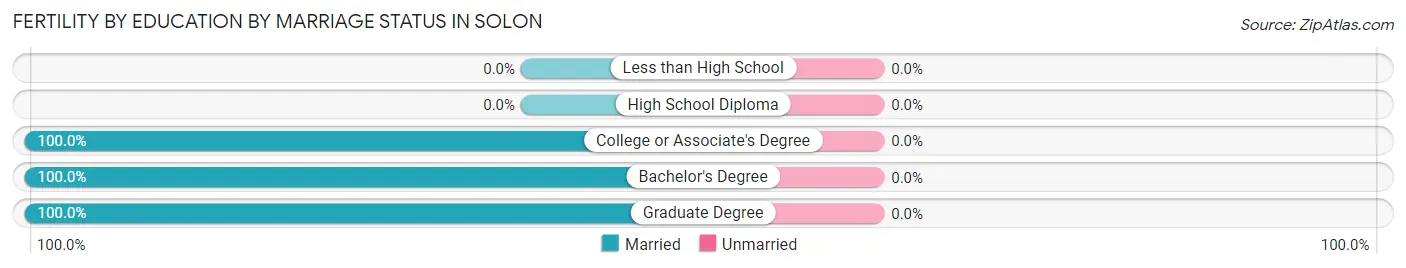
| Educational Attainment | Married | Unmarried |
| Less than High School | 0 (0.0%) | 0 (0.0%) |
| High School Diploma | 0 (0.0%) | 0 (0.0%) |
| College or Associate's Degree | 10 (100.0%) | 0 (0.0%) |
| Bachelor's Degree | 2 (100.0%) | 0 (0.0%) |
| Graduate Degree | 3 (100.0%) | 0 (0.0%) |
| Total | 15 (100.0%) | 0 (0.0%) |
Employment Characteristics in Solon
Employment by Class of Employer in Solon
Among the 1,624 employed individuals in Solon, private company employees (964 | 59.4%), not-for-profit organizations (178 | 11.0%), and state government employees (147 | 9.0%) make up the most common classes of employment.
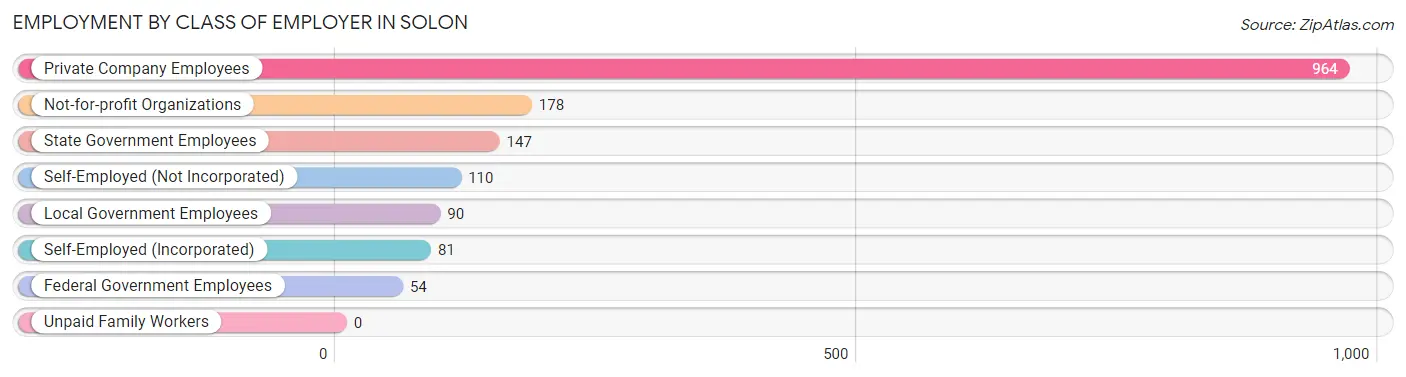
| Employer Class | # Employees | % Employees |
| Private Company Employees | 964 | 59.4% |
| Self-Employed (Incorporated) | 81 | 5.0% |
| Self-Employed (Not Incorporated) | 110 | 6.8% |
| Not-for-profit Organizations | 178 | 11.0% |
| Local Government Employees | 90 | 5.5% |
| State Government Employees | 147 | 9.0% |
| Federal Government Employees | 54 | 3.3% |
| Unpaid Family Workers | 0 | 0.0% |
| Total | 1,624 | 100.0% |
Employment Status by Age in Solon
According to the labor force statistics for Solon, out of the total population over 16 years of age (2,288), 74.0% or 1,693 individuals are in the labor force, with 1.2% or 20 of them unemployed. The age group with the highest labor force participation rate is 35 to 44 years, with 98.2% or 428 individuals in the labor force. Within the labor force, the 20 to 24 years age range has the highest percentage of unemployed individuals, with 10.4% or 20 of them being unemployed.
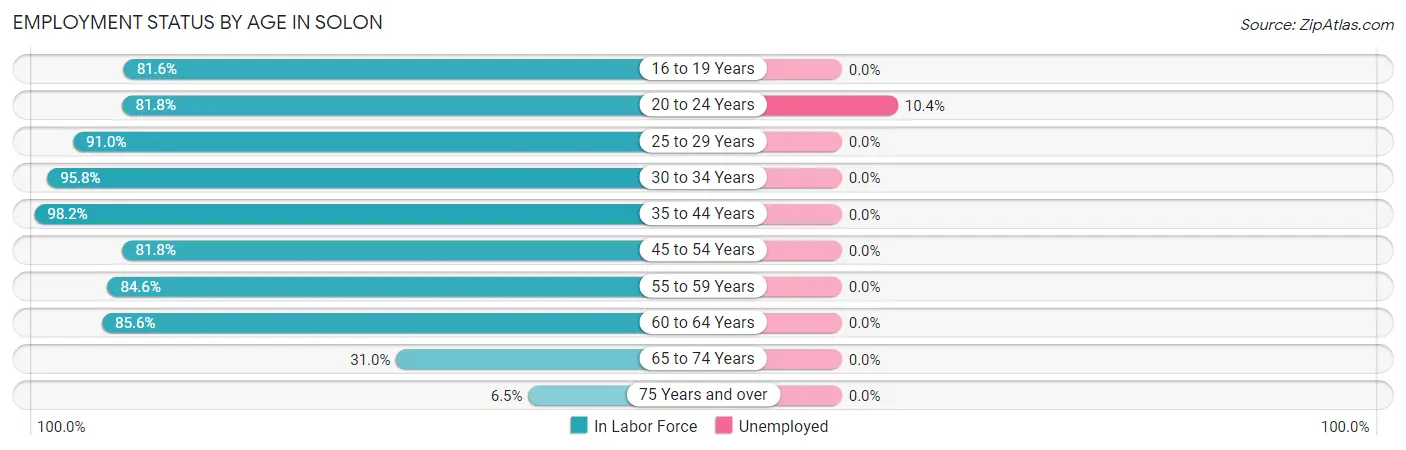
| Age Bracket | In Labor Force | Unemployed |
| 16 to 19 Years | 222 (81.6%) | 0 (0.0%) |
| 20 to 24 Years | 193 (81.8%) | 20 (10.4%) |
| 25 to 29 Years | 121 (91.0%) | 0 (0.0%) |
| 30 to 34 Years | 68 (95.8%) | 0 (0.0%) |
| 35 to 44 Years | 428 (98.2%) | 0 (0.0%) |
| 45 to 54 Years | 315 (81.8%) | 0 (0.0%) |
| 55 to 59 Years | 132 (84.6%) | 0 (0.0%) |
| 60 to 64 Years | 119 (85.6%) | 0 (0.0%) |
| 65 to 74 Years | 81 (31.0%) | 0 (0.0%) |
| 75 Years and over | 13 (6.5%) | 0 (0.0%) |
| Total | 1,693 (74.0%) | 20 (1.2%) |
Employment Status by Educational Attainment in Solon
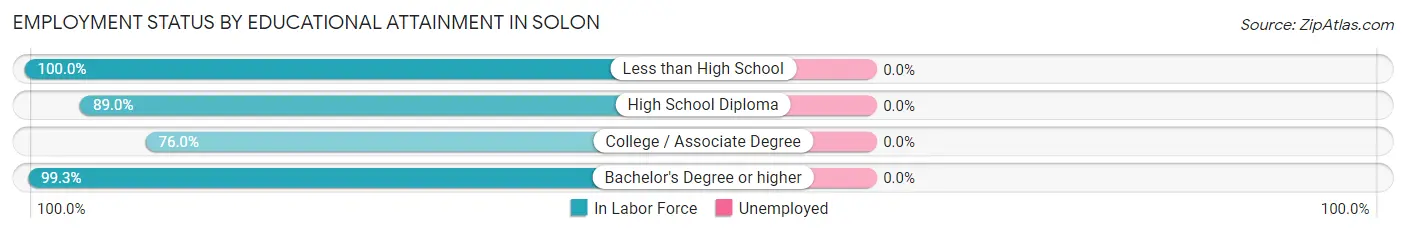
| Educational Attainment | In Labor Force | Unemployed |
| Less than High School | 52 (100.0%) | 0 (0.0%) |
| High School Diploma | 186 (89.0%) | 0 (0.0%) |
| College / Associate Degree | 349 (76.0%) | 0 (0.0%) |
| Bachelor's Degree or higher | 596 (99.3%) | 0 (0.0%) |
| Total | 1,183 (89.6%) | 0 (0.0%) |
Employment Occupations by Sex in Solon
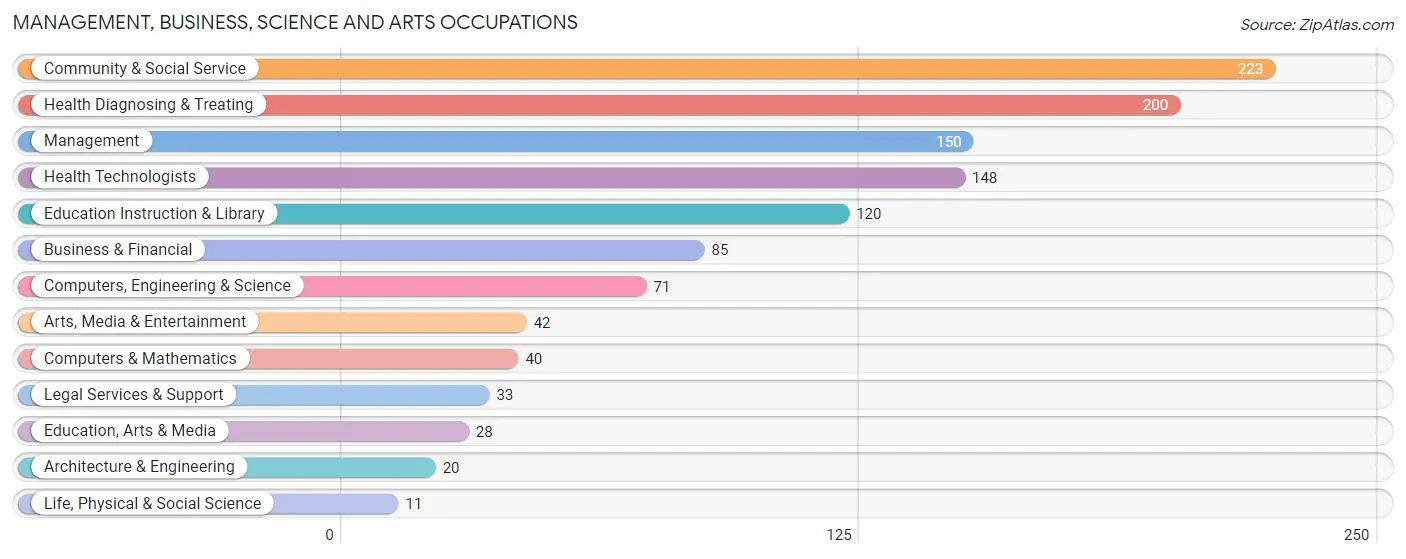
Management, Business, Science and Arts Occupations
The most common Management, Business, Science and Arts occupations in Solon are Community & Social Service (223 | 13.3%), Health Diagnosing & Treating (200 | 12.0%), Management (150 | 9.0%), Health Technologists (148 | 8.8%), and Education Instruction & Library (120 | 7.2%).
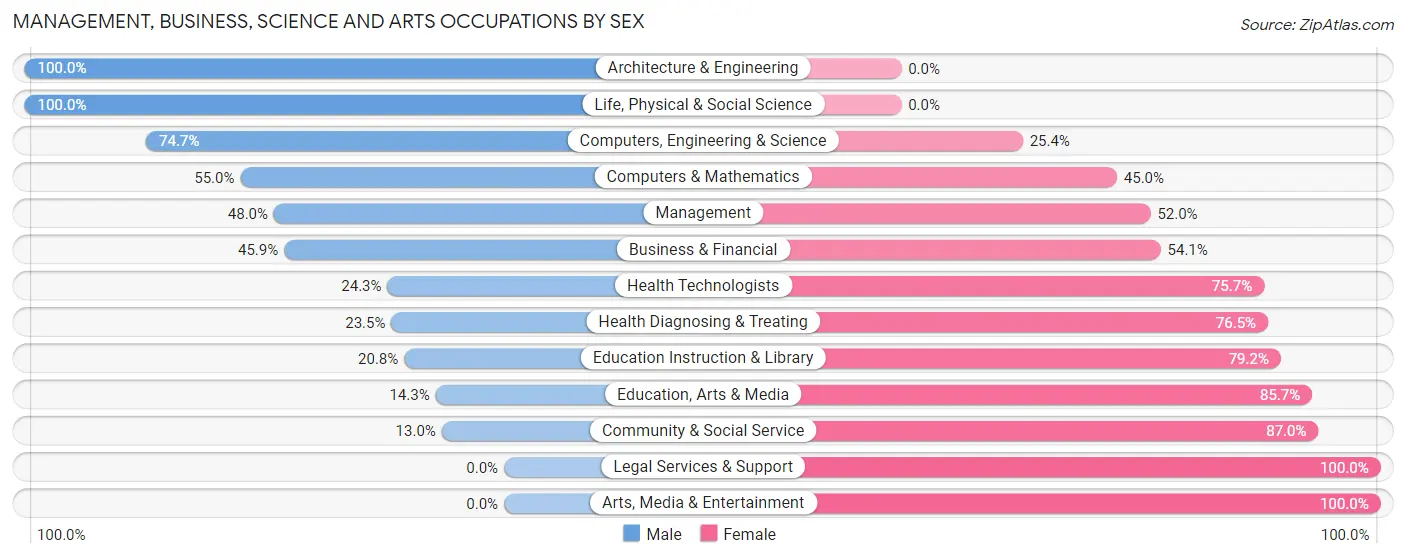
Management, Business, Science and Arts Occupations by Sex
Within the Management, Business, Science and Arts occupations in Solon, the most male-oriented occupations are Architecture & Engineering (100.0%), Life, Physical & Social Science (100.0%), and Computers, Engineering & Science (74.7%), while the most female-oriented occupations are Legal Services & Support (100.0%), Arts, Media & Entertainment (100.0%), and Community & Social Service (87.0%).
| Occupation | Male | Female |
| Management | 72 (48.0%) | 78 (52.0%) |
| Business & Financial | 39 (45.9%) | 46 (54.1%) |
| Computers, Engineering & Science | 53 (74.7%) | 18 (25.4%) |
| Computers & Mathematics | 22 (55.0%) | 18 (45.0%) |
| Architecture & Engineering | 20 (100.0%) | 0 (0.0%) |
| Life, Physical & Social Science | 11 (100.0%) | 0 (0.0%) |
| Community & Social Service | 29 (13.0%) | 194 (87.0%) |
| Education, Arts & Media | 4 (14.3%) | 24 (85.7%) |
| Legal Services & Support | 0 (0.0%) | 33 (100.0%) |
| Education Instruction & Library | 25 (20.8%) | 95 (79.2%) |
| Arts, Media & Entertainment | 0 (0.0%) | 42 (100.0%) |
| Health Diagnosing & Treating | 47 (23.5%) | 153 (76.5%) |
| Health Technologists | 36 (24.3%) | 112 (75.7%) |
| Total (Category) | 240 (32.9%) | 489 (67.1%) |
| Total (Overall) | 731 (43.7%) | 941 (56.3%) |
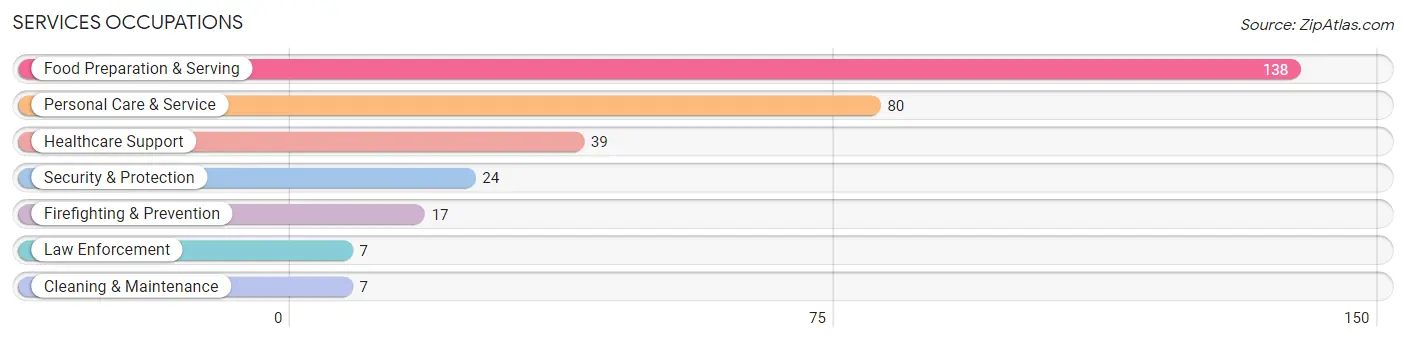
Services Occupations
The most common Services occupations in Solon are Food Preparation & Serving (138 | 8.3%), Personal Care & Service (80 | 4.8%), Healthcare Support (39 | 2.3%), Security & Protection (24 | 1.4%), and Firefighting & Prevention (17 | 1.0%).
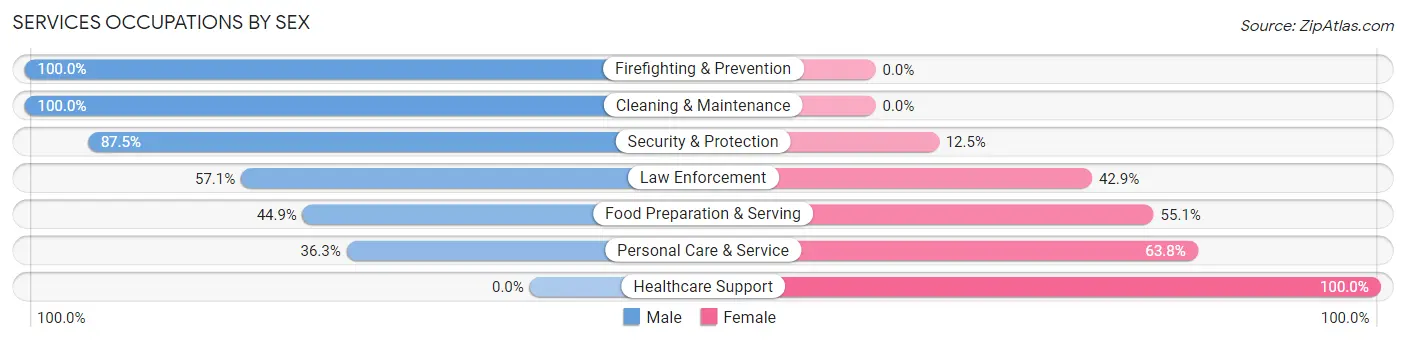
Services Occupations by Sex
Within the Services occupations in Solon, the most male-oriented occupations are Firefighting & Prevention (100.0%), Cleaning & Maintenance (100.0%), and Security & Protection (87.5%), while the most female-oriented occupations are Healthcare Support (100.0%), Personal Care & Service (63.7%), and Food Preparation & Serving (55.1%).
| Occupation | Male | Female |
| Healthcare Support | 0 (0.0%) | 39 (100.0%) |
| Security & Protection | 21 (87.5%) | 3 (12.5%) |
| Firefighting & Prevention | 17 (100.0%) | 0 (0.0%) |
| Law Enforcement | 4 (57.1%) | 3 (42.9%) |
| Food Preparation & Serving | 62 (44.9%) | 76 (55.1%) |
| Cleaning & Maintenance | 7 (100.0%) | 0 (0.0%) |
| Personal Care & Service | 29 (36.2%) | 51 (63.7%) |
| Total (Category) | 119 (41.3%) | 169 (58.7%) |
| Total (Overall) | 731 (43.7%) | 941 (56.3%) |
Sales and Office Occupations
The most common Sales and Office occupations in Solon are Office & Administration (215 | 12.9%), and Sales & Related (142 | 8.5%).

Sales and Office Occupations by Sex
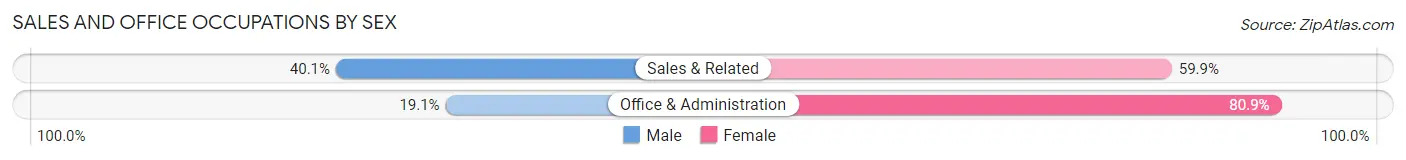
| Occupation | Male | Female |
| Sales & Related | 57 (40.1%) | 85 (59.9%) |
| Office & Administration | 41 (19.1%) | 174 (80.9%) |
| Total (Category) | 98 (27.5%) | 259 (72.6%) |
| Total (Overall) | 731 (43.7%) | 941 (56.3%) |
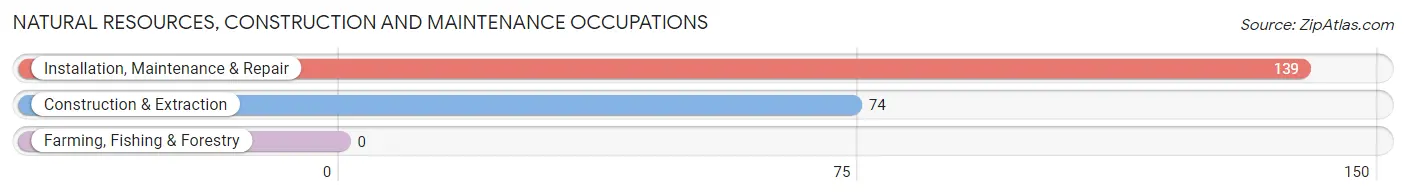
Natural Resources, Construction and Maintenance Occupations
The most common Natural Resources, Construction and Maintenance occupations in Solon are Installation, Maintenance & Repair (139 | 8.3%), and Construction & Extraction (74 | 4.4%).
Natural Resources, Construction and Maintenance Occupations by Sex
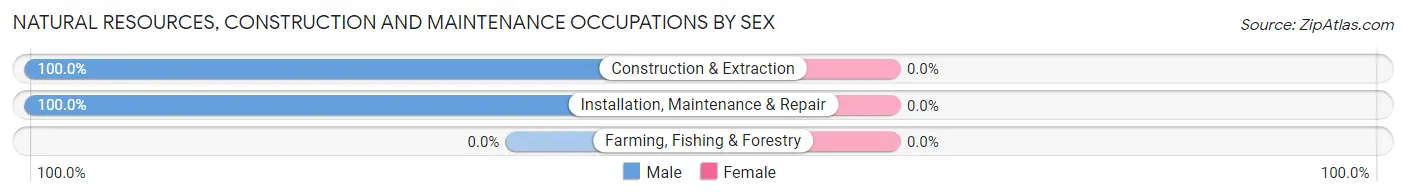
| Occupation | Male | Female |
| Farming, Fishing & Forestry | 0 (0.0%) | 0 (0.0%) |
| Construction & Extraction | 74 (100.0%) | 0 (0.0%) |
| Installation, Maintenance & Repair | 139 (100.0%) | 0 (0.0%) |
| Total (Category) | 213 (100.0%) | 0 (0.0%) |
| Total (Overall) | 731 (43.7%) | 941 (56.3%) |
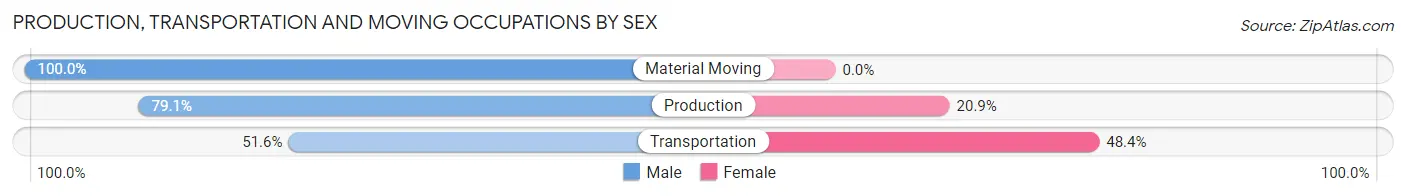
Production, Transportation and Moving Occupations
The most common Production, Transportation and Moving occupations in Solon are Production (43 | 2.6%), Transportation (31 | 1.8%), and Material Moving (11 | 0.7%).
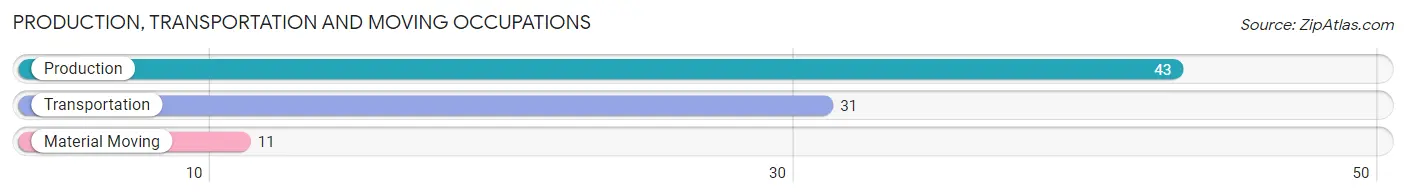
Production, Transportation and Moving Occupations by Sex
| Occupation | Male | Female |
| Production | 34 (79.1%) | 9 (20.9%) |
| Transportation | 16 (51.6%) | 15 (48.4%) |
| Material Moving | 11 (100.0%) | 0 (0.0%) |
| Total (Category) | 61 (71.8%) | 24 (28.2%) |
| Total (Overall) | 731 (43.7%) | 941 (56.3%) |
Employment Industries by Sex in Solon
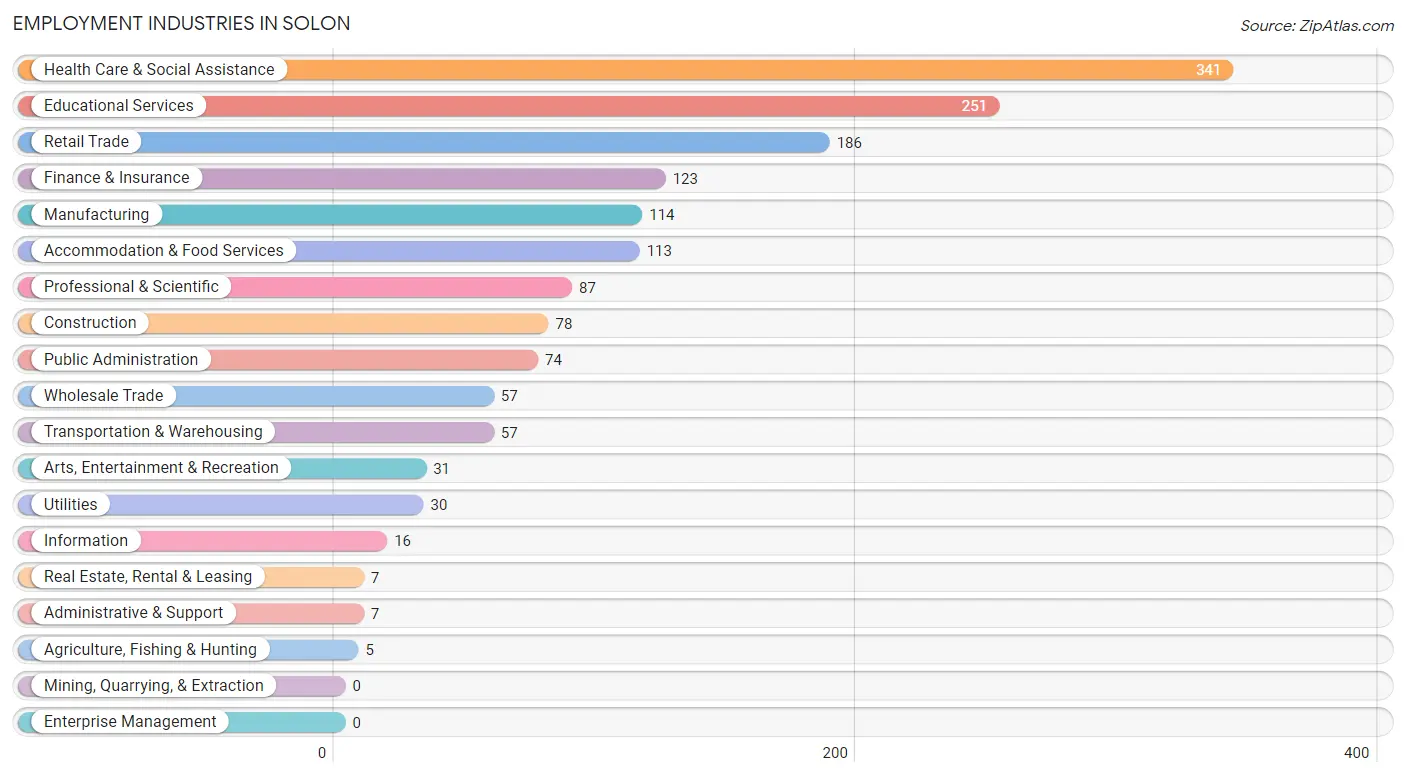
Employment Industries in Solon
The major employment industries in Solon include Health Care & Social Assistance (341 | 20.4%), Educational Services (251 | 15.0%), Retail Trade (186 | 11.1%), Finance & Insurance (123 | 7.4%), and Manufacturing (114 | 6.8%).
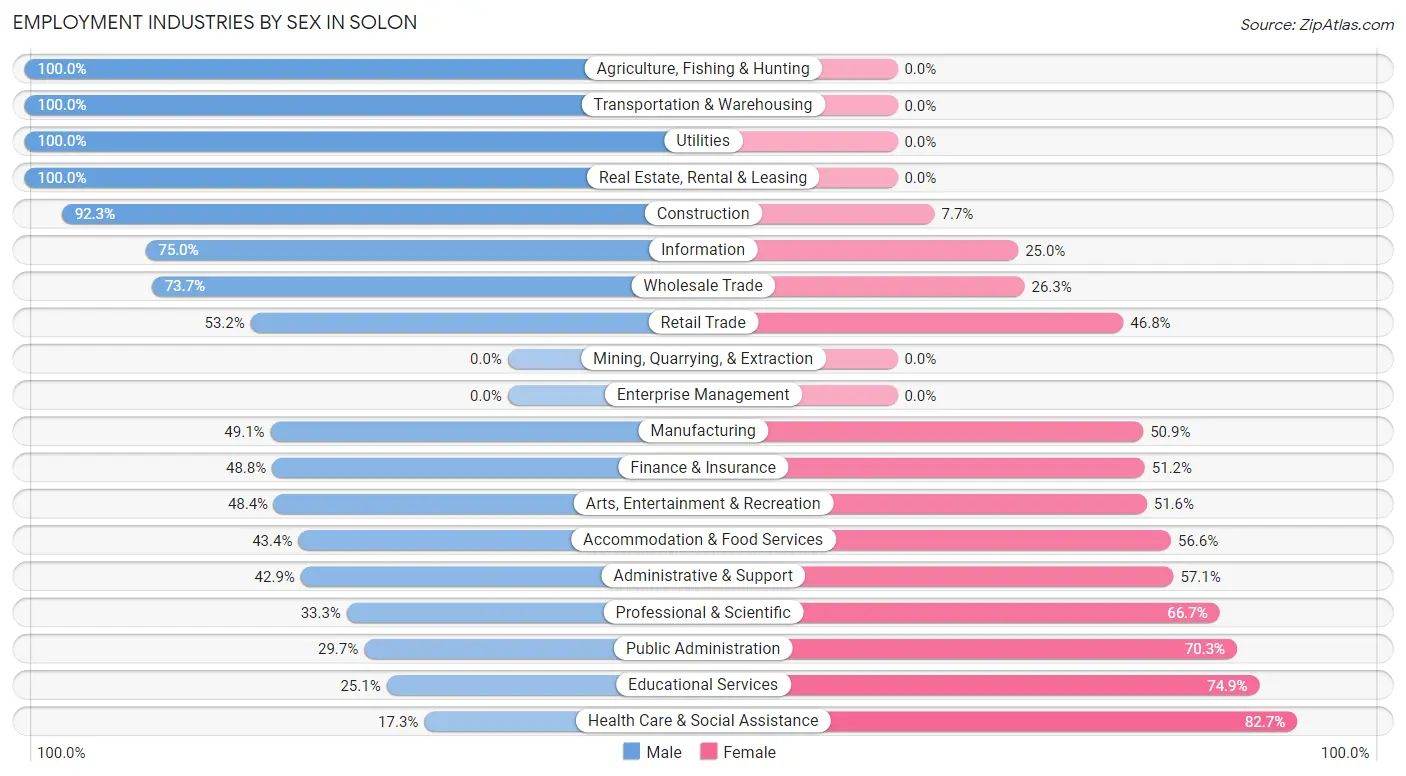
Employment Industries by Sex in Solon
The Solon industries that see more men than women are Agriculture, Fishing & Hunting (100.0%), Transportation & Warehousing (100.0%), and Utilities (100.0%), whereas the industries that tend to have a higher number of women are Health Care & Social Assistance (82.7%), Educational Services (74.9%), and Public Administration (70.3%).
| Industry | Male | Female |
| Agriculture, Fishing & Hunting | 5 (100.0%) | 0 (0.0%) |
| Mining, Quarrying, & Extraction | 0 (0.0%) | 0 (0.0%) |
| Construction | 72 (92.3%) | 6 (7.7%) |
| Manufacturing | 56 (49.1%) | 58 (50.9%) |
| Wholesale Trade | 42 (73.7%) | 15 (26.3%) |
| Retail Trade | 99 (53.2%) | 87 (46.8%) |
| Transportation & Warehousing | 57 (100.0%) | 0 (0.0%) |
| Utilities | 30 (100.0%) | 0 (0.0%) |
| Information | 12 (75.0%) | 4 (25.0%) |
| Finance & Insurance | 60 (48.8%) | 63 (51.2%) |
| Real Estate, Rental & Leasing | 7 (100.0%) | 0 (0.0%) |
| Professional & Scientific | 29 (33.3%) | 58 (66.7%) |
| Enterprise Management | 0 (0.0%) | 0 (0.0%) |
| Administrative & Support | 3 (42.9%) | 4 (57.1%) |
| Educational Services | 63 (25.1%) | 188 (74.9%) |
| Health Care & Social Assistance | 59 (17.3%) | 282 (82.7%) |
| Arts, Entertainment & Recreation | 15 (48.4%) | 16 (51.6%) |
| Accommodation & Food Services | 49 (43.4%) | 64 (56.6%) |
| Public Administration | 22 (29.7%) | 52 (70.3%) |
| Total | 731 (43.7%) | 941 (56.3%) |
Education in Solon
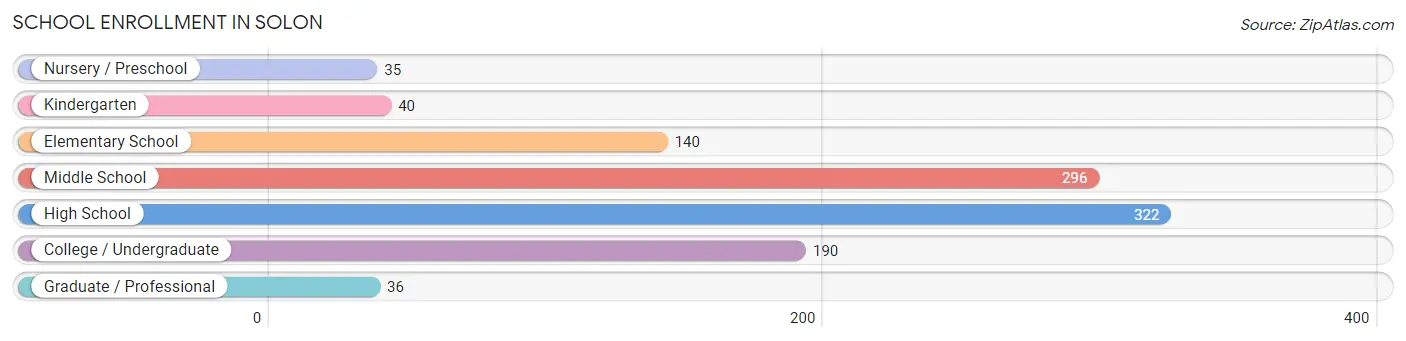
School Enrollment in Solon
The most common levels of schooling among the 1,059 students in Solon are high school (322 | 30.4%), middle school (296 | 28.0%), and college / undergraduate (190 | 17.9%).
| School Level | # Students | % Students |
| Nursery / Preschool | 35 | 3.3% |
| Kindergarten | 40 | 3.8% |
| Elementary School | 140 | 13.2% |
| Middle School | 296 | 28.0% |
| High School | 322 | 30.4% |
| College / Undergraduate | 190 | 17.9% |
| Graduate / Professional | 36 | 3.4% |
| Total | 1,059 | 100.0% |
School Enrollment by Age by Funding Source in Solon
Out of a total of 1,059 students who are enrolled in schools in Solon, 131 (12.4%) attend a private institution, while the remaining 928 (87.6%) are enrolled in public schools. The age group of 3 to 4 year olds has the highest likelihood of being enrolled in private schools, with 29 (90.6% in the age bracket) enrolled. Conversely, the age group of 15 to 17 year olds has the lowest likelihood of being enrolled in a private school, with 280 (100.0% in the age bracket) attending a public institution.
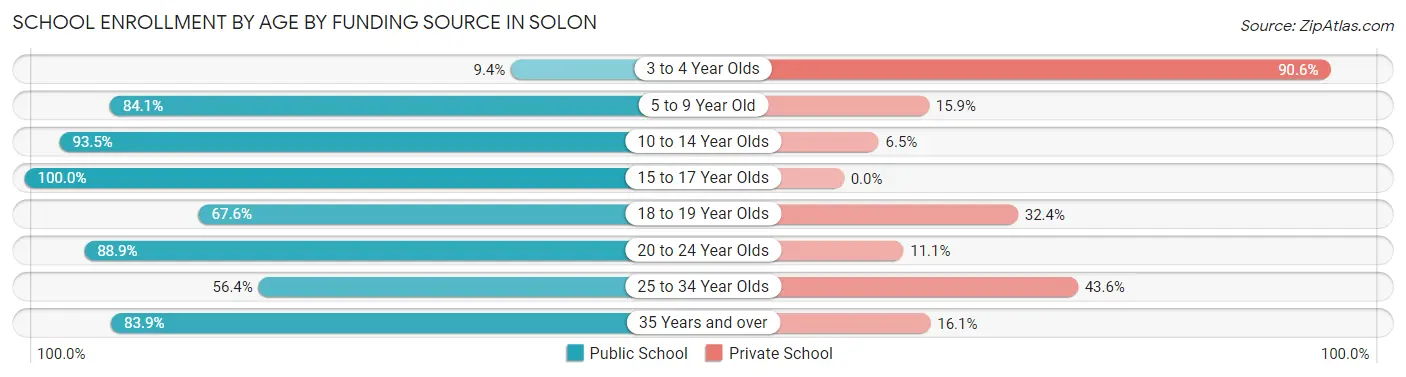
| Age Bracket | Public School | Private School |
| 3 to 4 Year Olds | 3 (9.4%) | 29 (90.6%) |
| 5 to 9 Year Old | 106 (84.1%) | 20 (15.9%) |
| 10 to 14 Year Olds | 345 (93.5%) | 24 (6.5%) |
| 15 to 17 Year Olds | 280 (100.0%) | 0 (0.0%) |
| 18 to 19 Year Olds | 50 (67.6%) | 24 (32.4%) |
| 20 to 24 Year Olds | 96 (88.9%) | 12 (11.1%) |
| 25 to 34 Year Olds | 22 (56.4%) | 17 (43.6%) |
| 35 Years and over | 26 (83.9%) | 5 (16.1%) |
| Total | 928 (87.6%) | 131 (12.4%) |
Educational Attainment by Field of Study in Solon
Business (194 | 26.3%), education (156 | 21.1%), science & technology (88 | 11.9%), bio, nature & agricultural (46 | 6.2%), and psychology (44 | 6.0%) are the most common fields of study among 738 individuals in Solon who have obtained a bachelor's degree or higher.
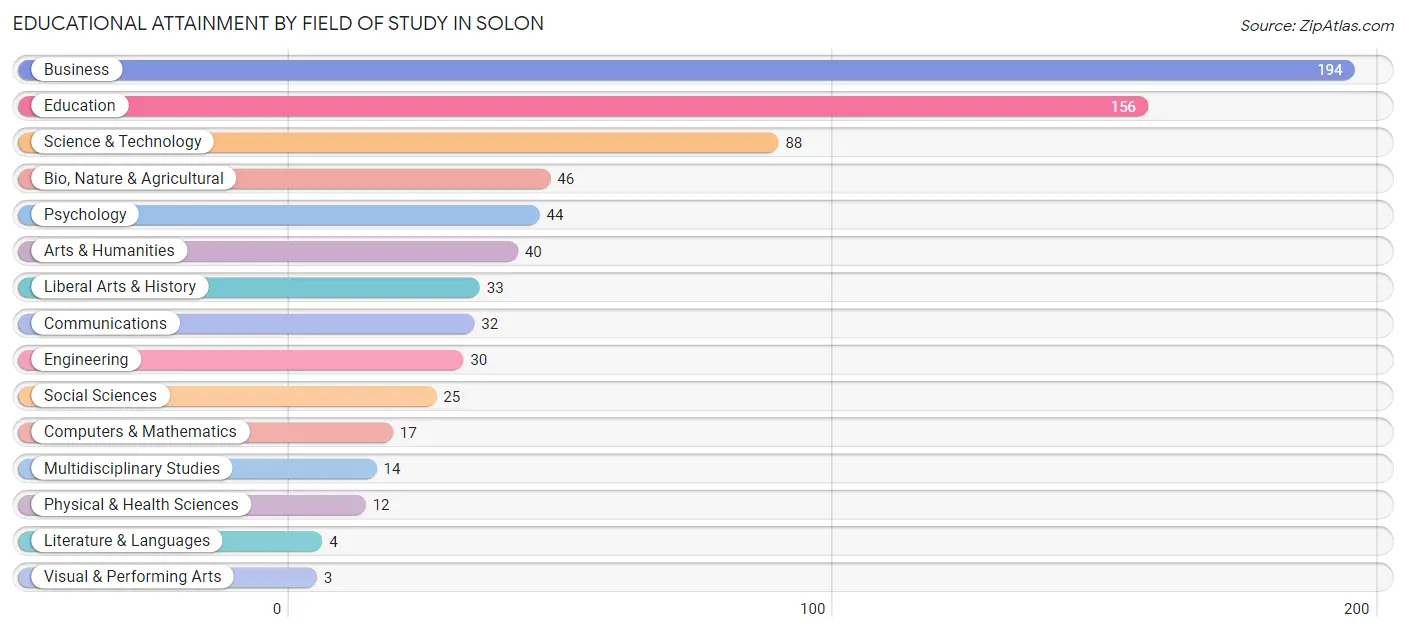
| Field of Study | # Graduates | % Graduates |
| Computers & Mathematics | 17 | 2.3% |
| Bio, Nature & Agricultural | 46 | 6.2% |
| Physical & Health Sciences | 12 | 1.6% |
| Psychology | 44 | 6.0% |
| Social Sciences | 25 | 3.4% |
| Engineering | 30 | 4.1% |
| Multidisciplinary Studies | 14 | 1.9% |
| Science & Technology | 88 | 11.9% |
| Business | 194 | 26.3% |
| Education | 156 | 21.1% |
| Literature & Languages | 4 | 0.5% |
| Liberal Arts & History | 33 | 4.5% |
| Visual & Performing Arts | 3 | 0.4% |
| Communications | 32 | 4.3% |
| Arts & Humanities | 40 | 5.4% |
| Total | 738 | 100.0% |
Transportation & Commute in Solon
Vehicle Availability by Sex in Solon
The most prevalent vehicle ownership categories in Solon are males with 2 vehicles (329, accounting for 45.3%) and females with 2 vehicles (403, making up 36.7%).
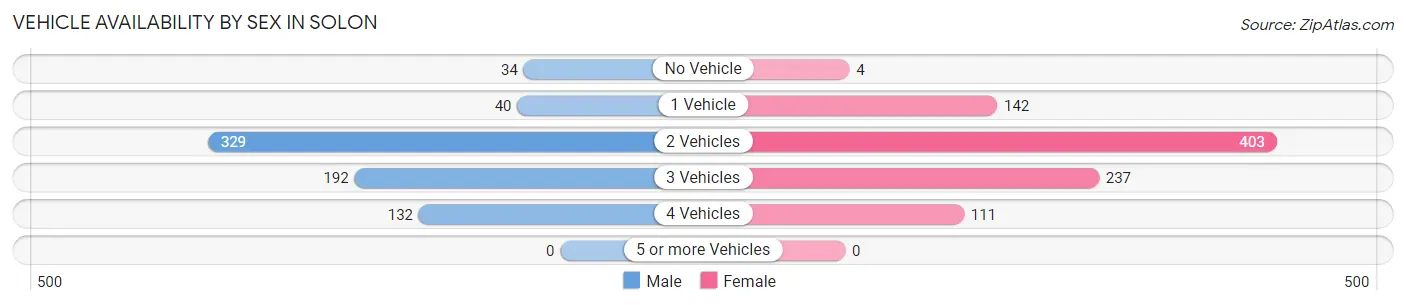
| Vehicles Available | Male | Female |
| No Vehicle | 34 (4.7%) | 4 (0.4%) |
| 1 Vehicle | 40 (5.5%) | 142 (15.8%) |
| 2 Vehicles | 329 (45.3%) | 403 (44.9%) |
| 3 Vehicles | 192 (26.4%) | 237 (26.4%) |
| 4 Vehicles | 132 (18.2%) | 111 (12.4%) |
| 5 or more Vehicles | 0 (0.0%) | 0 (0.0%) |
| Total | 727 (100.0%) | 897 (100.0%) |
Commute Time in Solon
The most frequently occuring commute durations in Solon are 20 to 24 minutes (320 commuters, 21.8%), 5 to 9 minutes (233 commuters, 15.9%), and less than 5 minutes (225 commuters, 15.4%).
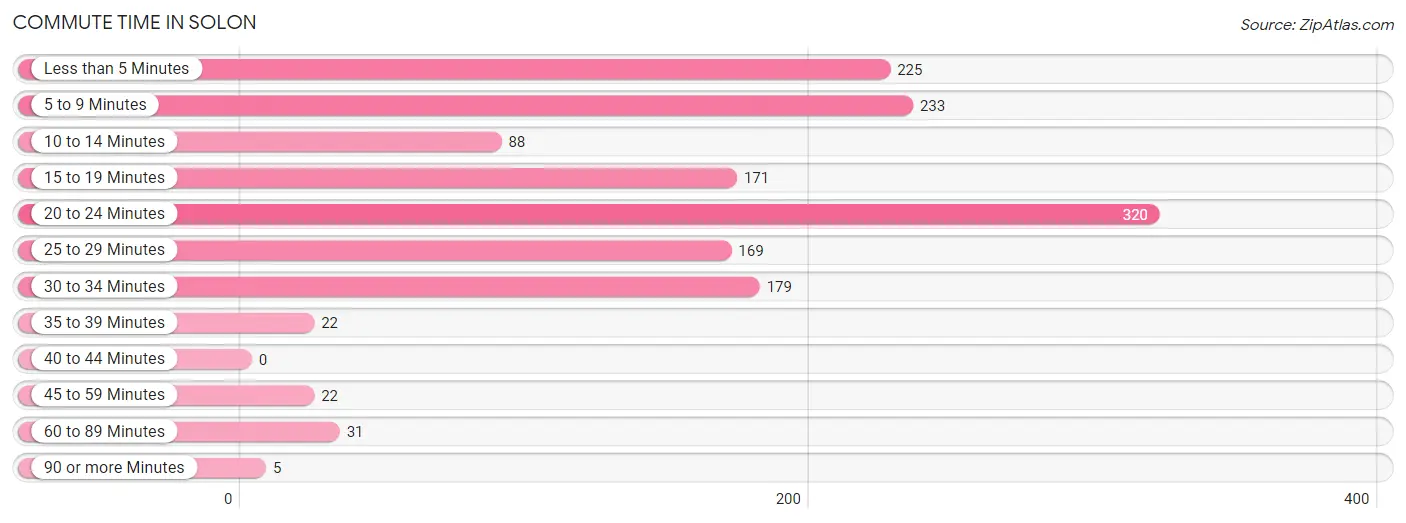
| Commute Time | # Commuters | % Commuters |
| Less than 5 Minutes | 225 | 15.4% |
| 5 to 9 Minutes | 233 | 15.9% |
| 10 to 14 Minutes | 88 | 6.0% |
| 15 to 19 Minutes | 171 | 11.7% |
| 20 to 24 Minutes | 320 | 21.8% |
| 25 to 29 Minutes | 169 | 11.5% |
| 30 to 34 Minutes | 179 | 12.2% |
| 35 to 39 Minutes | 22 | 1.5% |
| 40 to 44 Minutes | 0 | 0.0% |
| 45 to 59 Minutes | 22 | 1.5% |
| 60 to 89 Minutes | 31 | 2.1% |
| 90 or more Minutes | 5 | 0.3% |
Commute Time by Sex in Solon
The most common commute times in Solon are 15 to 19 minutes (134 commuters, 19.2%) for males and 20 to 24 minutes (216 commuters, 28.2%) for females.
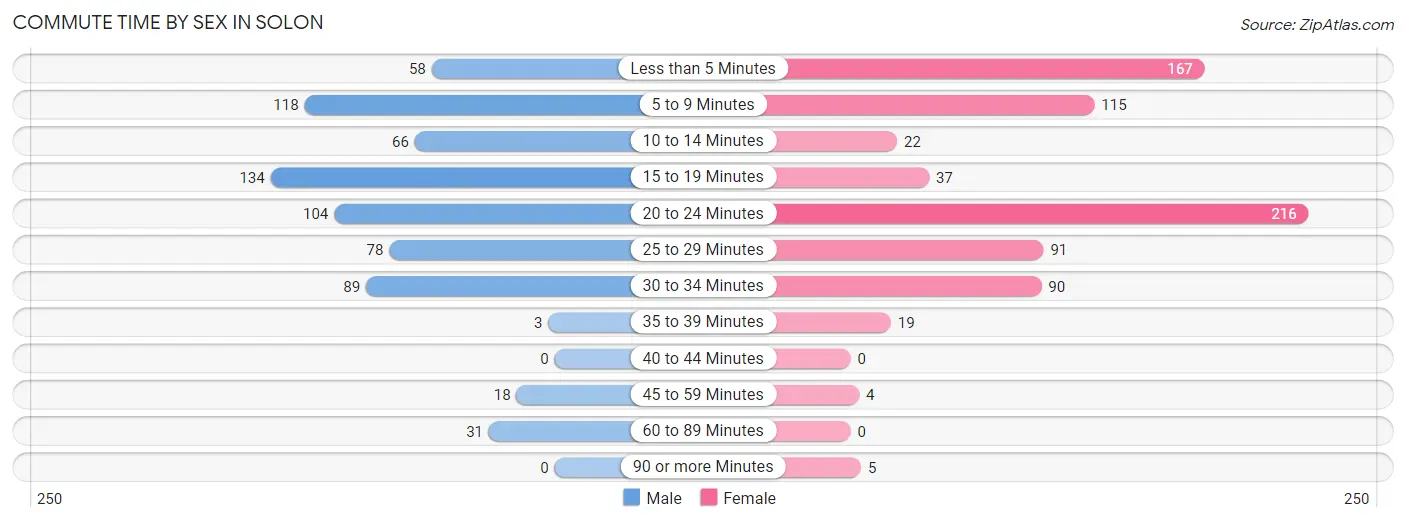
| Commute Time | Male | Female |
| Less than 5 Minutes | 58 (8.3%) | 167 (21.8%) |
| 5 to 9 Minutes | 118 (16.9%) | 115 (15.0%) |
| 10 to 14 Minutes | 66 (9.4%) | 22 (2.9%) |
| 15 to 19 Minutes | 134 (19.2%) | 37 (4.8%) |
| 20 to 24 Minutes | 104 (14.9%) | 216 (28.2%) |
| 25 to 29 Minutes | 78 (11.2%) | 91 (11.9%) |
| 30 to 34 Minutes | 89 (12.7%) | 90 (11.7%) |
| 35 to 39 Minutes | 3 (0.4%) | 19 (2.5%) |
| 40 to 44 Minutes | 0 (0.0%) | 0 (0.0%) |
| 45 to 59 Minutes | 18 (2.6%) | 4 (0.5%) |
| 60 to 89 Minutes | 31 (4.4%) | 0 (0.0%) |
| 90 or more Minutes | 0 (0.0%) | 5 (0.6%) |
Time of Departure to Work by Sex in Solon
The most frequent times of departure to work in Solon are 7:00 AM to 7:29 AM (135, 19.3%) for males and 7:30 AM to 7:59 AM (146, 19.1%) for females.
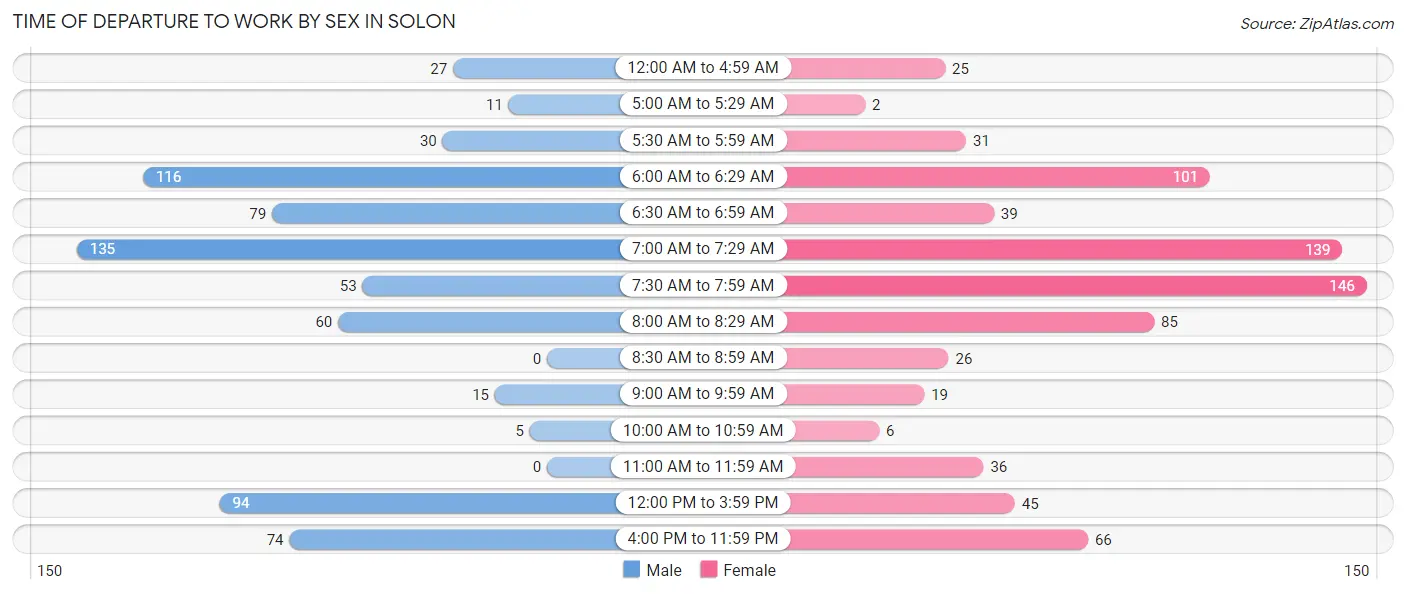
| Time of Departure | Male | Female |
| 12:00 AM to 4:59 AM | 27 (3.9%) | 25 (3.3%) |
| 5:00 AM to 5:29 AM | 11 (1.6%) | 2 (0.3%) |
| 5:30 AM to 5:59 AM | 30 (4.3%) | 31 (4.1%) |
| 6:00 AM to 6:29 AM | 116 (16.6%) | 101 (13.2%) |
| 6:30 AM to 6:59 AM | 79 (11.3%) | 39 (5.1%) |
| 7:00 AM to 7:29 AM | 135 (19.3%) | 139 (18.1%) |
| 7:30 AM to 7:59 AM | 53 (7.6%) | 146 (19.1%) |
| 8:00 AM to 8:29 AM | 60 (8.6%) | 85 (11.1%) |
| 8:30 AM to 8:59 AM | 0 (0.0%) | 26 (3.4%) |
| 9:00 AM to 9:59 AM | 15 (2.1%) | 19 (2.5%) |
| 10:00 AM to 10:59 AM | 5 (0.7%) | 6 (0.8%) |
| 11:00 AM to 11:59 AM | 0 (0.0%) | 36 (4.7%) |
| 12:00 PM to 3:59 PM | 94 (13.5%) | 45 (5.9%) |
| 4:00 PM to 11:59 PM | 74 (10.6%) | 66 (8.6%) |
| Total | 699 (100.0%) | 766 (100.0%) |
Housing Occupancy in Solon
Occupancy by Ownership in Solon
Of the total 1,034 dwellings in Solon, owner-occupied units account for 855 (82.7%), while renter-occupied units make up 179 (17.3%).
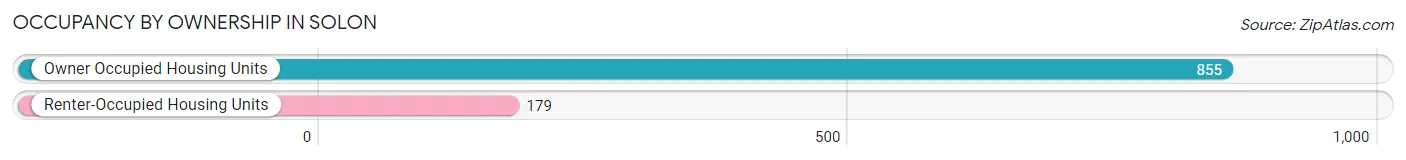
| Occupancy | # Housing Units | % Housing Units |
| Owner Occupied Housing Units | 855 | 82.7% |
| Renter-Occupied Housing Units | 179 | 17.3% |
| Total Occupied Housing Units | 1,034 | 100.0% |
Occupancy by Household Size in Solon
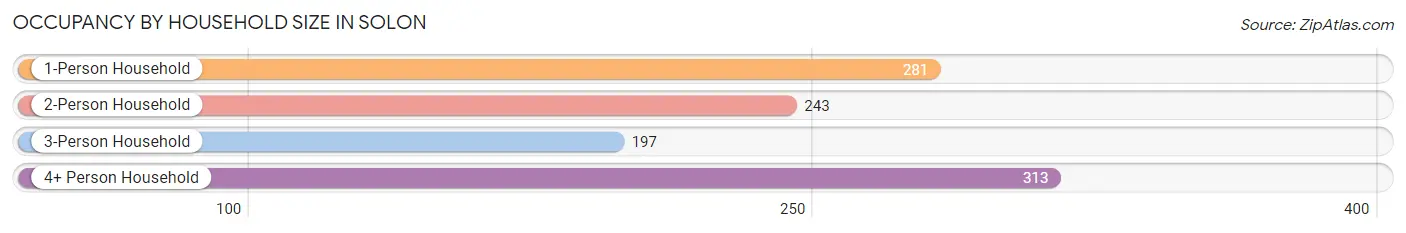
| Household Size | # Housing Units | % Housing Units |
| 1-Person Household | 281 | 27.2% |
| 2-Person Household | 243 | 23.5% |
| 3-Person Household | 197 | 19.1% |
| 4+ Person Household | 313 | 30.3% |
| Total Housing Units | 1,034 | 100.0% |
Occupancy by Ownership by Household Size in Solon
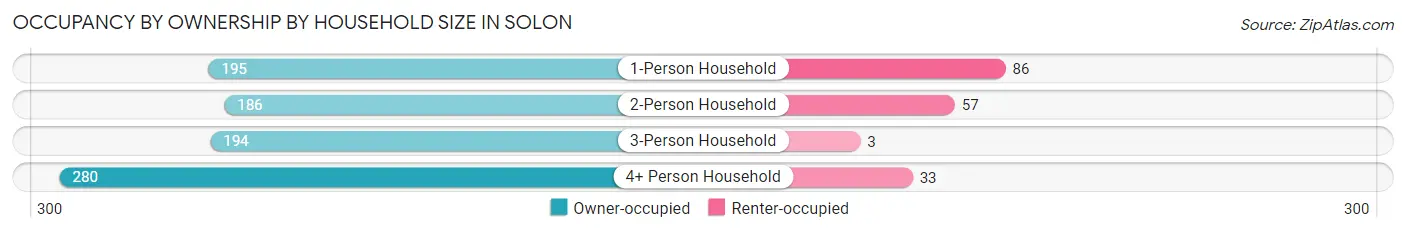
| Household Size | Owner-occupied | Renter-occupied |
| 1-Person Household | 195 (69.4%) | 86 (30.6%) |
| 2-Person Household | 186 (76.5%) | 57 (23.5%) |
| 3-Person Household | 194 (98.5%) | 3 (1.5%) |
| 4+ Person Household | 280 (89.5%) | 33 (10.5%) |
| Total Housing Units | 855 (82.7%) | 179 (17.3%) |
Occupancy by Educational Attainment in Solon
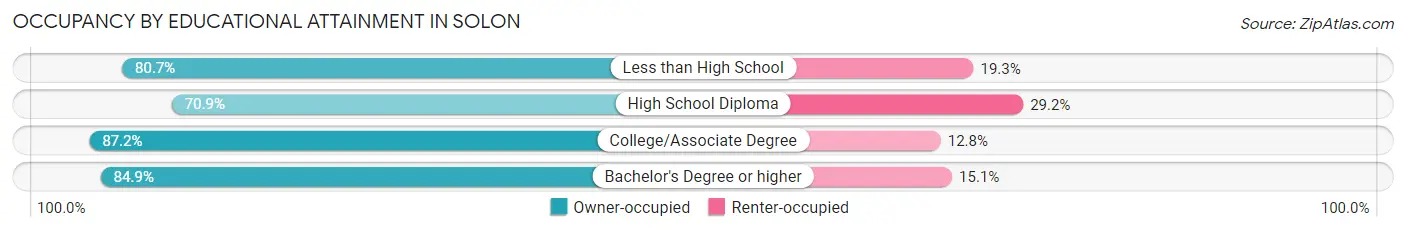
| Household Size | Owner-occupied | Renter-occupied |
| Less than High School | 46 (80.7%) | 11 (19.3%) |
| High School Diploma | 141 (70.9%) | 58 (29.1%) |
| College/Associate Degree | 279 (87.2%) | 41 (12.8%) |
| Bachelor's Degree or higher | 389 (84.9%) | 69 (15.1%) |
Occupancy by Age of Householder in Solon
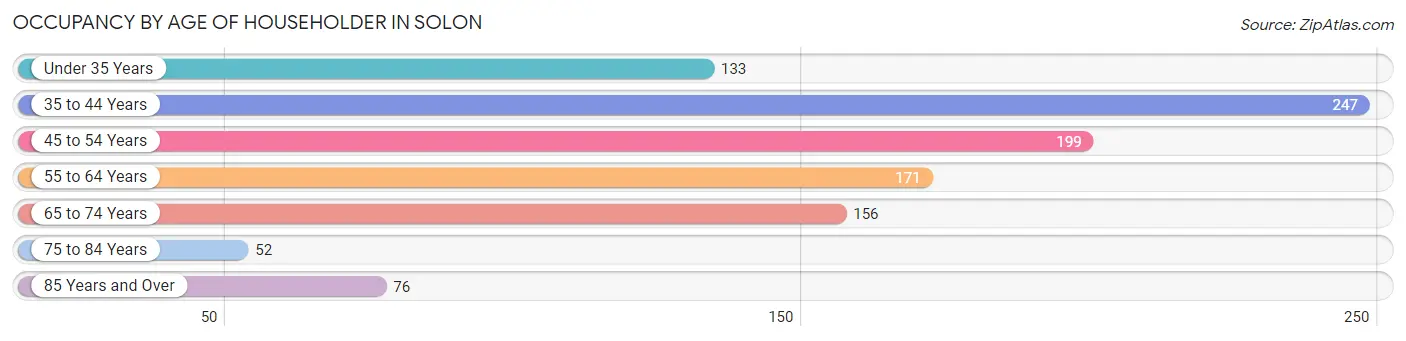
| Age Bracket | # Households | % Households |
| Under 35 Years | 133 | 12.9% |
| 35 to 44 Years | 247 | 23.9% |
| 45 to 54 Years | 199 | 19.3% |
| 55 to 64 Years | 171 | 16.5% |
| 65 to 74 Years | 156 | 15.1% |
| 75 to 84 Years | 52 | 5.0% |
| 85 Years and Over | 76 | 7.3% |
| Total | 1,034 | 100.0% |
Housing Finances in Solon
Median Income by Occupancy in Solon
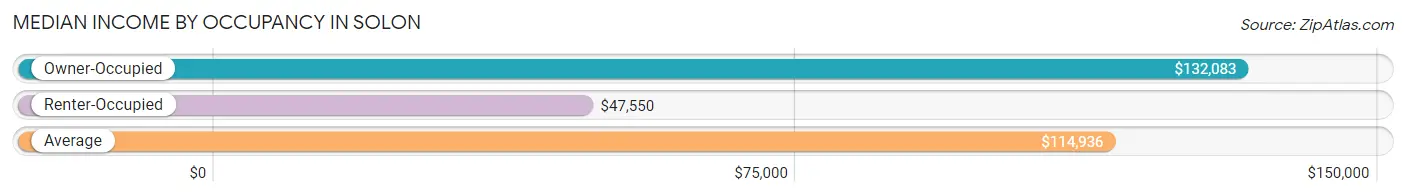
| Occupancy Type | # Households | Median Income |
| Owner-Occupied | 855 (82.7%) | $132,083 |
| Renter-Occupied | 179 (17.3%) | $47,550 |
| Average | 1,034 (100.0%) | $114,936 |
Occupancy by Householder Income Bracket in Solon
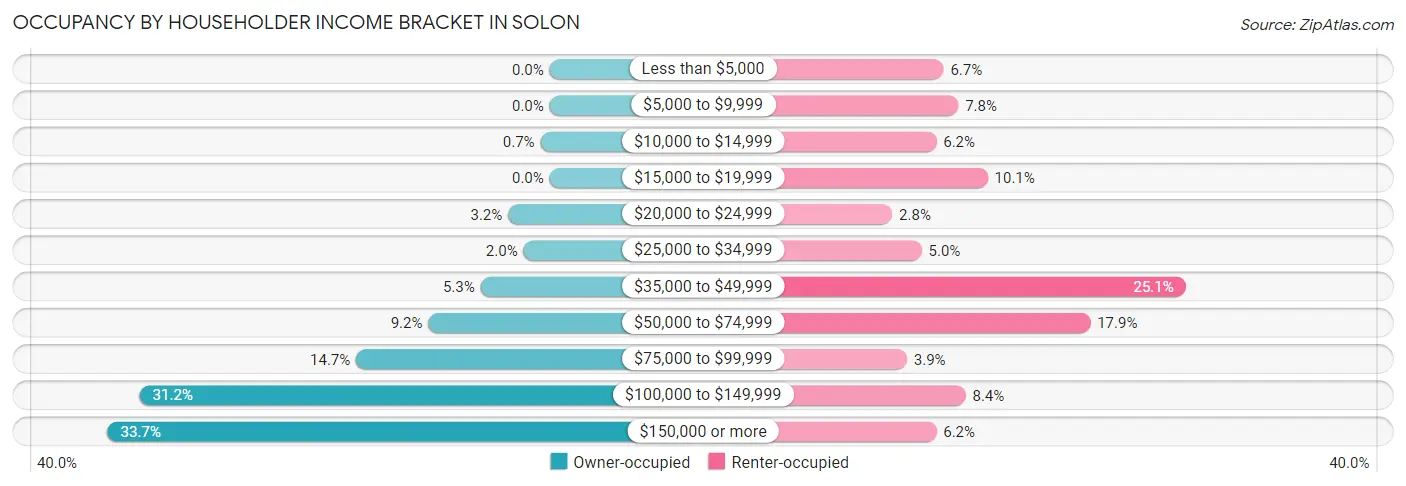
| Income Bracket | Owner-occupied | Renter-occupied |
| Less than $5,000 | 0 (0.0%) | 12 (6.7%) |
| $5,000 to $9,999 | 0 (0.0%) | 14 (7.8%) |
| $10,000 to $14,999 | 6 (0.7%) | 11 (6.1%) |
| $15,000 to $19,999 | 0 (0.0%) | 18 (10.1%) |
| $20,000 to $24,999 | 27 (3.2%) | 5 (2.8%) |
| $25,000 to $34,999 | 17 (2.0%) | 9 (5.0%) |
| $35,000 to $49,999 | 45 (5.3%) | 45 (25.1%) |
| $50,000 to $74,999 | 79 (9.2%) | 32 (17.9%) |
| $75,000 to $99,999 | 126 (14.7%) | 7 (3.9%) |
| $100,000 to $149,999 | 267 (31.2%) | 15 (8.4%) |
| $150,000 or more | 288 (33.7%) | 11 (6.1%) |
| Total | 855 (100.0%) | 179 (100.0%) |
Monthly Housing Cost Tiers in Solon
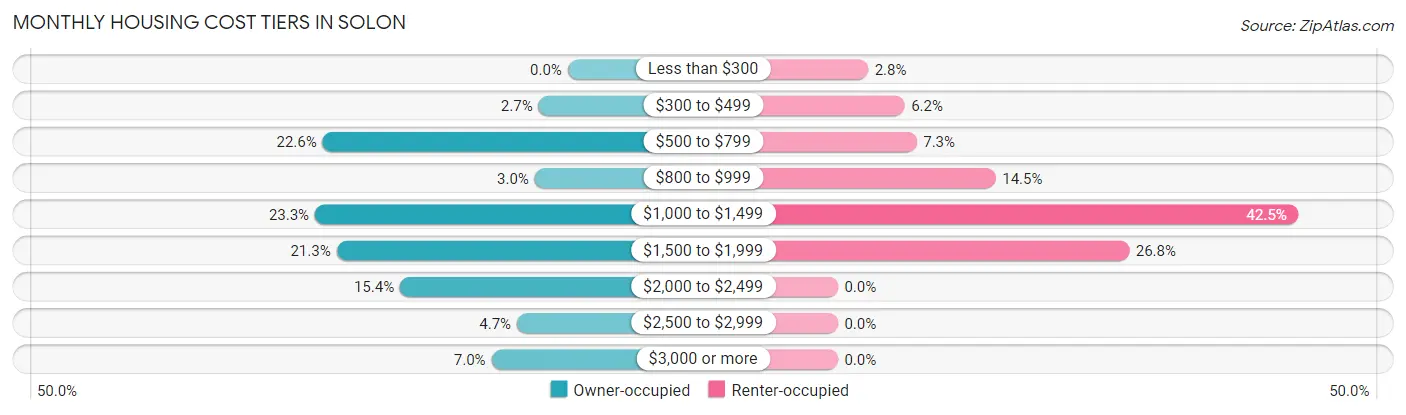
| Monthly Cost | Owner-occupied | Renter-occupied |
| Less than $300 | 0 (0.0%) | 5 (2.8%) |
| $300 to $499 | 23 (2.7%) | 11 (6.1%) |
| $500 to $799 | 193 (22.6%) | 13 (7.3%) |
| $800 to $999 | 26 (3.0%) | 26 (14.5%) |
| $1,000 to $1,499 | 199 (23.3%) | 76 (42.5%) |
| $1,500 to $1,999 | 182 (21.3%) | 48 (26.8%) |
| $2,000 to $2,499 | 132 (15.4%) | 0 (0.0%) |
| $2,500 to $2,999 | 40 (4.7%) | 0 (0.0%) |
| $3,000 or more | 60 (7.0%) | 0 (0.0%) |
| Total | 855 (100.0%) | 179 (100.0%) |
Physical Housing Characteristics in Solon
Housing Structures in Solon
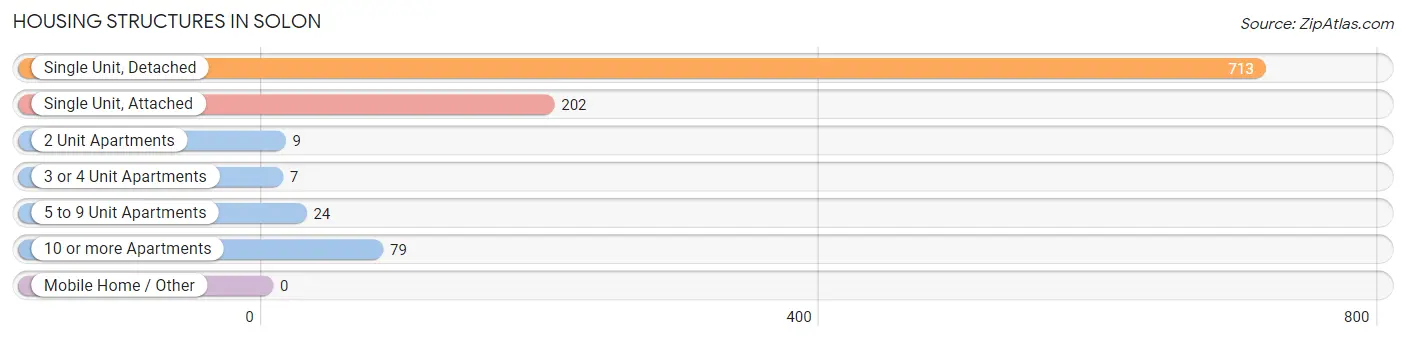
| Structure Type | # Housing Units | % Housing Units |
| Single Unit, Detached | 713 | 69.0% |
| Single Unit, Attached | 202 | 19.5% |
| 2 Unit Apartments | 9 | 0.9% |
| 3 or 4 Unit Apartments | 7 | 0.7% |
| 5 to 9 Unit Apartments | 24 | 2.3% |
| 10 or more Apartments | 79 | 7.6% |
| Mobile Home / Other | 0 | 0.0% |
| Total | 1,034 | 100.0% |
Housing Structures by Occupancy in Solon
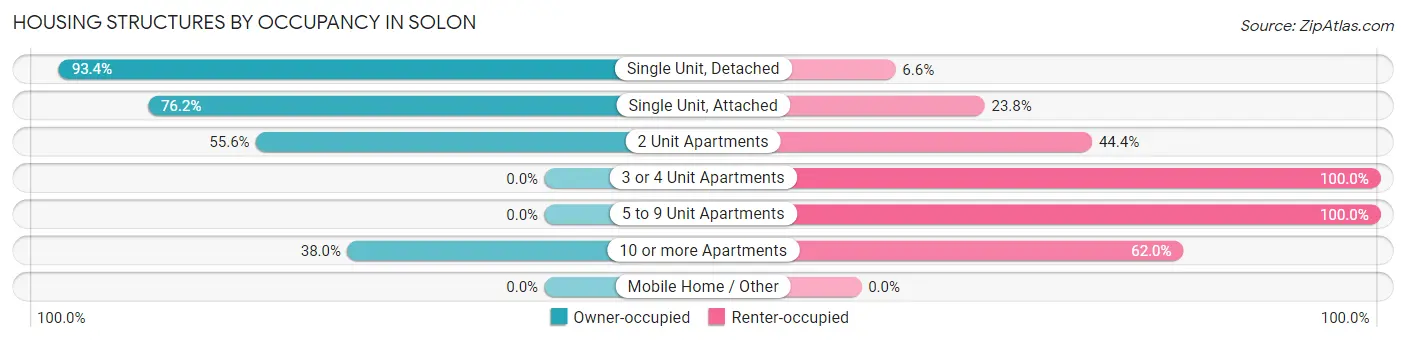
| Structure Type | Owner-occupied | Renter-occupied |
| Single Unit, Detached | 666 (93.4%) | 47 (6.6%) |
| Single Unit, Attached | 154 (76.2%) | 48 (23.8%) |
| 2 Unit Apartments | 5 (55.6%) | 4 (44.4%) |
| 3 or 4 Unit Apartments | 0 (0.0%) | 7 (100.0%) |
| 5 to 9 Unit Apartments | 0 (0.0%) | 24 (100.0%) |
| 10 or more Apartments | 30 (38.0%) | 49 (62.0%) |
| Mobile Home / Other | 0 (0.0%) | 0 (0.0%) |
| Total | 855 (82.7%) | 179 (17.3%) |
Housing Structures by Number of Rooms in Solon
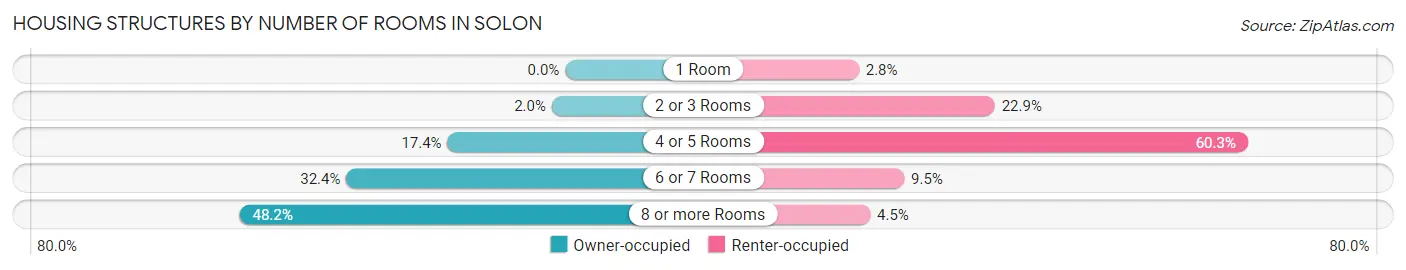
| Number of Rooms | Owner-occupied | Renter-occupied |
| 1 Room | 0 (0.0%) | 5 (2.8%) |
| 2 or 3 Rooms | 17 (2.0%) | 41 (22.9%) |
| 4 or 5 Rooms | 149 (17.4%) | 108 (60.3%) |
| 6 or 7 Rooms | 277 (32.4%) | 17 (9.5%) |
| 8 or more Rooms | 412 (48.2%) | 8 (4.5%) |
| Total | 855 (100.0%) | 179 (100.0%) |
Housing Structure by Heating Type in Solon
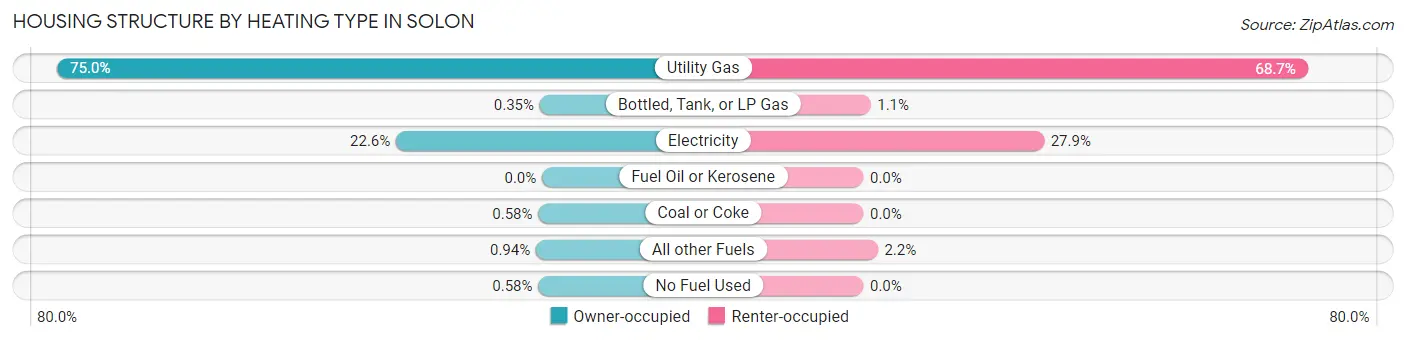
| Heating Type | Owner-occupied | Renter-occupied |
| Utility Gas | 641 (75.0%) | 123 (68.7%) |
| Bottled, Tank, or LP Gas | 3 (0.4%) | 2 (1.1%) |
| Electricity | 193 (22.6%) | 50 (27.9%) |
| Fuel Oil or Kerosene | 0 (0.0%) | 0 (0.0%) |
| Coal or Coke | 5 (0.6%) | 0 (0.0%) |
| All other Fuels | 8 (0.9%) | 4 (2.2%) |
| No Fuel Used | 5 (0.6%) | 0 (0.0%) |
| Total | 855 (100.0%) | 179 (100.0%) |
Household Vehicle Usage in Solon
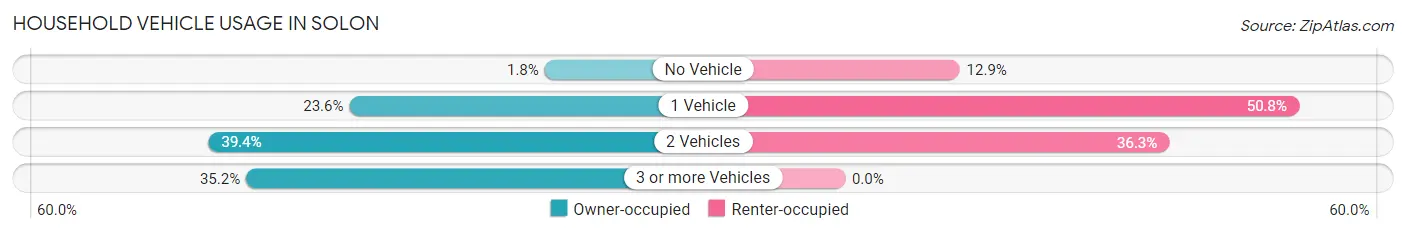
| Vehicles per Household | Owner-occupied | Renter-occupied |
| No Vehicle | 15 (1.8%) | 23 (12.9%) |
| 1 Vehicle | 202 (23.6%) | 91 (50.8%) |
| 2 Vehicles | 337 (39.4%) | 65 (36.3%) |
| 3 or more Vehicles | 301 (35.2%) | 0 (0.0%) |
| Total | 855 (100.0%) | 179 (100.0%) |
Real Estate & Mortgages in Solon
Real Estate and Mortgage Overview in Solon
| Characteristic | Without Mortgage | With Mortgage |
| Housing Units | 272 | 583 |
| Median Property Value | $261,900 | $303,400 |
| Median Household Income | $76,653 | $230 |
| Monthly Housing Costs | $655 | $60 |
| Real Estate Taxes | $3,880 | $0 |
Property Value by Mortgage Status in Solon
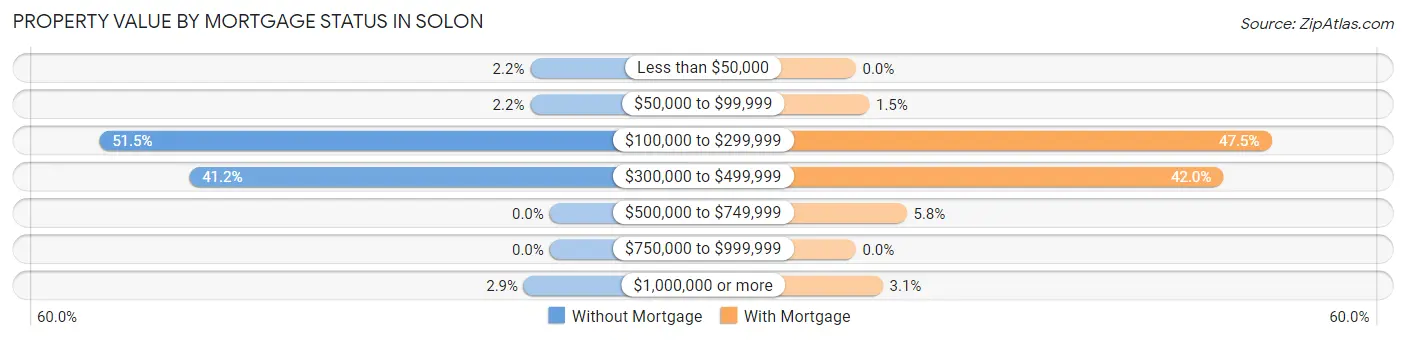
| Property Value | Without Mortgage | With Mortgage |
| Less than $50,000 | 6 (2.2%) | 0 (0.0%) |
| $50,000 to $99,999 | 6 (2.2%) | 9 (1.5%) |
| $100,000 to $299,999 | 140 (51.5%) | 277 (47.5%) |
| $300,000 to $499,999 | 112 (41.2%) | 245 (42.0%) |
| $500,000 to $749,999 | 0 (0.0%) | 34 (5.8%) |
| $750,000 to $999,999 | 0 (0.0%) | 0 (0.0%) |
| $1,000,000 or more | 8 (2.9%) | 18 (3.1%) |
| Total | 272 (100.0%) | 583 (100.0%) |
Household Income by Mortgage Status in Solon
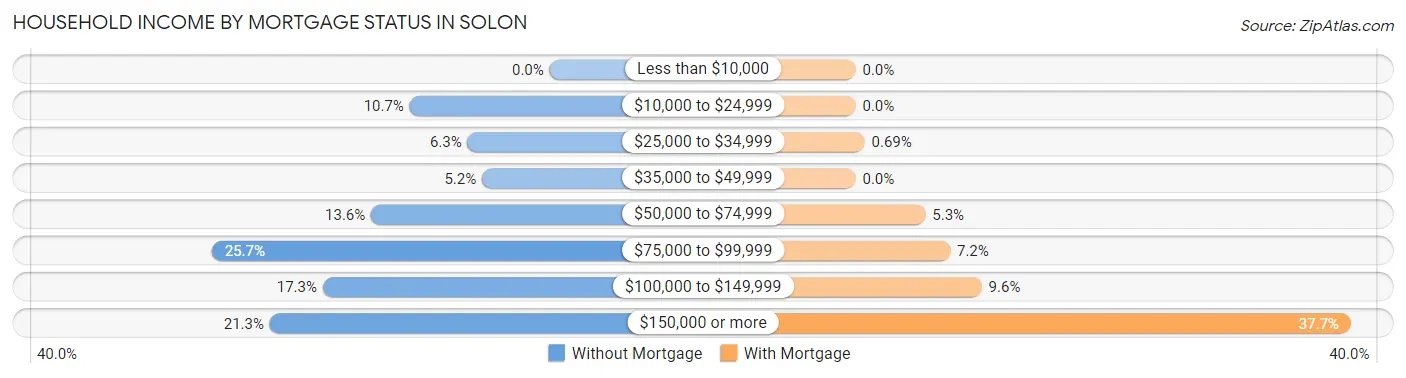
| Household Income | Without Mortgage | With Mortgage |
| Less than $10,000 | 0 (0.0%) | 0 (0.0%) |
| $10,000 to $24,999 | 29 (10.7%) | 0 (0.0%) |
| $25,000 to $34,999 | 17 (6.2%) | 4 (0.7%) |
| $35,000 to $49,999 | 14 (5.1%) | 0 (0.0%) |
| $50,000 to $74,999 | 37 (13.6%) | 31 (5.3%) |
| $75,000 to $99,999 | 70 (25.7%) | 42 (7.2%) |
| $100,000 to $149,999 | 47 (17.3%) | 56 (9.6%) |
| $150,000 or more | 58 (21.3%) | 220 (37.7%) |
| Total | 272 (100.0%) | 583 (100.0%) |
Property Value to Household Income Ratio in Solon
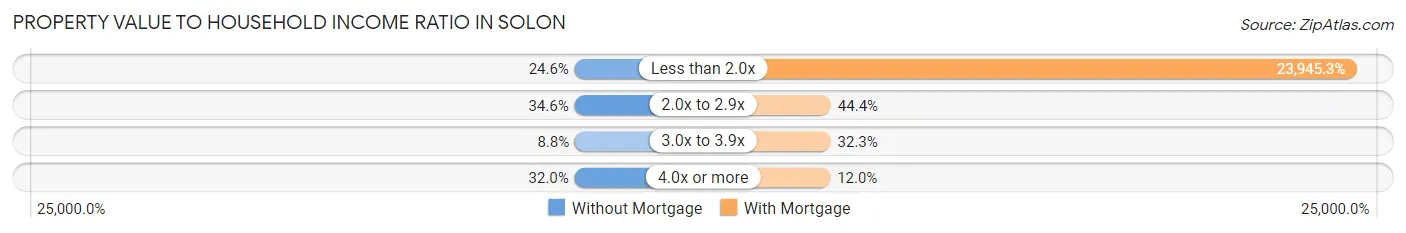
| Value-to-Income Ratio | Without Mortgage | With Mortgage |
| Less than 2.0x | 67 (24.6%) | 139,601 (23,945.3%) |
| 2.0x to 2.9x | 94 (34.6%) | 259 (44.4%) |
| 3.0x to 3.9x | 24 (8.8%) | 188 (32.3%) |
| 4.0x or more | 87 (32.0%) | 70 (12.0%) |
| Total | 272 (100.0%) | 583 (100.0%) |
Real Estate Taxes by Mortgage Status in Solon
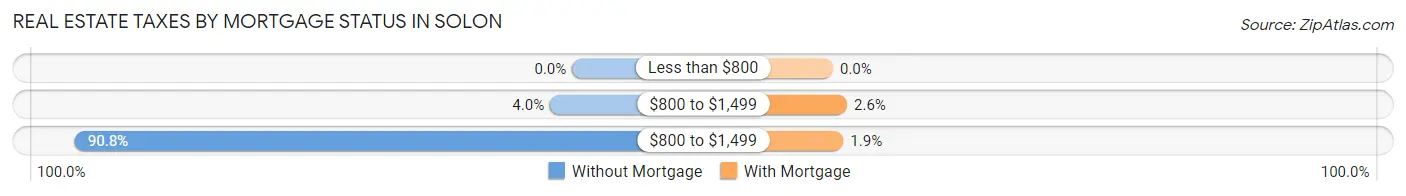
| Property Taxes | Without Mortgage | With Mortgage |
| Less than $800 | 0 (0.0%) | 0 (0.0%) |
| $800 to $1,499 | 11 (4.0%) | 15 (2.6%) |
| $800 to $1,499 | 247 (90.8%) | 11 (1.9%) |
| Total | 272 (100.0%) | 583 (100.0%) |
Health & Disability in Solon
Health Insurance Coverage by Age in Solon
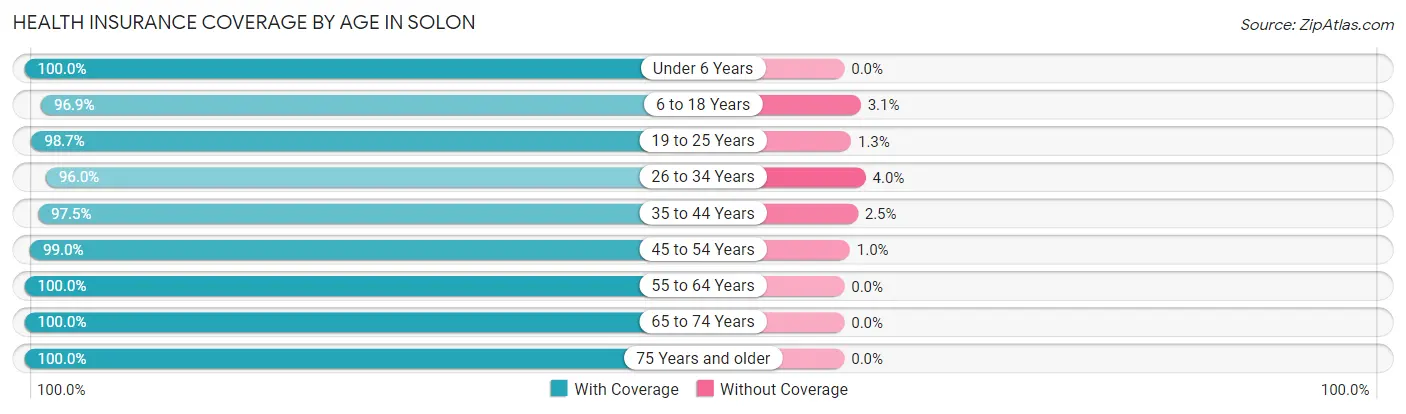
| Age Bracket | With Coverage | Without Coverage |
| Under 6 Years | 169 (100.0%) | 0 (0.0%) |
| 6 to 18 Years | 757 (96.9%) | 24 (3.1%) |
| 19 to 25 Years | 314 (98.7%) | 4 (1.3%) |
| 26 to 34 Years | 169 (96.0%) | 7 (4.0%) |
| 35 to 44 Years | 425 (97.5%) | 11 (2.5%) |
| 45 to 54 Years | 381 (99.0%) | 4 (1.0%) |
| 55 to 64 Years | 295 (100.0%) | 0 (0.0%) |
| 65 to 74 Years | 211 (100.0%) | 0 (0.0%) |
| 75 Years and older | 165 (100.0%) | 0 (0.0%) |
| Total | 2,886 (98.3%) | 50 (1.7%) |
Health Insurance Coverage by Citizenship Status in Solon
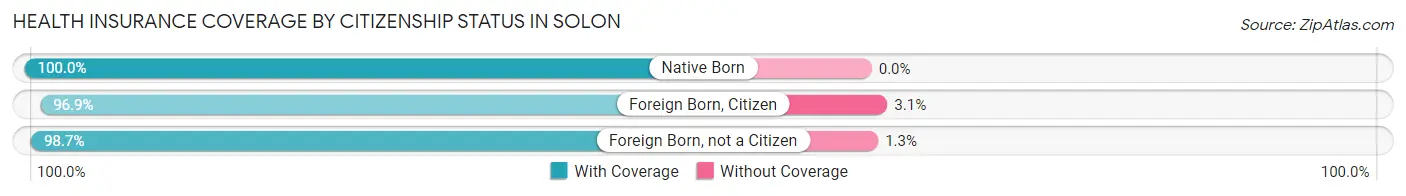
| Citizenship Status | With Coverage | Without Coverage |
| Native Born | 169 (100.0%) | 0 (0.0%) |
| Foreign Born, Citizen | 757 (96.9%) | 24 (3.1%) |
| Foreign Born, not a Citizen | 314 (98.7%) | 4 (1.3%) |
Health Insurance Coverage by Household Income in Solon
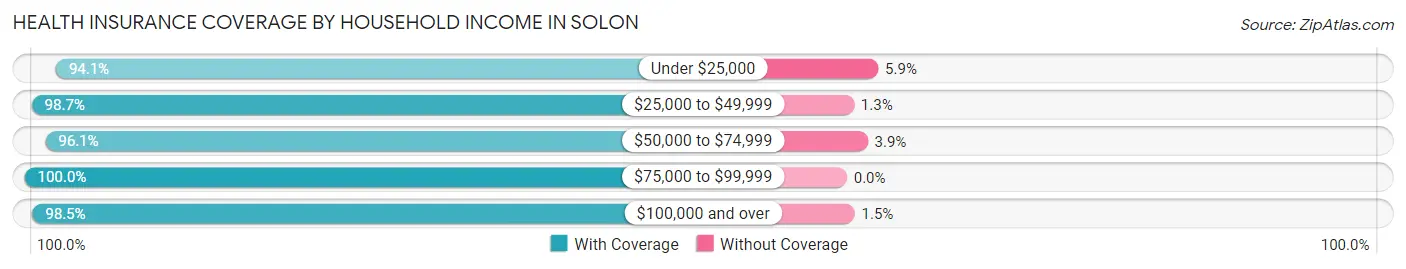
| Household Income | With Coverage | Without Coverage |
| Under $25,000 | 112 (94.1%) | 7 (5.9%) |
| $25,000 to $49,999 | 296 (98.7%) | 4 (1.3%) |
| $50,000 to $74,999 | 271 (96.1%) | 11 (3.9%) |
| $75,000 to $99,999 | 321 (100.0%) | 0 (0.0%) |
| $100,000 and over | 1,886 (98.5%) | 28 (1.5%) |
Public vs Private Health Insurance Coverage by Age in Solon
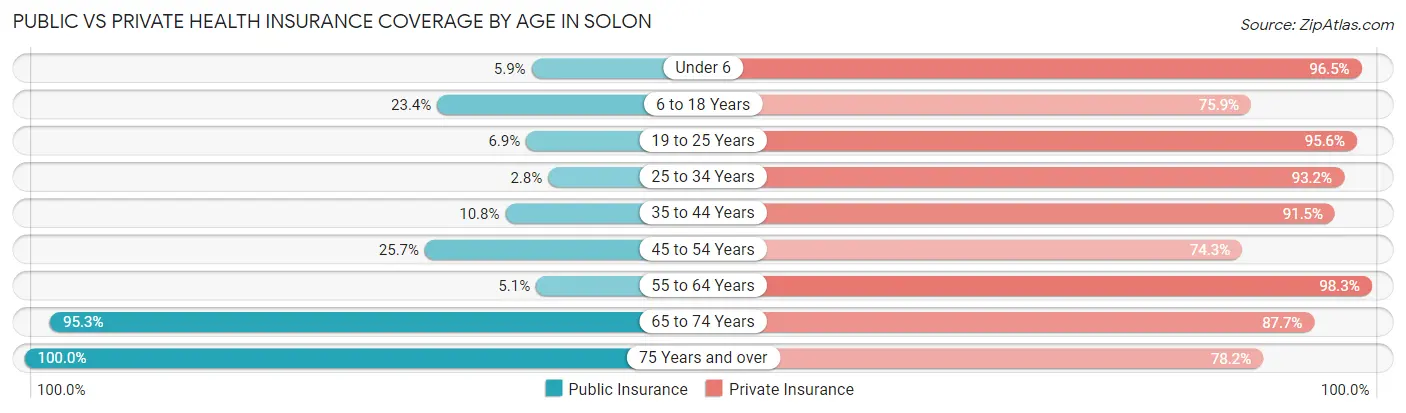
| Age Bracket | Public Insurance | Private Insurance |
| Under 6 | 10 (5.9%) | 163 (96.5%) |
| 6 to 18 Years | 183 (23.4%) | 593 (75.9%) |
| 19 to 25 Years | 22 (6.9%) | 304 (95.6%) |
| 25 to 34 Years | 5 (2.8%) | 164 (93.2%) |
| 35 to 44 Years | 47 (10.8%) | 399 (91.5%) |
| 45 to 54 Years | 99 (25.7%) | 286 (74.3%) |
| 55 to 64 Years | 15 (5.1%) | 290 (98.3%) |
| 65 to 74 Years | 201 (95.3%) | 185 (87.7%) |
| 75 Years and over | 165 (100.0%) | 129 (78.2%) |
| Total | 747 (25.4%) | 2,513 (85.6%) |
Disability Status by Sex by Age in Solon
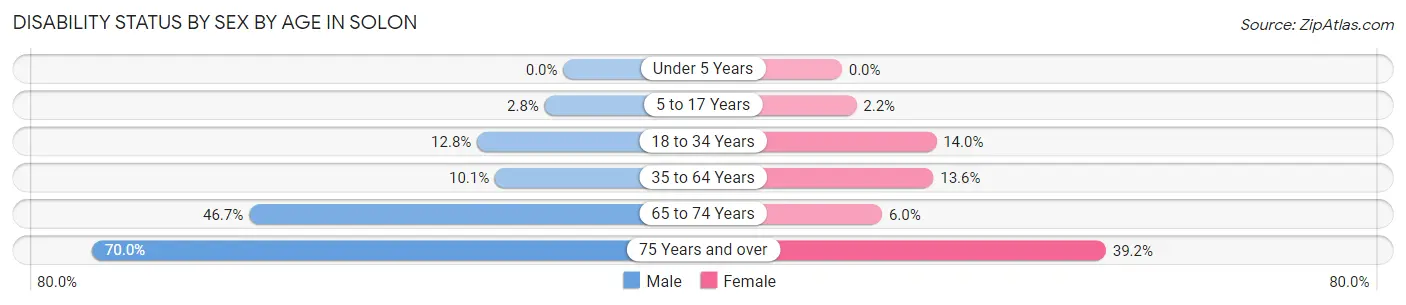
| Age Bracket | Male | Female |
| Under 5 Years | 0 (0.0%) | 0 (0.0%) |
| 5 to 17 Years | 9 (2.8%) | 10 (2.2%) |
| 18 to 34 Years | 32 (12.8%) | 37 (14.0%) |
| 35 to 64 Years | 49 (10.1%) | 86 (13.6%) |
| 65 to 74 Years | 28 (46.7%) | 9 (6.0%) |
| 75 Years and over | 28 (70.0%) | 49 (39.2%) |
Disability Class by Sex by Age in Solon
Disability Class: Hearing Difficulty
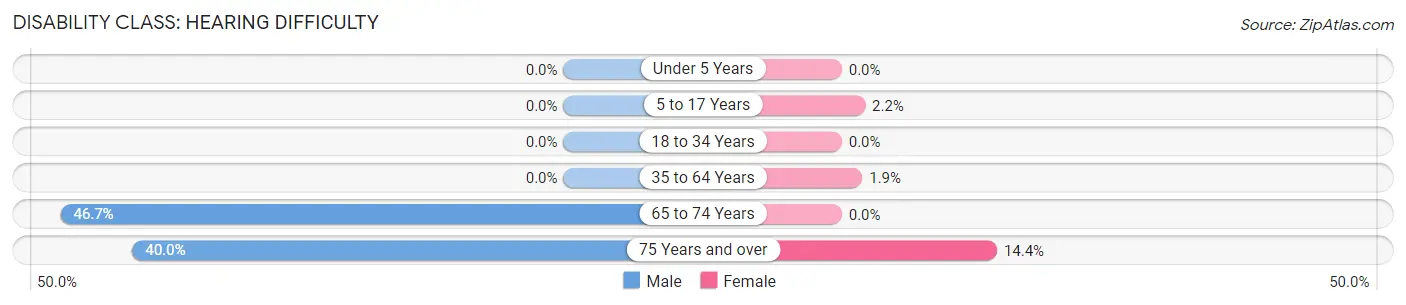
| Age Bracket | Male | Female |
| Under 5 Years | 0 (0.0%) | 0 (0.0%) |
| 5 to 17 Years | 0 (0.0%) | 10 (2.2%) |
| 18 to 34 Years | 0 (0.0%) | 0 (0.0%) |
| 35 to 64 Years | 0 (0.0%) | 12 (1.9%) |
| 65 to 74 Years | 28 (46.7%) | 0 (0.0%) |
| 75 Years and over | 16 (40.0%) | 18 (14.4%) |
Disability Class: Vision Difficulty
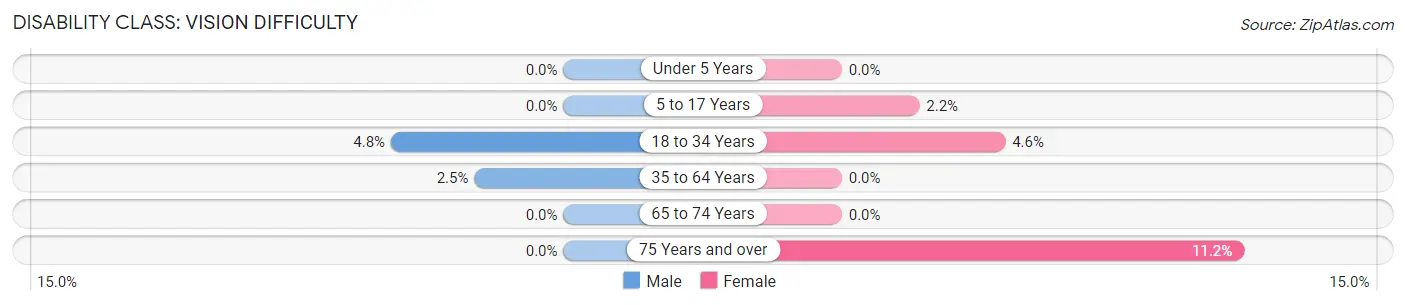
| Age Bracket | Male | Female |
| Under 5 Years | 0 (0.0%) | 0 (0.0%) |
| 5 to 17 Years | 0 (0.0%) | 10 (2.2%) |
| 18 to 34 Years | 12 (4.8%) | 12 (4.5%) |
| 35 to 64 Years | 12 (2.5%) | 0 (0.0%) |
| 65 to 74 Years | 0 (0.0%) | 0 (0.0%) |
| 75 Years and over | 0 (0.0%) | 14 (11.2%) |
Disability Class: Cognitive Difficulty
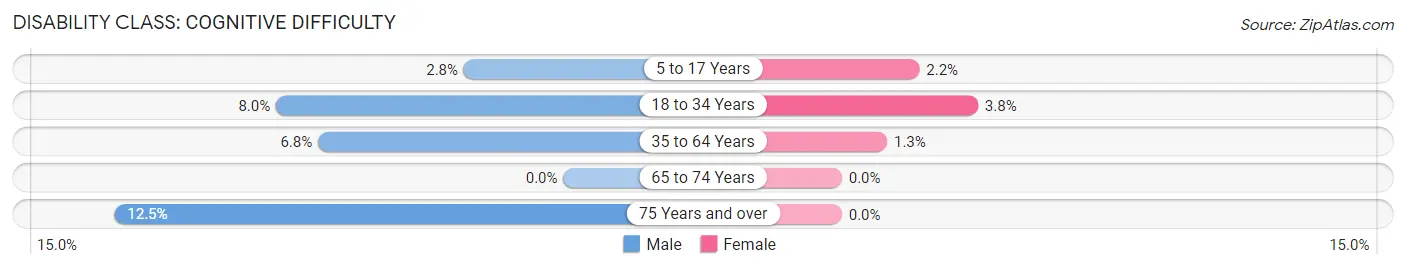
| Age Bracket | Male | Female |
| 5 to 17 Years | 9 (2.8%) | 10 (2.2%) |
| 18 to 34 Years | 20 (8.0%) | 10 (3.8%) |
| 35 to 64 Years | 33 (6.8%) | 8 (1.3%) |
| 65 to 74 Years | 0 (0.0%) | 0 (0.0%) |
| 75 Years and over | 5 (12.5%) | 0 (0.0%) |
Disability Class: Ambulatory Difficulty
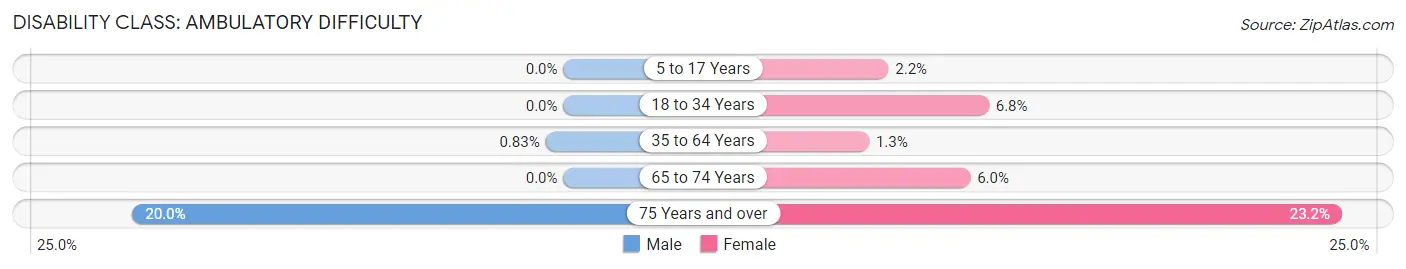
| Age Bracket | Male | Female |
| 5 to 17 Years | 0 (0.0%) | 10 (2.2%) |
| 18 to 34 Years | 0 (0.0%) | 18 (6.8%) |
| 35 to 64 Years | 4 (0.8%) | 8 (1.3%) |
| 65 to 74 Years | 0 (0.0%) | 9 (6.0%) |
| 75 Years and over | 8 (20.0%) | 29 (23.2%) |
Disability Class: Self-Care Difficulty
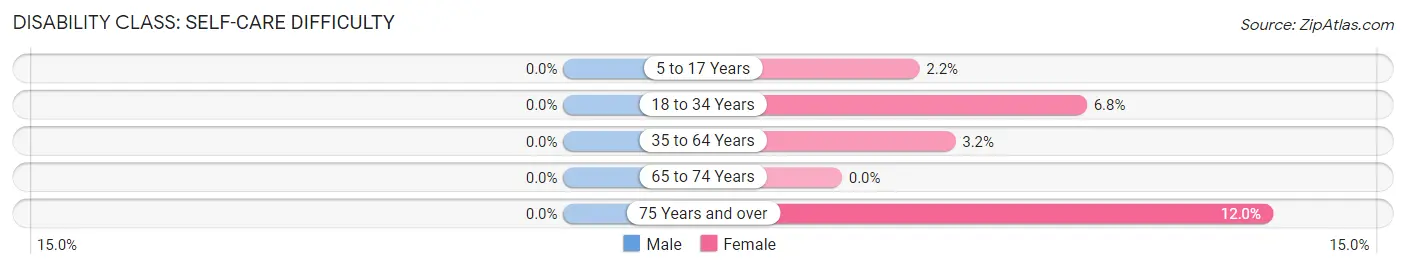
| Age Bracket | Male | Female |
| 5 to 17 Years | 0 (0.0%) | 10 (2.2%) |
| 18 to 34 Years | 0 (0.0%) | 18 (6.8%) |
| 35 to 64 Years | 0 (0.0%) | 20 (3.2%) |
| 65 to 74 Years | 0 (0.0%) | 0 (0.0%) |
| 75 Years and over | 0 (0.0%) | 15 (12.0%) |
Technology Access in Solon
Computing Device Access in Solon
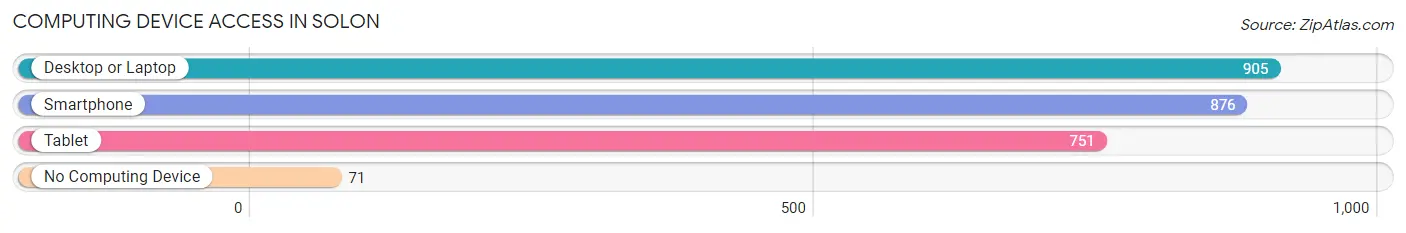
| Device Type | # Households | % Households |
| Desktop or Laptop | 905 | 87.5% |
| Smartphone | 876 | 84.7% |
| Tablet | 751 | 72.6% |
| No Computing Device | 71 | 6.9% |
| Total | 1,034 | 100.0% |
Internet Access in Solon
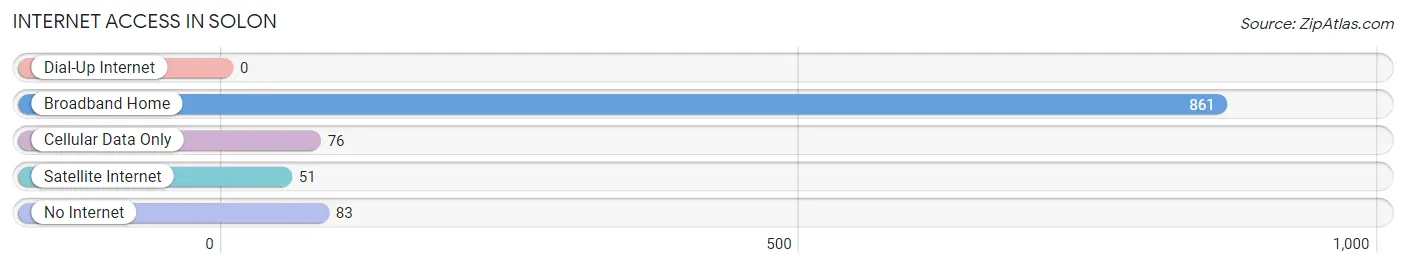
| Internet Type | # Households | % Households |
| Dial-Up Internet | 0 | 0.0% |
| Broadband Home | 861 | 83.3% |
| Cellular Data Only | 76 | 7.3% |
| Satellite Internet | 51 | 4.9% |
| No Internet | 83 | 8.0% |
| Total | 1,034 | 100.0% |
Solon Summary
Solon, Iowa is a small city located in Johnson County, Iowa. It is situated on the banks of the Iowa River and is part of the Iowa City Metropolitan Statistical Area. The city has a population of approximately 3,000 people and is known for its small-town charm and rural atmosphere.
History
Solon was founded in 1855 by a group of settlers from New England. The town was named after the Greek statesman Solon, who was known for his wisdom and justice. The settlers were attracted to the area due to its fertile soil and abundant natural resources. The first settlers built a sawmill and gristmill, which provided the town with its first industry.
In 1856, the first post office was established in Solon. The town was incorporated in 1858 and the first mayor was elected in 1859. The town grew steadily throughout the 19th century, and by the turn of the century, it had become a thriving agricultural community.
Geography
Solon is located in Johnson County, Iowa, approximately 20 miles south of Iowa City. The city is situated on the banks of the Iowa River and is surrounded by rolling hills and farmland. The city has a total area of 2.2 square miles, all of which is land.
The climate in Solon is typical of the Midwest, with hot summers and cold winters. The average temperature in the summer is around 75 degrees Fahrenheit, while the average temperature in the winter is around 25 degrees Fahrenheit.
Economy
Solon’s economy is largely based on agriculture. The city is home to several large farms, which produce corn, soybeans, and other crops. The city also has a number of small businesses, including restaurants, retail stores, and service providers.
The city is also home to several manufacturing companies, including a plastics manufacturer and a metal fabrication company. The city is also home to a number of technology companies, including a software development firm and a web design firm.
Demographics
As of the 2010 census, the population of Solon was 3,000. The racial makeup of the city was 97.2% White, 0.7% African American, 0.3% Native American, 0.3% Asian, 0.1% Pacific Islander, and 1.4% from other races. The median household income was $50,000, and the median family income was $60,000.
Solon is a small city with a rural atmosphere and a strong sense of community. The city is home to a number of churches, schools, and other organizations that help to create a strong sense of community. The city is also home to a number of parks and recreational facilities, which provide residents with a variety of activities and entertainment options.
Common Questions
What is Per Capita Income in Solon?
Per Capita income in Solon is $41,158.
What is the Median Family Income in Solon?
Median Family Income in Solon is $137,546.
What is the Median Household income in Solon?
Median Household Income in Solon is $114,936.
What is Income or Wage Gap in Solon?
Income or Wage Gap in Solon is 51.4%.
Women in Solon earn 48.6 cents for every dollar earned by a man.
What is Inequality or Gini Index in Solon?
Inequality or Gini Index in Solon is 0.33.
What is the Total Population of Solon?
Total Population of Solon is 3,020.
What is the Total Male Population of Solon?
Total Male Population of Solon is 1,261.
What is the Total Female Population of Solon?
Total Female Population of Solon is 1,759.
What is the Ratio of Males per 100 Females in Solon?
There are 71.69 Males per 100 Females in Solon.
What is the Ratio of Females per 100 Males in Solon?
There are 139.49 Females per 100 Males in Solon.
What is the Median Population Age in Solon?
Median Population Age in Solon is 36.8 Years.
What is the Average Family Size in Solon
Average Family Size in Solon is 3.4 People.
What is the Average Household Size in Solon
Average Household Size in Solon is 2.8 People.
How Large is the Labor Force in Solon?
There are 1,693 People in the Labor Forcein in Solon.
What is the Percentage of People in the Labor Force in Solon?
74.0% of People are in the Labor Force in Solon.
What is the Unemployment Rate in Solon?
Unemployment Rate in Solon is 1.2%.