Mount Vernon, IA Map & Demographics
Mount Vernon Map
Mount Vernon Overview
$31,147
PER CAPITA INCOME
$107,078
AVG FAMILY INCOME
$98,991
AVG HOUSEHOLD INCOME
14.4%
WAGE / INCOME GAP [ % ]
85.6¢/ $1
WAGE / INCOME GAP [ $ ]
0.44
INEQUALITY / GINI INDEX
4,529
TOTAL POPULATION
2,053
MALE POPULATION
2,476
FEMALE POPULATION
82.92
MALES / 100 FEMALES
120.60
FEMALES / 100 MALES
21.3
MEDIAN AGE
3.6
AVG FAMILY SIZE
3.0
AVG HOUSEHOLD SIZE
2,171
LABOR FORCE [ PEOPLE ]
62.2%
PERCENT IN LABOR FORCE
4.9%
UNEMPLOYMENT RATE
Mount Vernon Zip Codes
Mount Vernon Area Codes
Income in Mount Vernon
Income Overview in Mount Vernon
Per Capita Income in Mount Vernon is $31,147, while median incomes of families and households are $107,078 and $98,991 respectively.
| Characteristic | Number | Measure |
| Per Capita Income | 4,529 | $31,147 |
| Median Family Income | 886 | $107,078 |
| Mean Family Income | 886 | $141,955 |
| Median Household Income | 1,158 | $98,991 |
| Mean Household Income | 1,158 | $116,155 |
| Income Deficit | 886 | $0 |
| Wage / Income Gap (%) | 4,529 | 14.45% |
| Wage / Income Gap ($) | 4,529 | 85.55¢ per $1 |
| Gini / Inequality Index | 4,529 | 0.44 |
Earnings by Sex in Mount Vernon
Average Earnings in Mount Vernon are $29,230, $32,575 for men and $27,868 for women, a difference of 14.4%.
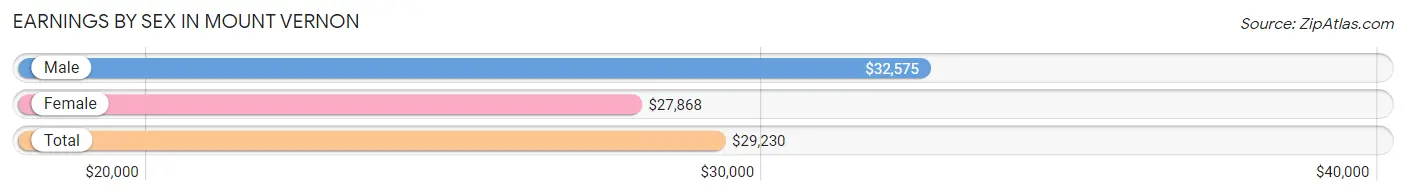
| Sex | Number | Average Earnings |
| Male | 1,237 (46.8%) | $32,575 |
| Female | 1,406 (53.2%) | $27,868 |
| Total | 2,643 (100.0%) | $29,230 |
Earnings by Sex by Income Bracket in Mount Vernon
The most common earnings brackets in Mount Vernon are $100,000+ for men (183 | 14.8%) and $2,500 to $4,999 for women (193 | 13.7%).
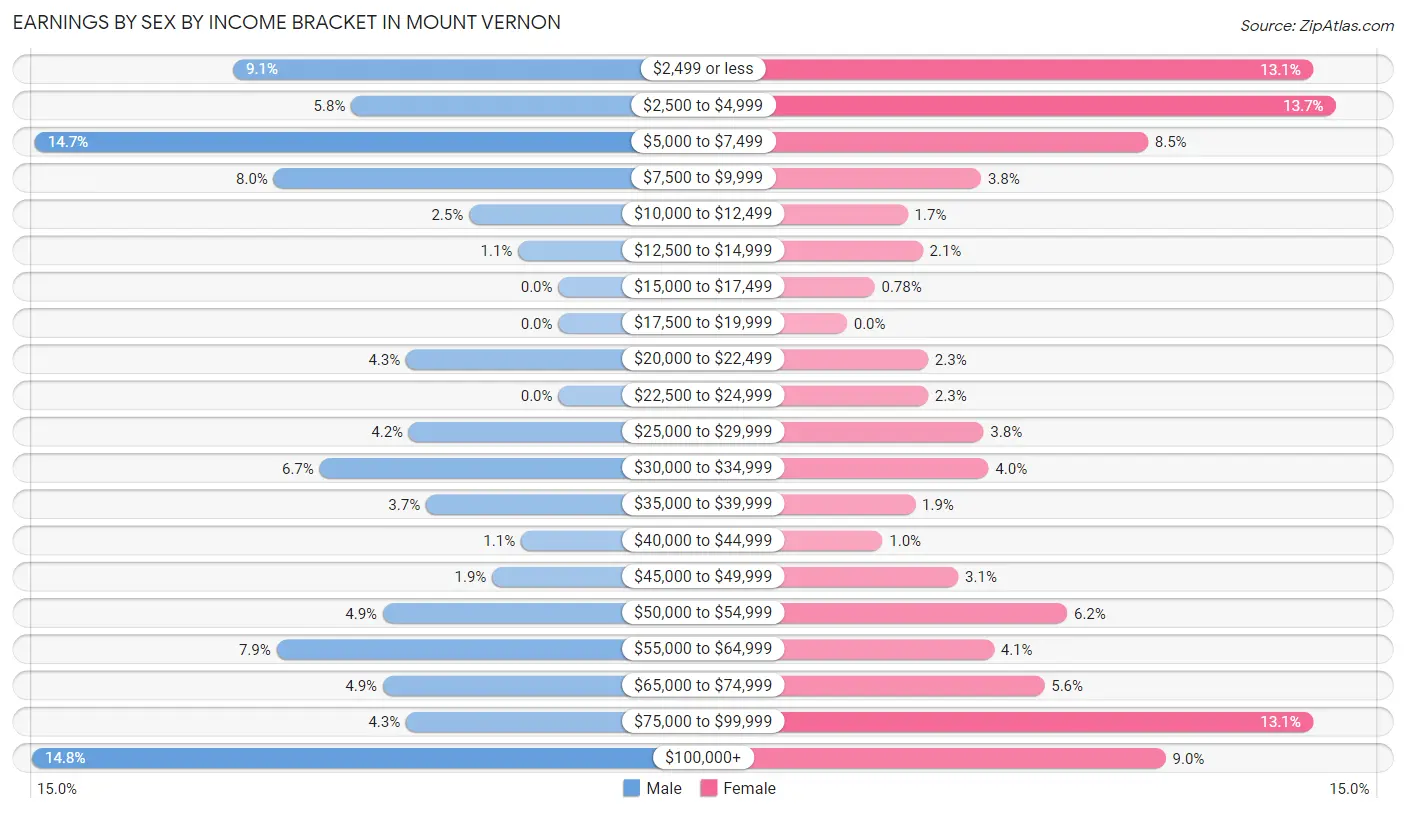
| Income | Male | Female |
| $2,499 or less | 113 (9.1%) | 184 (13.1%) |
| $2,500 to $4,999 | 72 (5.8%) | 193 (13.7%) |
| $5,000 to $7,499 | 182 (14.7%) | 119 (8.5%) |
| $7,500 to $9,999 | 99 (8.0%) | 53 (3.8%) |
| $10,000 to $12,499 | 31 (2.5%) | 24 (1.7%) |
| $12,500 to $14,999 | 14 (1.1%) | 30 (2.1%) |
| $15,000 to $17,499 | 0 (0.0%) | 11 (0.8%) |
| $17,500 to $19,999 | 0 (0.0%) | 0 (0.0%) |
| $20,000 to $22,499 | 53 (4.3%) | 32 (2.3%) |
| $22,500 to $24,999 | 0 (0.0%) | 32 (2.3%) |
| $25,000 to $29,999 | 52 (4.2%) | 54 (3.8%) |
| $30,000 to $34,999 | 83 (6.7%) | 56 (4.0%) |
| $35,000 to $39,999 | 46 (3.7%) | 27 (1.9%) |
| $40,000 to $44,999 | 13 (1.1%) | 14 (1.0%) |
| $45,000 to $49,999 | 23 (1.9%) | 44 (3.1%) |
| $50,000 to $54,999 | 61 (4.9%) | 87 (6.2%) |
| $55,000 to $64,999 | 98 (7.9%) | 58 (4.1%) |
| $65,000 to $74,999 | 61 (4.9%) | 78 (5.6%) |
| $75,000 to $99,999 | 53 (4.3%) | 184 (13.1%) |
| $100,000+ | 183 (14.8%) | 126 (9.0%) |
| Total | 1,237 (100.0%) | 1,406 (100.0%) |
Earnings by Sex by Educational Attainment in Mount Vernon
Average earnings in Mount Vernon are $51,680 for men and $58,491 for women, a difference of 11.6%. Men with an educational attainment of graduate degree enjoy the highest average annual earnings of $112,045, while those with bachelor's degree education earn the least with $33,661. Women with an educational attainment of graduate degree earn the most with the average annual earnings of $84,559, while those with high school diploma education have the smallest earnings of $34,482.
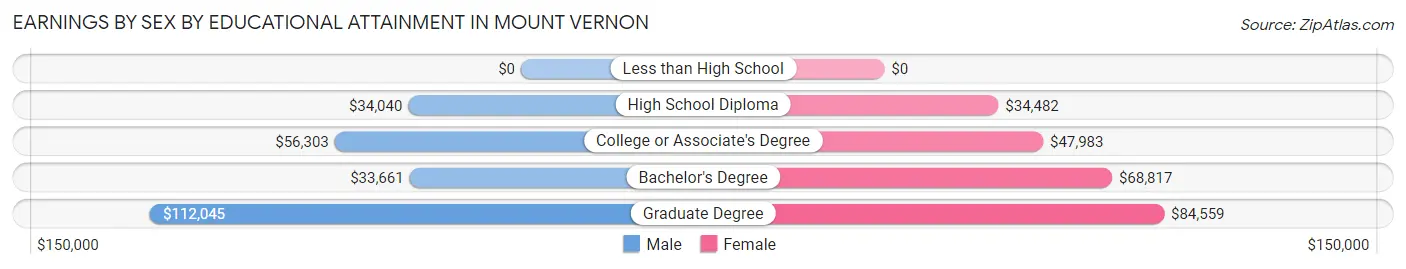
| Educational Attainment | Male Income | Female Income |
| Less than High School | - | - |
| High School Diploma | $34,040 | $34,482 |
| College or Associate's Degree | $56,303 | $47,983 |
| Bachelor's Degree | $33,661 | $68,817 |
| Graduate Degree | $112,045 | $84,559 |
| Total | $51,680 | $58,491 |
Family Income in Mount Vernon
Family Income Brackets in Mount Vernon
According to the Mount Vernon family income data, there are 324 families falling into the $100,000 to $149,999 income range, which is the most common income bracket and makes up 36.6% of all families.
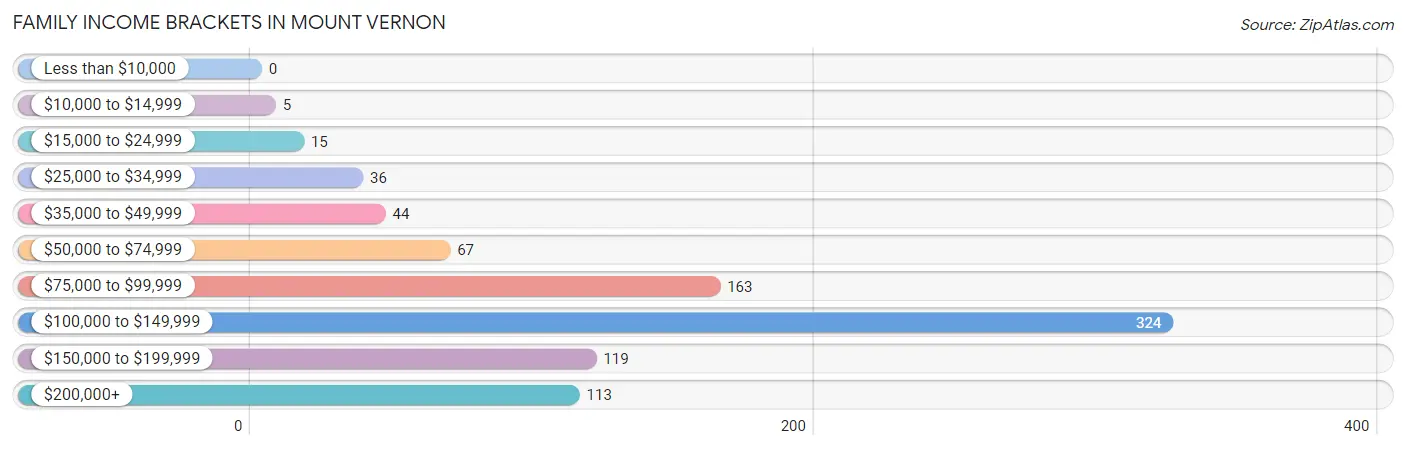
| Income Bracket | # Families | % Families |
| Less than $10,000 | 0 | 0.0% |
| $10,000 to $14,999 | 5 | 0.6% |
| $15,000 to $24,999 | 15 | 1.7% |
| $25,000 to $34,999 | 36 | 4.1% |
| $35,000 to $49,999 | 44 | 5.0% |
| $50,000 to $74,999 | 67 | 7.6% |
| $75,000 to $99,999 | 163 | 18.4% |
| $100,000 to $149,999 | 324 | 36.6% |
| $150,000 to $199,999 | 119 | 13.4% |
| $200,000+ | 113 | 12.8% |
Family Income by Famaliy Size in Mount Vernon
4-person families (117 | 13.2%) account for the highest median family income in Mount Vernon with $131,635 per family, while 2-person families (327 | 36.9%) have the highest median income of $49,262 per family member.

| Income Bracket | # Families | Median Income |
| 2-Person Families | 327 (36.9%) | $98,523 |
| 3-Person Families | 152 (17.2%) | $106,486 |
| 4-Person Families | 117 (13.2%) | $131,635 |
| 5-Person Families | 251 (28.3%) | $129,263 |
| 6-Person Families | 18 (2.0%) | $0 |
| 7+ Person Families | 21 (2.4%) | $0 |
| Total | 886 (100.0%) | $107,078 |
Family Income by Number of Earners in Mount Vernon
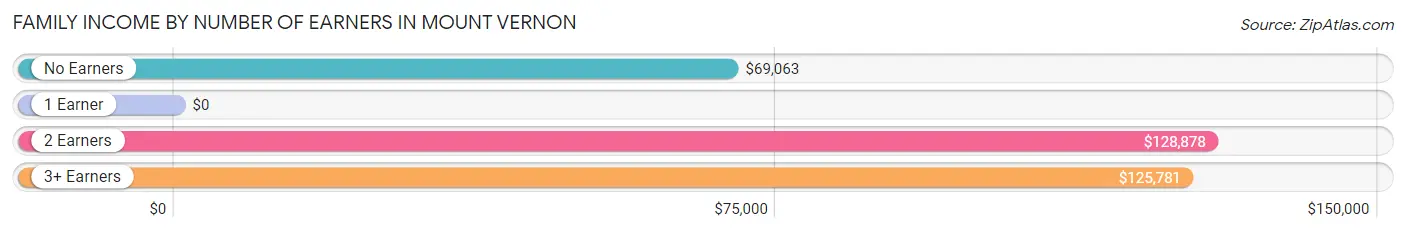
| Number of Earners | # Families | Median Income |
| No Earners | 85 (9.6%) | $69,063 |
| 1 Earner | 143 (16.1%) | $0 |
| 2 Earners | 489 (55.2%) | $128,878 |
| 3+ Earners | 169 (19.1%) | $125,781 |
| Total | 886 (100.0%) | $107,078 |
Household Income in Mount Vernon
Household Income Brackets in Mount Vernon
With 324 households falling in the category, the $100,000 to $149,999 income range is the most frequent in Mount Vernon, accounting for 28.0% of all households. In contrast, only 14 households (1.2%) fall into the less than $10,000 income bracket, making it the least populous group.
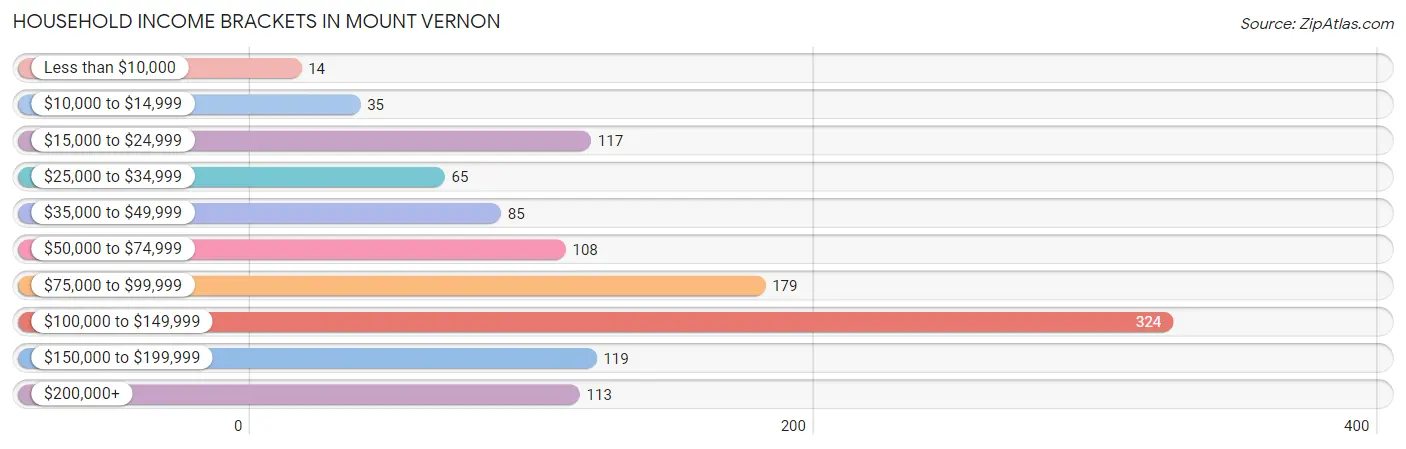
| Income Bracket | # Households | % Households |
| Less than $10,000 | 14 | 1.2% |
| $10,000 to $14,999 | 35 | 3.0% |
| $15,000 to $24,999 | 117 | 10.1% |
| $25,000 to $34,999 | 65 | 5.6% |
| $35,000 to $49,999 | 85 | 7.3% |
| $50,000 to $74,999 | 108 | 9.3% |
| $75,000 to $99,999 | 179 | 15.5% |
| $100,000 to $149,999 | 324 | 28.0% |
| $150,000 to $199,999 | 119 | 10.3% |
| $200,000+ | 113 | 9.8% |
Household Income by Householder Age in Mount Vernon
The median household income in Mount Vernon is $98,991, with the highest median household income of $106,943 found in the 45 to 64 years age bracket for the primary householder. A total of 499 households (43.1%) fall into this category.
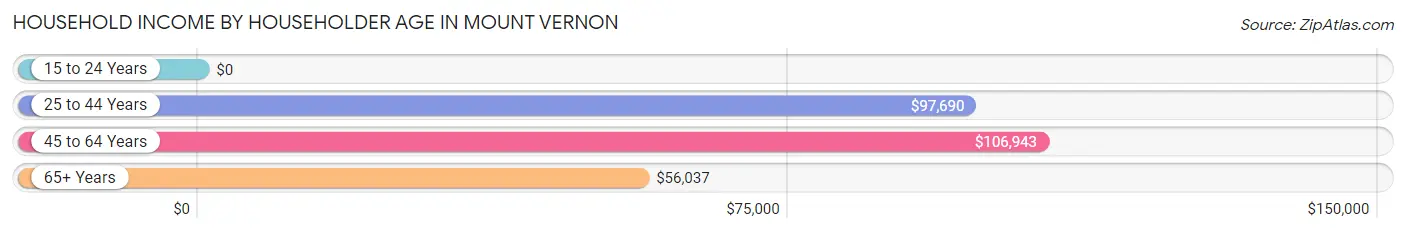
| Income Bracket | # Households | Median Income |
| 15 to 24 Years | 0 (0.0%) | $0 |
| 25 to 44 Years | 453 (39.1%) | $97,690 |
| 45 to 64 Years | 499 (43.1%) | $106,943 |
| 65+ Years | 206 (17.8%) | $56,037 |
| Total | 1,158 (100.0%) | $98,991 |
Poverty in Mount Vernon
Income Below Poverty by Sex and Age in Mount Vernon
With 7.1% poverty level for males and 5.4% for females among the residents of Mount Vernon, under 5 year old males and 15 year old females are the most vulnerable to poverty, with 33 males (27.1%) and 28 females (36.4%) in their respective age groups living below the poverty level.
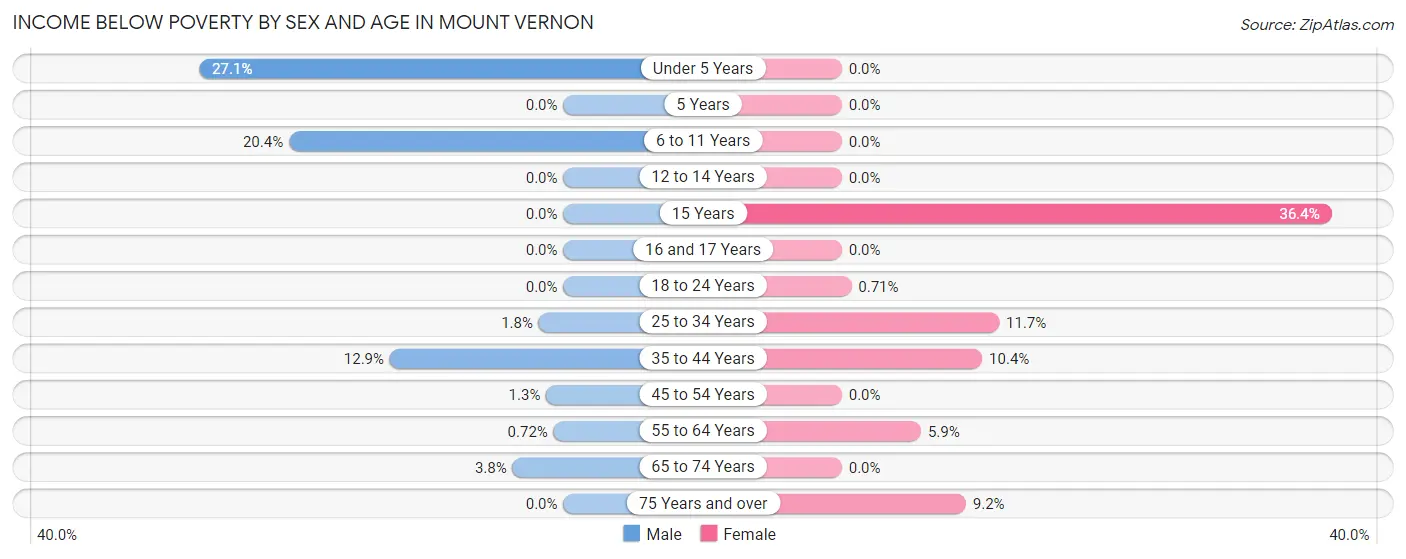
| Age Bracket | Male | Female |
| Under 5 Years | 33 (27.1%) | 0 (0.0%) |
| 5 Years | 0 (0.0%) | 0 (0.0%) |
| 6 to 11 Years | 33 (20.4%) | 0 (0.0%) |
| 12 to 14 Years | 0 (0.0%) | 0 (0.0%) |
| 15 Years | 0 (0.0%) | 28 (36.4%) |
| 16 and 17 Years | 0 (0.0%) | 0 (0.0%) |
| 18 to 24 Years | 0 (0.0%) | 1 (0.7%) |
| 25 to 34 Years | 2 (1.8%) | 16 (11.7%) |
| 35 to 44 Years | 38 (12.9%) | 32 (10.4%) |
| 45 to 54 Years | 2 (1.3%) | 0 (0.0%) |
| 55 to 64 Years | 2 (0.7%) | 14 (5.9%) |
| 65 to 74 Years | 2 (3.8%) | 0 (0.0%) |
| 75 Years and over | 0 (0.0%) | 14 (9.2%) |
| Total | 112 (7.1%) | 105 (5.4%) |
Income Above Poverty by Sex and Age in Mount Vernon
According to the poverty statistics in Mount Vernon, males aged 5 years and females aged under 5 years are the age groups that are most secure financially, with 100.0% of males and 100.0% of females in these age groups living above the poverty line.
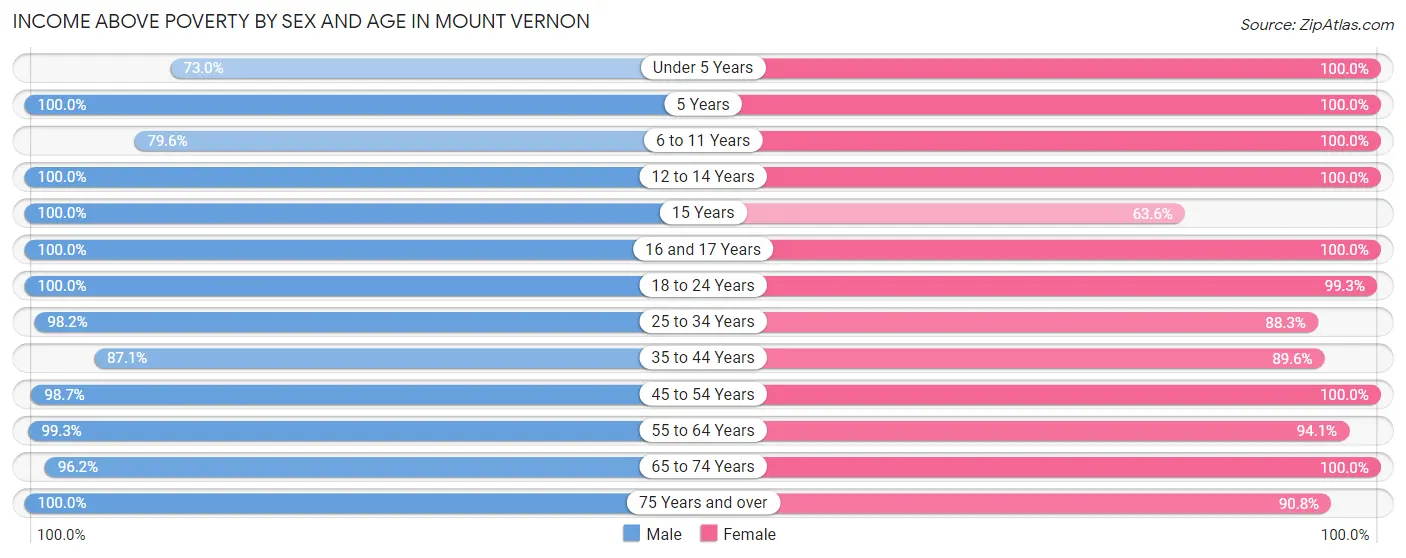
| Age Bracket | Male | Female |
| Under 5 Years | 89 (73.0%) | 29 (100.0%) |
| 5 Years | 10 (100.0%) | 29 (100.0%) |
| 6 to 11 Years | 129 (79.6%) | 225 (100.0%) |
| 12 to 14 Years | 186 (100.0%) | 176 (100.0%) |
| 15 Years | 23 (100.0%) | 49 (63.6%) |
| 16 and 17 Years | 96 (100.0%) | 128 (100.0%) |
| 18 to 24 Years | 35 (100.0%) | 139 (99.3%) |
| 25 to 34 Years | 108 (98.2%) | 121 (88.3%) |
| 35 to 44 Years | 257 (87.1%) | 275 (89.6%) |
| 45 to 54 Years | 155 (98.7%) | 181 (100.0%) |
| 55 to 64 Years | 274 (99.3%) | 224 (94.1%) |
| 65 to 74 Years | 51 (96.2%) | 114 (100.0%) |
| 75 Years and over | 57 (100.0%) | 138 (90.8%) |
| Total | 1,470 (92.9%) | 1,828 (94.6%) |
Income Below Poverty Among Married-Couple Families in Mount Vernon
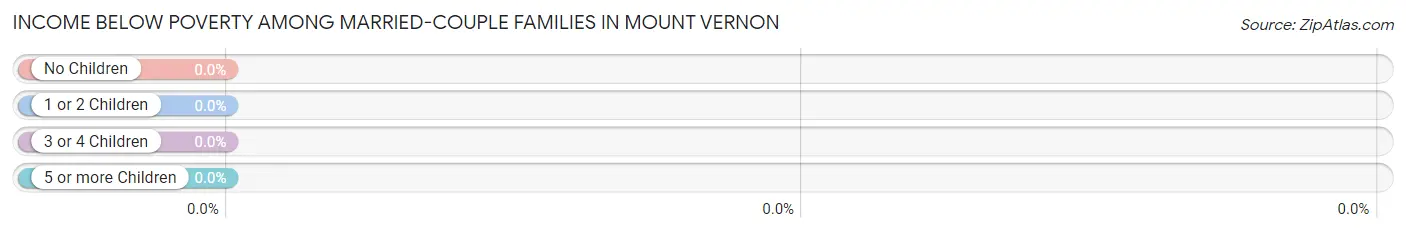
| Children | Above Poverty | Below Poverty |
| No Children | 304 (100.0%) | 0 (0.0%) |
| 1 or 2 Children | 205 (100.0%) | 0 (0.0%) |
| 3 or 4 Children | 204 (100.0%) | 0 (0.0%) |
| 5 or more Children | 8 (100.0%) | 0 (0.0%) |
| Total | 721 (100.0%) | 0 (0.0%) |
Income Below Poverty Among Single-Parent Households in Mount Vernon
According to the poverty data in Mount Vernon, 70.6% or 36 single-father households and 4.4% or 5 single-mother households are living below the poverty line. Among single-father households, those with 3 or 4 children have the highest poverty rate, with 36 households (100.0%) experiencing poverty. Likewise, among single-mother households, those with no children have the highest poverty rate, with 5 households (26.3%) falling below the poverty line.
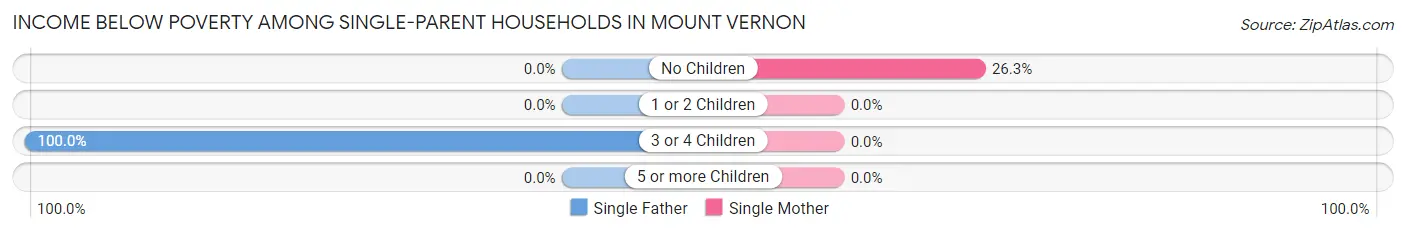
| Children | Single Father | Single Mother |
| No Children | 0 (0.0%) | 5 (26.3%) |
| 1 or 2 Children | 0 (0.0%) | 0 (0.0%) |
| 3 or 4 Children | 36 (100.0%) | 0 (0.0%) |
| 5 or more Children | 0 (0.0%) | 0 (0.0%) |
| Total | 36 (70.6%) | 5 (4.4%) |
Income Below Poverty Among Married-Couple vs Single-Parent Households in Mount Vernon
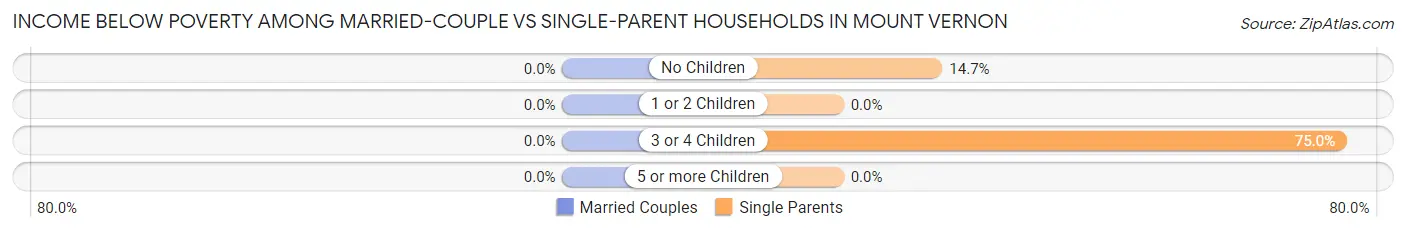
| Children | Married-Couple Families | Single-Parent Households |
| No Children | 0 (0.0%) | 5 (14.7%) |
| 1 or 2 Children | 0 (0.0%) | 0 (0.0%) |
| 3 or 4 Children | 0 (0.0%) | 36 (75.0%) |
| 5 or more Children | 0 (0.0%) | 0 (0.0%) |
| Total | 0 (0.0%) | 41 (24.8%) |
Race in Mount Vernon
The most populous races in Mount Vernon are White / Caucasian (4,188 | 92.5%), Hispanic or Latino (146 | 3.2%), and Black / African American (105 | 2.3%).
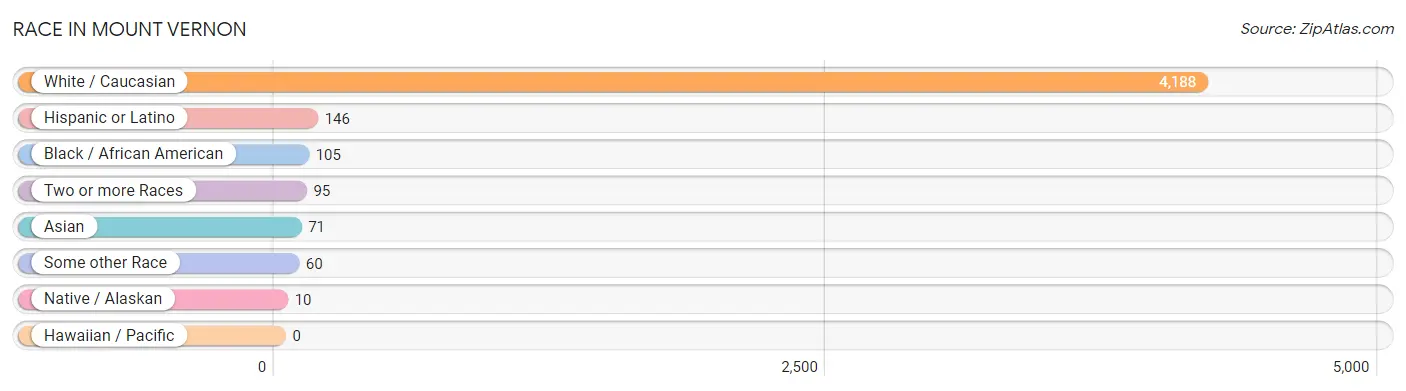
| Race | # Population | % Population |
| Asian | 71 | 1.6% |
| Black / African American | 105 | 2.3% |
| Hawaiian / Pacific | 0 | 0.0% |
| Hispanic or Latino | 146 | 3.2% |
| Native / Alaskan | 10 | 0.2% |
| White / Caucasian | 4,188 | 92.5% |
| Two or more Races | 95 | 2.1% |
| Some other Race | 60 | 1.3% |
| Total | 4,529 | 100.0% |
Ancestry in Mount Vernon
The most populous ancestries reported in Mount Vernon are German (973 | 21.5%), Irish (409 | 9.0%), English (353 | 7.8%), European (343 | 7.6%), and American (258 | 5.7%), together accounting for 51.6% of all Mount Vernon residents.
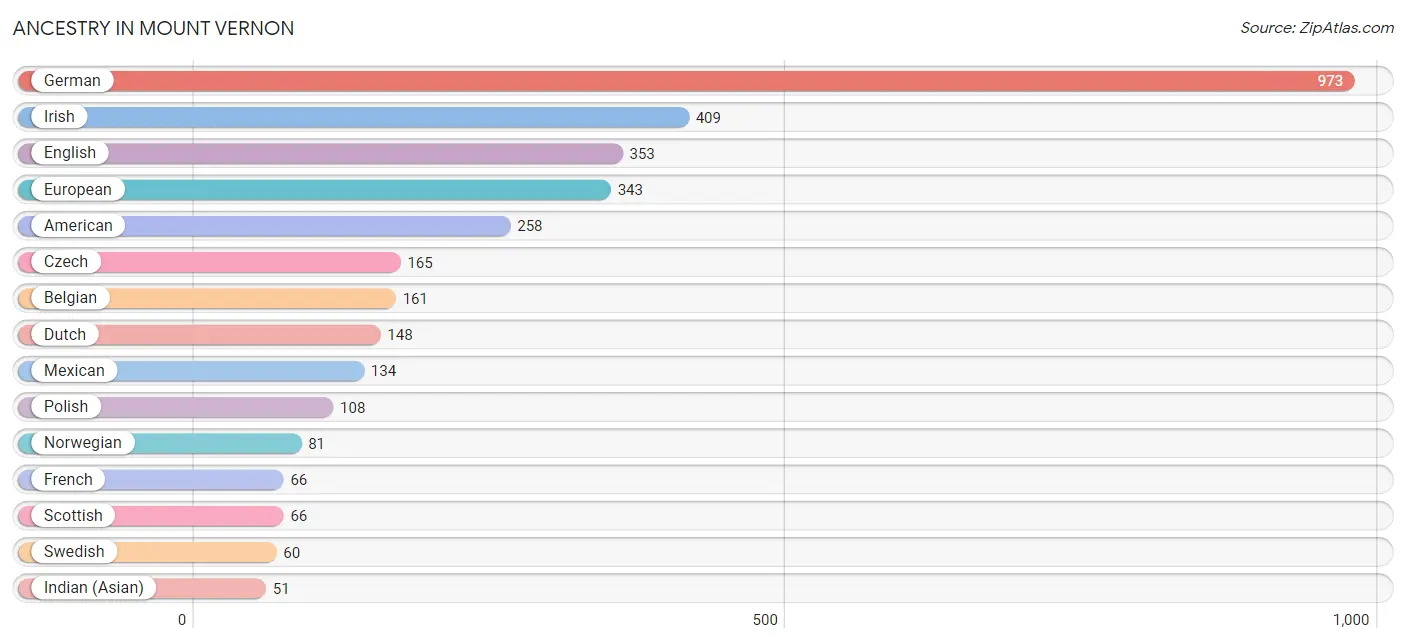
| Ancestry | # Population | % Population |
| American | 258 | 5.7% |
| Arab | 18 | 0.4% |
| Austrian | 47 | 1.0% |
| Belgian | 161 | 3.5% |
| Bhutanese | 3 | 0.1% |
| Burmese | 27 | 0.6% |
| Cherokee | 16 | 0.4% |
| Croatian | 28 | 0.6% |
| Czech | 165 | 3.6% |
| Danish | 18 | 0.4% |
| Dutch | 148 | 3.3% |
| Ecuadorian | 5 | 0.1% |
| English | 353 | 7.8% |
| European | 343 | 7.6% |
| French | 66 | 1.5% |
| French Canadian | 4 | 0.1% |
| German | 973 | 21.5% |
| Greek | 3 | 0.1% |
| Haitian | 15 | 0.3% |
| Indian (Asian) | 51 | 1.1% |
| Irish | 409 | 9.0% |
| Italian | 45 | 1.0% |
| Korean | 9 | 0.2% |
| Lithuanian | 33 | 0.7% |
| Luxembourger | 11 | 0.2% |
| Mexican | 134 | 3.0% |
| Northern European | 28 | 0.6% |
| Norwegian | 81 | 1.8% |
| Polish | 108 | 2.4% |
| Puerto Rican | 4 | 0.1% |
| Romanian | 9 | 0.2% |
| Russian | 8 | 0.2% |
| Scandinavian | 22 | 0.5% |
| Scottish | 66 | 1.5% |
| South American | 5 | 0.1% |
| Swedish | 60 | 1.3% |
| Swiss | 25 | 0.5% |
| Syrian | 18 | 0.4% |
| Welsh | 4 | 0.1% | View All 39 Rows |
Immigrants in Mount Vernon
The most numerous immigrant groups reported in Mount Vernon came from Asia (56 | 1.2%), Eastern Asia (56 | 1.2%), China (32 | 0.7%), Korea (24 | 0.5%), and Caribbean (15 | 0.3%), together accounting for 4.0% of all Mount Vernon residents.
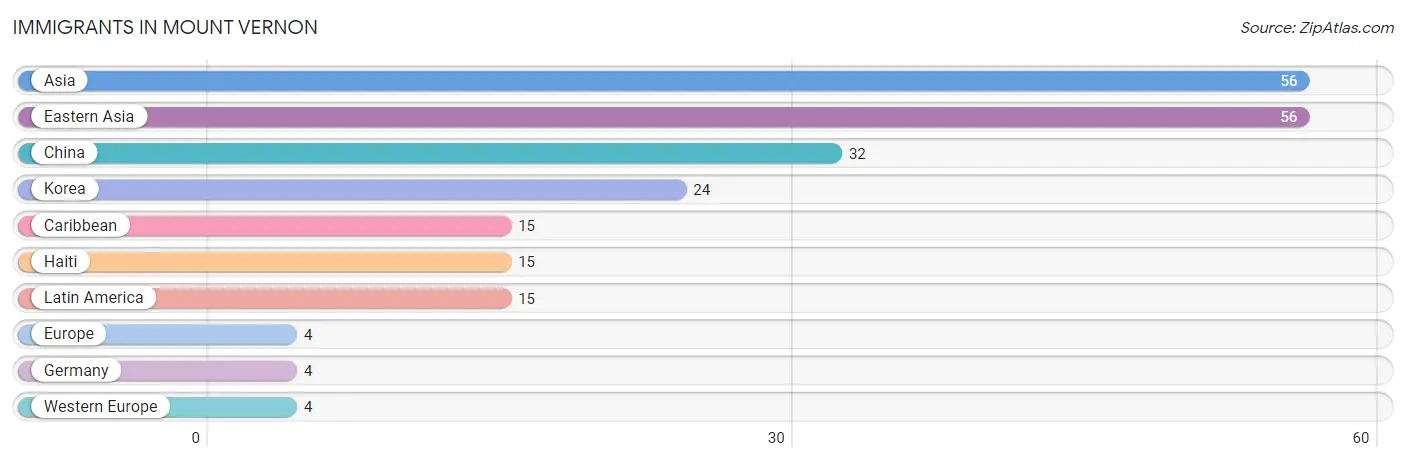
| Immigration Origin | # Population | % Population |
| Asia | 56 | 1.2% |
| Caribbean | 15 | 0.3% |
| China | 32 | 0.7% |
| Eastern Asia | 56 | 1.2% |
| Europe | 4 | 0.1% |
| Germany | 4 | 0.1% |
| Haiti | 15 | 0.3% |
| Korea | 24 | 0.5% |
| Latin America | 15 | 0.3% |
| Western Europe | 4 | 0.1% | View All 10 Rows |
Sex and Age in Mount Vernon
Sex and Age in Mount Vernon
The most populous age groups in Mount Vernon are 15 to 19 Years (431 | 21.0%) for men and 15 to 19 Years (706 | 28.5%) for women.
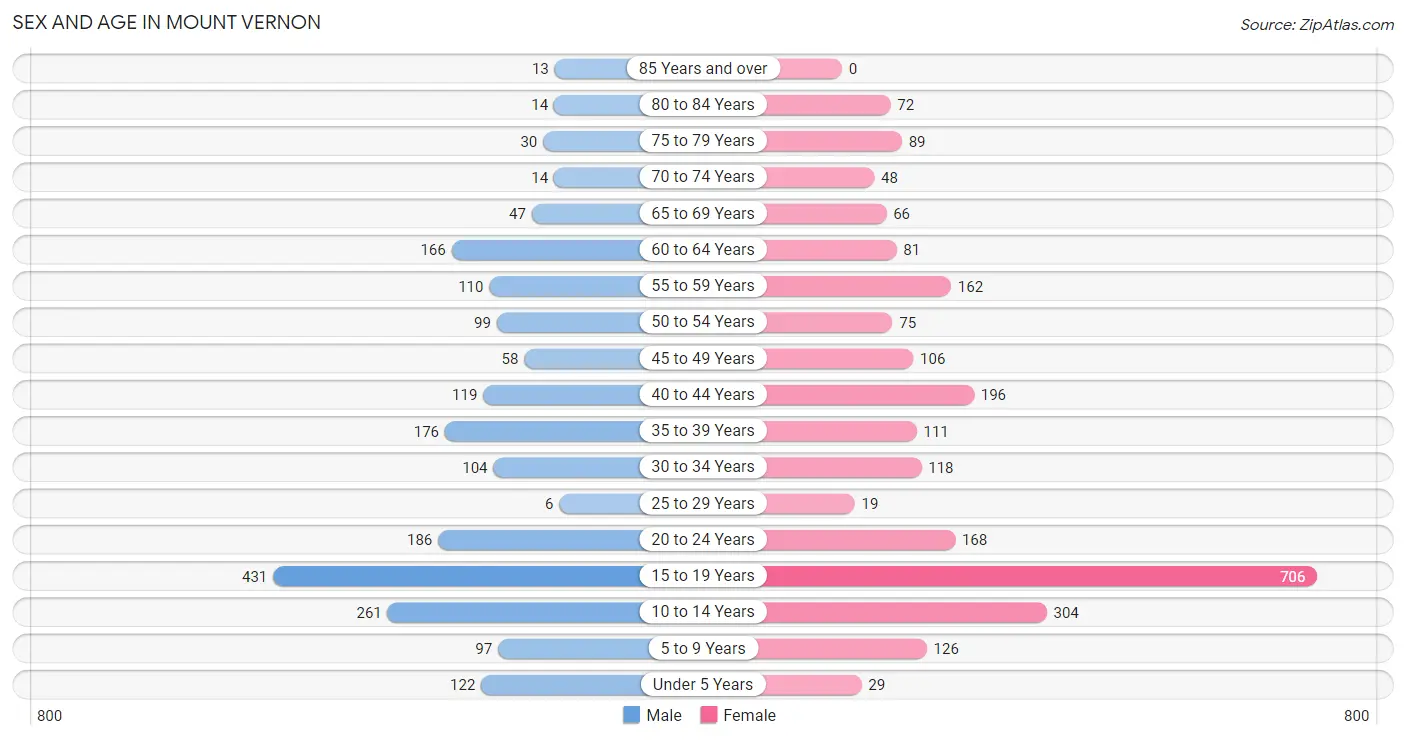
| Age Bracket | Male | Female |
| Under 5 Years | 122 (5.9%) | 29 (1.2%) |
| 5 to 9 Years | 97 (4.7%) | 126 (5.1%) |
| 10 to 14 Years | 261 (12.7%) | 304 (12.3%) |
| 15 to 19 Years | 431 (21.0%) | 706 (28.5%) |
| 20 to 24 Years | 186 (9.1%) | 168 (6.8%) |
| 25 to 29 Years | 6 (0.3%) | 19 (0.8%) |
| 30 to 34 Years | 104 (5.1%) | 118 (4.8%) |
| 35 to 39 Years | 176 (8.6%) | 111 (4.5%) |
| 40 to 44 Years | 119 (5.8%) | 196 (7.9%) |
| 45 to 49 Years | 58 (2.8%) | 106 (4.3%) |
| 50 to 54 Years | 99 (4.8%) | 75 (3.0%) |
| 55 to 59 Years | 110 (5.4%) | 162 (6.5%) |
| 60 to 64 Years | 166 (8.1%) | 81 (3.3%) |
| 65 to 69 Years | 47 (2.3%) | 66 (2.7%) |
| 70 to 74 Years | 14 (0.7%) | 48 (1.9%) |
| 75 to 79 Years | 30 (1.5%) | 89 (3.6%) |
| 80 to 84 Years | 14 (0.7%) | 72 (2.9%) |
| 85 Years and over | 13 (0.6%) | 0 (0.0%) |
| Total | 2,053 (100.0%) | 2,476 (100.0%) |
Families and Households in Mount Vernon
Median Family Size in Mount Vernon
The median family size in Mount Vernon is 3.58 persons per family, with married-couple families (721 | 81.4%) accounting for the largest median family size of 3.78 persons per family. On the other hand, single female/mother families (114 | 12.9%) represent the smallest median family size with 2.55 persons per family.
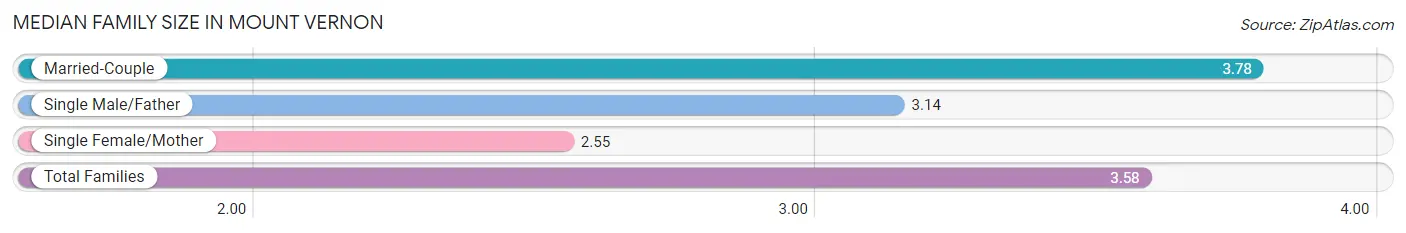
| Family Type | # Families | Family Size |
| Married-Couple | 721 (81.4%) | 3.78 |
| Single Male/Father | 51 (5.8%) | 3.14 |
| Single Female/Mother | 114 (12.9%) | 2.55 |
| Total Families | 886 (100.0%) | 3.58 |
Median Household Size in Mount Vernon
The median household size in Mount Vernon is 3.01 persons per household, with married-couple households (721 | 62.3%) accounting for the largest median household size of 3.78 persons per household. non-family households (272 | 23.5%) represent the smallest median household size with 1.06 persons per household.
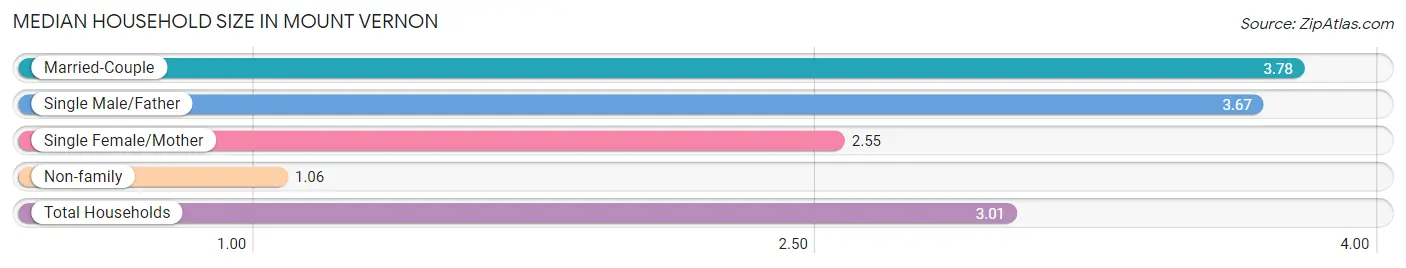
| Household Type | # Households | Household Size |
| Married-Couple | 721 (62.3%) | 3.78 |
| Single Male/Father | 51 (4.4%) | 3.67 |
| Single Female/Mother | 114 (9.8%) | 2.55 |
| Non-family | 272 (23.5%) | 1.06 |
| Total Households | 1,158 (100.0%) | 3.01 |
Household Size by Marriage Status in Mount Vernon
Out of a total of 1,158 households in Mount Vernon, 886 (76.5%) are family households, while 272 (23.5%) are nonfamily households. The most numerous type of family households are 2-person households, comprising 327, and the most common type of nonfamily households are 1-person households, comprising 256.
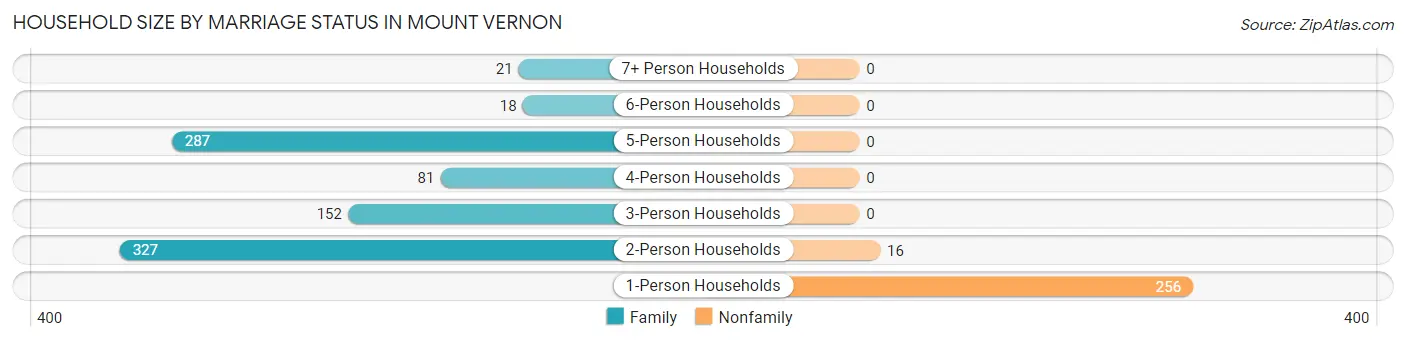
| Household Size | Family Households | Nonfamily Households |
| 1-Person Households | - | 256 (22.1%) |
| 2-Person Households | 327 (28.2%) | 16 (1.4%) |
| 3-Person Households | 152 (13.1%) | 0 (0.0%) |
| 4-Person Households | 81 (7.0%) | 0 (0.0%) |
| 5-Person Households | 287 (24.8%) | 0 (0.0%) |
| 6-Person Households | 18 (1.5%) | 0 (0.0%) |
| 7+ Person Households | 21 (1.8%) | 0 (0.0%) |
| Total | 886 (76.5%) | 272 (23.5%) |
Female Fertility in Mount Vernon
Fertility by Age in Mount Vernon
Average fertility rate in Mount Vernon is 8.0 births per 1,000 women. Women in the age bracket of 35 to 50 years have the highest fertility rate with 27.0 births per 1,000 women. Women in the age bracket of 35 to 50 years acount for 100.0% of all women with births.
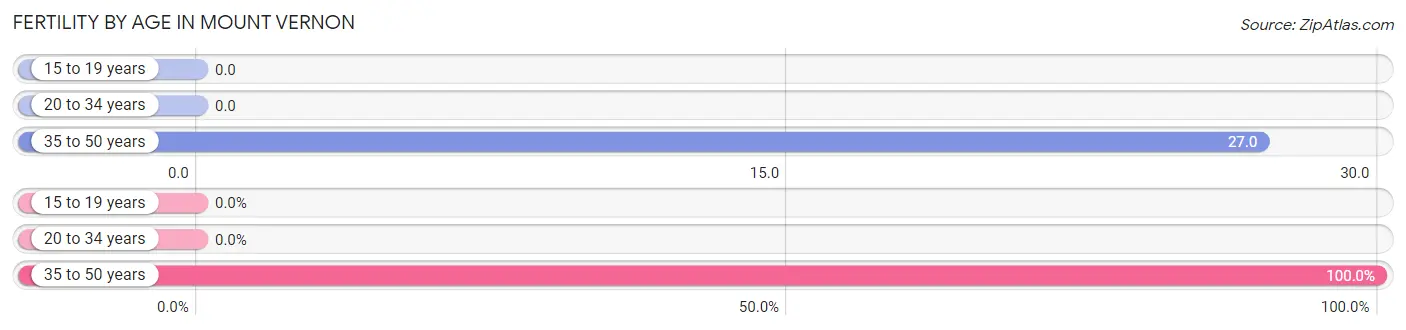
| Age Bracket | Women with Births | Births / 1,000 Women |
| 15 to 19 years | 0 (0.0%) | 0.0 |
| 20 to 34 years | 0 (0.0%) | 0.0 |
| 35 to 50 years | 11 (100.0%) | 27.0 |
| Total | 11 (100.0%) | 8.0 |
Fertility by Age by Marriage Status in Mount Vernon
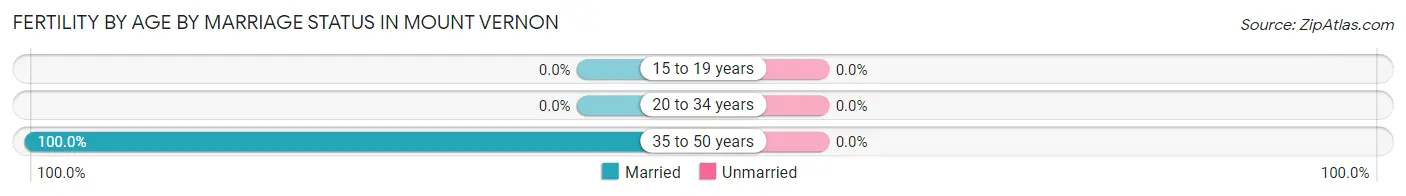
| Age Bracket | Married | Unmarried |
| 15 to 19 years | 0 (0.0%) | 0 (0.0%) |
| 20 to 34 years | 0 (0.0%) | 0 (0.0%) |
| 35 to 50 years | 11 (100.0%) | 0 (0.0%) |
| Total | 11 (100.0%) | 0 (0.0%) |
Fertility by Education in Mount Vernon
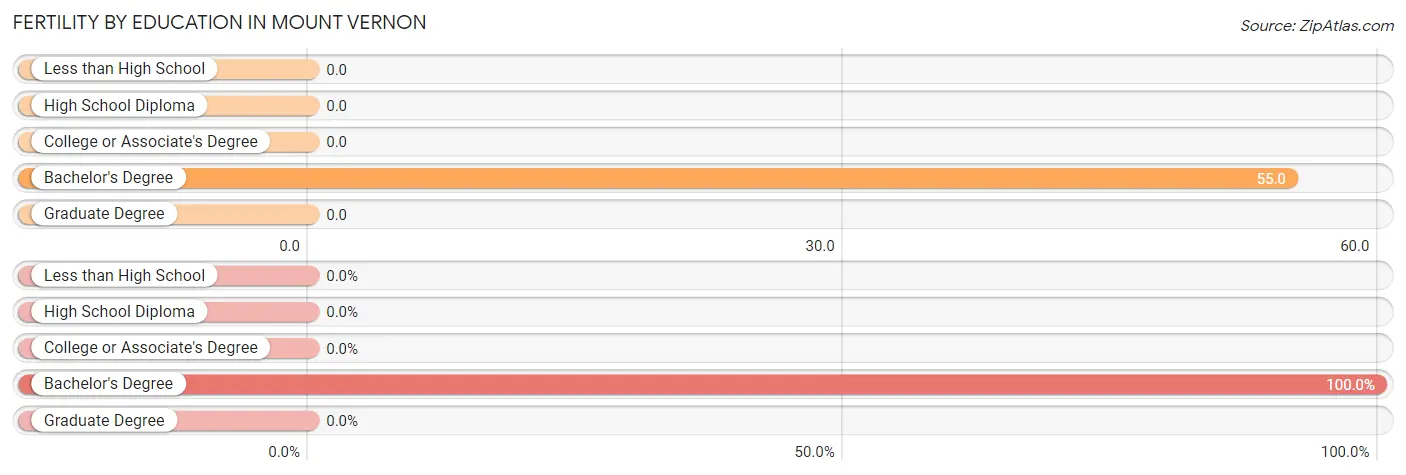
| Educational Attainment | Women with Births | Births / 1,000 Women |
| Less than High School | 0 (0.0%) | 0.0 |
| High School Diploma | 0 (0.0%) | 0.0 |
| College or Associate's Degree | 0 (0.0%) | 0.0 |
| Bachelor's Degree | 11 (100.0%) | 55.0 |
| Graduate Degree | 0 (0.0%) | 0.0 |
| Total | 11 (100.0%) | 8.0 |
Fertility by Education by Marriage Status in Mount Vernon
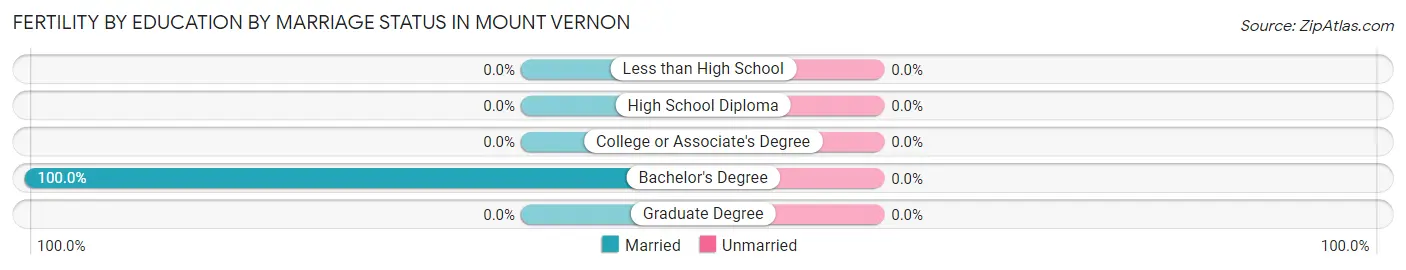
| Educational Attainment | Married | Unmarried |
| Less than High School | 0 (0.0%) | 0 (0.0%) |
| High School Diploma | 0 (0.0%) | 0 (0.0%) |
| College or Associate's Degree | 0 (0.0%) | 0 (0.0%) |
| Bachelor's Degree | 11 (100.0%) | 0 (0.0%) |
| Graduate Degree | 0 (0.0%) | 0 (0.0%) |
| Total | 11 (100.0%) | 0 (0.0%) |
Employment Characteristics in Mount Vernon
Employment by Class of Employer in Mount Vernon
Among the 1,969 employed individuals in Mount Vernon, private company employees (1,086 | 55.1%), state government employees (267 | 13.6%), and not-for-profit organizations (239 | 12.1%) make up the most common classes of employment.
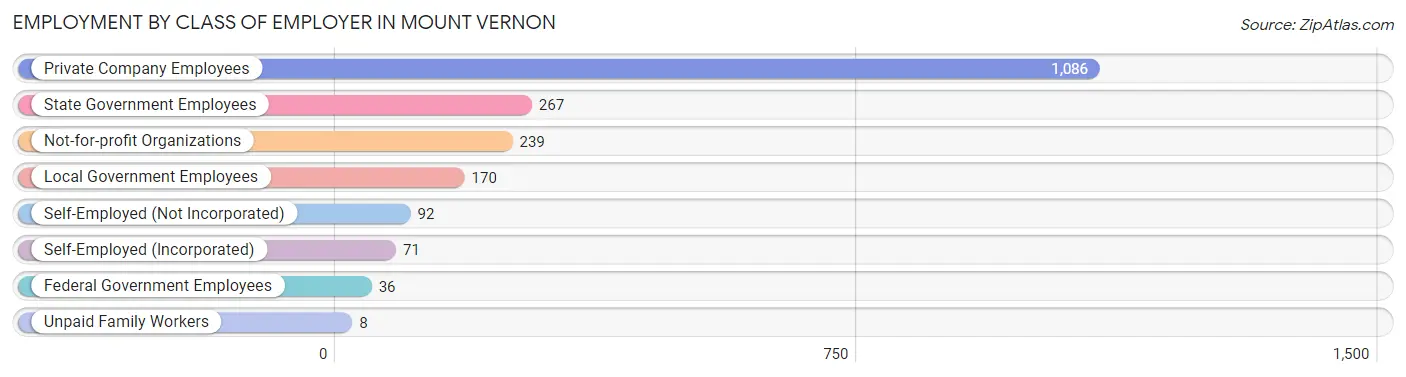
| Employer Class | # Employees | % Employees |
| Private Company Employees | 1,086 | 55.1% |
| Self-Employed (Incorporated) | 71 | 3.6% |
| Self-Employed (Not Incorporated) | 92 | 4.7% |
| Not-for-profit Organizations | 239 | 12.1% |
| Local Government Employees | 170 | 8.6% |
| State Government Employees | 267 | 13.6% |
| Federal Government Employees | 36 | 1.8% |
| Unpaid Family Workers | 8 | 0.4% |
| Total | 1,969 | 100.0% |
Employment Status by Age in Mount Vernon
According to the labor force statistics for Mount Vernon, out of the total population over 16 years of age (3,490), 62.2% or 2,171 individuals are in the labor force, with 4.9% or 106 of them unemployed. The age group with the highest labor force participation rate is 45 to 54 years, with 95.0% or 321 individuals in the labor force. Within the labor force, the 25 to 29 years age range has the highest percentage of unemployed individuals, with 100.0% or 6 of them being unemployed.
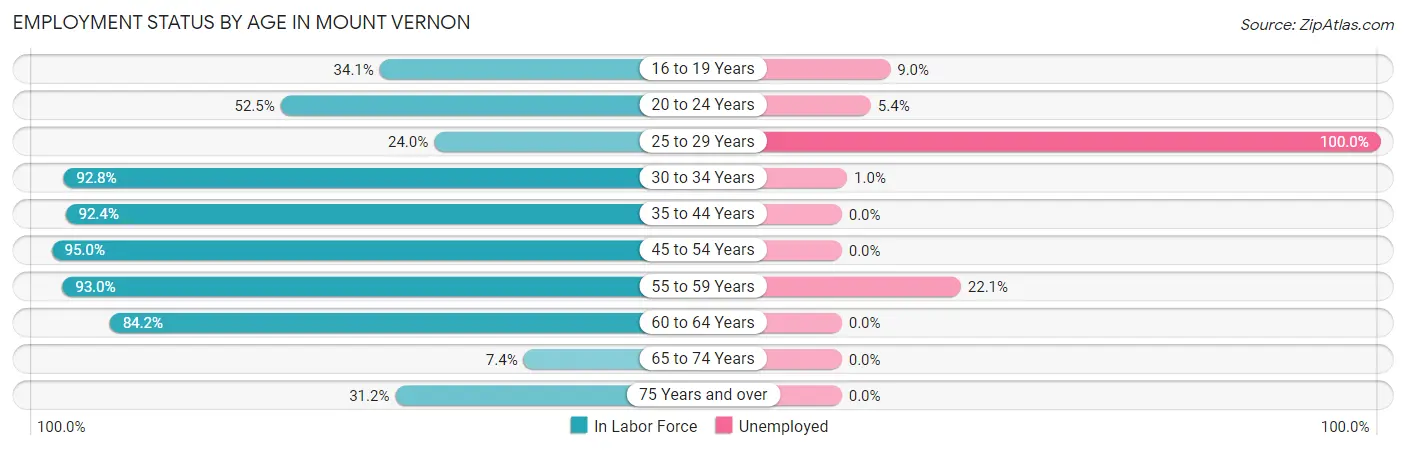
| Age Bracket | In Labor Force | Unemployed |
| 16 to 19 Years | 354 (34.1%) | 32 (9.0%) |
| 20 to 24 Years | 186 (52.5%) | 10 (5.4%) |
| 25 to 29 Years | 6 (24.0%) | 6 (100.0%) |
| 30 to 34 Years | 206 (92.8%) | 2 (1.0%) |
| 35 to 44 Years | 556 (92.4%) | 0 (0.0%) |
| 45 to 54 Years | 321 (95.0%) | 0 (0.0%) |
| 55 to 59 Years | 253 (93.0%) | 56 (22.1%) |
| 60 to 64 Years | 208 (84.2%) | 0 (0.0%) |
| 65 to 74 Years | 13 (7.4%) | 0 (0.0%) |
| 75 Years and over | 68 (31.2%) | 0 (0.0%) |
| Total | 2,171 (62.2%) | 106 (4.9%) |
Employment Status by Educational Attainment in Mount Vernon
According to labor force statistics for Mount Vernon, 90.9% of individuals (1,551) out of the total population between 25 and 64 years of age (1,706) are in the labor force, with 4.1% or 64 of them being unemployed. The group with the highest labor force participation rate are those with the educational attainment of bachelor's degree or higher, with 93.0% or 863 individuals in the labor force. Within the labor force, individuals with less than high school education have the highest percentage of unemployment, with 7.2% or 6 of them being unemployed.
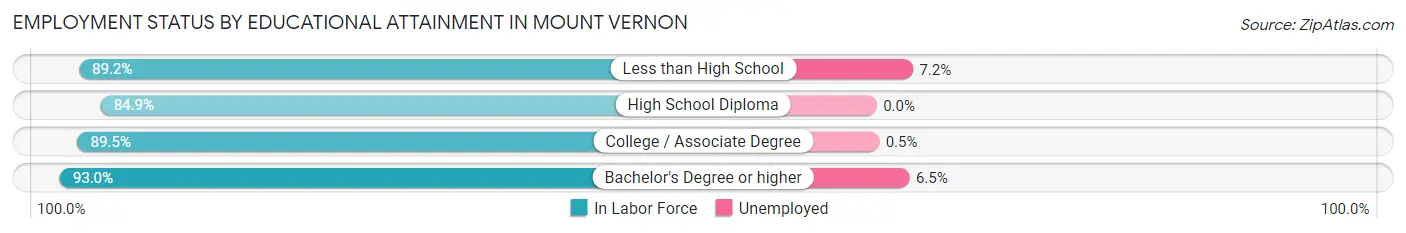
| Educational Attainment | In Labor Force | Unemployed |
| Less than High School | 83 (89.2%) | 7 (7.2%) |
| High School Diploma | 169 (84.9%) | 0 (0.0%) |
| College / Associate Degree | 435 (89.5%) | 2 (0.5%) |
| Bachelor's Degree or higher | 863 (93.0%) | 60 (6.5%) |
| Total | 1,551 (90.9%) | 70 (4.1%) |
Employment Occupations by Sex in Mount Vernon
Management, Business, Science and Arts Occupations
The most common Management, Business, Science and Arts occupations in Mount Vernon are Community & Social Service (266 | 12.9%), Health Diagnosing & Treating (161 | 7.8%), Health Technologists (161 | 7.8%), Education Instruction & Library (159 | 7.7%), and Business & Financial (136 | 6.6%).
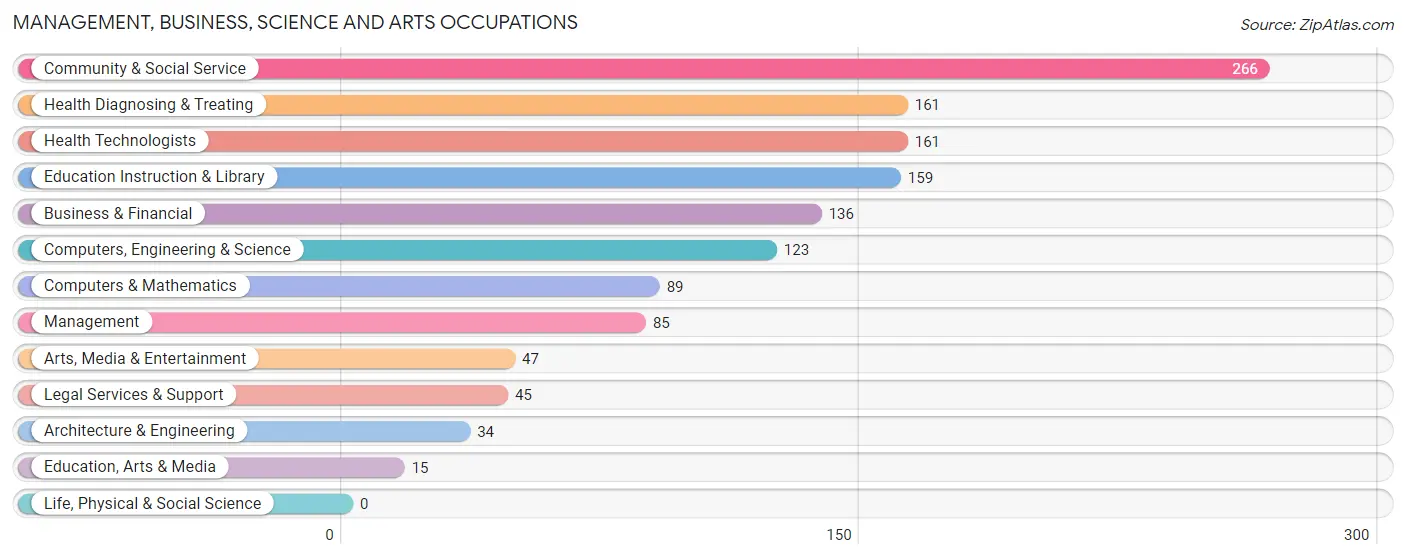
Management, Business, Science and Arts Occupations by Sex
Within the Management, Business, Science and Arts occupations in Mount Vernon, the most male-oriented occupations are Architecture & Engineering (100.0%), Computers, Engineering & Science (80.5%), and Legal Services & Support (77.8%), while the most female-oriented occupations are Education, Arts & Media (100.0%), Health Diagnosing & Treating (91.9%), and Health Technologists (91.9%).
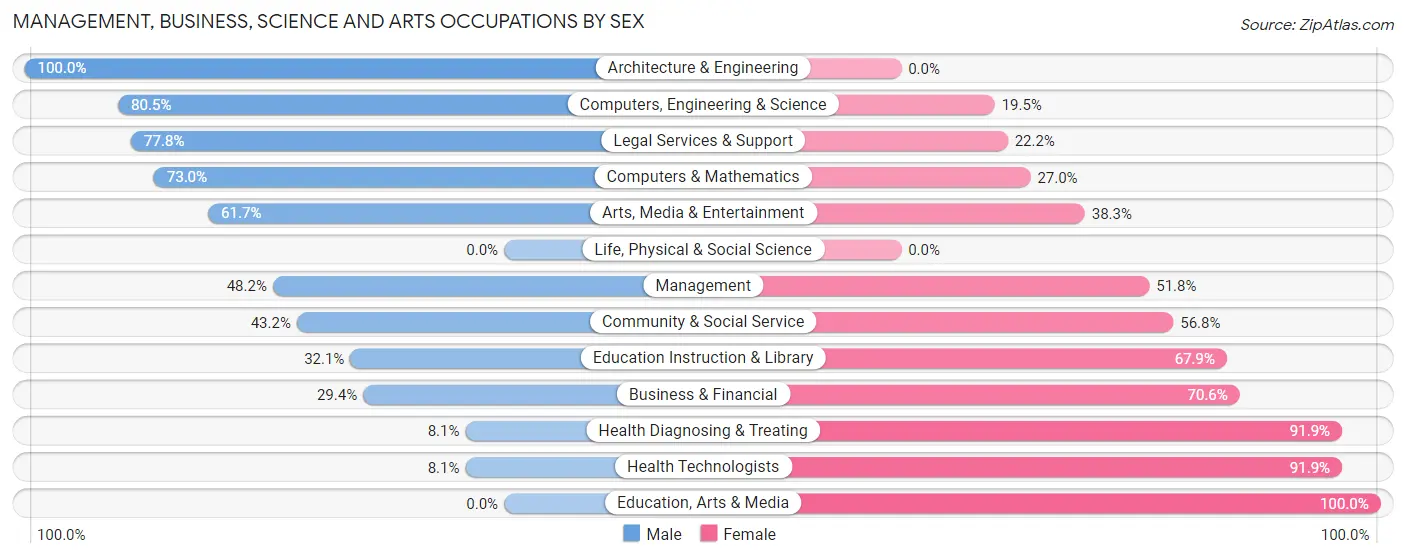
| Occupation | Male | Female |
| Management | 41 (48.2%) | 44 (51.8%) |
| Business & Financial | 40 (29.4%) | 96 (70.6%) |
| Computers, Engineering & Science | 99 (80.5%) | 24 (19.5%) |
| Computers & Mathematics | 65 (73.0%) | 24 (27.0%) |
| Architecture & Engineering | 34 (100.0%) | 0 (0.0%) |
| Life, Physical & Social Science | 0 (0.0%) | 0 (0.0%) |
| Community & Social Service | 115 (43.2%) | 151 (56.8%) |
| Education, Arts & Media | 0 (0.0%) | 15 (100.0%) |
| Legal Services & Support | 35 (77.8%) | 10 (22.2%) |
| Education Instruction & Library | 51 (32.1%) | 108 (67.9%) |
| Arts, Media & Entertainment | 29 (61.7%) | 18 (38.3%) |
| Health Diagnosing & Treating | 13 (8.1%) | 148 (91.9%) |
| Health Technologists | 13 (8.1%) | 148 (91.9%) |
| Total (Category) | 308 (40.0%) | 463 (60.1%) |
| Total (Overall) | 964 (46.7%) | 1,101 (53.3%) |
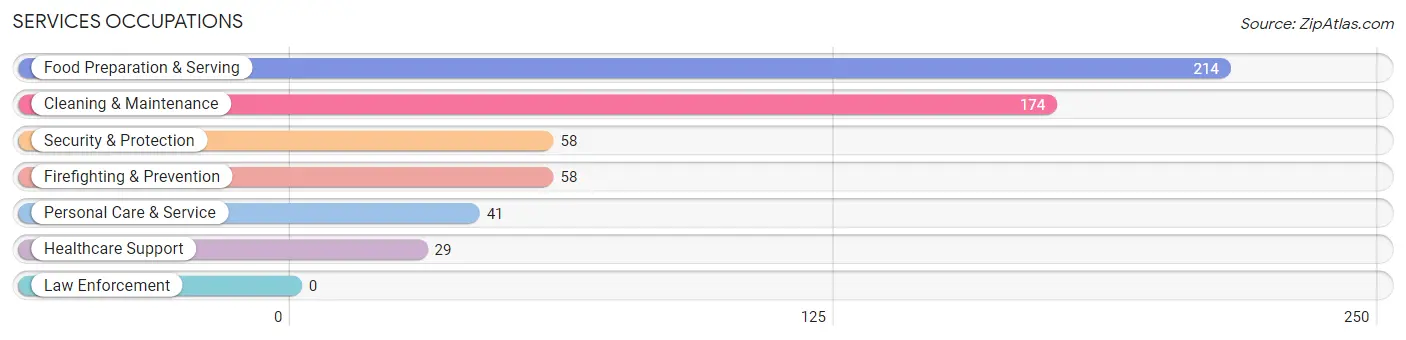
Services Occupations
The most common Services occupations in Mount Vernon are Food Preparation & Serving (214 | 10.4%), Cleaning & Maintenance (174 | 8.4%), Security & Protection (58 | 2.8%), Firefighting & Prevention (58 | 2.8%), and Personal Care & Service (41 | 2.0%).
Services Occupations by Sex
Within the Services occupations in Mount Vernon, the most male-oriented occupations are Cleaning & Maintenance (88.5%), Security & Protection (75.9%), and Firefighting & Prevention (75.9%), while the most female-oriented occupations are Healthcare Support (100.0%), Personal Care & Service (80.5%), and Food Preparation & Serving (64.5%).
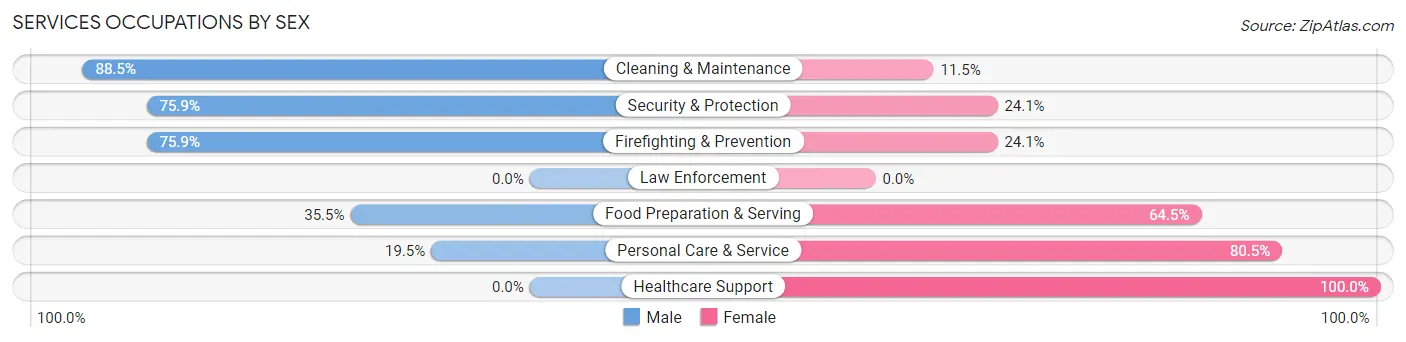
| Occupation | Male | Female |
| Healthcare Support | 0 (0.0%) | 29 (100.0%) |
| Security & Protection | 44 (75.9%) | 14 (24.1%) |
| Firefighting & Prevention | 44 (75.9%) | 14 (24.1%) |
| Law Enforcement | 0 (0.0%) | 0 (0.0%) |
| Food Preparation & Serving | 76 (35.5%) | 138 (64.5%) |
| Cleaning & Maintenance | 154 (88.5%) | 20 (11.5%) |
| Personal Care & Service | 8 (19.5%) | 33 (80.5%) |
| Total (Category) | 282 (54.6%) | 234 (45.4%) |
| Total (Overall) | 964 (46.7%) | 1,101 (53.3%) |
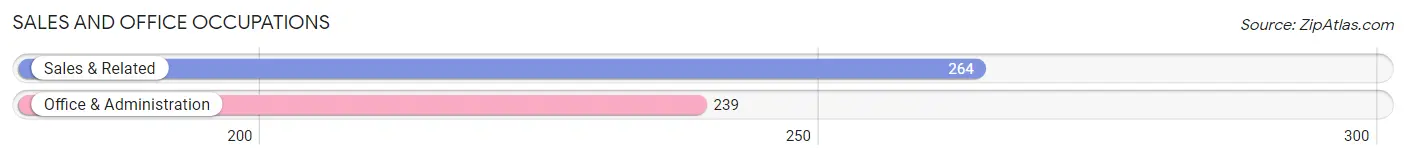
Sales and Office Occupations
The most common Sales and Office occupations in Mount Vernon are Sales & Related (264 | 12.8%), and Office & Administration (239 | 11.6%).
Sales and Office Occupations by Sex
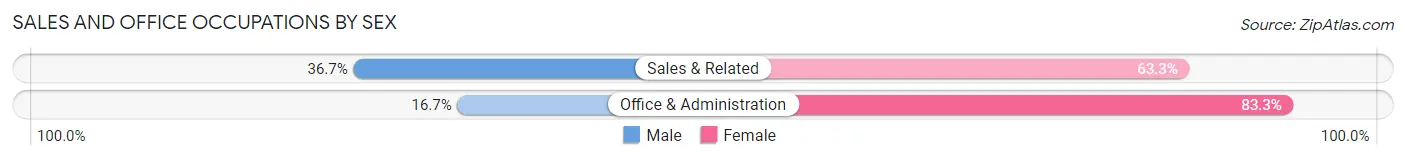
| Occupation | Male | Female |
| Sales & Related | 97 (36.7%) | 167 (63.3%) |
| Office & Administration | 40 (16.7%) | 199 (83.3%) |
| Total (Category) | 137 (27.2%) | 366 (72.8%) |
| Total (Overall) | 964 (46.7%) | 1,101 (53.3%) |
Natural Resources, Construction and Maintenance Occupations
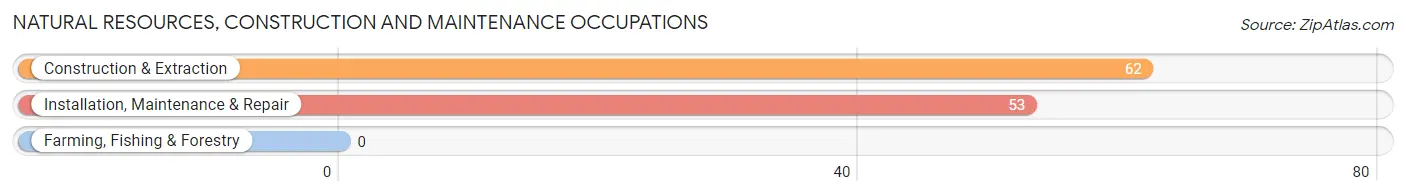
The most common Natural Resources, Construction and Maintenance occupations in Mount Vernon are Construction & Extraction (62 | 3.0%), and Installation, Maintenance & Repair (53 | 2.6%).
Natural Resources, Construction and Maintenance Occupations by Sex
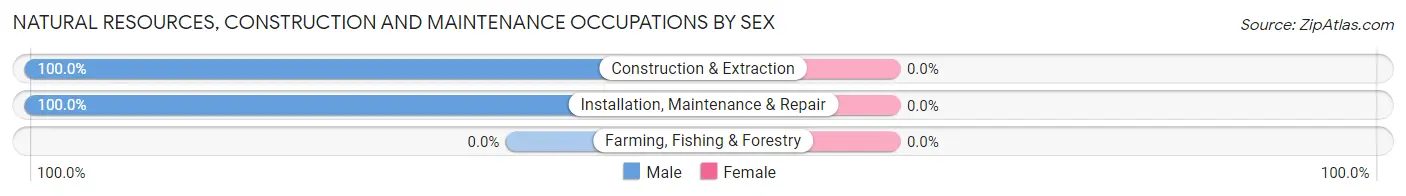
| Occupation | Male | Female |
| Farming, Fishing & Forestry | 0 (0.0%) | 0 (0.0%) |
| Construction & Extraction | 62 (100.0%) | 0 (0.0%) |
| Installation, Maintenance & Repair | 53 (100.0%) | 0 (0.0%) |
| Total (Category) | 115 (100.0%) | 0 (0.0%) |
| Total (Overall) | 964 (46.7%) | 1,101 (53.3%) |
Production, Transportation and Moving Occupations
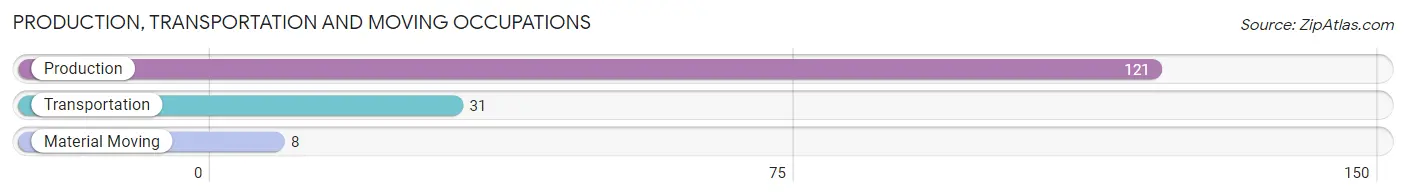
The most common Production, Transportation and Moving occupations in Mount Vernon are Production (121 | 5.9%), Transportation (31 | 1.5%), and Material Moving (8 | 0.4%).
Production, Transportation and Moving Occupations by Sex
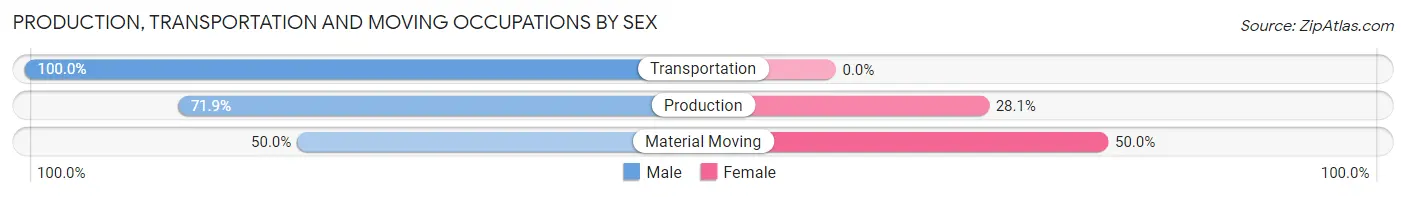
| Occupation | Male | Female |
| Production | 87 (71.9%) | 34 (28.1%) |
| Transportation | 31 (100.0%) | 0 (0.0%) |
| Material Moving | 4 (50.0%) | 4 (50.0%) |
| Total (Category) | 122 (76.2%) | 38 (23.7%) |
| Total (Overall) | 964 (46.7%) | 1,101 (53.3%) |
Employment Industries by Sex in Mount Vernon
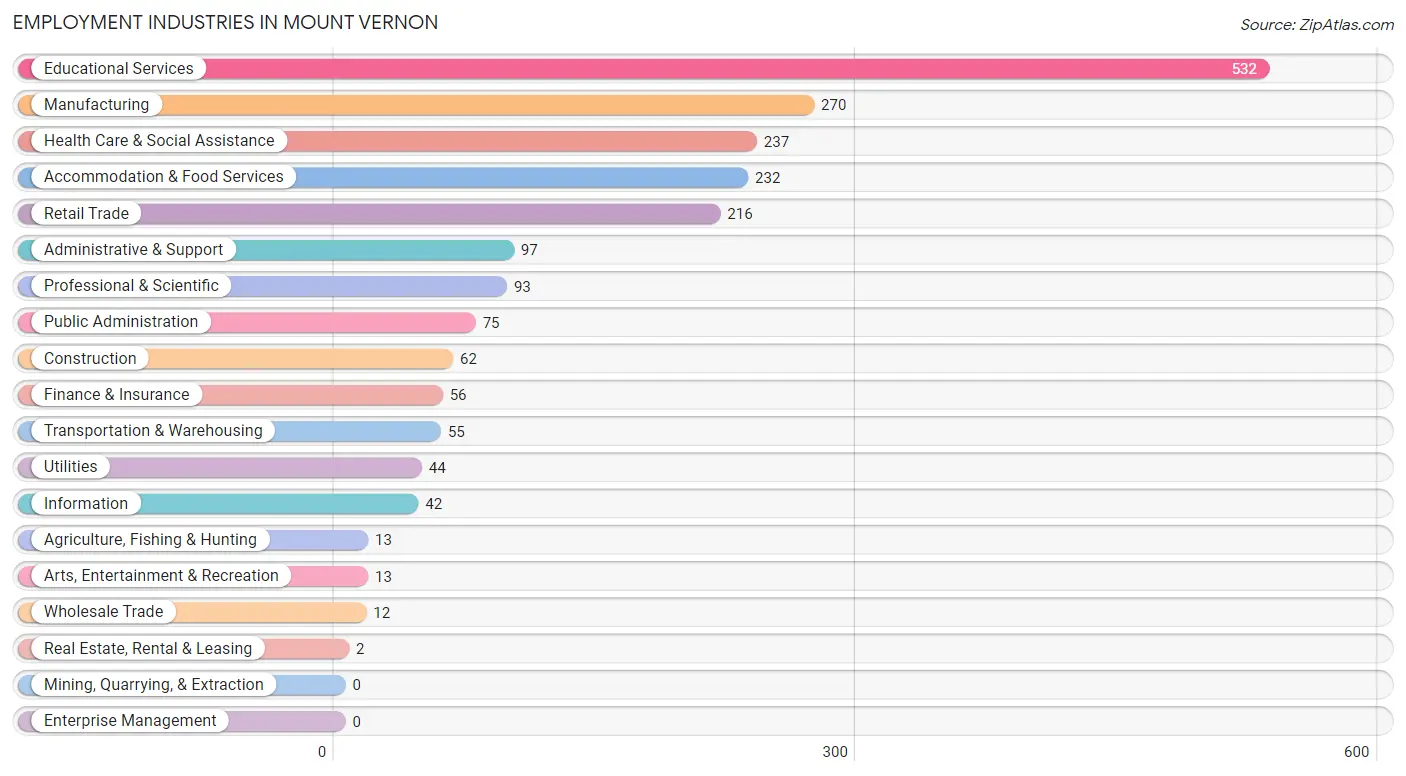
Employment Industries in Mount Vernon
The major employment industries in Mount Vernon include Educational Services (532 | 25.8%), Manufacturing (270 | 13.1%), Health Care & Social Assistance (237 | 11.5%), Accommodation & Food Services (232 | 11.2%), and Retail Trade (216 | 10.5%).
Employment Industries by Sex in Mount Vernon
The Mount Vernon industries that see more men than women are Construction (100.0%), Real Estate, Rental & Leasing (100.0%), and Manufacturing (84.4%), whereas the industries that tend to have a higher number of women are Agriculture, Fishing & Hunting (100.0%), Wholesale Trade (100.0%), and Utilities (100.0%).
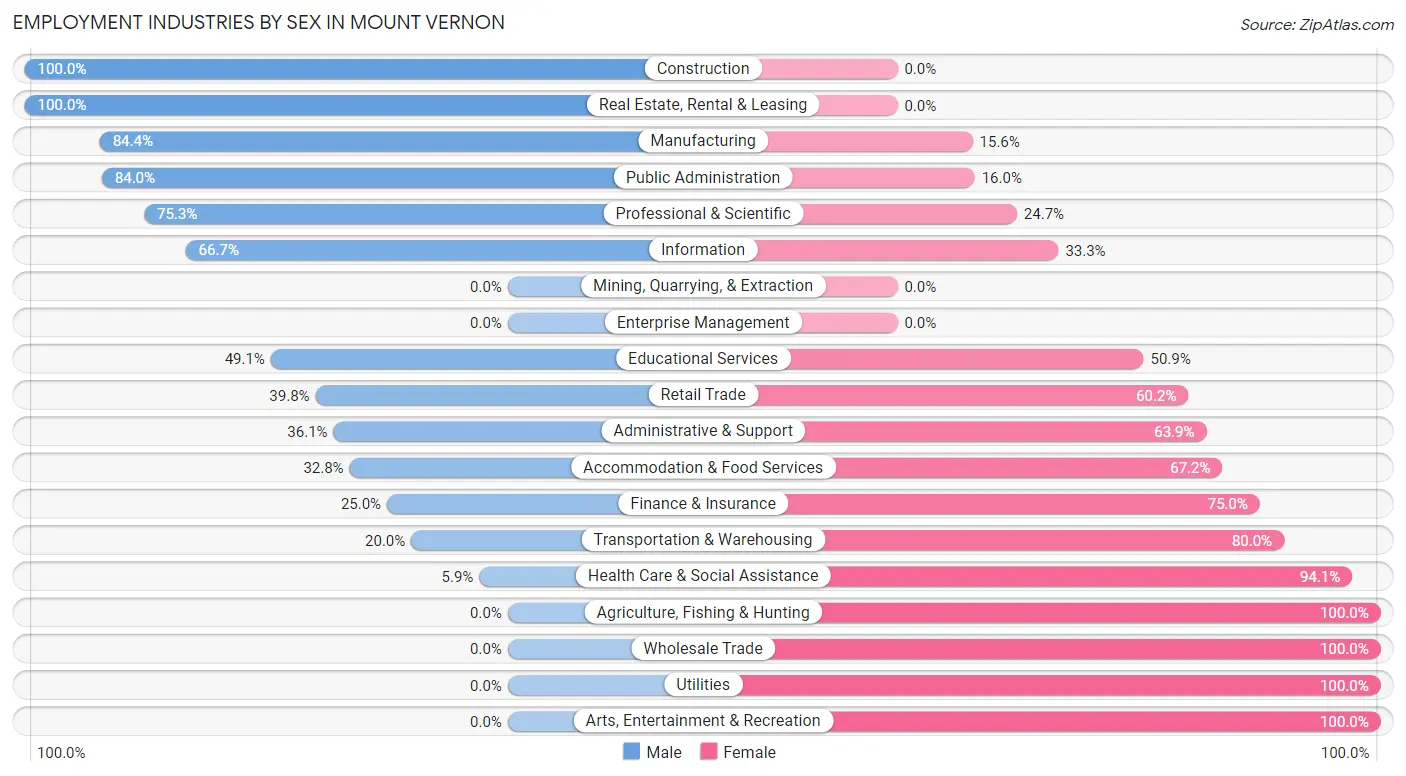
| Industry | Male | Female |
| Agriculture, Fishing & Hunting | 0 (0.0%) | 13 (100.0%) |
| Mining, Quarrying, & Extraction | 0 (0.0%) | 0 (0.0%) |
| Construction | 62 (100.0%) | 0 (0.0%) |
| Manufacturing | 228 (84.4%) | 42 (15.6%) |
| Wholesale Trade | 0 (0.0%) | 12 (100.0%) |
| Retail Trade | 86 (39.8%) | 130 (60.2%) |
| Transportation & Warehousing | 11 (20.0%) | 44 (80.0%) |
| Utilities | 0 (0.0%) | 44 (100.0%) |
| Information | 28 (66.7%) | 14 (33.3%) |
| Finance & Insurance | 14 (25.0%) | 42 (75.0%) |
| Real Estate, Rental & Leasing | 2 (100.0%) | 0 (0.0%) |
| Professional & Scientific | 70 (75.3%) | 23 (24.7%) |
| Enterprise Management | 0 (0.0%) | 0 (0.0%) |
| Administrative & Support | 35 (36.1%) | 62 (63.9%) |
| Educational Services | 261 (49.1%) | 271 (50.9%) |
| Health Care & Social Assistance | 14 (5.9%) | 223 (94.1%) |
| Arts, Entertainment & Recreation | 0 (0.0%) | 13 (100.0%) |
| Accommodation & Food Services | 76 (32.8%) | 156 (67.2%) |
| Public Administration | 63 (84.0%) | 12 (16.0%) |
| Total | 964 (46.7%) | 1,101 (53.3%) |
Education in Mount Vernon
School Enrollment in Mount Vernon
The most common levels of schooling among the 2,404 students in Mount Vernon are college / undergraduate (1,228 | 51.1%), high school (432 | 18.0%), and middle school (423 | 17.6%).
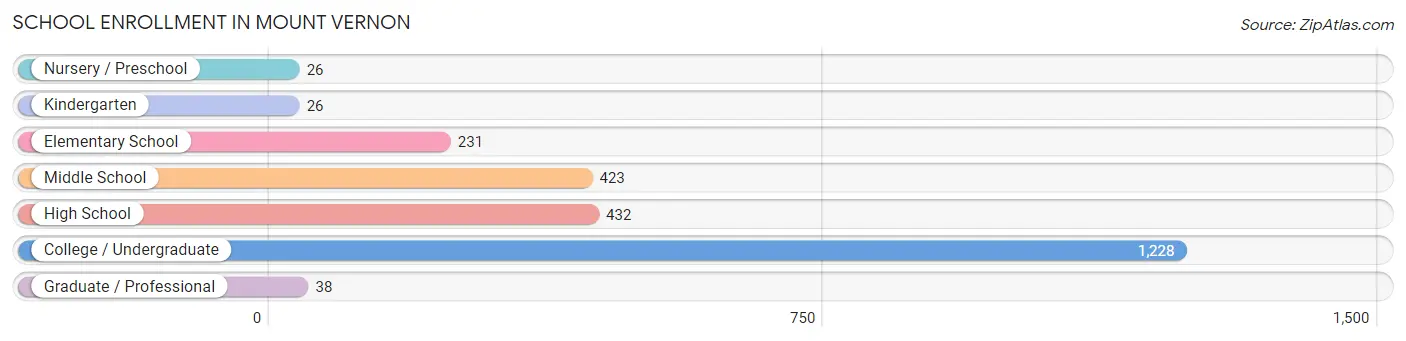
| School Level | # Students | % Students |
| Nursery / Preschool | 26 | 1.1% |
| Kindergarten | 26 | 1.1% |
| Elementary School | 231 | 9.6% |
| Middle School | 423 | 17.6% |
| High School | 432 | 18.0% |
| College / Undergraduate | 1,228 | 51.1% |
| Graduate / Professional | 38 | 1.6% |
| Total | 2,404 | 100.0% |
School Enrollment by Age by Funding Source in Mount Vernon
Out of a total of 2,404 students who are enrolled in schools in Mount Vernon, 1,094 (45.5%) attend a private institution, while the remaining 1,310 (54.5%) are enrolled in public schools. The age group of 3 to 4 year olds has the highest likelihood of being enrolled in private schools, with 13 (100.0% in the age bracket) enrolled. Conversely, the age group of 5 to 9 year old has the lowest likelihood of being enrolled in a private school, with 223 (100.0% in the age bracket) attending a public institution.
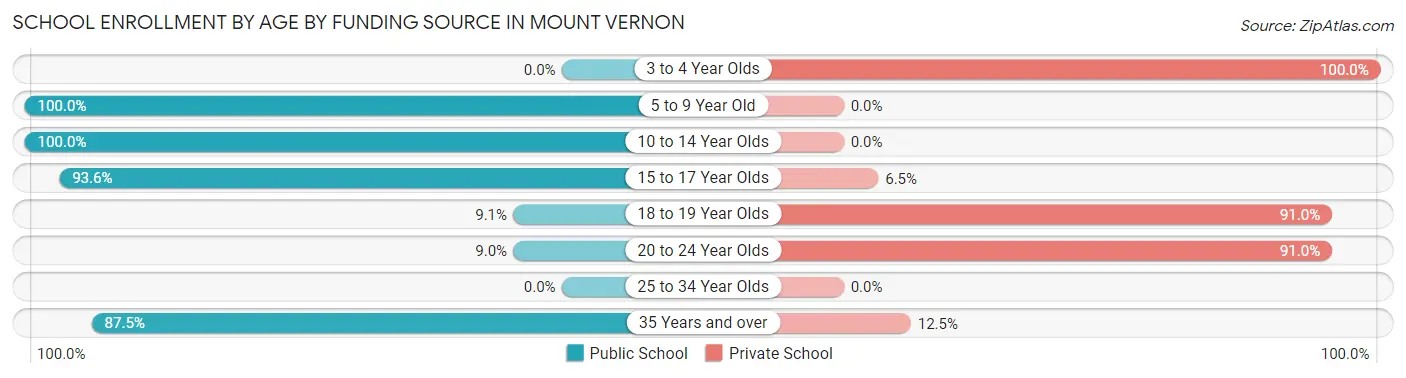
| Age Bracket | Public School | Private School |
| 3 to 4 Year Olds | 0 (0.0%) | 13 (100.0%) |
| 5 to 9 Year Old | 223 (100.0%) | 0 (0.0%) |
| 10 to 14 Year Olds | 565 (100.0%) | 0 (0.0%) |
| 15 to 17 Year Olds | 319 (93.5%) | 22 (6.5%) |
| 18 to 19 Year Olds | 72 (9.0%) | 724 (90.9%) |
| 20 to 24 Year Olds | 32 (9.0%) | 322 (91.0%) |
| 25 to 34 Year Olds | 0 (0.0%) | 0 (0.0%) |
| 35 Years and over | 98 (87.5%) | 14 (12.5%) |
| Total | 1,310 (54.5%) | 1,094 (45.5%) |
Educational Attainment by Field of Study in Mount Vernon
Education (219 | 17.7%), business (212 | 17.1%), science & technology (171 | 13.8%), visual & performing arts (137 | 11.1%), and literature & languages (113 | 9.1%) are the most common fields of study among 1,237 individuals in Mount Vernon who have obtained a bachelor's degree or higher.
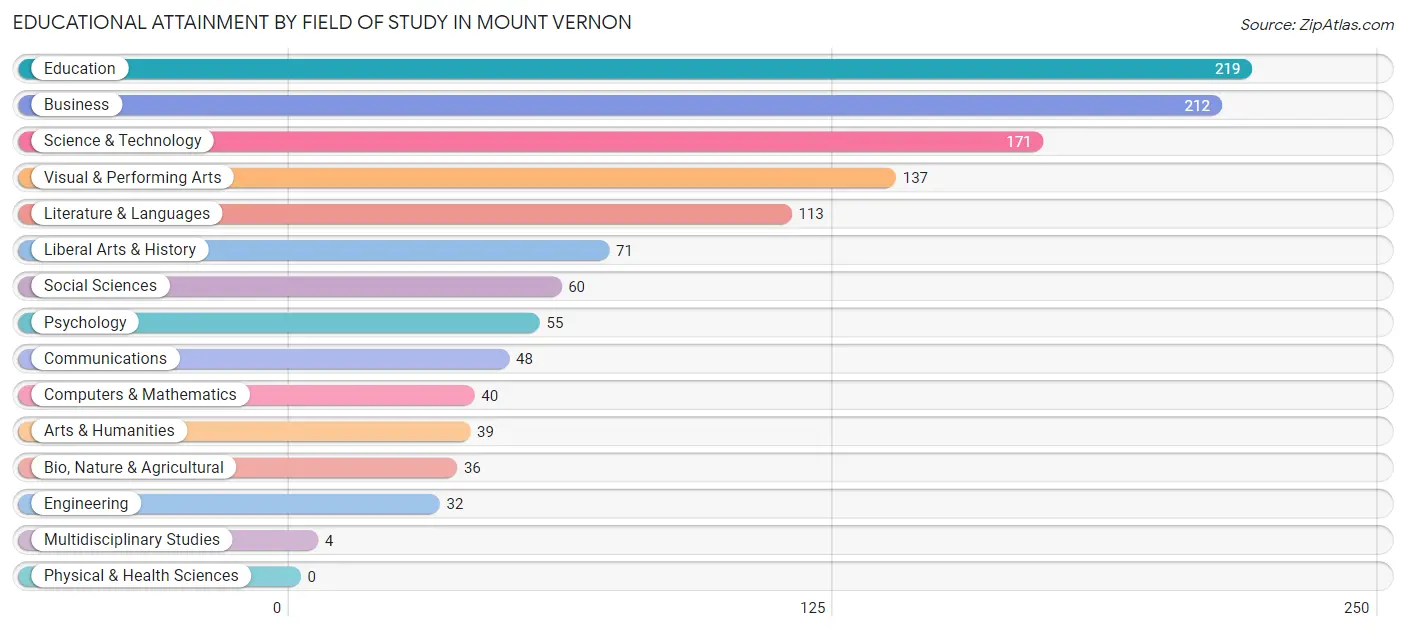
| Field of Study | # Graduates | % Graduates |
| Computers & Mathematics | 40 | 3.2% |
| Bio, Nature & Agricultural | 36 | 2.9% |
| Physical & Health Sciences | 0 | 0.0% |
| Psychology | 55 | 4.4% |
| Social Sciences | 60 | 4.9% |
| Engineering | 32 | 2.6% |
| Multidisciplinary Studies | 4 | 0.3% |
| Science & Technology | 171 | 13.8% |
| Business | 212 | 17.1% |
| Education | 219 | 17.7% |
| Literature & Languages | 113 | 9.1% |
| Liberal Arts & History | 71 | 5.7% |
| Visual & Performing Arts | 137 | 11.1% |
| Communications | 48 | 3.9% |
| Arts & Humanities | 39 | 3.2% |
| Total | 1,237 | 100.0% |
Transportation & Commute in Mount Vernon
Vehicle Availability by Sex in Mount Vernon
The most prevalent vehicle ownership categories in Mount Vernon are males with 2 vehicles (357, accounting for 46.9%) and females with 2 vehicles (461, making up 42.7%).
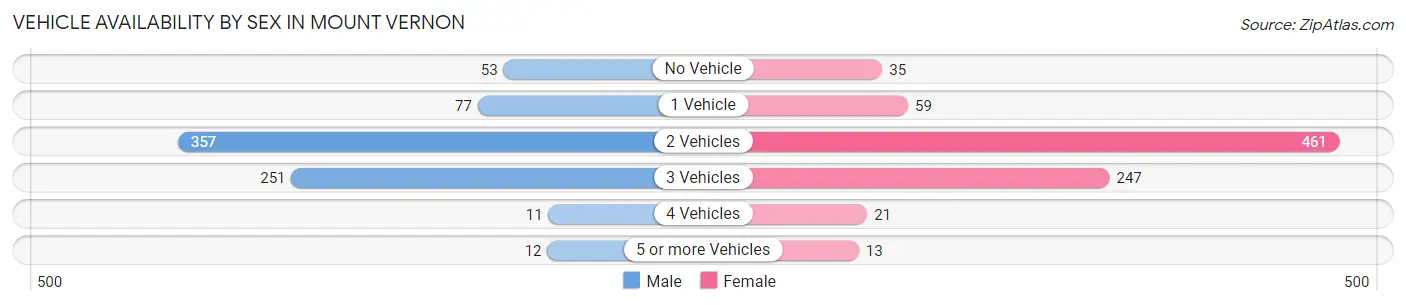
| Vehicles Available | Male | Female |
| No Vehicle | 53 (7.0%) | 35 (4.2%) |
| 1 Vehicle | 77 (10.1%) | 59 (7.1%) |
| 2 Vehicles | 357 (46.9%) | 461 (55.1%) |
| 3 Vehicles | 251 (33.0%) | 247 (29.5%) |
| 4 Vehicles | 11 (1.5%) | 21 (2.5%) |
| 5 or more Vehicles | 12 (1.6%) | 13 (1.6%) |
| Total | 761 (100.0%) | 836 (100.0%) |
Commute Time in Mount Vernon
The most frequently occuring commute durations in Mount Vernon are 20 to 24 minutes (347 commuters, 21.6%), 30 to 34 minutes (316 commuters, 19.7%), and less than 5 minutes (246 commuters, 15.3%).
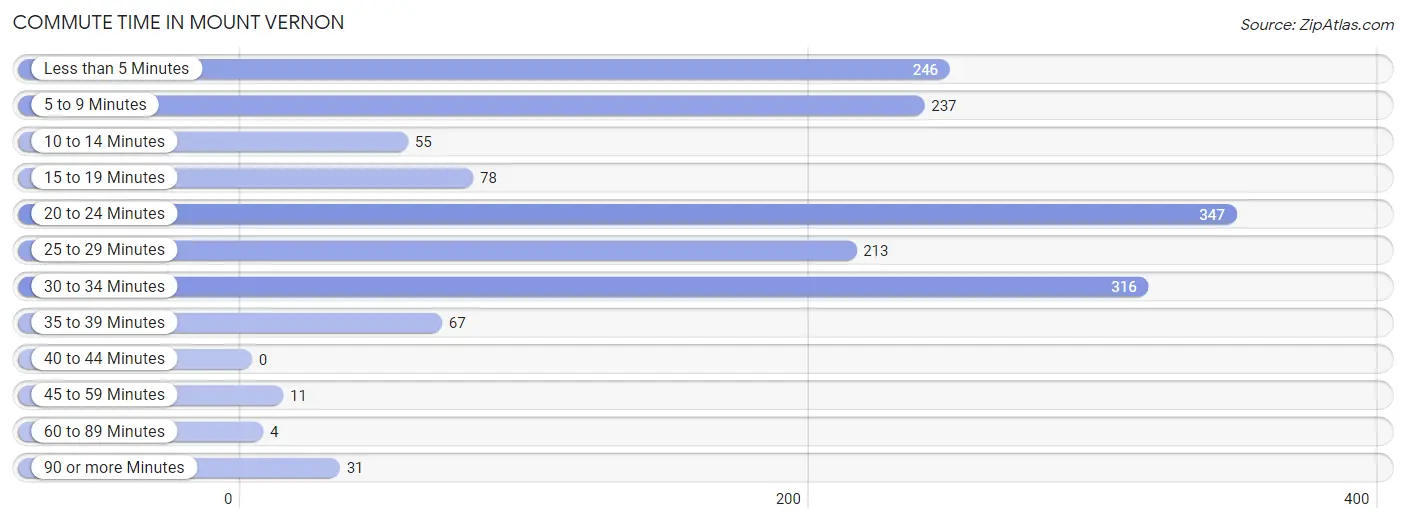
| Commute Time | # Commuters | % Commuters |
| Less than 5 Minutes | 246 | 15.3% |
| 5 to 9 Minutes | 237 | 14.8% |
| 10 to 14 Minutes | 55 | 3.4% |
| 15 to 19 Minutes | 78 | 4.9% |
| 20 to 24 Minutes | 347 | 21.6% |
| 25 to 29 Minutes | 213 | 13.3% |
| 30 to 34 Minutes | 316 | 19.7% |
| 35 to 39 Minutes | 67 | 4.2% |
| 40 to 44 Minutes | 0 | 0.0% |
| 45 to 59 Minutes | 11 | 0.7% |
| 60 to 89 Minutes | 4 | 0.3% |
| 90 or more Minutes | 31 | 1.9% |
Commute Time by Sex in Mount Vernon
The most common commute times in Mount Vernon are 20 to 24 minutes (230 commuters, 29.3%) for males and 30 to 34 minutes (185 commuters, 22.5%) for females.
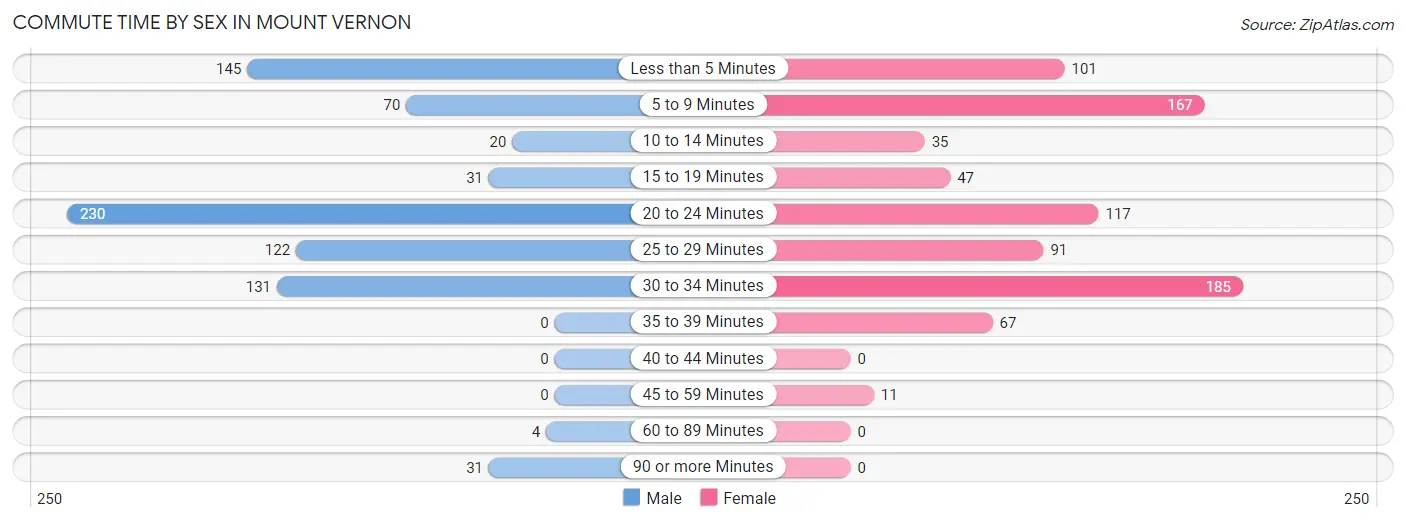
| Commute Time | Male | Female |
| Less than 5 Minutes | 145 (18.5%) | 101 (12.3%) |
| 5 to 9 Minutes | 70 (8.9%) | 167 (20.3%) |
| 10 to 14 Minutes | 20 (2.5%) | 35 (4.3%) |
| 15 to 19 Minutes | 31 (4.0%) | 47 (5.7%) |
| 20 to 24 Minutes | 230 (29.3%) | 117 (14.2%) |
| 25 to 29 Minutes | 122 (15.6%) | 91 (11.1%) |
| 30 to 34 Minutes | 131 (16.7%) | 185 (22.5%) |
| 35 to 39 Minutes | 0 (0.0%) | 67 (8.2%) |
| 40 to 44 Minutes | 0 (0.0%) | 0 (0.0%) |
| 45 to 59 Minutes | 0 (0.0%) | 11 (1.3%) |
| 60 to 89 Minutes | 4 (0.5%) | 0 (0.0%) |
| 90 or more Minutes | 31 (4.0%) | 0 (0.0%) |
Time of Departure to Work by Sex in Mount Vernon
The most frequent times of departure to work in Mount Vernon are 7:30 AM to 7:59 AM (163, 20.8%) for males and 4:00 PM to 11:59 PM (183, 22.3%) for females.
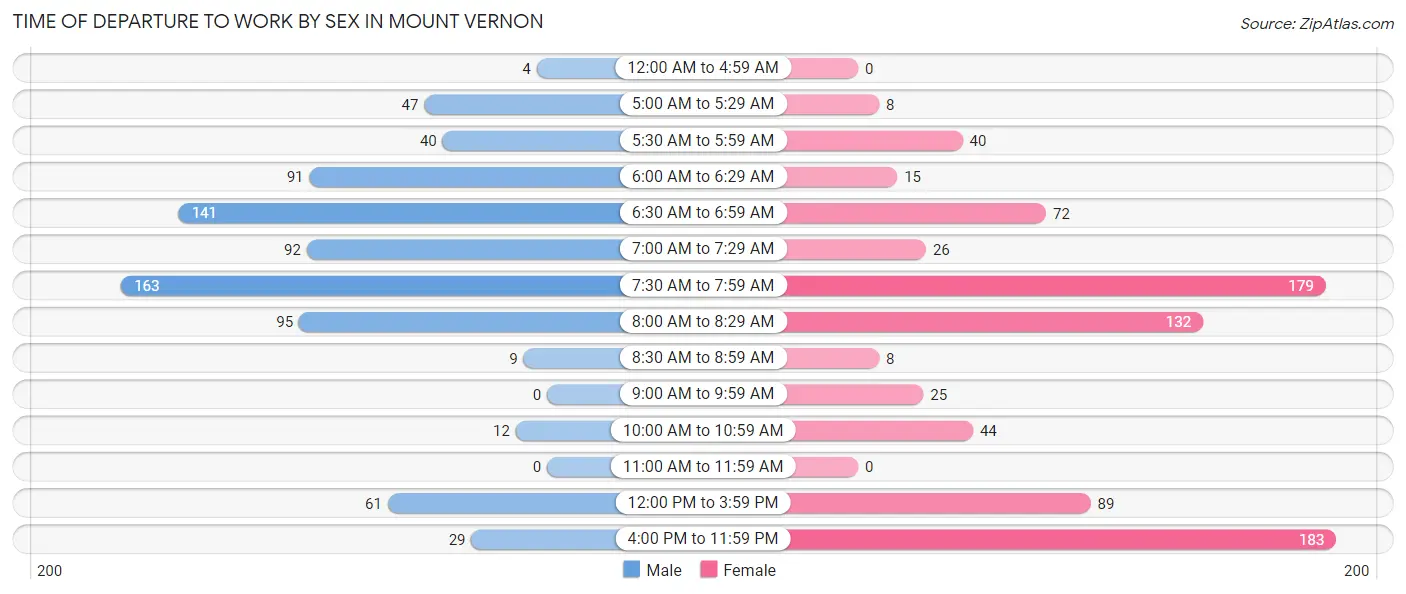
| Time of Departure | Male | Female |
| 12:00 AM to 4:59 AM | 4 (0.5%) | 0 (0.0%) |
| 5:00 AM to 5:29 AM | 47 (6.0%) | 8 (1.0%) |
| 5:30 AM to 5:59 AM | 40 (5.1%) | 40 (4.9%) |
| 6:00 AM to 6:29 AM | 91 (11.6%) | 15 (1.8%) |
| 6:30 AM to 6:59 AM | 141 (18.0%) | 72 (8.8%) |
| 7:00 AM to 7:29 AM | 92 (11.7%) | 26 (3.2%) |
| 7:30 AM to 7:59 AM | 163 (20.8%) | 179 (21.8%) |
| 8:00 AM to 8:29 AM | 95 (12.1%) | 132 (16.1%) |
| 8:30 AM to 8:59 AM | 9 (1.1%) | 8 (1.0%) |
| 9:00 AM to 9:59 AM | 0 (0.0%) | 25 (3.0%) |
| 10:00 AM to 10:59 AM | 12 (1.5%) | 44 (5.4%) |
| 11:00 AM to 11:59 AM | 0 (0.0%) | 0 (0.0%) |
| 12:00 PM to 3:59 PM | 61 (7.8%) | 89 (10.8%) |
| 4:00 PM to 11:59 PM | 29 (3.7%) | 183 (22.3%) |
| Total | 784 (100.0%) | 821 (100.0%) |
Housing Occupancy in Mount Vernon
Occupancy by Ownership in Mount Vernon
Of the total 1,158 dwellings in Mount Vernon, owner-occupied units account for 926 (80.0%), while renter-occupied units make up 232 (20.0%).
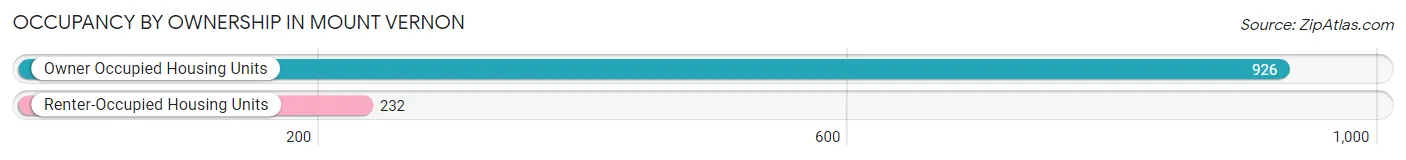
| Occupancy | # Housing Units | % Housing Units |
| Owner Occupied Housing Units | 926 | 80.0% |
| Renter-Occupied Housing Units | 232 | 20.0% |
| Total Occupied Housing Units | 1,158 | 100.0% |
Occupancy by Household Size in Mount Vernon
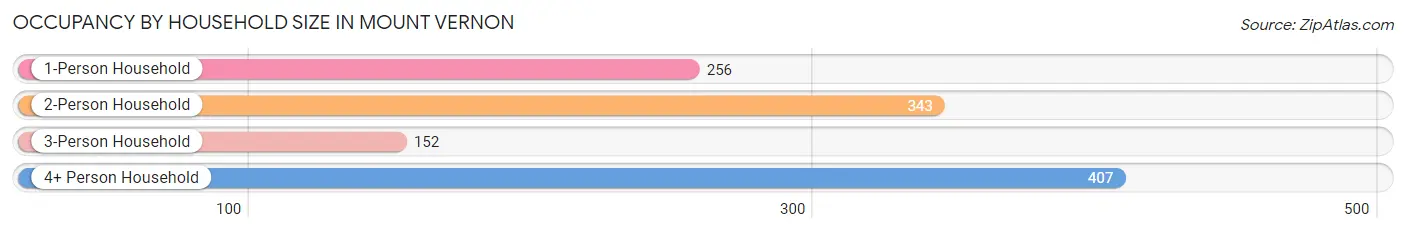
| Household Size | # Housing Units | % Housing Units |
| 1-Person Household | 256 | 22.1% |
| 2-Person Household | 343 | 29.6% |
| 3-Person Household | 152 | 13.1% |
| 4+ Person Household | 407 | 35.1% |
| Total Housing Units | 1,158 | 100.0% |
Occupancy by Ownership by Household Size in Mount Vernon
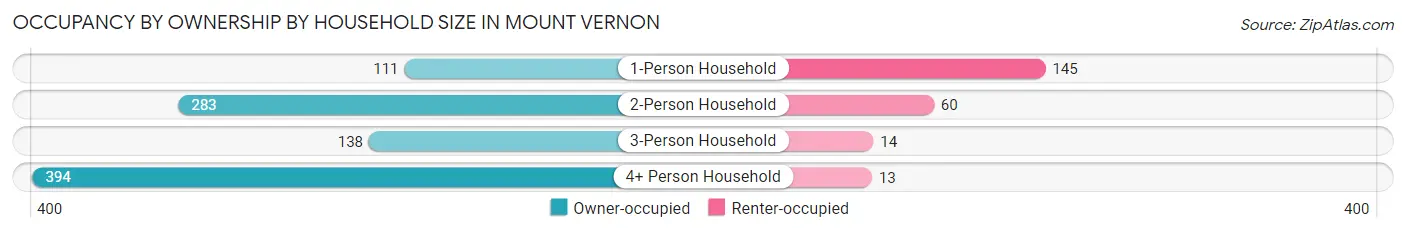
| Household Size | Owner-occupied | Renter-occupied |
| 1-Person Household | 111 (43.4%) | 145 (56.6%) |
| 2-Person Household | 283 (82.5%) | 60 (17.5%) |
| 3-Person Household | 138 (90.8%) | 14 (9.2%) |
| 4+ Person Household | 394 (96.8%) | 13 (3.2%) |
| Total Housing Units | 926 (80.0%) | 232 (20.0%) |
Occupancy by Educational Attainment in Mount Vernon
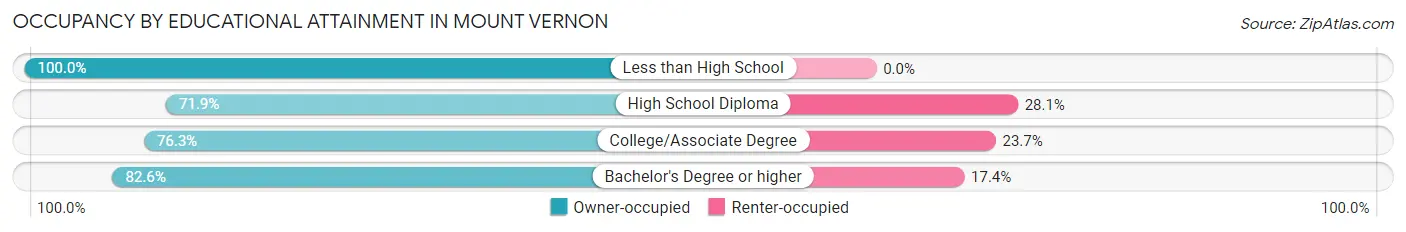
| Household Size | Owner-occupied | Renter-occupied |
| Less than High School | 54 (100.0%) | 0 (0.0%) |
| High School Diploma | 141 (71.9%) | 55 (28.1%) |
| College/Associate Degree | 229 (76.3%) | 71 (23.7%) |
| Bachelor's Degree or higher | 502 (82.6%) | 106 (17.4%) |
Occupancy by Age of Householder in Mount Vernon
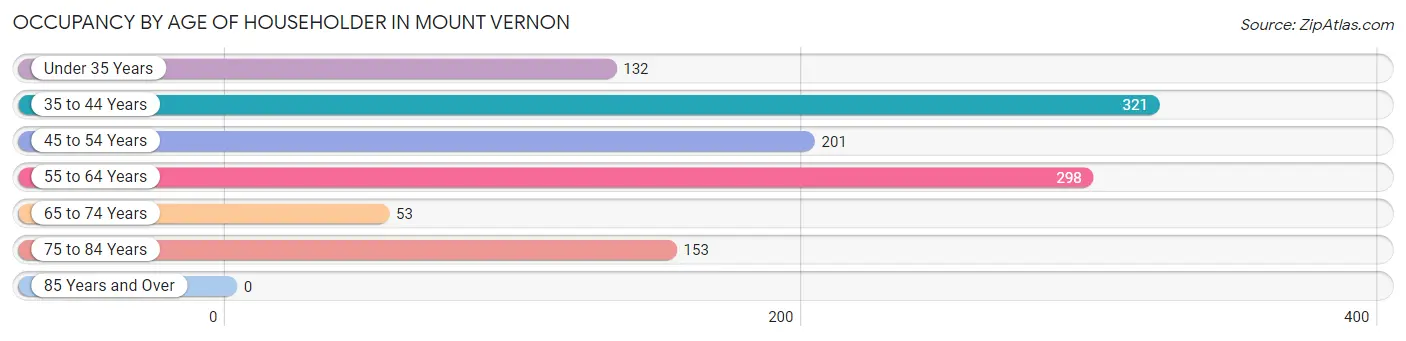
| Age Bracket | # Households | % Households |
| Under 35 Years | 132 | 11.4% |
| 35 to 44 Years | 321 | 27.7% |
| 45 to 54 Years | 201 | 17.4% |
| 55 to 64 Years | 298 | 25.7% |
| 65 to 74 Years | 53 | 4.6% |
| 75 to 84 Years | 153 | 13.2% |
| 85 Years and Over | 0 | 0.0% |
| Total | 1,158 | 100.0% |
Housing Finances in Mount Vernon
Median Income by Occupancy in Mount Vernon
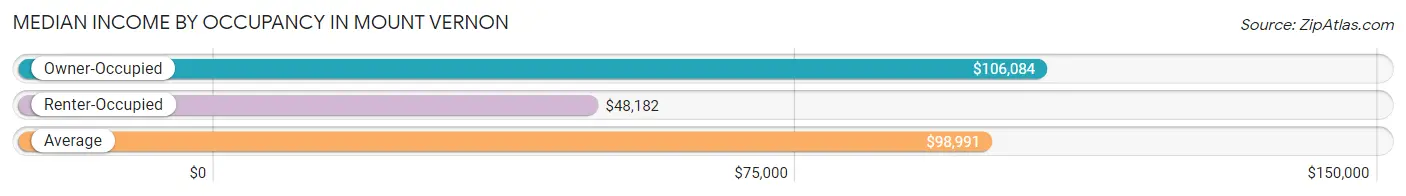
| Occupancy Type | # Households | Median Income |
| Owner-Occupied | 926 (80.0%) | $106,084 |
| Renter-Occupied | 232 (20.0%) | $48,182 |
| Average | 1,158 (100.0%) | $98,991 |
Occupancy by Householder Income Bracket in Mount Vernon
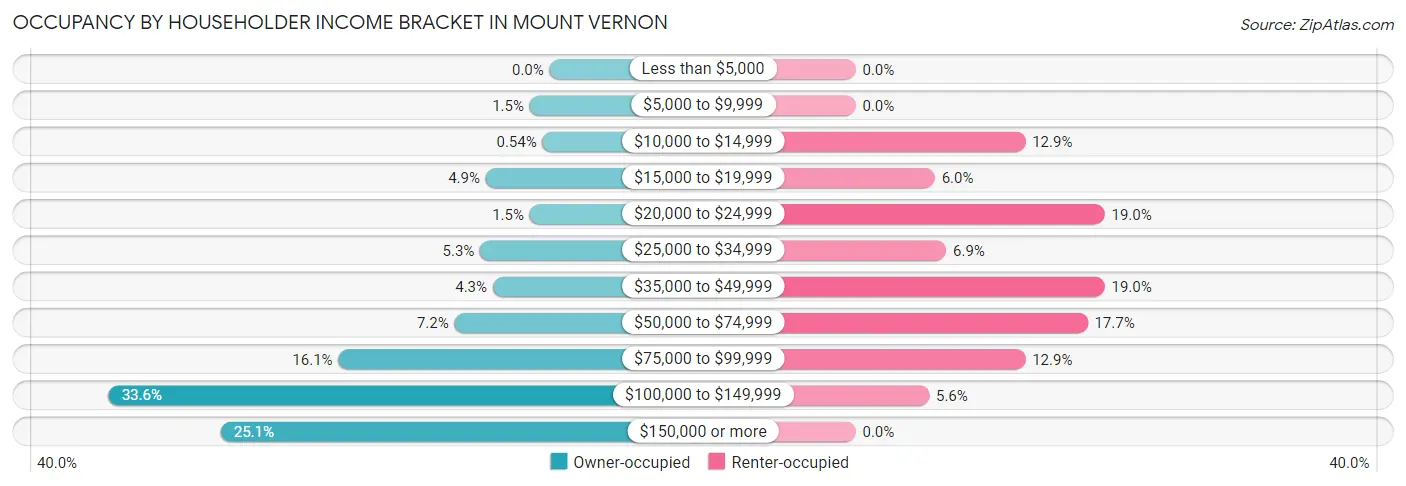
| Income Bracket | Owner-occupied | Renter-occupied |
| Less than $5,000 | 0 (0.0%) | 0 (0.0%) |
| $5,000 to $9,999 | 14 (1.5%) | 0 (0.0%) |
| $10,000 to $14,999 | 5 (0.5%) | 30 (12.9%) |
| $15,000 to $19,999 | 45 (4.9%) | 14 (6.0%) |
| $20,000 to $24,999 | 14 (1.5%) | 44 (19.0%) |
| $25,000 to $34,999 | 49 (5.3%) | 16 (6.9%) |
| $35,000 to $49,999 | 40 (4.3%) | 44 (19.0%) |
| $50,000 to $74,999 | 67 (7.2%) | 41 (17.7%) |
| $75,000 to $99,999 | 149 (16.1%) | 30 (12.9%) |
| $100,000 to $149,999 | 311 (33.6%) | 13 (5.6%) |
| $150,000 or more | 232 (25.1%) | 0 (0.0%) |
| Total | 926 (100.0%) | 232 (100.0%) |
Monthly Housing Cost Tiers in Mount Vernon
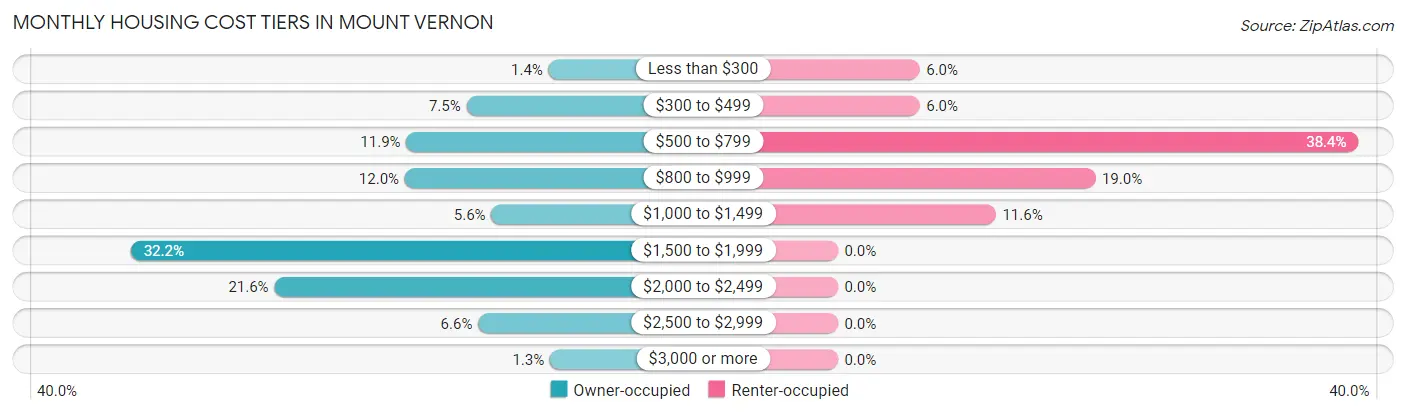
| Monthly Cost | Owner-occupied | Renter-occupied |
| Less than $300 | 13 (1.4%) | 14 (6.0%) |
| $300 to $499 | 69 (7.4%) | 14 (6.0%) |
| $500 to $799 | 110 (11.9%) | 89 (38.4%) |
| $800 to $999 | 111 (12.0%) | 44 (19.0%) |
| $1,000 to $1,499 | 52 (5.6%) | 27 (11.6%) |
| $1,500 to $1,999 | 298 (32.2%) | 0 (0.0%) |
| $2,000 to $2,499 | 200 (21.6%) | 0 (0.0%) |
| $2,500 to $2,999 | 61 (6.6%) | 0 (0.0%) |
| $3,000 or more | 12 (1.3%) | 0 (0.0%) |
| Total | 926 (100.0%) | 232 (100.0%) |
Physical Housing Characteristics in Mount Vernon
Housing Structures in Mount Vernon
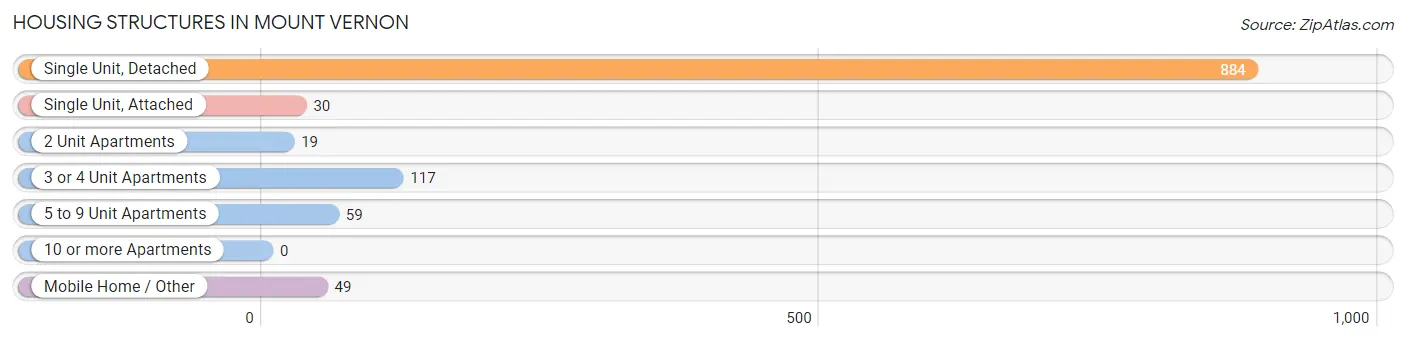
| Structure Type | # Housing Units | % Housing Units |
| Single Unit, Detached | 884 | 76.3% |
| Single Unit, Attached | 30 | 2.6% |
| 2 Unit Apartments | 19 | 1.6% |
| 3 or 4 Unit Apartments | 117 | 10.1% |
| 5 to 9 Unit Apartments | 59 | 5.1% |
| 10 or more Apartments | 0 | 0.0% |
| Mobile Home / Other | 49 | 4.2% |
| Total | 1,158 | 100.0% |
Housing Structures by Occupancy in Mount Vernon
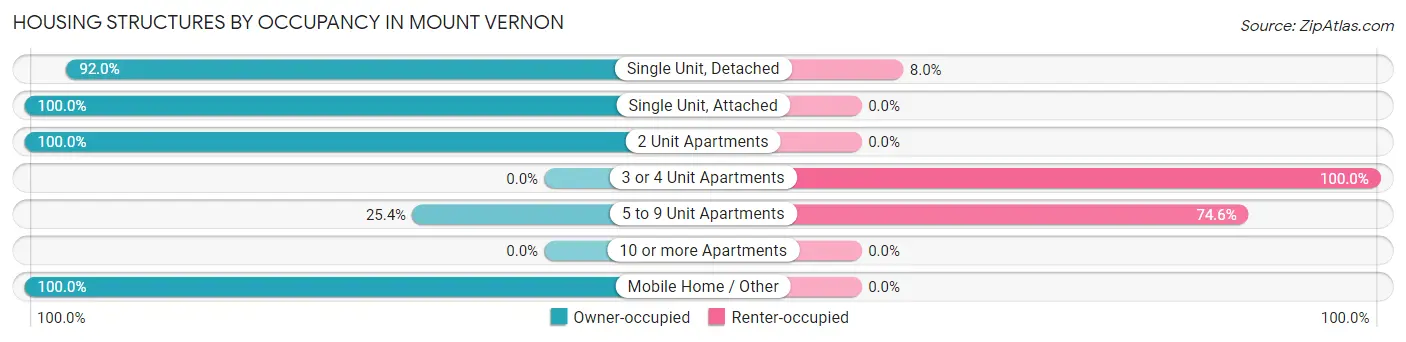
| Structure Type | Owner-occupied | Renter-occupied |
| Single Unit, Detached | 813 (92.0%) | 71 (8.0%) |
| Single Unit, Attached | 30 (100.0%) | 0 (0.0%) |
| 2 Unit Apartments | 19 (100.0%) | 0 (0.0%) |
| 3 or 4 Unit Apartments | 0 (0.0%) | 117 (100.0%) |
| 5 to 9 Unit Apartments | 15 (25.4%) | 44 (74.6%) |
| 10 or more Apartments | 0 (0.0%) | 0 (0.0%) |
| Mobile Home / Other | 49 (100.0%) | 0 (0.0%) |
| Total | 926 (80.0%) | 232 (20.0%) |
Housing Structures by Number of Rooms in Mount Vernon
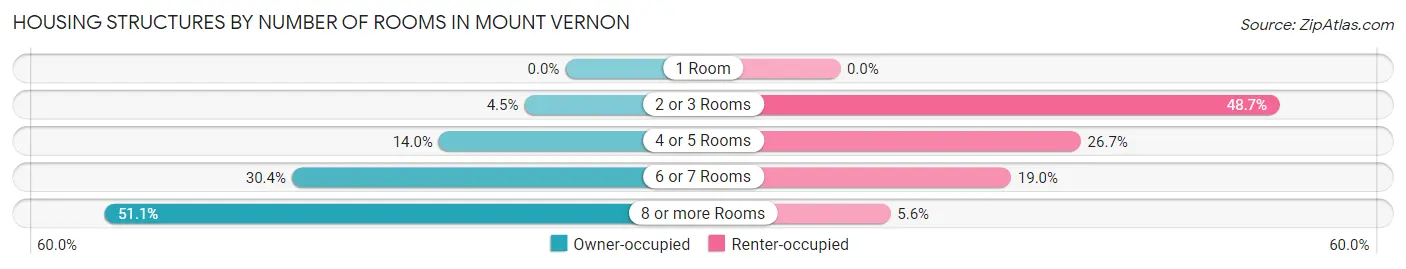
| Number of Rooms | Owner-occupied | Renter-occupied |
| 1 Room | 0 (0.0%) | 0 (0.0%) |
| 2 or 3 Rooms | 42 (4.5%) | 113 (48.7%) |
| 4 or 5 Rooms | 130 (14.0%) | 62 (26.7%) |
| 6 or 7 Rooms | 281 (30.3%) | 44 (19.0%) |
| 8 or more Rooms | 473 (51.1%) | 13 (5.6%) |
| Total | 926 (100.0%) | 232 (100.0%) |
Housing Structure by Heating Type in Mount Vernon
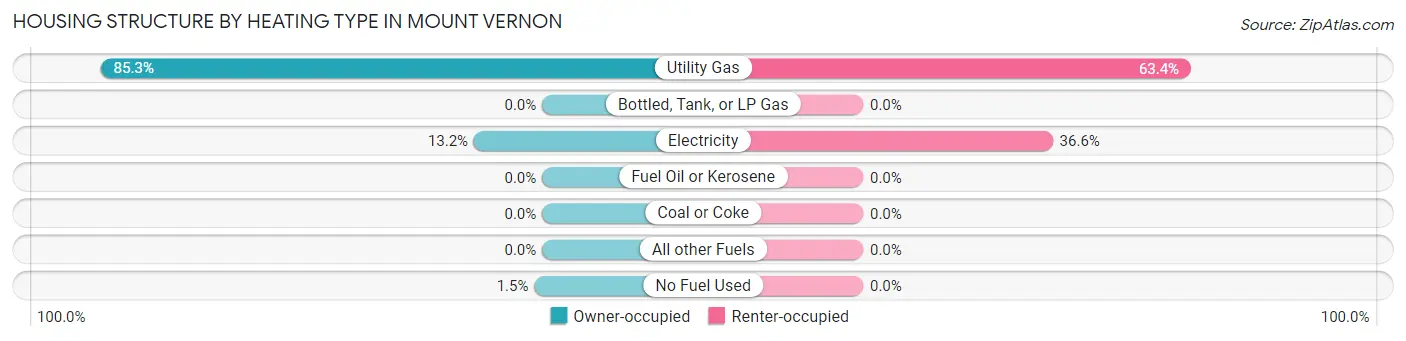
| Heating Type | Owner-occupied | Renter-occupied |
| Utility Gas | 790 (85.3%) | 147 (63.4%) |
| Bottled, Tank, or LP Gas | 0 (0.0%) | 0 (0.0%) |
| Electricity | 122 (13.2%) | 85 (36.6%) |
| Fuel Oil or Kerosene | 0 (0.0%) | 0 (0.0%) |
| Coal or Coke | 0 (0.0%) | 0 (0.0%) |
| All other Fuels | 0 (0.0%) | 0 (0.0%) |
| No Fuel Used | 14 (1.5%) | 0 (0.0%) |
| Total | 926 (100.0%) | 232 (100.0%) |
Household Vehicle Usage in Mount Vernon
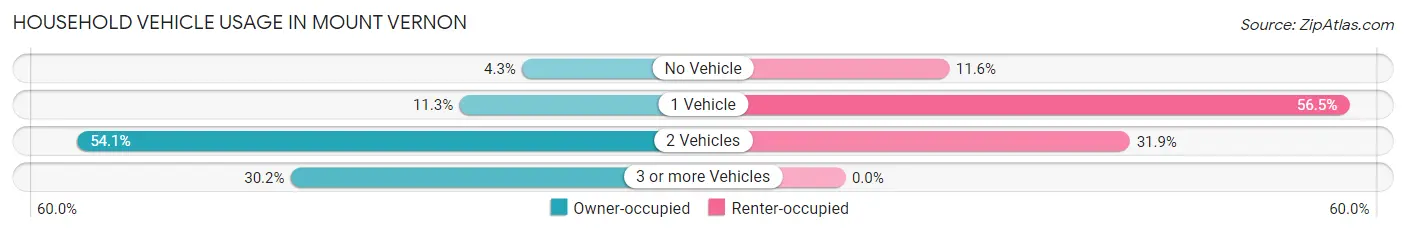
| Vehicles per Household | Owner-occupied | Renter-occupied |
| No Vehicle | 40 (4.3%) | 27 (11.6%) |
| 1 Vehicle | 105 (11.3%) | 131 (56.5%) |
| 2 Vehicles | 501 (54.1%) | 74 (31.9%) |
| 3 or more Vehicles | 280 (30.2%) | 0 (0.0%) |
| Total | 926 (100.0%) | 232 (100.0%) |
Real Estate & Mortgages in Mount Vernon
Real Estate and Mortgage Overview in Mount Vernon
| Characteristic | Without Mortgage | With Mortgage |
| Housing Units | 261 | 665 |
| Median Property Value | $211,100 | $250,800 |
| Median Household Income | $68,646 | $187 |
| Monthly Housing Costs | $650 | $12 |
| Real Estate Taxes | $3,349 | $0 |
Property Value by Mortgage Status in Mount Vernon
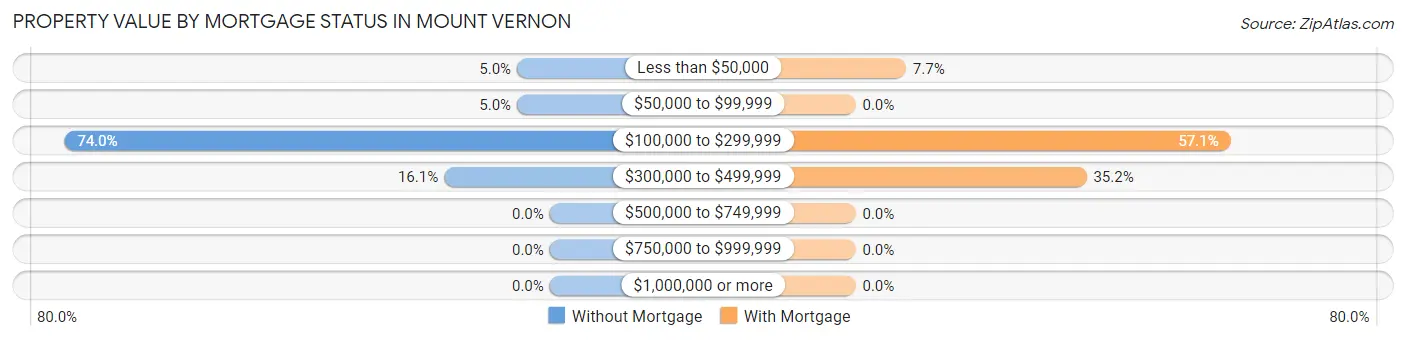
| Property Value | Without Mortgage | With Mortgage |
| Less than $50,000 | 13 (5.0%) | 51 (7.7%) |
| $50,000 to $99,999 | 13 (5.0%) | 0 (0.0%) |
| $100,000 to $299,999 | 193 (74.0%) | 380 (57.1%) |
| $300,000 to $499,999 | 42 (16.1%) | 234 (35.2%) |
| $500,000 to $749,999 | 0 (0.0%) | 0 (0.0%) |
| $750,000 to $999,999 | 0 (0.0%) | 0 (0.0%) |
| $1,000,000 or more | 0 (0.0%) | 0 (0.0%) |
| Total | 261 (100.0%) | 665 (100.0%) |
Household Income by Mortgage Status in Mount Vernon
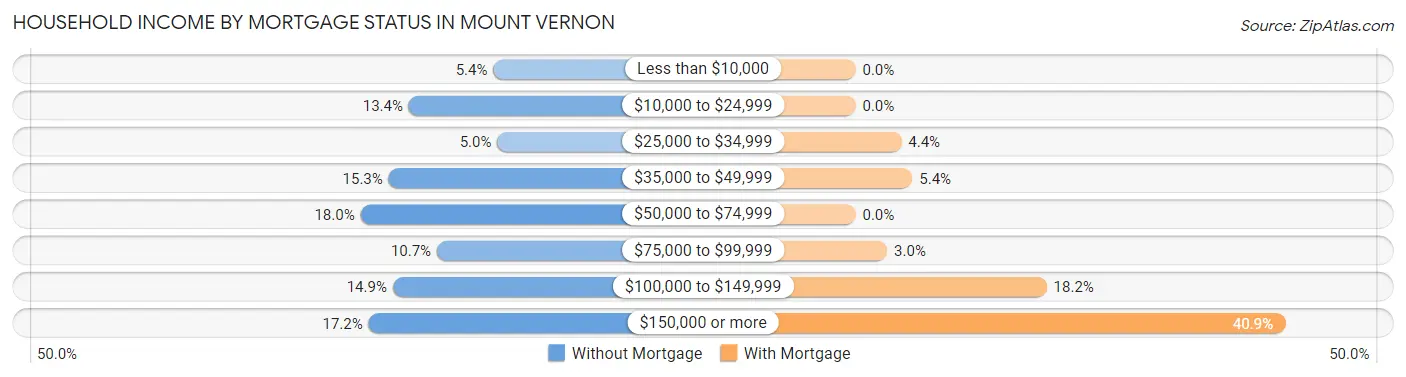
| Household Income | Without Mortgage | With Mortgage |
| Less than $10,000 | 14 (5.4%) | 0 (0.0%) |
| $10,000 to $24,999 | 35 (13.4%) | 0 (0.0%) |
| $25,000 to $34,999 | 13 (5.0%) | 29 (4.4%) |
| $35,000 to $49,999 | 40 (15.3%) | 36 (5.4%) |
| $50,000 to $74,999 | 47 (18.0%) | 0 (0.0%) |
| $75,000 to $99,999 | 28 (10.7%) | 20 (3.0%) |
| $100,000 to $149,999 | 39 (14.9%) | 121 (18.2%) |
| $150,000 or more | 45 (17.2%) | 272 (40.9%) |
| Total | 261 (100.0%) | 665 (100.0%) |
Property Value to Household Income Ratio in Mount Vernon
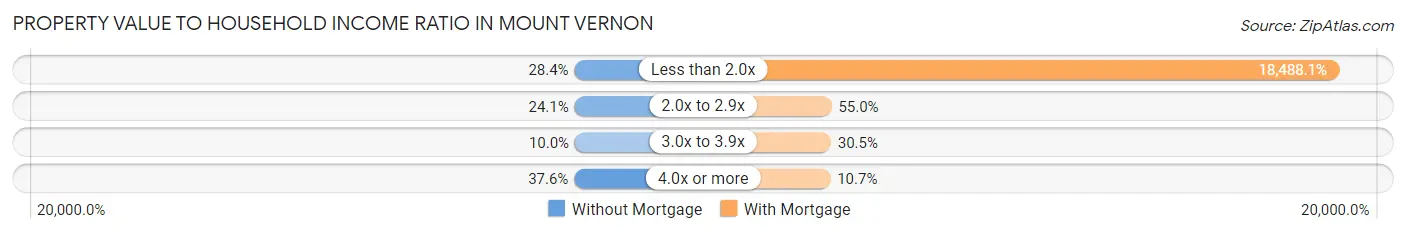
| Value-to-Income Ratio | Without Mortgage | With Mortgage |
| Less than 2.0x | 74 (28.3%) | 122,946 (18,488.1%) |
| 2.0x to 2.9x | 63 (24.1%) | 366 (55.0%) |
| 3.0x to 3.9x | 26 (10.0%) | 203 (30.5%) |
| 4.0x or more | 98 (37.6%) | 71 (10.7%) |
| Total | 261 (100.0%) | 665 (100.0%) |
Real Estate Taxes by Mortgage Status in Mount Vernon
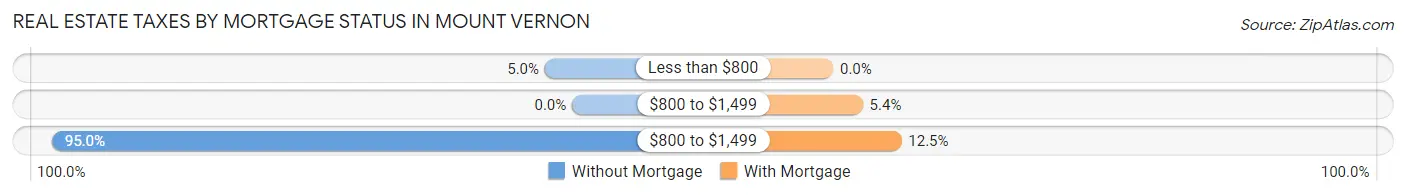
| Property Taxes | Without Mortgage | With Mortgage |
| Less than $800 | 13 (5.0%) | 0 (0.0%) |
| $800 to $1,499 | 0 (0.0%) | 36 (5.4%) |
| $800 to $1,499 | 248 (95.0%) | 83 (12.5%) |
| Total | 261 (100.0%) | 665 (100.0%) |
Health & Disability in Mount Vernon
Health Insurance Coverage by Age in Mount Vernon
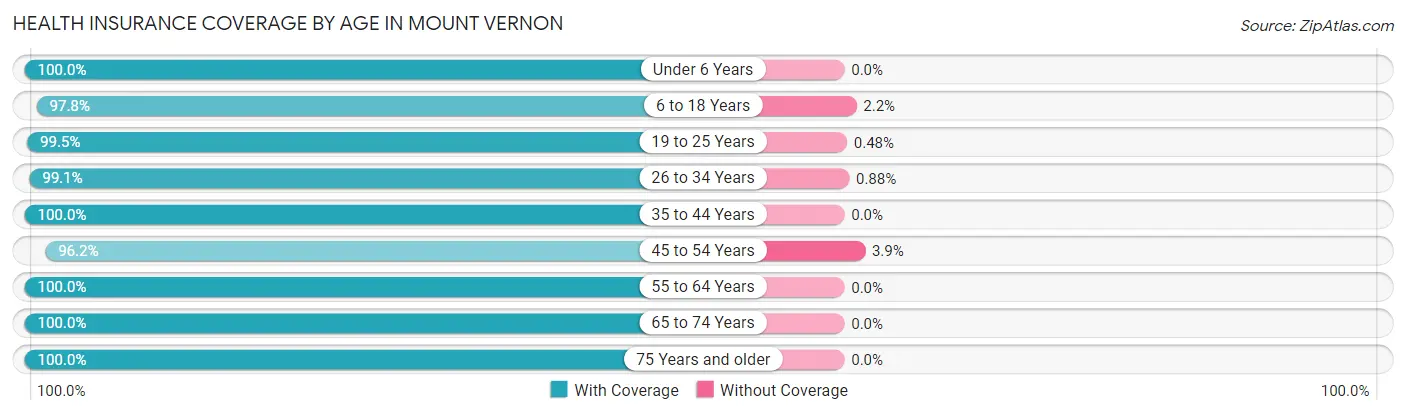
| Age Bracket | With Coverage | Without Coverage |
| Under 6 Years | 190 (100.0%) | 0 (0.0%) |
| 6 to 18 Years | 1,399 (97.8%) | 32 (2.2%) |
| 19 to 25 Years | 824 (99.5%) | 4 (0.5%) |
| 26 to 34 Years | 226 (99.1%) | 2 (0.9%) |
| 35 to 44 Years | 602 (100.0%) | 0 (0.0%) |
| 45 to 54 Years | 325 (96.2%) | 13 (3.8%) |
| 55 to 64 Years | 514 (100.0%) | 0 (0.0%) |
| 65 to 74 Years | 167 (100.0%) | 0 (0.0%) |
| 75 Years and older | 209 (100.0%) | 0 (0.0%) |
| Total | 4,456 (98.9%) | 51 (1.1%) |
Health Insurance Coverage by Citizenship Status in Mount Vernon
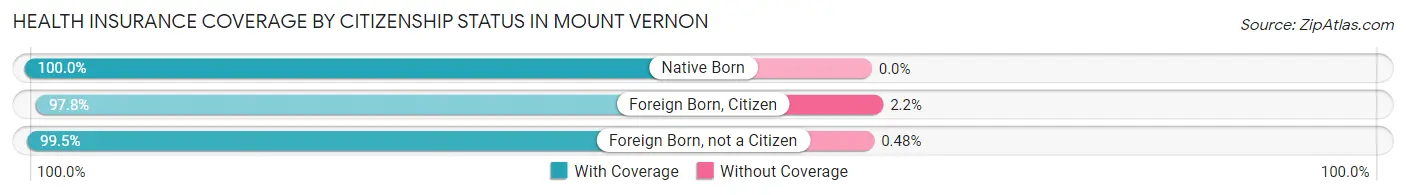
| Citizenship Status | With Coverage | Without Coverage |
| Native Born | 190 (100.0%) | 0 (0.0%) |
| Foreign Born, Citizen | 1,399 (97.8%) | 32 (2.2%) |
| Foreign Born, not a Citizen | 824 (99.5%) | 4 (0.5%) |
Health Insurance Coverage by Household Income in Mount Vernon
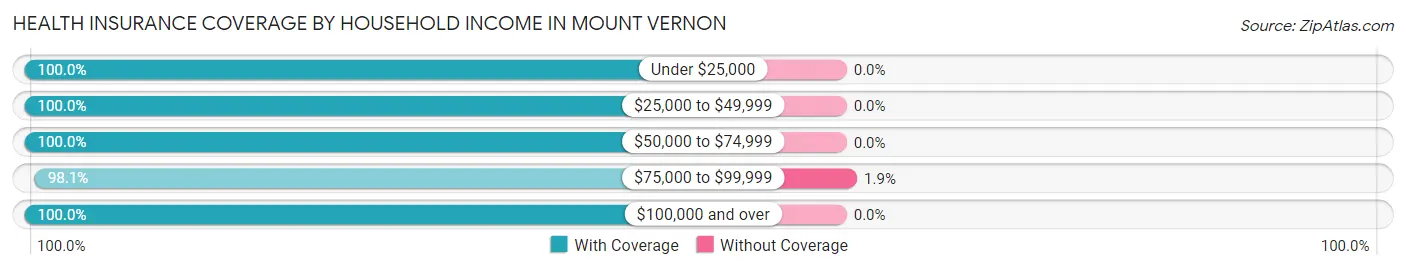
| Household Income | With Coverage | Without Coverage |
| Under $25,000 | 182 (100.0%) | 0 (0.0%) |
| $25,000 to $49,999 | 320 (100.0%) | 0 (0.0%) |
| $50,000 to $74,999 | 220 (100.0%) | 0 (0.0%) |
| $75,000 to $99,999 | 656 (98.1%) | 13 (1.9%) |
| $100,000 and over | 2,100 (100.0%) | 0 (0.0%) |
Public vs Private Health Insurance Coverage by Age in Mount Vernon
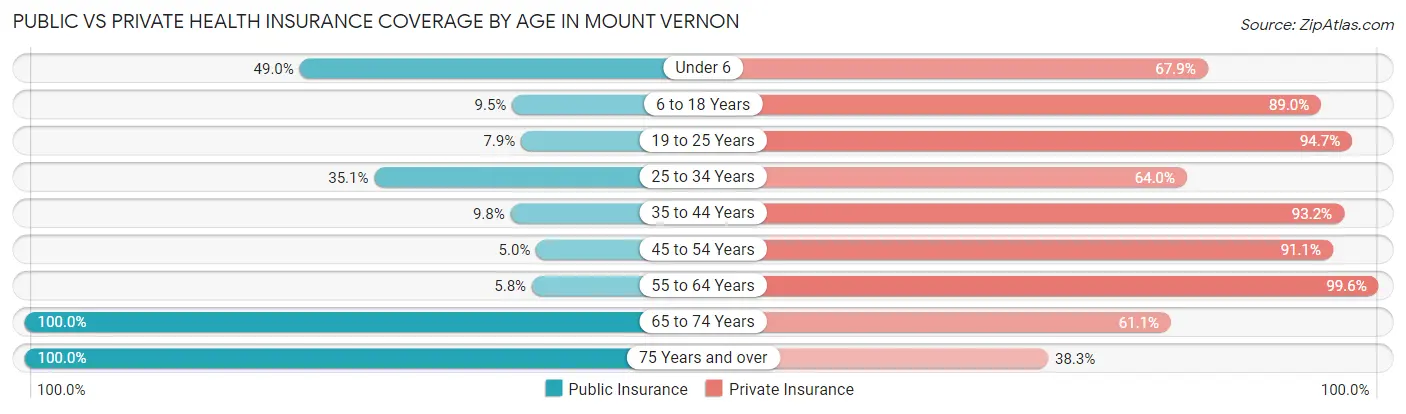
| Age Bracket | Public Insurance | Private Insurance |
| Under 6 | 93 (48.9%) | 129 (67.9%) |
| 6 to 18 Years | 136 (9.5%) | 1,273 (89.0%) |
| 19 to 25 Years | 65 (7.9%) | 784 (94.7%) |
| 25 to 34 Years | 80 (35.1%) | 146 (64.0%) |
| 35 to 44 Years | 59 (9.8%) | 561 (93.2%) |
| 45 to 54 Years | 17 (5.0%) | 308 (91.1%) |
| 55 to 64 Years | 30 (5.8%) | 512 (99.6%) |
| 65 to 74 Years | 167 (100.0%) | 102 (61.1%) |
| 75 Years and over | 209 (100.0%) | 80 (38.3%) |
| Total | 856 (19.0%) | 3,895 (86.4%) |
Disability Status by Sex by Age in Mount Vernon
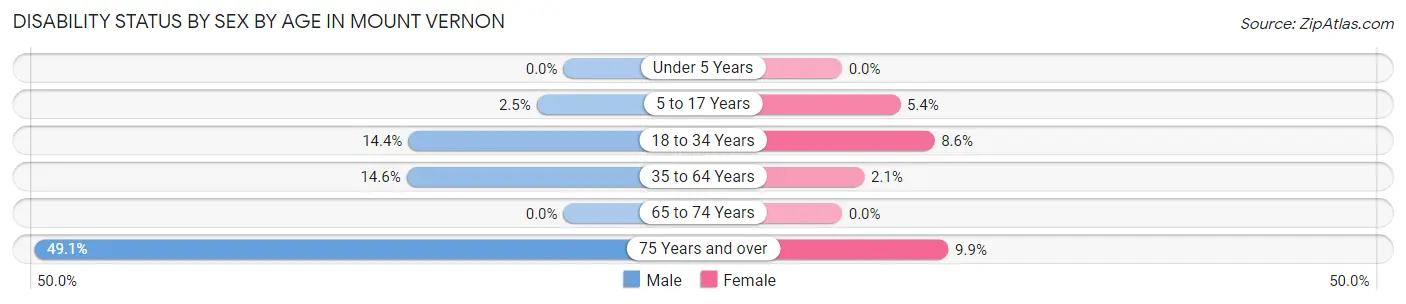
| Age Bracket | Male | Female |
| Under 5 Years | 0 (0.0%) | 0 (0.0%) |
| 5 to 17 Years | 12 (2.5%) | 35 (5.4%) |
| 18 to 34 Years | 87 (14.4%) | 68 (8.6%) |
| 35 to 64 Years | 106 (14.6%) | 15 (2.1%) |
| 65 to 74 Years | 0 (0.0%) | 0 (0.0%) |
| 75 Years and over | 28 (49.1%) | 15 (9.9%) |
Disability Class by Sex by Age in Mount Vernon
Disability Class: Hearing Difficulty
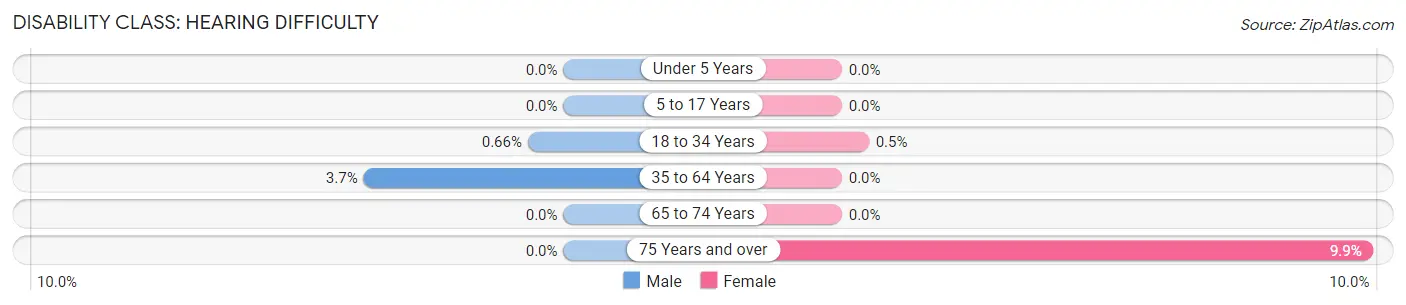
| Age Bracket | Male | Female |
| Under 5 Years | 0 (0.0%) | 0 (0.0%) |
| 5 to 17 Years | 0 (0.0%) | 0 (0.0%) |
| 18 to 34 Years | 4 (0.7%) | 4 (0.5%) |
| 35 to 64 Years | 27 (3.7%) | 0 (0.0%) |
| 65 to 74 Years | 0 (0.0%) | 0 (0.0%) |
| 75 Years and over | 0 (0.0%) | 15 (9.9%) |
Disability Class: Vision Difficulty
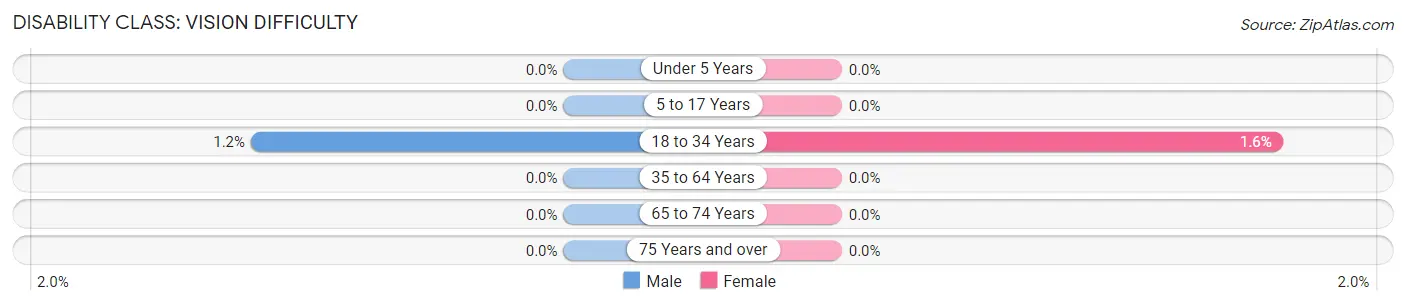
| Age Bracket | Male | Female |
| Under 5 Years | 0 (0.0%) | 0 (0.0%) |
| 5 to 17 Years | 0 (0.0%) | 0 (0.0%) |
| 18 to 34 Years | 7 (1.2%) | 13 (1.6%) |
| 35 to 64 Years | 0 (0.0%) | 0 (0.0%) |
| 65 to 74 Years | 0 (0.0%) | 0 (0.0%) |
| 75 Years and over | 0 (0.0%) | 0 (0.0%) |
Disability Class: Cognitive Difficulty
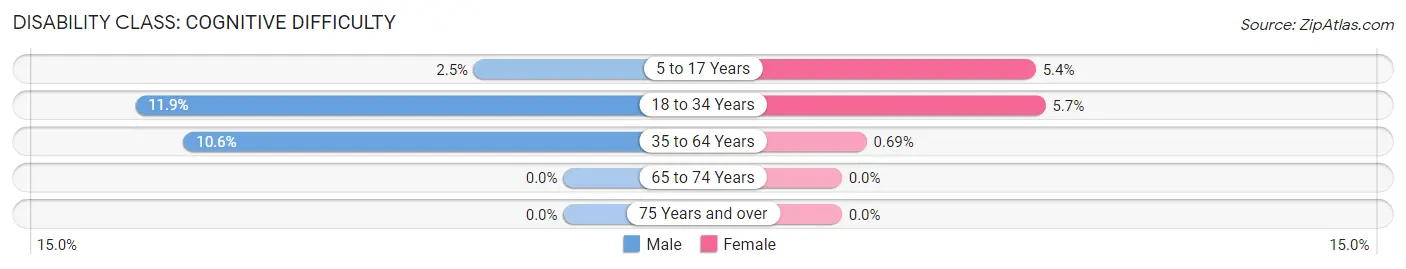
| Age Bracket | Male | Female |
| 5 to 17 Years | 12 (2.5%) | 35 (5.4%) |
| 18 to 34 Years | 72 (11.9%) | 45 (5.7%) |
| 35 to 64 Years | 77 (10.6%) | 5 (0.7%) |
| 65 to 74 Years | 0 (0.0%) | 0 (0.0%) |
| 75 Years and over | 0 (0.0%) | 0 (0.0%) |
Disability Class: Ambulatory Difficulty
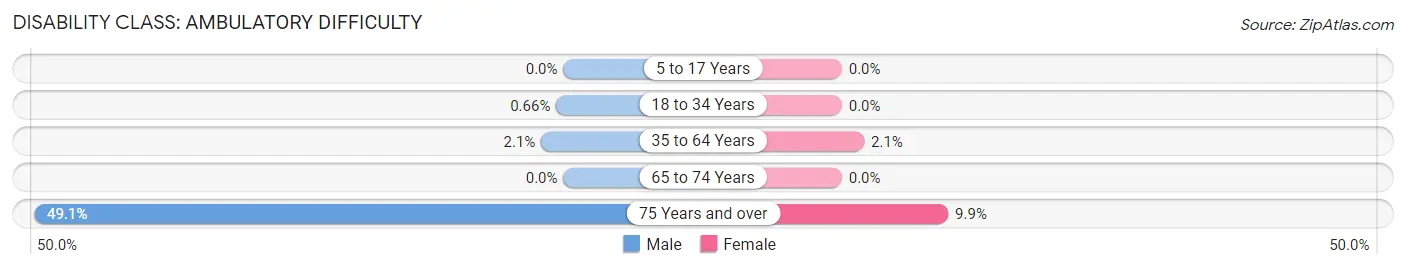
| Age Bracket | Male | Female |
| 5 to 17 Years | 0 (0.0%) | 0 (0.0%) |
| 18 to 34 Years | 4 (0.7%) | 0 (0.0%) |
| 35 to 64 Years | 15 (2.1%) | 15 (2.1%) |
| 65 to 74 Years | 0 (0.0%) | 0 (0.0%) |
| 75 Years and over | 28 (49.1%) | 15 (9.9%) |
Disability Class: Self-Care Difficulty
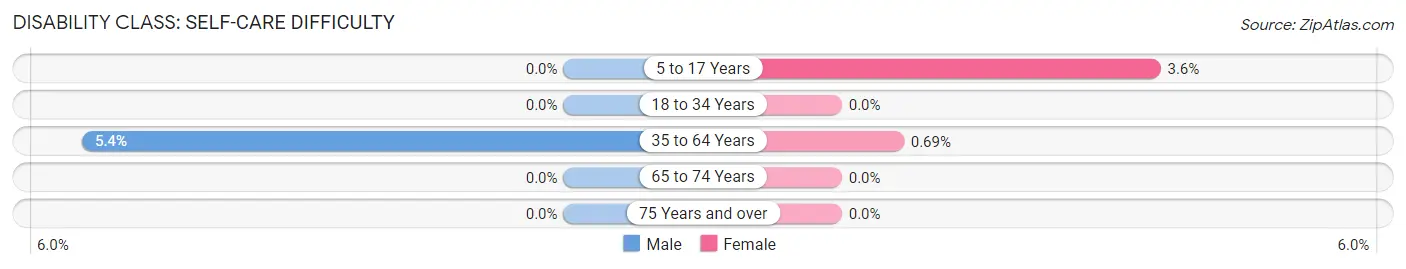
| Age Bracket | Male | Female |
| 5 to 17 Years | 0 (0.0%) | 23 (3.5%) |
| 18 to 34 Years | 0 (0.0%) | 0 (0.0%) |
| 35 to 64 Years | 39 (5.4%) | 5 (0.7%) |
| 65 to 74 Years | 0 (0.0%) | 0 (0.0%) |
| 75 Years and over | 0 (0.0%) | 0 (0.0%) |
Technology Access in Mount Vernon
Computing Device Access in Mount Vernon
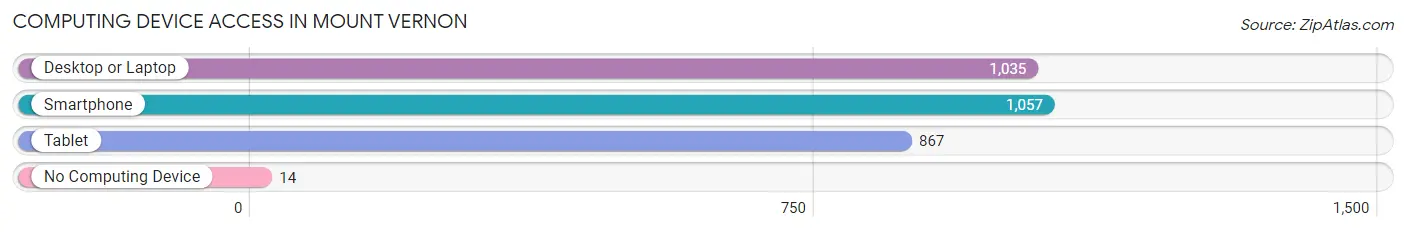
| Device Type | # Households | % Households |
| Desktop or Laptop | 1,035 | 89.4% |
| Smartphone | 1,057 | 91.3% |
| Tablet | 867 | 74.9% |
| No Computing Device | 14 | 1.2% |
| Total | 1,158 | 100.0% |
Internet Access in Mount Vernon
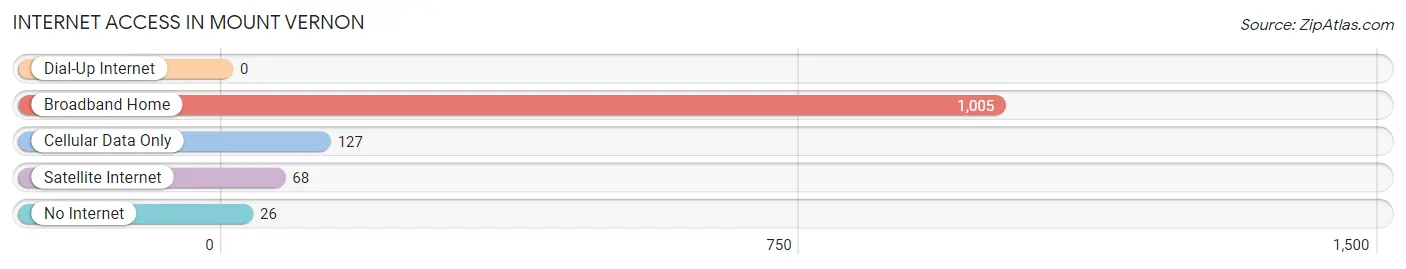
| Internet Type | # Households | % Households |
| Dial-Up Internet | 0 | 0.0% |
| Broadband Home | 1,005 | 86.8% |
| Cellular Data Only | 127 | 11.0% |
| Satellite Internet | 68 | 5.9% |
| No Internet | 26 | 2.2% |
| Total | 1,158 | 100.0% |
Mount Vernon Summary
Introduction
Mount Vernon, Iowa is a small city located in Linn County, Iowa. It is part of the Cedar Rapids Metropolitan Statistical Area and is located just east of Cedar Rapids. The city has a population of 4,506 as of the 2010 census. The city is known for its historic downtown, which is home to many businesses and restaurants.
History
Mount Vernon was founded in 1847 by a group of settlers from Mount Vernon, Ohio. The city was named after the Ohio town, which was named after George Washington's home in Virginia. The city was incorporated in 1857 and has been growing ever since.
The city was an important stop on the Chicago, Rock Island and Pacific Railroad, which ran through the city until the 1970s. The railroad was a major factor in the city's growth and development.
The city was also home to the Mount Vernon Car Company, which manufactured railroad cars from 1887 to 1929. The company was a major employer in the city and helped to spur economic growth.
Geography
Mount Vernon is located in Linn County, Iowa, just east of Cedar Rapids. The city is situated on the banks of the Cedar River and is surrounded by rolling hills and farmland. The city has a total area of 4.2 square miles, all of which is land.
The climate in Mount Vernon is humid continental, with hot summers and cold winters. The average temperature in the summer is around 75 degrees Fahrenheit, while the average temperature in the winter is around 25 degrees Fahrenheit.
Economy
The economy of Mount Vernon is largely based on agriculture and manufacturing. The city is home to several large agricultural companies, including Pioneer Hi-Bred International, Inc., which produces corn and soybean seed. The city is also home to several manufacturing companies, including the Mount Vernon Car Company, which produces railroad cars.
The city is also home to several retail stores, restaurants, and other businesses. The city is home to several banks, including Bank of the West and U.S. Bank.
Demographics
As of the 2010 census, the population of Mount Vernon was 4,506. The racial makeup of the city was 95.3% White, 1.2% African American, 0.3% Native American, 0.7% Asian, 0.1% Pacific Islander, 0.7% from other races, and 1.9% from two or more races. Hispanic or Latino of any race were 2.2% of the population.
The median income for a household in the city was $45,938, and the median income for a family was $54,938. The per capita income for the city was $21,938. About 8.2% of families and 10.2% of the population were below the poverty line, including 14.2% of those under age 18 and 6.2% of those age 65 or over.
Conclusion
Mount Vernon, Iowa is a small city located in Linn County, Iowa. It is part of the Cedar Rapids Metropolitan Statistical Area and is located just east of Cedar Rapids. The city has a population of 4,506 as of the 2010 census. The city is known for its historic downtown, which is home to many businesses and restaurants. The economy of Mount Vernon is largely based on agriculture and manufacturing, and the city is home to several large agricultural companies and manufacturing companies. The racial makeup of the city is 95.3% White, 1.2% African American, 0.3% Native American, 0.7% Asian, 0.1% Pacific Islander, 0.7% from other races, and 1.9% from two or more races. The median income for a household in the city was $45,938, and the median income for a family was $54,938.
Common Questions
What is Per Capita Income in Mount Vernon?
Per Capita income in Mount Vernon is $31,147.
What is the Median Family Income in Mount Vernon?
Median Family Income in Mount Vernon is $107,078.
What is the Median Household income in Mount Vernon?
Median Household Income in Mount Vernon is $98,991.
What is Income or Wage Gap in Mount Vernon?
Income or Wage Gap in Mount Vernon is 14.4%.
Women in Mount Vernon earn 85.6 cents for every dollar earned by a man.
What is Inequality or Gini Index in Mount Vernon?
Inequality or Gini Index in Mount Vernon is 0.44.
What is the Total Population of Mount Vernon?
Total Population of Mount Vernon is 4,529.
What is the Total Male Population of Mount Vernon?
Total Male Population of Mount Vernon is 2,053.
What is the Total Female Population of Mount Vernon?
Total Female Population of Mount Vernon is 2,476.
What is the Ratio of Males per 100 Females in Mount Vernon?
There are 82.92 Males per 100 Females in Mount Vernon.
What is the Ratio of Females per 100 Males in Mount Vernon?
There are 120.60 Females per 100 Males in Mount Vernon.
What is the Median Population Age in Mount Vernon?
Median Population Age in Mount Vernon is 21.3 Years.
What is the Average Family Size in Mount Vernon
Average Family Size in Mount Vernon is 3.6 People.
What is the Average Household Size in Mount Vernon
Average Household Size in Mount Vernon is 3.0 People.
How Large is the Labor Force in Mount Vernon?
There are 2,171 People in the Labor Forcein in Mount Vernon.
What is the Percentage of People in the Labor Force in Mount Vernon?
62.2% of People are in the Labor Force in Mount Vernon.
What is the Unemployment Rate in Mount Vernon?
Unemployment Rate in Mount Vernon is 4.9%.