Glen Haven, WI Map & Demographics
Glen Haven Map
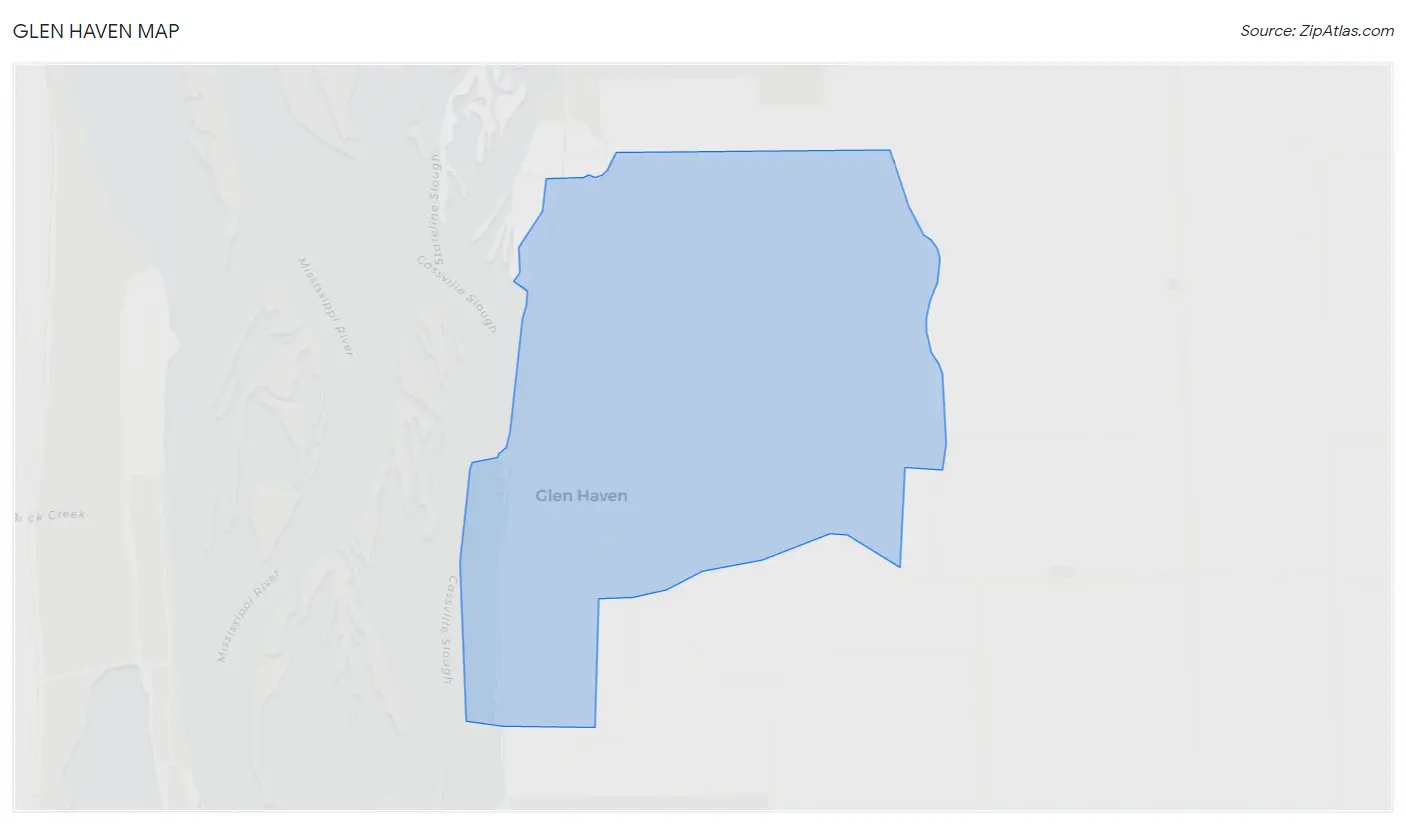
Glen Haven Overview
$37,102
PER CAPITA INCOME
$68,929
AVG FAMILY INCOME
$67,857
AVG HOUSEHOLD INCOME
0.26
INEQUALITY / GINI INDEX
41
TOTAL POPULATION
17
MALE POPULATION
24
FEMALE POPULATION
70.83
MALES / 100 FEMALES
141.18
FEMALES / 100 MALES
65.5
MEDIAN AGE
2.1
AVG FAMILY SIZE
1.7
AVG HOUSEHOLD SIZE
10
LABOR FORCE [ PEOPLE ]
25.6%
PERCENT IN LABOR FORCE
Glen Haven Zip Codes
Glen Haven Area Codes
Income in Glen Haven
Income Overview in Glen Haven
Per Capita Income in Glen Haven is $37,102, while median incomes of families and households are $68,929 and $67,857 respectively.
| Characteristic | Number | Measure |
| Per Capita Income | 41 | $37,102 |
| Median Family Income | 12 | $68,929 |
| Mean Family Income | 12 | $72,200 |
| Median Household Income | 24 | $67,857 |
| Mean Household Income | 24 | $63,783 |
| Income Deficit | 12 | $0 |
| Wage / Income Gap (%) | 41 | 0.00% |
| Wage / Income Gap ($) | 41 | 100.00¢ per $1 |
| Gini / Inequality Index | 41 | 0.26 |
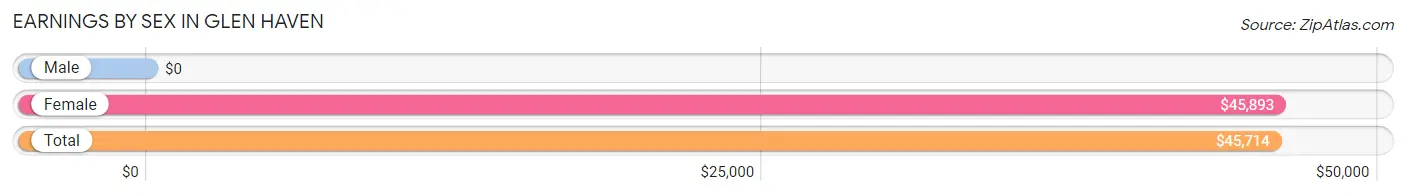
Earnings by Sex in Glen Haven
| Sex | Number | Average Earnings |
| Male | 9 (45.0%) | $0 |
| Female | 11 (55.0%) | $45,893 |
| Total | 20 (100.0%) | $45,714 |
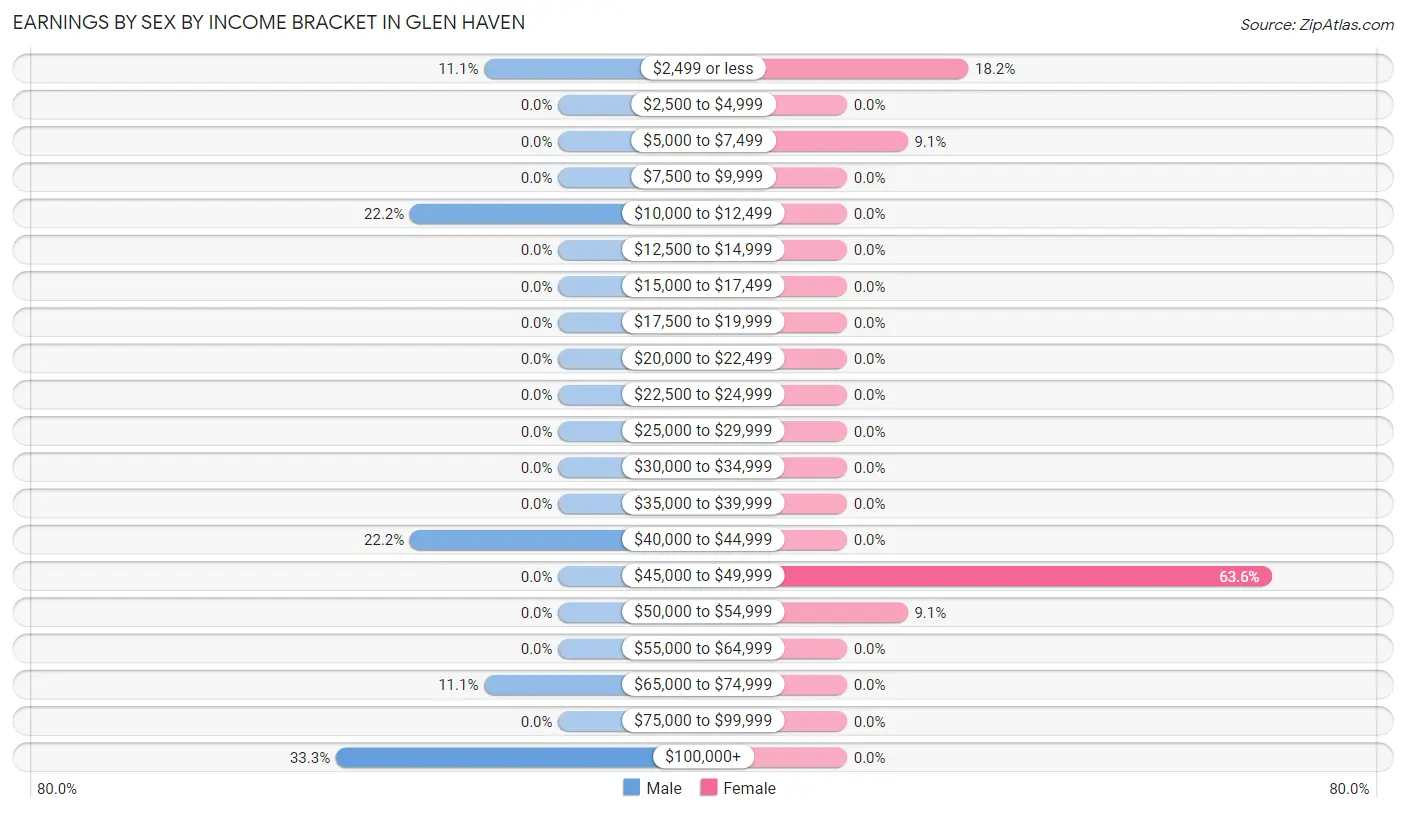
Earnings by Sex by Income Bracket in Glen Haven
The most common earnings brackets in Glen Haven are $100,000+ for men (3 | 33.3%) and $45,000 to $49,999 for women (7 | 63.6%).
| Income | Male | Female |
| $2,499 or less | 1 (11.1%) | 2 (18.2%) |
| $2,500 to $4,999 | 0 (0.0%) | 0 (0.0%) |
| $5,000 to $7,499 | 0 (0.0%) | 1 (9.1%) |
| $7,500 to $9,999 | 0 (0.0%) | 0 (0.0%) |
| $10,000 to $12,499 | 2 (22.2%) | 0 (0.0%) |
| $12,500 to $14,999 | 0 (0.0%) | 0 (0.0%) |
| $15,000 to $17,499 | 0 (0.0%) | 0 (0.0%) |
| $17,500 to $19,999 | 0 (0.0%) | 0 (0.0%) |
| $20,000 to $22,499 | 0 (0.0%) | 0 (0.0%) |
| $22,500 to $24,999 | 0 (0.0%) | 0 (0.0%) |
| $25,000 to $29,999 | 0 (0.0%) | 0 (0.0%) |
| $30,000 to $34,999 | 0 (0.0%) | 0 (0.0%) |
| $35,000 to $39,999 | 0 (0.0%) | 0 (0.0%) |
| $40,000 to $44,999 | 2 (22.2%) | 0 (0.0%) |
| $45,000 to $49,999 | 0 (0.0%) | 7 (63.6%) |
| $50,000 to $54,999 | 0 (0.0%) | 1 (9.1%) |
| $55,000 to $64,999 | 0 (0.0%) | 0 (0.0%) |
| $65,000 to $74,999 | 1 (11.1%) | 0 (0.0%) |
| $75,000 to $99,999 | 0 (0.0%) | 0 (0.0%) |
| $100,000+ | 3 (33.3%) | 0 (0.0%) |
| Total | 9 (100.0%) | 11 (100.0%) |
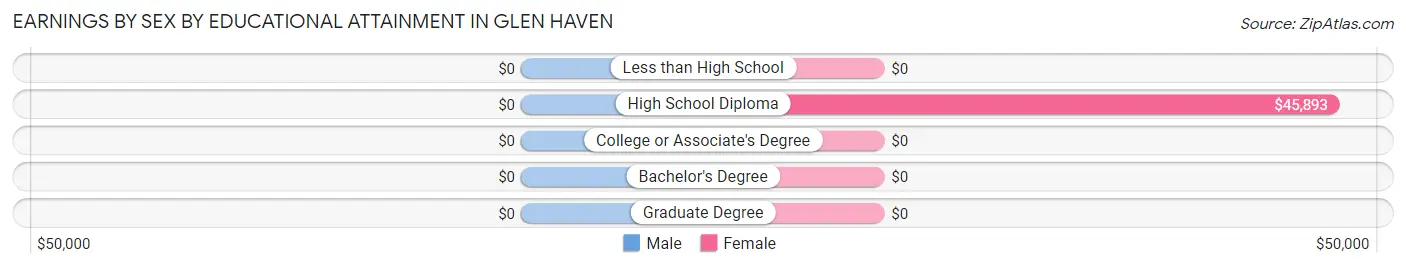
Earnings by Sex by Educational Attainment in Glen Haven
| Educational Attainment | Male Income | Female Income |
| Less than High School | - | - |
| High School Diploma | - | - |
| College or Associate's Degree | - | - |
| Bachelor's Degree | - | - |
| Graduate Degree | - | - |
| Total | - | - |
Family Income in Glen Haven
Family Income Brackets in Glen Haven
According to the Glen Haven family income data, there are 8 families falling into the $50,000 to $74,999 income range, which is the most common income bracket and makes up 66.7% of all families.
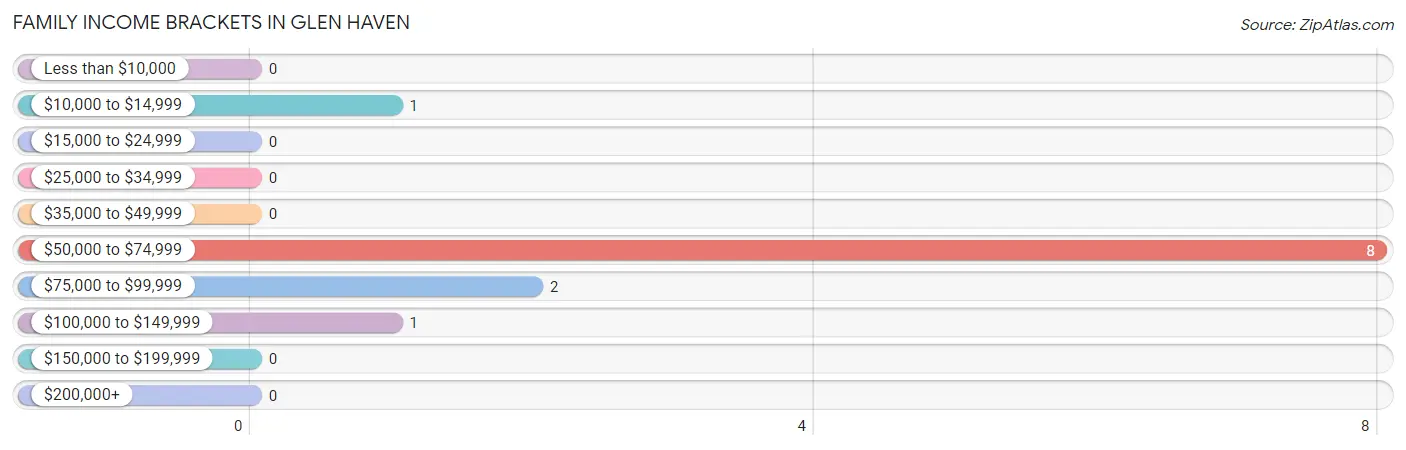
| Income Bracket | # Families | % Families |
| Less than $10,000 | 0 | 0.0% |
| $10,000 to $14,999 | 1 | 8.3% |
| $15,000 to $24,999 | 0 | 0.0% |
| $25,000 to $34,999 | 0 | 0.0% |
| $35,000 to $49,999 | 0 | 0.0% |
| $50,000 to $74,999 | 8 | 66.7% |
| $75,000 to $99,999 | 2 | 16.7% |
| $100,000 to $149,999 | 1 | 8.3% |
| $150,000 to $199,999 | 0 | 0.0% |
| $200,000+ | 0 | 0.0% |
Family Income by Famaliy Size in Glen Haven
2-person families (11 | 91.7%) account for the highest median family income in Glen Haven with $68,750 per family, while 2-person families (11 | 91.7%) have the highest median income of $34,375 per family member.
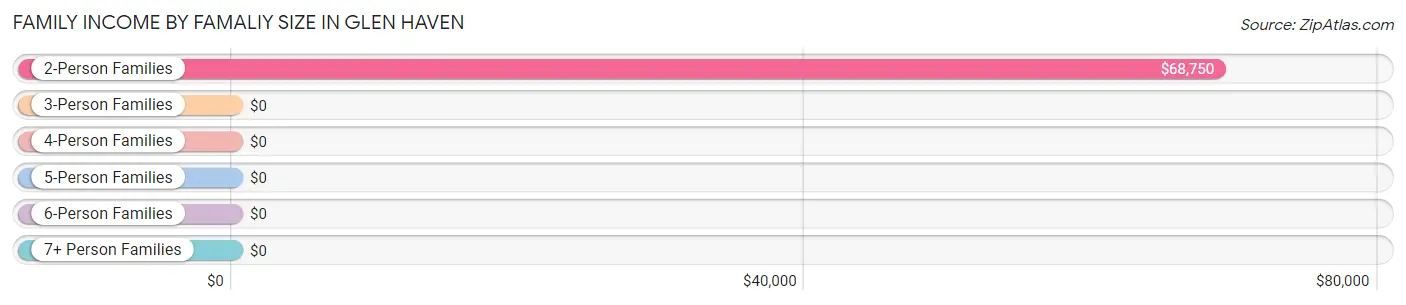
| Income Bracket | # Families | Median Income |
| 2-Person Families | 11 (91.7%) | $68,750 |
| 3-Person Families | 0 (0.0%) | $0 |
| 4-Person Families | 1 (8.3%) | $0 |
| 5-Person Families | 0 (0.0%) | $0 |
| 6-Person Families | 0 (0.0%) | $0 |
| 7+ Person Families | 0 (0.0%) | $0 |
| Total | 12 (100.0%) | $68,929 |
Family Income by Number of Earners in Glen Haven
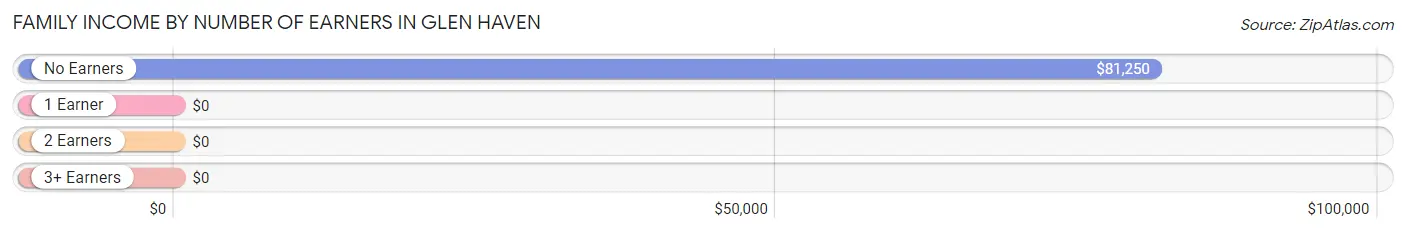
| Number of Earners | # Families | Median Income |
| No Earners | 4 (33.3%) | $81,250 |
| 1 Earner | 7 (58.3%) | $0 |
| 2 Earners | 1 (8.3%) | $0 |
| 3+ Earners | 0 (0.0%) | $0 |
| Total | 12 (100.0%) | $68,929 |
Household Income in Glen Haven
Household Income Brackets in Glen Haven
With 11 households falling in the category, the $50,000 to $74,999 income range is the most frequent in Glen Haven, accounting for 45.8% of all households.
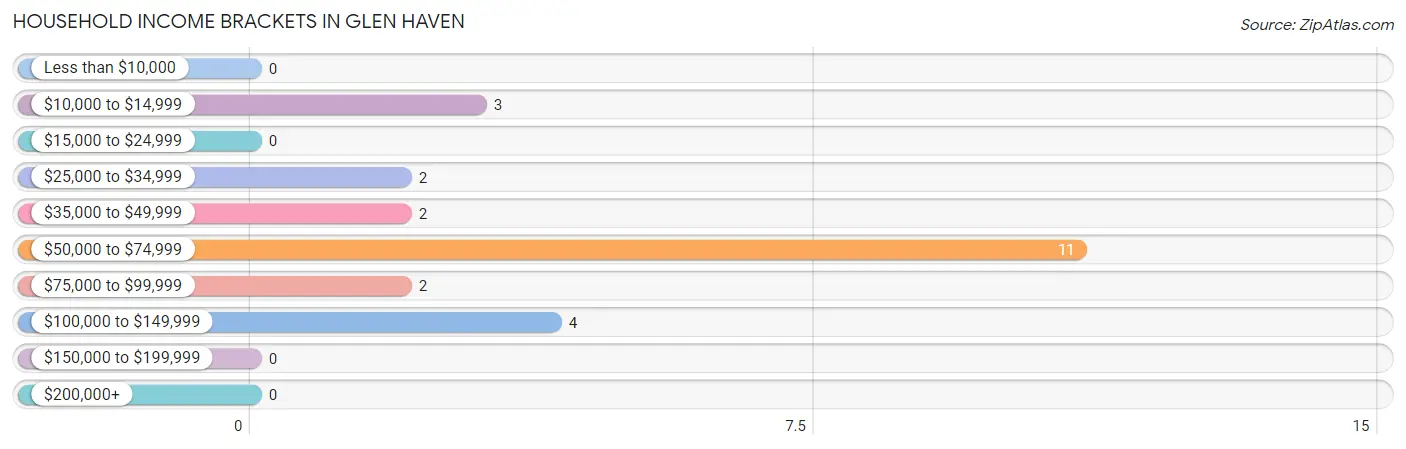
| Income Bracket | # Households | % Households |
| Less than $10,000 | 0 | 0.0% |
| $10,000 to $14,999 | 3 | 12.5% |
| $15,000 to $24,999 | 0 | 0.0% |
| $25,000 to $34,999 | 2 | 8.3% |
| $35,000 to $49,999 | 2 | 8.3% |
| $50,000 to $74,999 | 11 | 45.8% |
| $75,000 to $99,999 | 2 | 8.3% |
| $100,000 to $149,999 | 4 | 16.7% |
| $150,000 to $199,999 | 0 | 0.0% |
| $200,000+ | 0 | 0.0% |
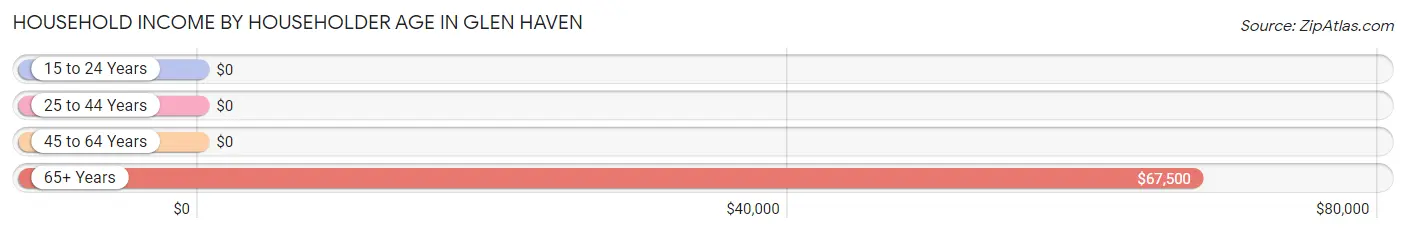
Household Income by Householder Age in Glen Haven
The median household income in Glen Haven is $67,857, with the highest median household income of $67,500 found in the 65+ years age bracket for the primary householder. A total of 18 households (75.0%) fall into this category.
| Income Bracket | # Households | Median Income |
| 15 to 24 Years | 0 (0.0%) | $0 |
| 25 to 44 Years | 1 (4.2%) | $0 |
| 45 to 64 Years | 5 (20.8%) | $0 |
| 65+ Years | 18 (75.0%) | $67,500 |
| Total | 24 (100.0%) | $67,857 |
Poverty in Glen Haven
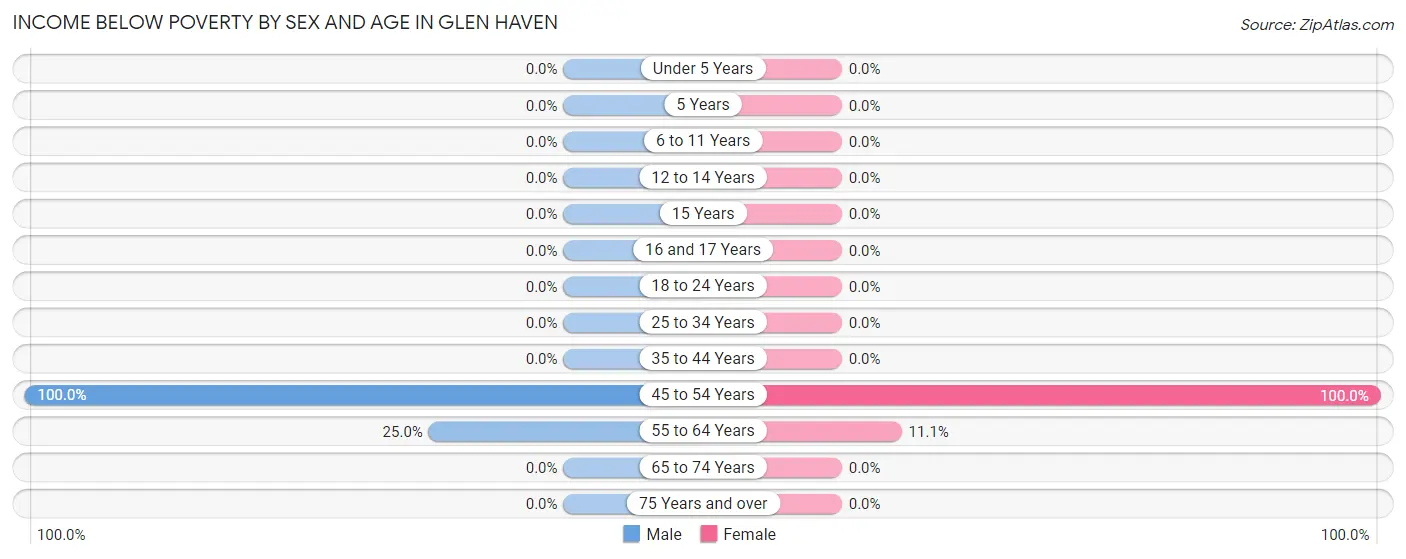
Income Below Poverty by Sex and Age in Glen Haven
With 17.6% poverty level for males and 8.3% for females among the residents of Glen Haven, 45 to 54 year old males and 45 to 54 year old females are the most vulnerable to poverty, with 2 males (100.0%) and 1 females (100.0%) in their respective age groups living below the poverty level.
| Age Bracket | Male | Female |
| Under 5 Years | 0 (0.0%) | 0 (0.0%) |
| 5 Years | 0 (0.0%) | 0 (0.0%) |
| 6 to 11 Years | 0 (0.0%) | 0 (0.0%) |
| 12 to 14 Years | 0 (0.0%) | 0 (0.0%) |
| 15 Years | 0 (0.0%) | 0 (0.0%) |
| 16 and 17 Years | 0 (0.0%) | 0 (0.0%) |
| 18 to 24 Years | 0 (0.0%) | 0 (0.0%) |
| 25 to 34 Years | 0 (0.0%) | 0 (0.0%) |
| 35 to 44 Years | 0 (0.0%) | 0 (0.0%) |
| 45 to 54 Years | 2 (100.0%) | 1 (100.0%) |
| 55 to 64 Years | 1 (25.0%) | 1 (11.1%) |
| 65 to 74 Years | 0 (0.0%) | 0 (0.0%) |
| 75 Years and over | 0 (0.0%) | 0 (0.0%) |
| Total | 3 (17.6%) | 2 (8.3%) |
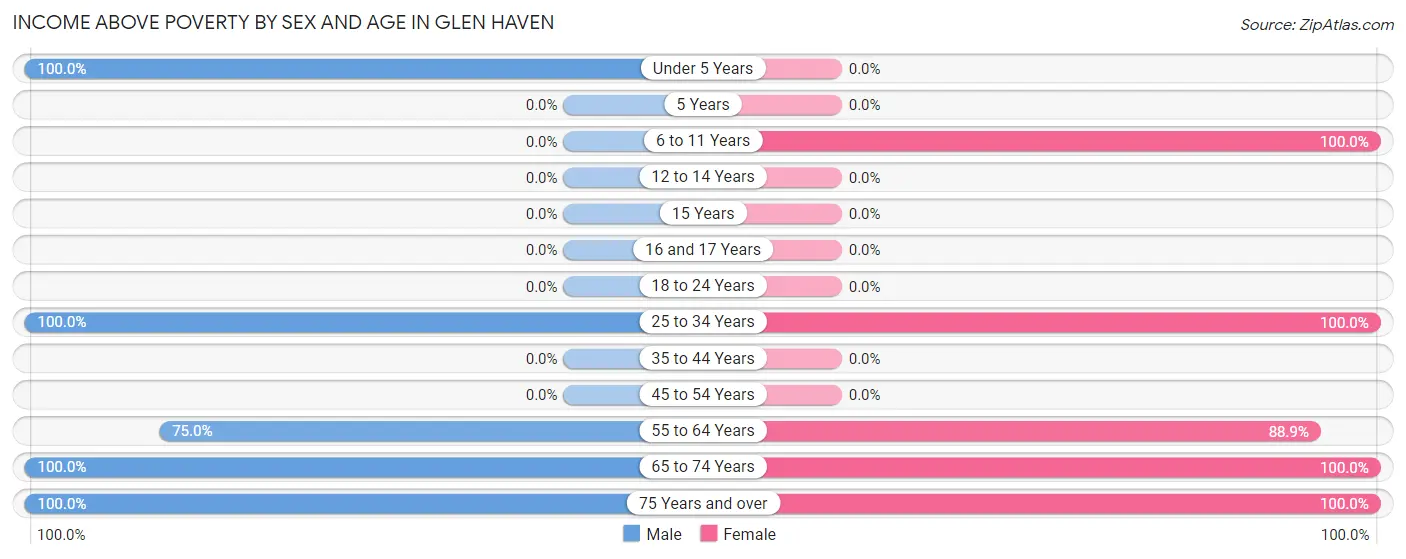
Income Above Poverty by Sex and Age in Glen Haven
According to the poverty statistics in Glen Haven, males aged under 5 years and females aged 6 to 11 years are the age groups that are most secure financially, with 100.0% of males and 100.0% of females in these age groups living above the poverty line.
| Age Bracket | Male | Female |
| Under 5 Years | 1 (100.0%) | 0 (0.0%) |
| 5 Years | 0 (0.0%) | 0 (0.0%) |
| 6 to 11 Years | 0 (0.0%) | 1 (100.0%) |
| 12 to 14 Years | 0 (0.0%) | 0 (0.0%) |
| 15 Years | 0 (0.0%) | 0 (0.0%) |
| 16 and 17 Years | 0 (0.0%) | 0 (0.0%) |
| 18 to 24 Years | 0 (0.0%) | 0 (0.0%) |
| 25 to 34 Years | 1 (100.0%) | 1 (100.0%) |
| 35 to 44 Years | 0 (0.0%) | 0 (0.0%) |
| 45 to 54 Years | 0 (0.0%) | 0 (0.0%) |
| 55 to 64 Years | 3 (75.0%) | 8 (88.9%) |
| 65 to 74 Years | 4 (100.0%) | 2 (100.0%) |
| 75 Years and over | 5 (100.0%) | 10 (100.0%) |
| Total | 14 (82.4%) | 22 (91.7%) |
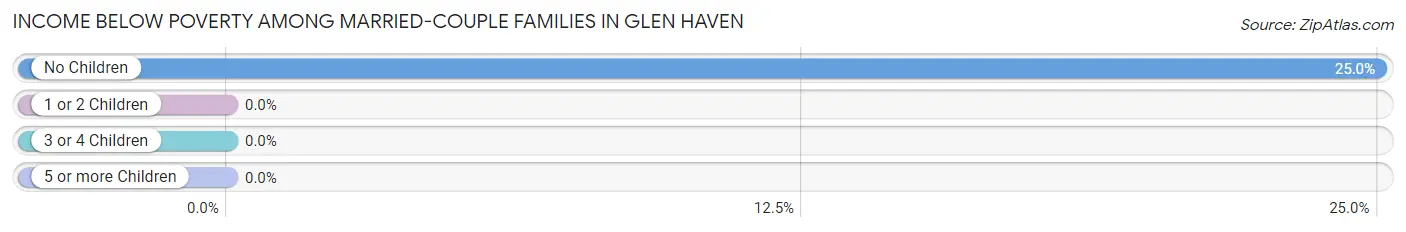
Income Below Poverty Among Married-Couple Families in Glen Haven
The poverty statistics for married-couple families in Glen Haven show that 20.0% or 1 of the total 5 families live below the poverty line. Families with no children have the highest poverty rate of 25.0%, comprising of 1 families. On the other hand, families with 1 or 2 children have the lowest poverty rate of 0.0%, which includes 0 families.
| Children | Above Poverty | Below Poverty |
| No Children | 3 (75.0%) | 1 (25.0%) |
| 1 or 2 Children | 1 (100.0%) | 0 (0.0%) |
| 3 or 4 Children | 0 (0.0%) | 0 (0.0%) |
| 5 or more Children | 0 (0.0%) | 0 (0.0%) |
| Total | 4 (80.0%) | 1 (20.0%) |
Income Below Poverty Among Single-Parent Households in Glen Haven
| Children | Single Father | Single Mother |
| No Children | 0 (0.0%) | 0 (0.0%) |
| 1 or 2 Children | 0 (0.0%) | 0 (0.0%) |
| 3 or 4 Children | 0 (0.0%) | 0 (0.0%) |
| 5 or more Children | 0 (0.0%) | 0 (0.0%) |
| Total | 0 (0.0%) | 0 (0.0%) |
Income Below Poverty Among Married-Couple vs Single-Parent Households in Glen Haven
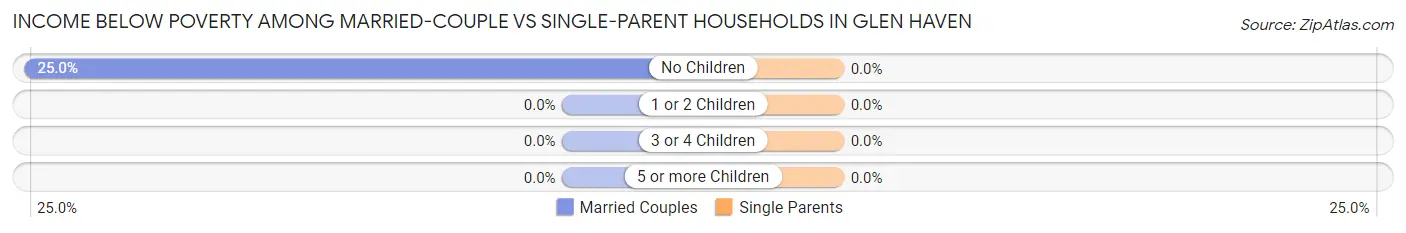
| Children | Married-Couple Families | Single-Parent Households |
| No Children | 1 (25.0%) | 0 (0.0%) |
| 1 or 2 Children | 0 (0.0%) | 0 (0.0%) |
| 3 or 4 Children | 0 (0.0%) | 0 (0.0%) |
| 5 or more Children | 0 (0.0%) | 0 (0.0%) |
| Total | 1 (20.0%) | 0 (0.0%) |
Race in Glen Haven
The most populous races in Glen Haven are , and White / Caucasian (41 | 100.0%).
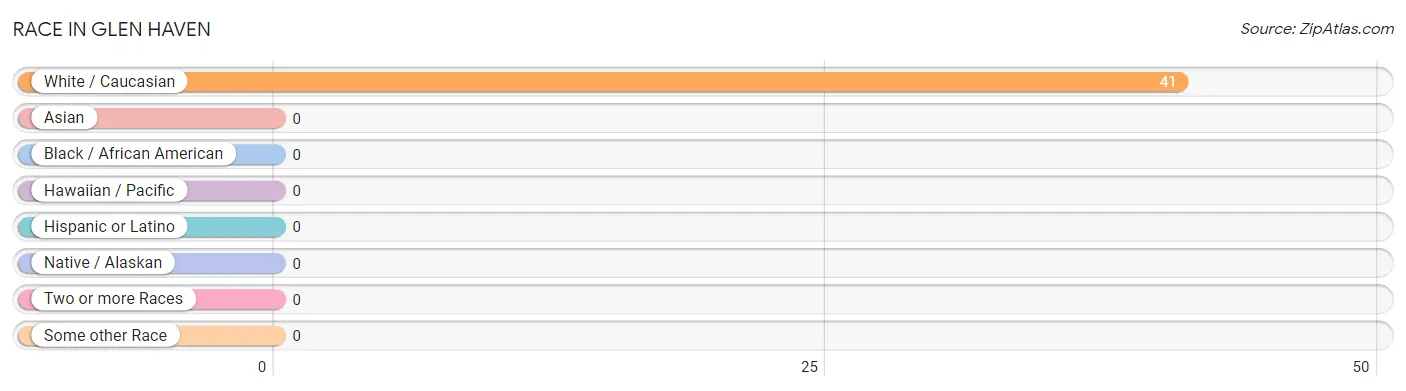
| Race | # Population | % Population |
| Asian | 0 | 0.0% |
| Black / African American | 0 | 0.0% |
| Hawaiian / Pacific | 0 | 0.0% |
| Hispanic or Latino | 0 | 0.0% |
| Native / Alaskan | 0 | 0.0% |
| White / Caucasian | 41 | 100.0% |
| Two or more Races | 0 | 0.0% |
| Some other Race | 0 | 0.0% |
| Total | 41 | 100.0% |
Ancestry in Glen Haven
The most populous ancestries reported in Glen Haven are German (4 | 9.8%), American (2 | 4.9%), English (1 | 2.4%), French (1 | 2.4%), and Hungarian (1 | 2.4%), together accounting for 22.0% of all Glen Haven residents.
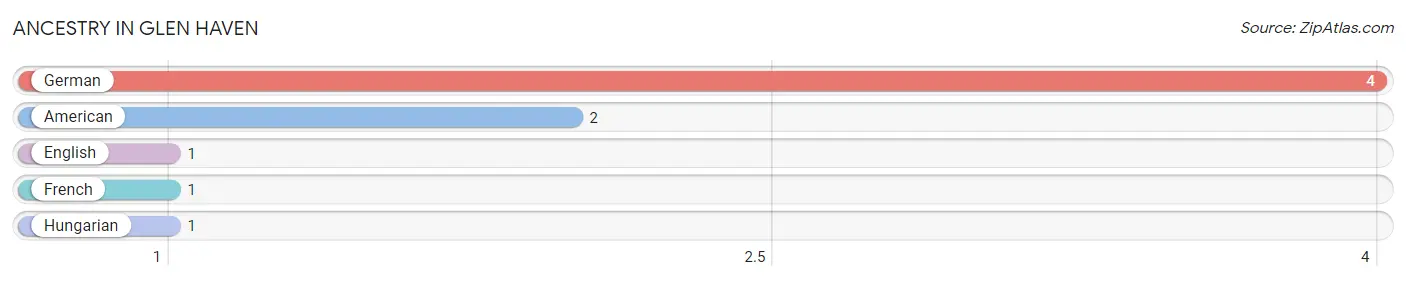
| Ancestry | # Population | % Population |
| American | 2 | 4.9% |
| English | 1 | 2.4% |
| French | 1 | 2.4% |
| German | 4 | 9.8% |
| Hungarian | 1 | 2.4% | View All 5 Rows |
Immigrants in Glen Haven

| Immigration Origin | # Population | % Population | View All 0 Rows |
Sex and Age in Glen Haven
Sex and Age in Glen Haven
The most populous age groups in Glen Haven are 55 to 59 Years (3 | 17.6%) for men and 55 to 59 Years (8 | 33.3%) for women.
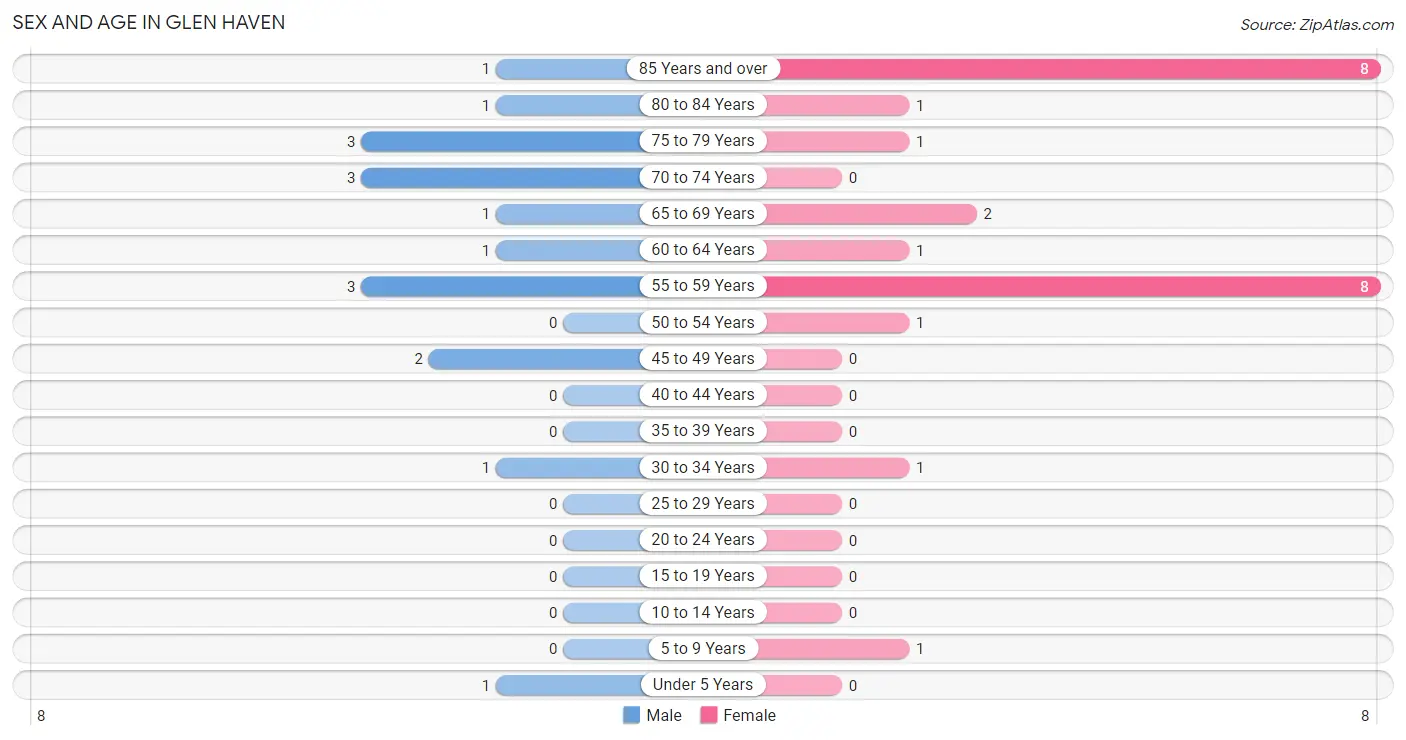
| Age Bracket | Male | Female |
| Under 5 Years | 1 (5.9%) | 0 (0.0%) |
| 5 to 9 Years | 0 (0.0%) | 1 (4.2%) |
| 10 to 14 Years | 0 (0.0%) | 0 (0.0%) |
| 15 to 19 Years | 0 (0.0%) | 0 (0.0%) |
| 20 to 24 Years | 0 (0.0%) | 0 (0.0%) |
| 25 to 29 Years | 0 (0.0%) | 0 (0.0%) |
| 30 to 34 Years | 1 (5.9%) | 1 (4.2%) |
| 35 to 39 Years | 0 (0.0%) | 0 (0.0%) |
| 40 to 44 Years | 0 (0.0%) | 0 (0.0%) |
| 45 to 49 Years | 2 (11.8%) | 0 (0.0%) |
| 50 to 54 Years | 0 (0.0%) | 1 (4.2%) |
| 55 to 59 Years | 3 (17.6%) | 8 (33.3%) |
| 60 to 64 Years | 1 (5.9%) | 1 (4.2%) |
| 65 to 69 Years | 1 (5.9%) | 2 (8.3%) |
| 70 to 74 Years | 3 (17.6%) | 0 (0.0%) |
| 75 to 79 Years | 3 (17.6%) | 1 (4.2%) |
| 80 to 84 Years | 1 (5.9%) | 1 (4.2%) |
| 85 Years and over | 1 (5.9%) | 8 (33.3%) |
| Total | 17 (100.0%) | 24 (100.0%) |
Families and Households in Glen Haven
Median Family Size in Glen Haven
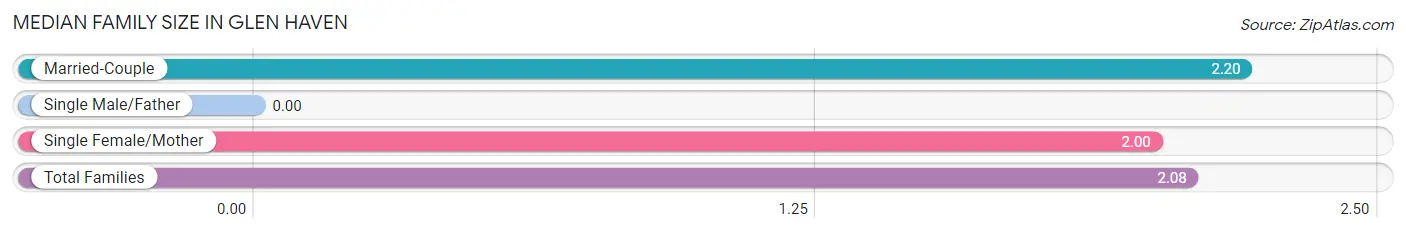
| Family Type | # Families | Family Size |
| Married-Couple | 5 (41.7%) | 2.20 |
| Single Male/Father | 0 (0.0%) | - |
| Single Female/Mother | 7 (58.3%) | 2.00 |
| Total Families | 12 (100.0%) | 2.08 |
Median Household Size in Glen Haven
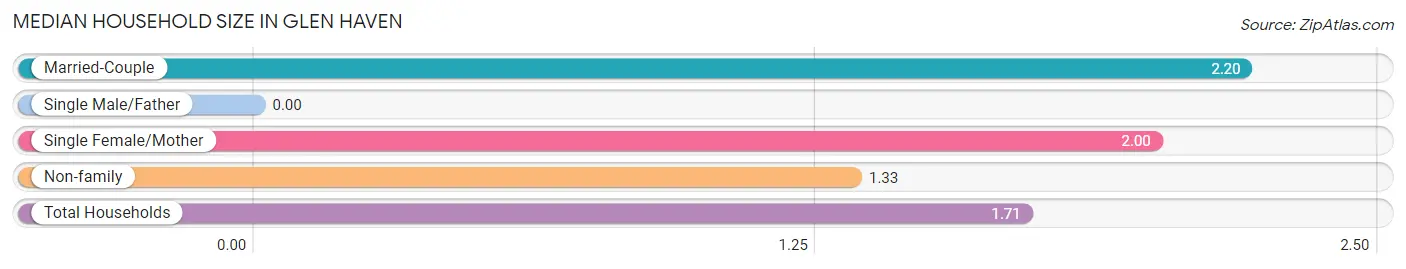
| Household Type | # Households | Household Size |
| Married-Couple | 5 (20.8%) | 2.20 |
| Single Male/Father | 0 (0.0%) | - |
| Single Female/Mother | 7 (29.2%) | 2.00 |
| Non-family | 12 (50.0%) | 1.33 |
| Total Households | 24 (100.0%) | 1.71 |
Household Size by Marriage Status in Glen Haven
Out of a total of 24 households in Glen Haven, 12 (50.0%) are family households, while 12 (50.0%) are nonfamily households. The most numerous type of family households are 2-person households, comprising 11, and the most common type of nonfamily households are 1-person households, comprising 9.
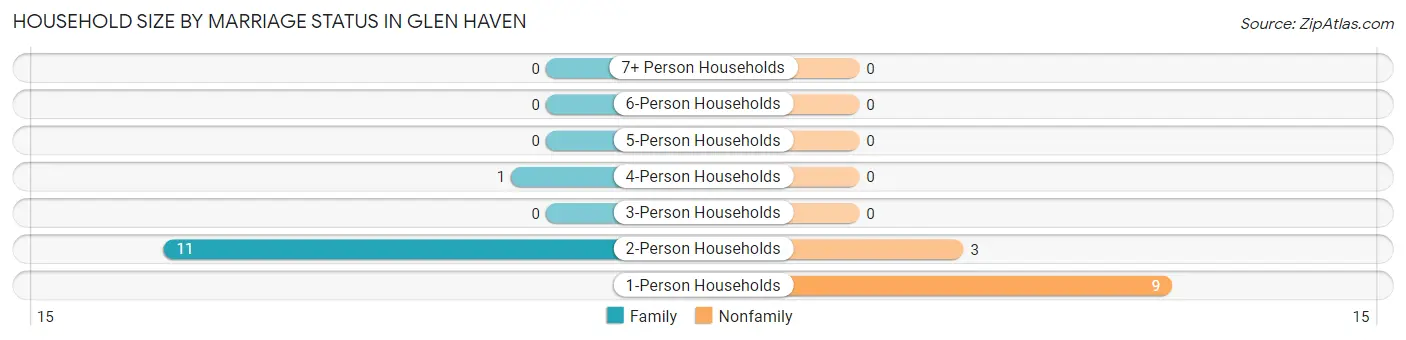
| Household Size | Family Households | Nonfamily Households |
| 1-Person Households | - | 9 (37.5%) |
| 2-Person Households | 11 (45.8%) | 3 (12.5%) |
| 3-Person Households | 0 (0.0%) | 0 (0.0%) |
| 4-Person Households | 1 (4.2%) | 0 (0.0%) |
| 5-Person Households | 0 (0.0%) | 0 (0.0%) |
| 6-Person Households | 0 (0.0%) | 0 (0.0%) |
| 7+ Person Households | 0 (0.0%) | 0 (0.0%) |
| Total | 12 (50.0%) | 12 (50.0%) |
Female Fertility in Glen Haven
Fertility by Age in Glen Haven
| Age Bracket | Women with Births | Births / 1,000 Women |
| 15 to 19 years | 0 (0.0%) | 0.0 |
| 20 to 34 years | 0 (0.0%) | 0.0 |
| 35 to 50 years | 0 (0.0%) | 0.0 |
| Total | 0 (0.0%) | 0.0 |
Fertility by Age by Marriage Status in Glen Haven
| Age Bracket | Married | Unmarried |
| 15 to 19 years | 0 (0.0%) | 0 (0.0%) |
| 20 to 34 years | 0 (0.0%) | 0 (0.0%) |
| 35 to 50 years | 0 (0.0%) | 0 (0.0%) |
| Total | 0 (0.0%) | 0 (0.0%) |
Fertility by Education in Glen Haven
| Educational Attainment | Women with Births | Births / 1,000 Women |
| Less than High School | 0 (0.0%) | 0.0 |
| High School Diploma | 0 (0.0%) | 0.0 |
| College or Associate's Degree | 0 (0.0%) | 0.0 |
| Bachelor's Degree | 0 (0.0%) | 0.0 |
| Graduate Degree | 0 (0.0%) | 0.0 |
| Total | 0 (0.0%) | 0.0 |
Fertility by Education by Marriage Status in Glen Haven
| Educational Attainment | Married | Unmarried |
| Less than High School | 0 (0.0%) | 0 (0.0%) |
| High School Diploma | 0 (0.0%) | 0 (0.0%) |
| College or Associate's Degree | 0 (0.0%) | 0 (0.0%) |
| Bachelor's Degree | 0 (0.0%) | 0 (0.0%) |
| Graduate Degree | 0 (0.0%) | 0 (0.0%) |
| Total | 0 (0.0%) | 0 (0.0%) |
Employment Characteristics in Glen Haven
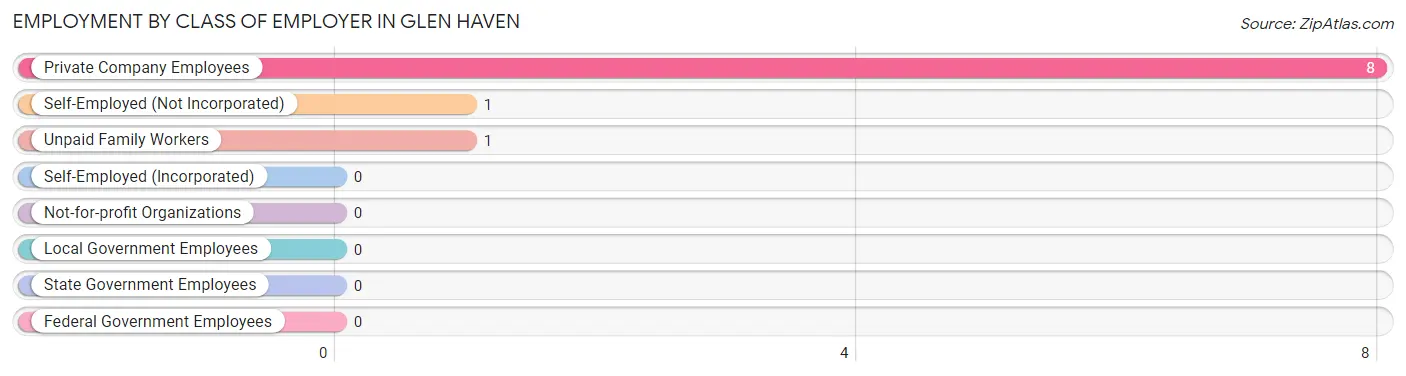
Employment by Class of Employer in Glen Haven
Among the 10 employed individuals in Glen Haven, private company employees (8 | 80.0%), self-employed (not incorporated) (1 | 10.0%), and unpaid family workers (1 | 10.0%) make up the most common classes of employment.
| Employer Class | # Employees | % Employees |
| Private Company Employees | 8 | 80.0% |
| Self-Employed (Incorporated) | 0 | 0.0% |
| Self-Employed (Not Incorporated) | 1 | 10.0% |
| Not-for-profit Organizations | 0 | 0.0% |
| Local Government Employees | 0 | 0.0% |
| State Government Employees | 0 | 0.0% |
| Federal Government Employees | 0 | 0.0% |
| Unpaid Family Workers | 1 | 10.0% |
| Total | 10 | 100.0% |
Employment Status by Age in Glen Haven
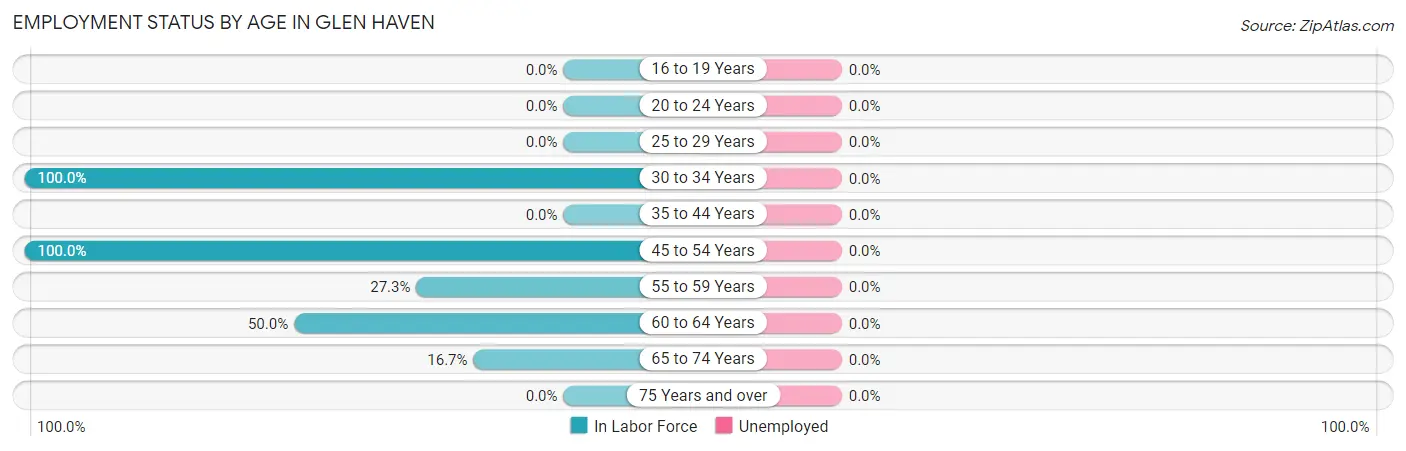
| Age Bracket | In Labor Force | Unemployed |
| 16 to 19 Years | 0 (0.0%) | 0 (0.0%) |
| 20 to 24 Years | 0 (0.0%) | 0 (0.0%) |
| 25 to 29 Years | 0 (0.0%) | 0 (0.0%) |
| 30 to 34 Years | 2 (100.0%) | 0 (0.0%) |
| 35 to 44 Years | 0 (0.0%) | 0 (0.0%) |
| 45 to 54 Years | 3 (100.0%) | 0 (0.0%) |
| 55 to 59 Years | 3 (27.3%) | 0 (0.0%) |
| 60 to 64 Years | 1 (50.0%) | 0 (0.0%) |
| 65 to 74 Years | 1 (16.7%) | 0 (0.0%) |
| 75 Years and over | 0 (0.0%) | 0 (0.0%) |
| Total | 10 (25.6%) | 0 (0.0%) |
Employment Status by Educational Attainment in Glen Haven
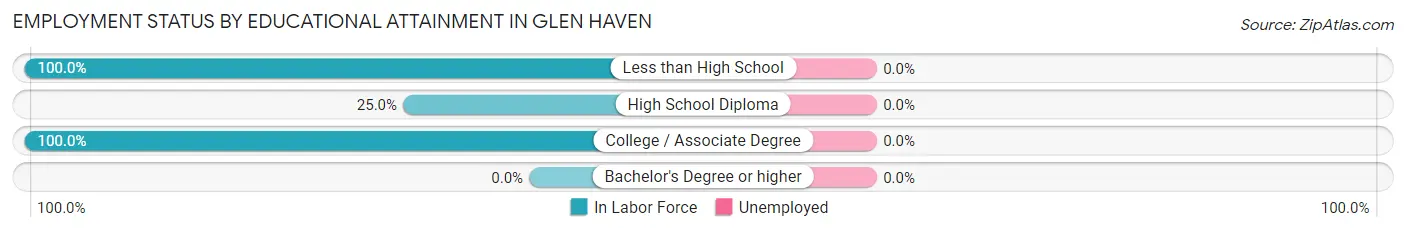
| Educational Attainment | In Labor Force | Unemployed |
| Less than High School | 3 (100.0%) | 0 (0.0%) |
| High School Diploma | 3 (25.0%) | 0 (0.0%) |
| College / Associate Degree | 3 (100.0%) | 0 (0.0%) |
| Bachelor's Degree or higher | 0 (0.0%) | 0 (0.0%) |
| Total | 9 (50.0%) | 0 (0.0%) |
Employment Occupations by Sex in Glen Haven
Management, Business, Science and Arts Occupations
The most common Management, Business, Science and Arts occupations in Glen Haven are , and Management (1 | 10.0%).
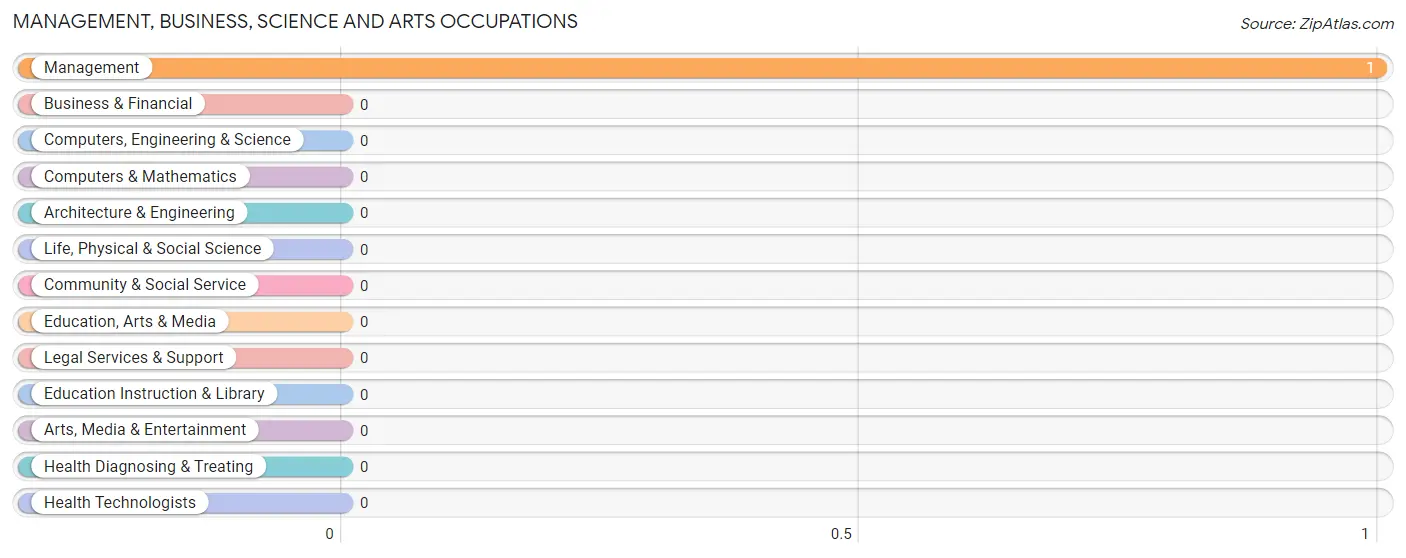
Management, Business, Science and Arts Occupations by Sex
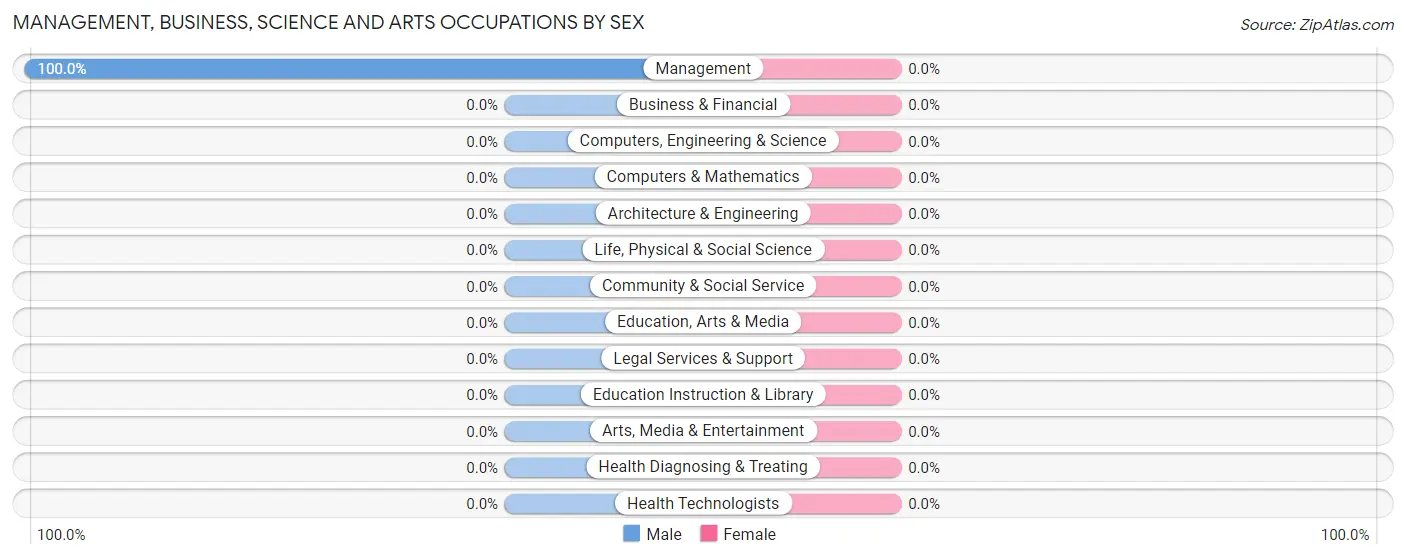
| Occupation | Male | Female |
| Management | 1 (100.0%) | 0 (0.0%) |
| Business & Financial | 0 (0.0%) | 0 (0.0%) |
| Computers, Engineering & Science | 0 (0.0%) | 0 (0.0%) |
| Computers & Mathematics | 0 (0.0%) | 0 (0.0%) |
| Architecture & Engineering | 0 (0.0%) | 0 (0.0%) |
| Life, Physical & Social Science | 0 (0.0%) | 0 (0.0%) |
| Community & Social Service | 0 (0.0%) | 0 (0.0%) |
| Education, Arts & Media | 0 (0.0%) | 0 (0.0%) |
| Legal Services & Support | 0 (0.0%) | 0 (0.0%) |
| Education Instruction & Library | 0 (0.0%) | 0 (0.0%) |
| Arts, Media & Entertainment | 0 (0.0%) | 0 (0.0%) |
| Health Diagnosing & Treating | 0 (0.0%) | 0 (0.0%) |
| Health Technologists | 0 (0.0%) | 0 (0.0%) |
| Total (Category) | 1 (100.0%) | 0 (0.0%) |
| Total (Overall) | 6 (60.0%) | 4 (40.0%) |
Services Occupations
The most common Services occupations in Glen Haven are , and Food Preparation & Serving (1 | 10.0%).
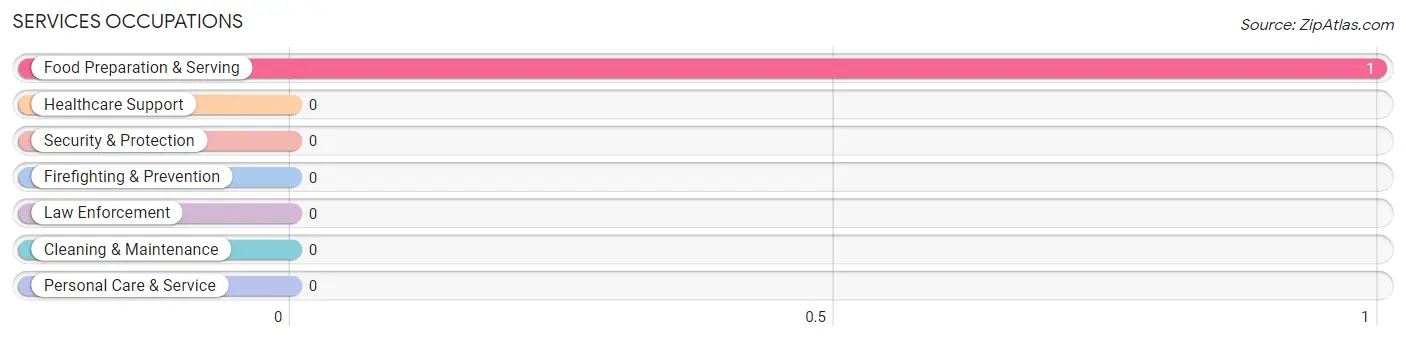
Services Occupations by Sex
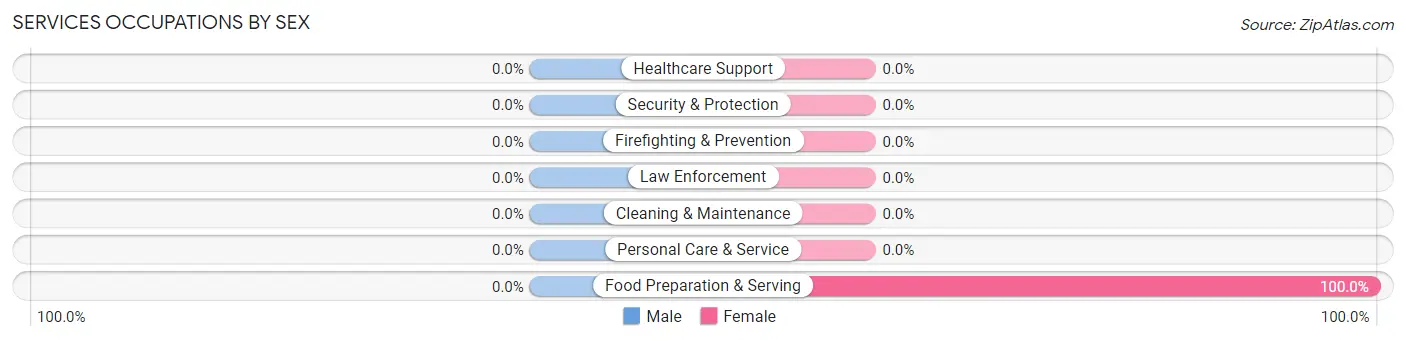
| Occupation | Male | Female |
| Healthcare Support | 0 (0.0%) | 0 (0.0%) |
| Security & Protection | 0 (0.0%) | 0 (0.0%) |
| Firefighting & Prevention | 0 (0.0%) | 0 (0.0%) |
| Law Enforcement | 0 (0.0%) | 0 (0.0%) |
| Food Preparation & Serving | 0 (0.0%) | 1 (100.0%) |
| Cleaning & Maintenance | 0 (0.0%) | 0 (0.0%) |
| Personal Care & Service | 0 (0.0%) | 0 (0.0%) |
| Total (Category) | 0 (0.0%) | 1 (100.0%) |
| Total (Overall) | 6 (60.0%) | 4 (40.0%) |
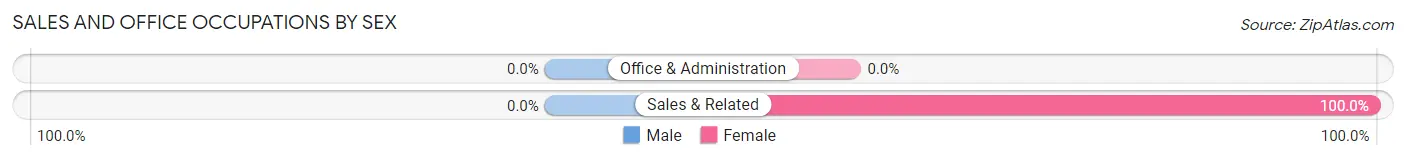
Sales and Office Occupations
The most common Sales and Office occupations in Glen Haven are , and Sales & Related (2 | 20.0%).
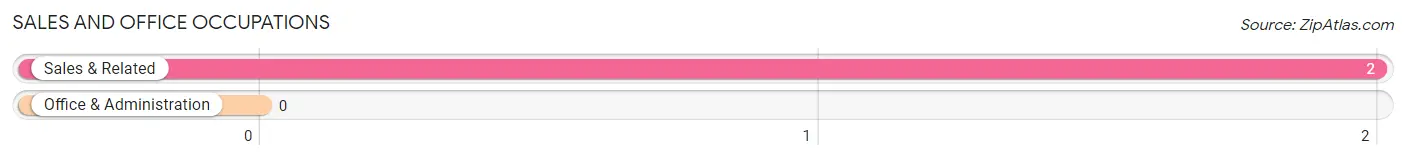
Sales and Office Occupations by Sex
| Occupation | Male | Female |
| Sales & Related | 0 (0.0%) | 2 (100.0%) |
| Office & Administration | 0 (0.0%) | 0 (0.0%) |
| Total (Category) | 0 (0.0%) | 2 (100.0%) |
| Total (Overall) | 6 (60.0%) | 4 (40.0%) |
Natural Resources, Construction and Maintenance Occupations
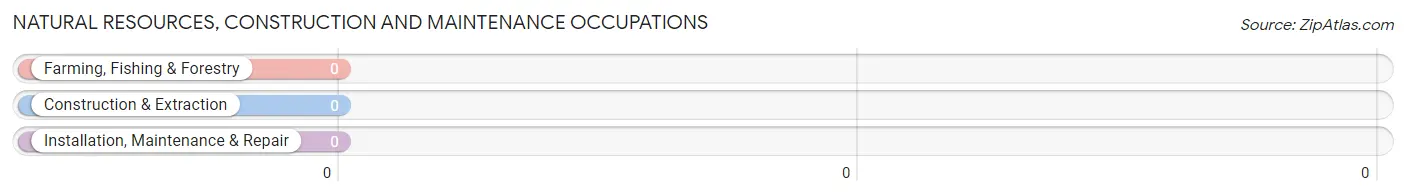
Natural Resources, Construction and Maintenance Occupations by Sex
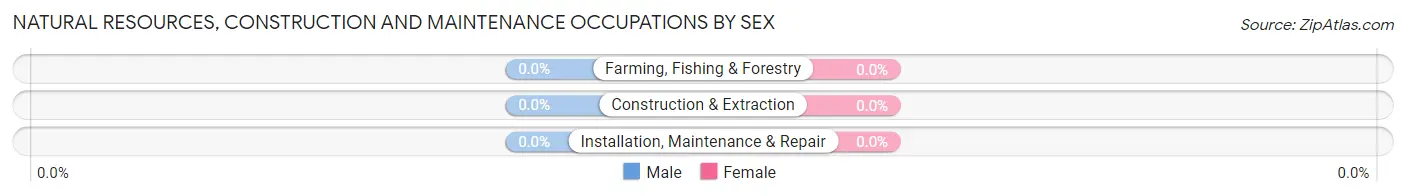
| Occupation | Male | Female |
| Farming, Fishing & Forestry | 0 (0.0%) | 0 (0.0%) |
| Construction & Extraction | 0 (0.0%) | 0 (0.0%) |
| Installation, Maintenance & Repair | 0 (0.0%) | 0 (0.0%) |
| Total (Category) | 0 (0.0%) | 0 (0.0%) |
| Total (Overall) | 6 (60.0%) | 4 (40.0%) |
Production, Transportation and Moving Occupations
The most common Production, Transportation and Moving occupations in Glen Haven are Transportation (5 | 50.0%), and Material Moving (1 | 10.0%).
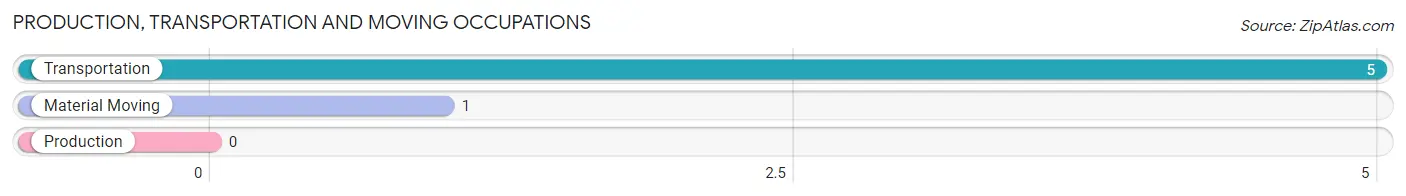
Production, Transportation and Moving Occupations by Sex
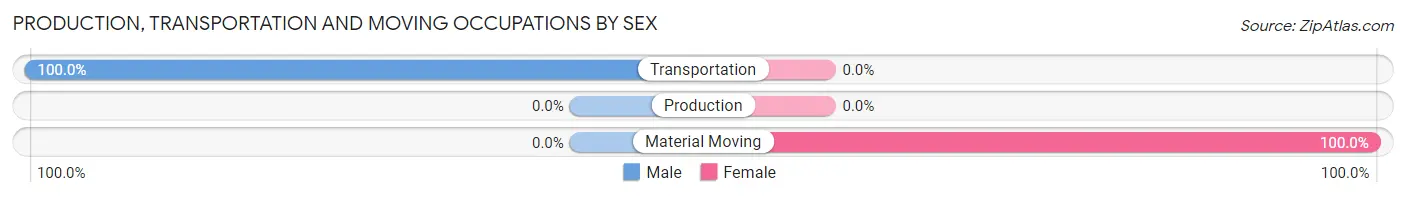
| Occupation | Male | Female |
| Production | 0 (0.0%) | 0 (0.0%) |
| Transportation | 5 (100.0%) | 0 (0.0%) |
| Material Moving | 0 (0.0%) | 1 (100.0%) |
| Total (Category) | 5 (83.3%) | 1 (16.7%) |
| Total (Overall) | 6 (60.0%) | 4 (40.0%) |
Employment Industries by Sex in Glen Haven
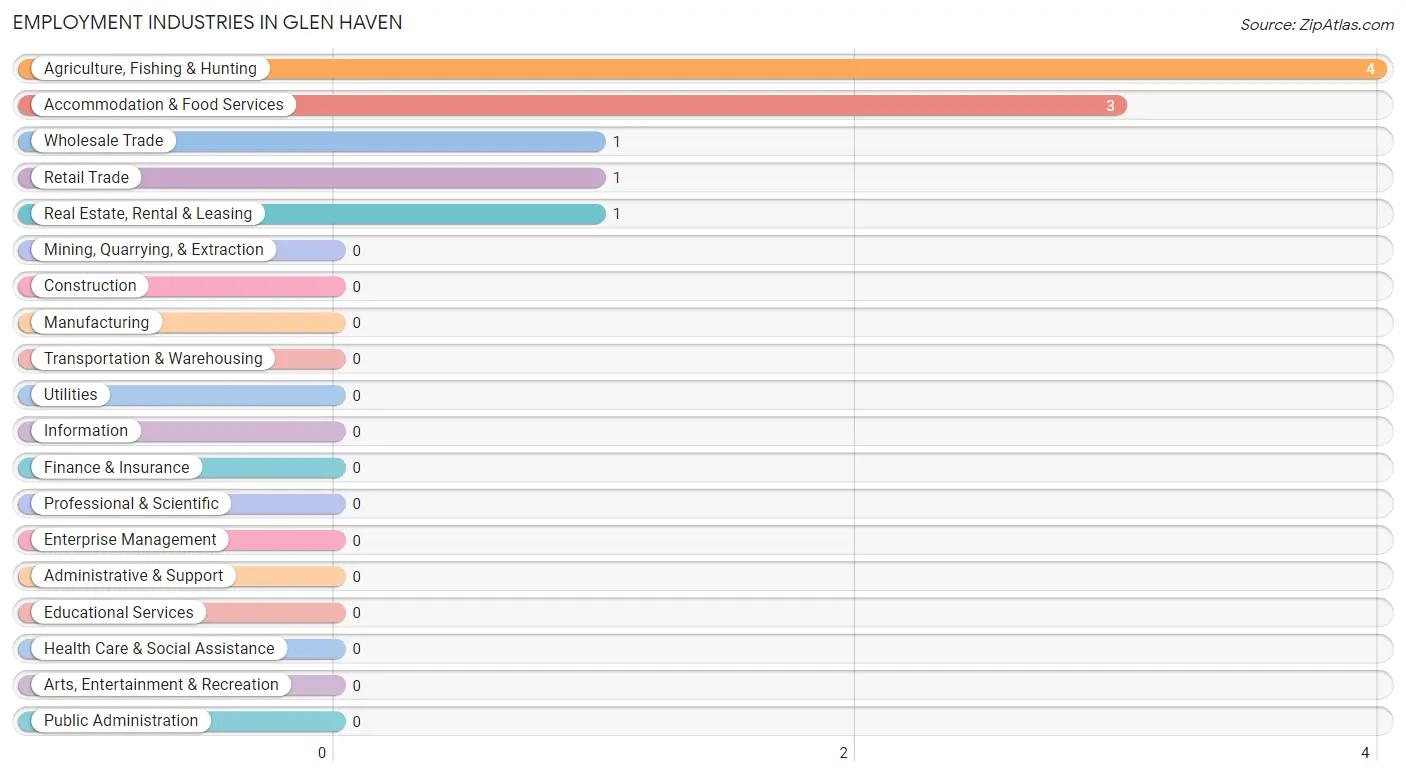
Employment Industries in Glen Haven
The major employment industries in Glen Haven include Agriculture, Fishing & Hunting (4 | 40.0%), Accommodation & Food Services (3 | 30.0%), Wholesale Trade (1 | 10.0%), Retail Trade (1 | 10.0%), and Real Estate, Rental & Leasing (1 | 10.0%).
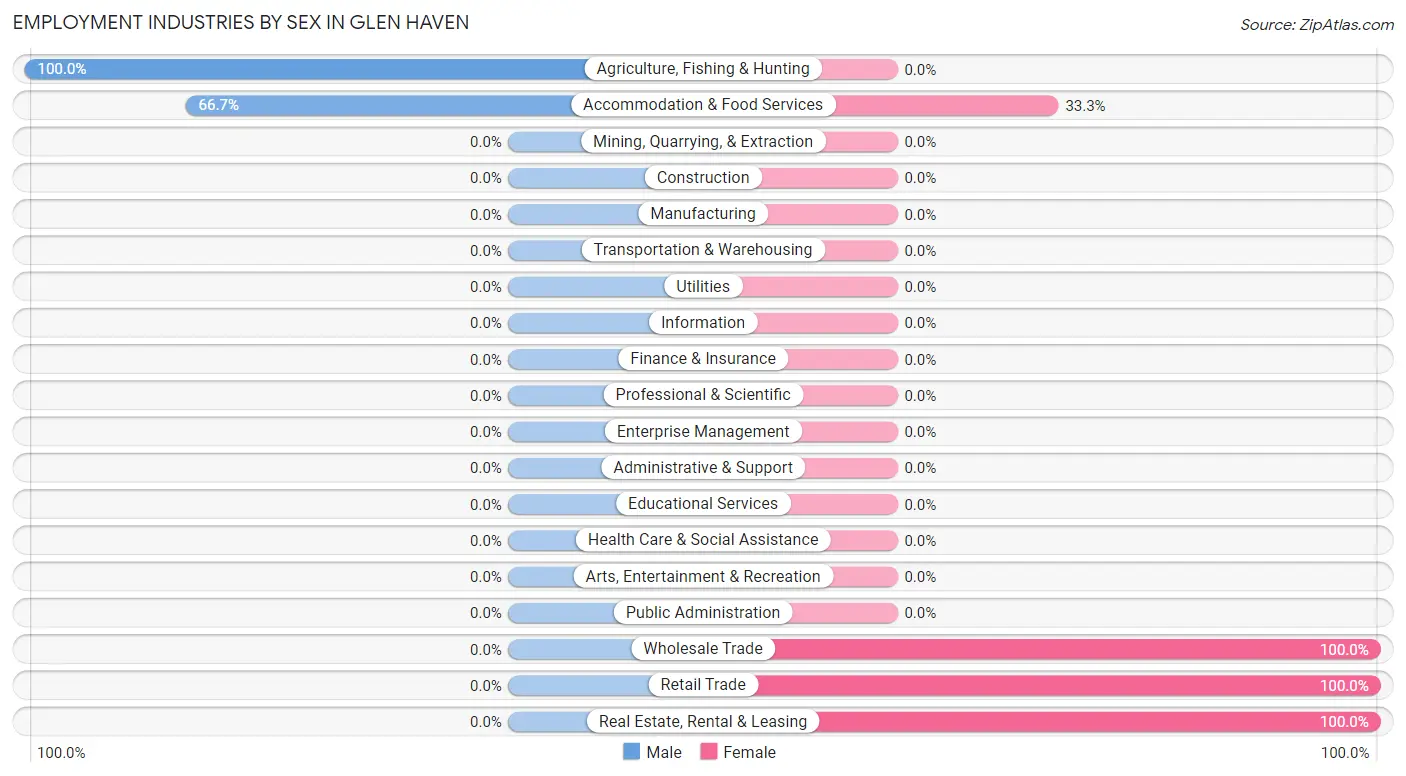
Employment Industries by Sex in Glen Haven
The Glen Haven industries that see more men than women are Agriculture, Fishing & Hunting (100.0%), and Accommodation & Food Services (66.7%), whereas the industries that tend to have a higher number of women are Wholesale Trade (100.0%), Retail Trade (100.0%), and Real Estate, Rental & Leasing (100.0%).
| Industry | Male | Female |
| Agriculture, Fishing & Hunting | 4 (100.0%) | 0 (0.0%) |
| Mining, Quarrying, & Extraction | 0 (0.0%) | 0 (0.0%) |
| Construction | 0 (0.0%) | 0 (0.0%) |
| Manufacturing | 0 (0.0%) | 0 (0.0%) |
| Wholesale Trade | 0 (0.0%) | 1 (100.0%) |
| Retail Trade | 0 (0.0%) | 1 (100.0%) |
| Transportation & Warehousing | 0 (0.0%) | 0 (0.0%) |
| Utilities | 0 (0.0%) | 0 (0.0%) |
| Information | 0 (0.0%) | 0 (0.0%) |
| Finance & Insurance | 0 (0.0%) | 0 (0.0%) |
| Real Estate, Rental & Leasing | 0 (0.0%) | 1 (100.0%) |
| Professional & Scientific | 0 (0.0%) | 0 (0.0%) |
| Enterprise Management | 0 (0.0%) | 0 (0.0%) |
| Administrative & Support | 0 (0.0%) | 0 (0.0%) |
| Educational Services | 0 (0.0%) | 0 (0.0%) |
| Health Care & Social Assistance | 0 (0.0%) | 0 (0.0%) |
| Arts, Entertainment & Recreation | 0 (0.0%) | 0 (0.0%) |
| Accommodation & Food Services | 2 (66.7%) | 1 (33.3%) |
| Public Administration | 0 (0.0%) | 0 (0.0%) |
| Total | 6 (60.0%) | 4 (40.0%) |
Education in Glen Haven
School Enrollment in Glen Haven
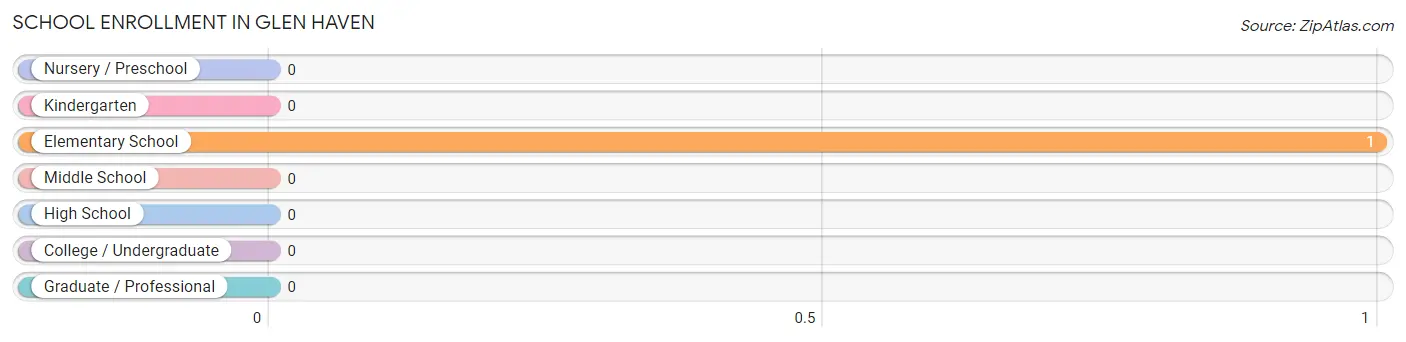
| School Level | # Students | % Students |
| Nursery / Preschool | 0 | 0.0% |
| Kindergarten | 0 | 0.0% |
| Elementary School | 1 | 100.0% |
| Middle School | 0 | 0.0% |
| High School | 0 | 0.0% |
| College / Undergraduate | 0 | 0.0% |
| Graduate / Professional | 0 | 0.0% |
| Total | 1 | 100.0% |
School Enrollment by Age by Funding Source in Glen Haven
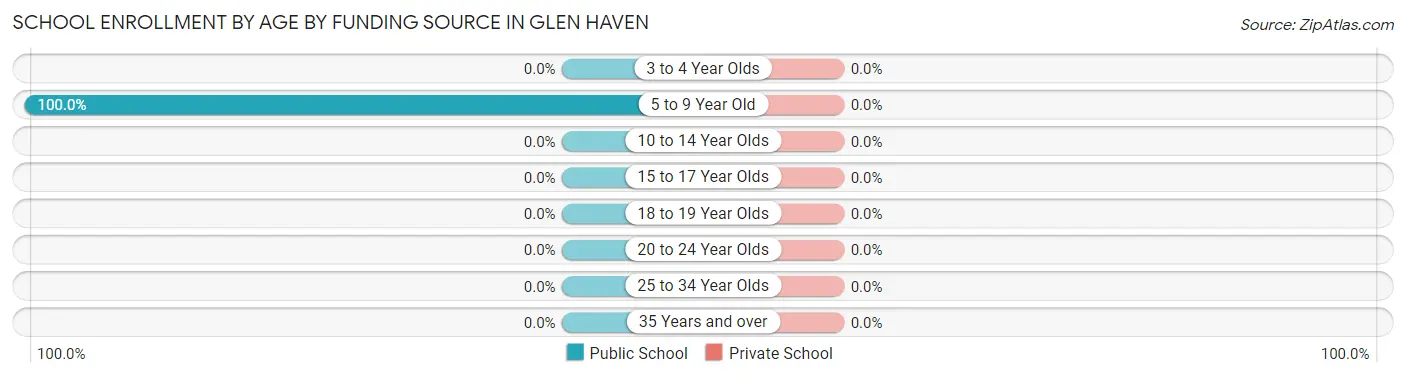
| Age Bracket | Public School | Private School |
| 3 to 4 Year Olds | 0 (0.0%) | 0 (0.0%) |
| 5 to 9 Year Old | 1 (100.0%) | 0 (0.0%) |
| 10 to 14 Year Olds | 0 (0.0%) | 0 (0.0%) |
| 15 to 17 Year Olds | 0 (0.0%) | 0 (0.0%) |
| 18 to 19 Year Olds | 0 (0.0%) | 0 (0.0%) |
| 20 to 24 Year Olds | 0 (0.0%) | 0 (0.0%) |
| 25 to 34 Year Olds | 0 (0.0%) | 0 (0.0%) |
| 35 Years and over | 0 (0.0%) | 0 (0.0%) |
| Total | 1 (100.0%) | 0 (0.0%) |
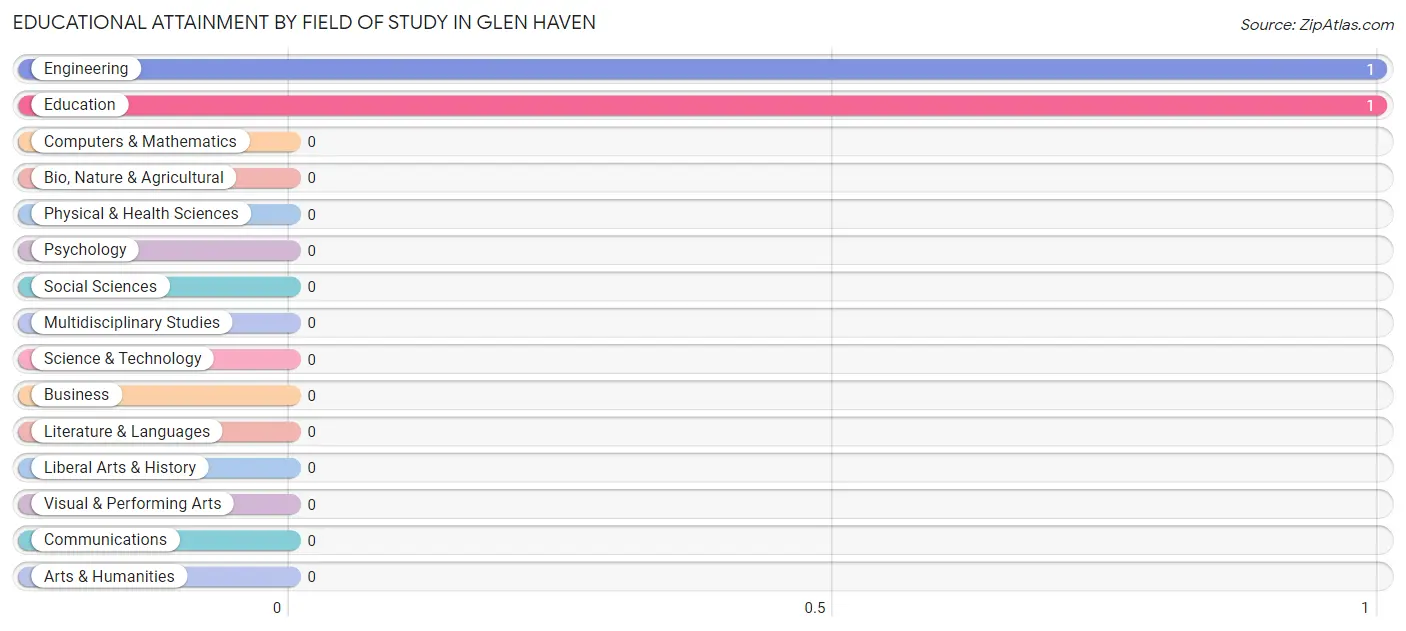
Educational Attainment by Field of Study in Glen Haven
Engineering (1 | 50.0%), and education (1 | 50.0%) are the most common fields of study among 2 individuals in Glen Haven who have obtained a bachelor's degree or higher.
| Field of Study | # Graduates | % Graduates |
| Computers & Mathematics | 0 | 0.0% |
| Bio, Nature & Agricultural | 0 | 0.0% |
| Physical & Health Sciences | 0 | 0.0% |
| Psychology | 0 | 0.0% |
| Social Sciences | 0 | 0.0% |
| Engineering | 1 | 50.0% |
| Multidisciplinary Studies | 0 | 0.0% |
| Science & Technology | 0 | 0.0% |
| Business | 0 | 0.0% |
| Education | 1 | 50.0% |
| Literature & Languages | 0 | 0.0% |
| Liberal Arts & History | 0 | 0.0% |
| Visual & Performing Arts | 0 | 0.0% |
| Communications | 0 | 0.0% |
| Arts & Humanities | 0 | 0.0% |
| Total | 2 | 100.0% |
Transportation & Commute in Glen Haven
Vehicle Availability by Sex in Glen Haven
The most prevalent vehicle ownership categories in Glen Haven are males with 1 vehicle (3, accounting for 50.0%) and females with 1 vehicle (0, making up 75.0%).
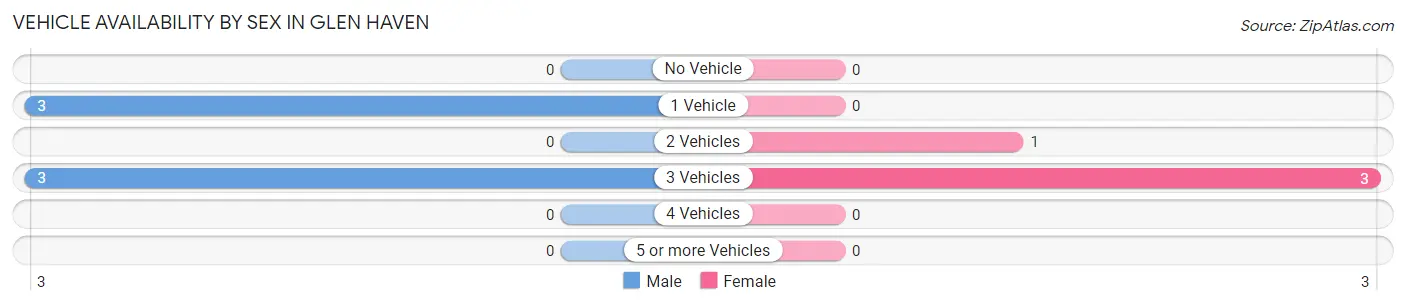
| Vehicles Available | Male | Female |
| No Vehicle | 0 (0.0%) | 0 (0.0%) |
| 1 Vehicle | 3 (50.0%) | 0 (0.0%) |
| 2 Vehicles | 0 (0.0%) | 1 (25.0%) |
| 3 Vehicles | 3 (50.0%) | 3 (75.0%) |
| 4 Vehicles | 0 (0.0%) | 0 (0.0%) |
| 5 or more Vehicles | 0 (0.0%) | 0 (0.0%) |
| Total | 6 (100.0%) | 4 (100.0%) |
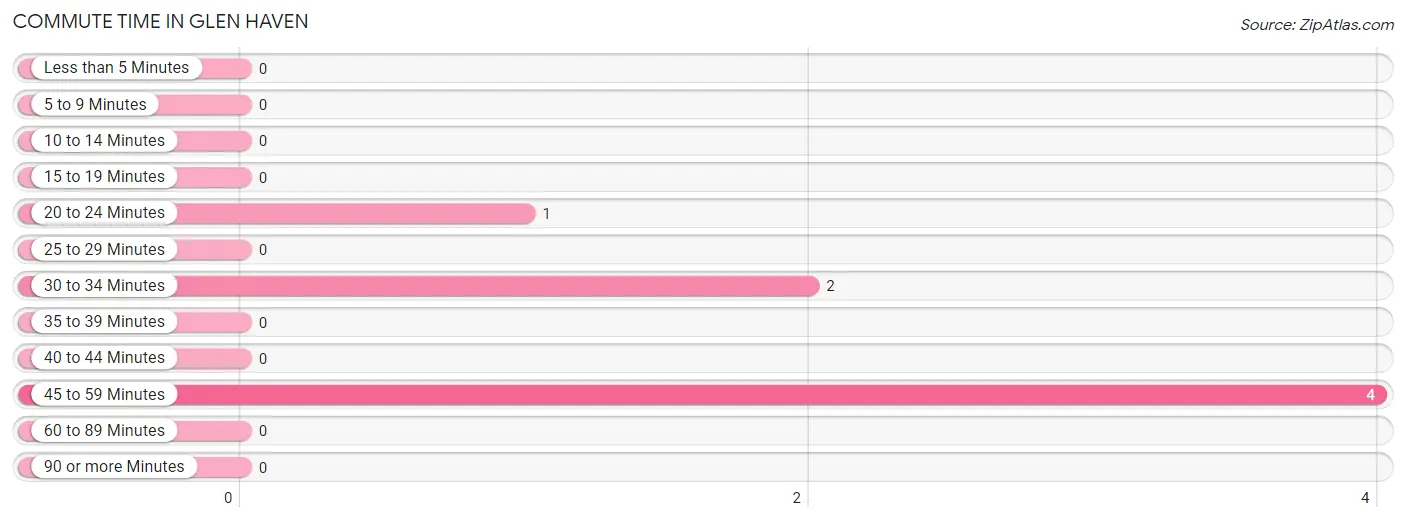
Commute Time in Glen Haven
The most frequently occuring commute durations in Glen Haven are 45 to 59 minutes (4 commuters, 57.1%), 30 to 34 minutes (2 commuters, 28.6%), and 20 to 24 minutes (1 commuters, 14.3%).
| Commute Time | # Commuters | % Commuters |
| Less than 5 Minutes | 0 | 0.0% |
| 5 to 9 Minutes | 0 | 0.0% |
| 10 to 14 Minutes | 0 | 0.0% |
| 15 to 19 Minutes | 0 | 0.0% |
| 20 to 24 Minutes | 1 | 14.3% |
| 25 to 29 Minutes | 0 | 0.0% |
| 30 to 34 Minutes | 2 | 28.6% |
| 35 to 39 Minutes | 0 | 0.0% |
| 40 to 44 Minutes | 0 | 0.0% |
| 45 to 59 Minutes | 4 | 57.1% |
| 60 to 89 Minutes | 0 | 0.0% |
| 90 or more Minutes | 0 | 0.0% |
Commute Time by Sex in Glen Haven
The most common commute times in Glen Haven are 45 to 59 minutes (4 commuters, 100.0%) for males and 30 to 34 minutes (2 commuters, 66.7%) for females.
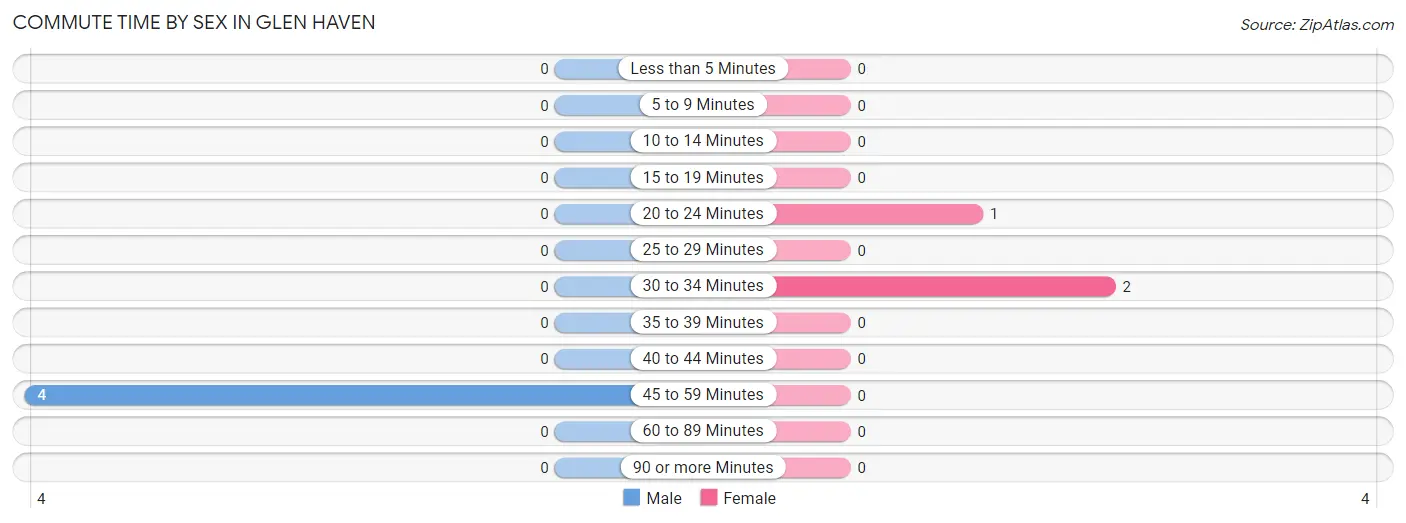
| Commute Time | Male | Female |
| Less than 5 Minutes | 0 (0.0%) | 0 (0.0%) |
| 5 to 9 Minutes | 0 (0.0%) | 0 (0.0%) |
| 10 to 14 Minutes | 0 (0.0%) | 0 (0.0%) |
| 15 to 19 Minutes | 0 (0.0%) | 0 (0.0%) |
| 20 to 24 Minutes | 0 (0.0%) | 1 (33.3%) |
| 25 to 29 Minutes | 0 (0.0%) | 0 (0.0%) |
| 30 to 34 Minutes | 0 (0.0%) | 2 (66.7%) |
| 35 to 39 Minutes | 0 (0.0%) | 0 (0.0%) |
| 40 to 44 Minutes | 0 (0.0%) | 0 (0.0%) |
| 45 to 59 Minutes | 4 (100.0%) | 0 (0.0%) |
| 60 to 89 Minutes | 0 (0.0%) | 0 (0.0%) |
| 90 or more Minutes | 0 (0.0%) | 0 (0.0%) |
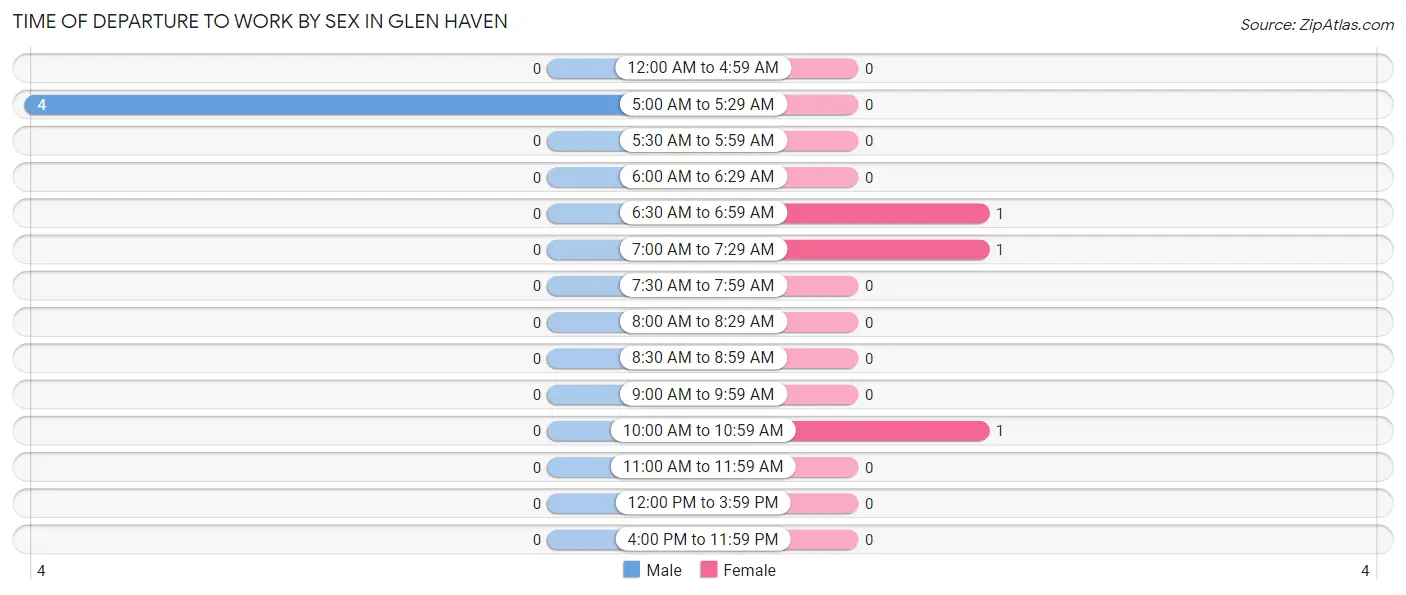
Time of Departure to Work by Sex in Glen Haven
The most frequent times of departure to work in Glen Haven are 5:00 AM to 5:29 AM (4, 100.0%) for males and 6:30 AM to 6:59 AM (1, 33.3%) for females.
| Time of Departure | Male | Female |
| 12:00 AM to 4:59 AM | 0 (0.0%) | 0 (0.0%) |
| 5:00 AM to 5:29 AM | 4 (100.0%) | 0 (0.0%) |
| 5:30 AM to 5:59 AM | 0 (0.0%) | 0 (0.0%) |
| 6:00 AM to 6:29 AM | 0 (0.0%) | 0 (0.0%) |
| 6:30 AM to 6:59 AM | 0 (0.0%) | 1 (33.3%) |
| 7:00 AM to 7:29 AM | 0 (0.0%) | 1 (33.3%) |
| 7:30 AM to 7:59 AM | 0 (0.0%) | 0 (0.0%) |
| 8:00 AM to 8:29 AM | 0 (0.0%) | 0 (0.0%) |
| 8:30 AM to 8:59 AM | 0 (0.0%) | 0 (0.0%) |
| 9:00 AM to 9:59 AM | 0 (0.0%) | 0 (0.0%) |
| 10:00 AM to 10:59 AM | 0 (0.0%) | 1 (33.3%) |
| 11:00 AM to 11:59 AM | 0 (0.0%) | 0 (0.0%) |
| 12:00 PM to 3:59 PM | 0 (0.0%) | 0 (0.0%) |
| 4:00 PM to 11:59 PM | 0 (0.0%) | 0 (0.0%) |
| Total | 4 (100.0%) | 3 (100.0%) |
Housing Occupancy in Glen Haven
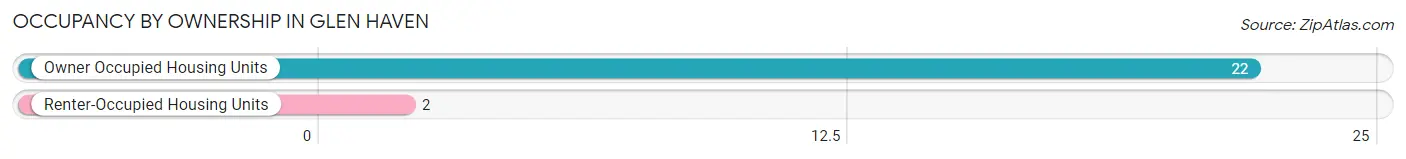
Occupancy by Ownership in Glen Haven
Of the total 24 dwellings in Glen Haven, owner-occupied units account for 22 (91.7%), while renter-occupied units make up 2 (8.3%).
| Occupancy | # Housing Units | % Housing Units |
| Owner Occupied Housing Units | 22 | 91.7% |
| Renter-Occupied Housing Units | 2 | 8.3% |
| Total Occupied Housing Units | 24 | 100.0% |
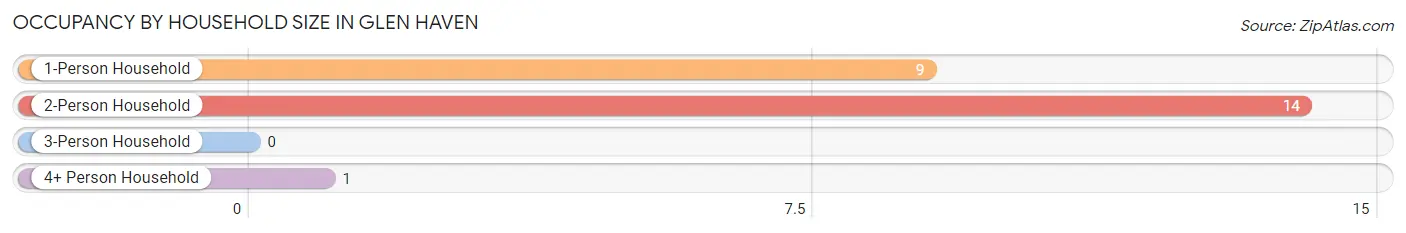
Occupancy by Household Size in Glen Haven
| Household Size | # Housing Units | % Housing Units |
| 1-Person Household | 9 | 37.5% |
| 2-Person Household | 14 | 58.3% |
| 3-Person Household | 0 | 0.0% |
| 4+ Person Household | 1 | 4.2% |
| Total Housing Units | 24 | 100.0% |
Occupancy by Ownership by Household Size in Glen Haven
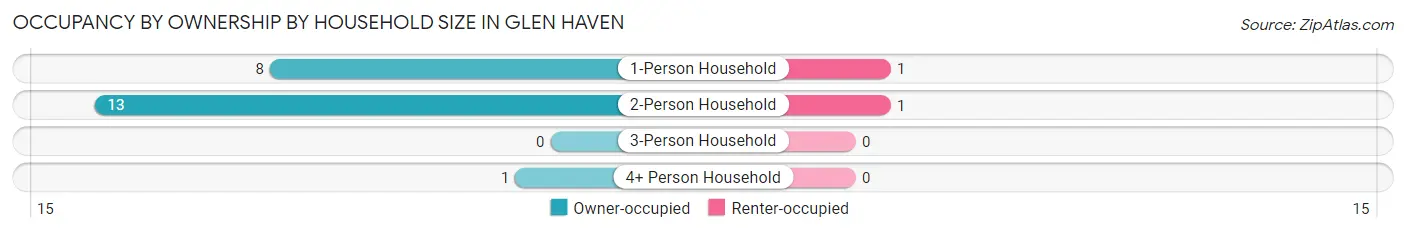
| Household Size | Owner-occupied | Renter-occupied |
| 1-Person Household | 8 (88.9%) | 1 (11.1%) |
| 2-Person Household | 13 (92.9%) | 1 (7.1%) |
| 3-Person Household | 0 (0.0%) | 0 (0.0%) |
| 4+ Person Household | 1 (100.0%) | 0 (0.0%) |
| Total Housing Units | 22 (91.7%) | 2 (8.3%) |
Occupancy by Educational Attainment in Glen Haven
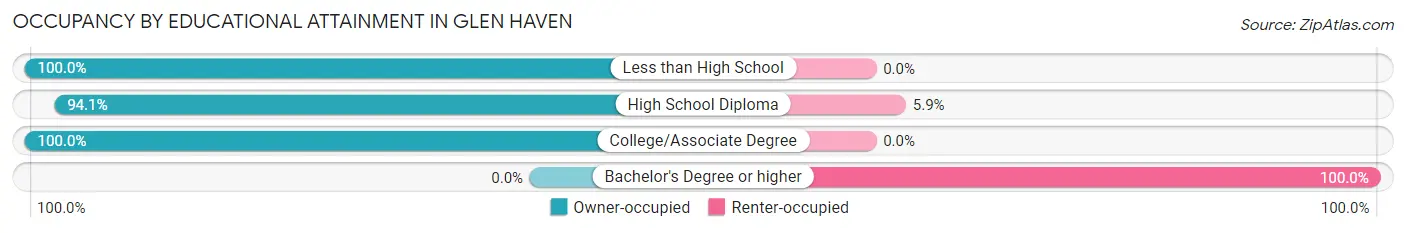
| Household Size | Owner-occupied | Renter-occupied |
| Less than High School | 3 (100.0%) | 0 (0.0%) |
| High School Diploma | 16 (94.1%) | 1 (5.9%) |
| College/Associate Degree | 3 (100.0%) | 0 (0.0%) |
| Bachelor's Degree or higher | 0 (0.0%) | 1 (100.0%) |
Occupancy by Age of Householder in Glen Haven
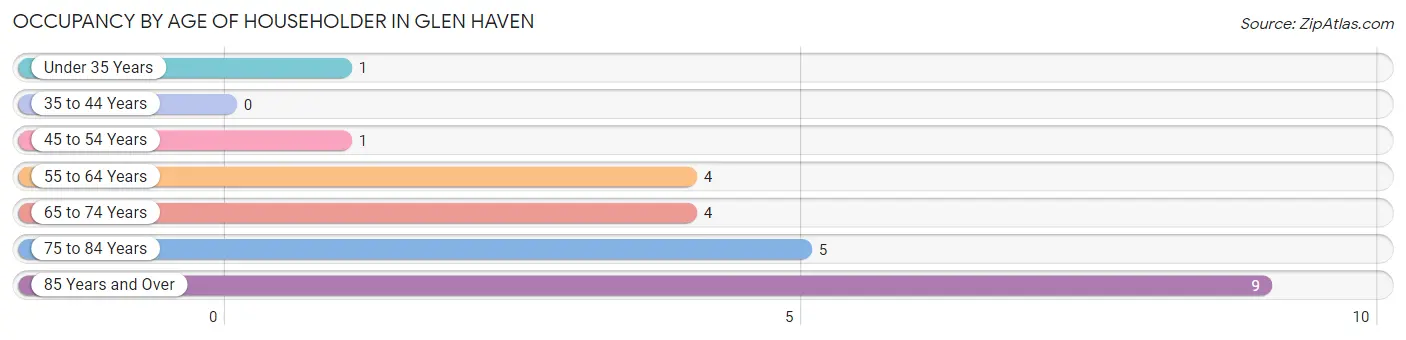
| Age Bracket | # Households | % Households |
| Under 35 Years | 1 | 4.2% |
| 35 to 44 Years | 0 | 0.0% |
| 45 to 54 Years | 1 | 4.2% |
| 55 to 64 Years | 4 | 16.7% |
| 65 to 74 Years | 4 | 16.7% |
| 75 to 84 Years | 5 | 20.8% |
| 85 Years and Over | 9 | 37.5% |
| Total | 24 | 100.0% |
Housing Finances in Glen Haven
Median Income by Occupancy in Glen Haven
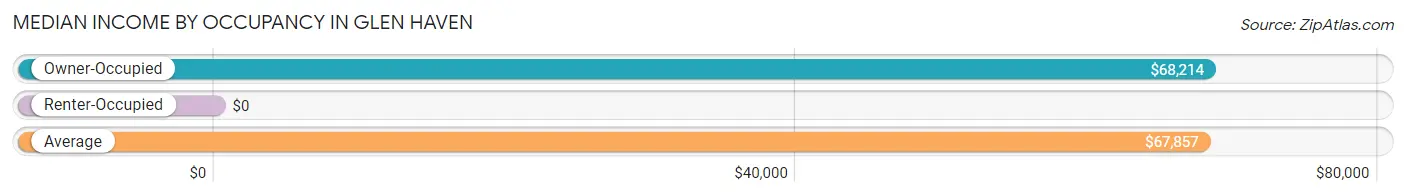
| Occupancy Type | # Households | Median Income |
| Owner-Occupied | 22 (91.7%) | $68,214 |
| Renter-Occupied | 2 (8.3%) | $0 |
| Average | 24 (100.0%) | $67,857 |
Occupancy by Householder Income Bracket in Glen Haven
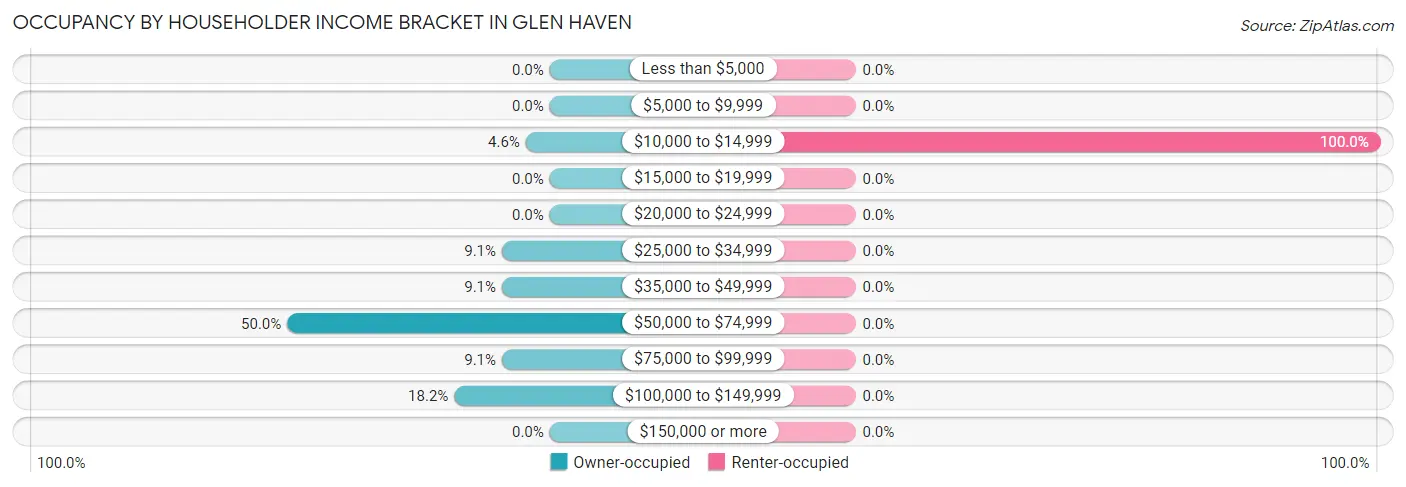
| Income Bracket | Owner-occupied | Renter-occupied |
| Less than $5,000 | 0 (0.0%) | 0 (0.0%) |
| $5,000 to $9,999 | 0 (0.0%) | 0 (0.0%) |
| $10,000 to $14,999 | 1 (4.5%) | 2 (100.0%) |
| $15,000 to $19,999 | 0 (0.0%) | 0 (0.0%) |
| $20,000 to $24,999 | 0 (0.0%) | 0 (0.0%) |
| $25,000 to $34,999 | 2 (9.1%) | 0 (0.0%) |
| $35,000 to $49,999 | 2 (9.1%) | 0 (0.0%) |
| $50,000 to $74,999 | 11 (50.0%) | 0 (0.0%) |
| $75,000 to $99,999 | 2 (9.1%) | 0 (0.0%) |
| $100,000 to $149,999 | 4 (18.2%) | 0 (0.0%) |
| $150,000 or more | 0 (0.0%) | 0 (0.0%) |
| Total | 22 (100.0%) | 2 (100.0%) |
Monthly Housing Cost Tiers in Glen Haven
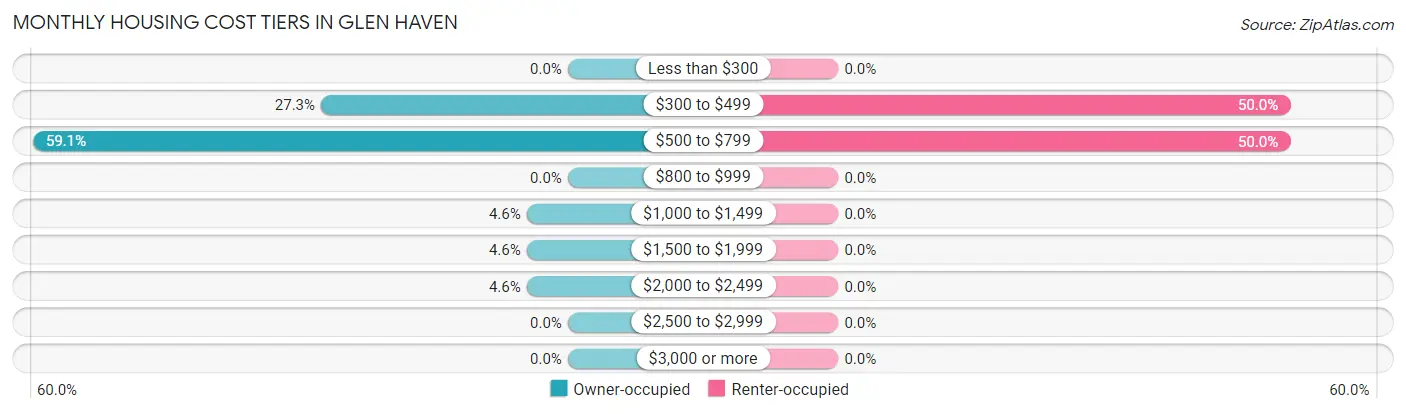
| Monthly Cost | Owner-occupied | Renter-occupied |
| Less than $300 | 0 (0.0%) | 0 (0.0%) |
| $300 to $499 | 6 (27.3%) | 1 (50.0%) |
| $500 to $799 | 13 (59.1%) | 1 (50.0%) |
| $800 to $999 | 0 (0.0%) | 0 (0.0%) |
| $1,000 to $1,499 | 1 (4.5%) | 0 (0.0%) |
| $1,500 to $1,999 | 1 (4.5%) | 0 (0.0%) |
| $2,000 to $2,499 | 1 (4.5%) | 0 (0.0%) |
| $2,500 to $2,999 | 0 (0.0%) | 0 (0.0%) |
| $3,000 or more | 0 (0.0%) | 0 (0.0%) |
| Total | 22 (100.0%) | 2 (100.0%) |
Physical Housing Characteristics in Glen Haven
Housing Structures in Glen Haven
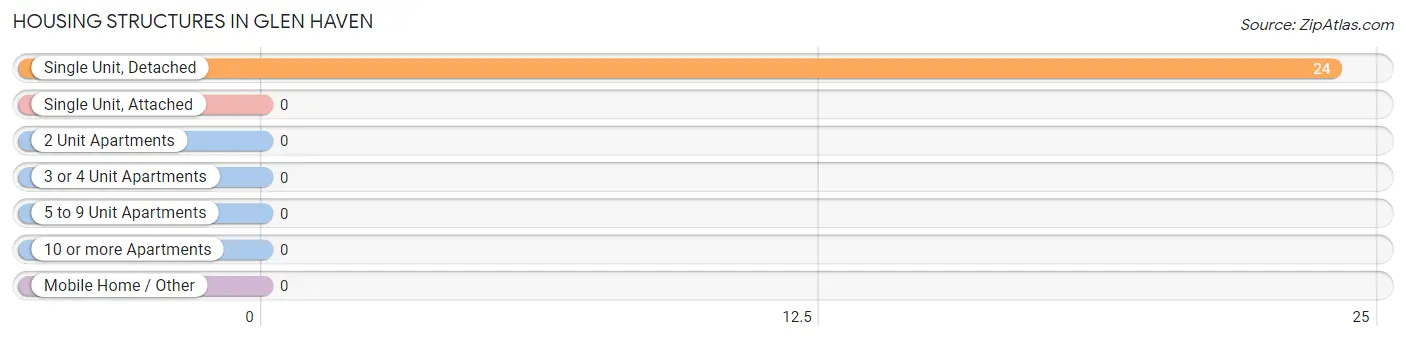
| Structure Type | # Housing Units | % Housing Units |
| Single Unit, Detached | 24 | 100.0% |
| Single Unit, Attached | 0 | 0.0% |
| 2 Unit Apartments | 0 | 0.0% |
| 3 or 4 Unit Apartments | 0 | 0.0% |
| 5 to 9 Unit Apartments | 0 | 0.0% |
| 10 or more Apartments | 0 | 0.0% |
| Mobile Home / Other | 0 | 0.0% |
| Total | 24 | 100.0% |
Housing Structures by Occupancy in Glen Haven
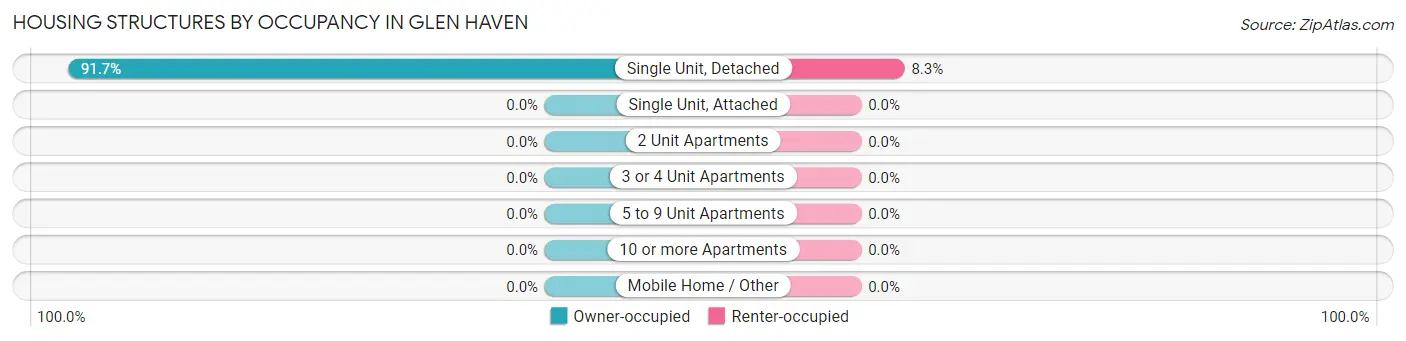
| Structure Type | Owner-occupied | Renter-occupied |
| Single Unit, Detached | 22 (91.7%) | 2 (8.3%) |
| Single Unit, Attached | 0 (0.0%) | 0 (0.0%) |
| 2 Unit Apartments | 0 (0.0%) | 0 (0.0%) |
| 3 or 4 Unit Apartments | 0 (0.0%) | 0 (0.0%) |
| 5 to 9 Unit Apartments | 0 (0.0%) | 0 (0.0%) |
| 10 or more Apartments | 0 (0.0%) | 0 (0.0%) |
| Mobile Home / Other | 0 (0.0%) | 0 (0.0%) |
| Total | 22 (91.7%) | 2 (8.3%) |
Housing Structures by Number of Rooms in Glen Haven
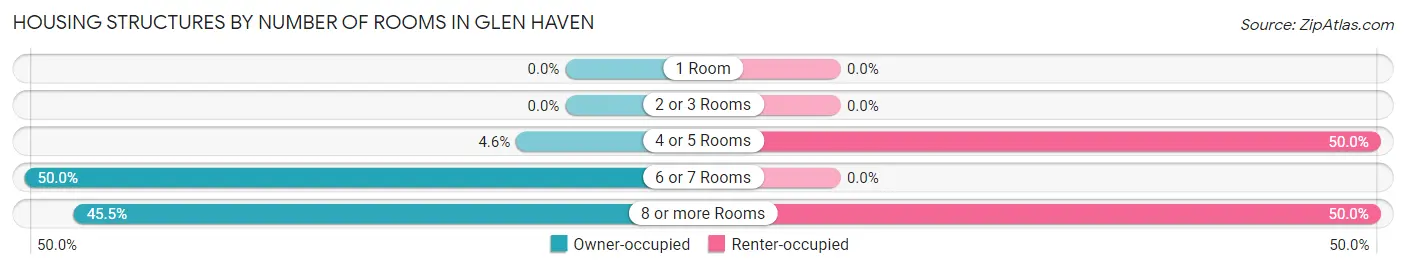
| Number of Rooms | Owner-occupied | Renter-occupied |
| 1 Room | 0 (0.0%) | 0 (0.0%) |
| 2 or 3 Rooms | 0 (0.0%) | 0 (0.0%) |
| 4 or 5 Rooms | 1 (4.5%) | 1 (50.0%) |
| 6 or 7 Rooms | 11 (50.0%) | 0 (0.0%) |
| 8 or more Rooms | 10 (45.5%) | 1 (50.0%) |
| Total | 22 (100.0%) | 2 (100.0%) |
Housing Structure by Heating Type in Glen Haven
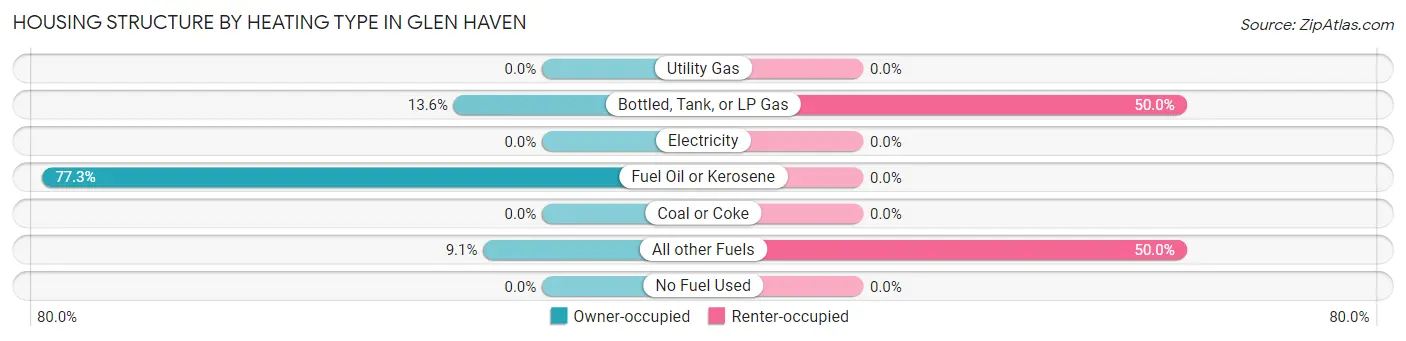
| Heating Type | Owner-occupied | Renter-occupied |
| Utility Gas | 0 (0.0%) | 0 (0.0%) |
| Bottled, Tank, or LP Gas | 3 (13.6%) | 1 (50.0%) |
| Electricity | 0 (0.0%) | 0 (0.0%) |
| Fuel Oil or Kerosene | 17 (77.3%) | 0 (0.0%) |
| Coal or Coke | 0 (0.0%) | 0 (0.0%) |
| All other Fuels | 2 (9.1%) | 1 (50.0%) |
| No Fuel Used | 0 (0.0%) | 0 (0.0%) |
| Total | 22 (100.0%) | 2 (100.0%) |
Household Vehicle Usage in Glen Haven
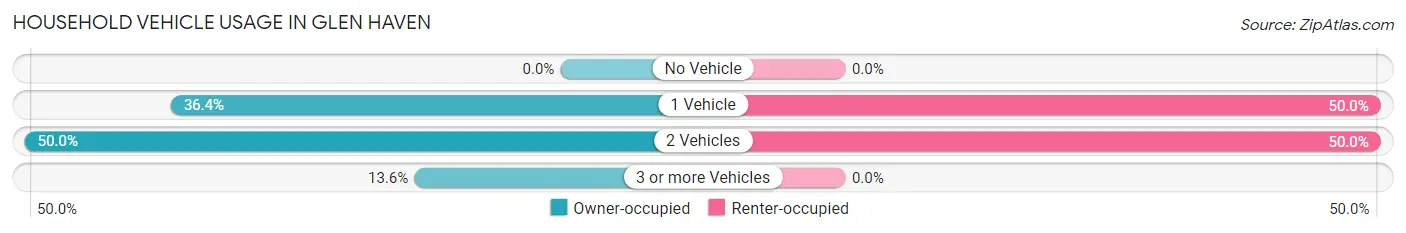
| Vehicles per Household | Owner-occupied | Renter-occupied |
| No Vehicle | 0 (0.0%) | 0 (0.0%) |
| 1 Vehicle | 8 (36.4%) | 1 (50.0%) |
| 2 Vehicles | 11 (50.0%) | 1 (50.0%) |
| 3 or more Vehicles | 3 (13.6%) | 0 (0.0%) |
| Total | 22 (100.0%) | 2 (100.0%) |
Real Estate & Mortgages in Glen Haven
Real Estate and Mortgage Overview in Glen Haven
| Characteristic | Without Mortgage | With Mortgage |
| Housing Units | 19 | 3 |
| Median Property Value | $67,500 | $162,500 |
| Median Household Income | $68,393 | $0 |
| Monthly Housing Costs | $539 | $0 |
| Real Estate Taxes | $1,673 | $0 |
Property Value by Mortgage Status in Glen Haven
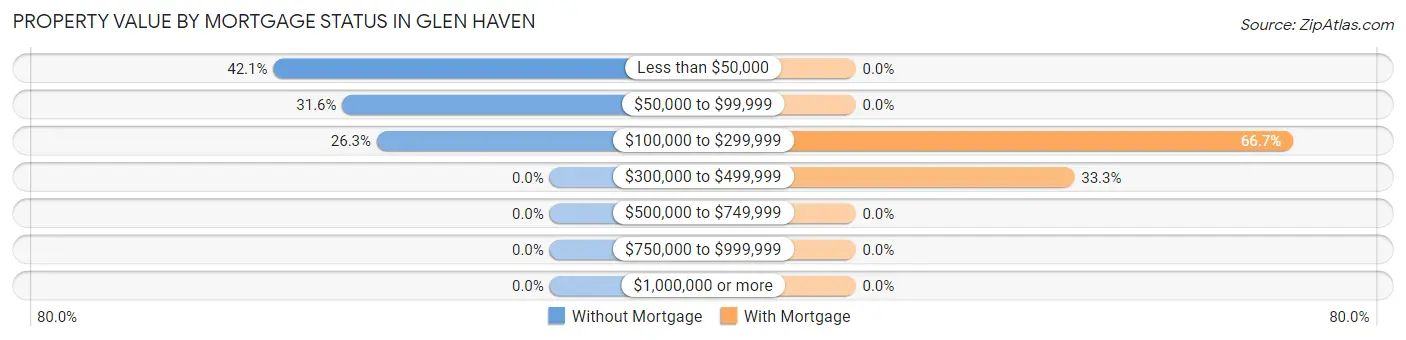
| Property Value | Without Mortgage | With Mortgage |
| Less than $50,000 | 8 (42.1%) | 0 (0.0%) |
| $50,000 to $99,999 | 6 (31.6%) | 0 (0.0%) |
| $100,000 to $299,999 | 5 (26.3%) | 2 (66.7%) |
| $300,000 to $499,999 | 0 (0.0%) | 1 (33.3%) |
| $500,000 to $749,999 | 0 (0.0%) | 0 (0.0%) |
| $750,000 to $999,999 | 0 (0.0%) | 0 (0.0%) |
| $1,000,000 or more | 0 (0.0%) | 0 (0.0%) |
| Total | 19 (100.0%) | 3 (100.0%) |
Household Income by Mortgage Status in Glen Haven
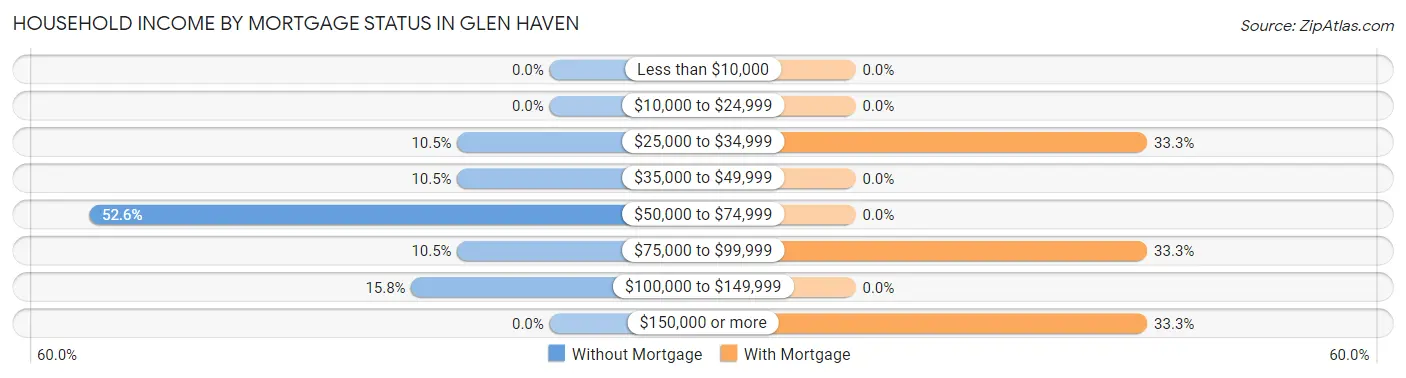
| Household Income | Without Mortgage | With Mortgage |
| Less than $10,000 | 0 (0.0%) | 0 (0.0%) |
| $10,000 to $24,999 | 0 (0.0%) | 0 (0.0%) |
| $25,000 to $34,999 | 2 (10.5%) | 1 (33.3%) |
| $35,000 to $49,999 | 2 (10.5%) | 0 (0.0%) |
| $50,000 to $74,999 | 10 (52.6%) | 0 (0.0%) |
| $75,000 to $99,999 | 2 (10.5%) | 1 (33.3%) |
| $100,000 to $149,999 | 3 (15.8%) | 0 (0.0%) |
| $150,000 or more | 0 (0.0%) | 1 (33.3%) |
| Total | 19 (100.0%) | 3 (100.0%) |
Property Value to Household Income Ratio in Glen Haven
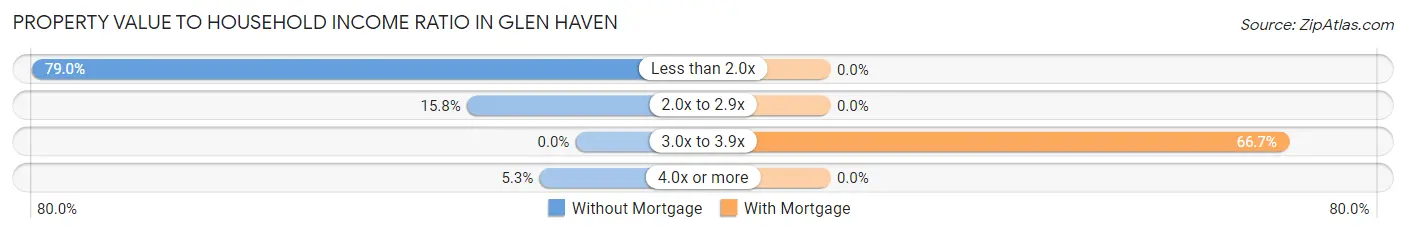
| Value-to-Income Ratio | Without Mortgage | With Mortgage |
| Less than 2.0x | 15 (78.9%) | 0 (0.0%) |
| 2.0x to 2.9x | 3 (15.8%) | 0 (0.0%) |
| 3.0x to 3.9x | 0 (0.0%) | 2 (66.7%) |
| 4.0x or more | 1 (5.3%) | 0 (0.0%) |
| Total | 19 (100.0%) | 3 (100.0%) |
Real Estate Taxes by Mortgage Status in Glen Haven
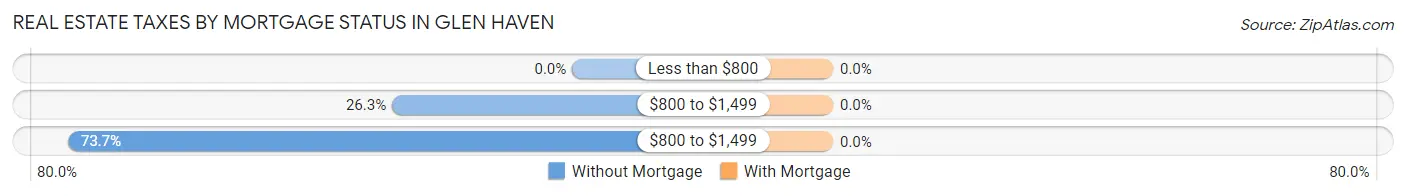
| Property Taxes | Without Mortgage | With Mortgage |
| Less than $800 | 0 (0.0%) | 0 (0.0%) |
| $800 to $1,499 | 5 (26.3%) | 0 (0.0%) |
| $800 to $1,499 | 14 (73.7%) | 0 (0.0%) |
| Total | 19 (100.0%) | 3 (100.0%) |
Health & Disability in Glen Haven
Health Insurance Coverage by Age in Glen Haven
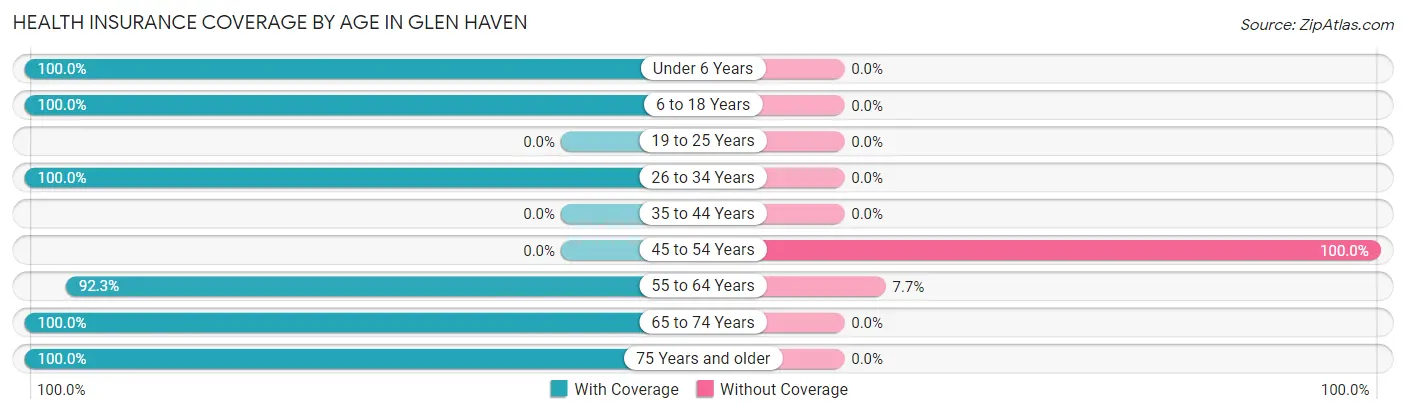
| Age Bracket | With Coverage | Without Coverage |
| Under 6 Years | 1 (100.0%) | 0 (0.0%) |
| 6 to 18 Years | 1 (100.0%) | 0 (0.0%) |
| 19 to 25 Years | 0 (0.0%) | 0 (0.0%) |
| 26 to 34 Years | 2 (100.0%) | 0 (0.0%) |
| 35 to 44 Years | 0 (0.0%) | 0 (0.0%) |
| 45 to 54 Years | 0 (0.0%) | 3 (100.0%) |
| 55 to 64 Years | 12 (92.3%) | 1 (7.7%) |
| 65 to 74 Years | 6 (100.0%) | 0 (0.0%) |
| 75 Years and older | 15 (100.0%) | 0 (0.0%) |
| Total | 37 (90.2%) | 4 (9.8%) |
Health Insurance Coverage by Citizenship Status in Glen Haven
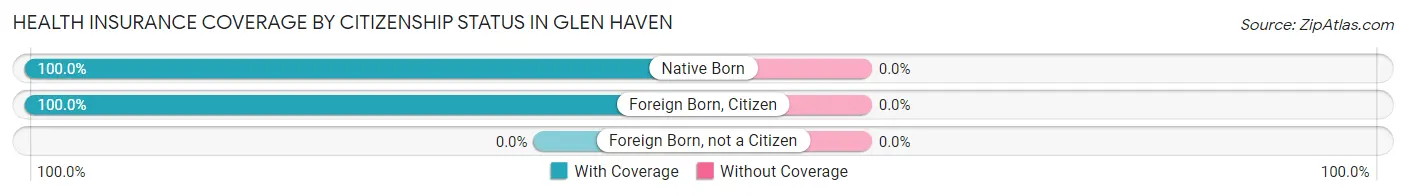
| Citizenship Status | With Coverage | Without Coverage |
| Native Born | 1 (100.0%) | 0 (0.0%) |
| Foreign Born, Citizen | 1 (100.0%) | 0 (0.0%) |
| Foreign Born, not a Citizen | 0 (0.0%) | 0 (0.0%) |
Health Insurance Coverage by Household Income in Glen Haven
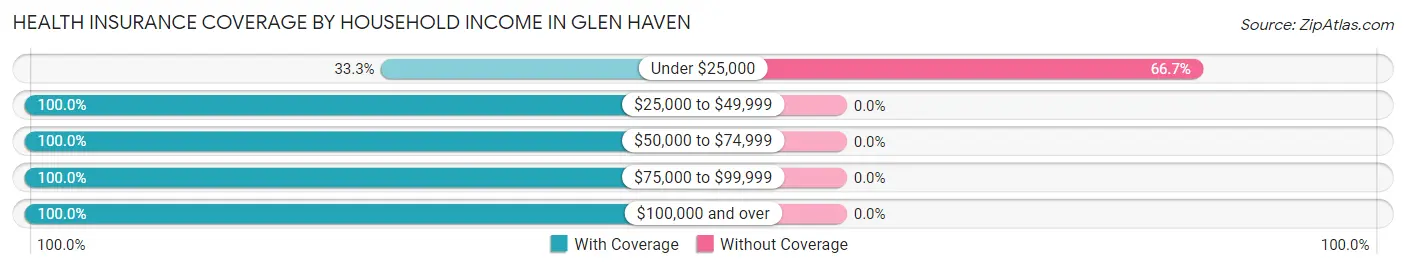
| Household Income | With Coverage | Without Coverage |
| Under $25,000 | 2 (33.3%) | 4 (66.7%) |
| $25,000 to $49,999 | 5 (100.0%) | 0 (0.0%) |
| $50,000 to $74,999 | 20 (100.0%) | 0 (0.0%) |
| $75,000 to $99,999 | 3 (100.0%) | 0 (0.0%) |
| $100,000 and over | 7 (100.0%) | 0 (0.0%) |
Public vs Private Health Insurance Coverage by Age in Glen Haven
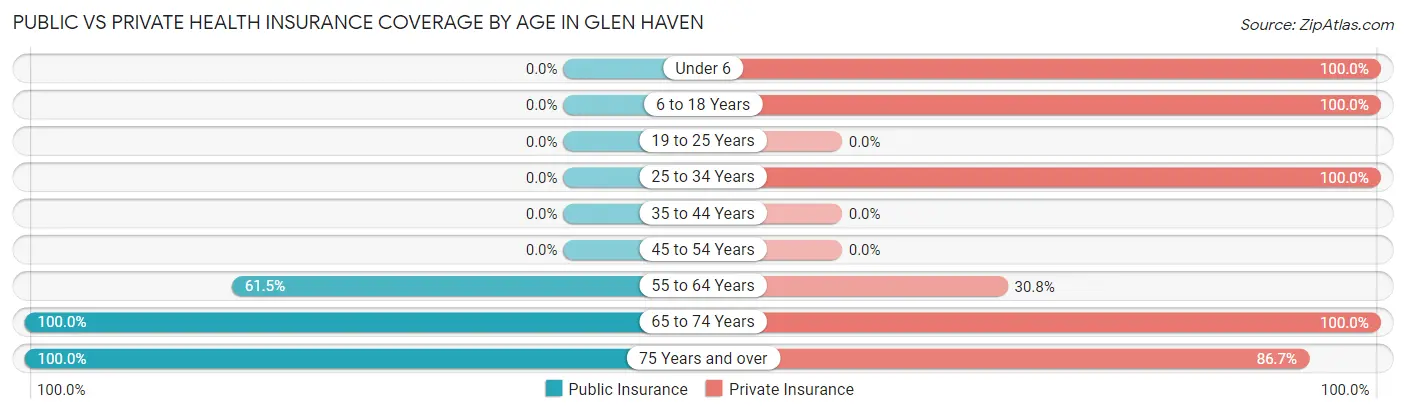
| Age Bracket | Public Insurance | Private Insurance |
| Under 6 | 0 (0.0%) | 1 (100.0%) |
| 6 to 18 Years | 0 (0.0%) | 1 (100.0%) |
| 19 to 25 Years | 0 (0.0%) | 0 (0.0%) |
| 25 to 34 Years | 0 (0.0%) | 2 (100.0%) |
| 35 to 44 Years | 0 (0.0%) | 0 (0.0%) |
| 45 to 54 Years | 0 (0.0%) | 0 (0.0%) |
| 55 to 64 Years | 8 (61.5%) | 4 (30.8%) |
| 65 to 74 Years | 6 (100.0%) | 6 (100.0%) |
| 75 Years and over | 15 (100.0%) | 13 (86.7%) |
| Total | 29 (70.7%) | 27 (65.8%) |
Disability Status by Sex by Age in Glen Haven
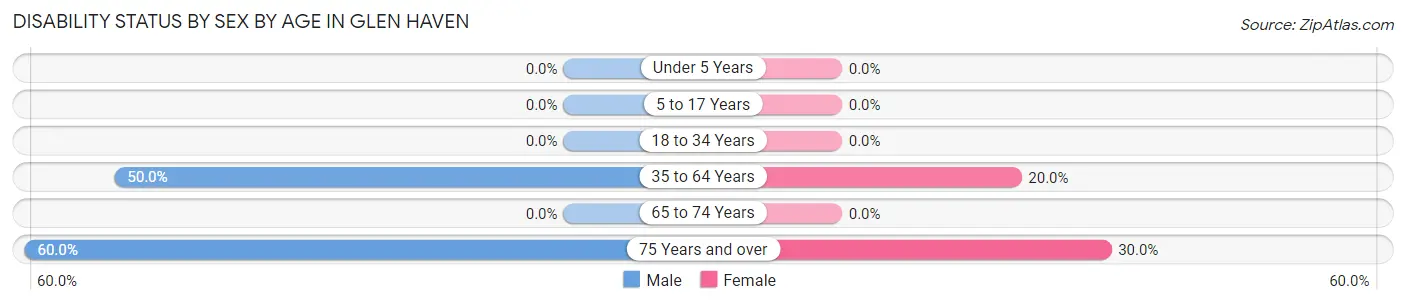
| Age Bracket | Male | Female |
| Under 5 Years | 0 (0.0%) | 0 (0.0%) |
| 5 to 17 Years | 0 (0.0%) | 0 (0.0%) |
| 18 to 34 Years | 0 (0.0%) | 0 (0.0%) |
| 35 to 64 Years | 3 (50.0%) | 2 (20.0%) |
| 65 to 74 Years | 0 (0.0%) | 0 (0.0%) |
| 75 Years and over | 3 (60.0%) | 3 (30.0%) |
Disability Class by Sex by Age in Glen Haven
Disability Class: Hearing Difficulty
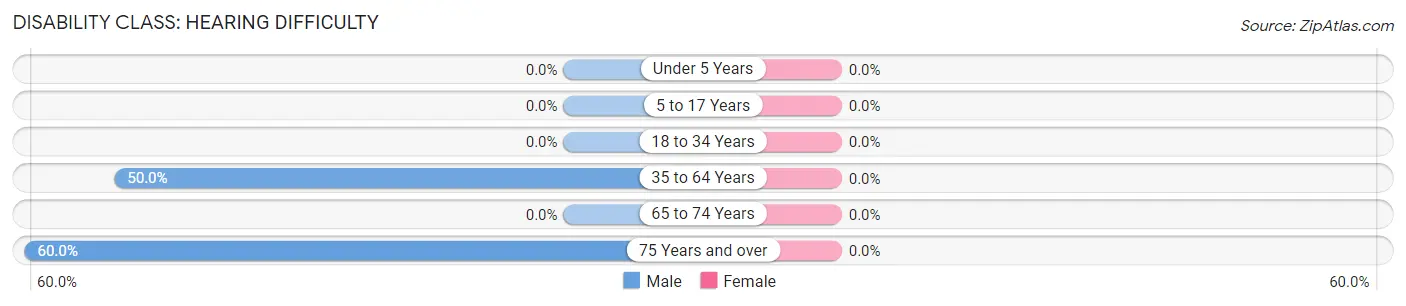
| Age Bracket | Male | Female |
| Under 5 Years | 0 (0.0%) | 0 (0.0%) |
| 5 to 17 Years | 0 (0.0%) | 0 (0.0%) |
| 18 to 34 Years | 0 (0.0%) | 0 (0.0%) |
| 35 to 64 Years | 3 (50.0%) | 0 (0.0%) |
| 65 to 74 Years | 0 (0.0%) | 0 (0.0%) |
| 75 Years and over | 3 (60.0%) | 0 (0.0%) |
Disability Class: Vision Difficulty
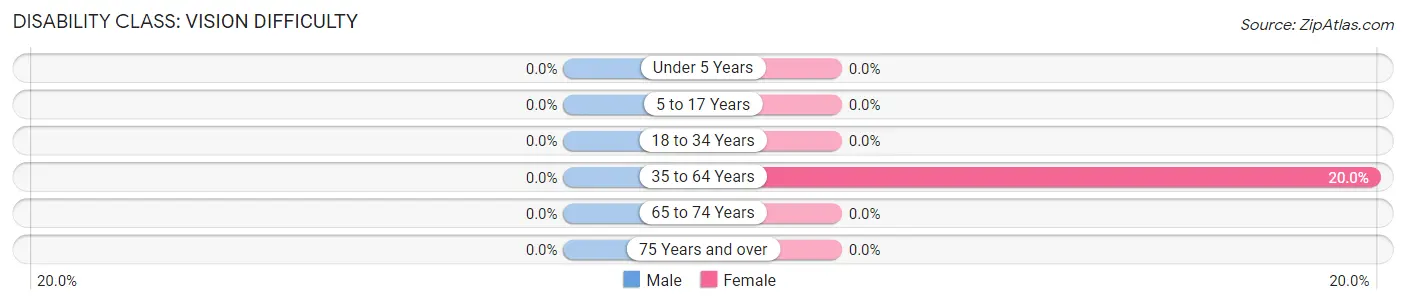
| Age Bracket | Male | Female |
| Under 5 Years | 0 (0.0%) | 0 (0.0%) |
| 5 to 17 Years | 0 (0.0%) | 0 (0.0%) |
| 18 to 34 Years | 0 (0.0%) | 0 (0.0%) |
| 35 to 64 Years | 0 (0.0%) | 2 (20.0%) |
| 65 to 74 Years | 0 (0.0%) | 0 (0.0%) |
| 75 Years and over | 0 (0.0%) | 0 (0.0%) |
Disability Class: Cognitive Difficulty

| Age Bracket | Male | Female |
| 5 to 17 Years | 0 (0.0%) | 0 (0.0%) |
| 18 to 34 Years | 0 (0.0%) | 0 (0.0%) |
| 35 to 64 Years | 0 (0.0%) | 1 (10.0%) |
| 65 to 74 Years | 0 (0.0%) | 0 (0.0%) |
| 75 Years and over | 0 (0.0%) | 0 (0.0%) |
Disability Class: Ambulatory Difficulty
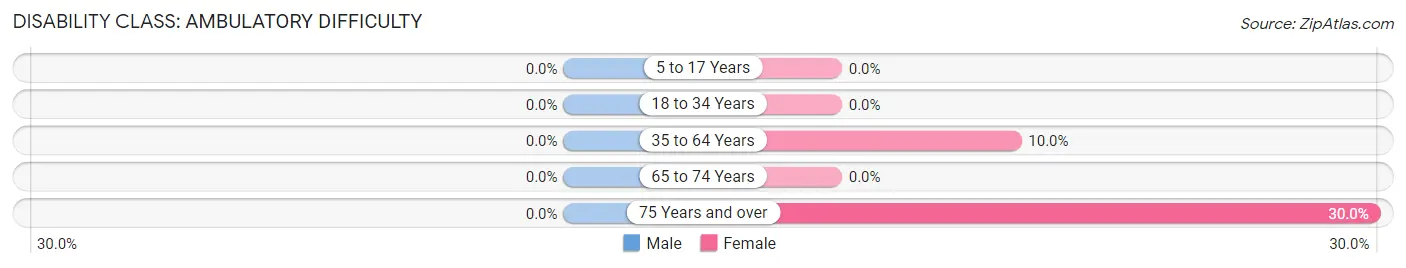
| Age Bracket | Male | Female |
| 5 to 17 Years | 0 (0.0%) | 0 (0.0%) |
| 18 to 34 Years | 0 (0.0%) | 0 (0.0%) |
| 35 to 64 Years | 0 (0.0%) | 1 (10.0%) |
| 65 to 74 Years | 0 (0.0%) | 0 (0.0%) |
| 75 Years and over | 0 (0.0%) | 3 (30.0%) |
Disability Class: Self-Care Difficulty
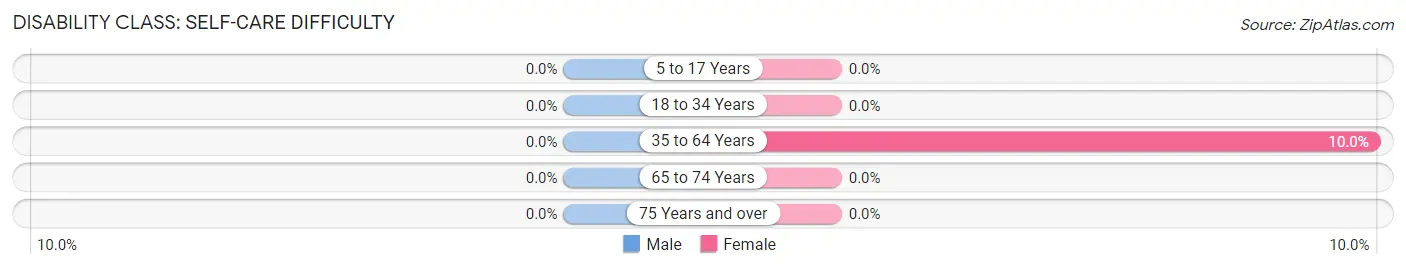
| Age Bracket | Male | Female |
| 5 to 17 Years | 0 (0.0%) | 0 (0.0%) |
| 18 to 34 Years | 0 (0.0%) | 0 (0.0%) |
| 35 to 64 Years | 0 (0.0%) | 1 (10.0%) |
| 65 to 74 Years | 0 (0.0%) | 0 (0.0%) |
| 75 Years and over | 0 (0.0%) | 0 (0.0%) |
Technology Access in Glen Haven
Computing Device Access in Glen Haven
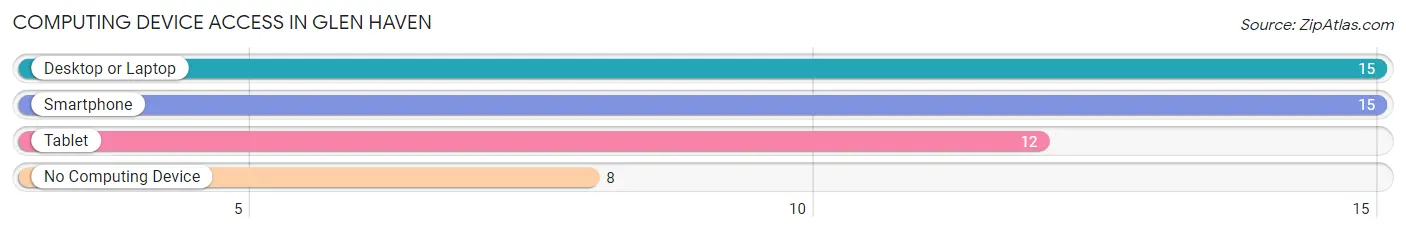
| Device Type | # Households | % Households |
| Desktop or Laptop | 15 | 62.5% |
| Smartphone | 15 | 62.5% |
| Tablet | 12 | 50.0% |
| No Computing Device | 8 | 33.3% |
| Total | 24 | 100.0% |
Internet Access in Glen Haven
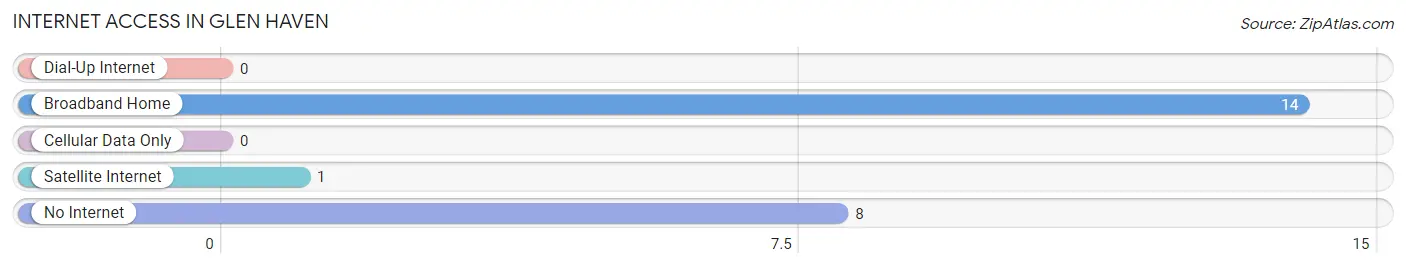
| Internet Type | # Households | % Households |
| Dial-Up Internet | 0 | 0.0% |
| Broadband Home | 14 | 58.3% |
| Cellular Data Only | 0 | 0.0% |
| Satellite Internet | 1 | 4.2% |
| No Internet | 8 | 33.3% |
| Total | 24 | 100.0% |
Glen Haven Summary
Glen Haven, Wisconsin is a small village located in the town of Glen Haven in Door County, Wisconsin. The village is situated on the shores of Lake Michigan and is home to a population of just over 500 people. The village is known for its picturesque views of the lake and its quaint, small-town atmosphere.
History
Glen Haven was first settled in the late 1800s by a group of Norwegian immigrants. The village was originally known as “Nordby”, which translates to “North Village” in Norwegian. The village was renamed to Glen Haven in 1891, after the nearby Glen Haven Resort. The resort was a popular destination for tourists and locals alike, and was known for its beautiful views of the lake.
The village was incorporated in 1895 and quickly became a popular summer destination for tourists. The village was home to several resorts, including the Glen Haven Resort, which was the largest and most popular. The resort was known for its beautiful views of the lake and its luxurious amenities.
In the early 1900s, the village began to experience a decline in tourism due to the Great Depression. The resorts closed and the village’s population began to decline. In the 1950s, the village experienced a resurgence in tourism due to the popularity of the nearby Door County peninsula. The village was home to several resorts and cottages, which attracted tourists from all over the Midwest.
Geography
Glen Haven is located in the town of Glen Haven in Door County, Wisconsin. The village is situated on the shores of Lake Michigan and is surrounded by the towns of Egg Harbor, Sturgeon Bay, and Baileys Harbor. The village is located approximately 30 miles north of Green Bay and is accessible by car via Highway 42.
The village is home to several parks and beaches, including the Glen Haven Beach, which is a popular destination for swimming and sunbathing. The village is also home to several marinas, which offer boat rentals and fishing charters.
Economy
The economy of Glen Haven is largely driven by tourism. The village is home to several resorts and cottages, which attract tourists from all over the Midwest. The village is also home to several restaurants, bars, and shops, which cater to the needs of tourists and locals alike.
The village is also home to several businesses, including a grocery store, a hardware store, and a post office. The village is also home to several art galleries, which showcase the work of local artists.
Demographics
As of the 2010 census, the population of Glen Haven was 514. The village is predominantly white, with 95.3% of the population identifying as white. The median household income in the village is $45,000, and the median age is 44. The village is home to a large number of retirees, with nearly 25% of the population over the age of 65.
Common Questions
What is Per Capita Income in Glen Haven?
Per Capita income in Glen Haven is $37,102.
What is the Median Family Income in Glen Haven?
Median Family Income in Glen Haven is $68,929.
What is the Median Household income in Glen Haven?
Median Household Income in Glen Haven is $67,857.
What is Inequality or Gini Index in Glen Haven?
Inequality or Gini Index in Glen Haven is 0.26.
What is the Total Population of Glen Haven?
Total Population of Glen Haven is 41.
What is the Total Male Population of Glen Haven?
Total Male Population of Glen Haven is 17.
What is the Total Female Population of Glen Haven?
Total Female Population of Glen Haven is 24.
What is the Ratio of Males per 100 Females in Glen Haven?
There are 70.83 Males per 100 Females in Glen Haven.
What is the Ratio of Females per 100 Males in Glen Haven?
There are 141.18 Females per 100 Males in Glen Haven.
What is the Median Population Age in Glen Haven?
Median Population Age in Glen Haven is 65.5 Years.
What is the Average Family Size in Glen Haven
Average Family Size in Glen Haven is 2.1 People.
What is the Average Household Size in Glen Haven
Average Household Size in Glen Haven is 1.7 People.
How Large is the Labor Force in Glen Haven?
There are 10 People in the Labor Forcein in Glen Haven.
What is the Percentage of People in the Labor Force in Glen Haven?
25.6% of People are in the Labor Force in Glen Haven.