Gorman, MD Map & Demographics
Gorman Map
Gorman Overview
$15,802
PER CAPITA INCOME
$67,864
AVG HOUSEHOLD INCOME
0.21
INEQUALITY / GINI INDEX
258
TOTAL POPULATION
114
MALE POPULATION
144
FEMALE POPULATION
79.17
MALES / 100 FEMALES
126.32
FEMALES / 100 MALES
56.3
MEDIAN AGE
3.2
AVG FAMILY SIZE
2.7
AVG HOUSEHOLD SIZE
84
LABOR FORCE [ PEOPLE ]
35.6%
PERCENT IN LABOR FORCE
Income in Gorman
Income Overview in Gorman
| Characteristic | Number | Measure |
| Per Capita Income | 258 | $15,802 |
| Median Family Income | 74 | $0 |
| Mean Family Income | 74 | $0 |
| Median Household Income | 94 | $67,864 |
| Mean Household Income | 94 | $52,184 |
| Income Deficit | 74 | $0 |
| Wage / Income Gap (%) | 258 | 0.00% |
| Wage / Income Gap ($) | 258 | 100.00¢ per $1 |
| Gini / Inequality Index | 258 | 0.21 |
Earnings by Sex in Gorman
| Sex | Number | Average Earnings |
| Male | 55 (65.5%) | $0 |
| Female | 29 (34.5%) | $0 |
| Total | 84 (100.0%) | $0 |
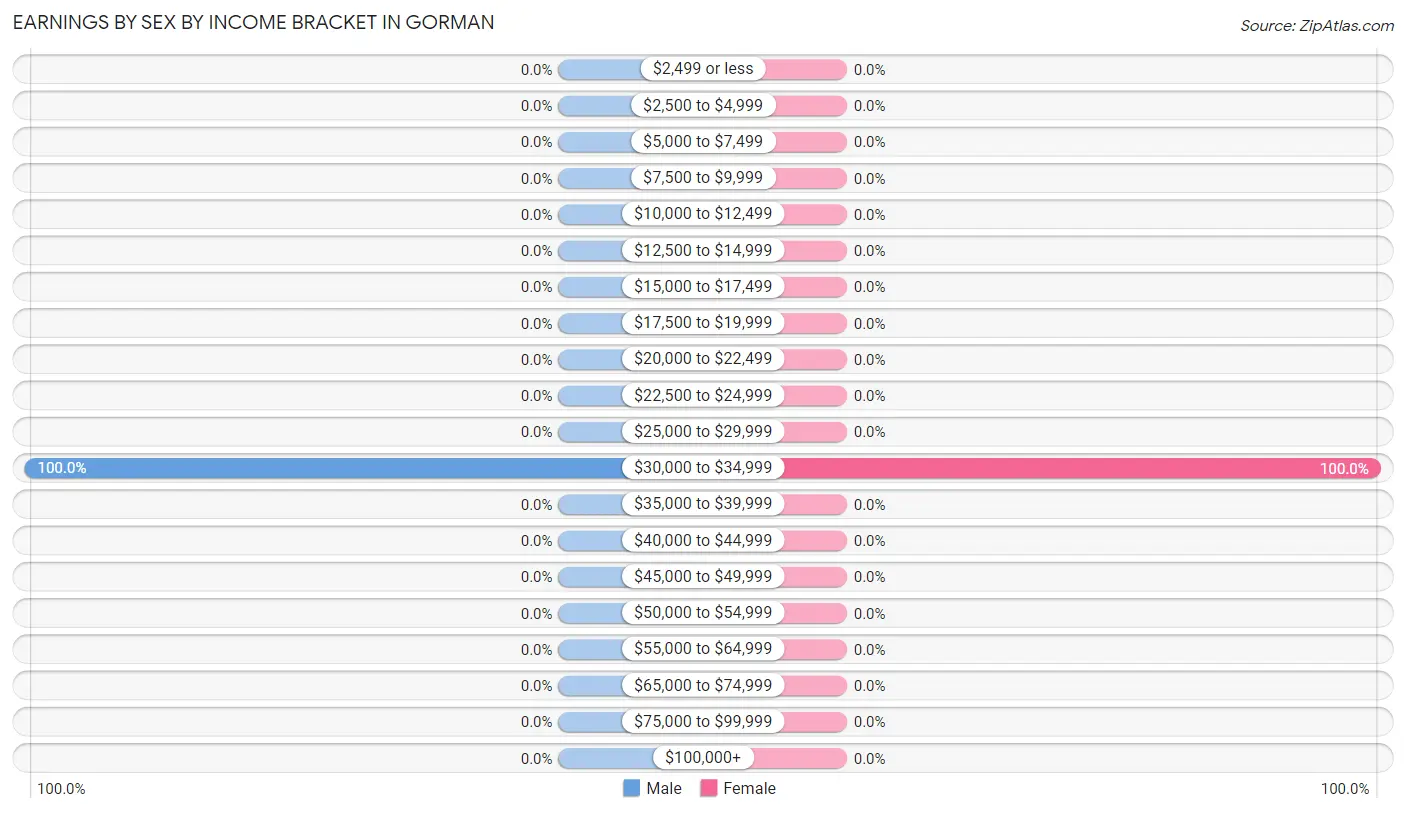
Earnings by Sex by Income Bracket in Gorman
The most common earnings brackets in Gorman are $30,000 to $34,999 for men (55 | 100.0%) and $30,000 to $34,999 for women (29 | 100.0%).
| Income | Male | Female |
| $2,499 or less | 0 (0.0%) | 0 (0.0%) |
| $2,500 to $4,999 | 0 (0.0%) | 0 (0.0%) |
| $5,000 to $7,499 | 0 (0.0%) | 0 (0.0%) |
| $7,500 to $9,999 | 0 (0.0%) | 0 (0.0%) |
| $10,000 to $12,499 | 0 (0.0%) | 0 (0.0%) |
| $12,500 to $14,999 | 0 (0.0%) | 0 (0.0%) |
| $15,000 to $17,499 | 0 (0.0%) | 0 (0.0%) |
| $17,500 to $19,999 | 0 (0.0%) | 0 (0.0%) |
| $20,000 to $22,499 | 0 (0.0%) | 0 (0.0%) |
| $22,500 to $24,999 | 0 (0.0%) | 0 (0.0%) |
| $25,000 to $29,999 | 0 (0.0%) | 0 (0.0%) |
| $30,000 to $34,999 | 55 (100.0%) | 29 (100.0%) |
| $35,000 to $39,999 | 0 (0.0%) | 0 (0.0%) |
| $40,000 to $44,999 | 0 (0.0%) | 0 (0.0%) |
| $45,000 to $49,999 | 0 (0.0%) | 0 (0.0%) |
| $50,000 to $54,999 | 0 (0.0%) | 0 (0.0%) |
| $55,000 to $64,999 | 0 (0.0%) | 0 (0.0%) |
| $65,000 to $74,999 | 0 (0.0%) | 0 (0.0%) |
| $75,000 to $99,999 | 0 (0.0%) | 0 (0.0%) |
| $100,000+ | 0 (0.0%) | 0 (0.0%) |
| Total | 55 (100.0%) | 29 (100.0%) |
Earnings by Sex by Educational Attainment in Gorman
| Educational Attainment | Male Income | Female Income |
| Less than High School | - | - |
| High School Diploma | - | - |
| College or Associate's Degree | - | - |
| Bachelor's Degree | - | - |
| Graduate Degree | - | - |
| Total | - | - |
Family Income in Gorman
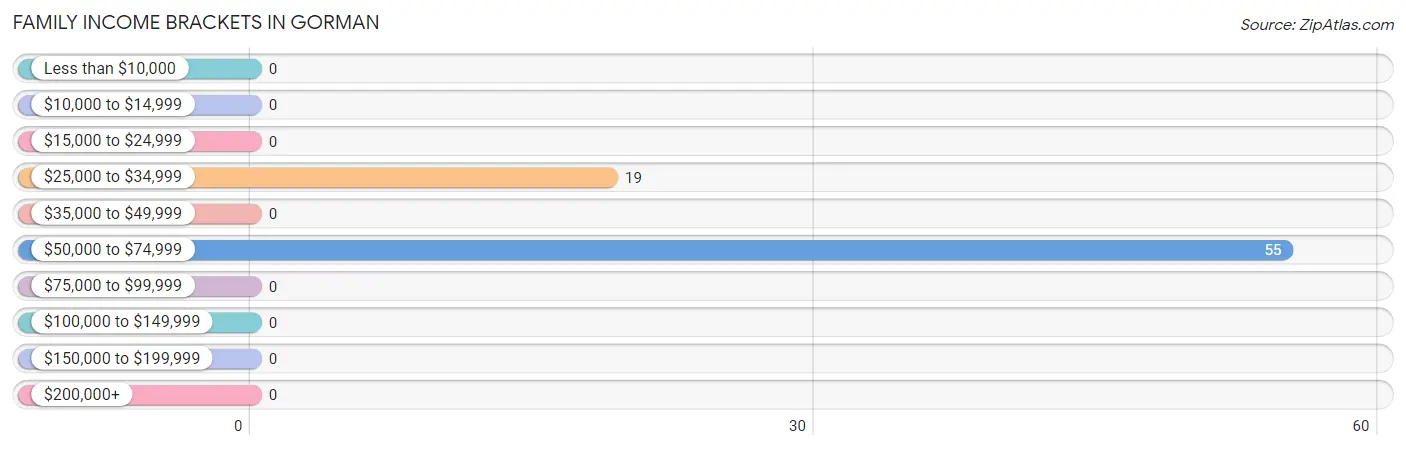
Family Income Brackets in Gorman
According to the Gorman family income data, there are 55 families falling into the $50,000 to $74,999 income range, which is the most common income bracket and makes up 74.3% of all families.
| Income Bracket | # Families | % Families |
| Less than $10,000 | 0 | 0.0% |
| $10,000 to $14,999 | 0 | 0.0% |
| $15,000 to $24,999 | 0 | 0.0% |
| $25,000 to $34,999 | 19 | 25.7% |
| $35,000 to $49,999 | 0 | 0.0% |
| $50,000 to $74,999 | 55 | 74.3% |
| $75,000 to $99,999 | 0 | 0.0% |
| $100,000 to $149,999 | 0 | 0.0% |
| $150,000 to $199,999 | 0 | 0.0% |
| $200,000+ | 0 | 0.0% |
Family Income by Famaliy Size in Gorman
| Income Bracket | # Families | Median Income |
| 2-Person Families | 55 (74.3%) | $0 |
| 3-Person Families | 0 (0.0%) | $0 |
| 4-Person Families | 0 (0.0%) | $0 |
| 5-Person Families | 0 (0.0%) | $0 |
| 6-Person Families | 19 (25.7%) | $0 |
| 7+ Person Families | 0 (0.0%) | $0 |
| Total | 74 (100.0%) | $0 |
Family Income by Number of Earners in Gorman
| Number of Earners | # Families | Median Income |
| No Earners | 19 (25.7%) | $0 |
| 1 Earner | 0 (0.0%) | $0 |
| 2 Earners | 55 (74.3%) | $0 |
| 3+ Earners | 0 (0.0%) | $0 |
| Total | 74 (100.0%) | $0 |
Household Income in Gorman
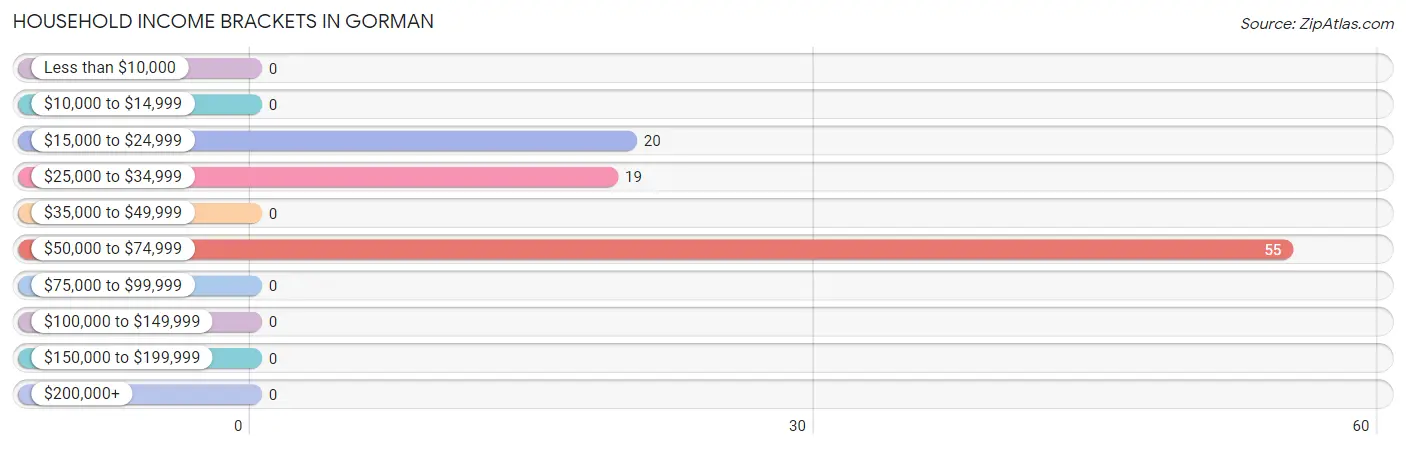
Household Income Brackets in Gorman
With 55 households falling in the category, the $50,000 to $74,999 income range is the most frequent in Gorman, accounting for 58.5% of all households.
| Income Bracket | # Households | % Households |
| Less than $10,000 | 0 | 0.0% |
| $10,000 to $14,999 | 0 | 0.0% |
| $15,000 to $24,999 | 20 | 21.3% |
| $25,000 to $34,999 | 19 | 20.2% |
| $35,000 to $49,999 | 0 | 0.0% |
| $50,000 to $74,999 | 55 | 58.5% |
| $75,000 to $99,999 | 0 | 0.0% |
| $100,000 to $149,999 | 0 | 0.0% |
| $150,000 to $199,999 | 0 | 0.0% |
| $200,000+ | 0 | 0.0% |
Household Income by Householder Age in Gorman
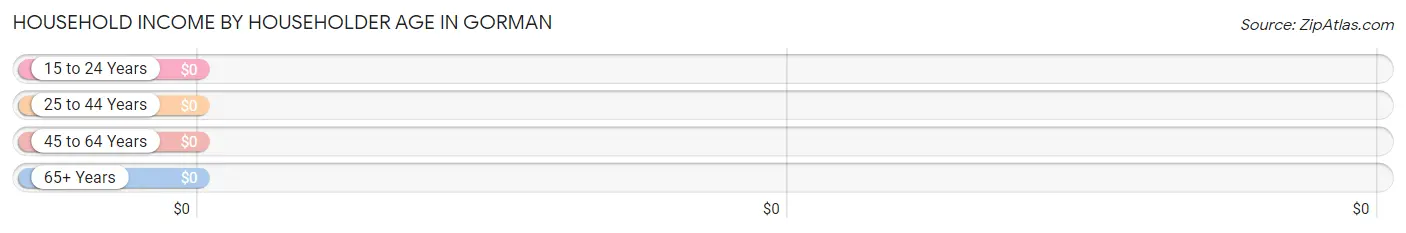
| Income Bracket | # Households | Median Income |
| 15 to 24 Years | 0 (0.0%) | $0 |
| 25 to 44 Years | 0 (0.0%) | $0 |
| 45 to 64 Years | 74 (78.7%) | $0 |
| 65+ Years | 20 (21.3%) | $0 |
| Total | 94 (100.0%) | $67,864 |
Poverty in Gorman
Income Below Poverty by Sex and Age in Gorman
With 51.7% poverty level for males and 66.0% for females among the residents of Gorman, 18 to 24 year old males and 12 to 14 year old females are the most vulnerable to poverty, with 40 males (100.0%) and 22 females (100.0%) in their respective age groups living below the poverty level.
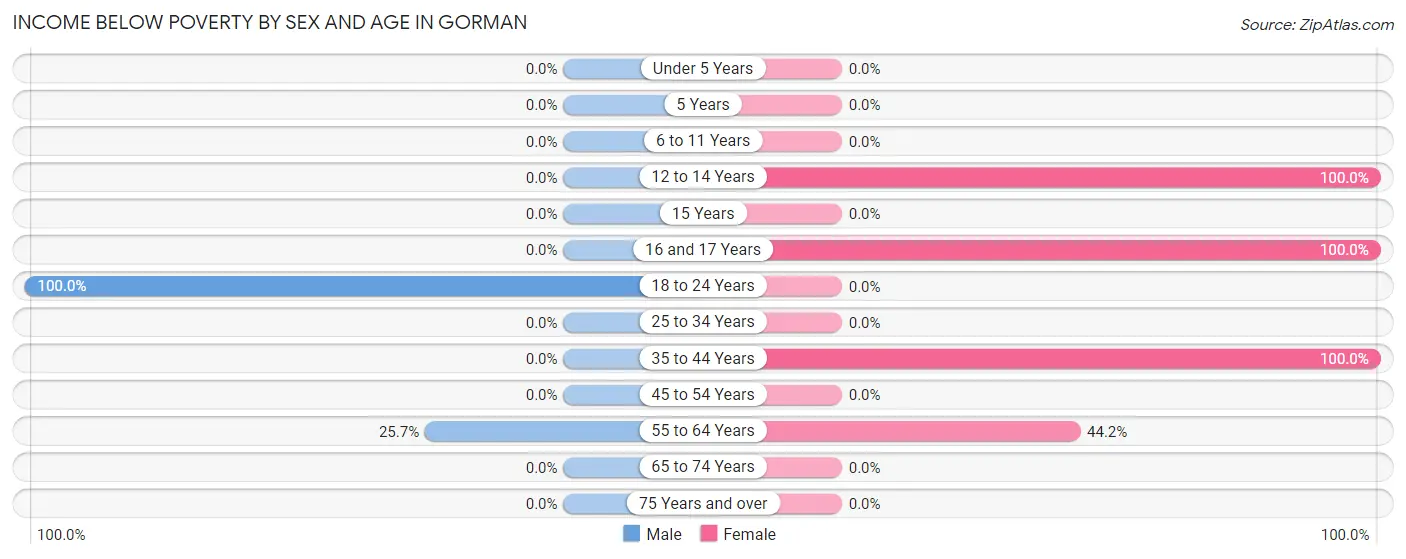
| Age Bracket | Male | Female |
| Under 5 Years | 0 (0.0%) | 0 (0.0%) |
| 5 Years | 0 (0.0%) | 0 (0.0%) |
| 6 to 11 Years | 0 (0.0%) | 0 (0.0%) |
| 12 to 14 Years | 0 (0.0%) | 22 (100.0%) |
| 15 Years | 0 (0.0%) | 0 (0.0%) |
| 16 and 17 Years | 0 (0.0%) | 28 (100.0%) |
| 18 to 24 Years | 40 (100.0%) | 0 (0.0%) |
| 25 to 34 Years | 0 (0.0%) | 0 (0.0%) |
| 35 to 44 Years | 0 (0.0%) | 22 (100.0%) |
| 45 to 54 Years | 0 (0.0%) | 0 (0.0%) |
| 55 to 64 Years | 19 (25.7%) | 23 (44.2%) |
| 65 to 74 Years | 0 (0.0%) | 0 (0.0%) |
| 75 Years and over | 0 (0.0%) | 0 (0.0%) |
| Total | 59 (51.7%) | 95 (66.0%) |
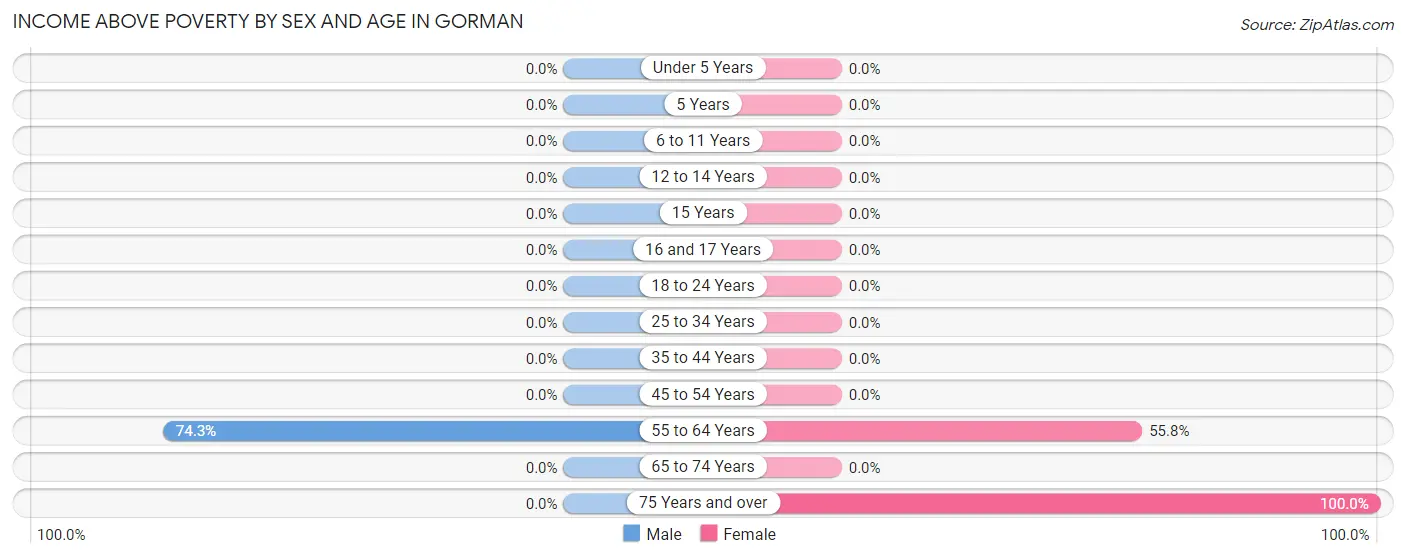
Income Above Poverty by Sex and Age in Gorman
According to the poverty statistics in Gorman, males aged 55 to 64 years and females aged 75 years and over are the age groups that are most secure financially, with 74.3% of males and 100.0% of females in these age groups living above the poverty line.
| Age Bracket | Male | Female |
| Under 5 Years | 0 (0.0%) | 0 (0.0%) |
| 5 Years | 0 (0.0%) | 0 (0.0%) |
| 6 to 11 Years | 0 (0.0%) | 0 (0.0%) |
| 12 to 14 Years | 0 (0.0%) | 0 (0.0%) |
| 15 Years | 0 (0.0%) | 0 (0.0%) |
| 16 and 17 Years | 0 (0.0%) | 0 (0.0%) |
| 18 to 24 Years | 0 (0.0%) | 0 (0.0%) |
| 25 to 34 Years | 0 (0.0%) | 0 (0.0%) |
| 35 to 44 Years | 0 (0.0%) | 0 (0.0%) |
| 45 to 54 Years | 0 (0.0%) | 0 (0.0%) |
| 55 to 64 Years | 55 (74.3%) | 29 (55.8%) |
| 65 to 74 Years | 0 (0.0%) | 0 (0.0%) |
| 75 Years and over | 0 (0.0%) | 20 (100.0%) |
| Total | 55 (48.2%) | 49 (34.0%) |
Income Below Poverty Among Married-Couple Families in Gorman
The poverty statistics for married-couple families in Gorman show that 25.7% or 19 of the total 74 families live below the poverty line. Families with 1 or 2 children have the highest poverty rate of 100.0%, comprising of 19 families. On the other hand, families with no children have the lowest poverty rate of 0.0%, which includes 0 families.
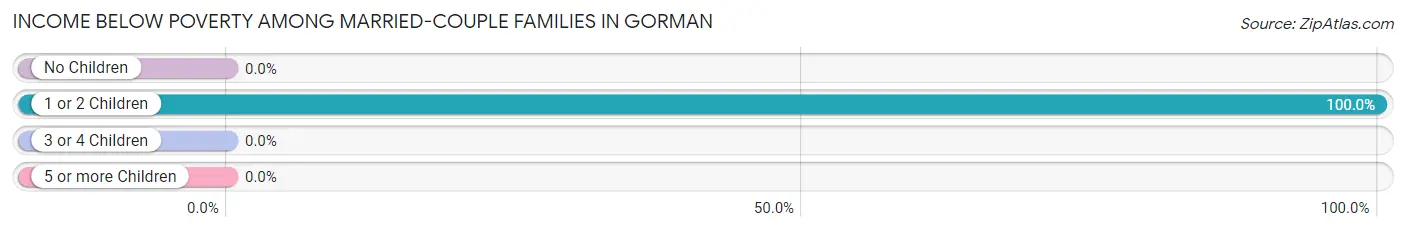
| Children | Above Poverty | Below Poverty |
| No Children | 55 (100.0%) | 0 (0.0%) |
| 1 or 2 Children | 0 (0.0%) | 19 (100.0%) |
| 3 or 4 Children | 0 (0.0%) | 0 (0.0%) |
| 5 or more Children | 0 (0.0%) | 0 (0.0%) |
| Total | 55 (74.3%) | 19 (25.7%) |
Income Below Poverty Among Single-Parent Households in Gorman
| Children | Single Father | Single Mother |
| No Children | 0 (0.0%) | 0 (0.0%) |
| 1 or 2 Children | 0 (0.0%) | 0 (0.0%) |
| 3 or 4 Children | 0 (0.0%) | 0 (0.0%) |
| 5 or more Children | 0 (0.0%) | 0 (0.0%) |
| Total | 0 (0.0%) | 0 (0.0%) |
Income Below Poverty Among Married-Couple vs Single-Parent Households in Gorman
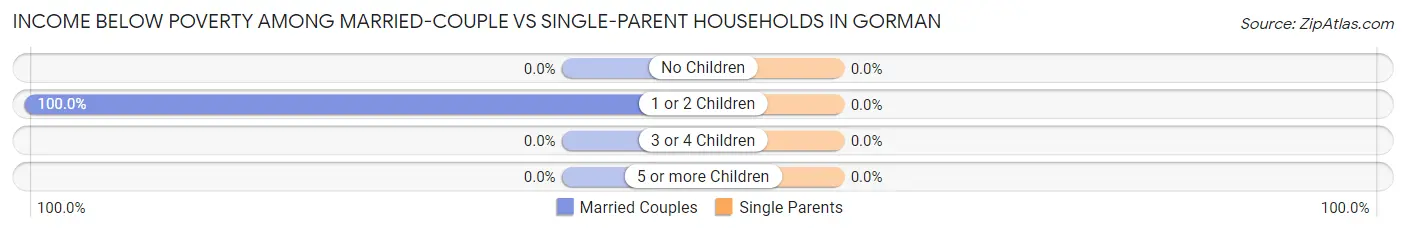
| Children | Married-Couple Families | Single-Parent Households |
| No Children | 0 (0.0%) | 0 (0.0%) |
| 1 or 2 Children | 19 (100.0%) | 0 (0.0%) |
| 3 or 4 Children | 0 (0.0%) | 0 (0.0%) |
| 5 or more Children | 0 (0.0%) | 0 (0.0%) |
| Total | 19 (25.7%) | 0 (0.0%) |
Race in Gorman
The most populous races in Gorman are , and White / Caucasian (258 | 100.0%).
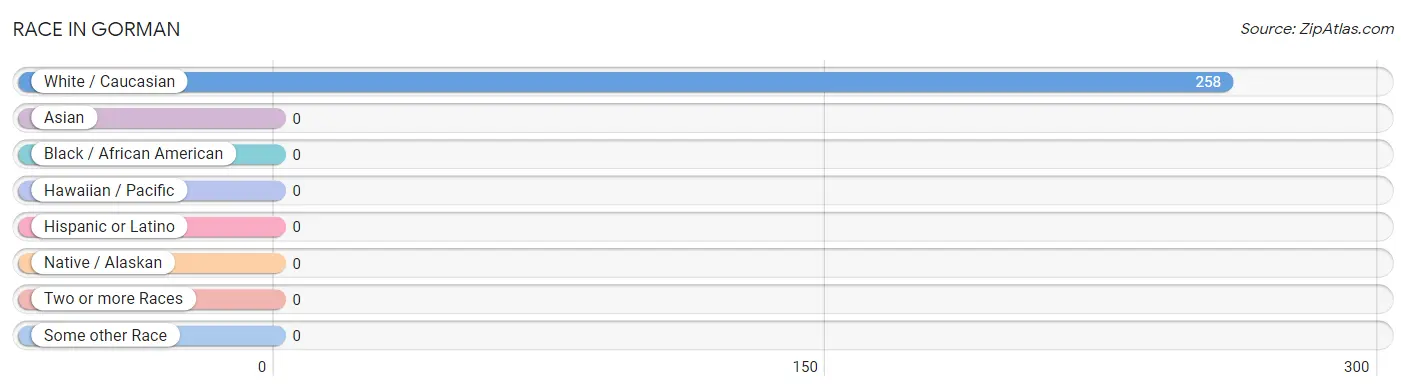
| Race | # Population | % Population |
| Asian | 0 | 0.0% |
| Black / African American | 0 | 0.0% |
| Hawaiian / Pacific | 0 | 0.0% |
| Hispanic or Latino | 0 | 0.0% |
| Native / Alaskan | 0 | 0.0% |
| White / Caucasian | 258 | 100.0% |
| Two or more Races | 0 | 0.0% |
| Some other Race | 0 | 0.0% |
| Total | 258 | 100.0% |
Ancestry in Gorman
The most populous ancestries reported in Gorman are Dutch (55 | 21.3%), Irish (29 | 11.2%), Austrian (20 | 7.7%), and German (20 | 7.7%), together accounting for 48.1% of all Gorman residents.
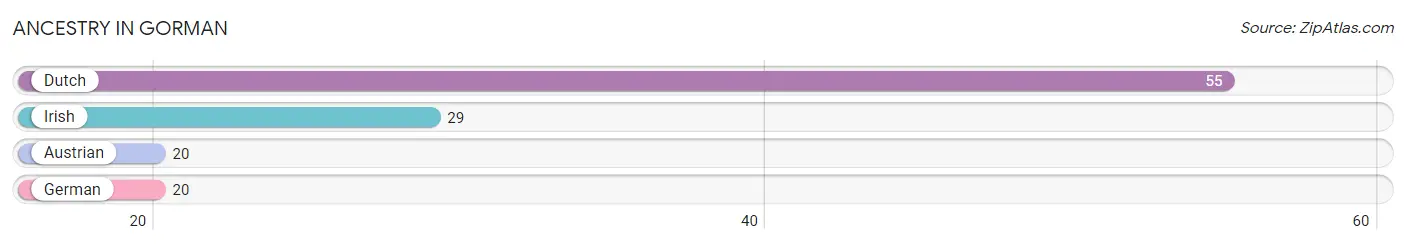
| Ancestry | # Population | % Population |
| Austrian | 20 | 7.7% |
| Dutch | 55 | 21.3% |
| German | 20 | 7.7% |
| Irish | 29 | 11.2% | View All 4 Rows |
Immigrants in Gorman

| Immigration Origin | # Population | % Population | View All 0 Rows |
Sex and Age in Gorman
Sex and Age in Gorman
The most populous age groups in Gorman are 55 to 59 Years (55 | 48.2%) for men and 55 to 59 Years (29 | 20.1%) for women.
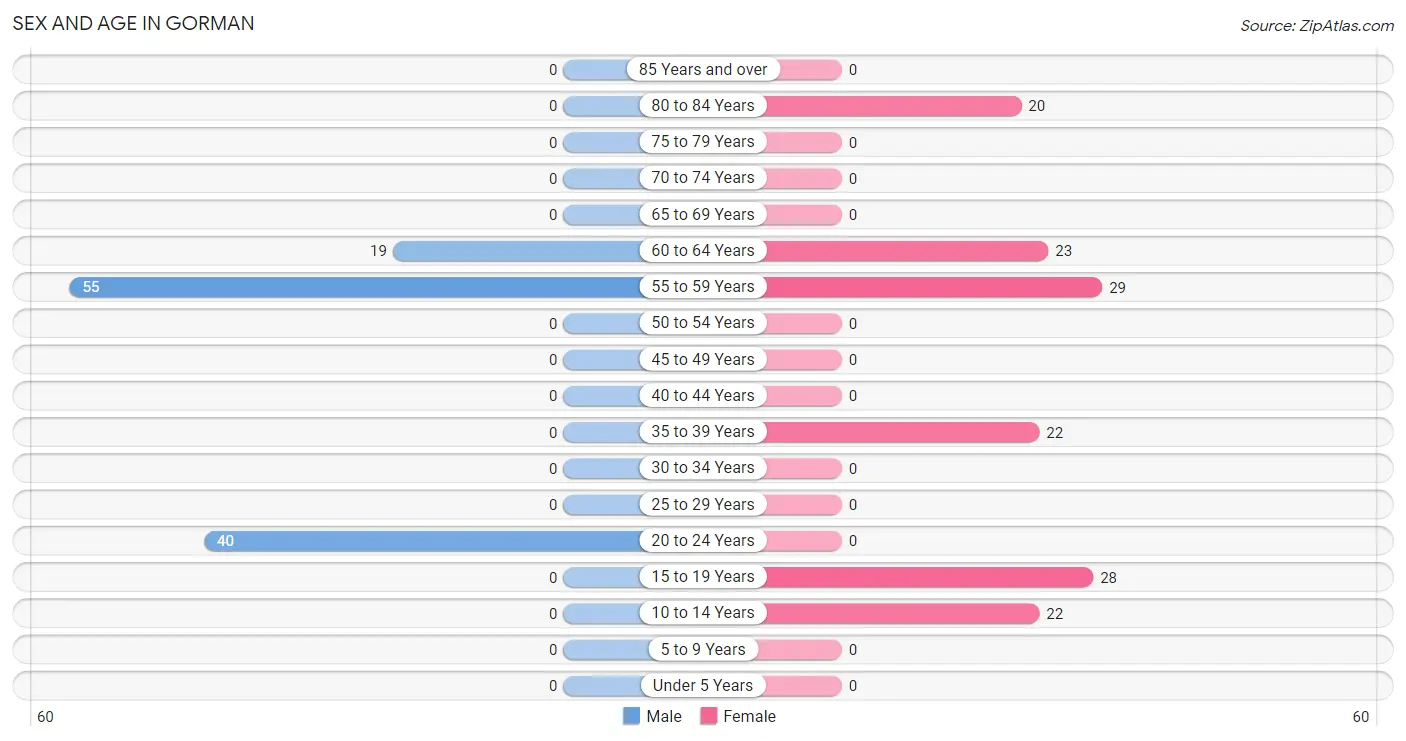
| Age Bracket | Male | Female |
| Under 5 Years | 0 (0.0%) | 0 (0.0%) |
| 5 to 9 Years | 0 (0.0%) | 0 (0.0%) |
| 10 to 14 Years | 0 (0.0%) | 22 (15.3%) |
| 15 to 19 Years | 0 (0.0%) | 28 (19.4%) |
| 20 to 24 Years | 40 (35.1%) | 0 (0.0%) |
| 25 to 29 Years | 0 (0.0%) | 0 (0.0%) |
| 30 to 34 Years | 0 (0.0%) | 0 (0.0%) |
| 35 to 39 Years | 0 (0.0%) | 22 (15.3%) |
| 40 to 44 Years | 0 (0.0%) | 0 (0.0%) |
| 45 to 49 Years | 0 (0.0%) | 0 (0.0%) |
| 50 to 54 Years | 0 (0.0%) | 0 (0.0%) |
| 55 to 59 Years | 55 (48.2%) | 29 (20.1%) |
| 60 to 64 Years | 19 (16.7%) | 23 (16.0%) |
| 65 to 69 Years | 0 (0.0%) | 0 (0.0%) |
| 70 to 74 Years | 0 (0.0%) | 0 (0.0%) |
| 75 to 79 Years | 0 (0.0%) | 0 (0.0%) |
| 80 to 84 Years | 0 (0.0%) | 20 (13.9%) |
| 85 Years and over | 0 (0.0%) | 0 (0.0%) |
| Total | 114 (100.0%) | 144 (100.0%) |
Families and Households in Gorman
Median Family Size in Gorman
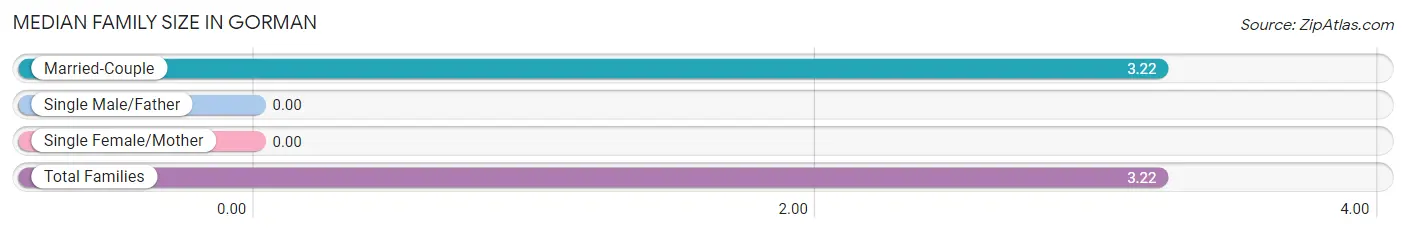
| Family Type | # Families | Family Size |
| Married-Couple | 74 (100.0%) | 3.22 |
| Single Male/Father | 0 (0.0%) | - |
| Single Female/Mother | 0 (0.0%) | - |
| Total Families | 74 (100.0%) | 3.22 |
Median Household Size in Gorman
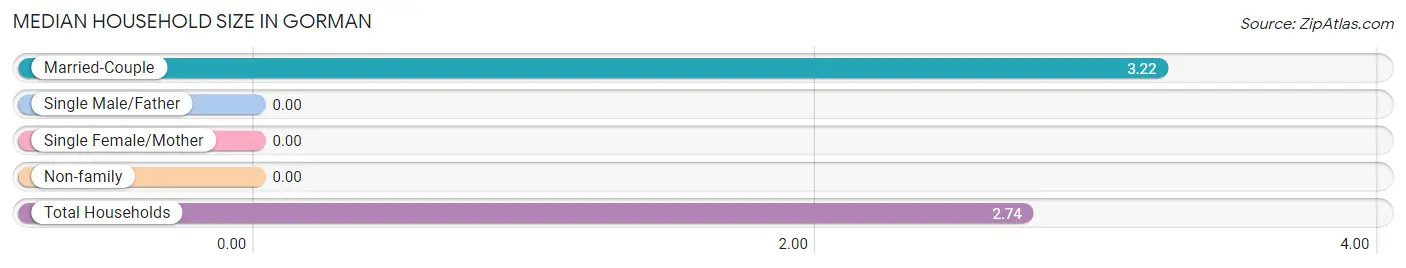
| Household Type | # Households | Household Size |
| Married-Couple | 74 (78.7%) | 3.22 |
| Single Male/Father | 0 (0.0%) | - |
| Single Female/Mother | 0 (0.0%) | - |
| Non-family | 20 (21.3%) | - |
| Total Households | 94 (100.0%) | 2.74 |
Household Size by Marriage Status in Gorman
Out of a total of 94 households in Gorman, 74 (78.7%) are family households, while 20 (21.3%) are nonfamily households. The most numerous type of family households are 2-person households, comprising 55, and the most common type of nonfamily households are 1-person households, comprising 20.
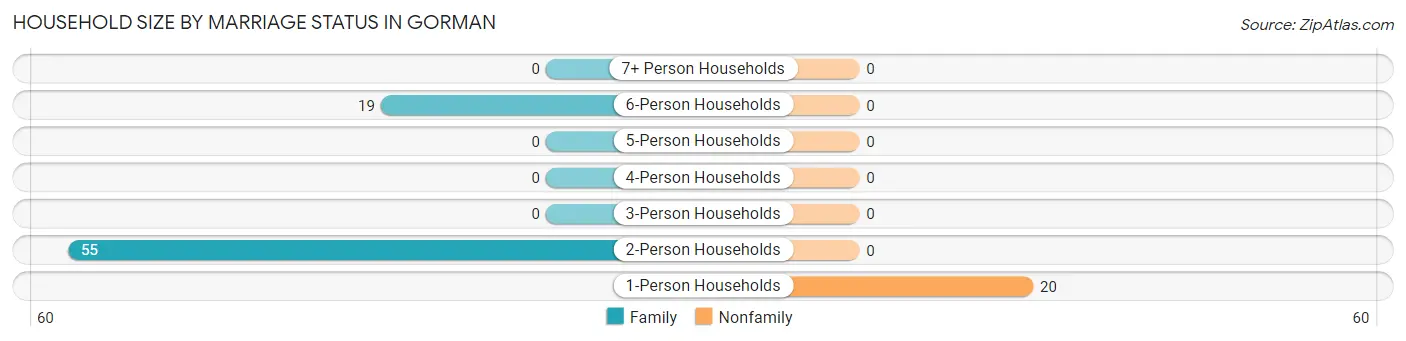
| Household Size | Family Households | Nonfamily Households |
| 1-Person Households | - | 20 (21.3%) |
| 2-Person Households | 55 (58.5%) | 0 (0.0%) |
| 3-Person Households | 0 (0.0%) | 0 (0.0%) |
| 4-Person Households | 0 (0.0%) | 0 (0.0%) |
| 5-Person Households | 0 (0.0%) | 0 (0.0%) |
| 6-Person Households | 19 (20.2%) | 0 (0.0%) |
| 7+ Person Households | 0 (0.0%) | 0 (0.0%) |
| Total | 74 (78.7%) | 20 (21.3%) |
Female Fertility in Gorman
Fertility by Age in Gorman
| Age Bracket | Women with Births | Births / 1,000 Women |
| 15 to 19 years | 0 (0.0%) | 0.0 |
| 20 to 34 years | 0 (0.0%) | 0.0 |
| 35 to 50 years | 0 (0.0%) | 0.0 |
| Total | 0 (0.0%) | 0.0 |
Fertility by Age by Marriage Status in Gorman
| Age Bracket | Married | Unmarried |
| 15 to 19 years | 0 (0.0%) | 0 (0.0%) |
| 20 to 34 years | 0 (0.0%) | 0 (0.0%) |
| 35 to 50 years | 0 (0.0%) | 0 (0.0%) |
| Total | 0 (0.0%) | 0 (0.0%) |
Fertility by Education in Gorman
| Educational Attainment | Women with Births | Births / 1,000 Women |
| Less than High School | 0 (0.0%) | 0.0 |
| High School Diploma | 0 (0.0%) | 0.0 |
| College or Associate's Degree | 0 (0.0%) | 0.0 |
| Bachelor's Degree | 0 (0.0%) | 0.0 |
| Graduate Degree | 0 (0.0%) | 0.0 |
| Total | 0 (0.0%) | 0.0 |
Fertility by Education by Marriage Status in Gorman
| Educational Attainment | Married | Unmarried |
| Less than High School | 0 (0.0%) | 0 (0.0%) |
| High School Diploma | 0 (0.0%) | 0 (0.0%) |
| College or Associate's Degree | 0 (0.0%) | 0 (0.0%) |
| Bachelor's Degree | 0 (0.0%) | 0 (0.0%) |
| Graduate Degree | 0 (0.0%) | 0 (0.0%) |
| Total | 0 (0.0%) | 0 (0.0%) |
Employment Characteristics in Gorman
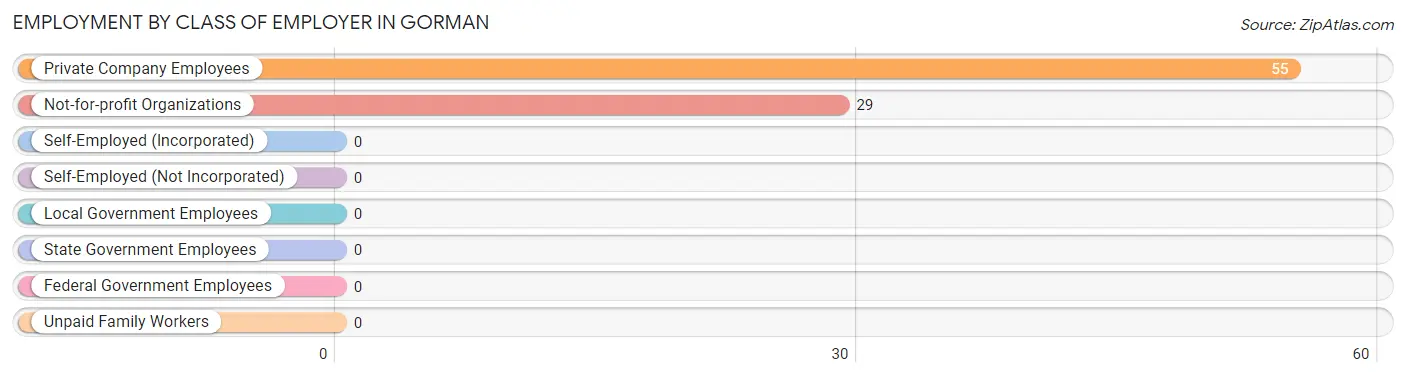
Employment by Class of Employer in Gorman
Among the 84 employed individuals in Gorman, private company employees (55 | 65.5%), and not-for-profit organizations (29 | 34.5%) make up the most common classes of employment.
| Employer Class | # Employees | % Employees |
| Private Company Employees | 55 | 65.5% |
| Self-Employed (Incorporated) | 0 | 0.0% |
| Self-Employed (Not Incorporated) | 0 | 0.0% |
| Not-for-profit Organizations | 29 | 34.5% |
| Local Government Employees | 0 | 0.0% |
| State Government Employees | 0 | 0.0% |
| Federal Government Employees | 0 | 0.0% |
| Unpaid Family Workers | 0 | 0.0% |
| Total | 84 | 100.0% |
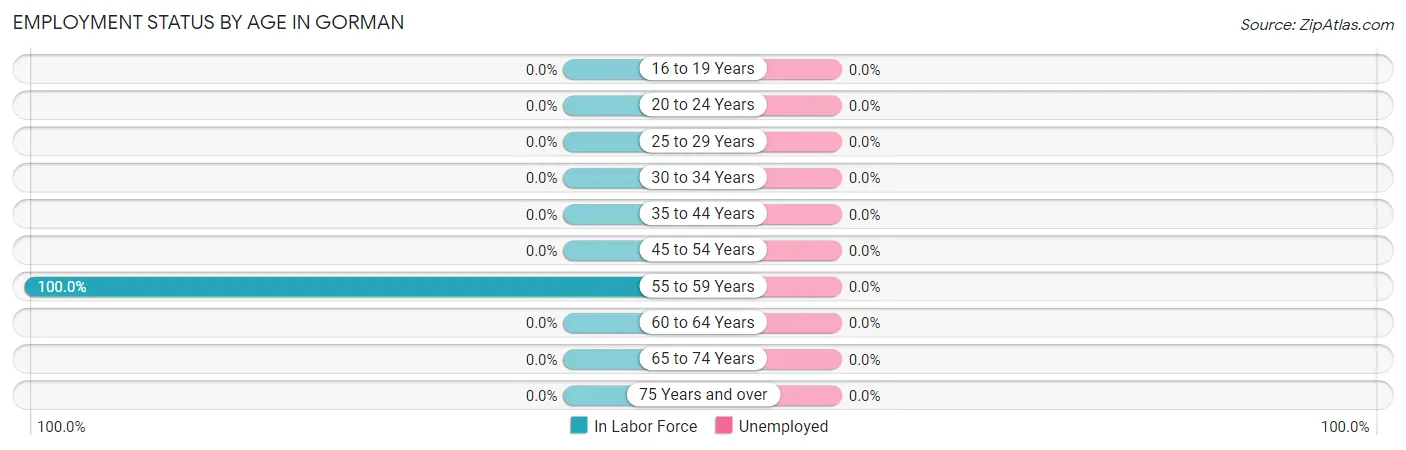
Employment Status by Age in Gorman
| Age Bracket | In Labor Force | Unemployed |
| 16 to 19 Years | 0 (0.0%) | 0 (0.0%) |
| 20 to 24 Years | 0 (0.0%) | 0 (0.0%) |
| 25 to 29 Years | 0 (0.0%) | 0 (0.0%) |
| 30 to 34 Years | 0 (0.0%) | 0 (0.0%) |
| 35 to 44 Years | 0 (0.0%) | 0 (0.0%) |
| 45 to 54 Years | 0 (0.0%) | 0 (0.0%) |
| 55 to 59 Years | 84 (100.0%) | 0 (0.0%) |
| 60 to 64 Years | 0 (0.0%) | 0 (0.0%) |
| 65 to 74 Years | 0 (0.0%) | 0 (0.0%) |
| 75 Years and over | 0 (0.0%) | 0 (0.0%) |
| Total | 84 (35.6%) | 0 (0.0%) |
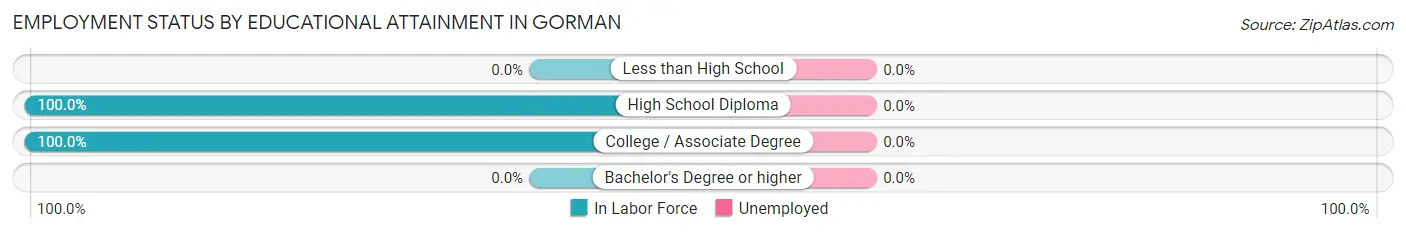
Employment Status by Educational Attainment in Gorman
| Educational Attainment | In Labor Force | Unemployed |
| Less than High School | 0 (0.0%) | 0 (0.0%) |
| High School Diploma | 55 (100.0%) | 0 (0.0%) |
| College / Associate Degree | 29 (100.0%) | 0 (0.0%) |
| Bachelor's Degree or higher | 0 (0.0%) | 0 (0.0%) |
| Total | 84 (56.8%) | 0 (0.0%) |
Employment Occupations by Sex in Gorman
Management, Business, Science and Arts Occupations
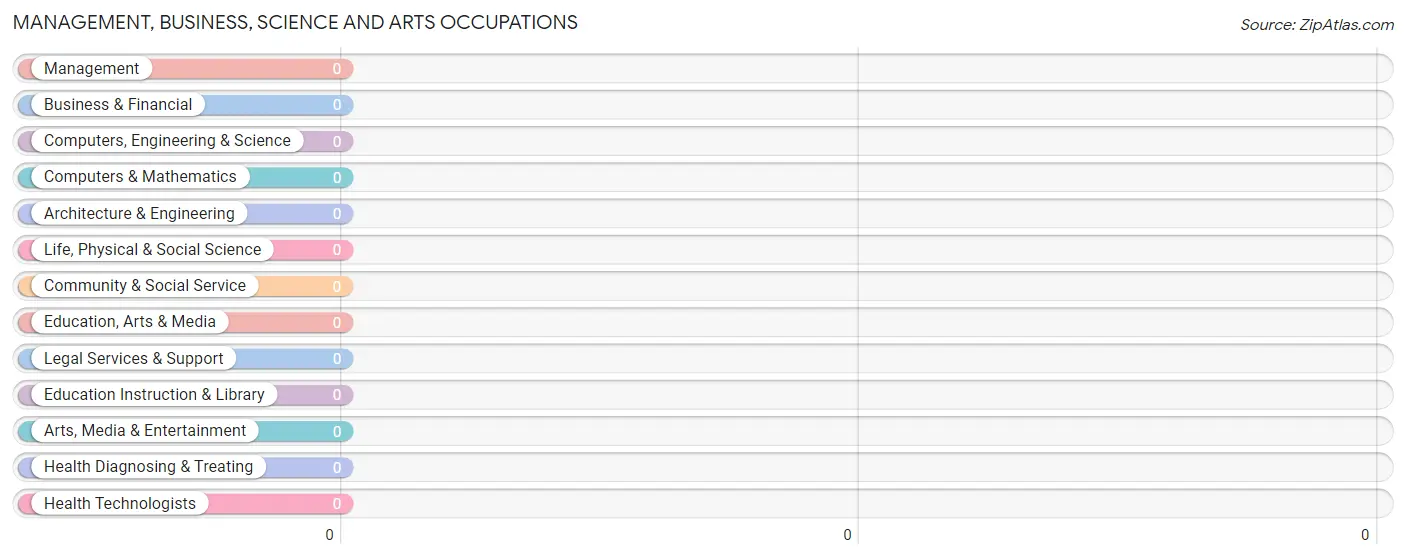
Management, Business, Science and Arts Occupations by Sex
| Occupation | Male | Female |
| Management | 0 (0.0%) | 0 (0.0%) |
| Business & Financial | 0 (0.0%) | 0 (0.0%) |
| Computers, Engineering & Science | 0 (0.0%) | 0 (0.0%) |
| Computers & Mathematics | 0 (0.0%) | 0 (0.0%) |
| Architecture & Engineering | 0 (0.0%) | 0 (0.0%) |
| Life, Physical & Social Science | 0 (0.0%) | 0 (0.0%) |
| Community & Social Service | 0 (0.0%) | 0 (0.0%) |
| Education, Arts & Media | 0 (0.0%) | 0 (0.0%) |
| Legal Services & Support | 0 (0.0%) | 0 (0.0%) |
| Education Instruction & Library | 0 (0.0%) | 0 (0.0%) |
| Arts, Media & Entertainment | 0 (0.0%) | 0 (0.0%) |
| Health Diagnosing & Treating | 0 (0.0%) | 0 (0.0%) |
| Health Technologists | 0 (0.0%) | 0 (0.0%) |
| Total (Category) | 0 (0.0%) | 0 (0.0%) |
| Total (Overall) | 55 (65.5%) | 29 (34.5%) |
Services Occupations
The most common Services occupations in Gorman are , and Healthcare Support (29 | 34.5%).
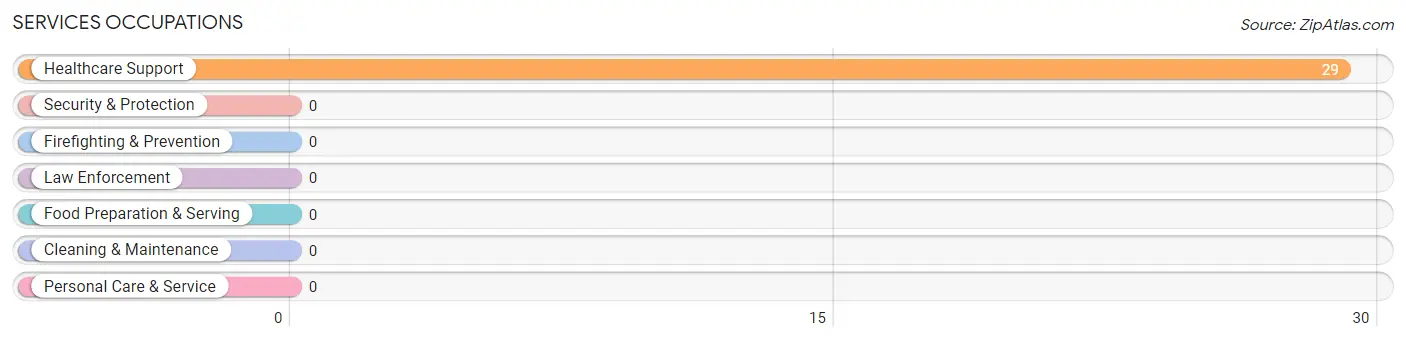
Services Occupations by Sex
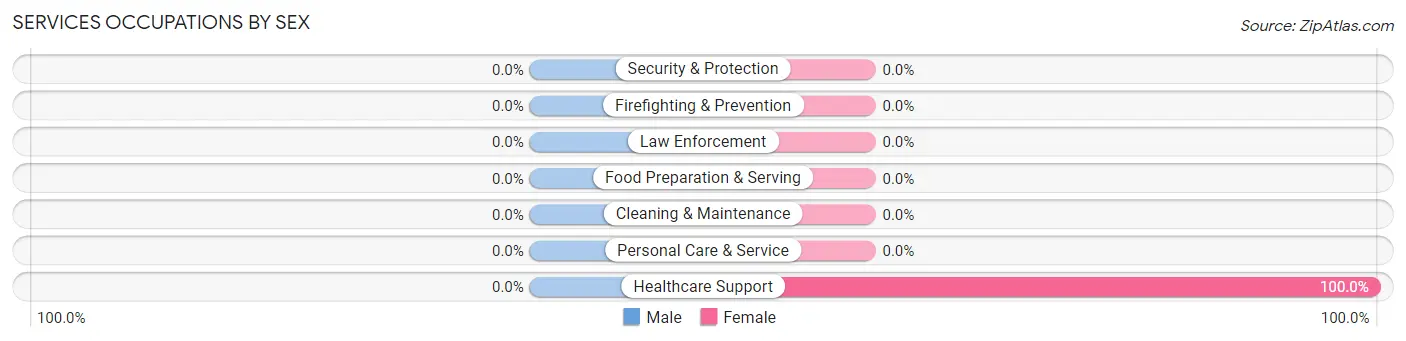
| Occupation | Male | Female |
| Healthcare Support | 0 (0.0%) | 29 (100.0%) |
| Security & Protection | 0 (0.0%) | 0 (0.0%) |
| Firefighting & Prevention | 0 (0.0%) | 0 (0.0%) |
| Law Enforcement | 0 (0.0%) | 0 (0.0%) |
| Food Preparation & Serving | 0 (0.0%) | 0 (0.0%) |
| Cleaning & Maintenance | 0 (0.0%) | 0 (0.0%) |
| Personal Care & Service | 0 (0.0%) | 0 (0.0%) |
| Total (Category) | 0 (0.0%) | 29 (100.0%) |
| Total (Overall) | 55 (65.5%) | 29 (34.5%) |
Sales and Office Occupations
Sales and Office Occupations by Sex
| Occupation | Male | Female |
| Sales & Related | 0 (0.0%) | 0 (0.0%) |
| Office & Administration | 0 (0.0%) | 0 (0.0%) |
| Total (Category) | 0 (0.0%) | 0 (0.0%) |
| Total (Overall) | 55 (65.5%) | 29 (34.5%) |
Natural Resources, Construction and Maintenance Occupations
Natural Resources, Construction and Maintenance Occupations by Sex
| Occupation | Male | Female |
| Farming, Fishing & Forestry | 0 (0.0%) | 0 (0.0%) |
| Construction & Extraction | 0 (0.0%) | 0 (0.0%) |
| Installation, Maintenance & Repair | 0 (0.0%) | 0 (0.0%) |
| Total (Category) | 0 (0.0%) | 0 (0.0%) |
| Total (Overall) | 55 (65.5%) | 29 (34.5%) |
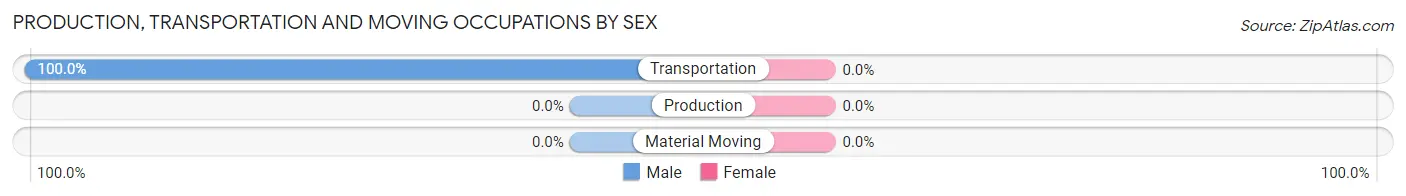
Production, Transportation and Moving Occupations
The most common Production, Transportation and Moving occupations in Gorman are , and Transportation (55 | 65.5%).
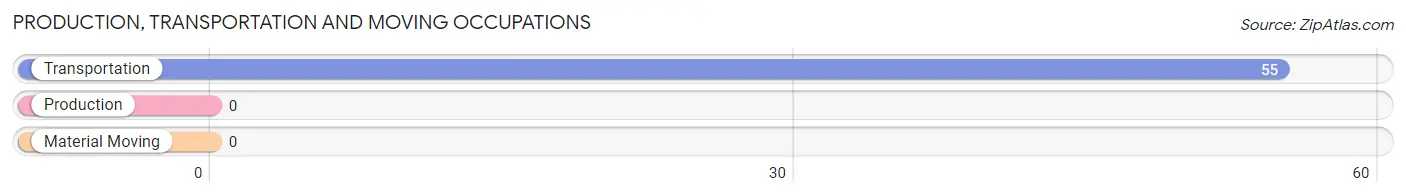
Production, Transportation and Moving Occupations by Sex
| Occupation | Male | Female |
| Production | 0 (0.0%) | 0 (0.0%) |
| Transportation | 55 (100.0%) | 0 (0.0%) |
| Material Moving | 0 (0.0%) | 0 (0.0%) |
| Total (Category) | 55 (100.0%) | 0 (0.0%) |
| Total (Overall) | 55 (65.5%) | 29 (34.5%) |
Employment Industries by Sex in Gorman
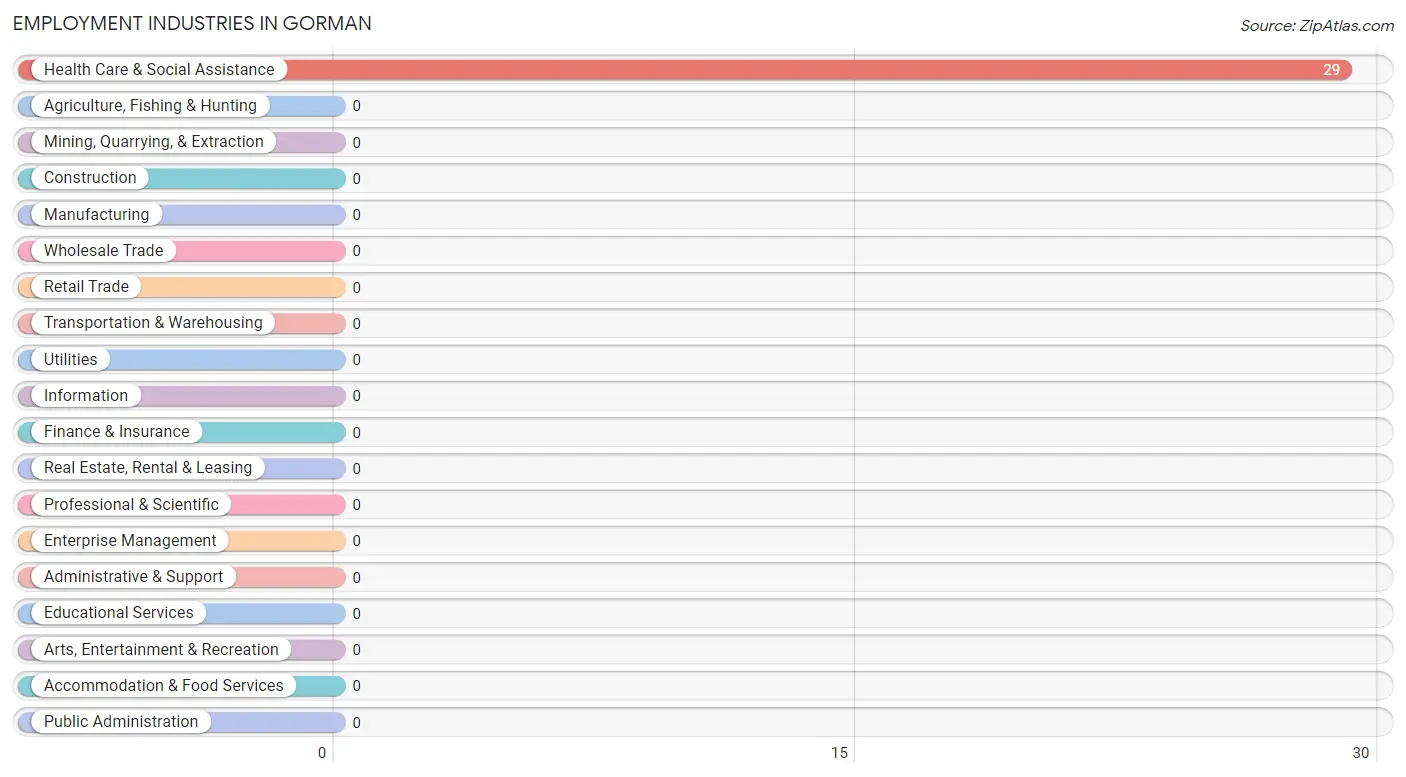
Employment Industries in Gorman
The major employment industries in Gorman include , and Health Care & Social Assistance (29 | 34.5%).
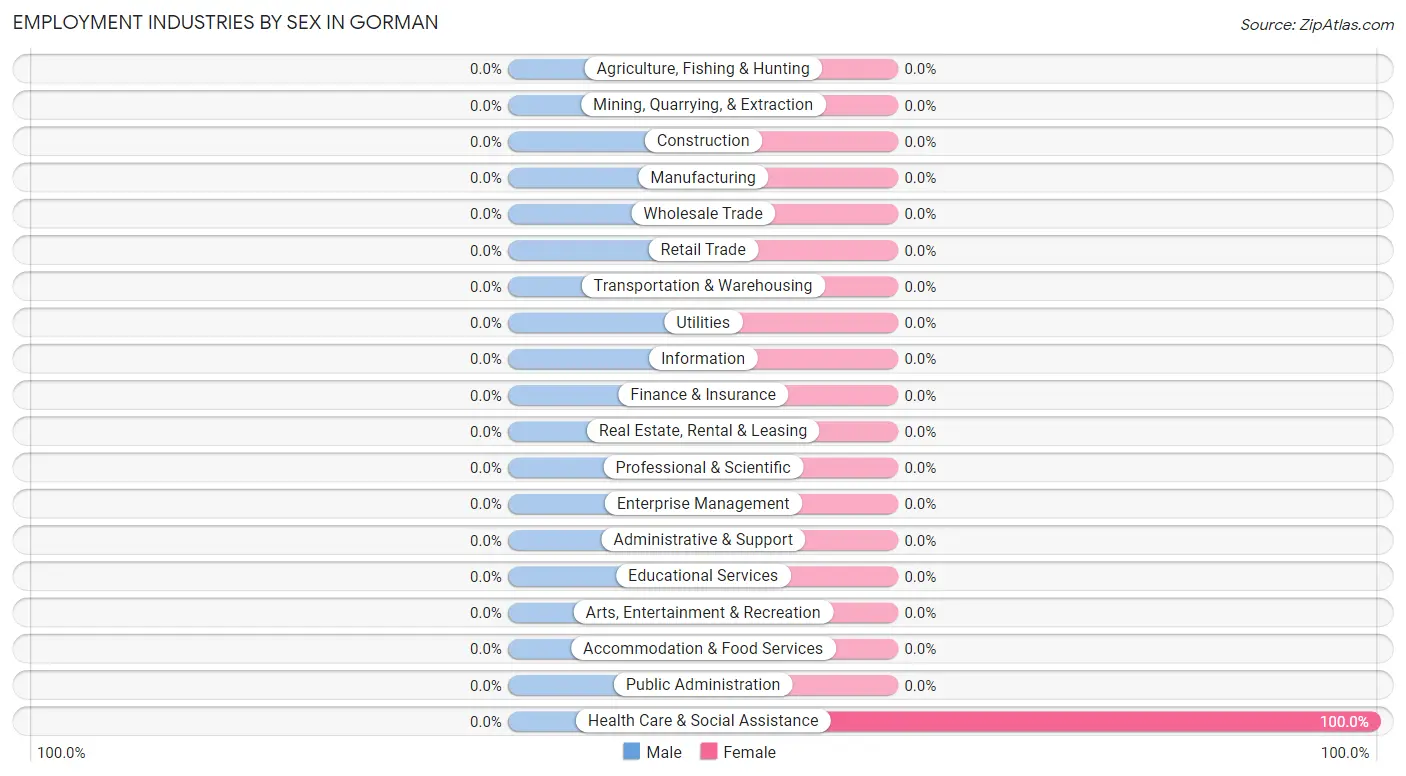
Employment Industries by Sex in Gorman
| Industry | Male | Female |
| Agriculture, Fishing & Hunting | 0 (0.0%) | 0 (0.0%) |
| Mining, Quarrying, & Extraction | 0 (0.0%) | 0 (0.0%) |
| Construction | 0 (0.0%) | 0 (0.0%) |
| Manufacturing | 0 (0.0%) | 0 (0.0%) |
| Wholesale Trade | 0 (0.0%) | 0 (0.0%) |
| Retail Trade | 0 (0.0%) | 0 (0.0%) |
| Transportation & Warehousing | 0 (0.0%) | 0 (0.0%) |
| Utilities | 0 (0.0%) | 0 (0.0%) |
| Information | 0 (0.0%) | 0 (0.0%) |
| Finance & Insurance | 0 (0.0%) | 0 (0.0%) |
| Real Estate, Rental & Leasing | 0 (0.0%) | 0 (0.0%) |
| Professional & Scientific | 0 (0.0%) | 0 (0.0%) |
| Enterprise Management | 0 (0.0%) | 0 (0.0%) |
| Administrative & Support | 0 (0.0%) | 0 (0.0%) |
| Educational Services | 0 (0.0%) | 0 (0.0%) |
| Health Care & Social Assistance | 0 (0.0%) | 29 (100.0%) |
| Arts, Entertainment & Recreation | 0 (0.0%) | 0 (0.0%) |
| Accommodation & Food Services | 0 (0.0%) | 0 (0.0%) |
| Public Administration | 0 (0.0%) | 0 (0.0%) |
| Total | 55 (65.5%) | 29 (34.5%) |
Education in Gorman
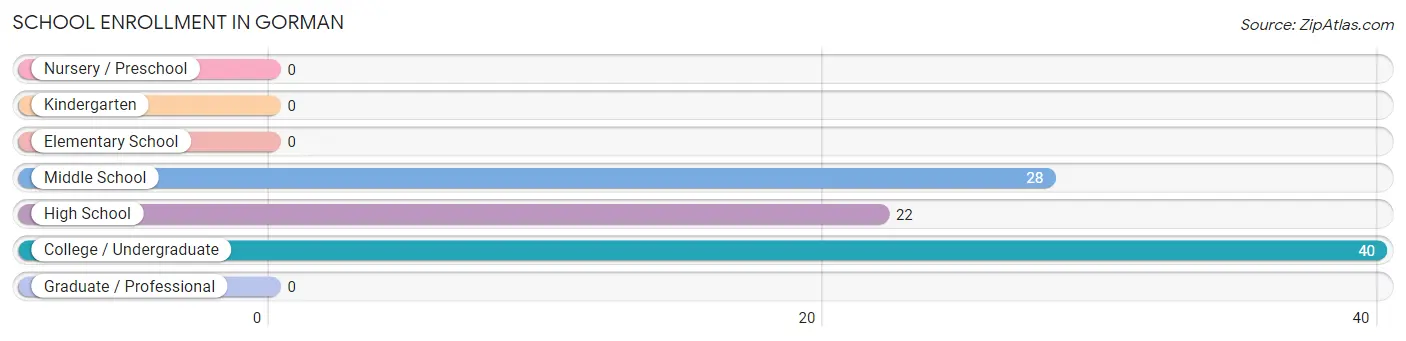
School Enrollment in Gorman
The most common levels of schooling among the 90 students in Gorman are college / undergraduate (40 | 44.4%), middle school (28 | 31.1%), and high school (22 | 24.4%).
| School Level | # Students | % Students |
| Nursery / Preschool | 0 | 0.0% |
| Kindergarten | 0 | 0.0% |
| Elementary School | 0 | 0.0% |
| Middle School | 28 | 31.1% |
| High School | 22 | 24.4% |
| College / Undergraduate | 40 | 44.4% |
| Graduate / Professional | 0 | 0.0% |
| Total | 90 | 100.0% |
School Enrollment by Age by Funding Source in Gorman
Out of a total of 90 students who are enrolled in schools in Gorman, 40 (44.4%) attend a private institution, while the remaining 50 (55.6%) are enrolled in public schools. The age group of 20 to 24 year olds has the highest likelihood of being enrolled in private schools, with 40 (100.0% in the age bracket) enrolled. Conversely, the age group of 10 to 14 year olds has the lowest likelihood of being enrolled in a private school, with 22 (100.0% in the age bracket) attending a public institution.
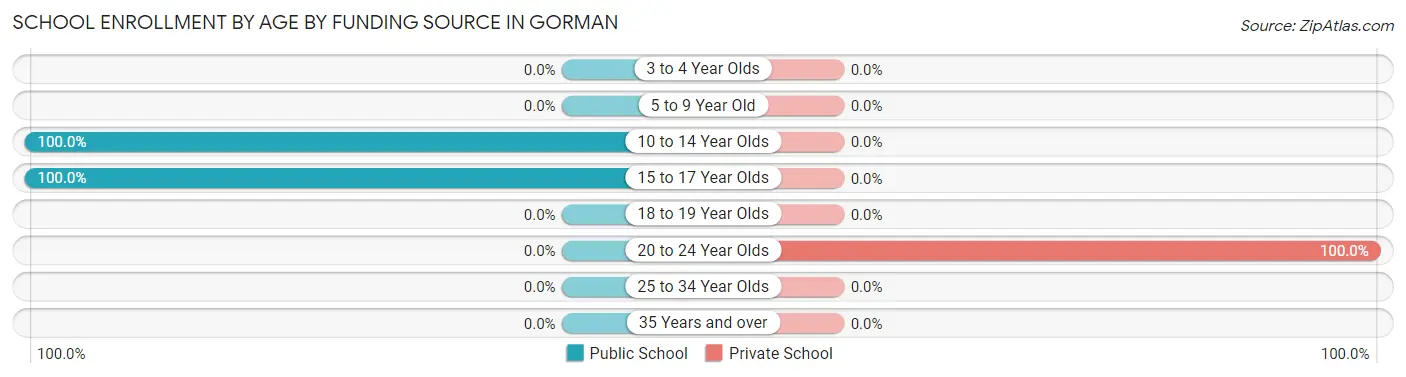
| Age Bracket | Public School | Private School |
| 3 to 4 Year Olds | 0 (0.0%) | 0 (0.0%) |
| 5 to 9 Year Old | 0 (0.0%) | 0 (0.0%) |
| 10 to 14 Year Olds | 22 (100.0%) | 0 (0.0%) |
| 15 to 17 Year Olds | 28 (100.0%) | 0 (0.0%) |
| 18 to 19 Year Olds | 0 (0.0%) | 0 (0.0%) |
| 20 to 24 Year Olds | 0 (0.0%) | 40 (100.0%) |
| 25 to 34 Year Olds | 0 (0.0%) | 0 (0.0%) |
| 35 Years and over | 0 (0.0%) | 0 (0.0%) |
| Total | 50 (55.6%) | 40 (44.4%) |
Educational Attainment by Field of Study in Gorman
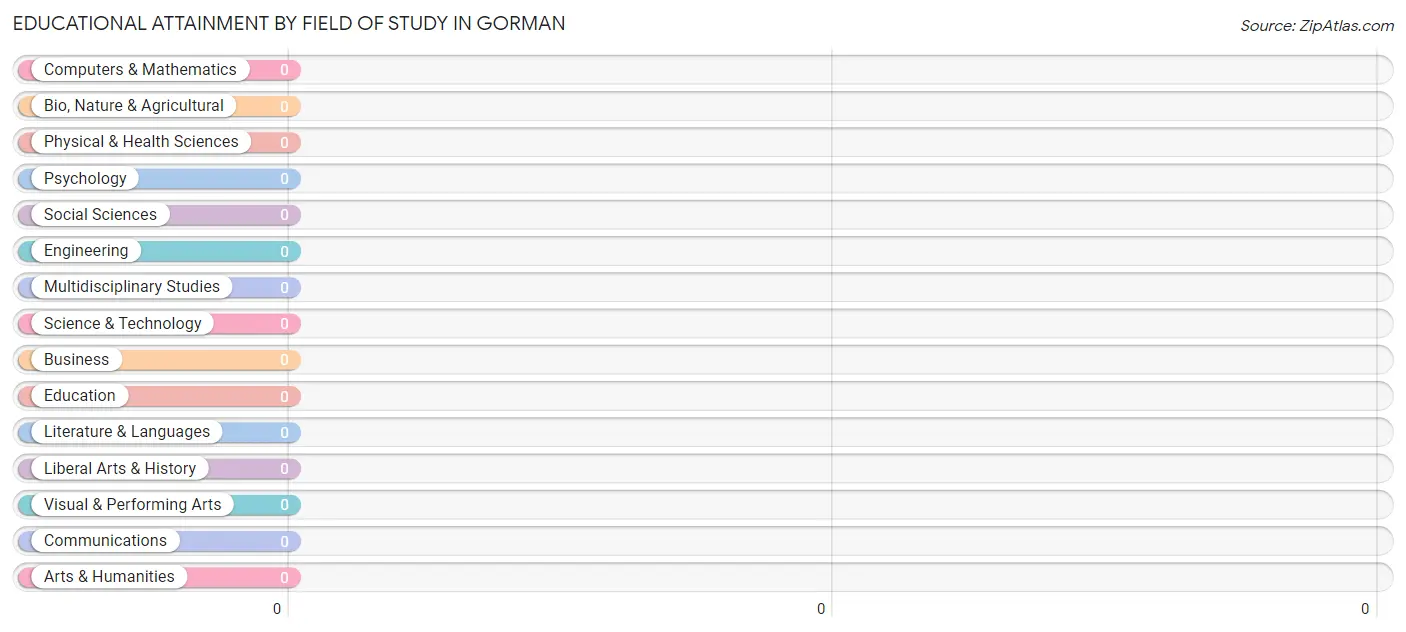
| Field of Study | # Graduates | % Graduates |
| Computers & Mathematics | 0 | 0.0% |
| Bio, Nature & Agricultural | 0 | 0.0% |
| Physical & Health Sciences | 0 | 0.0% |
| Psychology | 0 | 0.0% |
| Social Sciences | 0 | 0.0% |
| Engineering | 0 | 0.0% |
| Multidisciplinary Studies | 0 | 0.0% |
| Science & Technology | 0 | 0.0% |
| Business | 0 | 0.0% |
| Education | 0 | 0.0% |
| Literature & Languages | 0 | 0.0% |
| Liberal Arts & History | 0 | 0.0% |
| Visual & Performing Arts | 0 | 0.0% |
| Communications | 0 | 0.0% |
| Arts & Humanities | 0 | 0.0% |
| Total | 0 | 0.0% |
Transportation & Commute in Gorman
Vehicle Availability by Sex in Gorman
The most prevalent vehicle ownership categories in Gorman are males with 2 vehicles (55, accounting for 100.0%) and females with 2 vehicles (29, making up 189.7%).
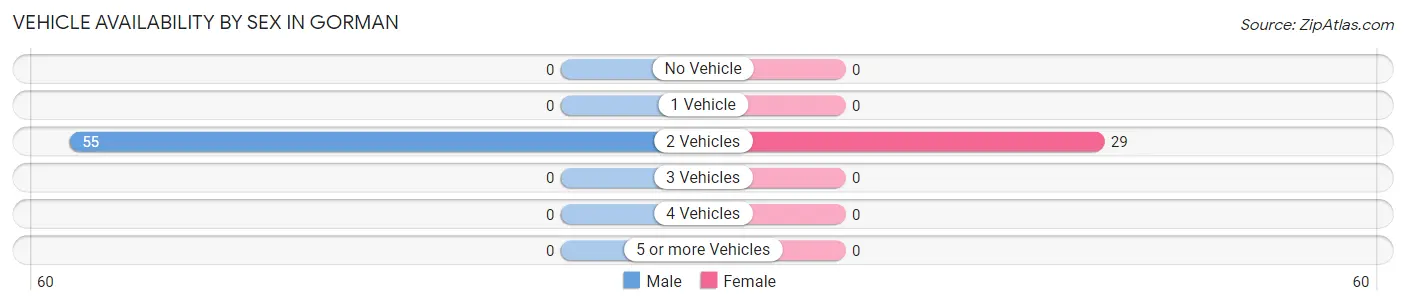
| Vehicles Available | Male | Female |
| No Vehicle | 0 (0.0%) | 0 (0.0%) |
| 1 Vehicle | 0 (0.0%) | 0 (0.0%) |
| 2 Vehicles | 55 (100.0%) | 29 (100.0%) |
| 3 Vehicles | 0 (0.0%) | 0 (0.0%) |
| 4 Vehicles | 0 (0.0%) | 0 (0.0%) |
| 5 or more Vehicles | 0 (0.0%) | 0 (0.0%) |
| Total | 55 (100.0%) | 29 (100.0%) |
Commute Time in Gorman
The most frequently occuring commute durations in Gorman are 15 to 19 minutes (84 commuters, 100.0%), less than 5 minutes (0 commuters, 0.0%), and 5 to 9 minutes (0 commuters, 0.0%).
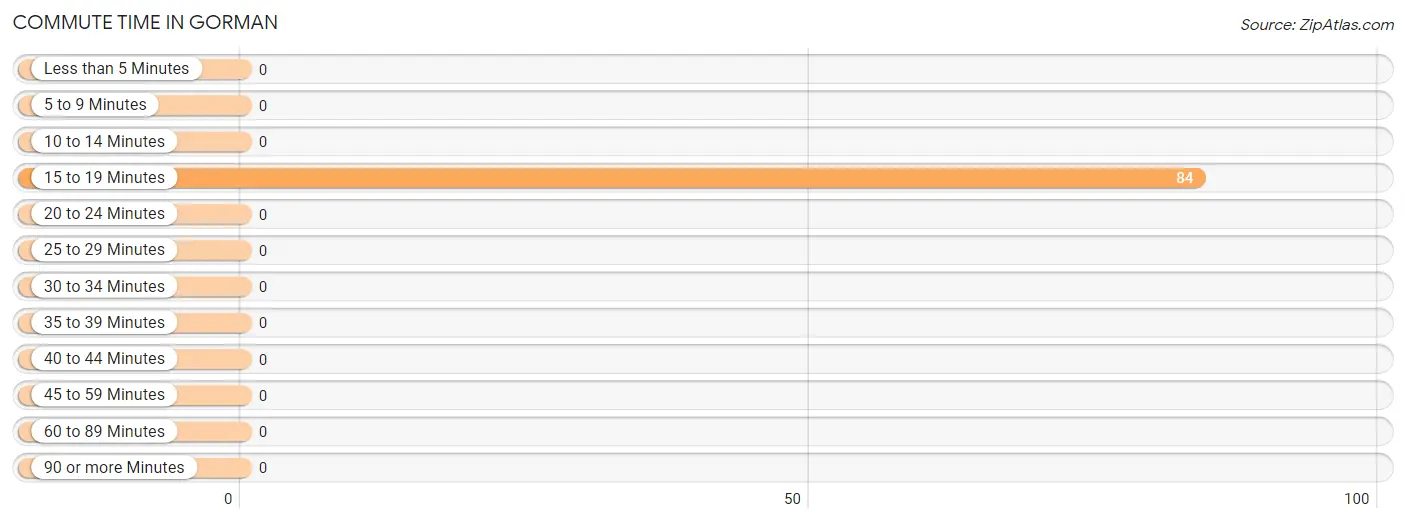
| Commute Time | # Commuters | % Commuters |
| Less than 5 Minutes | 0 | 0.0% |
| 5 to 9 Minutes | 0 | 0.0% |
| 10 to 14 Minutes | 0 | 0.0% |
| 15 to 19 Minutes | 84 | 100.0% |
| 20 to 24 Minutes | 0 | 0.0% |
| 25 to 29 Minutes | 0 | 0.0% |
| 30 to 34 Minutes | 0 | 0.0% |
| 35 to 39 Minutes | 0 | 0.0% |
| 40 to 44 Minutes | 0 | 0.0% |
| 45 to 59 Minutes | 0 | 0.0% |
| 60 to 89 Minutes | 0 | 0.0% |
| 90 or more Minutes | 0 | 0.0% |
Commute Time by Sex in Gorman
The most common commute times in Gorman are 15 to 19 minutes (55 commuters, 100.0%) for males and 15 to 19 minutes (29 commuters, 100.0%) for females.
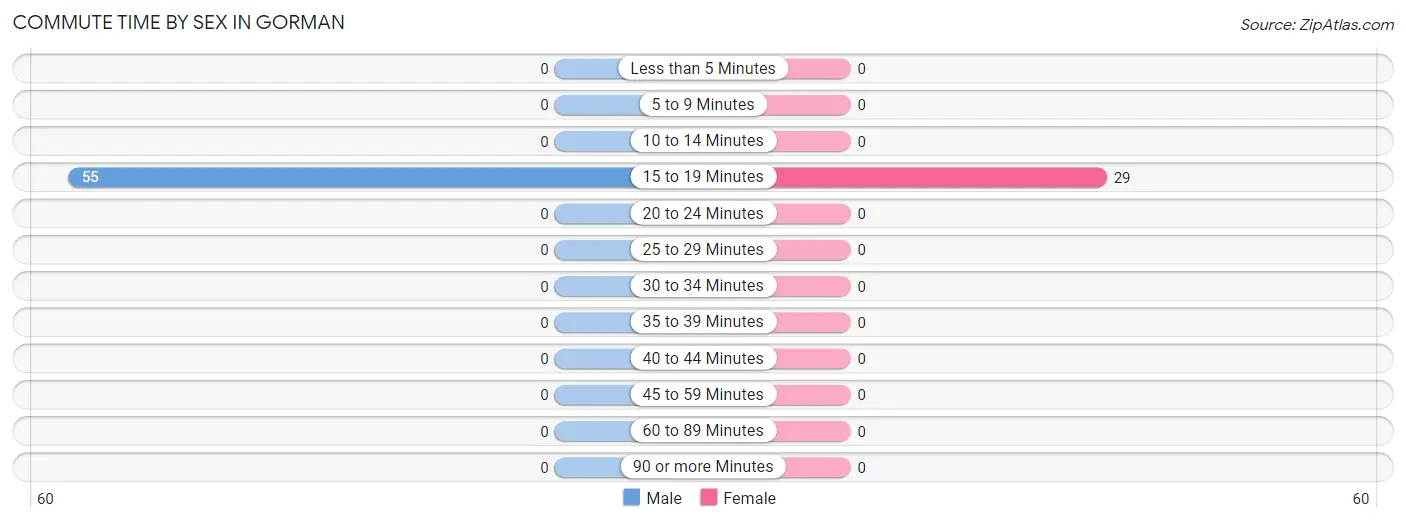
| Commute Time | Male | Female |
| Less than 5 Minutes | 0 (0.0%) | 0 (0.0%) |
| 5 to 9 Minutes | 0 (0.0%) | 0 (0.0%) |
| 10 to 14 Minutes | 0 (0.0%) | 0 (0.0%) |
| 15 to 19 Minutes | 55 (100.0%) | 29 (100.0%) |
| 20 to 24 Minutes | 0 (0.0%) | 0 (0.0%) |
| 25 to 29 Minutes | 0 (0.0%) | 0 (0.0%) |
| 30 to 34 Minutes | 0 (0.0%) | 0 (0.0%) |
| 35 to 39 Minutes | 0 (0.0%) | 0 (0.0%) |
| 40 to 44 Minutes | 0 (0.0%) | 0 (0.0%) |
| 45 to 59 Minutes | 0 (0.0%) | 0 (0.0%) |
| 60 to 89 Minutes | 0 (0.0%) | 0 (0.0%) |
| 90 or more Minutes | 0 (0.0%) | 0 (0.0%) |
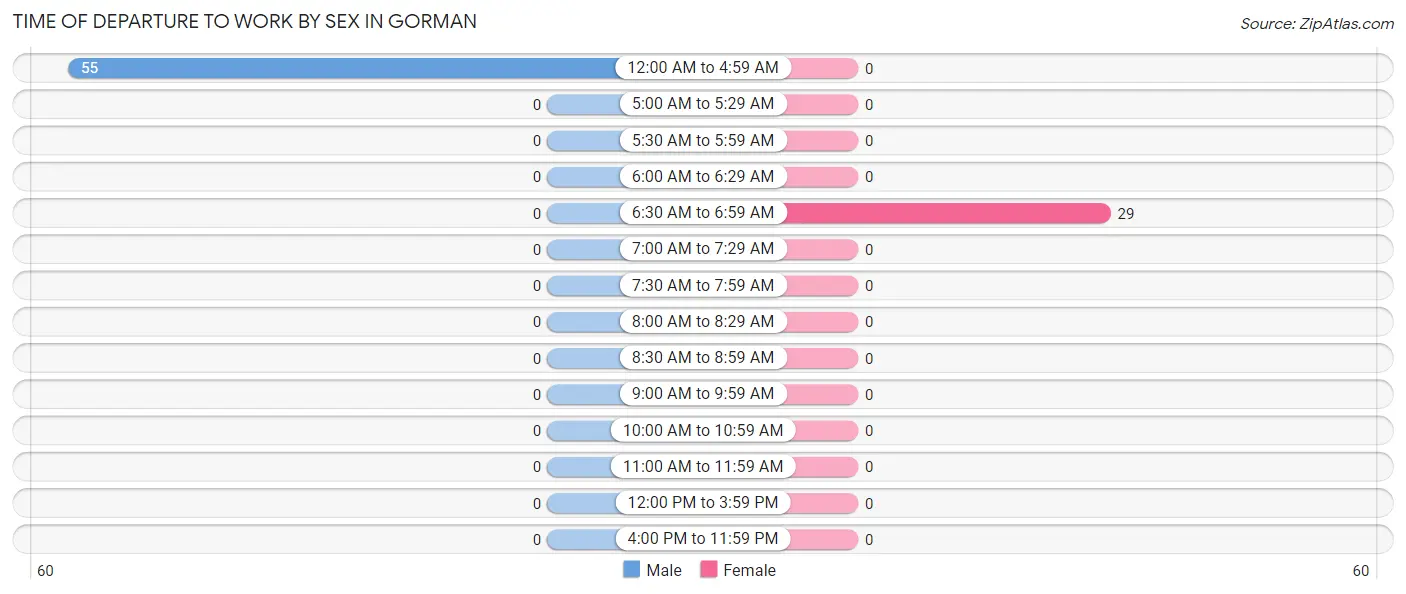
Time of Departure to Work by Sex in Gorman
The most frequent times of departure to work in Gorman are 12:00 AM to 4:59 AM (55, 100.0%) for males and 6:30 AM to 6:59 AM (29, 100.0%) for females.
| Time of Departure | Male | Female |
| 12:00 AM to 4:59 AM | 55 (100.0%) | 0 (0.0%) |
| 5:00 AM to 5:29 AM | 0 (0.0%) | 0 (0.0%) |
| 5:30 AM to 5:59 AM | 0 (0.0%) | 0 (0.0%) |
| 6:00 AM to 6:29 AM | 0 (0.0%) | 0 (0.0%) |
| 6:30 AM to 6:59 AM | 0 (0.0%) | 29 (100.0%) |
| 7:00 AM to 7:29 AM | 0 (0.0%) | 0 (0.0%) |
| 7:30 AM to 7:59 AM | 0 (0.0%) | 0 (0.0%) |
| 8:00 AM to 8:29 AM | 0 (0.0%) | 0 (0.0%) |
| 8:30 AM to 8:59 AM | 0 (0.0%) | 0 (0.0%) |
| 9:00 AM to 9:59 AM | 0 (0.0%) | 0 (0.0%) |
| 10:00 AM to 10:59 AM | 0 (0.0%) | 0 (0.0%) |
| 11:00 AM to 11:59 AM | 0 (0.0%) | 0 (0.0%) |
| 12:00 PM to 3:59 PM | 0 (0.0%) | 0 (0.0%) |
| 4:00 PM to 11:59 PM | 0 (0.0%) | 0 (0.0%) |
| Total | 55 (100.0%) | 29 (100.0%) |
Housing Occupancy in Gorman
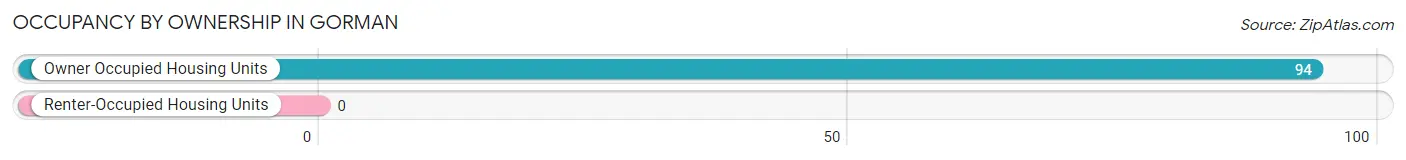
Occupancy by Ownership in Gorman
Of the total 94 dwellings in Gorman, owner-occupied units account for 94 (100.0%), while renter-occupied units make up 0 (0.0%).
| Occupancy | # Housing Units | % Housing Units |
| Owner Occupied Housing Units | 94 | 100.0% |
| Renter-Occupied Housing Units | 0 | 0.0% |
| Total Occupied Housing Units | 94 | 100.0% |
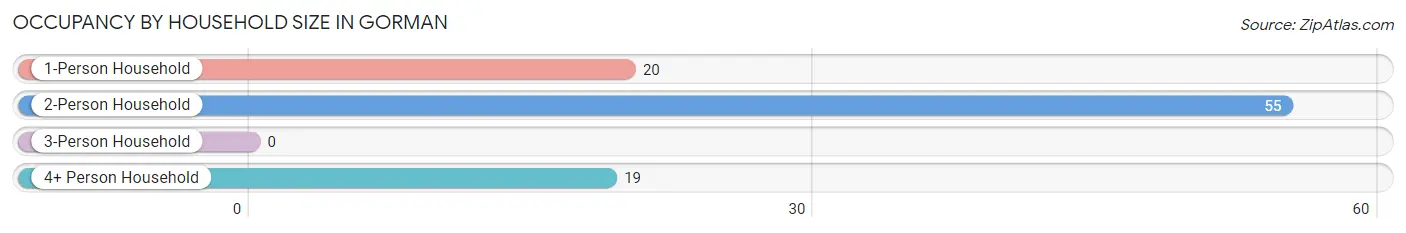
Occupancy by Household Size in Gorman
| Household Size | # Housing Units | % Housing Units |
| 1-Person Household | 20 | 21.3% |
| 2-Person Household | 55 | 58.5% |
| 3-Person Household | 0 | 0.0% |
| 4+ Person Household | 19 | 20.2% |
| Total Housing Units | 94 | 100.0% |
Occupancy by Ownership by Household Size in Gorman
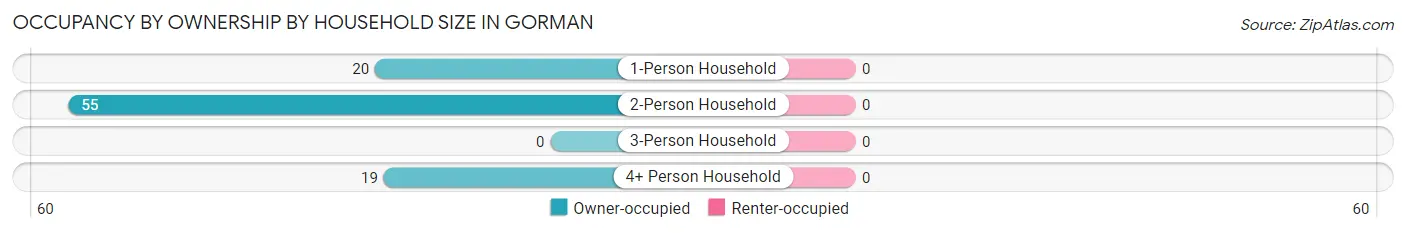
| Household Size | Owner-occupied | Renter-occupied |
| 1-Person Household | 20 (100.0%) | 0 (0.0%) |
| 2-Person Household | 55 (100.0%) | 0 (0.0%) |
| 3-Person Household | 0 (0.0%) | 0 (0.0%) |
| 4+ Person Household | 19 (100.0%) | 0 (0.0%) |
| Total Housing Units | 94 (100.0%) | 0 (0.0%) |
Occupancy by Educational Attainment in Gorman
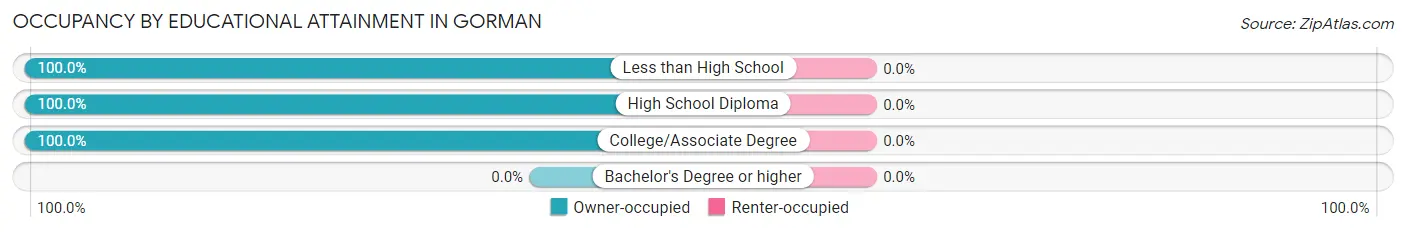
| Household Size | Owner-occupied | Renter-occupied |
| Less than High School | 19 (100.0%) | 0 (0.0%) |
| High School Diploma | 55 (100.0%) | 0 (0.0%) |
| College/Associate Degree | 20 (100.0%) | 0 (0.0%) |
| Bachelor's Degree or higher | 0 (0.0%) | 0 (0.0%) |
Occupancy by Age of Householder in Gorman
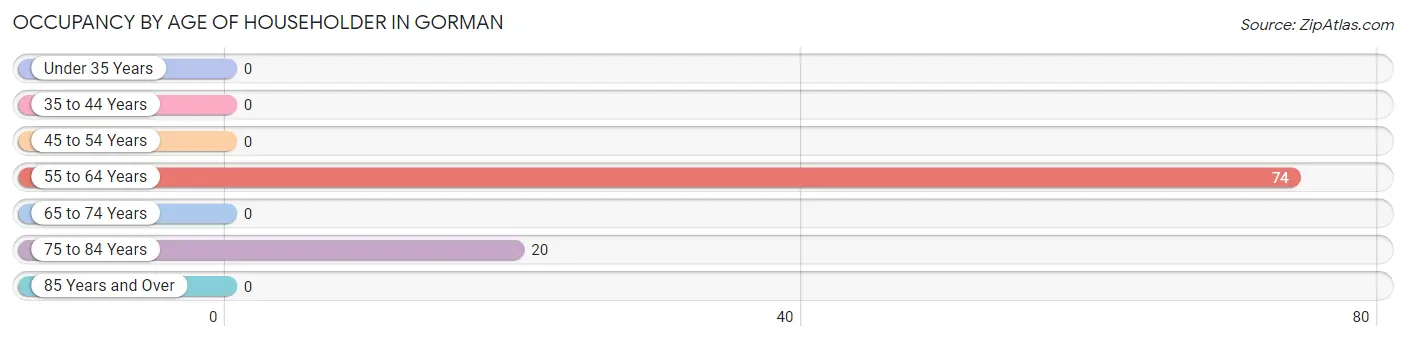
| Age Bracket | # Households | % Households |
| Under 35 Years | 0 | 0.0% |
| 35 to 44 Years | 0 | 0.0% |
| 45 to 54 Years | 0 | 0.0% |
| 55 to 64 Years | 74 | 78.7% |
| 65 to 74 Years | 0 | 0.0% |
| 75 to 84 Years | 20 | 21.3% |
| 85 Years and Over | 0 | 0.0% |
| Total | 94 | 100.0% |
Housing Finances in Gorman
Median Income by Occupancy in Gorman
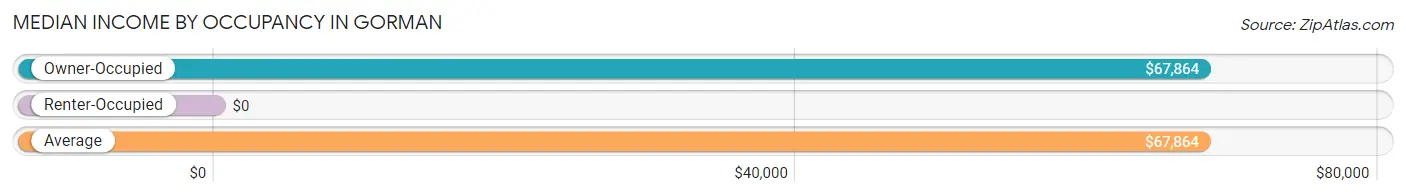
| Occupancy Type | # Households | Median Income |
| Owner-Occupied | 94 (100.0%) | $67,864 |
| Renter-Occupied | 0 (0.0%) | $0 |
| Average | 94 (100.0%) | $67,864 |
Occupancy by Householder Income Bracket in Gorman
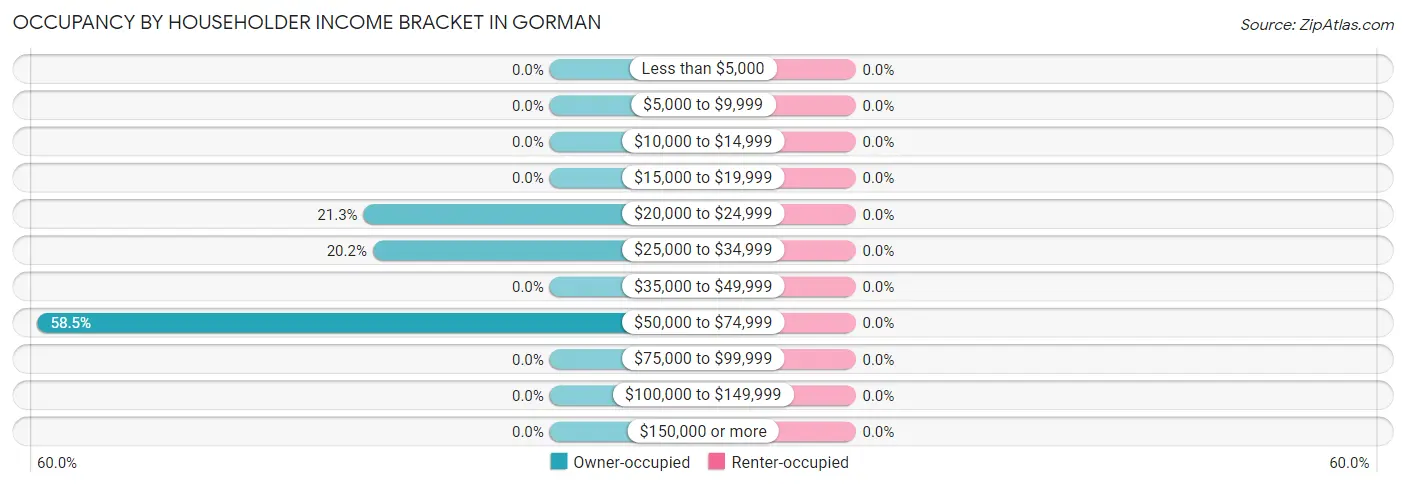
| Income Bracket | Owner-occupied | Renter-occupied |
| Less than $5,000 | 0 (0.0%) | 0 (0.0%) |
| $5,000 to $9,999 | 0 (0.0%) | 0 (0.0%) |
| $10,000 to $14,999 | 0 (0.0%) | 0 (0.0%) |
| $15,000 to $19,999 | 0 (0.0%) | 0 (0.0%) |
| $20,000 to $24,999 | 20 (21.3%) | 0 (0.0%) |
| $25,000 to $34,999 | 19 (20.2%) | 0 (0.0%) |
| $35,000 to $49,999 | 0 (0.0%) | 0 (0.0%) |
| $50,000 to $74,999 | 55 (58.5%) | 0 (0.0%) |
| $75,000 to $99,999 | 0 (0.0%) | 0 (0.0%) |
| $100,000 to $149,999 | 0 (0.0%) | 0 (0.0%) |
| $150,000 or more | 0 (0.0%) | 0 (0.0%) |
| Total | 94 (100.0%) | 0 (0.0%) |
Monthly Housing Cost Tiers in Gorman
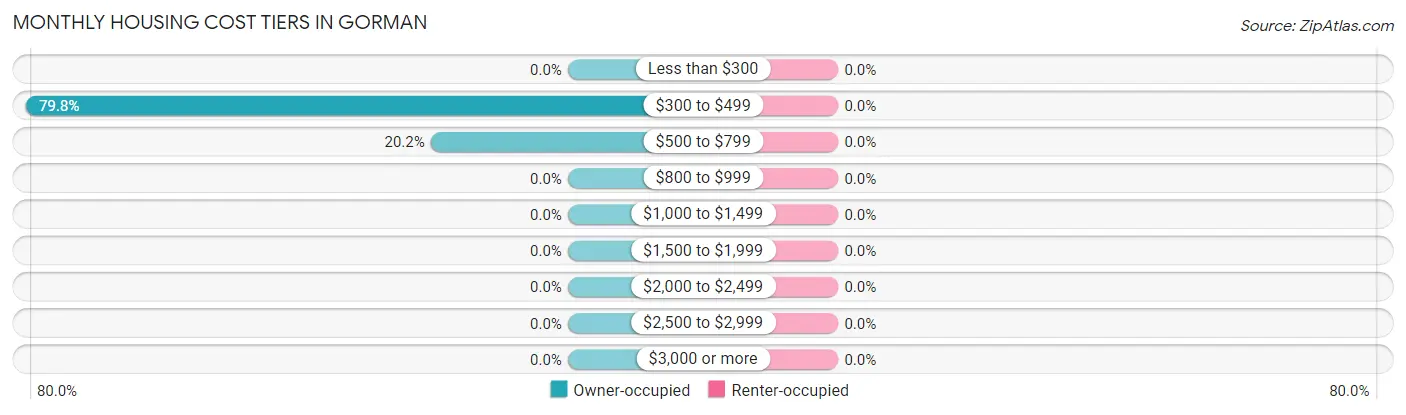
| Monthly Cost | Owner-occupied | Renter-occupied |
| Less than $300 | 0 (0.0%) | 0 (0.0%) |
| $300 to $499 | 75 (79.8%) | 0 (0.0%) |
| $500 to $799 | 19 (20.2%) | 0 (0.0%) |
| $800 to $999 | 0 (0.0%) | 0 (0.0%) |
| $1,000 to $1,499 | 0 (0.0%) | 0 (0.0%) |
| $1,500 to $1,999 | 0 (0.0%) | 0 (0.0%) |
| $2,000 to $2,499 | 0 (0.0%) | 0 (0.0%) |
| $2,500 to $2,999 | 0 (0.0%) | 0 (0.0%) |
| $3,000 or more | 0 (0.0%) | 0 (0.0%) |
| Total | 94 (100.0%) | 0 (0.0%) |
Physical Housing Characteristics in Gorman
Housing Structures in Gorman
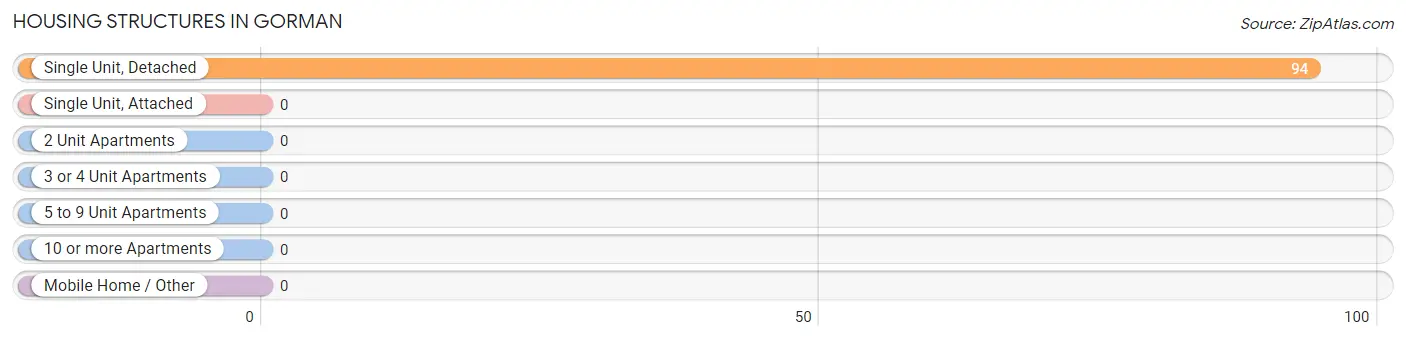
| Structure Type | # Housing Units | % Housing Units |
| Single Unit, Detached | 94 | 100.0% |
| Single Unit, Attached | 0 | 0.0% |
| 2 Unit Apartments | 0 | 0.0% |
| 3 or 4 Unit Apartments | 0 | 0.0% |
| 5 to 9 Unit Apartments | 0 | 0.0% |
| 10 or more Apartments | 0 | 0.0% |
| Mobile Home / Other | 0 | 0.0% |
| Total | 94 | 100.0% |
Housing Structures by Occupancy in Gorman
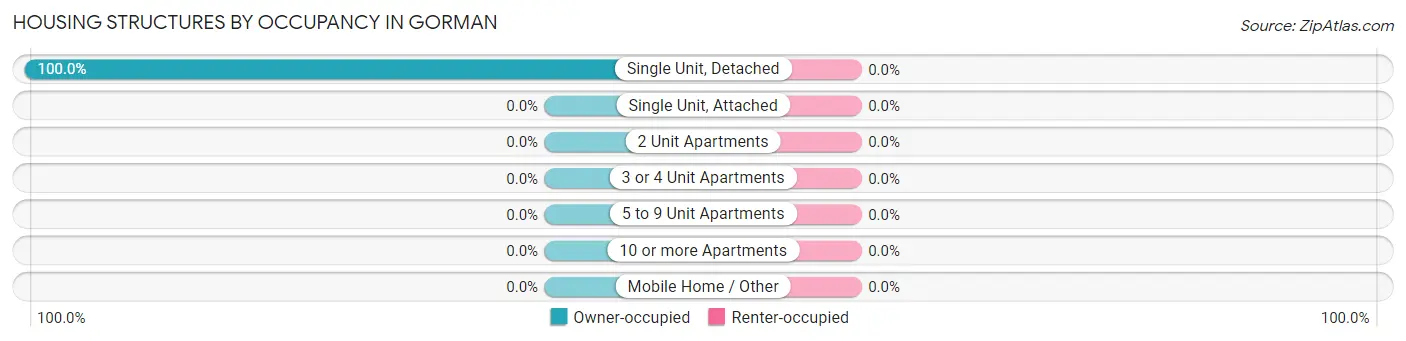
| Structure Type | Owner-occupied | Renter-occupied |
| Single Unit, Detached | 94 (100.0%) | 0 (0.0%) |
| Single Unit, Attached | 0 (0.0%) | 0 (0.0%) |
| 2 Unit Apartments | 0 (0.0%) | 0 (0.0%) |
| 3 or 4 Unit Apartments | 0 (0.0%) | 0 (0.0%) |
| 5 to 9 Unit Apartments | 0 (0.0%) | 0 (0.0%) |
| 10 or more Apartments | 0 (0.0%) | 0 (0.0%) |
| Mobile Home / Other | 0 (0.0%) | 0 (0.0%) |
| Total | 94 (100.0%) | 0 (0.0%) |
Housing Structures by Number of Rooms in Gorman
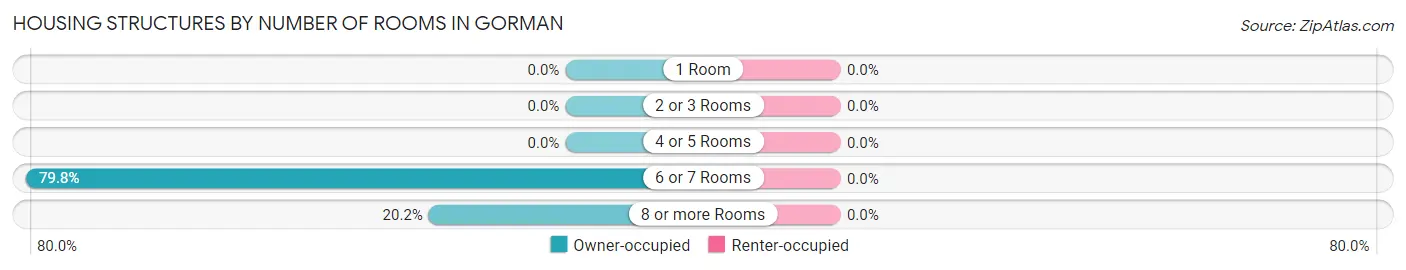
| Number of Rooms | Owner-occupied | Renter-occupied |
| 1 Room | 0 (0.0%) | 0 (0.0%) |
| 2 or 3 Rooms | 0 (0.0%) | 0 (0.0%) |
| 4 or 5 Rooms | 0 (0.0%) | 0 (0.0%) |
| 6 or 7 Rooms | 75 (79.8%) | 0 (0.0%) |
| 8 or more Rooms | 19 (20.2%) | 0 (0.0%) |
| Total | 94 (100.0%) | 0 (0.0%) |
Housing Structure by Heating Type in Gorman
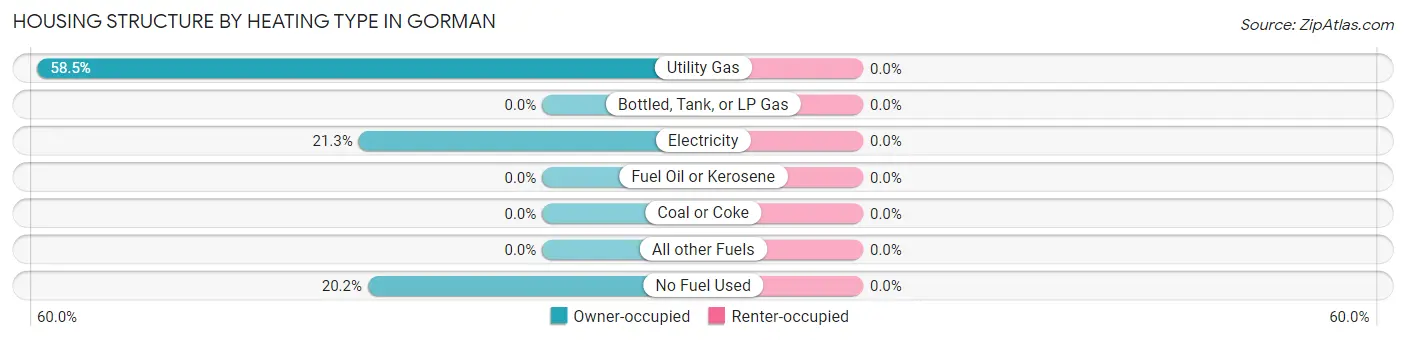
| Heating Type | Owner-occupied | Renter-occupied |
| Utility Gas | 55 (58.5%) | 0 (0.0%) |
| Bottled, Tank, or LP Gas | 0 (0.0%) | 0 (0.0%) |
| Electricity | 20 (21.3%) | 0 (0.0%) |
| Fuel Oil or Kerosene | 0 (0.0%) | 0 (0.0%) |
| Coal or Coke | 0 (0.0%) | 0 (0.0%) |
| All other Fuels | 0 (0.0%) | 0 (0.0%) |
| No Fuel Used | 19 (20.2%) | 0 (0.0%) |
| Total | 94 (100.0%) | 0 (0.0%) |
Household Vehicle Usage in Gorman
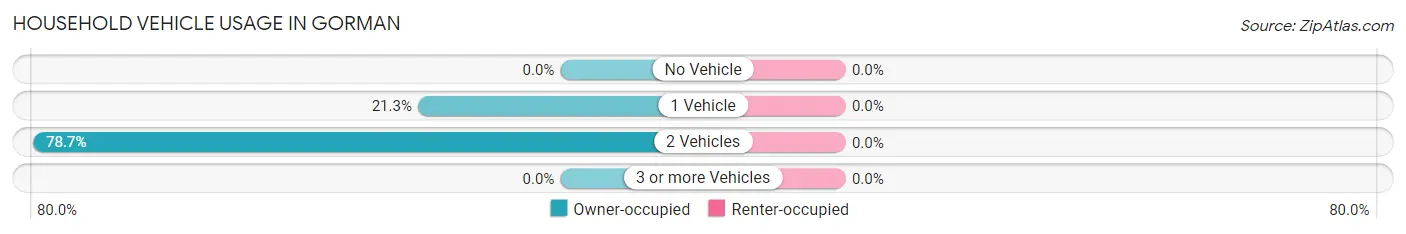
| Vehicles per Household | Owner-occupied | Renter-occupied |
| No Vehicle | 0 (0.0%) | 0 (0.0%) |
| 1 Vehicle | 20 (21.3%) | 0 (0.0%) |
| 2 Vehicles | 74 (78.7%) | 0 (0.0%) |
| 3 or more Vehicles | 0 (0.0%) | 0 (0.0%) |
| Total | 94 (100.0%) | 0 (0.0%) |
Real Estate & Mortgages in Gorman
Real Estate and Mortgage Overview in Gorman
| Characteristic | Without Mortgage | With Mortgage |
| Housing Units | 94 | 0 |
| Median Property Value | - | - |
| Median Household Income | $67,864 | $0 |
| Monthly Housing Costs | $343 | $0 |
| Real Estate Taxes | $698 | $0 |
Property Value by Mortgage Status in Gorman
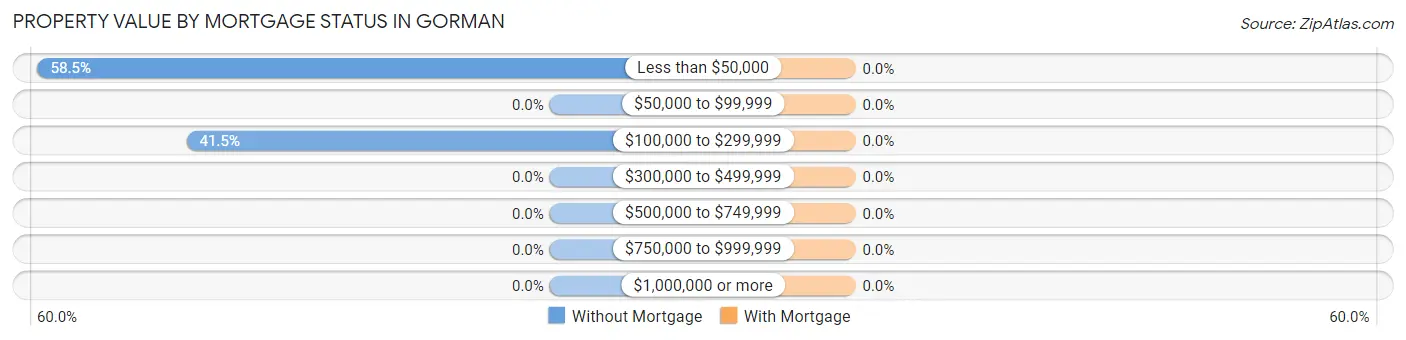
| Property Value | Without Mortgage | With Mortgage |
| Less than $50,000 | 55 (58.5%) | 0 (0.0%) |
| $50,000 to $99,999 | 0 (0.0%) | 0 (0.0%) |
| $100,000 to $299,999 | 39 (41.5%) | 0 (0.0%) |
| $300,000 to $499,999 | 0 (0.0%) | 0 (0.0%) |
| $500,000 to $749,999 | 0 (0.0%) | 0 (0.0%) |
| $750,000 to $999,999 | 0 (0.0%) | 0 (0.0%) |
| $1,000,000 or more | 0 (0.0%) | 0 (0.0%) |
| Total | 94 (100.0%) | 0 (0.0%) |
Household Income by Mortgage Status in Gorman
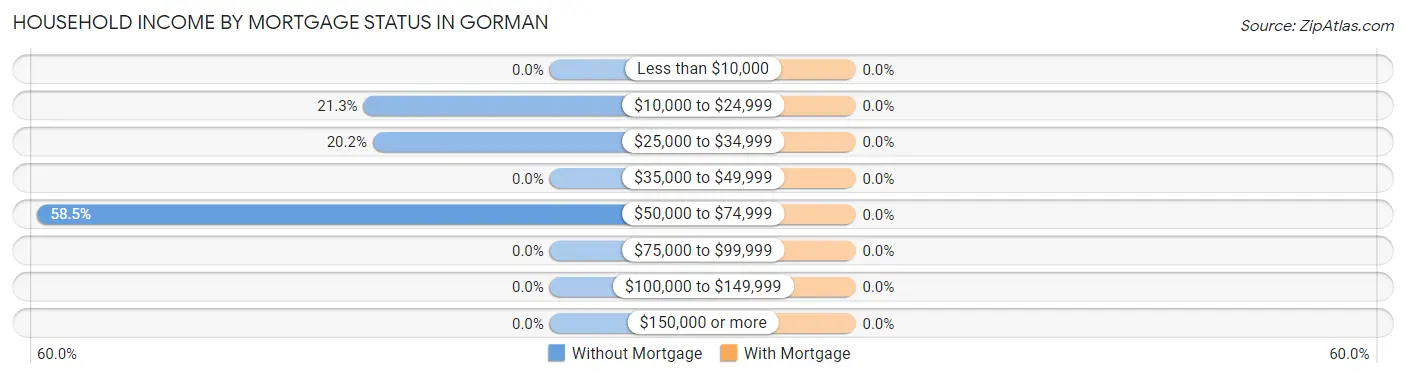
| Household Income | Without Mortgage | With Mortgage |
| Less than $10,000 | 0 (0.0%) | 0 (0.0%) |
| $10,000 to $24,999 | 20 (21.3%) | 0 (0.0%) |
| $25,000 to $34,999 | 19 (20.2%) | 0 (0.0%) |
| $35,000 to $49,999 | 0 (0.0%) | 0 (0.0%) |
| $50,000 to $74,999 | 55 (58.5%) | 0 (0.0%) |
| $75,000 to $99,999 | 0 (0.0%) | 0 (0.0%) |
| $100,000 to $149,999 | 0 (0.0%) | 0 (0.0%) |
| $150,000 or more | 0 (0.0%) | 0 (0.0%) |
| Total | 94 (100.0%) | 0 (0.0%) |
Property Value to Household Income Ratio in Gorman
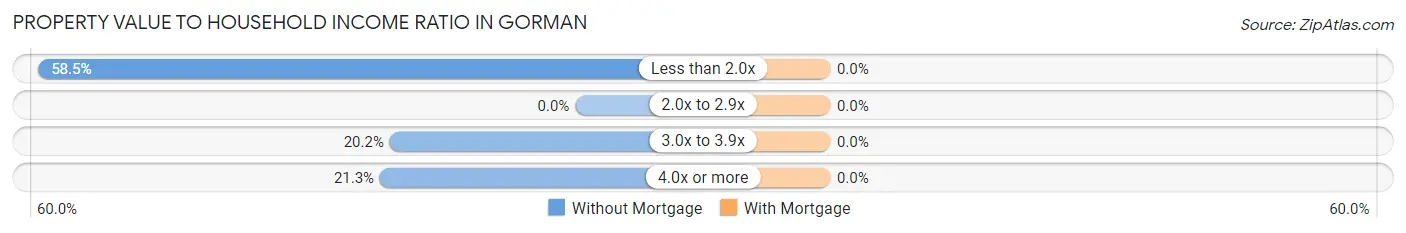
| Value-to-Income Ratio | Without Mortgage | With Mortgage |
| Less than 2.0x | 55 (58.5%) | 0 (0.0%) |
| 2.0x to 2.9x | 0 (0.0%) | 0 (0.0%) |
| 3.0x to 3.9x | 19 (20.2%) | 0 (0.0%) |
| 4.0x or more | 20 (21.3%) | 0 (0.0%) |
| Total | 94 (100.0%) | 0 (0.0%) |
Real Estate Taxes by Mortgage Status in Gorman
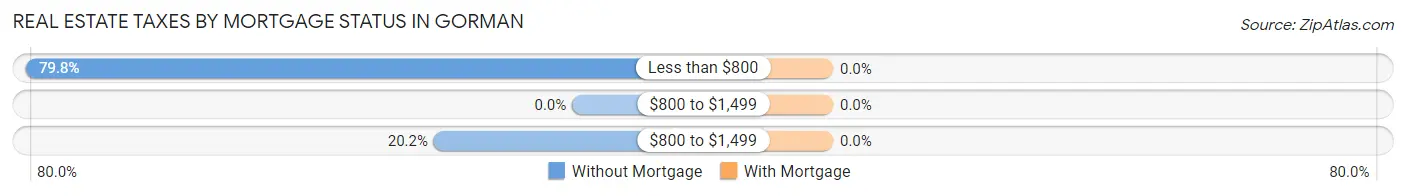
| Property Taxes | Without Mortgage | With Mortgage |
| Less than $800 | 75 (79.8%) | 0 (0.0%) |
| $800 to $1,499 | 0 (0.0%) | 0 (0.0%) |
| $800 to $1,499 | 19 (20.2%) | 0 (0.0%) |
| Total | 94 (100.0%) | 0 (0.0%) |
Health & Disability in Gorman
Health Insurance Coverage by Age in Gorman
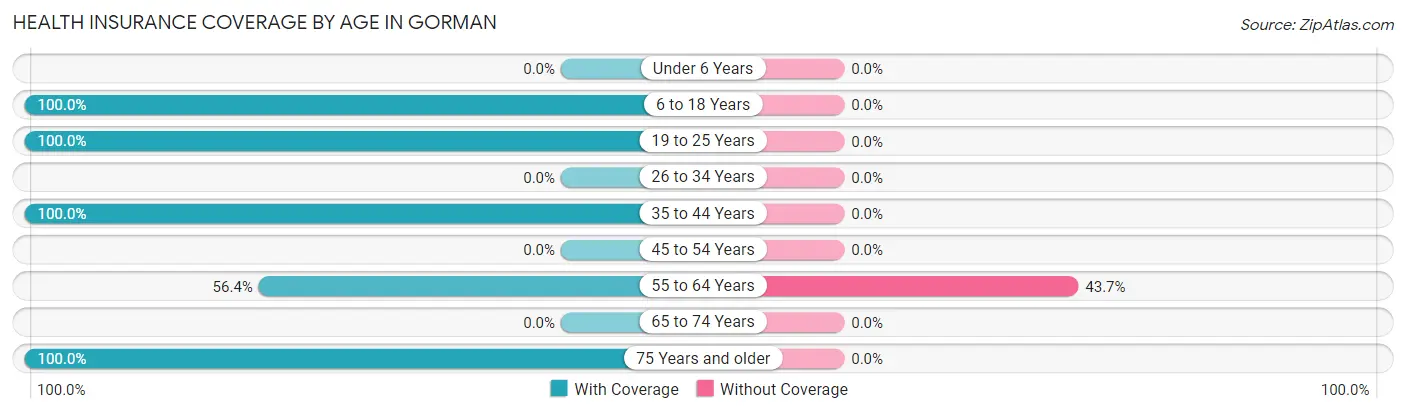
| Age Bracket | With Coverage | Without Coverage |
| Under 6 Years | 0 (0.0%) | 0 (0.0%) |
| 6 to 18 Years | 50 (100.0%) | 0 (0.0%) |
| 19 to 25 Years | 40 (100.0%) | 0 (0.0%) |
| 26 to 34 Years | 0 (0.0%) | 0 (0.0%) |
| 35 to 44 Years | 22 (100.0%) | 0 (0.0%) |
| 45 to 54 Years | 0 (0.0%) | 0 (0.0%) |
| 55 to 64 Years | 71 (56.4%) | 55 (43.6%) |
| 65 to 74 Years | 0 (0.0%) | 0 (0.0%) |
| 75 Years and older | 20 (100.0%) | 0 (0.0%) |
| Total | 203 (78.7%) | 55 (21.3%) |
Health Insurance Coverage by Citizenship Status in Gorman
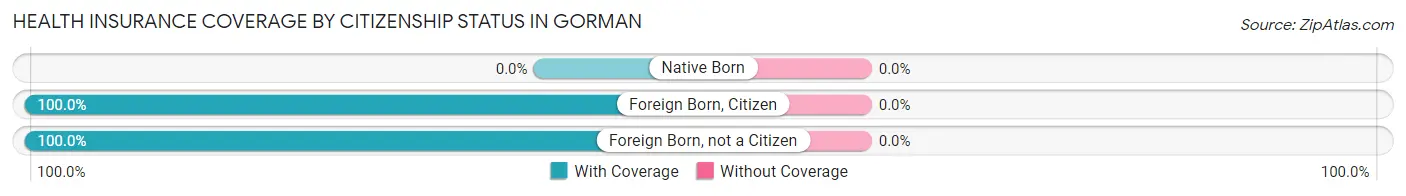
| Citizenship Status | With Coverage | Without Coverage |
| Native Born | 0 (0.0%) | 0 (0.0%) |
| Foreign Born, Citizen | 50 (100.0%) | 0 (0.0%) |
| Foreign Born, not a Citizen | 40 (100.0%) | 0 (0.0%) |
Health Insurance Coverage by Household Income in Gorman
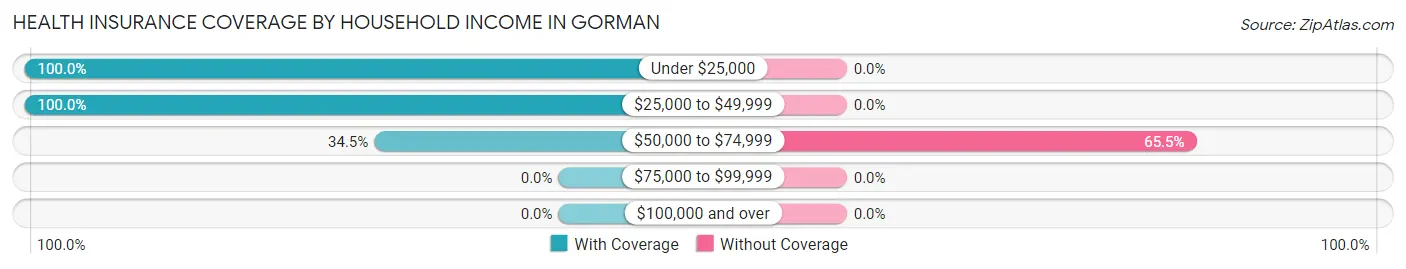
| Household Income | With Coverage | Without Coverage |
| Under $25,000 | 20 (100.0%) | 0 (0.0%) |
| $25,000 to $49,999 | 154 (100.0%) | 0 (0.0%) |
| $50,000 to $74,999 | 29 (34.5%) | 55 (65.5%) |
| $75,000 to $99,999 | 0 (0.0%) | 0 (0.0%) |
| $100,000 and over | 0 (0.0%) | 0 (0.0%) |
Public vs Private Health Insurance Coverage by Age in Gorman
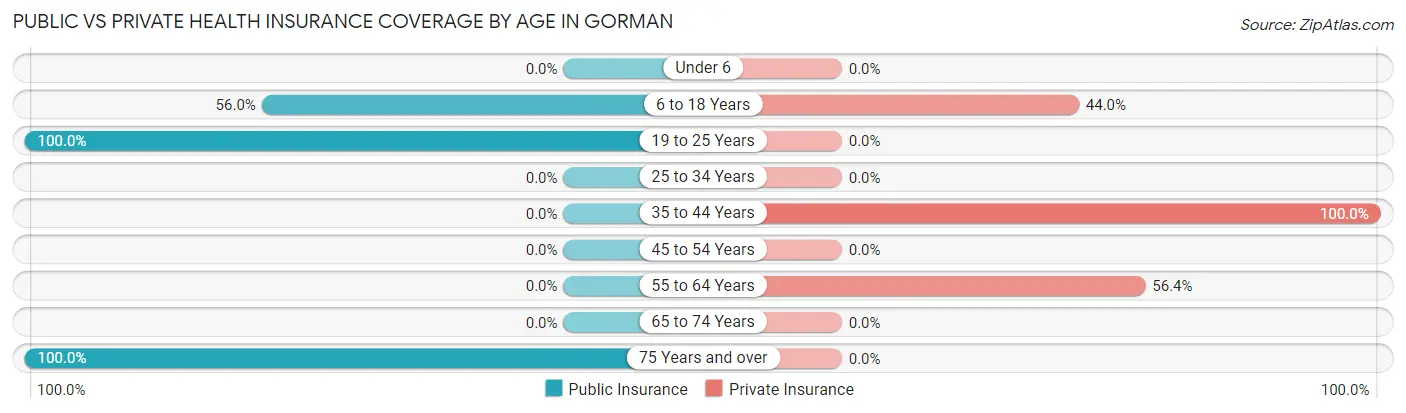
| Age Bracket | Public Insurance | Private Insurance |
| Under 6 | 0 (0.0%) | 0 (0.0%) |
| 6 to 18 Years | 28 (56.0%) | 22 (44.0%) |
| 19 to 25 Years | 40 (100.0%) | 0 (0.0%) |
| 25 to 34 Years | 0 (0.0%) | 0 (0.0%) |
| 35 to 44 Years | 0 (0.0%) | 22 (100.0%) |
| 45 to 54 Years | 0 (0.0%) | 0 (0.0%) |
| 55 to 64 Years | 0 (0.0%) | 71 (56.4%) |
| 65 to 74 Years | 0 (0.0%) | 0 (0.0%) |
| 75 Years and over | 20 (100.0%) | 0 (0.0%) |
| Total | 88 (34.1%) | 115 (44.6%) |
Disability Status by Sex by Age in Gorman
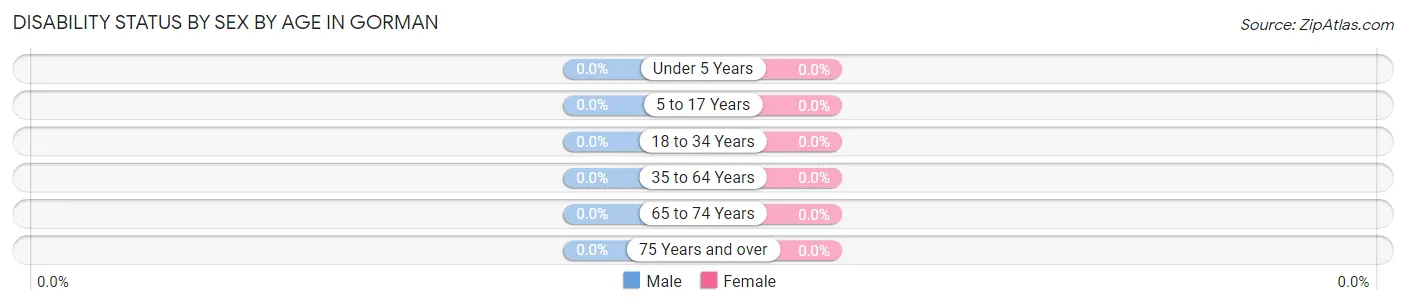
| Age Bracket | Male | Female |
| Under 5 Years | 0 (0.0%) | 0 (0.0%) |
| 5 to 17 Years | 0 (0.0%) | 0 (0.0%) |
| 18 to 34 Years | 0 (0.0%) | 0 (0.0%) |
| 35 to 64 Years | 0 (0.0%) | 0 (0.0%) |
| 65 to 74 Years | 0 (0.0%) | 0 (0.0%) |
| 75 Years and over | 0 (0.0%) | 0 (0.0%) |
Disability Class by Sex by Age in Gorman
Disability Class: Hearing Difficulty
| Age Bracket | Male | Female |
| Under 5 Years | 0 (0.0%) | 0 (0.0%) |
| 5 to 17 Years | 0 (0.0%) | 0 (0.0%) |
| 18 to 34 Years | 0 (0.0%) | 0 (0.0%) |
| 35 to 64 Years | 0 (0.0%) | 0 (0.0%) |
| 65 to 74 Years | 0 (0.0%) | 0 (0.0%) |
| 75 Years and over | 0 (0.0%) | 0 (0.0%) |
Disability Class: Vision Difficulty
| Age Bracket | Male | Female |
| Under 5 Years | 0 (0.0%) | 0 (0.0%) |
| 5 to 17 Years | 0 (0.0%) | 0 (0.0%) |
| 18 to 34 Years | 0 (0.0%) | 0 (0.0%) |
| 35 to 64 Years | 0 (0.0%) | 0 (0.0%) |
| 65 to 74 Years | 0 (0.0%) | 0 (0.0%) |
| 75 Years and over | 0 (0.0%) | 0 (0.0%) |
Disability Class: Cognitive Difficulty

| Age Bracket | Male | Female |
| 5 to 17 Years | 0 (0.0%) | 0 (0.0%) |
| 18 to 34 Years | 0 (0.0%) | 0 (0.0%) |
| 35 to 64 Years | 0 (0.0%) | 0 (0.0%) |
| 65 to 74 Years | 0 (0.0%) | 0 (0.0%) |
| 75 Years and over | 0 (0.0%) | 0 (0.0%) |
Disability Class: Ambulatory Difficulty
| Age Bracket | Male | Female |
| 5 to 17 Years | 0 (0.0%) | 0 (0.0%) |
| 18 to 34 Years | 0 (0.0%) | 0 (0.0%) |
| 35 to 64 Years | 0 (0.0%) | 0 (0.0%) |
| 65 to 74 Years | 0 (0.0%) | 0 (0.0%) |
| 75 Years and over | 0 (0.0%) | 0 (0.0%) |
Disability Class: Self-Care Difficulty
| Age Bracket | Male | Female |
| 5 to 17 Years | 0 (0.0%) | 0 (0.0%) |
| 18 to 34 Years | 0 (0.0%) | 0 (0.0%) |
| 35 to 64 Years | 0 (0.0%) | 0 (0.0%) |
| 65 to 74 Years | 0 (0.0%) | 0 (0.0%) |
| 75 Years and over | 0 (0.0%) | 0 (0.0%) |
Technology Access in Gorman
Computing Device Access in Gorman
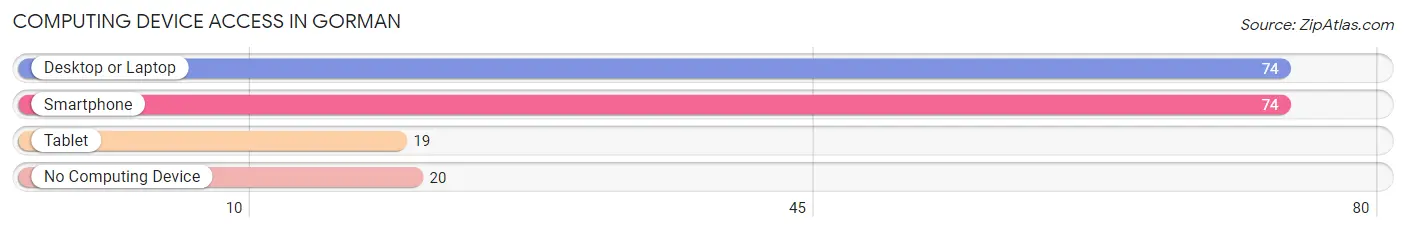
| Device Type | # Households | % Households |
| Desktop or Laptop | 74 | 78.7% |
| Smartphone | 74 | 78.7% |
| Tablet | 19 | 20.2% |
| No Computing Device | 20 | 21.3% |
| Total | 94 | 100.0% |
Internet Access in Gorman
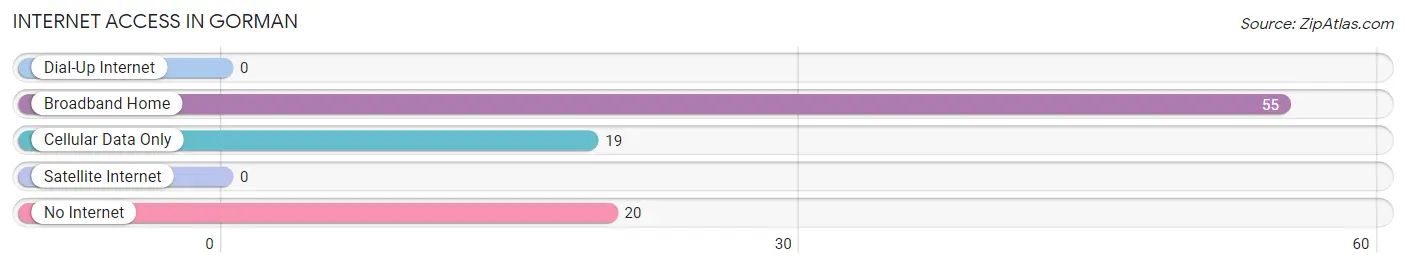
| Internet Type | # Households | % Households |
| Dial-Up Internet | 0 | 0.0% |
| Broadband Home | 55 | 58.5% |
| Cellular Data Only | 19 | 20.2% |
| Satellite Internet | 0 | 0.0% |
| No Internet | 20 | 21.3% |
| Total | 94 | 100.0% |
Gorman Summary
Gorman is an unincorporated community located in Los Angeles County, California. It is situated in the foothills of the San Gabriel Mountains, approximately 40 miles northeast of downtown Los Angeles. The community is located in the Antelope Valley, which is part of the Mojave Desert.
History
Gorman was founded in 1876 by William Gorman, a rancher from Missouri. He purchased a large tract of land in the area and began to raise cattle and sheep. Gorman quickly became a popular stop for travelers on the Butterfield Stage Line, which ran from San Francisco to Los Angeles. The stage line stopped at Gorman's ranch, providing a place for travelers to rest and eat.
In 1887, the Southern Pacific Railroad built a line through the area, connecting Gorman to Los Angeles. This allowed Gorman to become a popular stop for travelers and freight. The town grew rapidly, and by the early 1900s, it had a population of over 500 people.
In the 1920s, Gorman became a popular destination for Hollywood celebrities, who would come to the area to hunt and fish. The town also became a popular stop for truckers, who would stop to rest and refuel.
Geography
Gorman is located in the Antelope Valley, which is part of the Mojave Desert. The area is characterized by rolling hills and dry, desert-like conditions. The town is situated at an elevation of 2,500 feet, and the surrounding area is mostly flat.
The climate in Gorman is hot and dry, with temperatures ranging from the mid-90s in the summer to the mid-50s in the winter. The area receives very little rainfall, with an average of only 8 inches per year.
Economy
Gorman's economy is largely based on agriculture and tourism. The area is home to several large farms, which produce a variety of crops, including alfalfa, cotton, and wheat. The town is also a popular destination for tourists, who come to the area to enjoy the desert scenery and outdoor activities.
Demographics
As of the 2010 census, Gorman had a population of 1,717 people. The racial makeup of the town was 73.3% White, 0.7% African American, 0.7% Native American, 0.7% Asian, 0.1% Pacific Islander, 22.2% from other races, and 2.2% from two or more races. Hispanic or Latino of any race were 44.2% of the population.
The median household income in Gorman was $37,917, and the median family income was $41,250. The per capita income was $17,845. About 17.2% of families and 20.2% of the population were below the poverty line, including 28.3% of those under age 18 and 8.3% of those age 65 or over.
Conclusion
Gorman is a small, unincorporated community located in Los Angeles County, California. It is situated in the foothills of the San Gabriel Mountains, approximately 40 miles northeast of downtown Los Angeles. The town was founded in 1876 by William Gorman, and it quickly became a popular stop for travelers on the Butterfield Stage Line. The economy of Gorman is largely based on agriculture and tourism, and the town has a population of 1,717 people, as of the 2010 census.
Common Questions
What is Per Capita Income in Gorman?
Per Capita income in Gorman is $15,802.
What is the Median Household income in Gorman?
Median Household Income in Gorman is $67,864.
What is Inequality or Gini Index in Gorman?
Inequality or Gini Index in Gorman is 0.21.
What is the Total Population of Gorman?
Total Population of Gorman is 258.
What is the Total Male Population of Gorman?
Total Male Population of Gorman is 114.
What is the Total Female Population of Gorman?
Total Female Population of Gorman is 144.
What is the Ratio of Males per 100 Females in Gorman?
There are 79.17 Males per 100 Females in Gorman.
What is the Ratio of Females per 100 Males in Gorman?
There are 126.32 Females per 100 Males in Gorman.
What is the Median Population Age in Gorman?
Median Population Age in Gorman is 56.3 Years.
What is the Average Family Size in Gorman
Average Family Size in Gorman is 3.2 People.
What is the Average Household Size in Gorman
Average Household Size in Gorman is 2.7 People.
How Large is the Labor Force in Gorman?
There are 84 People in the Labor Forcein in Gorman.
What is the Percentage of People in the Labor Force in Gorman?
35.6% of People are in the Labor Force in Gorman.