Kopperston, WV Map & Demographics
Kopperston Map
Kopperston Overview
$30,795
PER CAPITA INCOME
$18,305
AVG FAMILY INCOME
$35,231
AVG HOUSEHOLD INCOME
0.61
INEQUALITY / GINI INDEX
780
TOTAL POPULATION
295
MALE POPULATION
485
FEMALE POPULATION
60.82
MALES / 100 FEMALES
164.41
FEMALES / 100 MALES
39.8
MEDIAN AGE
4.0
AVG FAMILY SIZE
3.2
AVG HOUSEHOLD SIZE
95
LABOR FORCE [ PEOPLE ]
16.7%
PERCENT IN LABOR FORCE
Kopperston Zip Codes
Kopperston Area Codes
Income in Kopperston
Income Overview in Kopperston
Per Capita Income in Kopperston is $30,795, while median incomes of families and households are $18,305 and $35,231 respectively.
| Characteristic | Number | Measure |
| Per Capita Income | 780 | $30,795 |
| Median Family Income | 170 | $18,305 |
| Mean Family Income | 170 | $26,414 |
| Median Household Income | 242 | $35,231 |
| Mean Household Income | 242 | $93,736 |
| Income Deficit | 170 | $0 |
| Wage / Income Gap (%) | 780 | 0.00% |
| Wage / Income Gap ($) | 780 | 100.00¢ per $1 |
| Gini / Inequality Index | 780 | 0.61 |
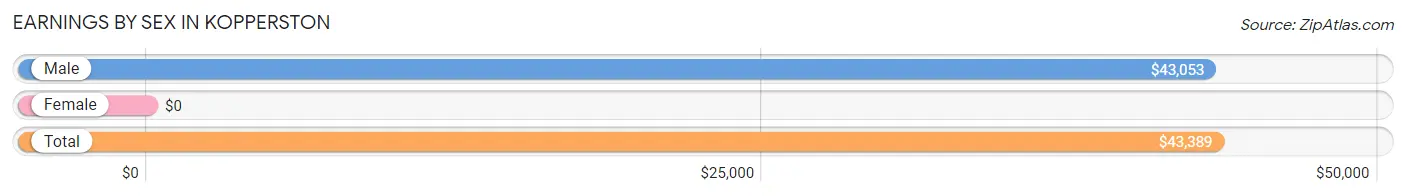
Earnings by Sex in Kopperston
| Sex | Number | Average Earnings |
| Male | 81 (85.3%) | $43,053 |
| Female | 14 (14.7%) | $0 |
| Total | 95 (100.0%) | $43,389 |
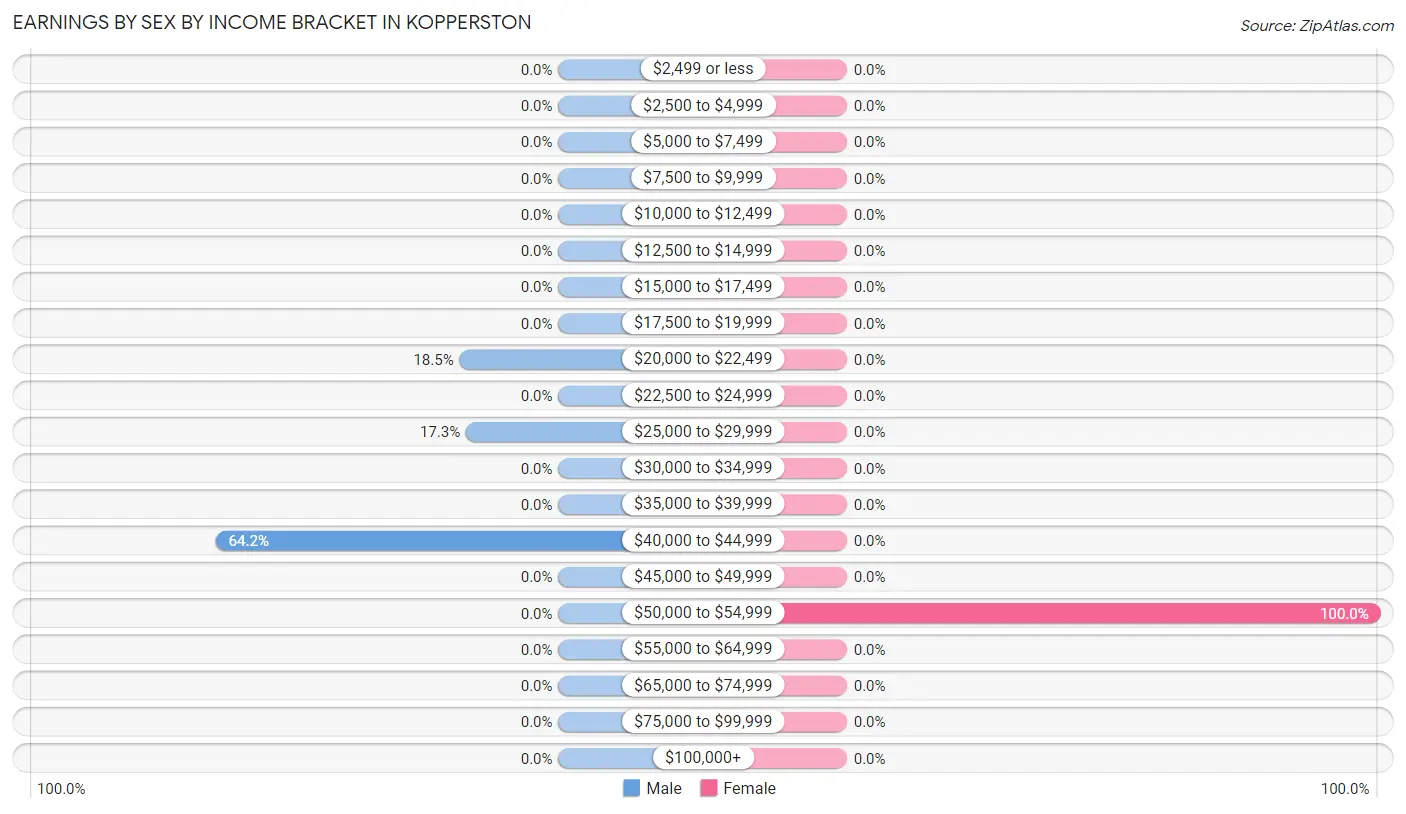
Earnings by Sex by Income Bracket in Kopperston
The most common earnings brackets in Kopperston are $40,000 to $44,999 for men (52 | 64.2%) and $50,000 to $54,999 for women (14 | 100.0%).
| Income | Male | Female |
| $2,499 or less | 0 (0.0%) | 0 (0.0%) |
| $2,500 to $4,999 | 0 (0.0%) | 0 (0.0%) |
| $5,000 to $7,499 | 0 (0.0%) | 0 (0.0%) |
| $7,500 to $9,999 | 0 (0.0%) | 0 (0.0%) |
| $10,000 to $12,499 | 0 (0.0%) | 0 (0.0%) |
| $12,500 to $14,999 | 0 (0.0%) | 0 (0.0%) |
| $15,000 to $17,499 | 0 (0.0%) | 0 (0.0%) |
| $17,500 to $19,999 | 0 (0.0%) | 0 (0.0%) |
| $20,000 to $22,499 | 15 (18.5%) | 0 (0.0%) |
| $22,500 to $24,999 | 0 (0.0%) | 0 (0.0%) |
| $25,000 to $29,999 | 14 (17.3%) | 0 (0.0%) |
| $30,000 to $34,999 | 0 (0.0%) | 0 (0.0%) |
| $35,000 to $39,999 | 0 (0.0%) | 0 (0.0%) |
| $40,000 to $44,999 | 52 (64.2%) | 0 (0.0%) |
| $45,000 to $49,999 | 0 (0.0%) | 0 (0.0%) |
| $50,000 to $54,999 | 0 (0.0%) | 14 (100.0%) |
| $55,000 to $64,999 | 0 (0.0%) | 0 (0.0%) |
| $65,000 to $74,999 | 0 (0.0%) | 0 (0.0%) |
| $75,000 to $99,999 | 0 (0.0%) | 0 (0.0%) |
| $100,000+ | 0 (0.0%) | 0 (0.0%) |
| Total | 81 (100.0%) | 14 (100.0%) |
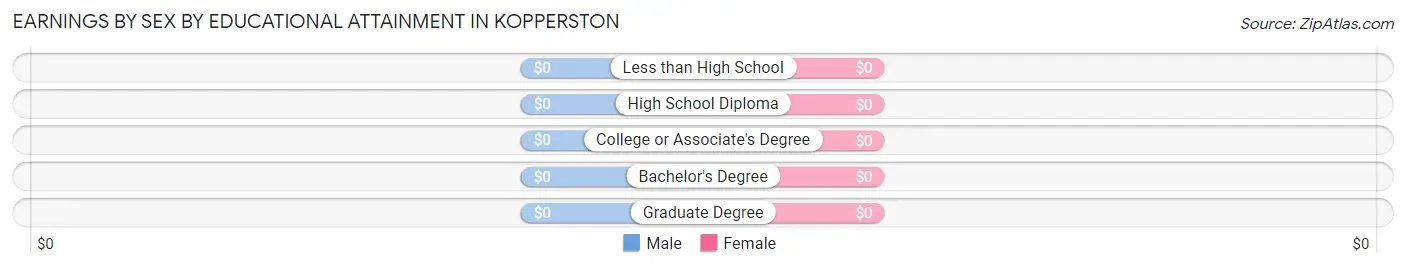
Earnings by Sex by Educational Attainment in Kopperston
| Educational Attainment | Male Income | Female Income |
| Less than High School | - | - |
| High School Diploma | - | - |
| College or Associate's Degree | - | - |
| Bachelor's Degree | - | - |
| Graduate Degree | - | - |
| Total | $43,053 | $0 |
Family Income in Kopperston
Family Income Brackets in Kopperston
According to the Kopperston family income data, there are 59 families falling into the $15,000 to $24,999 income range, which is the most common income bracket and makes up 34.7% of all families.
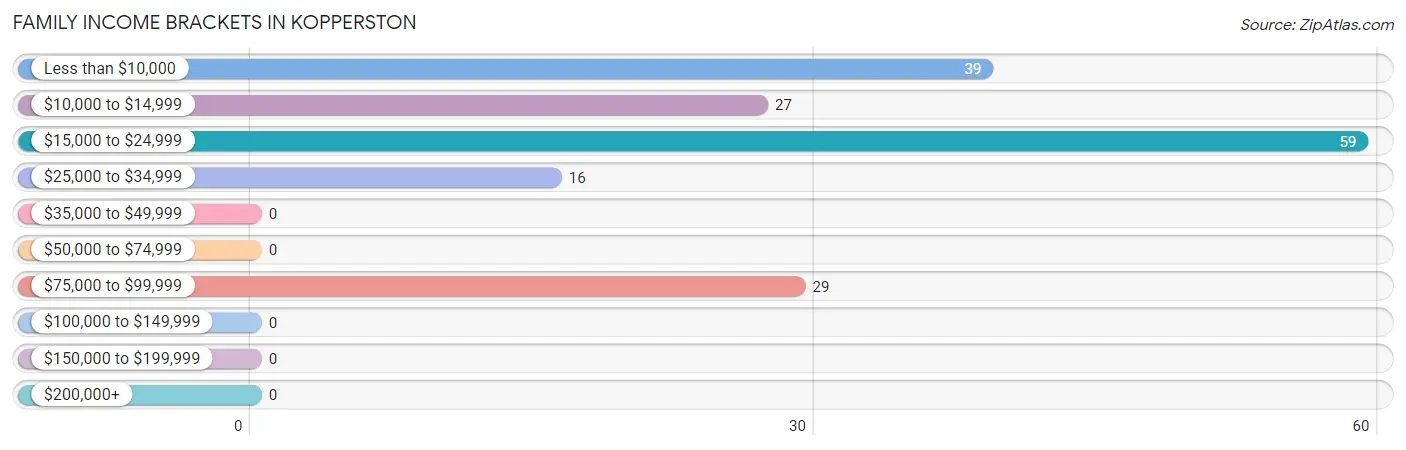
| Income Bracket | # Families | % Families |
| Less than $10,000 | 39 | 22.9% |
| $10,000 to $14,999 | 27 | 15.9% |
| $15,000 to $24,999 | 59 | 34.7% |
| $25,000 to $34,999 | 16 | 9.4% |
| $35,000 to $49,999 | 0 | 0.0% |
| $50,000 to $74,999 | 0 | 0.0% |
| $75,000 to $99,999 | 29 | 17.1% |
| $100,000 to $149,999 | 0 | 0.0% |
| $150,000 to $199,999 | 0 | 0.0% |
| $200,000+ | 0 | 0.0% |
Family Income by Famaliy Size in Kopperston
3-person families (100 | 58.8%) account for the highest median family income in Kopperston with $18,475 per family, while 3-person families (100 | 58.8%) have the highest median income of $6,158 per family member.
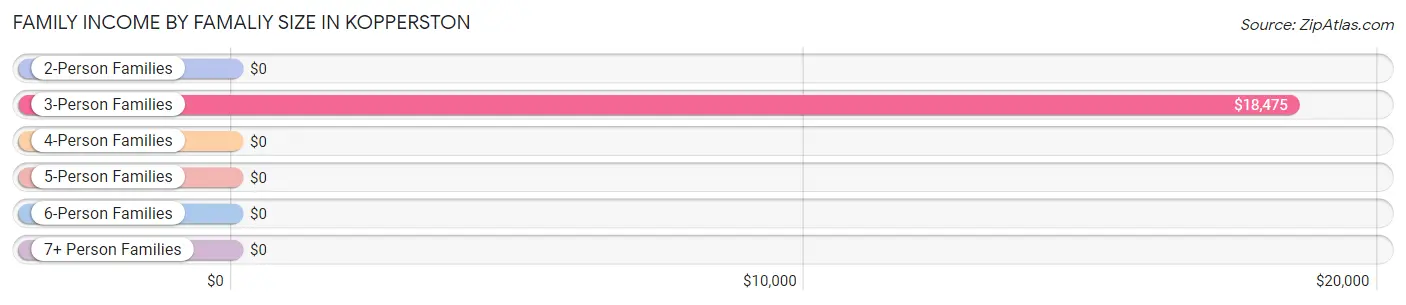
| Income Bracket | # Families | Median Income |
| 2-Person Families | 54 (31.8%) | $0 |
| 3-Person Families | 100 (58.8%) | $18,475 |
| 4-Person Families | 16 (9.4%) | $0 |
| 5-Person Families | 0 (0.0%) | $0 |
| 6-Person Families | 0 (0.0%) | $0 |
| 7+ Person Families | 0 (0.0%) | $0 |
| Total | 170 (100.0%) | $18,305 |
Family Income by Number of Earners in Kopperston
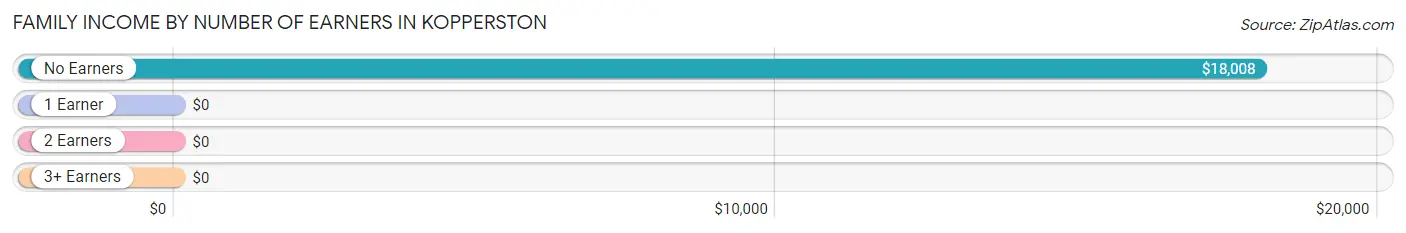
| Number of Earners | # Families | Median Income |
| No Earners | 156 (91.8%) | $18,008 |
| 1 Earner | 0 (0.0%) | $0 |
| 2 Earners | 14 (8.2%) | $0 |
| 3+ Earners | 0 (0.0%) | $0 |
| Total | 170 (100.0%) | $18,305 |
Household Income in Kopperston
Household Income Brackets in Kopperston
With 59 households falling in the category, the $15,000 to $24,999 income range is the most frequent in Kopperston, accounting for 24.4% of all households.
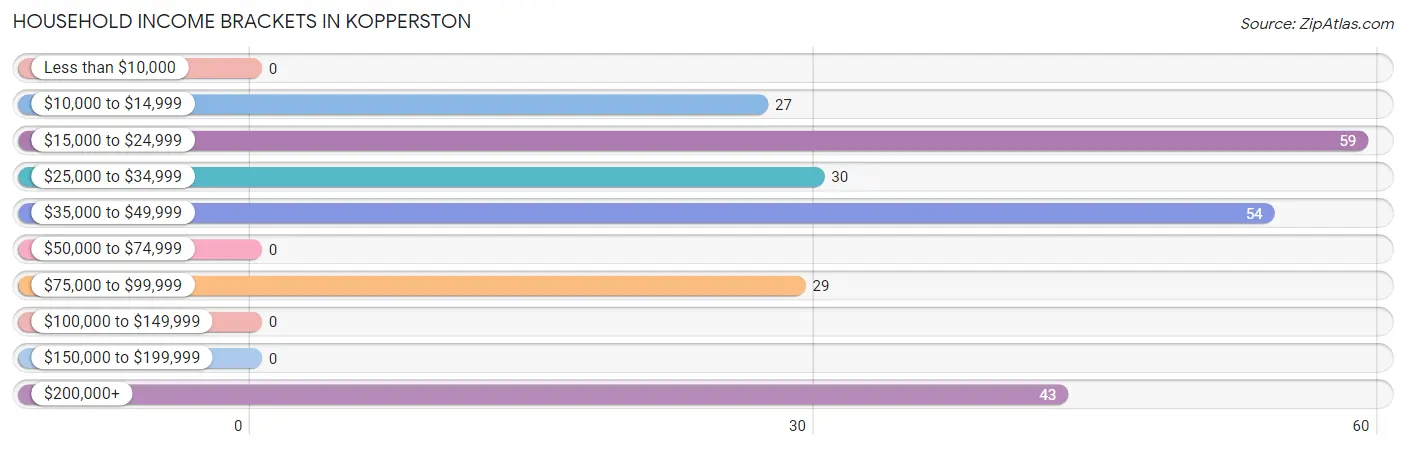
| Income Bracket | # Households | % Households |
| Less than $10,000 | 0 | 0.0% |
| $10,000 to $14,999 | 27 | 11.2% |
| $15,000 to $24,999 | 59 | 24.4% |
| $25,000 to $34,999 | 30 | 12.4% |
| $35,000 to $49,999 | 54 | 22.3% |
| $50,000 to $74,999 | 0 | 0.0% |
| $75,000 to $99,999 | 29 | 12.0% |
| $100,000 to $149,999 | 0 | 0.0% |
| $150,000 to $199,999 | 0 | 0.0% |
| $200,000+ | 43 | 17.8% |
Household Income by Householder Age in Kopperston
| Income Bracket | # Households | Median Income |
| 15 to 24 Years | 0 (0.0%) | $0 |
| 25 to 44 Years | 28 (11.6%) | $0 |
| 45 to 64 Years | 156 (64.5%) | $0 |
| 65+ Years | 58 (24.0%) | $0 |
| Total | 242 (100.0%) | $35,231 |
Poverty in Kopperston
Income Below Poverty by Sex and Age in Kopperston
With 43.4% poverty level for males and 74.6% for females among the residents of Kopperston, 12 to 14 year old males and under 5 year old females are the most vulnerable to poverty, with 20 males (100.0%) and 67 females (100.0%) in their respective age groups living below the poverty level.
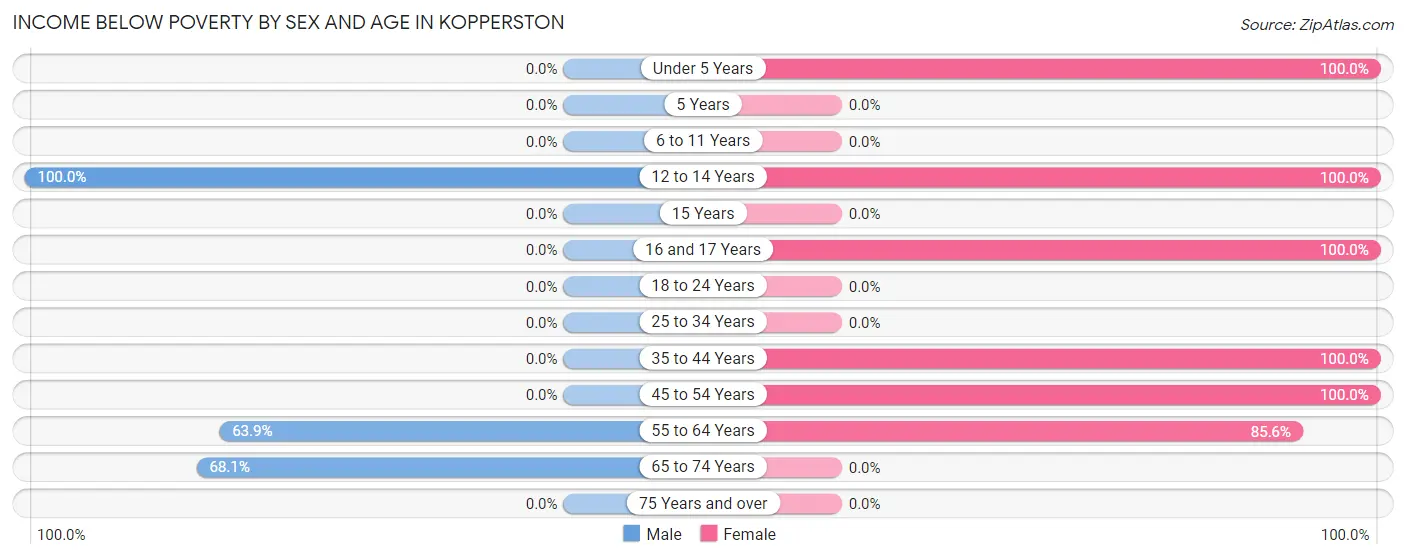
| Age Bracket | Male | Female |
| Under 5 Years | 0 (0.0%) | 67 (100.0%) |
| 5 Years | 0 (0.0%) | 0 (0.0%) |
| 6 to 11 Years | 0 (0.0%) | 0 (0.0%) |
| 12 to 14 Years | 20 (100.0%) | 29 (100.0%) |
| 15 Years | 0 (0.0%) | 0 (0.0%) |
| 16 and 17 Years | 0 (0.0%) | 43 (100.0%) |
| 18 to 24 Years | 0 (0.0%) | 0 (0.0%) |
| 25 to 34 Years | 0 (0.0%) | 0 (0.0%) |
| 35 to 44 Years | 0 (0.0%) | 85 (100.0%) |
| 45 to 54 Years | 0 (0.0%) | 55 (100.0%) |
| 55 to 64 Years | 76 (63.9%) | 83 (85.6%) |
| 65 to 74 Years | 32 (68.1%) | 0 (0.0%) |
| 75 Years and over | 0 (0.0%) | 0 (0.0%) |
| Total | 128 (43.4%) | 362 (74.6%) |
Income Above Poverty by Sex and Age in Kopperston
According to the poverty statistics in Kopperston, males aged 25 to 34 years and females aged 6 to 11 years are the age groups that are most secure financially, with 100.0% of males and 100.0% of females in these age groups living above the poverty line.
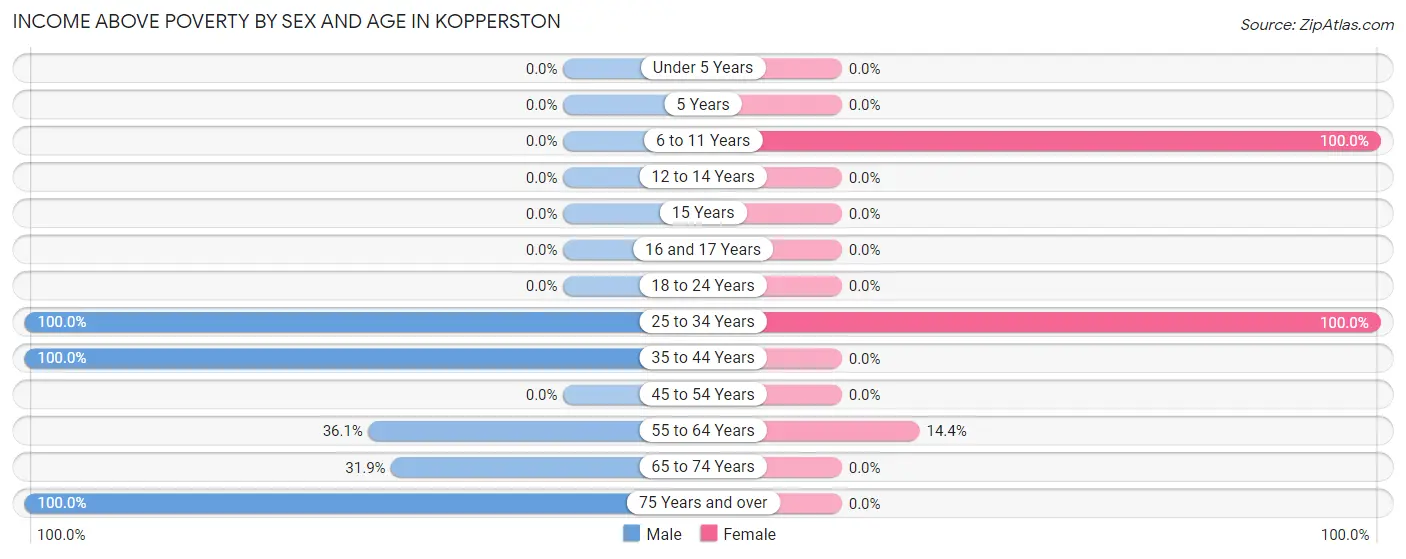
| Age Bracket | Male | Female |
| Under 5 Years | 0 (0.0%) | 0 (0.0%) |
| 5 Years | 0 (0.0%) | 0 (0.0%) |
| 6 to 11 Years | 0 (0.0%) | 95 (100.0%) |
| 12 to 14 Years | 0 (0.0%) | 0 (0.0%) |
| 15 Years | 0 (0.0%) | 0 (0.0%) |
| 16 and 17 Years | 0 (0.0%) | 0 (0.0%) |
| 18 to 24 Years | 0 (0.0%) | 0 (0.0%) |
| 25 to 34 Years | 52 (100.0%) | 14 (100.0%) |
| 35 to 44 Years | 14 (100.0%) | 0 (0.0%) |
| 45 to 54 Years | 0 (0.0%) | 0 (0.0%) |
| 55 to 64 Years | 43 (36.1%) | 14 (14.4%) |
| 65 to 74 Years | 15 (31.9%) | 0 (0.0%) |
| 75 Years and over | 43 (100.0%) | 0 (0.0%) |
| Total | 167 (56.6%) | 123 (25.4%) |
Income Below Poverty Among Married-Couple Families in Kopperston
The poverty statistics for married-couple families in Kopperston show that 77.9% or 102 of the total 131 families live below the poverty line. Families with 1 or 2 children have the highest poverty rate of 84.3%, comprising of 75 families. On the other hand, families with no children have the lowest poverty rate of 64.3%, which includes 27 families.
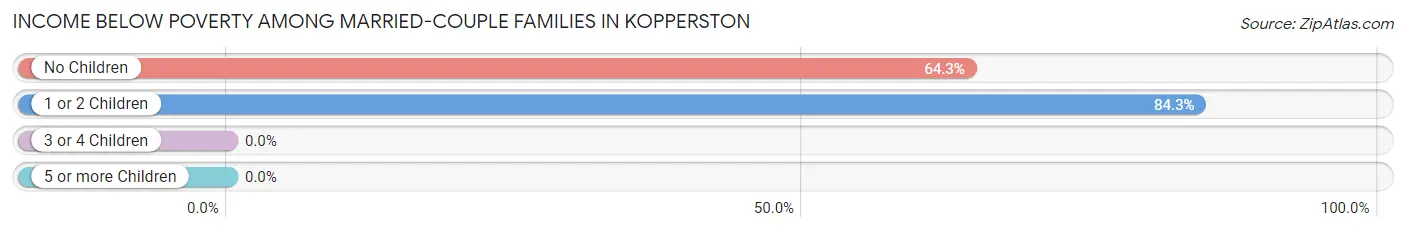
| Children | Above Poverty | Below Poverty |
| No Children | 15 (35.7%) | 27 (64.3%) |
| 1 or 2 Children | 14 (15.7%) | 75 (84.3%) |
| 3 or 4 Children | 0 (0.0%) | 0 (0.0%) |
| 5 or more Children | 0 (0.0%) | 0 (0.0%) |
| Total | 29 (22.1%) | 102 (77.9%) |
Income Below Poverty Among Single-Parent Households in Kopperston
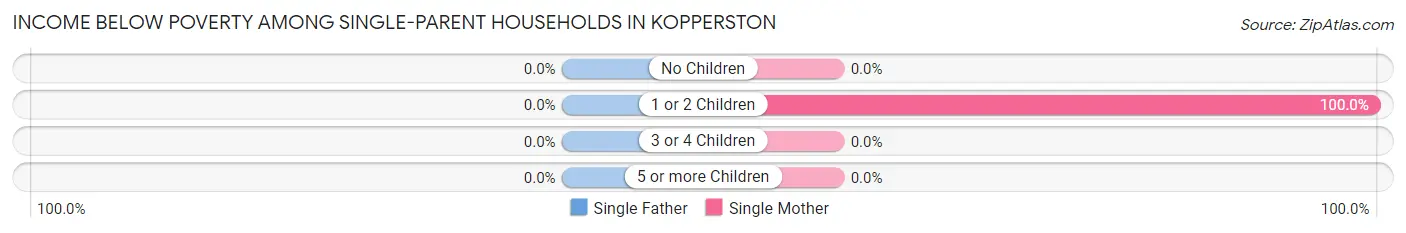
| Children | Single Father | Single Mother |
| No Children | 0 (0.0%) | 0 (0.0%) |
| 1 or 2 Children | 0 (0.0%) | 39 (100.0%) |
| 3 or 4 Children | 0 (0.0%) | 0 (0.0%) |
| 5 or more Children | 0 (0.0%) | 0 (0.0%) |
| Total | 0 (0.0%) | 39 (100.0%) |
Income Below Poverty Among Married-Couple vs Single-Parent Households in Kopperston
The poverty data for Kopperston shows that 102 of the married-couple family households (77.9%) and 39 of the single-parent households (100.0%) are living below the poverty level. Within the married-couple family households, those with 1 or 2 children have the highest poverty rate, with 75 households (84.3%) falling below the poverty line. Among the single-parent households, those with 1 or 2 children have the highest poverty rate, with 39 household (100.0%) living below poverty.
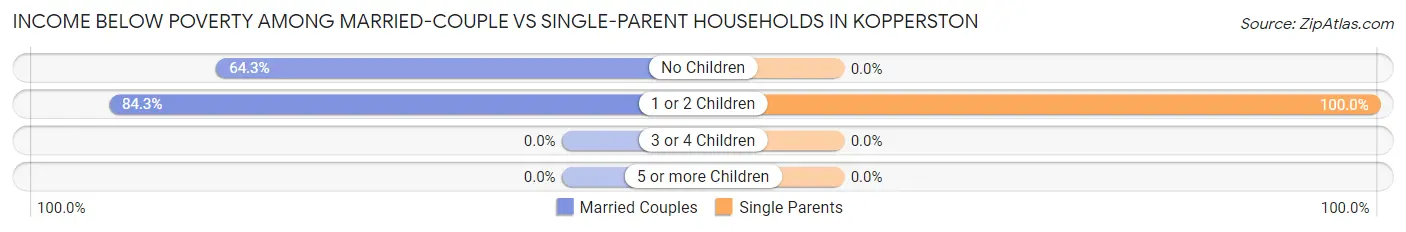
| Children | Married-Couple Families | Single-Parent Households |
| No Children | 27 (64.3%) | 0 (0.0%) |
| 1 or 2 Children | 75 (84.3%) | 39 (100.0%) |
| 3 or 4 Children | 0 (0.0%) | 0 (0.0%) |
| 5 or more Children | 0 (0.0%) | 0 (0.0%) |
| Total | 102 (77.9%) | 39 (100.0%) |
Race in Kopperston
The most populous races in Kopperston are White / Caucasian (633 | 81.1%), and Two or more Races (147 | 18.9%).
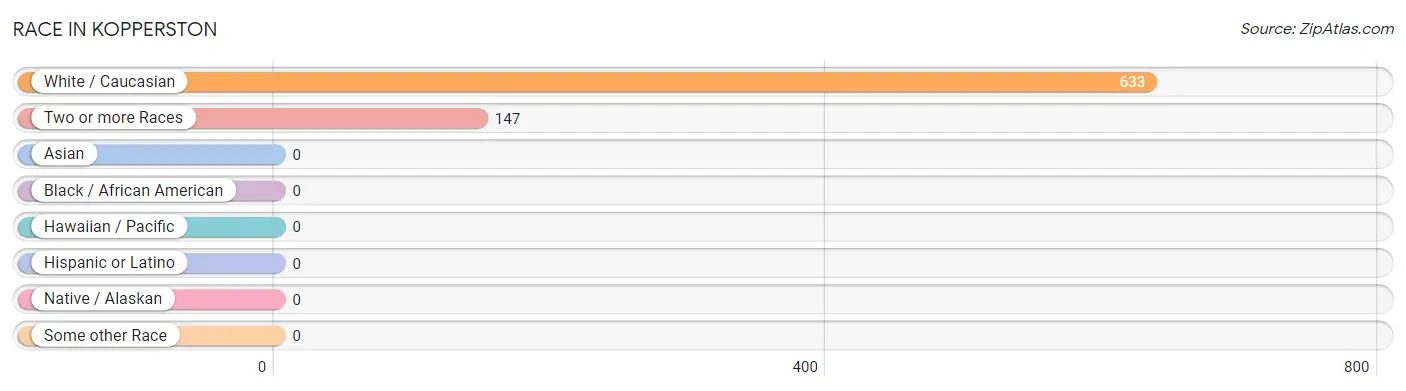
| Race | # Population | % Population |
| Asian | 0 | 0.0% |
| Black / African American | 0 | 0.0% |
| Hawaiian / Pacific | 0 | 0.0% |
| Hispanic or Latino | 0 | 0.0% |
| Native / Alaskan | 0 | 0.0% |
| White / Caucasian | 633 | 81.1% |
| Two or more Races | 147 | 18.9% |
| Some other Race | 0 | 0.0% |
| Total | 780 | 100.0% |
Ancestry in Kopperston
The most populous ancestries reported in Kopperston are English (320 | 41.0%), German (95 | 12.2%), Irish (57 | 7.3%), and Polish (14 | 1.8%), together accounting for 62.3% of all Kopperston residents.
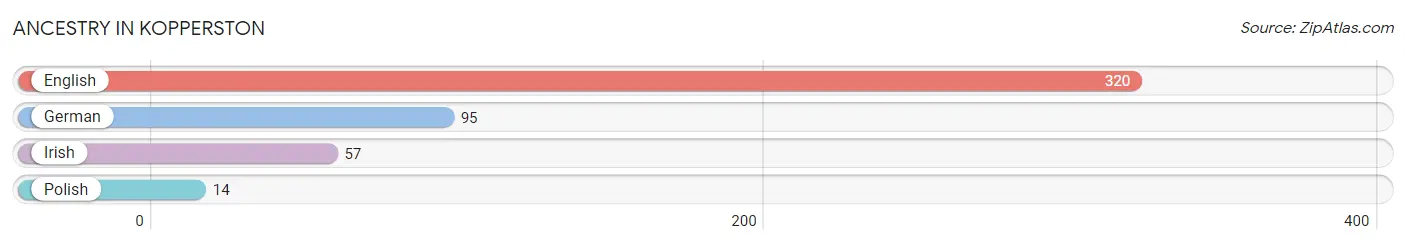
| Ancestry | # Population | % Population |
| English | 320 | 41.0% |
| German | 95 | 12.2% |
| Irish | 57 | 7.3% |
| Polish | 14 | 1.8% | View All 4 Rows |
Immigrants in Kopperston

| Immigration Origin | # Population | % Population | View All 0 Rows |
Sex and Age in Kopperston
Sex and Age in Kopperston
The most populous age groups in Kopperston are 55 to 59 Years (104 | 35.2%) for men and 5 to 9 Years (95 | 19.6%) for women.
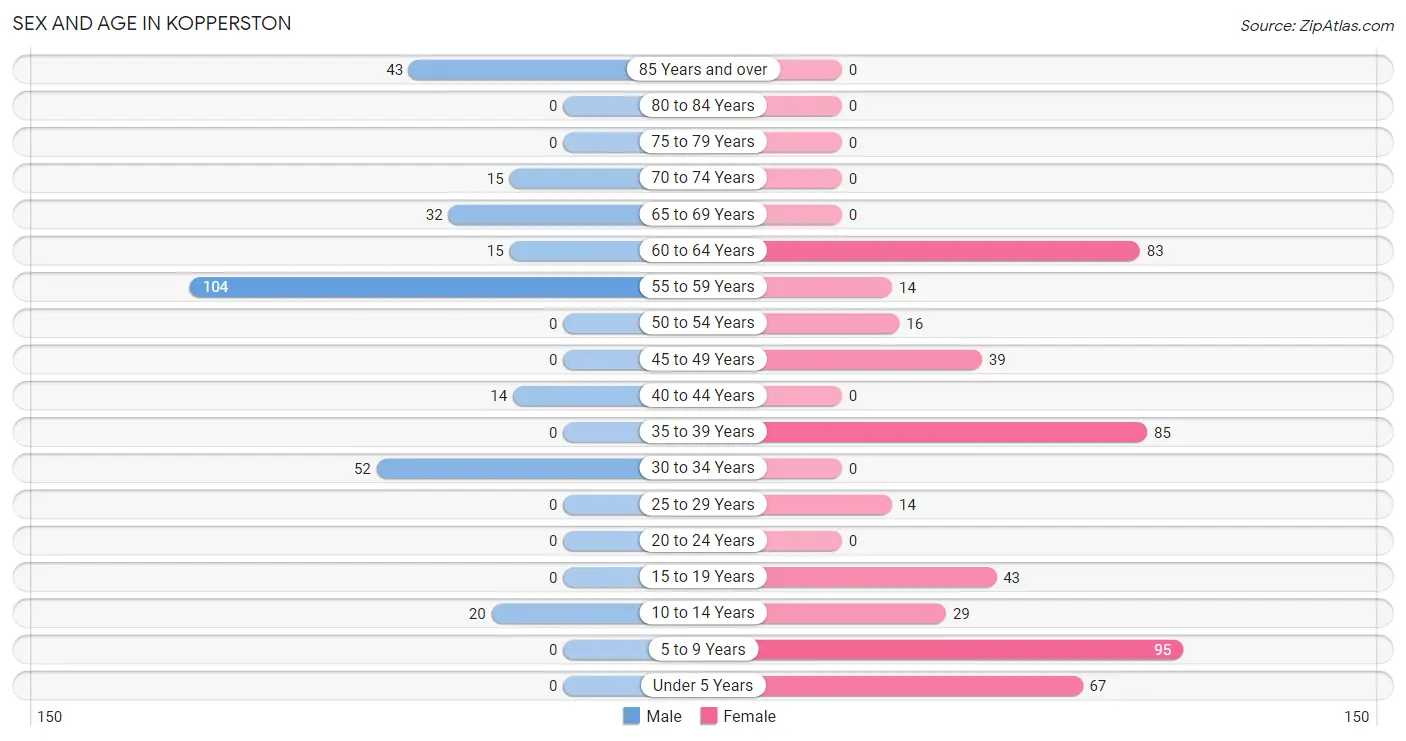
| Age Bracket | Male | Female |
| Under 5 Years | 0 (0.0%) | 67 (13.8%) |
| 5 to 9 Years | 0 (0.0%) | 95 (19.6%) |
| 10 to 14 Years | 20 (6.8%) | 29 (6.0%) |
| 15 to 19 Years | 0 (0.0%) | 43 (8.9%) |
| 20 to 24 Years | 0 (0.0%) | 0 (0.0%) |
| 25 to 29 Years | 0 (0.0%) | 14 (2.9%) |
| 30 to 34 Years | 52 (17.6%) | 0 (0.0%) |
| 35 to 39 Years | 0 (0.0%) | 85 (17.5%) |
| 40 to 44 Years | 14 (4.8%) | 0 (0.0%) |
| 45 to 49 Years | 0 (0.0%) | 39 (8.0%) |
| 50 to 54 Years | 0 (0.0%) | 16 (3.3%) |
| 55 to 59 Years | 104 (35.2%) | 14 (2.9%) |
| 60 to 64 Years | 15 (5.1%) | 83 (17.1%) |
| 65 to 69 Years | 32 (10.8%) | 0 (0.0%) |
| 70 to 74 Years | 15 (5.1%) | 0 (0.0%) |
| 75 to 79 Years | 0 (0.0%) | 0 (0.0%) |
| 80 to 84 Years | 0 (0.0%) | 0 (0.0%) |
| 85 Years and over | 43 (14.6%) | 0 (0.0%) |
| Total | 295 (100.0%) | 485 (100.0%) |
Families and Households in Kopperston
Median Family Size in Kopperston
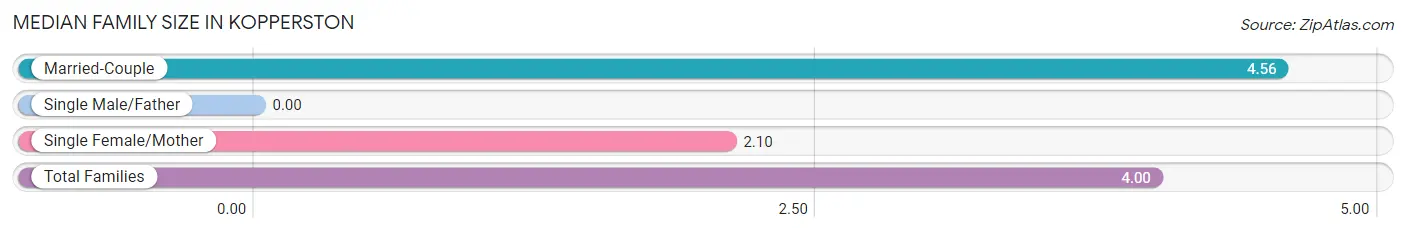
| Family Type | # Families | Family Size |
| Married-Couple | 131 (77.1%) | 4.56 |
| Single Male/Father | 0 (0.0%) | - |
| Single Female/Mother | 39 (22.9%) | 2.10 |
| Total Families | 170 (100.0%) | 4.00 |
Median Household Size in Kopperston
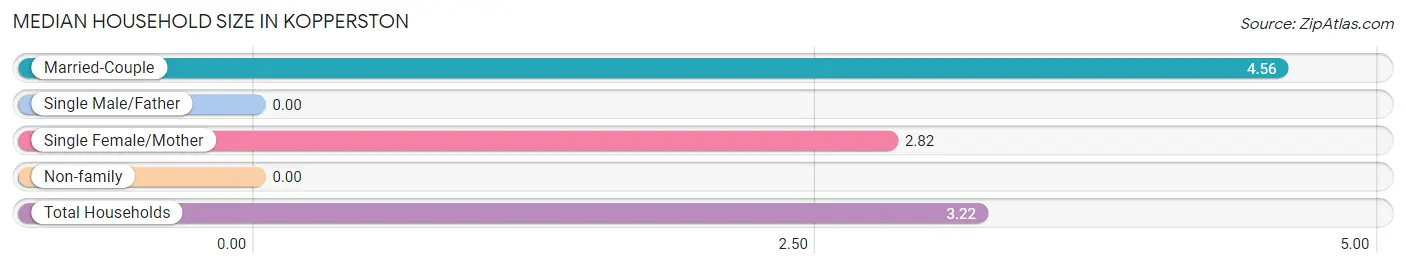
| Household Type | # Households | Household Size |
| Married-Couple | 131 (54.1%) | 4.56 |
| Single Male/Father | 0 (0.0%) | - |
| Single Female/Mother | 39 (16.1%) | 2.82 |
| Non-family | 72 (29.7%) | - |
| Total Households | 242 (100.0%) | 3.22 |
Household Size by Marriage Status in Kopperston
Out of a total of 242 households in Kopperston, 170 (70.3%) are family households, while 72 (29.7%) are nonfamily households. The most numerous type of family households are 3-person households, comprising 139, and the most common type of nonfamily households are 1-person households, comprising 72.
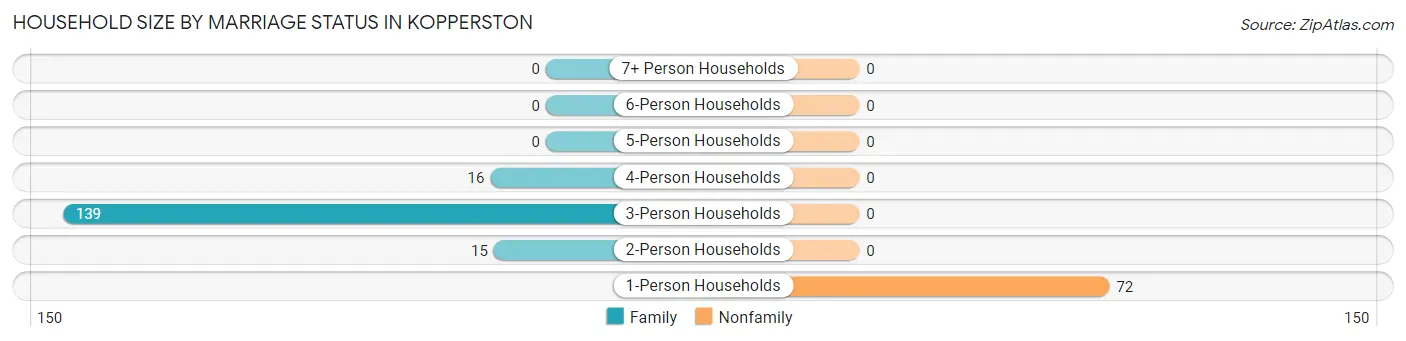
| Household Size | Family Households | Nonfamily Households |
| 1-Person Households | - | 72 (29.7%) |
| 2-Person Households | 15 (6.2%) | 0 (0.0%) |
| 3-Person Households | 139 (57.4%) | 0 (0.0%) |
| 4-Person Households | 16 (6.6%) | 0 (0.0%) |
| 5-Person Households | 0 (0.0%) | 0 (0.0%) |
| 6-Person Households | 0 (0.0%) | 0 (0.0%) |
| 7+ Person Households | 0 (0.0%) | 0 (0.0%) |
| Total | 170 (70.3%) | 72 (29.7%) |
Female Fertility in Kopperston
Fertility by Age in Kopperston
| Age Bracket | Women with Births | Births / 1,000 Women |
| 15 to 19 years | 0 (0.0%) | 0.0 |
| 20 to 34 years | 0 (0.0%) | 0.0 |
| 35 to 50 years | 0 (0.0%) | 0.0 |
| Total | 0 (0.0%) | 0.0 |
Fertility by Age by Marriage Status in Kopperston
| Age Bracket | Married | Unmarried |
| 15 to 19 years | 0 (0.0%) | 0 (0.0%) |
| 20 to 34 years | 0 (0.0%) | 0 (0.0%) |
| 35 to 50 years | 0 (0.0%) | 0 (0.0%) |
| Total | 0 (0.0%) | 0 (0.0%) |
Fertility by Education in Kopperston
| Educational Attainment | Women with Births | Births / 1,000 Women |
| Less than High School | 0 (0.0%) | 0.0 |
| High School Diploma | 0 (0.0%) | 0.0 |
| College or Associate's Degree | 0 (0.0%) | 0.0 |
| Bachelor's Degree | 0 (0.0%) | 0.0 |
| Graduate Degree | 0 (0.0%) | 0.0 |
| Total | 0 (0.0%) | 0.0 |
Fertility by Education by Marriage Status in Kopperston
| Educational Attainment | Married | Unmarried |
| Less than High School | 0 (0.0%) | 0 (0.0%) |
| High School Diploma | 0 (0.0%) | 0 (0.0%) |
| College or Associate's Degree | 0 (0.0%) | 0 (0.0%) |
| Bachelor's Degree | 0 (0.0%) | 0 (0.0%) |
| Graduate Degree | 0 (0.0%) | 0 (0.0%) |
| Total | 0 (0.0%) | 0 (0.0%) |
Employment Characteristics in Kopperston
Employment by Class of Employer in Kopperston
Among the 95 employed individuals in Kopperston, , and private company employees (95 | 100.0%) make up the most common classes of employment.
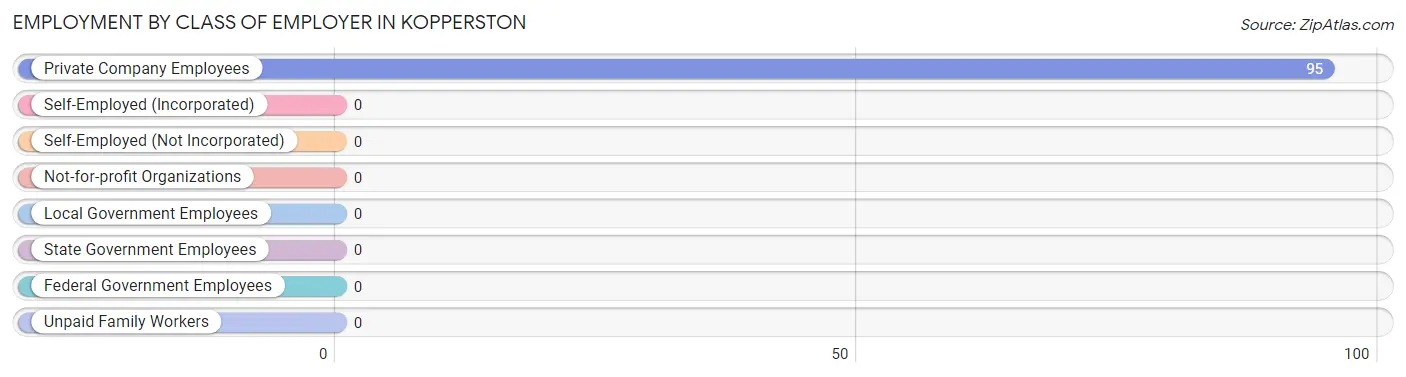
| Employer Class | # Employees | % Employees |
| Private Company Employees | 95 | 100.0% |
| Self-Employed (Incorporated) | 0 | 0.0% |
| Self-Employed (Not Incorporated) | 0 | 0.0% |
| Not-for-profit Organizations | 0 | 0.0% |
| Local Government Employees | 0 | 0.0% |
| State Government Employees | 0 | 0.0% |
| Federal Government Employees | 0 | 0.0% |
| Unpaid Family Workers | 0 | 0.0% |
| Total | 95 | 100.0% |
Employment Status by Age in Kopperston
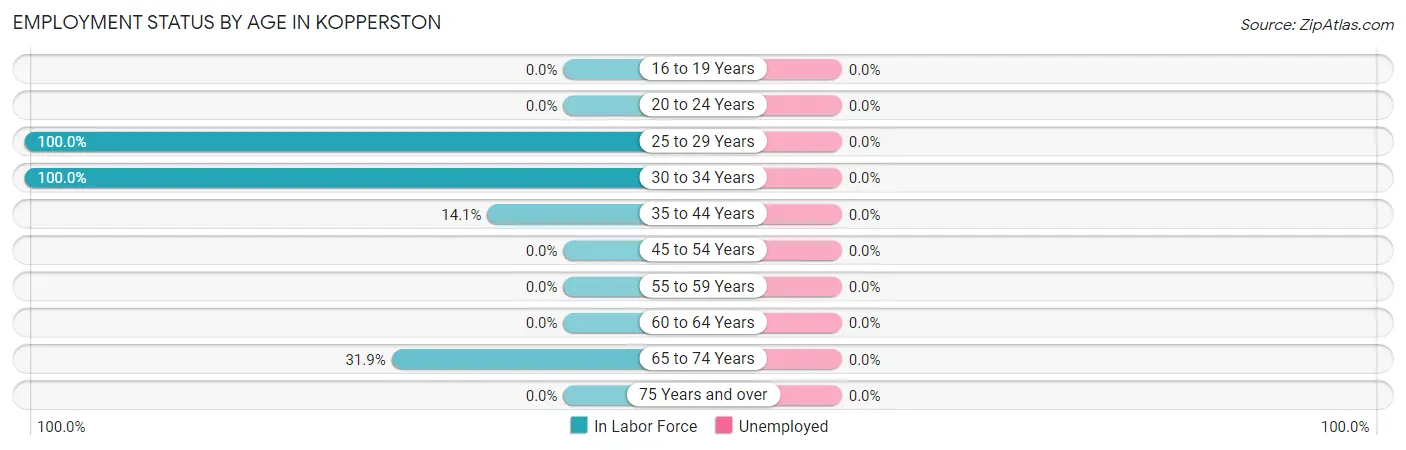
| Age Bracket | In Labor Force | Unemployed |
| 16 to 19 Years | 0 (0.0%) | 0 (0.0%) |
| 20 to 24 Years | 0 (0.0%) | 0 (0.0%) |
| 25 to 29 Years | 14 (100.0%) | 0 (0.0%) |
| 30 to 34 Years | 52 (100.0%) | 0 (0.0%) |
| 35 to 44 Years | 14 (14.1%) | 0 (0.0%) |
| 45 to 54 Years | 0 (0.0%) | 0 (0.0%) |
| 55 to 59 Years | 0 (0.0%) | 0 (0.0%) |
| 60 to 64 Years | 0 (0.0%) | 0 (0.0%) |
| 65 to 74 Years | 15 (31.9%) | 0 (0.0%) |
| 75 Years and over | 0 (0.0%) | 0 (0.0%) |
| Total | 95 (16.7%) | 0 (0.0%) |
Employment Status by Educational Attainment in Kopperston
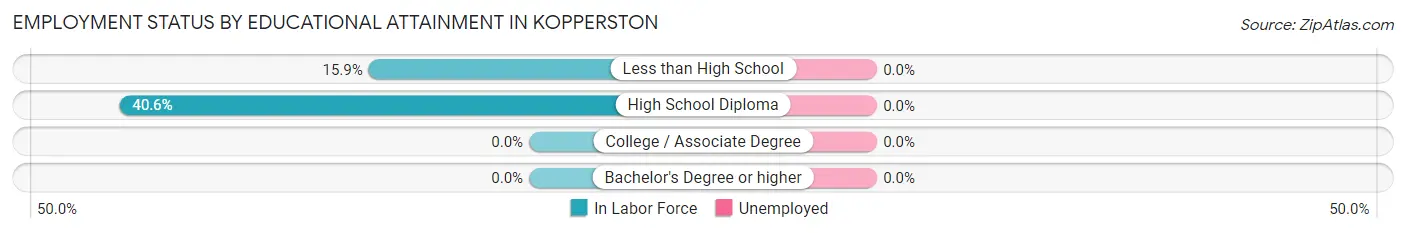
| Educational Attainment | In Labor Force | Unemployed |
| Less than High School | 52 (15.9%) | 0 (0.0%) |
| High School Diploma | 28 (40.6%) | 0 (0.0%) |
| College / Associate Degree | 0 (0.0%) | 0 (0.0%) |
| Bachelor's Degree or higher | 0 (0.0%) | 0 (0.0%) |
| Total | 80 (18.3%) | 0 (0.0%) |
Employment Occupations by Sex in Kopperston
Management, Business, Science and Arts Occupations
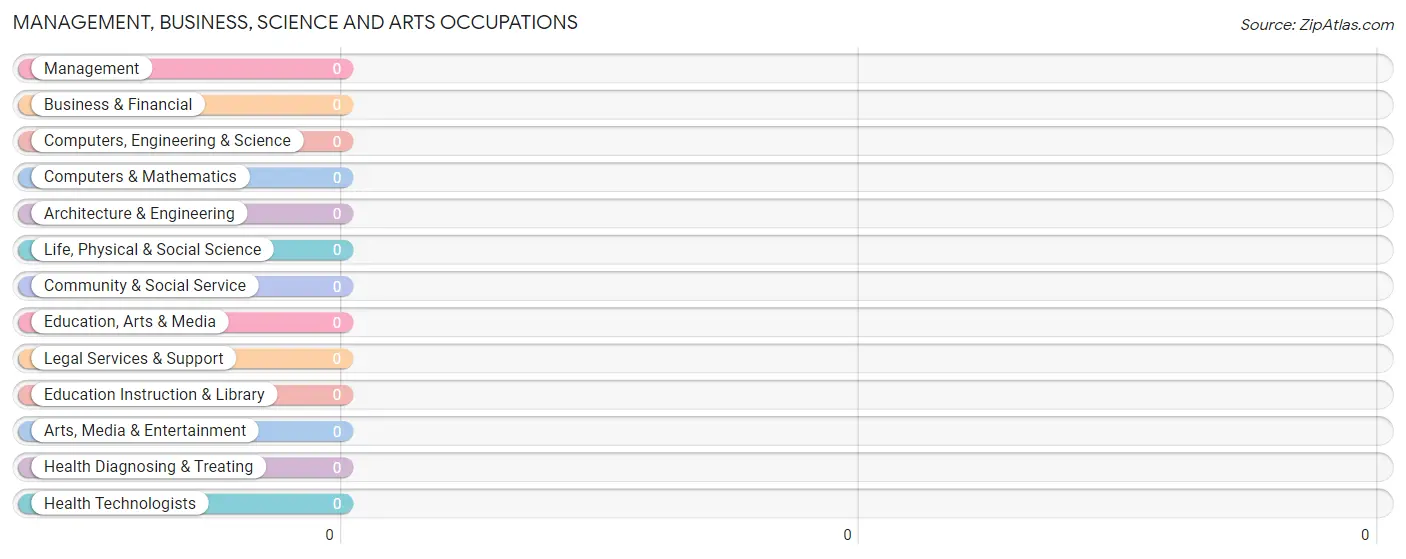
Management, Business, Science and Arts Occupations by Sex
| Occupation | Male | Female |
| Management | 0 (0.0%) | 0 (0.0%) |
| Business & Financial | 0 (0.0%) | 0 (0.0%) |
| Computers, Engineering & Science | 0 (0.0%) | 0 (0.0%) |
| Computers & Mathematics | 0 (0.0%) | 0 (0.0%) |
| Architecture & Engineering | 0 (0.0%) | 0 (0.0%) |
| Life, Physical & Social Science | 0 (0.0%) | 0 (0.0%) |
| Community & Social Service | 0 (0.0%) | 0 (0.0%) |
| Education, Arts & Media | 0 (0.0%) | 0 (0.0%) |
| Legal Services & Support | 0 (0.0%) | 0 (0.0%) |
| Education Instruction & Library | 0 (0.0%) | 0 (0.0%) |
| Arts, Media & Entertainment | 0 (0.0%) | 0 (0.0%) |
| Health Diagnosing & Treating | 0 (0.0%) | 0 (0.0%) |
| Health Technologists | 0 (0.0%) | 0 (0.0%) |
| Total (Category) | 0 (0.0%) | 0 (0.0%) |
| Total (Overall) | 81 (85.3%) | 14 (14.7%) |
Services Occupations
Services Occupations by Sex
| Occupation | Male | Female |
| Healthcare Support | 0 (0.0%) | 0 (0.0%) |
| Security & Protection | 0 (0.0%) | 0 (0.0%) |
| Firefighting & Prevention | 0 (0.0%) | 0 (0.0%) |
| Law Enforcement | 0 (0.0%) | 0 (0.0%) |
| Food Preparation & Serving | 0 (0.0%) | 0 (0.0%) |
| Cleaning & Maintenance | 0 (0.0%) | 0 (0.0%) |
| Personal Care & Service | 0 (0.0%) | 0 (0.0%) |
| Total (Category) | 0 (0.0%) | 0 (0.0%) |
| Total (Overall) | 81 (85.3%) | 14 (14.7%) |
Sales and Office Occupations
Sales and Office Occupations by Sex
| Occupation | Male | Female |
| Sales & Related | 0 (0.0%) | 0 (0.0%) |
| Office & Administration | 0 (0.0%) | 0 (0.0%) |
| Total (Category) | 0 (0.0%) | 0 (0.0%) |
| Total (Overall) | 81 (85.3%) | 14 (14.7%) |
Natural Resources, Construction and Maintenance Occupations
The most common Natural Resources, Construction and Maintenance occupations in Kopperston are , and Installation, Maintenance & Repair (14 | 14.7%).
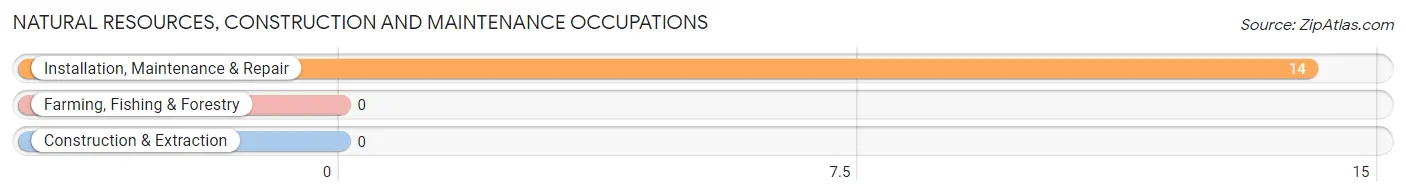
Natural Resources, Construction and Maintenance Occupations by Sex
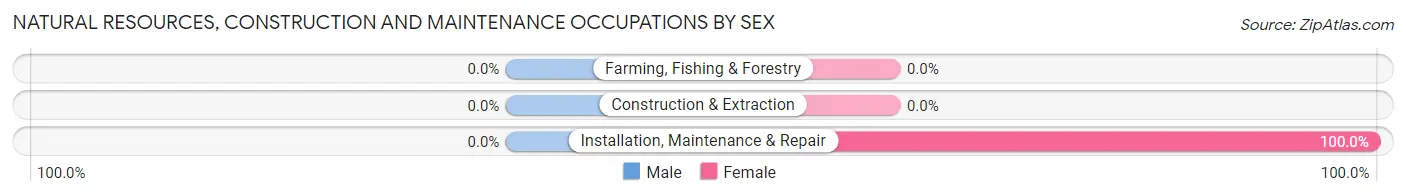
| Occupation | Male | Female |
| Farming, Fishing & Forestry | 0 (0.0%) | 0 (0.0%) |
| Construction & Extraction | 0 (0.0%) | 0 (0.0%) |
| Installation, Maintenance & Repair | 0 (0.0%) | 14 (100.0%) |
| Total (Category) | 0 (0.0%) | 14 (100.0%) |
| Total (Overall) | 81 (85.3%) | 14 (14.7%) |
Production, Transportation and Moving Occupations
The most common Production, Transportation and Moving occupations in Kopperston are Transportation (52 | 54.7%), Production (15 | 15.8%), and Material Moving (14 | 14.7%).
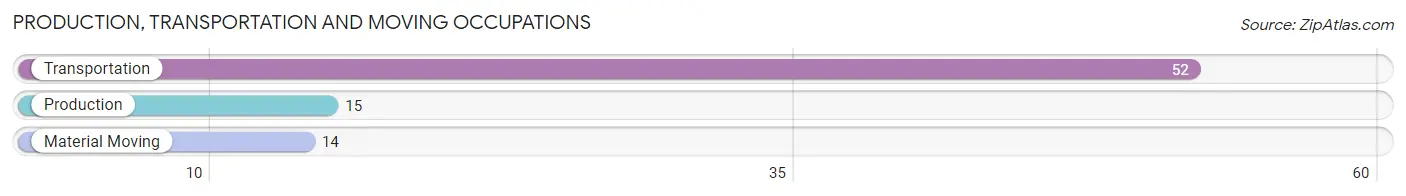
Production, Transportation and Moving Occupations by Sex
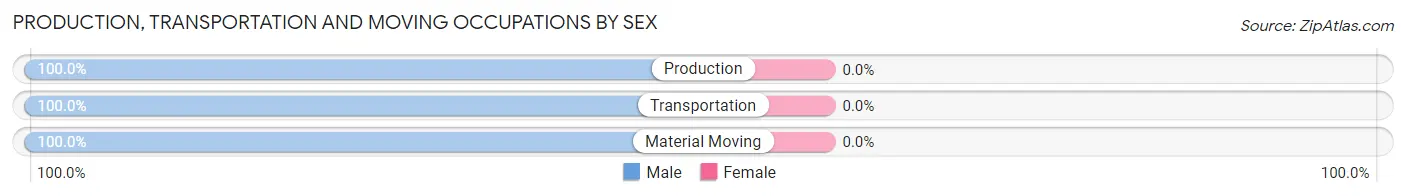
| Occupation | Male | Female |
| Production | 15 (100.0%) | 0 (0.0%) |
| Transportation | 52 (100.0%) | 0 (0.0%) |
| Material Moving | 14 (100.0%) | 0 (0.0%) |
| Total (Category) | 81 (100.0%) | 0 (0.0%) |
| Total (Overall) | 81 (85.3%) | 14 (14.7%) |
Employment Industries by Sex in Kopperston
Employment Industries in Kopperston
The major employment industries in Kopperston include Wholesale Trade (52 | 54.7%), Retail Trade (29 | 30.5%), and Information (14 | 14.7%).
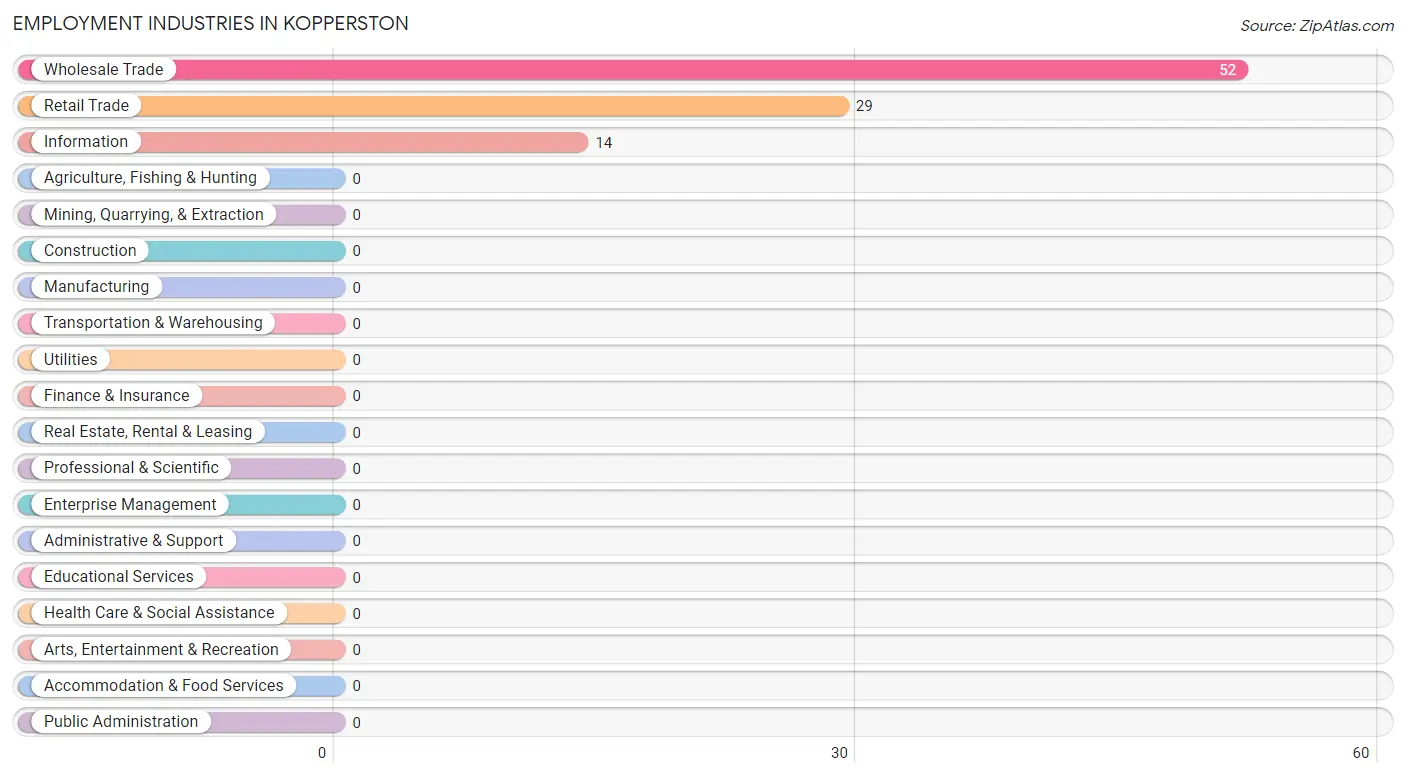
Employment Industries by Sex in Kopperston
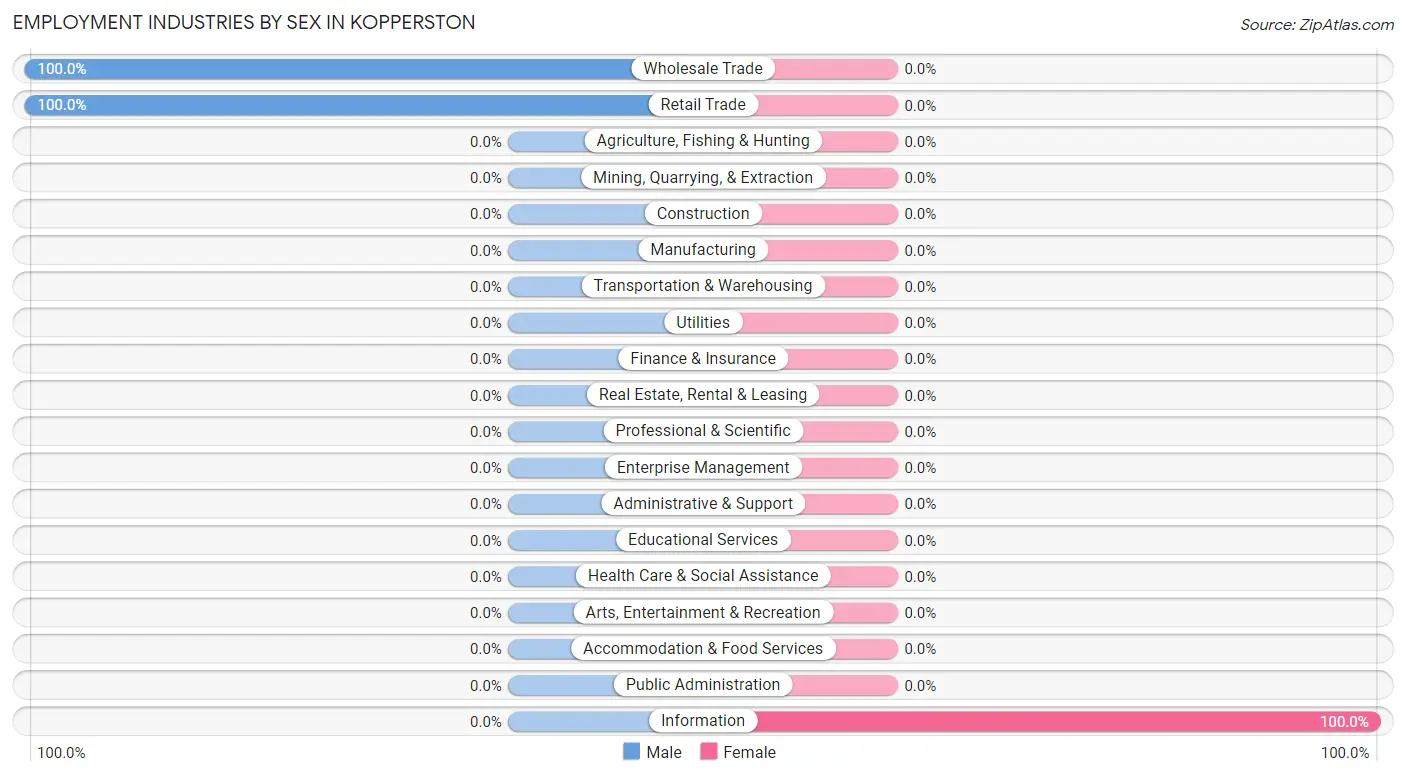
| Industry | Male | Female |
| Agriculture, Fishing & Hunting | 0 (0.0%) | 0 (0.0%) |
| Mining, Quarrying, & Extraction | 0 (0.0%) | 0 (0.0%) |
| Construction | 0 (0.0%) | 0 (0.0%) |
| Manufacturing | 0 (0.0%) | 0 (0.0%) |
| Wholesale Trade | 52 (100.0%) | 0 (0.0%) |
| Retail Trade | 29 (100.0%) | 0 (0.0%) |
| Transportation & Warehousing | 0 (0.0%) | 0 (0.0%) |
| Utilities | 0 (0.0%) | 0 (0.0%) |
| Information | 0 (0.0%) | 14 (100.0%) |
| Finance & Insurance | 0 (0.0%) | 0 (0.0%) |
| Real Estate, Rental & Leasing | 0 (0.0%) | 0 (0.0%) |
| Professional & Scientific | 0 (0.0%) | 0 (0.0%) |
| Enterprise Management | 0 (0.0%) | 0 (0.0%) |
| Administrative & Support | 0 (0.0%) | 0 (0.0%) |
| Educational Services | 0 (0.0%) | 0 (0.0%) |
| Health Care & Social Assistance | 0 (0.0%) | 0 (0.0%) |
| Arts, Entertainment & Recreation | 0 (0.0%) | 0 (0.0%) |
| Accommodation & Food Services | 0 (0.0%) | 0 (0.0%) |
| Public Administration | 0 (0.0%) | 0 (0.0%) |
| Total | 81 (85.3%) | 14 (14.7%) |
Education in Kopperston
School Enrollment in Kopperston
The most common levels of schooling among the 144 students in Kopperston are elementary school (95 | 66.0%), and middle school (49 | 34.0%).
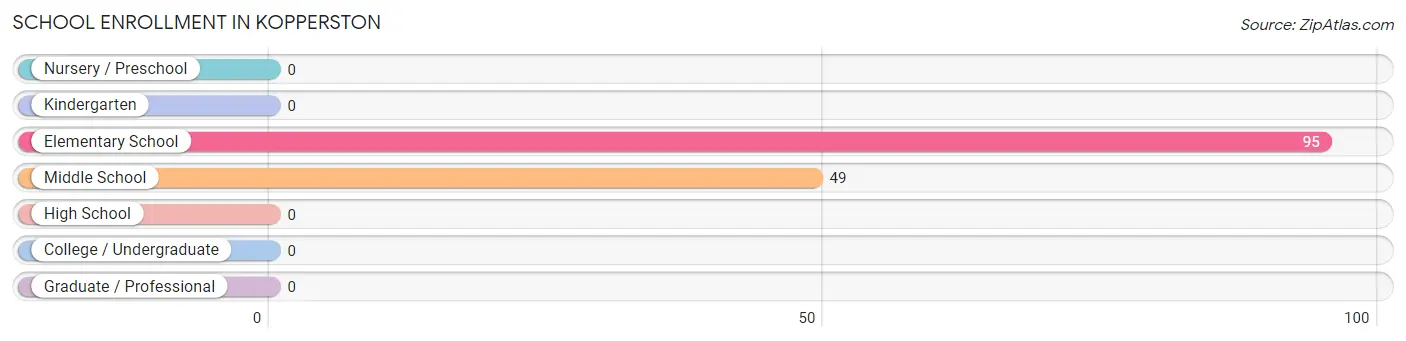
| School Level | # Students | % Students |
| Nursery / Preschool | 0 | 0.0% |
| Kindergarten | 0 | 0.0% |
| Elementary School | 95 | 66.0% |
| Middle School | 49 | 34.0% |
| High School | 0 | 0.0% |
| College / Undergraduate | 0 | 0.0% |
| Graduate / Professional | 0 | 0.0% |
| Total | 144 | 100.0% |
School Enrollment by Age by Funding Source in Kopperston
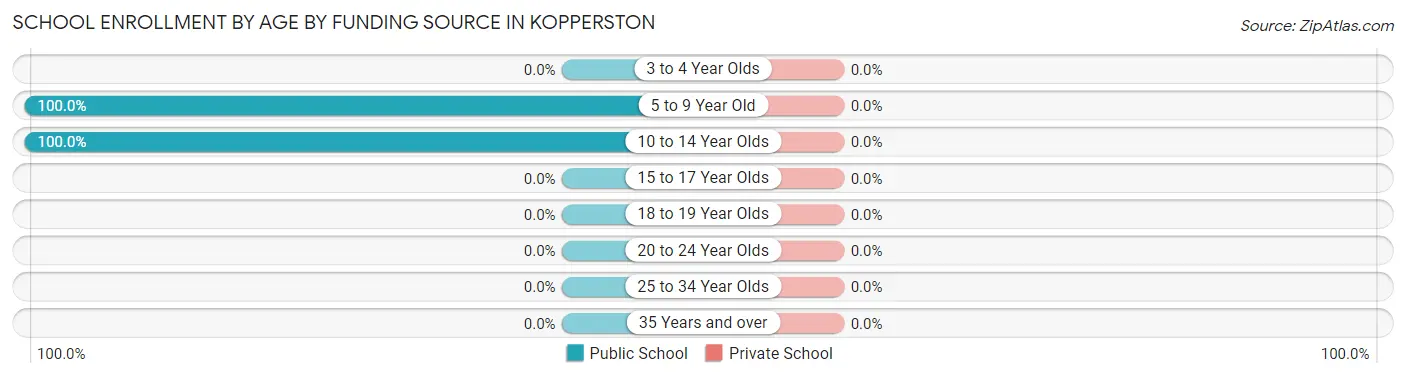
| Age Bracket | Public School | Private School |
| 3 to 4 Year Olds | 0 (0.0%) | 0 (0.0%) |
| 5 to 9 Year Old | 95 (100.0%) | 0 (0.0%) |
| 10 to 14 Year Olds | 49 (100.0%) | 0 (0.0%) |
| 15 to 17 Year Olds | 0 (0.0%) | 0 (0.0%) |
| 18 to 19 Year Olds | 0 (0.0%) | 0 (0.0%) |
| 20 to 24 Year Olds | 0 (0.0%) | 0 (0.0%) |
| 25 to 34 Year Olds | 0 (0.0%) | 0 (0.0%) |
| 35 Years and over | 0 (0.0%) | 0 (0.0%) |
| Total | 144 (100.0%) | 0 (0.0%) |
Educational Attainment by Field of Study in Kopperston
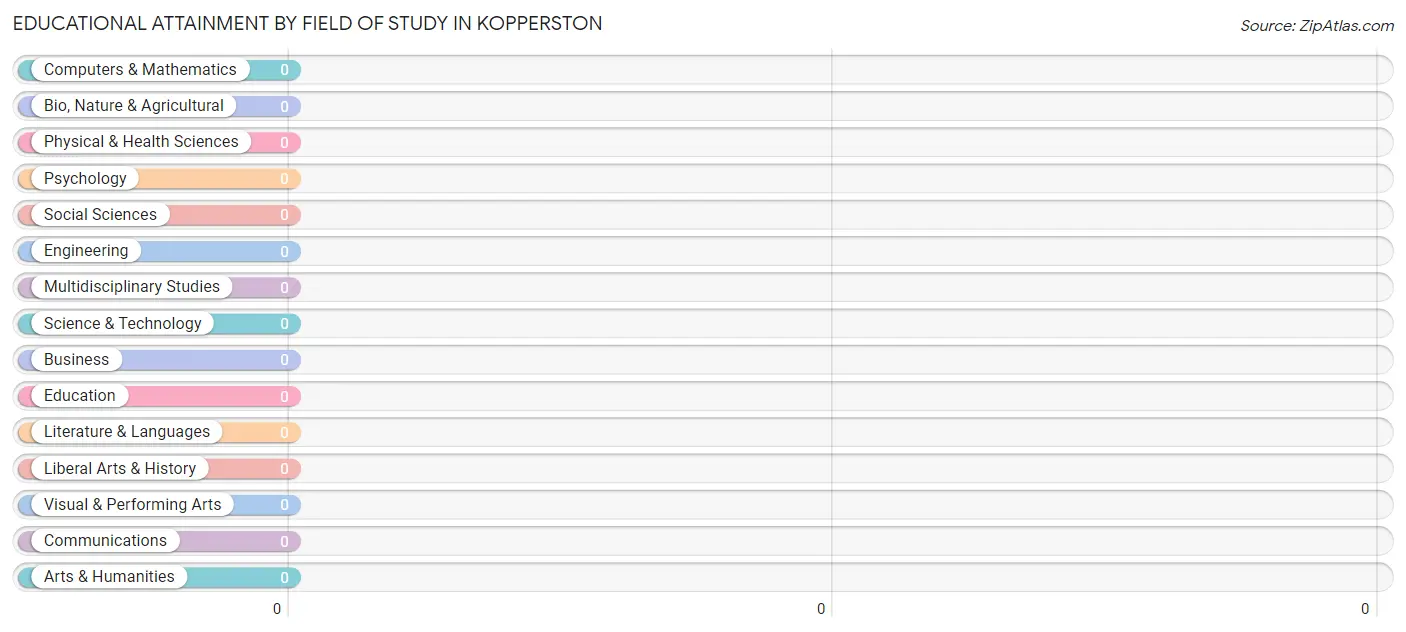
| Field of Study | # Graduates | % Graduates |
| Computers & Mathematics | 0 | 0.0% |
| Bio, Nature & Agricultural | 0 | 0.0% |
| Physical & Health Sciences | 0 | 0.0% |
| Psychology | 0 | 0.0% |
| Social Sciences | 0 | 0.0% |
| Engineering | 0 | 0.0% |
| Multidisciplinary Studies | 0 | 0.0% |
| Science & Technology | 0 | 0.0% |
| Business | 0 | 0.0% |
| Education | 0 | 0.0% |
| Literature & Languages | 0 | 0.0% |
| Liberal Arts & History | 0 | 0.0% |
| Visual & Performing Arts | 0 | 0.0% |
| Communications | 0 | 0.0% |
| Arts & Humanities | 0 | 0.0% |
| Total | 0 | 0.0% |
Transportation & Commute in Kopperston
Vehicle Availability by Sex in Kopperston
The most prevalent vehicle ownership categories in Kopperston are males with 1 vehicle (66, accounting for 81.5%) and females with 1 vehicle (14, making up 471.4%).
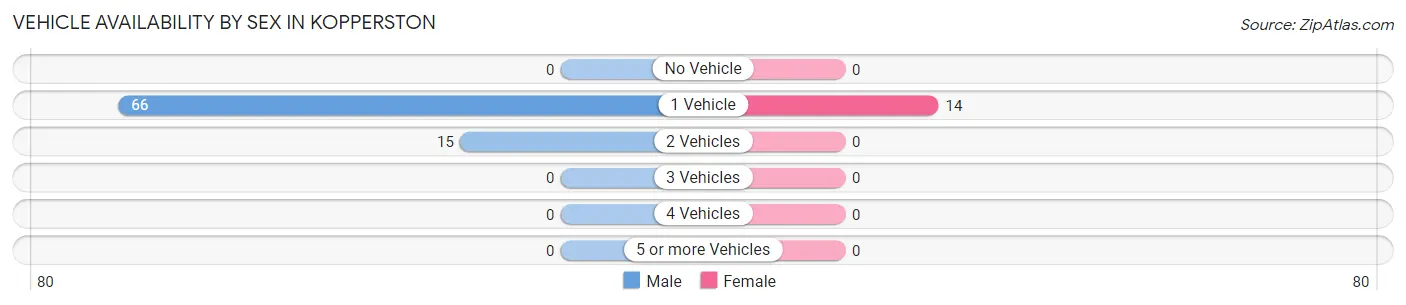
| Vehicles Available | Male | Female |
| No Vehicle | 0 (0.0%) | 0 (0.0%) |
| 1 Vehicle | 66 (81.5%) | 14 (100.0%) |
| 2 Vehicles | 15 (18.5%) | 0 (0.0%) |
| 3 Vehicles | 0 (0.0%) | 0 (0.0%) |
| 4 Vehicles | 0 (0.0%) | 0 (0.0%) |
| 5 or more Vehicles | 0 (0.0%) | 0 (0.0%) |
| Total | 81 (100.0%) | 14 (100.0%) |
Commute Time in Kopperston
The most frequently occuring commute durations in Kopperston are 45 to 59 minutes (52 commuters, 64.2%), 10 to 14 minutes (15 commuters, 18.5%), and 30 to 34 minutes (14 commuters, 17.3%).
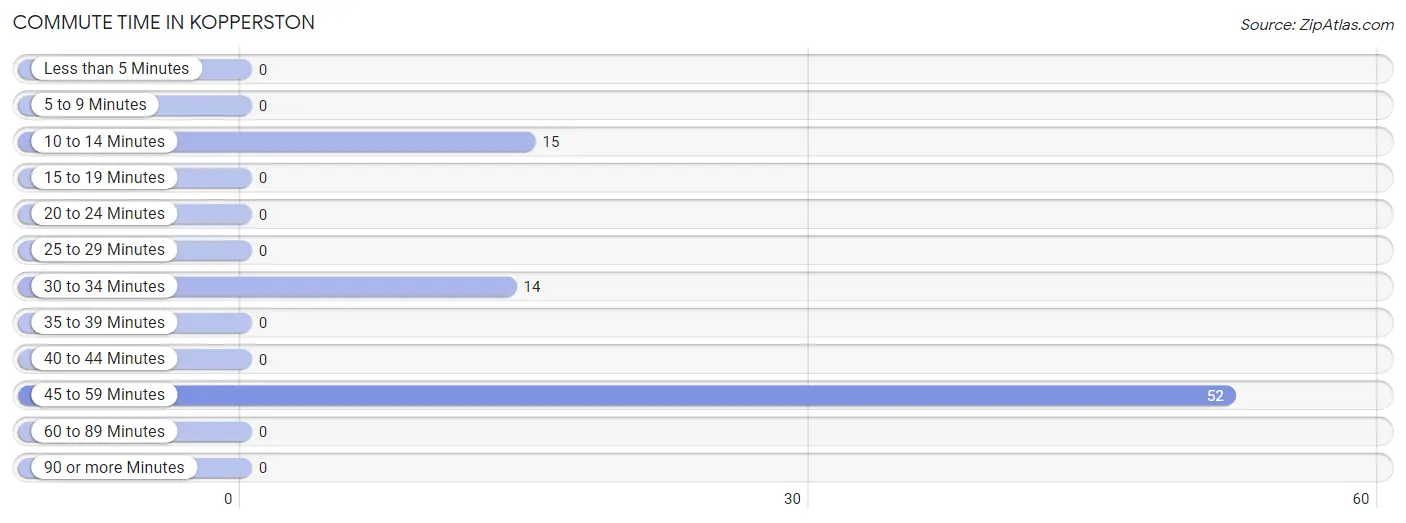
| Commute Time | # Commuters | % Commuters |
| Less than 5 Minutes | 0 | 0.0% |
| 5 to 9 Minutes | 0 | 0.0% |
| 10 to 14 Minutes | 15 | 18.5% |
| 15 to 19 Minutes | 0 | 0.0% |
| 20 to 24 Minutes | 0 | 0.0% |
| 25 to 29 Minutes | 0 | 0.0% |
| 30 to 34 Minutes | 14 | 17.3% |
| 35 to 39 Minutes | 0 | 0.0% |
| 40 to 44 Minutes | 0 | 0.0% |
| 45 to 59 Minutes | 52 | 64.2% |
| 60 to 89 Minutes | 0 | 0.0% |
| 90 or more Minutes | 0 | 0.0% |
Commute Time by Sex in Kopperston
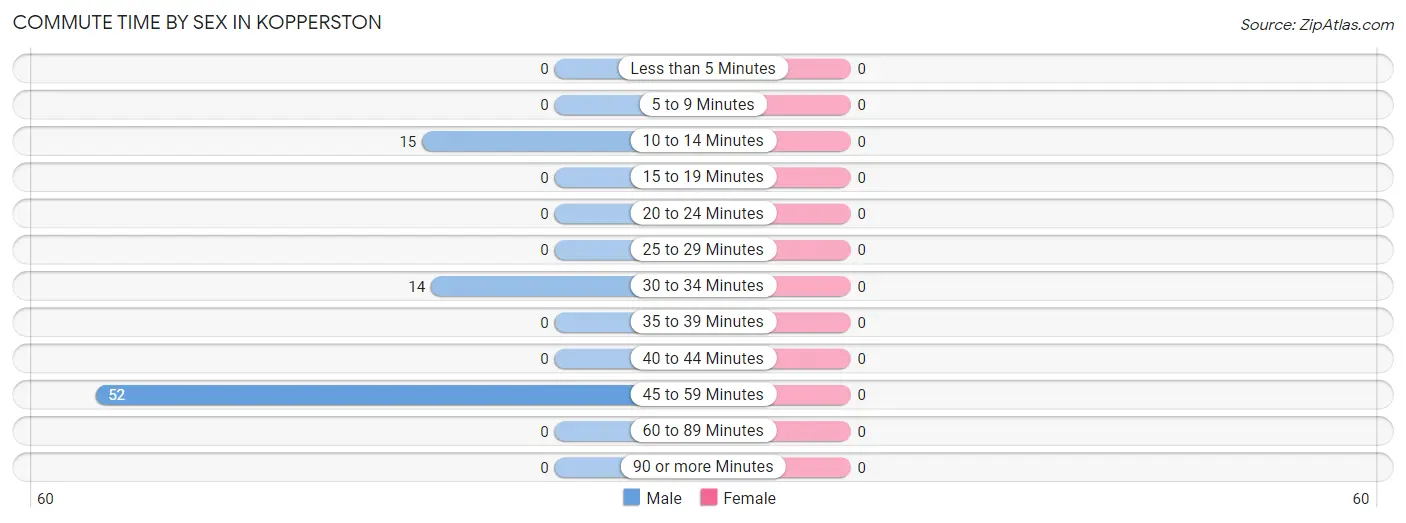
| Commute Time | Male | Female |
| Less than 5 Minutes | 0 (0.0%) | 0 (0.0%) |
| 5 to 9 Minutes | 0 (0.0%) | 0 (0.0%) |
| 10 to 14 Minutes | 15 (18.5%) | 0 (0.0%) |
| 15 to 19 Minutes | 0 (0.0%) | 0 (0.0%) |
| 20 to 24 Minutes | 0 (0.0%) | 0 (0.0%) |
| 25 to 29 Minutes | 0 (0.0%) | 0 (0.0%) |
| 30 to 34 Minutes | 14 (17.3%) | 0 (0.0%) |
| 35 to 39 Minutes | 0 (0.0%) | 0 (0.0%) |
| 40 to 44 Minutes | 0 (0.0%) | 0 (0.0%) |
| 45 to 59 Minutes | 52 (64.2%) | 0 (0.0%) |
| 60 to 89 Minutes | 0 (0.0%) | 0 (0.0%) |
| 90 or more Minutes | 0 (0.0%) | 0 (0.0%) |
Time of Departure to Work by Sex in Kopperston
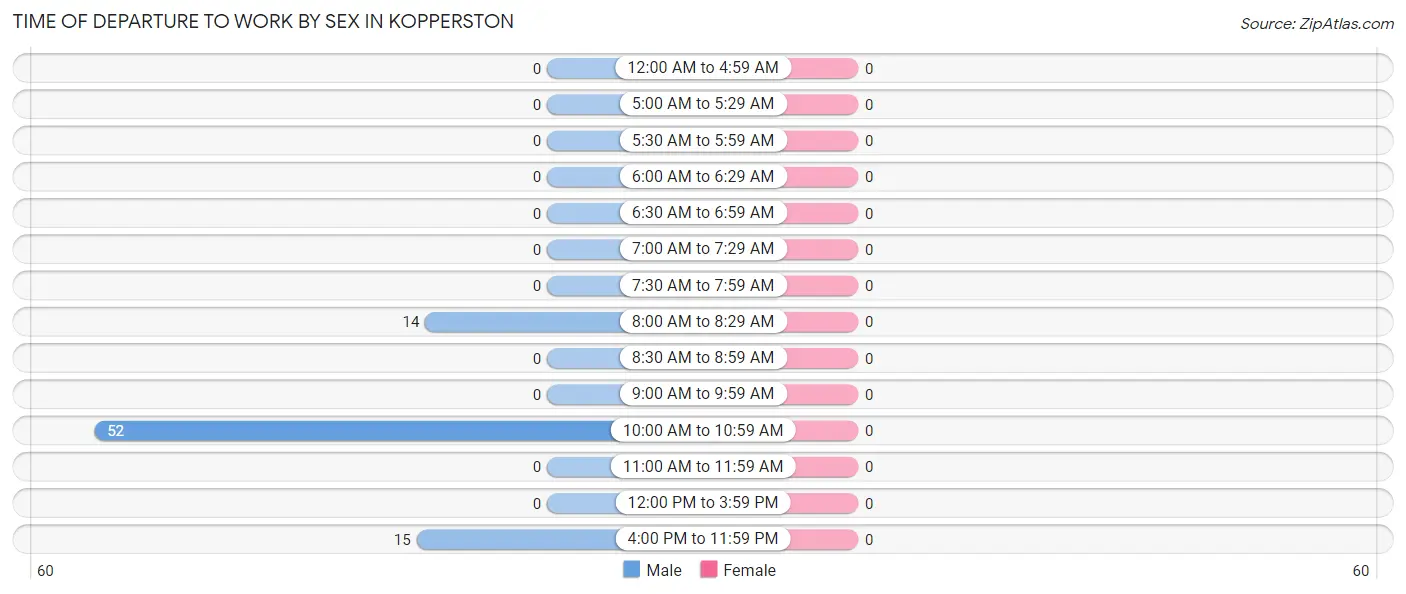
| Time of Departure | Male | Female |
| 12:00 AM to 4:59 AM | 0 (0.0%) | 0 (0.0%) |
| 5:00 AM to 5:29 AM | 0 (0.0%) | 0 (0.0%) |
| 5:30 AM to 5:59 AM | 0 (0.0%) | 0 (0.0%) |
| 6:00 AM to 6:29 AM | 0 (0.0%) | 0 (0.0%) |
| 6:30 AM to 6:59 AM | 0 (0.0%) | 0 (0.0%) |
| 7:00 AM to 7:29 AM | 0 (0.0%) | 0 (0.0%) |
| 7:30 AM to 7:59 AM | 0 (0.0%) | 0 (0.0%) |
| 8:00 AM to 8:29 AM | 14 (17.3%) | 0 (0.0%) |
| 8:30 AM to 8:59 AM | 0 (0.0%) | 0 (0.0%) |
| 9:00 AM to 9:59 AM | 0 (0.0%) | 0 (0.0%) |
| 10:00 AM to 10:59 AM | 52 (64.2%) | 0 (0.0%) |
| 11:00 AM to 11:59 AM | 0 (0.0%) | 0 (0.0%) |
| 12:00 PM to 3:59 PM | 0 (0.0%) | 0 (0.0%) |
| 4:00 PM to 11:59 PM | 15 (18.5%) | 0 (0.0%) |
| Total | 81 (100.0%) | 0 (0.0%) |
Housing Occupancy in Kopperston
Occupancy by Ownership in Kopperston
Of the total 242 dwellings in Kopperston, owner-occupied units account for 186 (76.9%), while renter-occupied units make up 56 (23.1%).
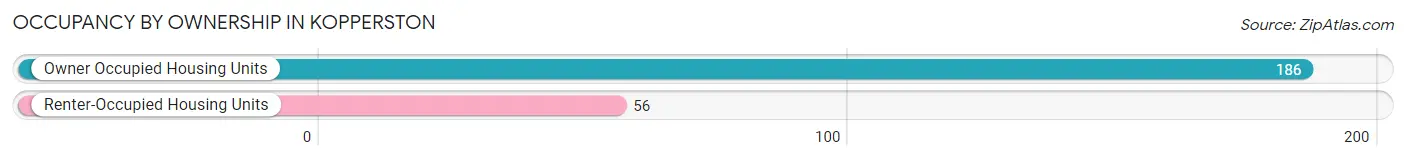
| Occupancy | # Housing Units | % Housing Units |
| Owner Occupied Housing Units | 186 | 76.9% |
| Renter-Occupied Housing Units | 56 | 23.1% |
| Total Occupied Housing Units | 242 | 100.0% |
Occupancy by Household Size in Kopperston
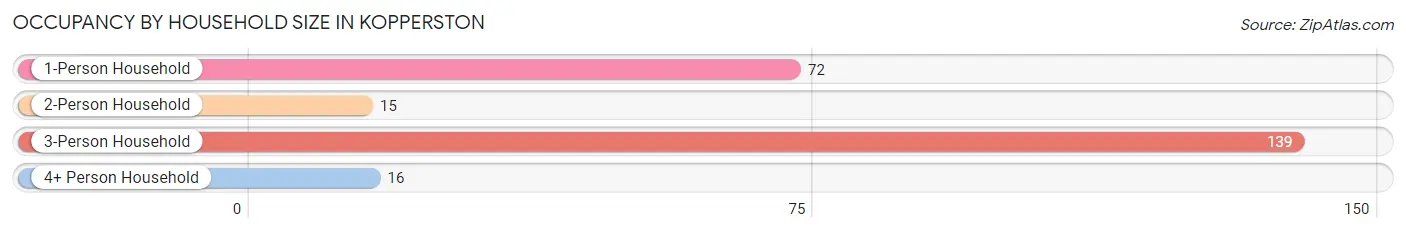
| Household Size | # Housing Units | % Housing Units |
| 1-Person Household | 72 | 29.7% |
| 2-Person Household | 15 | 6.2% |
| 3-Person Household | 139 | 57.4% |
| 4+ Person Household | 16 | 6.6% |
| Total Housing Units | 242 | 100.0% |
Occupancy by Ownership by Household Size in Kopperston
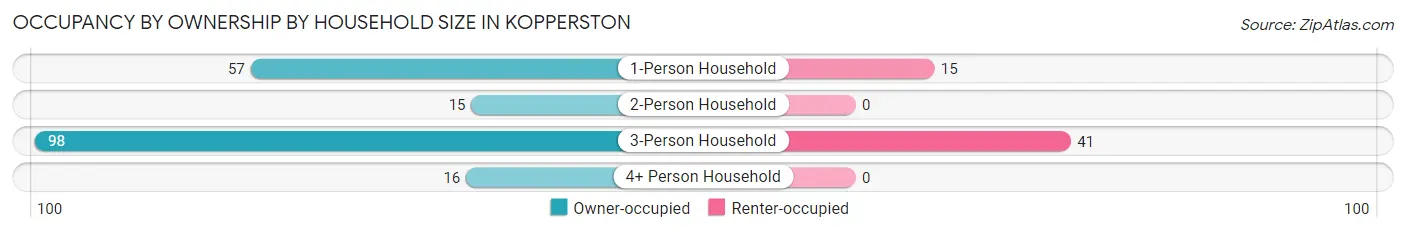
| Household Size | Owner-occupied | Renter-occupied |
| 1-Person Household | 57 (79.2%) | 15 (20.8%) |
| 2-Person Household | 15 (100.0%) | 0 (0.0%) |
| 3-Person Household | 98 (70.5%) | 41 (29.5%) |
| 4+ Person Household | 16 (100.0%) | 0 (0.0%) |
| Total Housing Units | 186 (76.9%) | 56 (23.1%) |
Occupancy by Educational Attainment in Kopperston
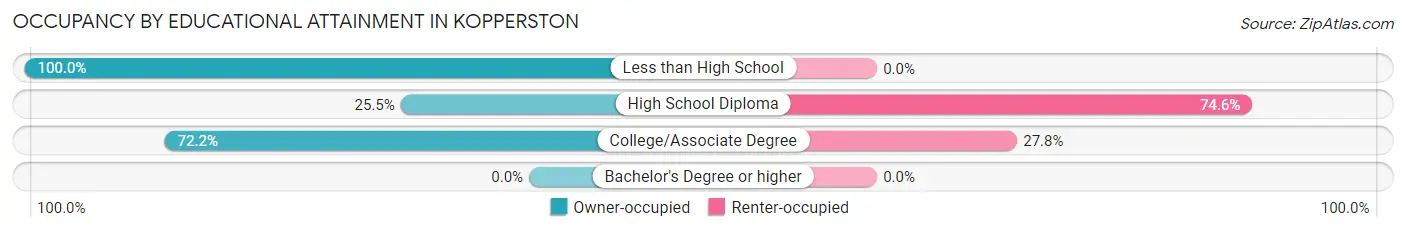
| Household Size | Owner-occupied | Renter-occupied |
| Less than High School | 133 (100.0%) | 0 (0.0%) |
| High School Diploma | 14 (25.5%) | 41 (74.6%) |
| College/Associate Degree | 39 (72.2%) | 15 (27.8%) |
| Bachelor's Degree or higher | 0 (0.0%) | 0 (0.0%) |
Occupancy by Age of Householder in Kopperston
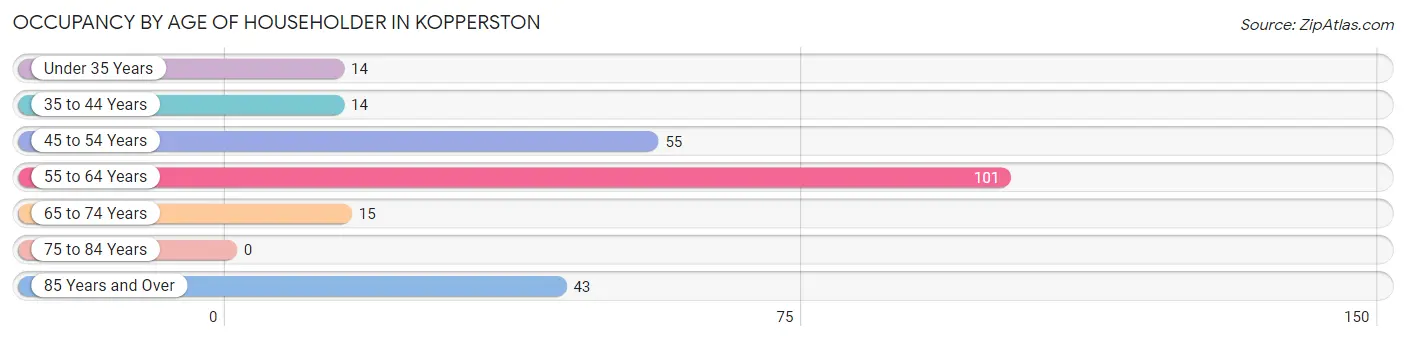
| Age Bracket | # Households | % Households |
| Under 35 Years | 14 | 5.8% |
| 35 to 44 Years | 14 | 5.8% |
| 45 to 54 Years | 55 | 22.7% |
| 55 to 64 Years | 101 | 41.7% |
| 65 to 74 Years | 15 | 6.2% |
| 75 to 84 Years | 0 | 0.0% |
| 85 Years and Over | 43 | 17.8% |
| Total | 242 | 100.0% |
Housing Finances in Kopperston
Median Income by Occupancy in Kopperston
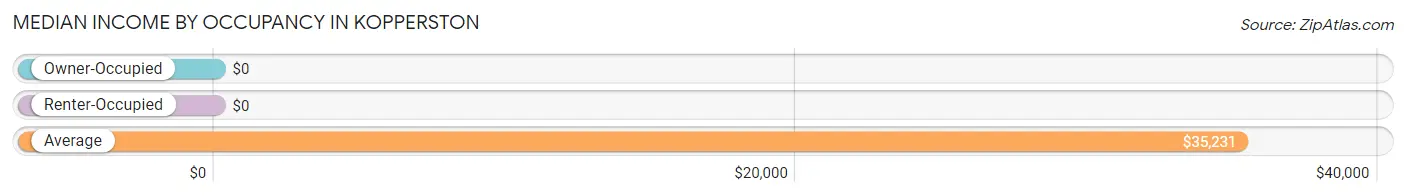
| Occupancy Type | # Households | Median Income |
| Owner-Occupied | 186 (76.9%) | $0 |
| Renter-Occupied | 56 (23.1%) | $0 |
| Average | 242 (100.0%) | $35,231 |
Occupancy by Householder Income Bracket in Kopperston
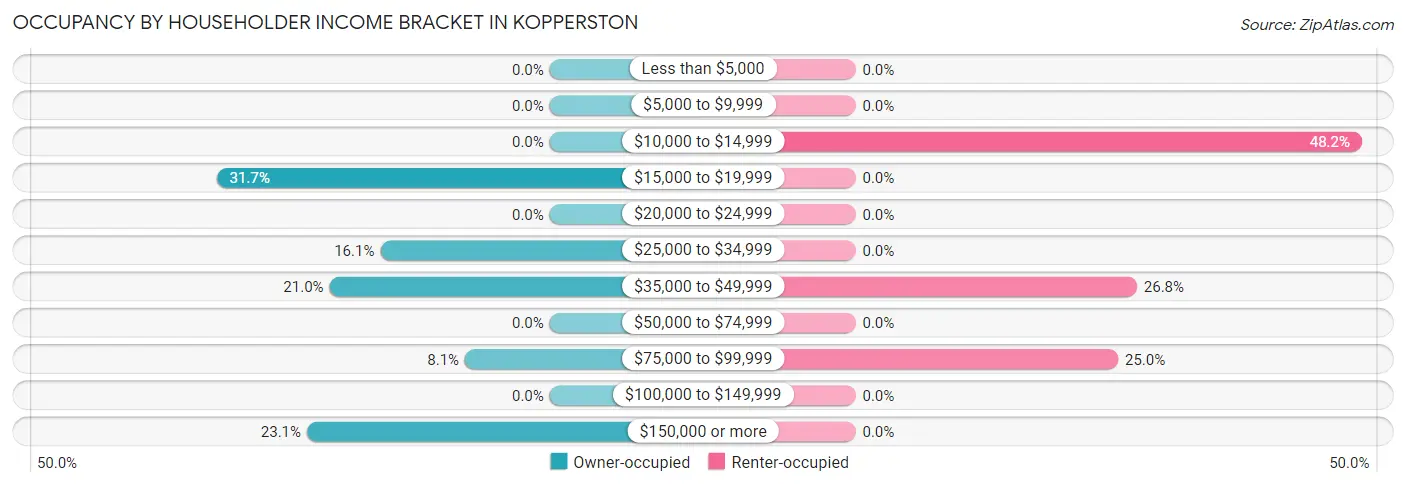
| Income Bracket | Owner-occupied | Renter-occupied |
| Less than $5,000 | 0 (0.0%) | 0 (0.0%) |
| $5,000 to $9,999 | 0 (0.0%) | 0 (0.0%) |
| $10,000 to $14,999 | 0 (0.0%) | 27 (48.2%) |
| $15,000 to $19,999 | 59 (31.7%) | 0 (0.0%) |
| $20,000 to $24,999 | 0 (0.0%) | 0 (0.0%) |
| $25,000 to $34,999 | 30 (16.1%) | 0 (0.0%) |
| $35,000 to $49,999 | 39 (21.0%) | 15 (26.8%) |
| $50,000 to $74,999 | 0 (0.0%) | 0 (0.0%) |
| $75,000 to $99,999 | 15 (8.1%) | 14 (25.0%) |
| $100,000 to $149,999 | 0 (0.0%) | 0 (0.0%) |
| $150,000 or more | 43 (23.1%) | 0 (0.0%) |
| Total | 186 (100.0%) | 56 (100.0%) |
Monthly Housing Cost Tiers in Kopperston
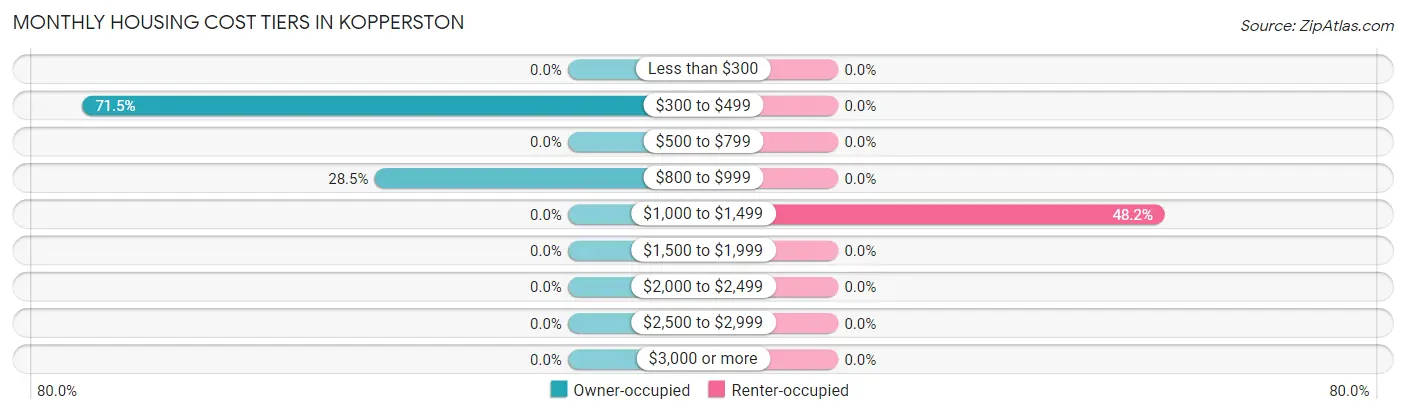
| Monthly Cost | Owner-occupied | Renter-occupied |
| Less than $300 | 0 (0.0%) | 0 (0.0%) |
| $300 to $499 | 133 (71.5%) | 0 (0.0%) |
| $500 to $799 | 0 (0.0%) | 0 (0.0%) |
| $800 to $999 | 53 (28.5%) | 0 (0.0%) |
| $1,000 to $1,499 | 0 (0.0%) | 27 (48.2%) |
| $1,500 to $1,999 | 0 (0.0%) | 0 (0.0%) |
| $2,000 to $2,499 | 0 (0.0%) | 0 (0.0%) |
| $2,500 to $2,999 | 0 (0.0%) | 0 (0.0%) |
| $3,000 or more | 0 (0.0%) | 0 (0.0%) |
| Total | 186 (100.0%) | 56 (100.0%) |
Physical Housing Characteristics in Kopperston
Housing Structures in Kopperston
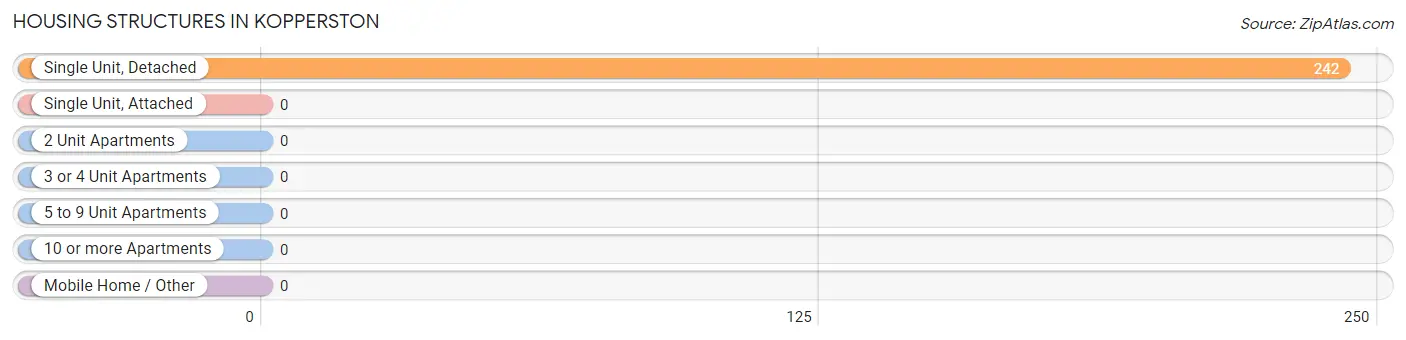
| Structure Type | # Housing Units | % Housing Units |
| Single Unit, Detached | 242 | 100.0% |
| Single Unit, Attached | 0 | 0.0% |
| 2 Unit Apartments | 0 | 0.0% |
| 3 or 4 Unit Apartments | 0 | 0.0% |
| 5 to 9 Unit Apartments | 0 | 0.0% |
| 10 or more Apartments | 0 | 0.0% |
| Mobile Home / Other | 0 | 0.0% |
| Total | 242 | 100.0% |
Housing Structures by Occupancy in Kopperston
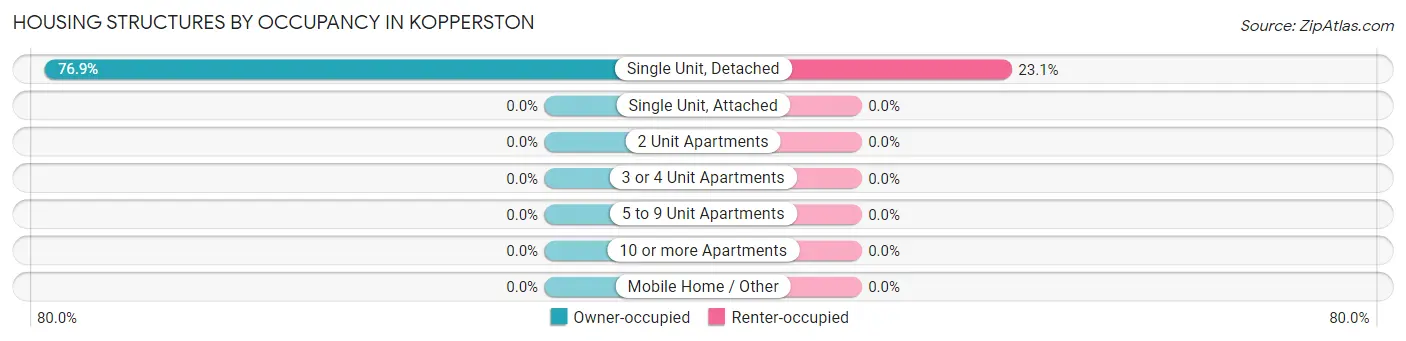
| Structure Type | Owner-occupied | Renter-occupied |
| Single Unit, Detached | 186 (76.9%) | 56 (23.1%) |
| Single Unit, Attached | 0 (0.0%) | 0 (0.0%) |
| 2 Unit Apartments | 0 (0.0%) | 0 (0.0%) |
| 3 or 4 Unit Apartments | 0 (0.0%) | 0 (0.0%) |
| 5 to 9 Unit Apartments | 0 (0.0%) | 0 (0.0%) |
| 10 or more Apartments | 0 (0.0%) | 0 (0.0%) |
| Mobile Home / Other | 0 (0.0%) | 0 (0.0%) |
| Total | 186 (76.9%) | 56 (23.1%) |
Housing Structures by Number of Rooms in Kopperston
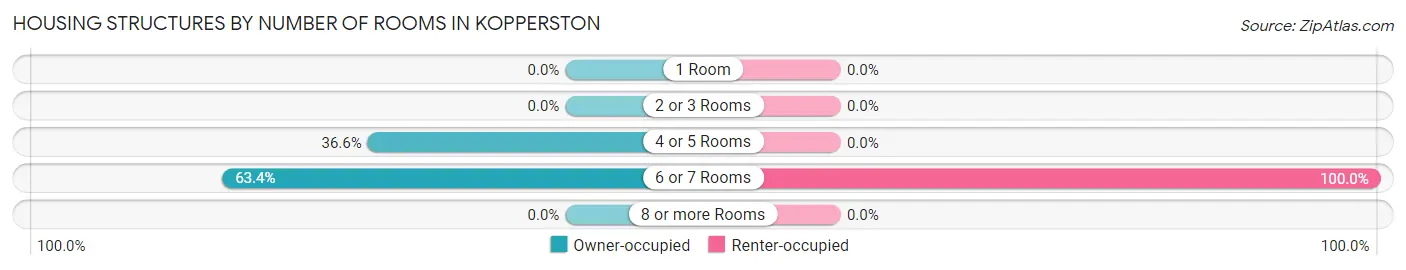
| Number of Rooms | Owner-occupied | Renter-occupied |
| 1 Room | 0 (0.0%) | 0 (0.0%) |
| 2 or 3 Rooms | 0 (0.0%) | 0 (0.0%) |
| 4 or 5 Rooms | 68 (36.6%) | 0 (0.0%) |
| 6 or 7 Rooms | 118 (63.4%) | 56 (100.0%) |
| 8 or more Rooms | 0 (0.0%) | 0 (0.0%) |
| Total | 186 (100.0%) | 56 (100.0%) |
Housing Structure by Heating Type in Kopperston
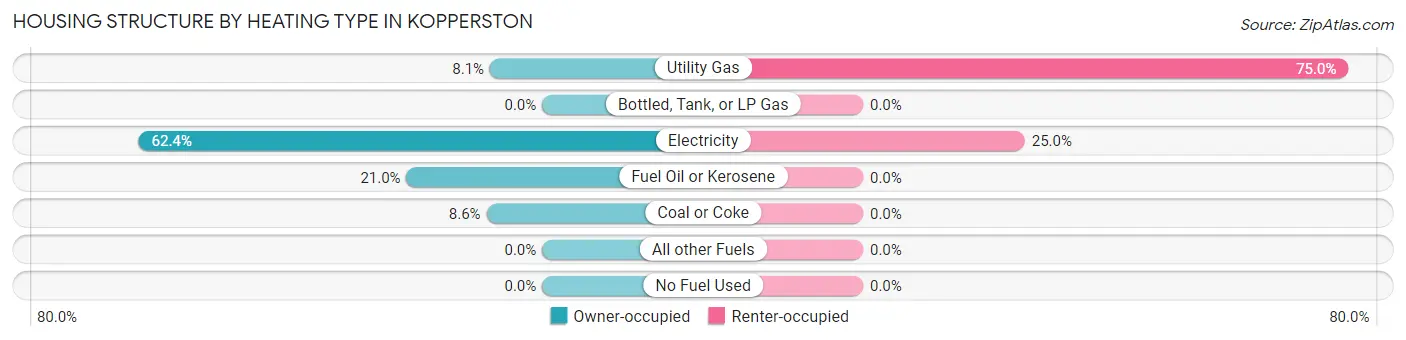
| Heating Type | Owner-occupied | Renter-occupied |
| Utility Gas | 15 (8.1%) | 42 (75.0%) |
| Bottled, Tank, or LP Gas | 0 (0.0%) | 0 (0.0%) |
| Electricity | 116 (62.4%) | 14 (25.0%) |
| Fuel Oil or Kerosene | 39 (21.0%) | 0 (0.0%) |
| Coal or Coke | 16 (8.6%) | 0 (0.0%) |
| All other Fuels | 0 (0.0%) | 0 (0.0%) |
| No Fuel Used | 0 (0.0%) | 0 (0.0%) |
| Total | 186 (100.0%) | 56 (100.0%) |
Household Vehicle Usage in Kopperston
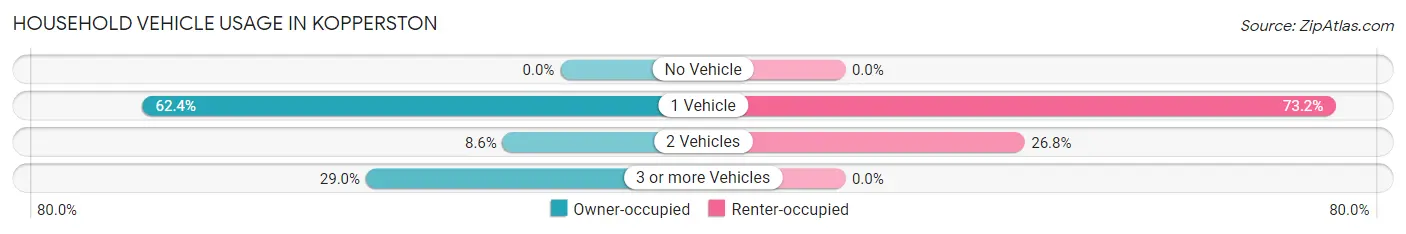
| Vehicles per Household | Owner-occupied | Renter-occupied |
| No Vehicle | 0 (0.0%) | 0 (0.0%) |
| 1 Vehicle | 116 (62.4%) | 41 (73.2%) |
| 2 Vehicles | 16 (8.6%) | 15 (26.8%) |
| 3 or more Vehicles | 54 (29.0%) | 0 (0.0%) |
| Total | 186 (100.0%) | 56 (100.0%) |
Real Estate & Mortgages in Kopperston
Real Estate and Mortgage Overview in Kopperston
| Characteristic | Without Mortgage | With Mortgage |
| Housing Units | 172 | 14 |
| Median Property Value | - | - |
| Median Household Income | - | - |
| Monthly Housing Costs | $436 | $0 |
| Real Estate Taxes | - | - |
Property Value by Mortgage Status in Kopperston
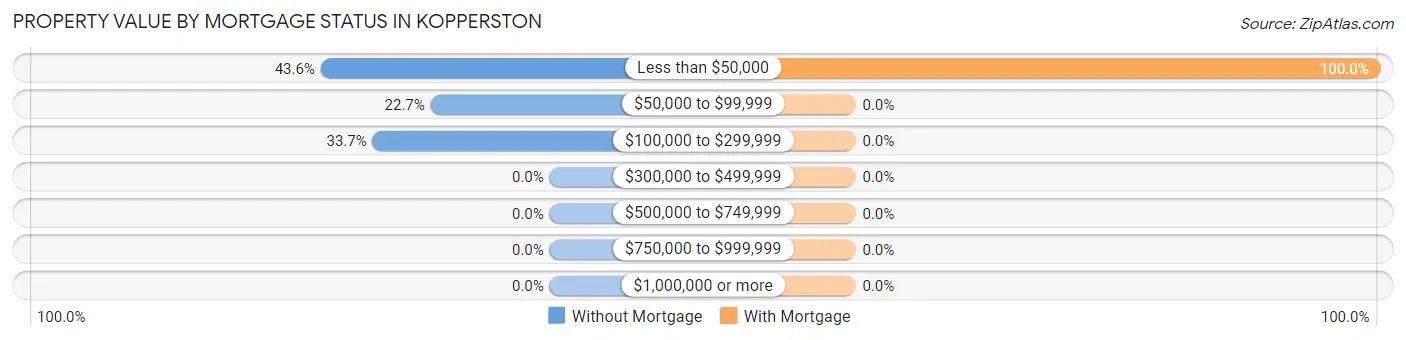
| Property Value | Without Mortgage | With Mortgage |
| Less than $50,000 | 75 (43.6%) | 14 (100.0%) |
| $50,000 to $99,999 | 39 (22.7%) | 0 (0.0%) |
| $100,000 to $299,999 | 58 (33.7%) | 0 (0.0%) |
| $300,000 to $499,999 | 0 (0.0%) | 0 (0.0%) |
| $500,000 to $749,999 | 0 (0.0%) | 0 (0.0%) |
| $750,000 to $999,999 | 0 (0.0%) | 0 (0.0%) |
| $1,000,000 or more | 0 (0.0%) | 0 (0.0%) |
| Total | 172 (100.0%) | 14 (100.0%) |
Household Income by Mortgage Status in Kopperston
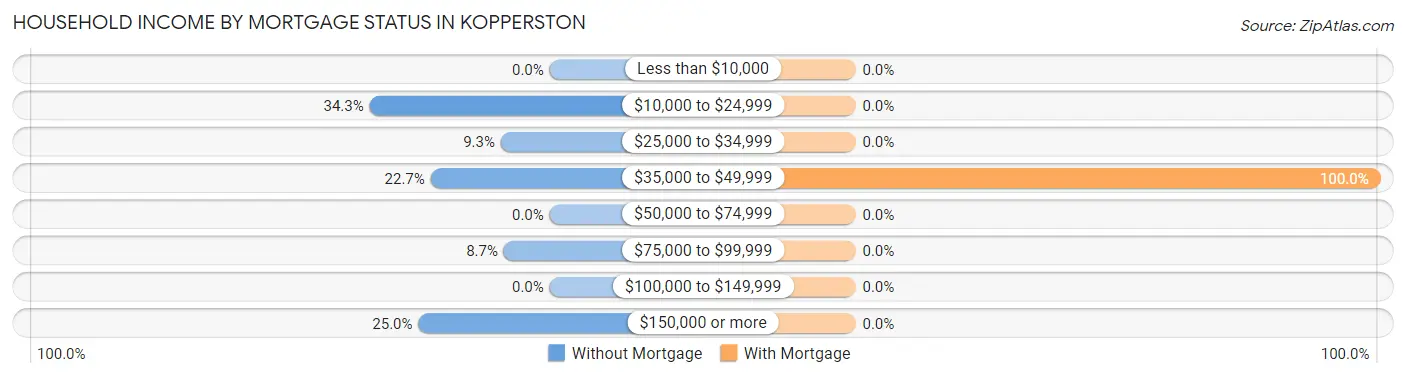
| Household Income | Without Mortgage | With Mortgage |
| Less than $10,000 | 0 (0.0%) | 0 (0.0%) |
| $10,000 to $24,999 | 59 (34.3%) | 0 (0.0%) |
| $25,000 to $34,999 | 16 (9.3%) | 0 (0.0%) |
| $35,000 to $49,999 | 39 (22.7%) | 14 (100.0%) |
| $50,000 to $74,999 | 0 (0.0%) | 0 (0.0%) |
| $75,000 to $99,999 | 15 (8.7%) | 0 (0.0%) |
| $100,000 to $149,999 | 0 (0.0%) | 0 (0.0%) |
| $150,000 or more | 43 (25.0%) | 0 (0.0%) |
| Total | 172 (100.0%) | 14 (100.0%) |
Property Value to Household Income Ratio in Kopperston
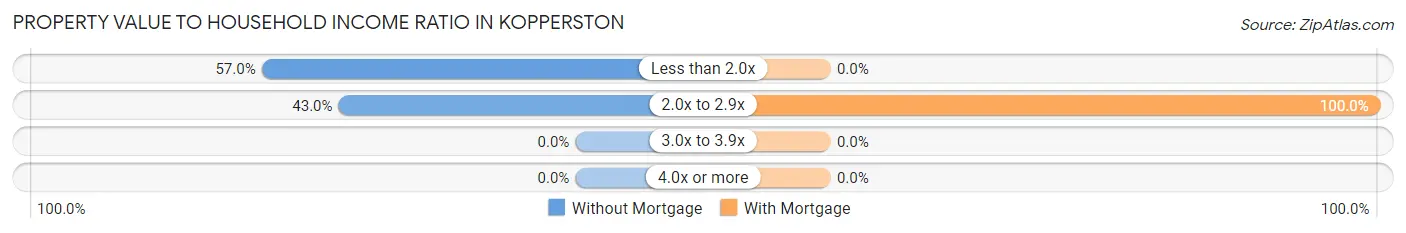
| Value-to-Income Ratio | Without Mortgage | With Mortgage |
| Less than 2.0x | 98 (57.0%) | 0 (0.0%) |
| 2.0x to 2.9x | 74 (43.0%) | 14 (100.0%) |
| 3.0x to 3.9x | 0 (0.0%) | 0 (0.0%) |
| 4.0x or more | 0 (0.0%) | 0 (0.0%) |
| Total | 172 (100.0%) | 14 (100.0%) |
Real Estate Taxes by Mortgage Status in Kopperston
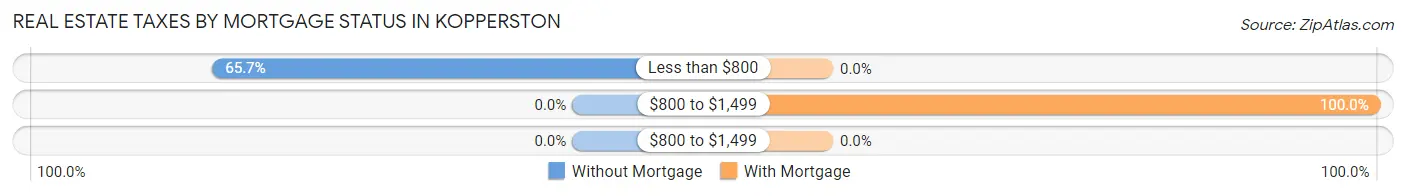
| Property Taxes | Without Mortgage | With Mortgage |
| Less than $800 | 113 (65.7%) | 0 (0.0%) |
| $800 to $1,499 | 0 (0.0%) | 14 (100.0%) |
| $800 to $1,499 | 0 (0.0%) | 0 (0.0%) |
| Total | 172 (100.0%) | 14 (100.0%) |
Health & Disability in Kopperston
Health Insurance Coverage by Age in Kopperston
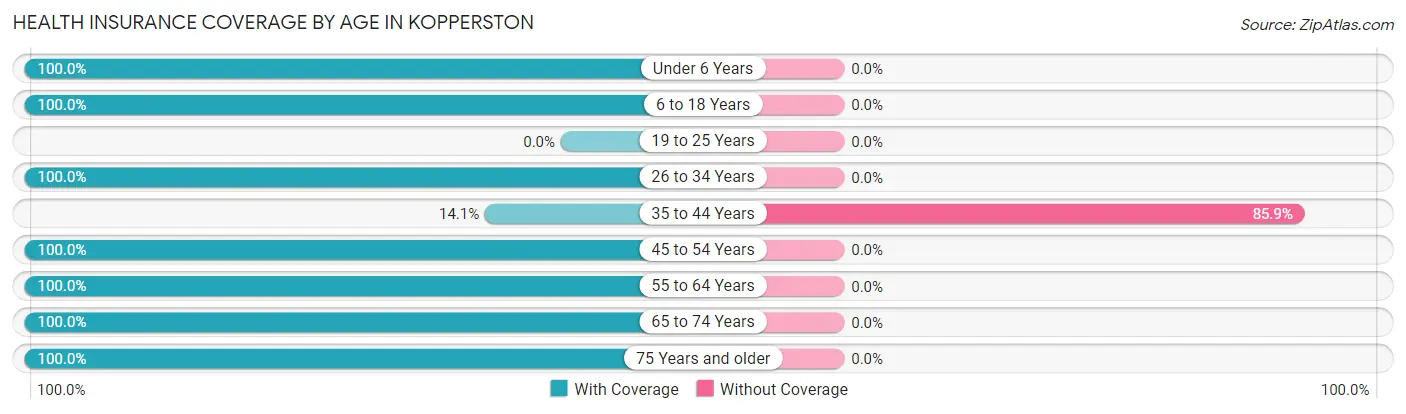
| Age Bracket | With Coverage | Without Coverage |
| Under 6 Years | 67 (100.0%) | 0 (0.0%) |
| 6 to 18 Years | 187 (100.0%) | 0 (0.0%) |
| 19 to 25 Years | 0 (0.0%) | 0 (0.0%) |
| 26 to 34 Years | 66 (100.0%) | 0 (0.0%) |
| 35 to 44 Years | 14 (14.1%) | 85 (85.9%) |
| 45 to 54 Years | 55 (100.0%) | 0 (0.0%) |
| 55 to 64 Years | 216 (100.0%) | 0 (0.0%) |
| 65 to 74 Years | 47 (100.0%) | 0 (0.0%) |
| 75 Years and older | 43 (100.0%) | 0 (0.0%) |
| Total | 695 (89.1%) | 85 (10.9%) |
Health Insurance Coverage by Citizenship Status in Kopperston
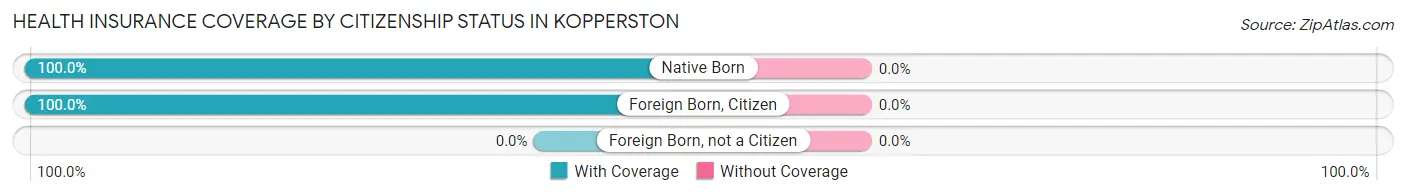
| Citizenship Status | With Coverage | Without Coverage |
| Native Born | 67 (100.0%) | 0 (0.0%) |
| Foreign Born, Citizen | 187 (100.0%) | 0 (0.0%) |
| Foreign Born, not a Citizen | 0 (0.0%) | 0 (0.0%) |
Health Insurance Coverage by Household Income in Kopperston
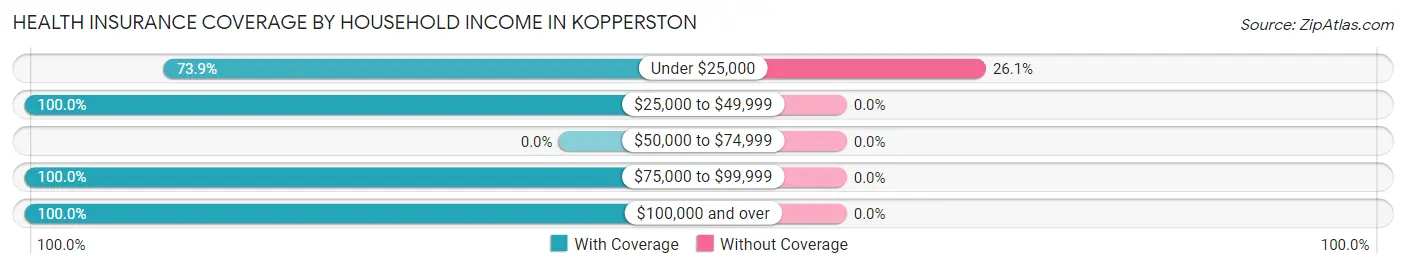
| Household Income | With Coverage | Without Coverage |
| Under $25,000 | 241 (73.9%) | 85 (26.1%) |
| $25,000 to $49,999 | 221 (100.0%) | 0 (0.0%) |
| $50,000 to $74,999 | 0 (0.0%) | 0 (0.0%) |
| $75,000 to $99,999 | 190 (100.0%) | 0 (0.0%) |
| $100,000 and over | 43 (100.0%) | 0 (0.0%) |
Public vs Private Health Insurance Coverage by Age in Kopperston
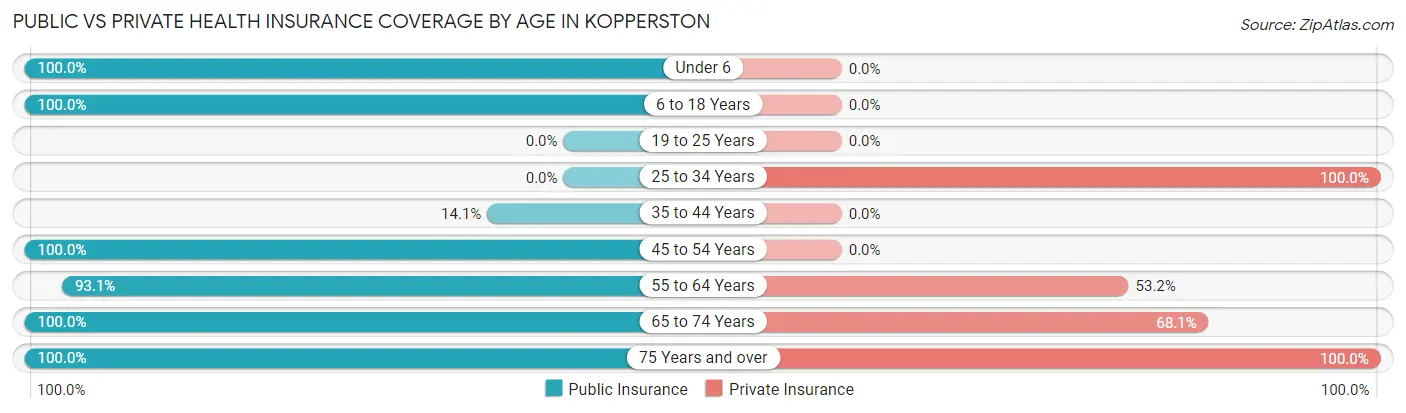
| Age Bracket | Public Insurance | Private Insurance |
| Under 6 | 67 (100.0%) | 0 (0.0%) |
| 6 to 18 Years | 187 (100.0%) | 0 (0.0%) |
| 19 to 25 Years | 0 (0.0%) | 0 (0.0%) |
| 25 to 34 Years | 0 (0.0%) | 66 (100.0%) |
| 35 to 44 Years | 14 (14.1%) | 0 (0.0%) |
| 45 to 54 Years | 55 (100.0%) | 0 (0.0%) |
| 55 to 64 Years | 201 (93.1%) | 115 (53.2%) |
| 65 to 74 Years | 47 (100.0%) | 32 (68.1%) |
| 75 Years and over | 43 (100.0%) | 43 (100.0%) |
| Total | 614 (78.7%) | 256 (32.8%) |
Disability Status by Sex by Age in Kopperston
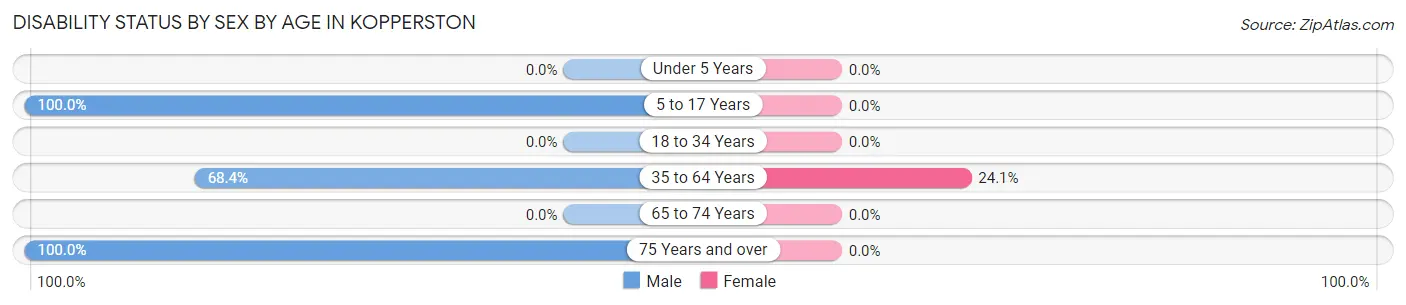
| Age Bracket | Male | Female |
| Under 5 Years | 0 (0.0%) | 0 (0.0%) |
| 5 to 17 Years | 20 (100.0%) | 0 (0.0%) |
| 18 to 34 Years | 0 (0.0%) | 0 (0.0%) |
| 35 to 64 Years | 91 (68.4%) | 57 (24.0%) |
| 65 to 74 Years | 0 (0.0%) | 0 (0.0%) |
| 75 Years and over | 43 (100.0%) | 0 (0.0%) |
Disability Class by Sex by Age in Kopperston
Disability Class: Hearing Difficulty
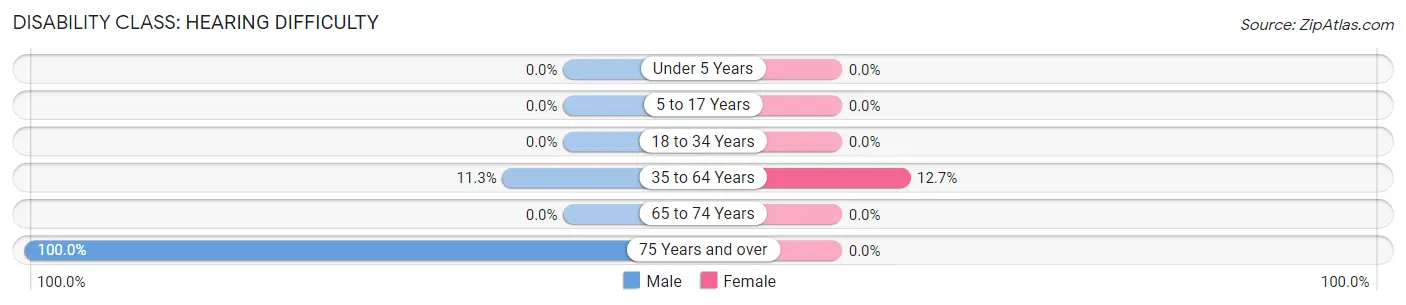
| Age Bracket | Male | Female |
| Under 5 Years | 0 (0.0%) | 0 (0.0%) |
| 5 to 17 Years | 0 (0.0%) | 0 (0.0%) |
| 18 to 34 Years | 0 (0.0%) | 0 (0.0%) |
| 35 to 64 Years | 15 (11.3%) | 30 (12.7%) |
| 65 to 74 Years | 0 (0.0%) | 0 (0.0%) |
| 75 Years and over | 43 (100.0%) | 0 (0.0%) |
Disability Class: Vision Difficulty
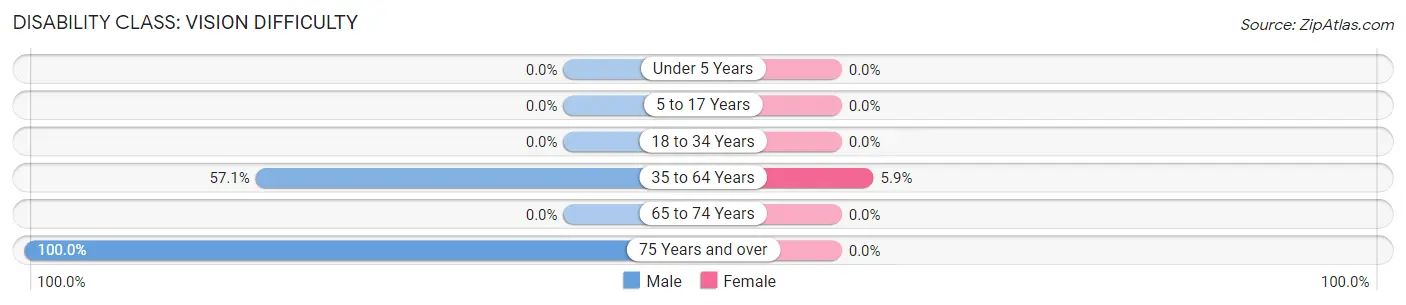
| Age Bracket | Male | Female |
| Under 5 Years | 0 (0.0%) | 0 (0.0%) |
| 5 to 17 Years | 0 (0.0%) | 0 (0.0%) |
| 18 to 34 Years | 0 (0.0%) | 0 (0.0%) |
| 35 to 64 Years | 76 (57.1%) | 14 (5.9%) |
| 65 to 74 Years | 0 (0.0%) | 0 (0.0%) |
| 75 Years and over | 43 (100.0%) | 0 (0.0%) |
Disability Class: Cognitive Difficulty
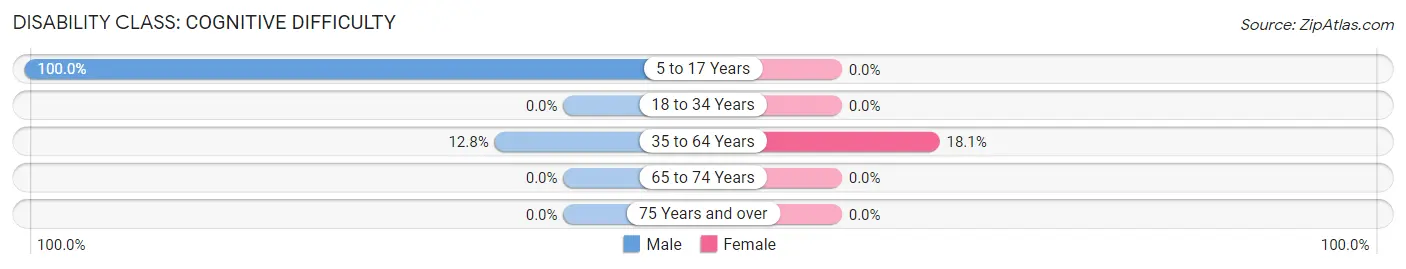
| Age Bracket | Male | Female |
| 5 to 17 Years | 20 (100.0%) | 0 (0.0%) |
| 18 to 34 Years | 0 (0.0%) | 0 (0.0%) |
| 35 to 64 Years | 17 (12.8%) | 43 (18.1%) |
| 65 to 74 Years | 0 (0.0%) | 0 (0.0%) |
| 75 Years and over | 0 (0.0%) | 0 (0.0%) |
Disability Class: Ambulatory Difficulty
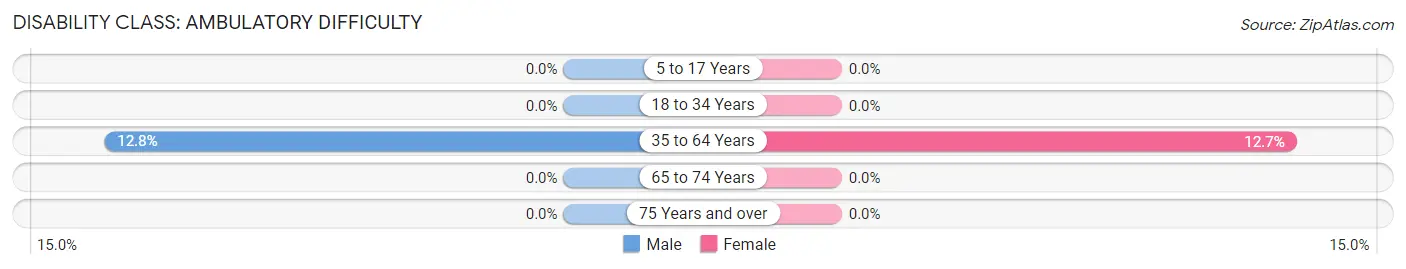
| Age Bracket | Male | Female |
| 5 to 17 Years | 0 (0.0%) | 0 (0.0%) |
| 18 to 34 Years | 0 (0.0%) | 0 (0.0%) |
| 35 to 64 Years | 17 (12.8%) | 30 (12.7%) |
| 65 to 74 Years | 0 (0.0%) | 0 (0.0%) |
| 75 Years and over | 0 (0.0%) | 0 (0.0%) |
Disability Class: Self-Care Difficulty
| Age Bracket | Male | Female |
| 5 to 17 Years | 0 (0.0%) | 0 (0.0%) |
| 18 to 34 Years | 0 (0.0%) | 0 (0.0%) |
| 35 to 64 Years | 0 (0.0%) | 0 (0.0%) |
| 65 to 74 Years | 0 (0.0%) | 0 (0.0%) |
| 75 Years and over | 0 (0.0%) | 0 (0.0%) |
Technology Access in Kopperston
Computing Device Access in Kopperston
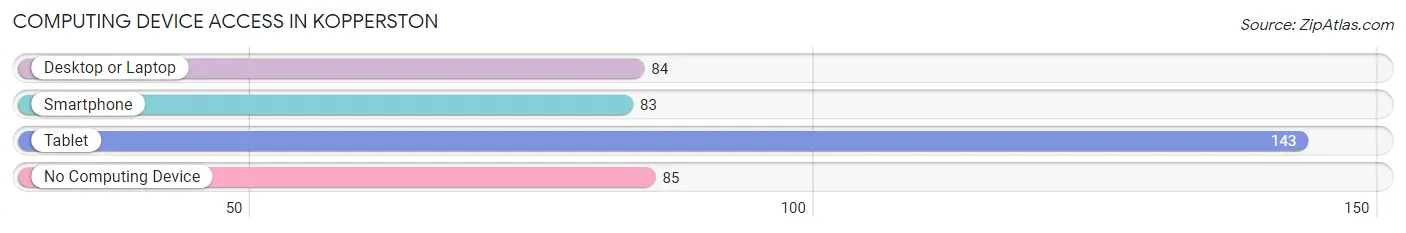
| Device Type | # Households | % Households |
| Desktop or Laptop | 84 | 34.7% |
| Smartphone | 83 | 34.3% |
| Tablet | 143 | 59.1% |
| No Computing Device | 85 | 35.1% |
| Total | 242 | 100.0% |
Internet Access in Kopperston
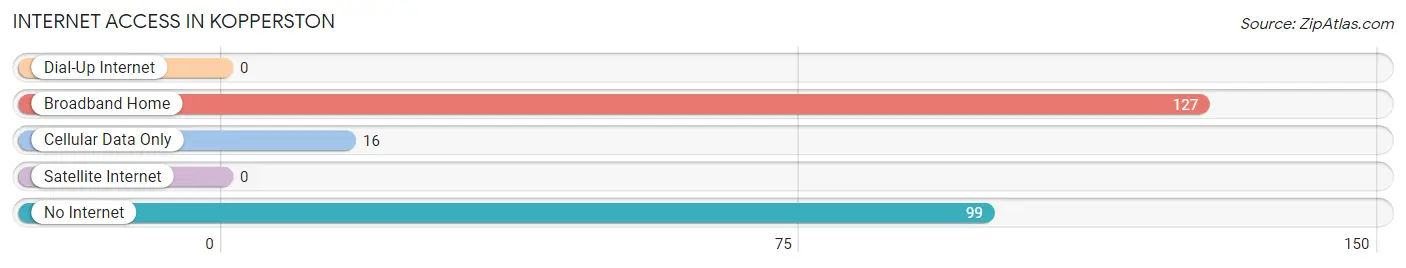
| Internet Type | # Households | % Households |
| Dial-Up Internet | 0 | 0.0% |
| Broadband Home | 127 | 52.5% |
| Cellular Data Only | 16 | 6.6% |
| Satellite Internet | 0 | 0.0% |
| No Internet | 99 | 40.9% |
| Total | 242 | 100.0% |
Kopperston Summary
KOPPERSTON WV HISTORY GEOGRAPHY ECONOMY AND DEMOGRAPHICS
Kopperton, West Virginia is a small town located in Wyoming County, West Virginia. It is situated in the Appalachian Mountains and is part of the Coal River Valley. The town was founded in 1891 and was named after the Kopperton family, who were early settlers in the area.
Geography
Kopperton is located in the Appalachian Mountains of West Virginia. It is situated in the Coal River Valley, which is a narrow valley that runs through the mountains. The town is surrounded by mountains and hills, and the Coal River runs through the town. The town is located at an elevation of 1,890 feet above sea level.
The climate in Kopperton is humid continental, with hot summers and cold winters. The average annual temperature is around 50 degrees Fahrenheit. The average annual precipitation is around 40 inches.
Economy
Kopperton’s economy is largely based on coal mining and timber production. The town is home to several coal mines, and the timber industry is also a major employer in the area. The town also has a few small businesses, such as restaurants, stores, and other services.
Demographics
As of the 2010 census, the population of Kopperton was 1,890. The racial makeup of the town was 97.3% White, 0.5% African American, 0.2% Native American, 0.2% Asian, 0.1% Pacific Islander, 0.7% from other races, and 0.9% from two or more races. Hispanic or Latino of any race were 1.2% of the population.
The median income for a household in Kopperton was $25,000, and the median income for a family was $30,000. The per capita income for the town was $14,000. About 17.3% of families and 20.2% of the population were below the poverty line, including 28.3% of those under age 18 and 11.3% of those age 65 or over.
Kopperton is a small town with a rich history and a unique culture. The town is home to a diverse population and a strong economy based on coal mining and timber production. The town is surrounded by beautiful mountains and hills, and the Coal River runs through the town. Kopperton is a great place to live and work, and it is a great place to visit.
Common Questions
What is Per Capita Income in Kopperston?
Per Capita income in Kopperston is $30,795.
What is the Median Family Income in Kopperston?
Median Family Income in Kopperston is $18,305.
What is the Median Household income in Kopperston?
Median Household Income in Kopperston is $35,231.
What is Inequality or Gini Index in Kopperston?
Inequality or Gini Index in Kopperston is 0.61.
What is the Total Population of Kopperston?
Total Population of Kopperston is 780.
What is the Total Male Population of Kopperston?
Total Male Population of Kopperston is 295.
What is the Total Female Population of Kopperston?
Total Female Population of Kopperston is 485.
What is the Ratio of Males per 100 Females in Kopperston?
There are 60.82 Males per 100 Females in Kopperston.
What is the Ratio of Females per 100 Males in Kopperston?
There are 164.41 Females per 100 Males in Kopperston.
What is the Median Population Age in Kopperston?
Median Population Age in Kopperston is 39.8 Years.
What is the Average Family Size in Kopperston
Average Family Size in Kopperston is 4.0 People.
What is the Average Household Size in Kopperston
Average Household Size in Kopperston is 3.2 People.
How Large is the Labor Force in Kopperston?
There are 95 People in the Labor Forcein in Kopperston.
What is the Percentage of People in the Labor Force in Kopperston?
16.7% of People are in the Labor Force in Kopperston.