Dayton, MT Map & Demographics
Dayton Map
Dayton Overview
$45,576
PER CAPITA INCOME
$93,750
AVG FAMILY INCOME
$92,750
AVG HOUSEHOLD INCOME
0.33
INEQUALITY / GINI INDEX
114
TOTAL POPULATION
53
MALE POPULATION
61
FEMALE POPULATION
86.89
MALES / 100 FEMALES
115.09
FEMALES / 100 MALES
67.9
MEDIAN AGE
2.3
AVG FAMILY SIZE
2.0
AVG HOUSEHOLD SIZE
14
LABOR FORCE [ PEOPLE ]
13.9%
PERCENT IN LABOR FORCE
Dayton Zip Codes
Dayton Area Codes
Income in Dayton
Income Overview in Dayton
Per Capita Income in Dayton is $45,576, while median incomes of families and households are $93,750 and $92,750 respectively.
| Characteristic | Number | Measure |
| Per Capita Income | 114 | $45,576 |
| Median Family Income | 43 | $93,750 |
| Mean Family Income | 43 | $89,456 |
| Median Household Income | 57 | $92,750 |
| Mean Household Income | 57 | $91,804 |
| Income Deficit | 43 | $0 |
| Wage / Income Gap (%) | 114 | 0.00% |
| Wage / Income Gap ($) | 114 | 100.00¢ per $1 |
| Gini / Inequality Index | 114 | 0.33 |
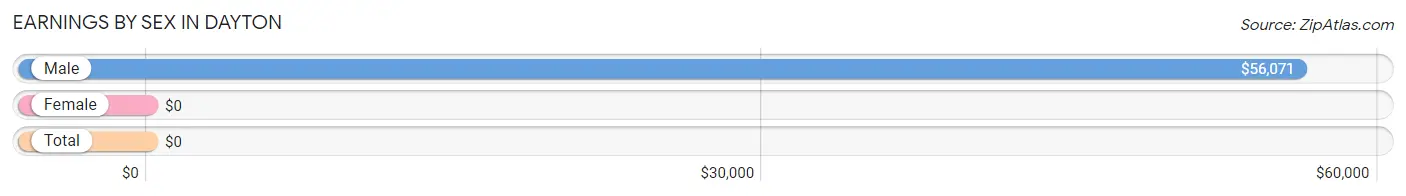
Earnings by Sex in Dayton
| Sex | Number | Average Earnings |
| Male | 14 (70.0%) | $56,071 |
| Female | 6 (30.0%) | $0 |
| Total | 20 (100.0%) | $0 |
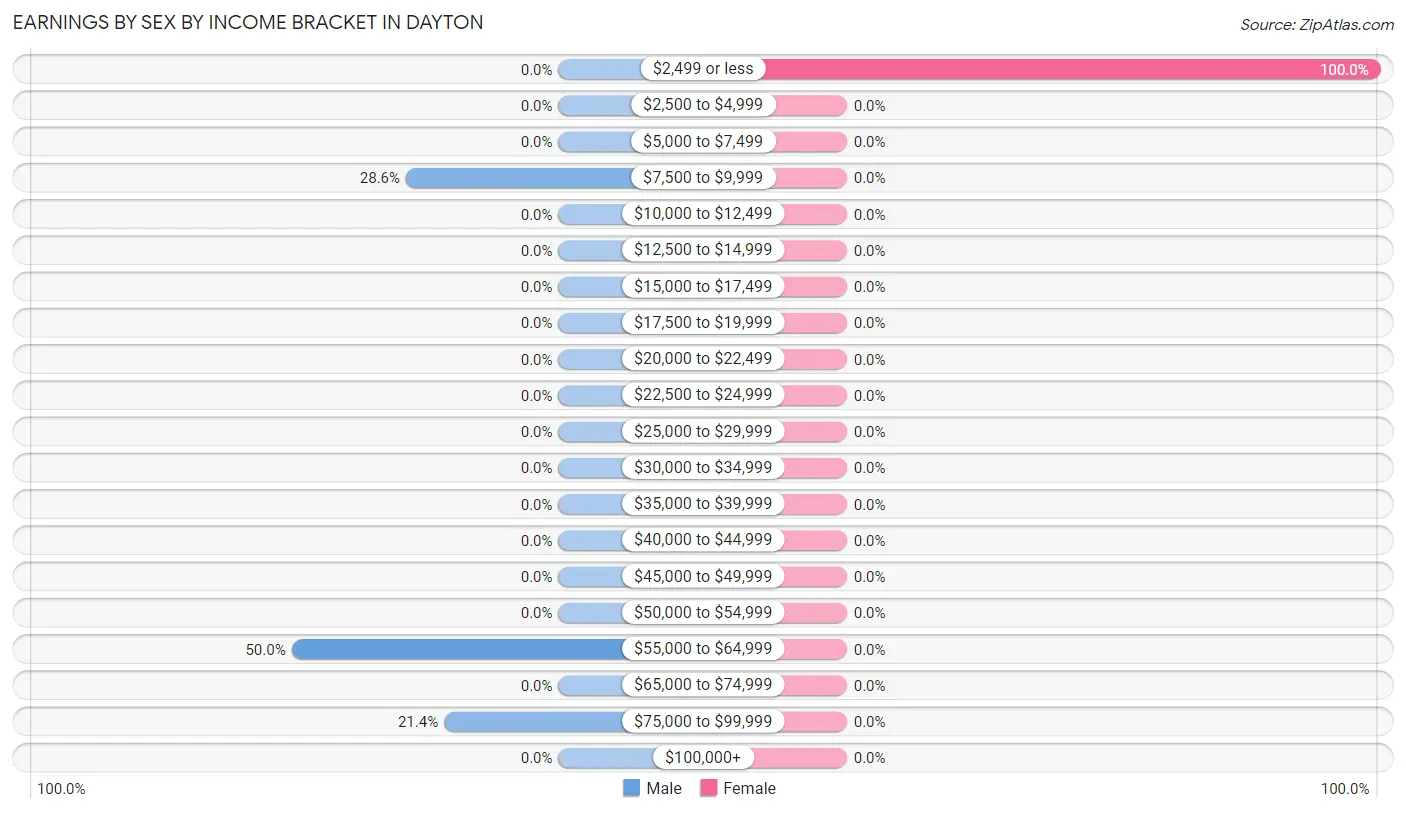
Earnings by Sex by Income Bracket in Dayton
The most common earnings brackets in Dayton are $55,000 to $64,999 for men (7 | 50.0%) and $2,499 or less for women (6 | 100.0%).
| Income | Male | Female |
| $2,499 or less | 0 (0.0%) | 6 (100.0%) |
| $2,500 to $4,999 | 0 (0.0%) | 0 (0.0%) |
| $5,000 to $7,499 | 0 (0.0%) | 0 (0.0%) |
| $7,500 to $9,999 | 4 (28.6%) | 0 (0.0%) |
| $10,000 to $12,499 | 0 (0.0%) | 0 (0.0%) |
| $12,500 to $14,999 | 0 (0.0%) | 0 (0.0%) |
| $15,000 to $17,499 | 0 (0.0%) | 0 (0.0%) |
| $17,500 to $19,999 | 0 (0.0%) | 0 (0.0%) |
| $20,000 to $22,499 | 0 (0.0%) | 0 (0.0%) |
| $22,500 to $24,999 | 0 (0.0%) | 0 (0.0%) |
| $25,000 to $29,999 | 0 (0.0%) | 0 (0.0%) |
| $30,000 to $34,999 | 0 (0.0%) | 0 (0.0%) |
| $35,000 to $39,999 | 0 (0.0%) | 0 (0.0%) |
| $40,000 to $44,999 | 0 (0.0%) | 0 (0.0%) |
| $45,000 to $49,999 | 0 (0.0%) | 0 (0.0%) |
| $50,000 to $54,999 | 0 (0.0%) | 0 (0.0%) |
| $55,000 to $64,999 | 7 (50.0%) | 0 (0.0%) |
| $65,000 to $74,999 | 0 (0.0%) | 0 (0.0%) |
| $75,000 to $99,999 | 3 (21.4%) | 0 (0.0%) |
| $100,000+ | 0 (0.0%) | 0 (0.0%) |
| Total | 14 (100.0%) | 6 (100.0%) |
Earnings by Sex by Educational Attainment in Dayton
| Educational Attainment | Male Income | Female Income |
| Less than High School | - | - |
| High School Diploma | - | - |
| College or Associate's Degree | - | - |
| Bachelor's Degree | - | - |
| Graduate Degree | - | - |
| Total | - | - |
Family Income in Dayton
Family Income Brackets in Dayton
According to the Dayton family income data, there are 15 families falling into the $100,000 to $149,999 income range, which is the most common income bracket and makes up 34.9% of all families.
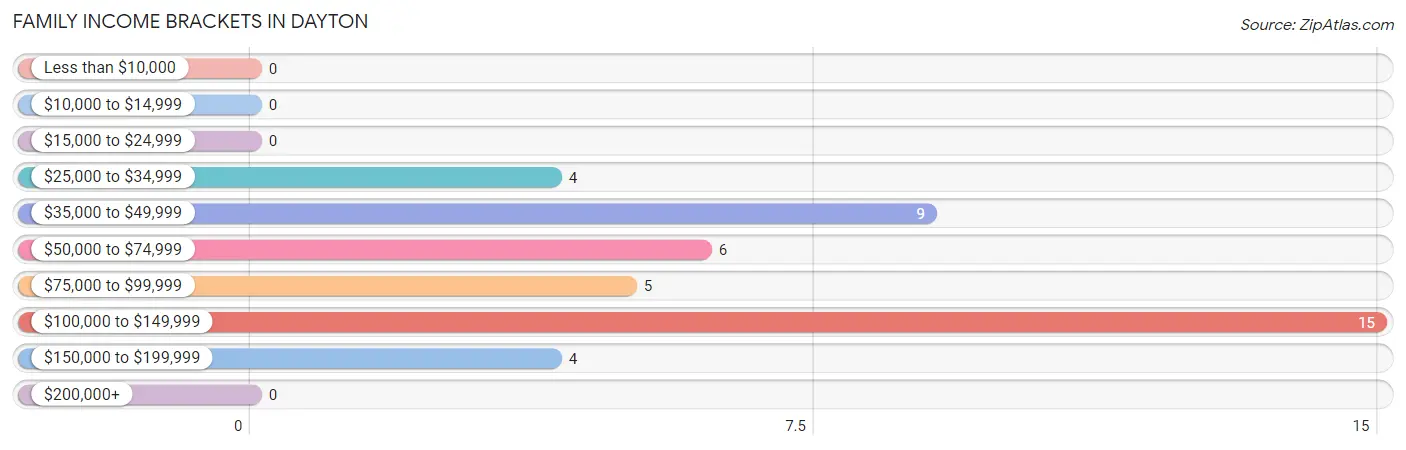
| Income Bracket | # Families | % Families |
| Less than $10,000 | 0 | 0.0% |
| $10,000 to $14,999 | 0 | 0.0% |
| $15,000 to $24,999 | 0 | 0.0% |
| $25,000 to $34,999 | 4 | 9.3% |
| $35,000 to $49,999 | 9 | 20.9% |
| $50,000 to $74,999 | 6 | 14.0% |
| $75,000 to $99,999 | 5 | 11.6% |
| $100,000 to $149,999 | 15 | 34.9% |
| $150,000 to $199,999 | 4 | 9.3% |
| $200,000+ | 0 | 0.0% |
Family Income by Famaliy Size in Dayton
2-person families (37 | 86.1%) account for the highest median family income in Dayton with $100,417 per family, while 2-person families (37 | 86.1%) have the highest median income of $50,208 per family member.
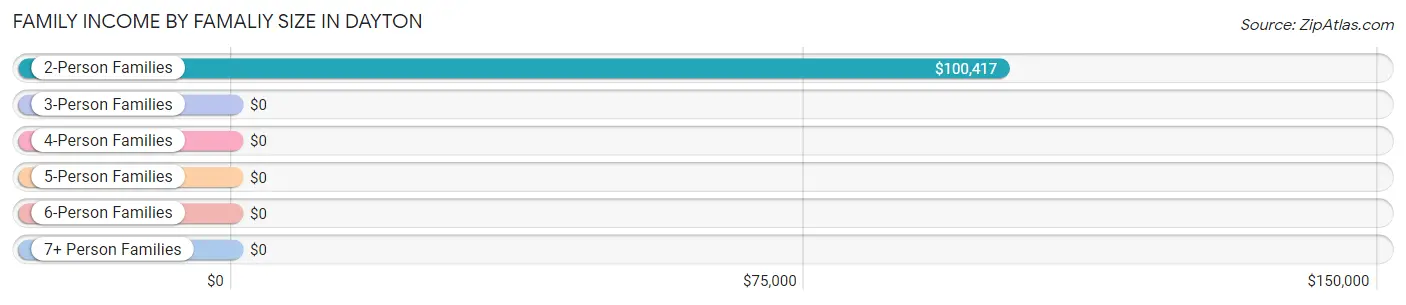
| Income Bracket | # Families | Median Income |
| 2-Person Families | 37 (86.1%) | $100,417 |
| 3-Person Families | 0 (0.0%) | $0 |
| 4-Person Families | 6 (14.0%) | $0 |
| 5-Person Families | 0 (0.0%) | $0 |
| 6-Person Families | 0 (0.0%) | $0 |
| 7+ Person Families | 0 (0.0%) | $0 |
| Total | 43 (100.0%) | $93,750 |
Family Income by Number of Earners in Dayton
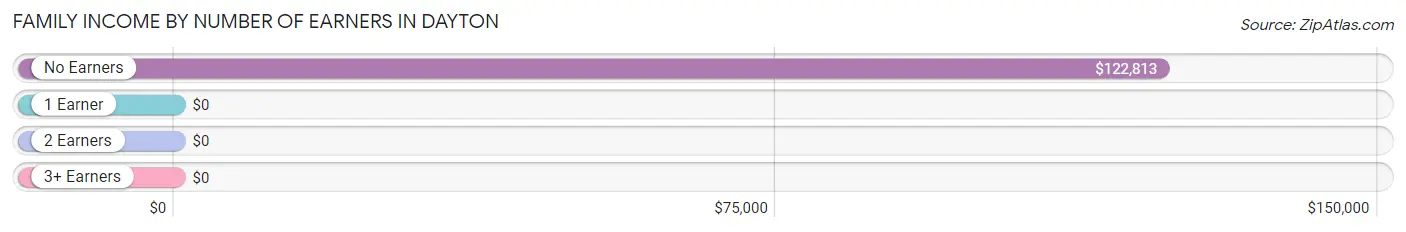
| Number of Earners | # Families | Median Income |
| No Earners | 30 (69.8%) | $122,813 |
| 1 Earner | 7 (16.3%) | $0 |
| 2 Earners | 6 (14.0%) | $0 |
| 3+ Earners | 0 (0.0%) | $0 |
| Total | 43 (100.0%) | $93,750 |
Household Income in Dayton
Household Income Brackets in Dayton
With 15 households falling in the category, the $100,000 to $149,999 income range is the most frequent in Dayton, accounting for 26.3% of all households.
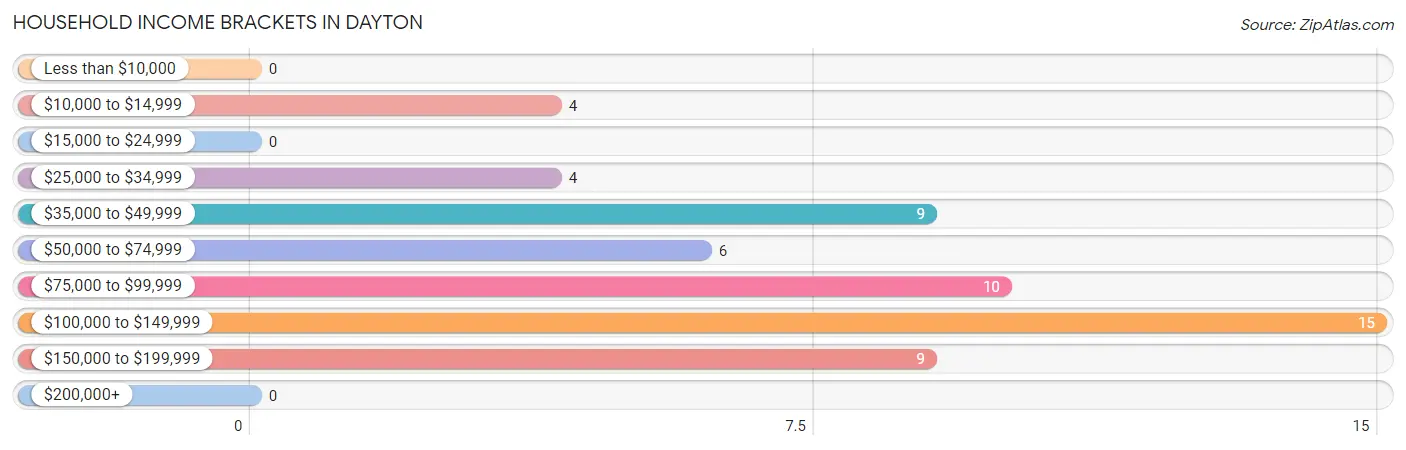
| Income Bracket | # Households | % Households |
| Less than $10,000 | 0 | 0.0% |
| $10,000 to $14,999 | 4 | 7.0% |
| $15,000 to $24,999 | 0 | 0.0% |
| $25,000 to $34,999 | 4 | 7.0% |
| $35,000 to $49,999 | 9 | 15.8% |
| $50,000 to $74,999 | 6 | 10.5% |
| $75,000 to $99,999 | 10 | 17.5% |
| $100,000 to $149,999 | 15 | 26.3% |
| $150,000 to $199,999 | 9 | 15.8% |
| $200,000+ | 0 | 0.0% |
Household Income by Householder Age in Dayton
The median household income in Dayton is $92,750, with the highest median household income of $94,750 found in the 65+ years age bracket for the primary householder. A total of 43 households (75.4%) fall into this category.
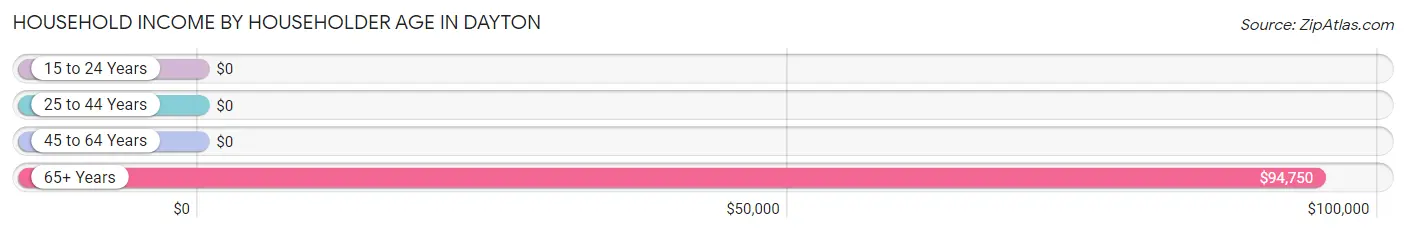
| Income Bracket | # Households | Median Income |
| 15 to 24 Years | 0 (0.0%) | $0 |
| 25 to 44 Years | 6 (10.5%) | $0 |
| 45 to 64 Years | 8 (14.0%) | $0 |
| 65+ Years | 43 (75.4%) | $94,750 |
| Total | 57 (100.0%) | $92,750 |
Poverty in Dayton
Income Below Poverty by Sex and Age in Dayton
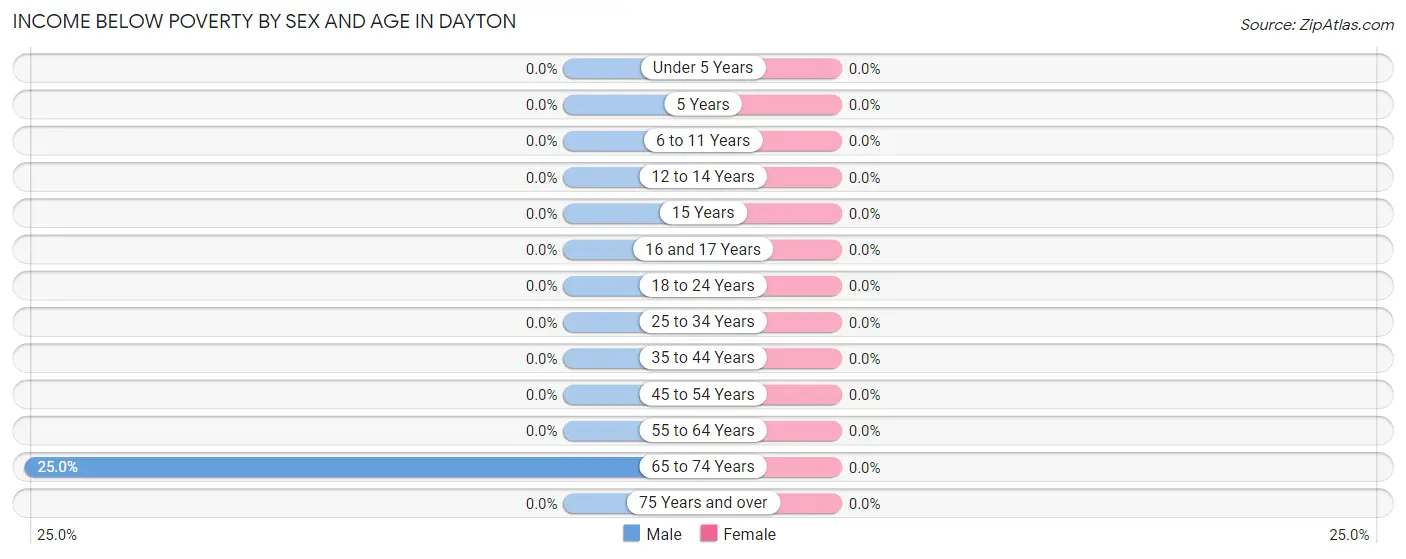
| Age Bracket | Male | Female |
| Under 5 Years | 0 (0.0%) | 0 (0.0%) |
| 5 Years | 0 (0.0%) | 0 (0.0%) |
| 6 to 11 Years | 0 (0.0%) | 0 (0.0%) |
| 12 to 14 Years | 0 (0.0%) | 0 (0.0%) |
| 15 Years | 0 (0.0%) | 0 (0.0%) |
| 16 and 17 Years | 0 (0.0%) | 0 (0.0%) |
| 18 to 24 Years | 0 (0.0%) | 0 (0.0%) |
| 25 to 34 Years | 0 (0.0%) | 0 (0.0%) |
| 35 to 44 Years | 0 (0.0%) | 0 (0.0%) |
| 45 to 54 Years | 0 (0.0%) | 0 (0.0%) |
| 55 to 64 Years | 0 (0.0%) | 0 (0.0%) |
| 65 to 74 Years | 4 (25.0%) | 0 (0.0%) |
| 75 Years and over | 0 (0.0%) | 0 (0.0%) |
| Total | 4 (7.5%) | 0 (0.0%) |
Income Above Poverty by Sex and Age in Dayton
According to the poverty statistics in Dayton, males aged 18 to 24 years and females aged under 5 years are the age groups that are most secure financially, with 100.0% of males and 100.0% of females in these age groups living above the poverty line.
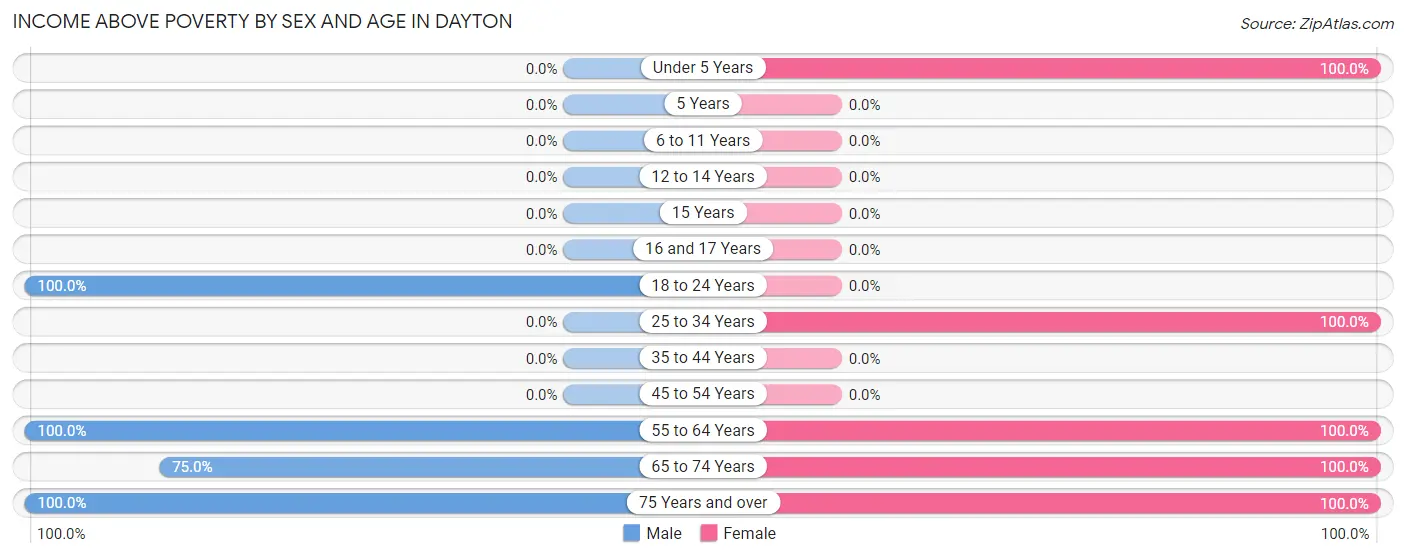
| Age Bracket | Male | Female |
| Under 5 Years | 0 (0.0%) | 13 (100.0%) |
| 5 Years | 0 (0.0%) | 0 (0.0%) |
| 6 to 11 Years | 0 (0.0%) | 0 (0.0%) |
| 12 to 14 Years | 0 (0.0%) | 0 (0.0%) |
| 15 Years | 0 (0.0%) | 0 (0.0%) |
| 16 and 17 Years | 0 (0.0%) | 0 (0.0%) |
| 18 to 24 Years | 7 (100.0%) | 0 (0.0%) |
| 25 to 34 Years | 0 (0.0%) | 6 (100.0%) |
| 35 to 44 Years | 0 (0.0%) | 0 (0.0%) |
| 45 to 54 Years | 0 (0.0%) | 0 (0.0%) |
| 55 to 64 Years | 8 (100.0%) | 12 (100.0%) |
| 65 to 74 Years | 12 (75.0%) | 23 (100.0%) |
| 75 Years and over | 22 (100.0%) | 7 (100.0%) |
| Total | 49 (92.4%) | 61 (100.0%) |
Income Below Poverty Among Married-Couple Families in Dayton
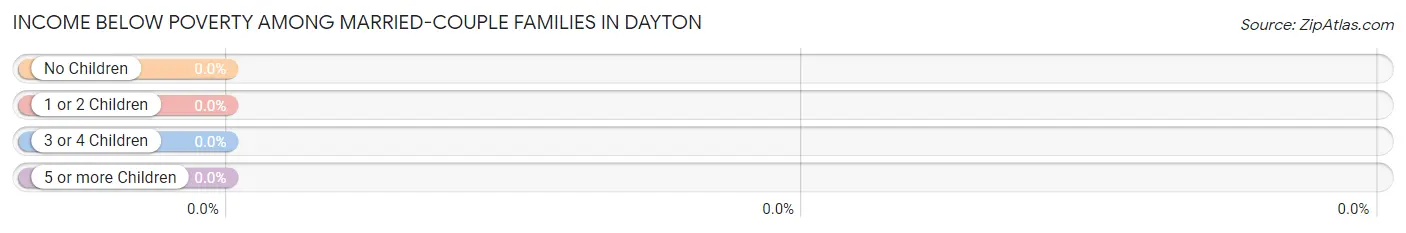
| Children | Above Poverty | Below Poverty |
| No Children | 37 (100.0%) | 0 (0.0%) |
| 1 or 2 Children | 6 (100.0%) | 0 (0.0%) |
| 3 or 4 Children | 0 (0.0%) | 0 (0.0%) |
| 5 or more Children | 0 (0.0%) | 0 (0.0%) |
| Total | 43 (100.0%) | 0 (0.0%) |
Income Below Poverty Among Single-Parent Households in Dayton
| Children | Single Father | Single Mother |
| No Children | 0 (0.0%) | 0 (0.0%) |
| 1 or 2 Children | 0 (0.0%) | 0 (0.0%) |
| 3 or 4 Children | 0 (0.0%) | 0 (0.0%) |
| 5 or more Children | 0 (0.0%) | 0 (0.0%) |
| Total | 0 (0.0%) | 0 (0.0%) |
Income Below Poverty Among Married-Couple vs Single-Parent Households in Dayton
| Children | Married-Couple Families | Single-Parent Households |
| No Children | 0 (0.0%) | 0 (0.0%) |
| 1 or 2 Children | 0 (0.0%) | 0 (0.0%) |
| 3 or 4 Children | 0 (0.0%) | 0 (0.0%) |
| 5 or more Children | 0 (0.0%) | 0 (0.0%) |
| Total | 0 (0.0%) | 0 (0.0%) |
Race in Dayton
The most populous races in Dayton are White / Caucasian (105 | 92.1%), and Native / Alaskan (9 | 7.9%).
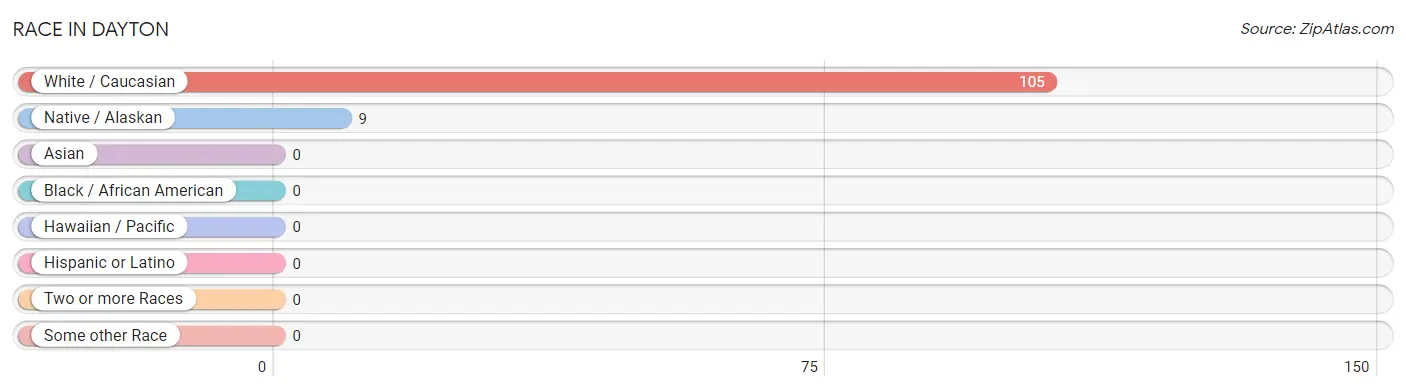
| Race | # Population | % Population |
| Asian | 0 | 0.0% |
| Black / African American | 0 | 0.0% |
| Hawaiian / Pacific | 0 | 0.0% |
| Hispanic or Latino | 0 | 0.0% |
| Native / Alaskan | 9 | 7.9% |
| White / Caucasian | 105 | 92.1% |
| Two or more Races | 0 | 0.0% |
| Some other Race | 0 | 0.0% |
| Total | 114 | 100.0% |
Ancestry in Dayton
The most populous ancestries reported in Dayton are American (20 | 17.5%), German (14 | 12.3%), Dutch (9 | 7.9%), English (9 | 7.9%), and Irish (9 | 7.9%), together accounting for 53.5% of all Dayton residents.
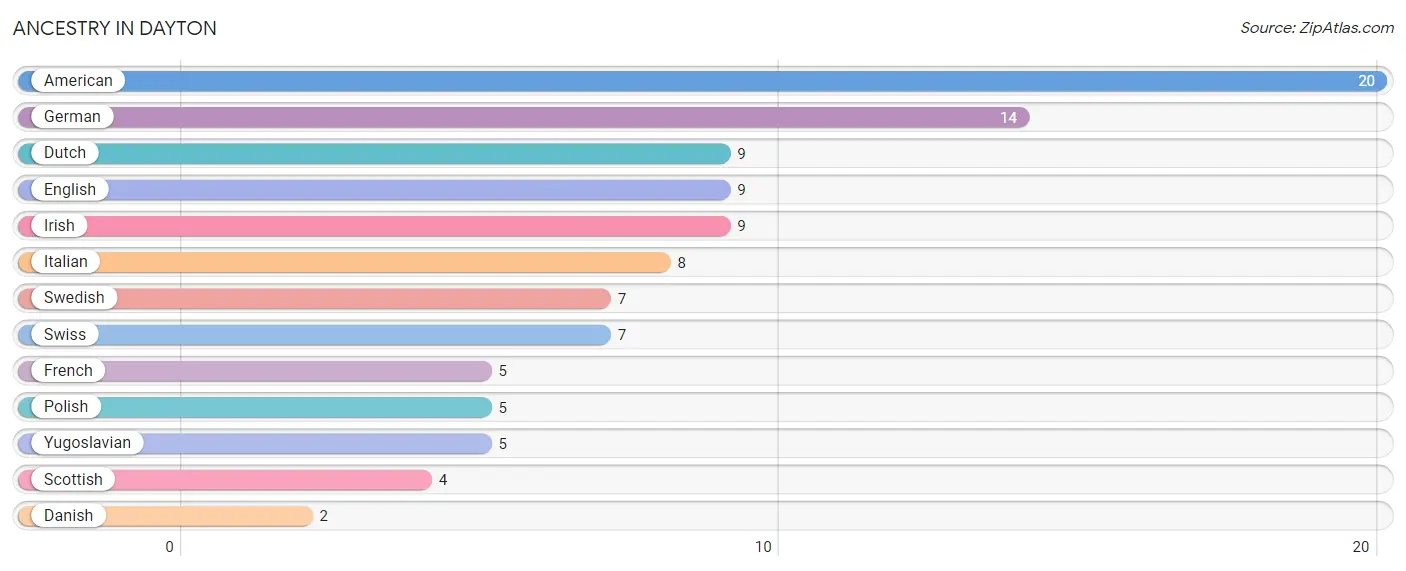
| Ancestry | # Population | % Population |
| American | 20 | 17.5% |
| Danish | 2 | 1.8% |
| Dutch | 9 | 7.9% |
| English | 9 | 7.9% |
| French | 5 | 4.4% |
| German | 14 | 12.3% |
| Irish | 9 | 7.9% |
| Italian | 8 | 7.0% |
| Polish | 5 | 4.4% |
| Scottish | 4 | 3.5% |
| Swedish | 7 | 6.1% |
| Swiss | 7 | 6.1% |
| Yugoslavian | 5 | 4.4% | View All 13 Rows |
Immigrants in Dayton
The most numerous immigrant groups reported in Dayton came from Europe (7 | 6.1%), Switzerland (7 | 6.1%), and Western Europe (7 | 6.1%), together accounting for 18.4% of all Dayton residents.
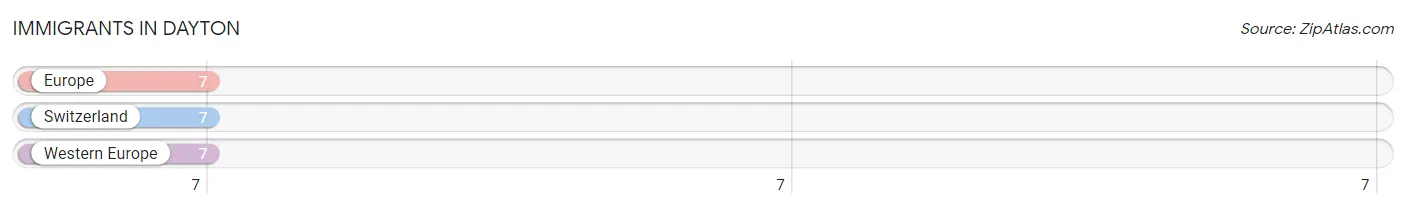
| Immigration Origin | # Population | % Population |
| Europe | 7 | 6.1% |
| Switzerland | 7 | 6.1% |
| Western Europe | 7 | 6.1% | View All 3 Rows |
Sex and Age in Dayton
Sex and Age in Dayton
The most populous age groups in Dayton are 70 to 74 Years (16 | 30.2%) for men and Under 5 Years (13 | 21.3%) for women.
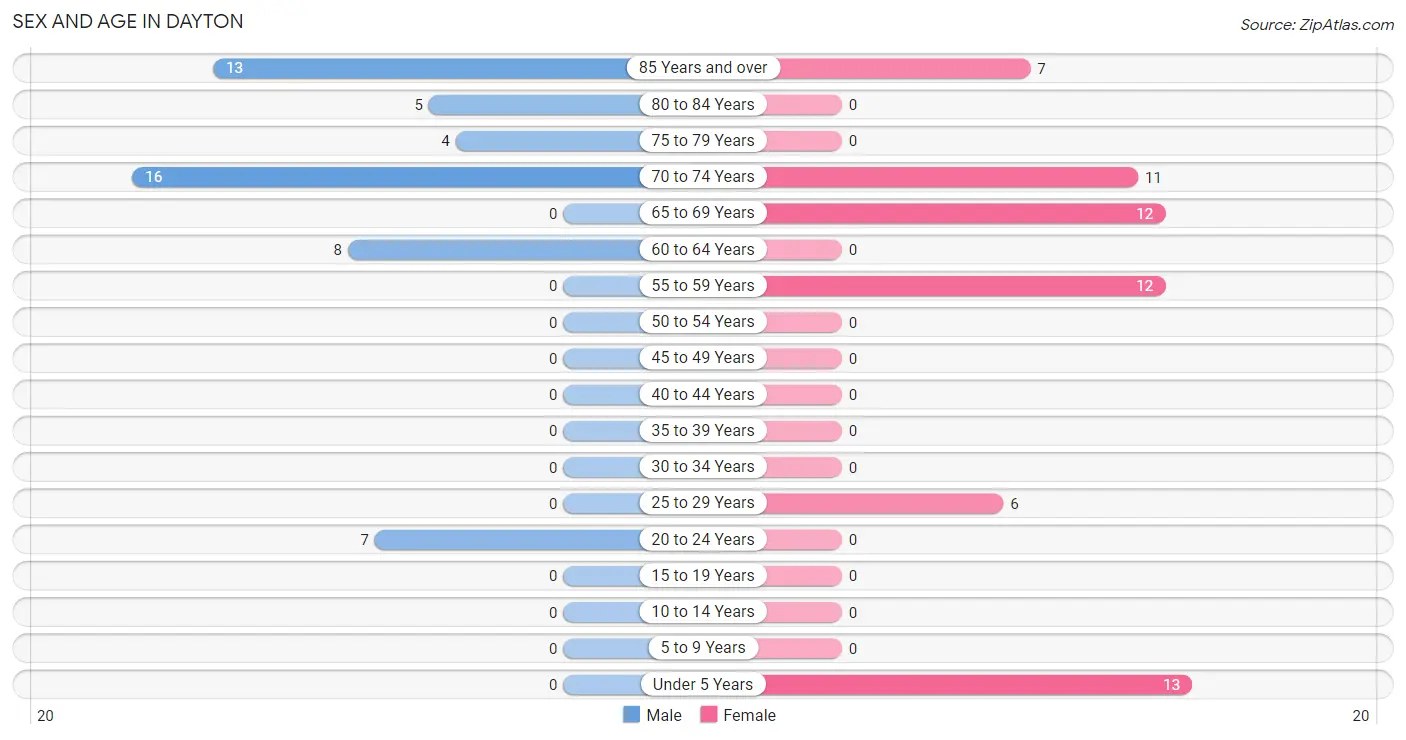
| Age Bracket | Male | Female |
| Under 5 Years | 0 (0.0%) | 13 (21.3%) |
| 5 to 9 Years | 0 (0.0%) | 0 (0.0%) |
| 10 to 14 Years | 0 (0.0%) | 0 (0.0%) |
| 15 to 19 Years | 0 (0.0%) | 0 (0.0%) |
| 20 to 24 Years | 7 (13.2%) | 0 (0.0%) |
| 25 to 29 Years | 0 (0.0%) | 6 (9.8%) |
| 30 to 34 Years | 0 (0.0%) | 0 (0.0%) |
| 35 to 39 Years | 0 (0.0%) | 0 (0.0%) |
| 40 to 44 Years | 0 (0.0%) | 0 (0.0%) |
| 45 to 49 Years | 0 (0.0%) | 0 (0.0%) |
| 50 to 54 Years | 0 (0.0%) | 0 (0.0%) |
| 55 to 59 Years | 0 (0.0%) | 12 (19.7%) |
| 60 to 64 Years | 8 (15.1%) | 0 (0.0%) |
| 65 to 69 Years | 0 (0.0%) | 12 (19.7%) |
| 70 to 74 Years | 16 (30.2%) | 11 (18.0%) |
| 75 to 79 Years | 4 (7.5%) | 0 (0.0%) |
| 80 to 84 Years | 5 (9.4%) | 0 (0.0%) |
| 85 Years and over | 13 (24.5%) | 7 (11.5%) |
| Total | 53 (100.0%) | 61 (100.0%) |
Families and Households in Dayton
Median Family Size in Dayton
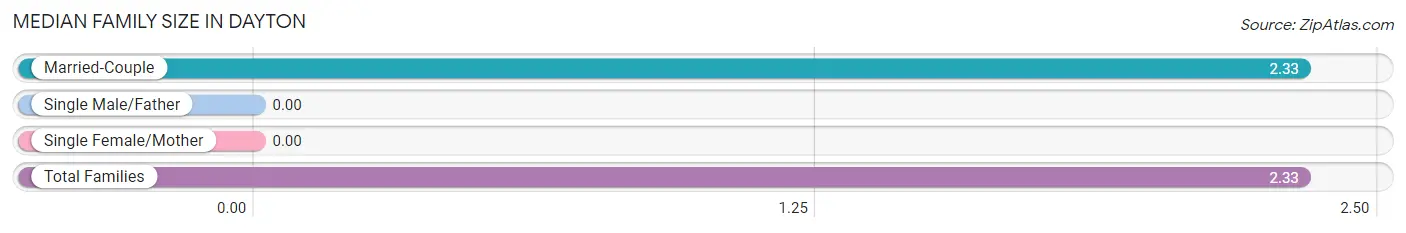
| Family Type | # Families | Family Size |
| Married-Couple | 43 (100.0%) | 2.33 |
| Single Male/Father | 0 (0.0%) | - |
| Single Female/Mother | 0 (0.0%) | - |
| Total Families | 43 (100.0%) | 2.33 |
Median Household Size in Dayton
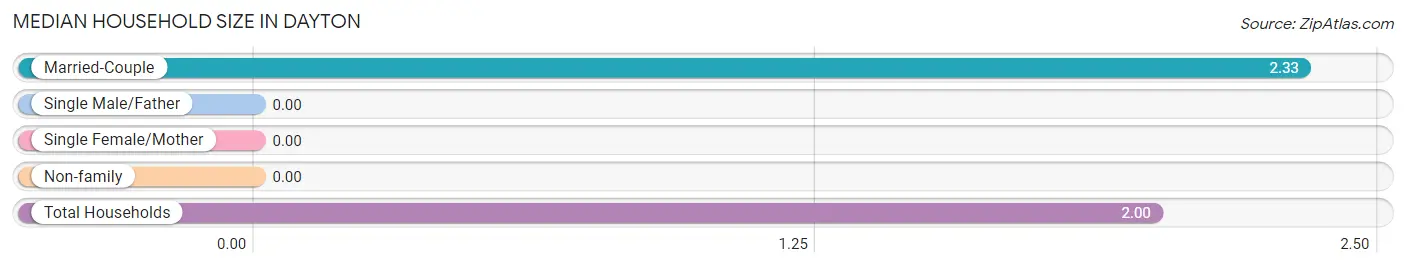
| Household Type | # Households | Household Size |
| Married-Couple | 43 (75.4%) | 2.33 |
| Single Male/Father | 0 (0.0%) | - |
| Single Female/Mother | 0 (0.0%) | - |
| Non-family | 14 (24.6%) | - |
| Total Households | 57 (100.0%) | 2.00 |
Household Size by Marriage Status in Dayton
Out of a total of 57 households in Dayton, 43 (75.4%) are family households, while 14 (24.6%) are nonfamily households. The most numerous type of family households are 2-person households, comprising 37, and the most common type of nonfamily households are 1-person households, comprising 14.
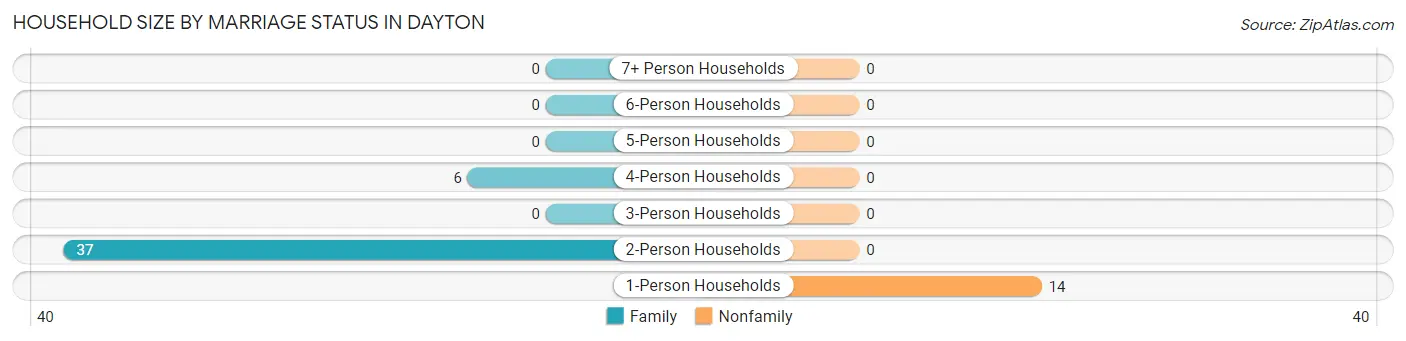
| Household Size | Family Households | Nonfamily Households |
| 1-Person Households | - | 14 (24.6%) |
| 2-Person Households | 37 (64.9%) | 0 (0.0%) |
| 3-Person Households | 0 (0.0%) | 0 (0.0%) |
| 4-Person Households | 6 (10.5%) | 0 (0.0%) |
| 5-Person Households | 0 (0.0%) | 0 (0.0%) |
| 6-Person Households | 0 (0.0%) | 0 (0.0%) |
| 7+ Person Households | 0 (0.0%) | 0 (0.0%) |
| Total | 43 (75.4%) | 14 (24.6%) |
Female Fertility in Dayton
Fertility by Age in Dayton
| Age Bracket | Women with Births | Births / 1,000 Women |
| 15 to 19 years | 0 (0.0%) | 0.0 |
| 20 to 34 years | 0 (0.0%) | 0.0 |
| 35 to 50 years | 0 (0.0%) | 0.0 |
| Total | 0 (0.0%) | 0.0 |
Fertility by Age by Marriage Status in Dayton
| Age Bracket | Married | Unmarried |
| 15 to 19 years | 0 (0.0%) | 0 (0.0%) |
| 20 to 34 years | 0 (0.0%) | 0 (0.0%) |
| 35 to 50 years | 0 (0.0%) | 0 (0.0%) |
| Total | 0 (0.0%) | 0 (0.0%) |
Fertility by Education in Dayton
| Educational Attainment | Women with Births | Births / 1,000 Women |
| Less than High School | 0 (0.0%) | 0.0 |
| High School Diploma | 0 (0.0%) | 0.0 |
| College or Associate's Degree | 0 (0.0%) | 0.0 |
| Bachelor's Degree | 0 (0.0%) | 0.0 |
| Graduate Degree | 0 (0.0%) | 0.0 |
| Total | 0 (0.0%) | 0.0 |
Fertility by Education by Marriage Status in Dayton
| Educational Attainment | Married | Unmarried |
| Less than High School | 0 (0.0%) | 0 (0.0%) |
| High School Diploma | 0 (0.0%) | 0 (0.0%) |
| College or Associate's Degree | 0 (0.0%) | 0 (0.0%) |
| Bachelor's Degree | 0 (0.0%) | 0 (0.0%) |
| Graduate Degree | 0 (0.0%) | 0 (0.0%) |
| Total | 0 (0.0%) | 0 (0.0%) |
Employment Characteristics in Dayton
Employment by Class of Employer in Dayton
Among the 14 employed individuals in Dayton, , and private company employees (14 | 100.0%) make up the most common classes of employment.
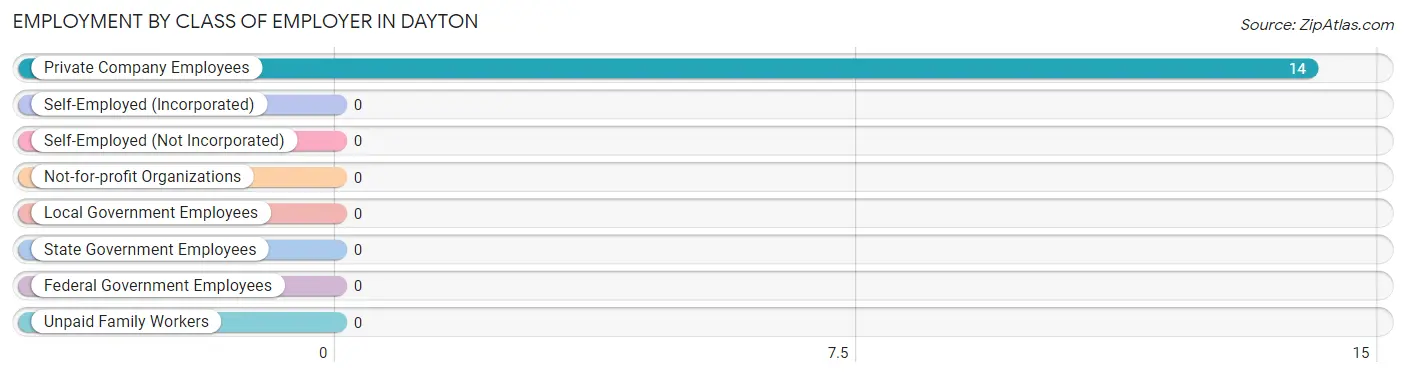
| Employer Class | # Employees | % Employees |
| Private Company Employees | 14 | 100.0% |
| Self-Employed (Incorporated) | 0 | 0.0% |
| Self-Employed (Not Incorporated) | 0 | 0.0% |
| Not-for-profit Organizations | 0 | 0.0% |
| Local Government Employees | 0 | 0.0% |
| State Government Employees | 0 | 0.0% |
| Federal Government Employees | 0 | 0.0% |
| Unpaid Family Workers | 0 | 0.0% |
| Total | 14 | 100.0% |
Employment Status by Age in Dayton
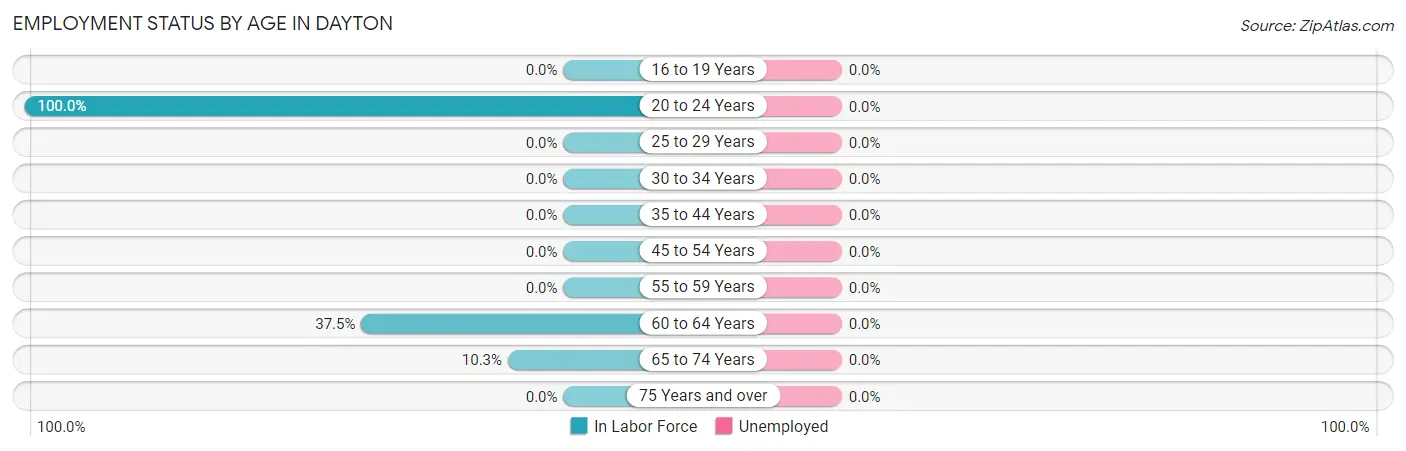
| Age Bracket | In Labor Force | Unemployed |
| 16 to 19 Years | 0 (0.0%) | 0 (0.0%) |
| 20 to 24 Years | 7 (100.0%) | 0 (0.0%) |
| 25 to 29 Years | 0 (0.0%) | 0 (0.0%) |
| 30 to 34 Years | 0 (0.0%) | 0 (0.0%) |
| 35 to 44 Years | 0 (0.0%) | 0 (0.0%) |
| 45 to 54 Years | 0 (0.0%) | 0 (0.0%) |
| 55 to 59 Years | 0 (0.0%) | 0 (0.0%) |
| 60 to 64 Years | 3 (37.5%) | 0 (0.0%) |
| 65 to 74 Years | 4 (10.3%) | 0 (0.0%) |
| 75 Years and over | 0 (0.0%) | 0 (0.0%) |
| Total | 14 (13.9%) | 0 (0.0%) |
Employment Status by Educational Attainment in Dayton
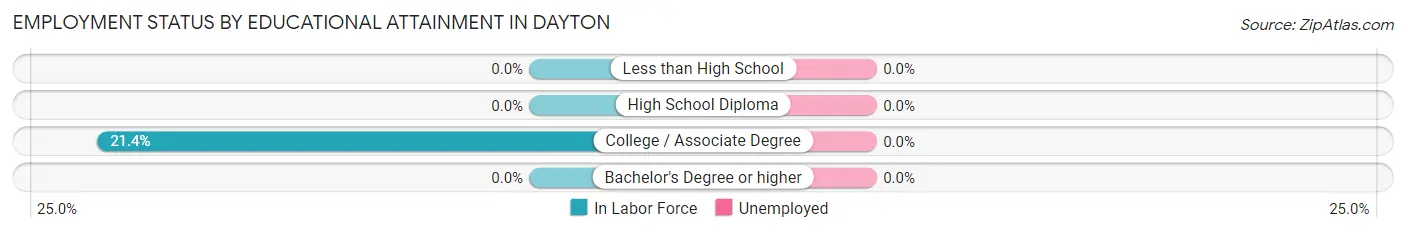
| Educational Attainment | In Labor Force | Unemployed |
| Less than High School | 0 (0.0%) | 0 (0.0%) |
| High School Diploma | 0 (0.0%) | 0 (0.0%) |
| College / Associate Degree | 3 (21.4%) | 0 (0.0%) |
| Bachelor's Degree or higher | 0 (0.0%) | 0 (0.0%) |
| Total | 3 (11.5%) | 0 (0.0%) |
Employment Occupations by Sex in Dayton
Management, Business, Science and Arts Occupations
The most common Management, Business, Science and Arts occupations in Dayton are , and Management (3 | 21.4%).
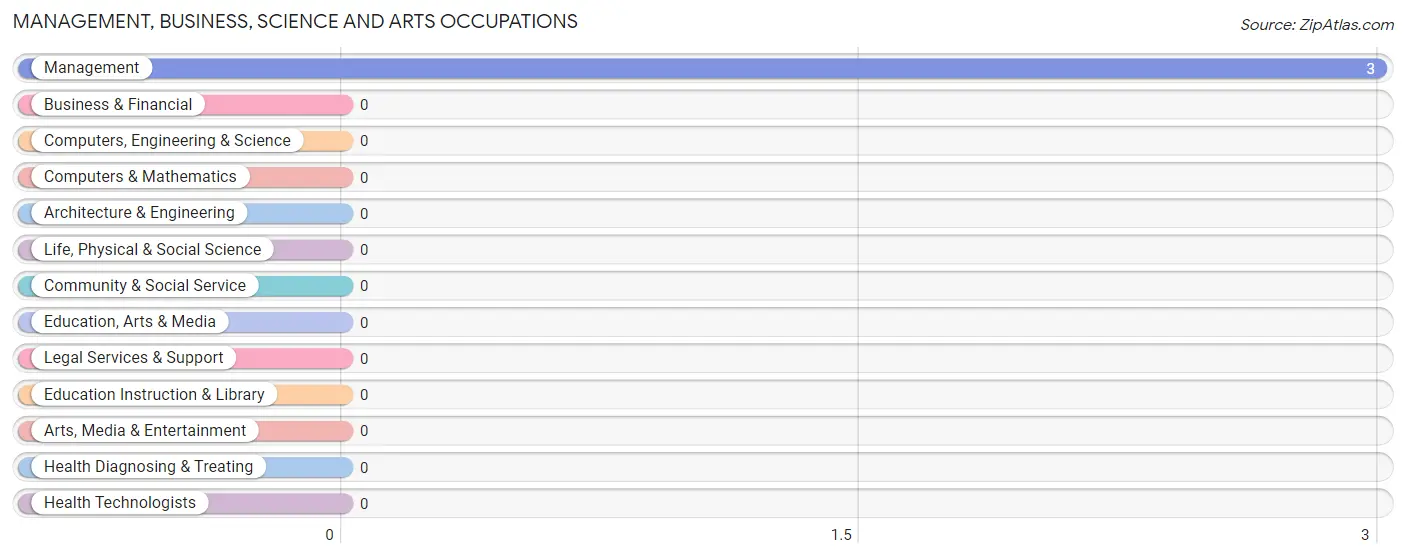
Management, Business, Science and Arts Occupations by Sex
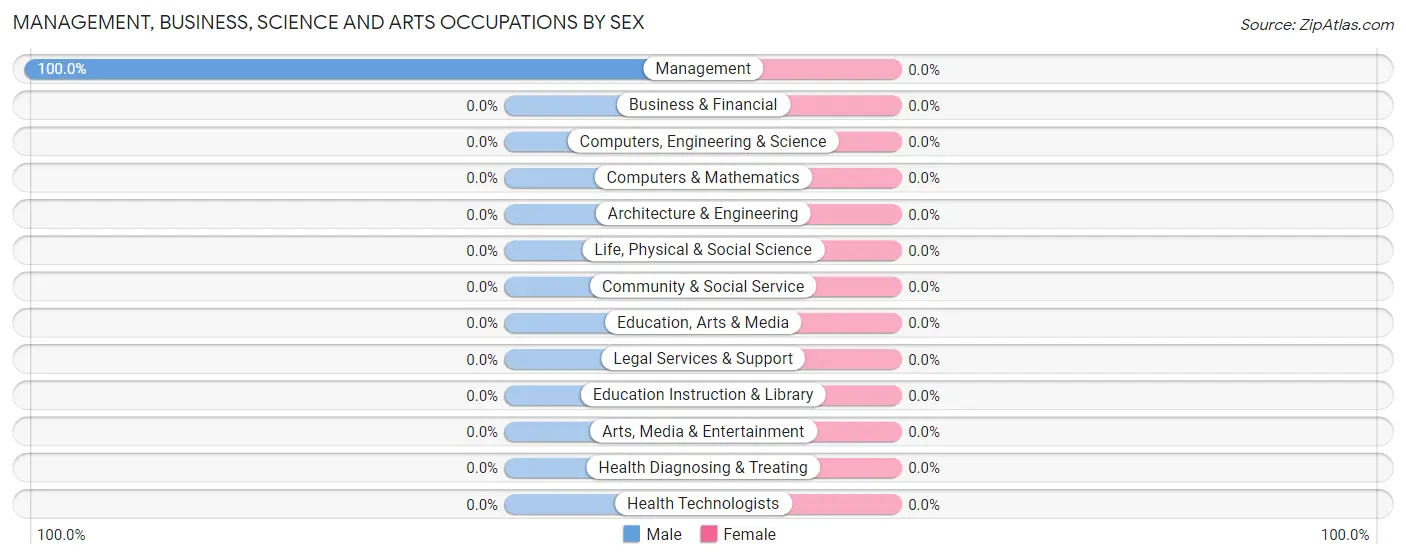
| Occupation | Male | Female |
| Management | 3 (100.0%) | 0 (0.0%) |
| Business & Financial | 0 (0.0%) | 0 (0.0%) |
| Computers, Engineering & Science | 0 (0.0%) | 0 (0.0%) |
| Computers & Mathematics | 0 (0.0%) | 0 (0.0%) |
| Architecture & Engineering | 0 (0.0%) | 0 (0.0%) |
| Life, Physical & Social Science | 0 (0.0%) | 0 (0.0%) |
| Community & Social Service | 0 (0.0%) | 0 (0.0%) |
| Education, Arts & Media | 0 (0.0%) | 0 (0.0%) |
| Legal Services & Support | 0 (0.0%) | 0 (0.0%) |
| Education Instruction & Library | 0 (0.0%) | 0 (0.0%) |
| Arts, Media & Entertainment | 0 (0.0%) | 0 (0.0%) |
| Health Diagnosing & Treating | 0 (0.0%) | 0 (0.0%) |
| Health Technologists | 0 (0.0%) | 0 (0.0%) |
| Total (Category) | 3 (100.0%) | 0 (0.0%) |
| Total (Overall) | 14 (100.0%) | 0 (0.0%) |
Services Occupations
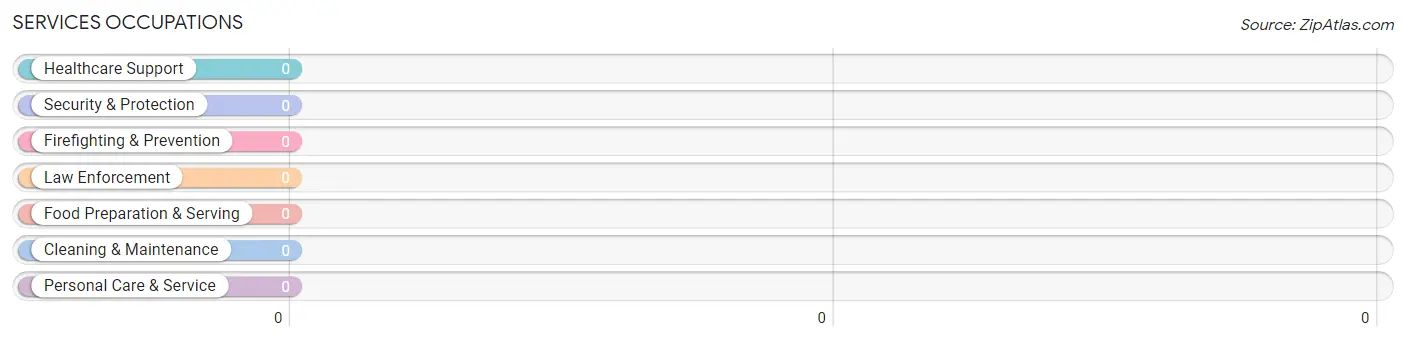
Services Occupations by Sex
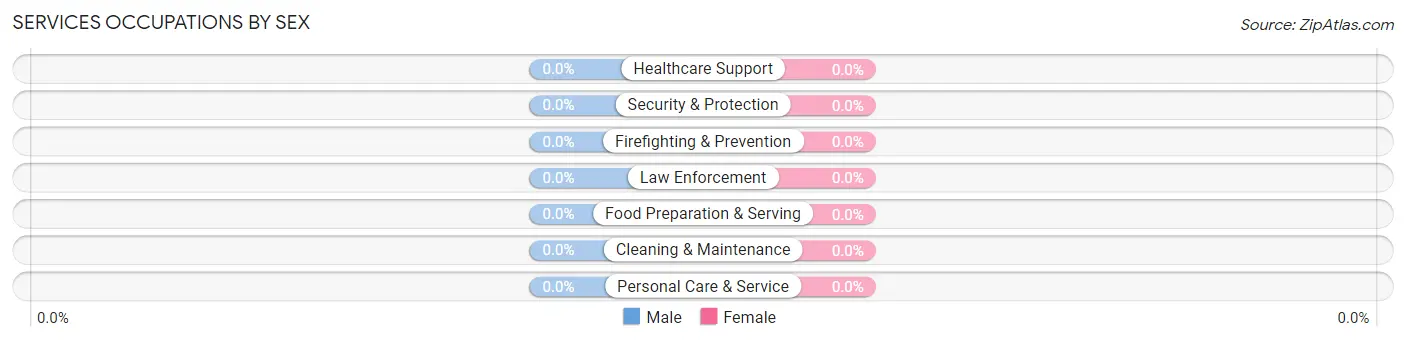
| Occupation | Male | Female |
| Healthcare Support | 0 (0.0%) | 0 (0.0%) |
| Security & Protection | 0 (0.0%) | 0 (0.0%) |
| Firefighting & Prevention | 0 (0.0%) | 0 (0.0%) |
| Law Enforcement | 0 (0.0%) | 0 (0.0%) |
| Food Preparation & Serving | 0 (0.0%) | 0 (0.0%) |
| Cleaning & Maintenance | 0 (0.0%) | 0 (0.0%) |
| Personal Care & Service | 0 (0.0%) | 0 (0.0%) |
| Total (Category) | 0 (0.0%) | 0 (0.0%) |
| Total (Overall) | 14 (100.0%) | 0 (0.0%) |
Sales and Office Occupations
Sales and Office Occupations by Sex
| Occupation | Male | Female |
| Sales & Related | 0 (0.0%) | 0 (0.0%) |
| Office & Administration | 0 (0.0%) | 0 (0.0%) |
| Total (Category) | 0 (0.0%) | 0 (0.0%) |
| Total (Overall) | 14 (100.0%) | 0 (0.0%) |
Natural Resources, Construction and Maintenance Occupations
Natural Resources, Construction and Maintenance Occupations by Sex
| Occupation | Male | Female |
| Farming, Fishing & Forestry | 0 (0.0%) | 0 (0.0%) |
| Construction & Extraction | 0 (0.0%) | 0 (0.0%) |
| Installation, Maintenance & Repair | 0 (0.0%) | 0 (0.0%) |
| Total (Category) | 0 (0.0%) | 0 (0.0%) |
| Total (Overall) | 14 (100.0%) | 0 (0.0%) |
Production, Transportation and Moving Occupations
The most common Production, Transportation and Moving occupations in Dayton are , and Transportation (11 | 78.6%).
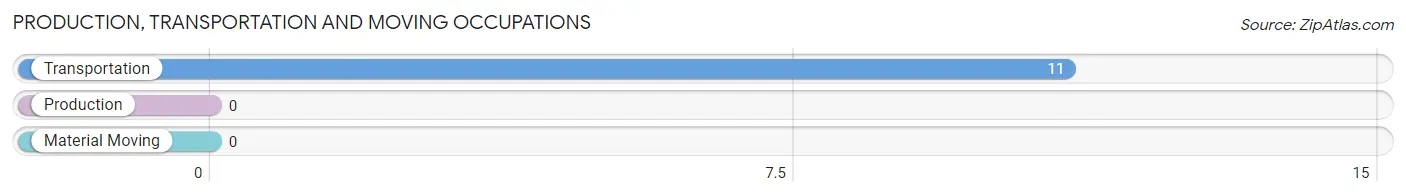
Production, Transportation and Moving Occupations by Sex
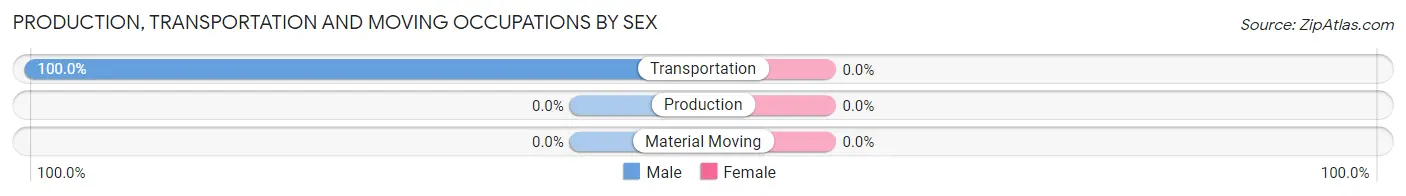
| Occupation | Male | Female |
| Production | 0 (0.0%) | 0 (0.0%) |
| Transportation | 11 (100.0%) | 0 (0.0%) |
| Material Moving | 0 (0.0%) | 0 (0.0%) |
| Total (Category) | 11 (100.0%) | 0 (0.0%) |
| Total (Overall) | 14 (100.0%) | 0 (0.0%) |
Employment Industries by Sex in Dayton
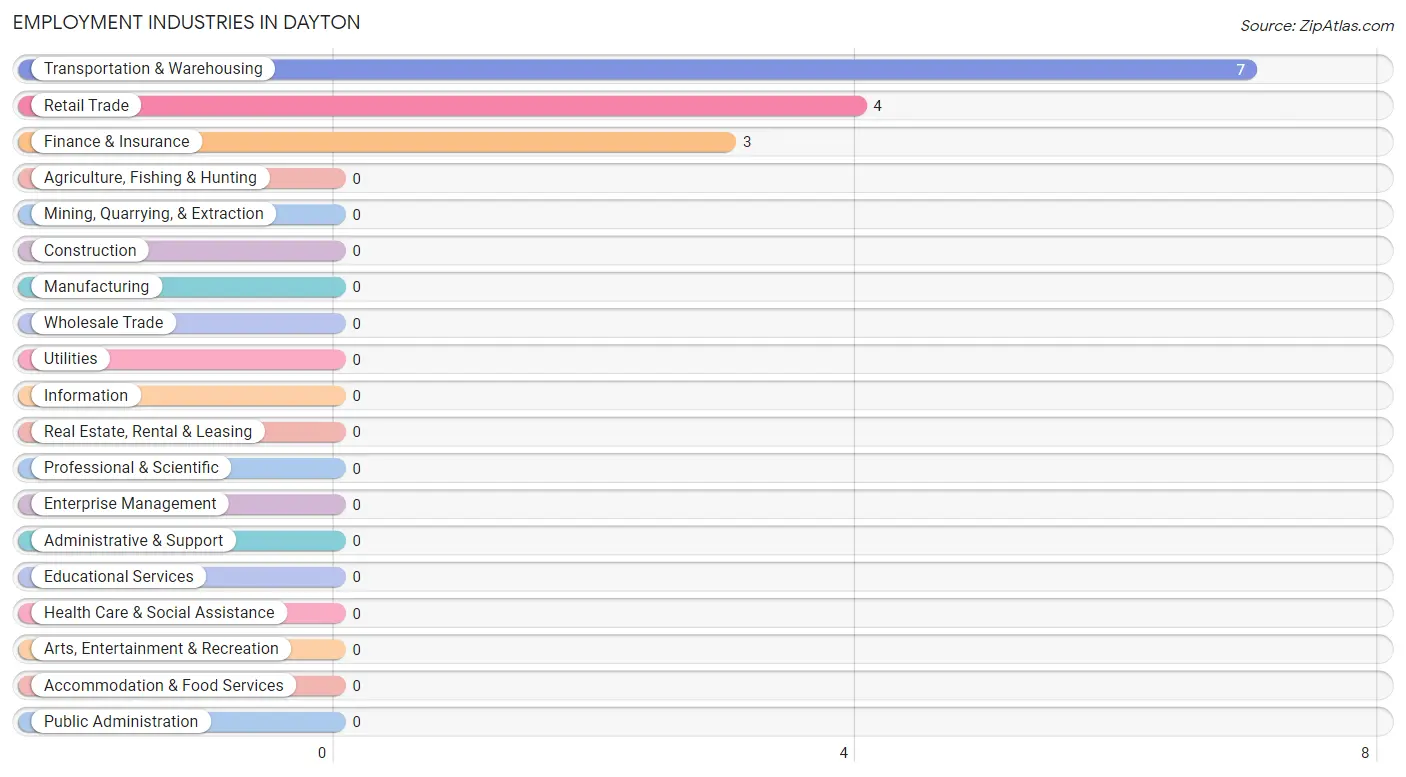
Employment Industries in Dayton
The major employment industries in Dayton include Transportation & Warehousing (7 | 50.0%), Retail Trade (4 | 28.6%), and Finance & Insurance (3 | 21.4%).
Employment Industries by Sex in Dayton
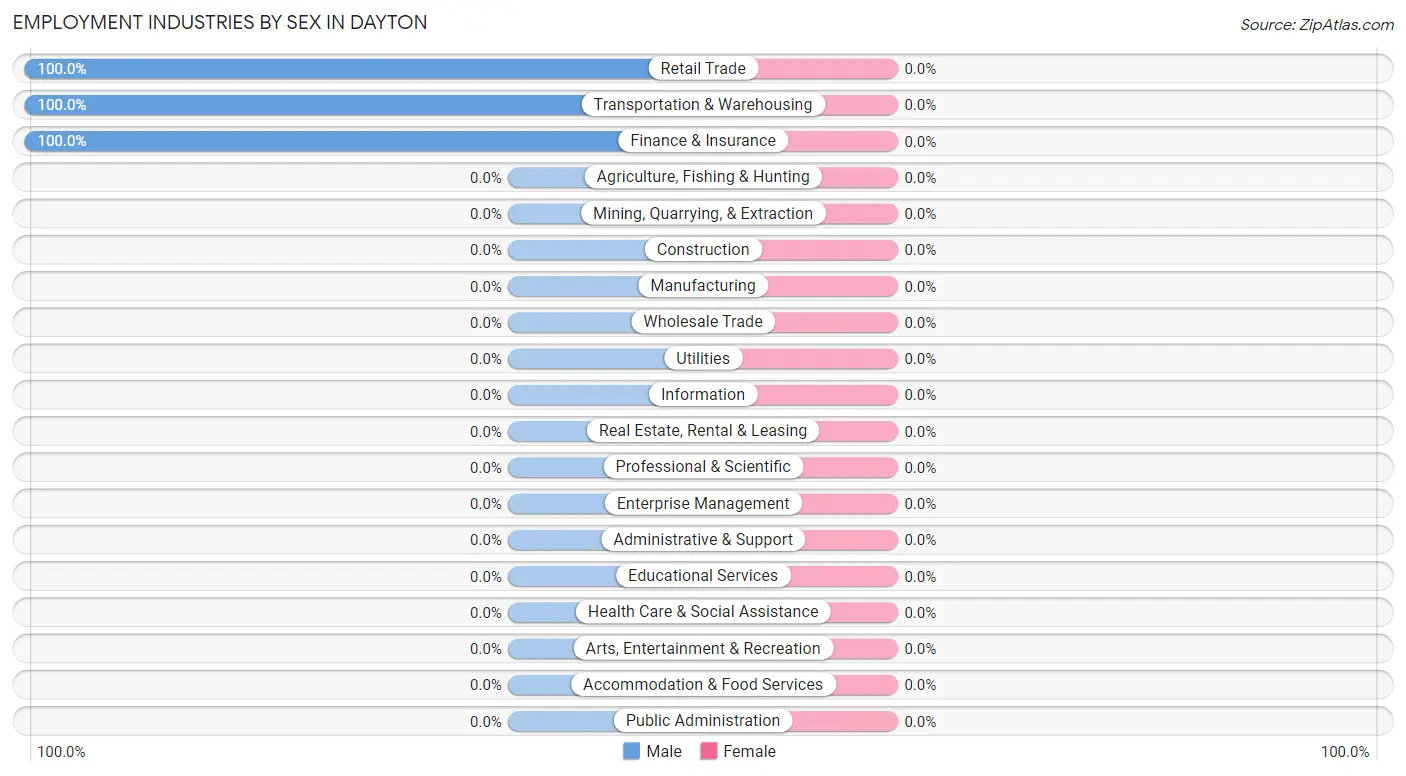
| Industry | Male | Female |
| Agriculture, Fishing & Hunting | 0 (0.0%) | 0 (0.0%) |
| Mining, Quarrying, & Extraction | 0 (0.0%) | 0 (0.0%) |
| Construction | 0 (0.0%) | 0 (0.0%) |
| Manufacturing | 0 (0.0%) | 0 (0.0%) |
| Wholesale Trade | 0 (0.0%) | 0 (0.0%) |
| Retail Trade | 4 (100.0%) | 0 (0.0%) |
| Transportation & Warehousing | 7 (100.0%) | 0 (0.0%) |
| Utilities | 0 (0.0%) | 0 (0.0%) |
| Information | 0 (0.0%) | 0 (0.0%) |
| Finance & Insurance | 3 (100.0%) | 0 (0.0%) |
| Real Estate, Rental & Leasing | 0 (0.0%) | 0 (0.0%) |
| Professional & Scientific | 0 (0.0%) | 0 (0.0%) |
| Enterprise Management | 0 (0.0%) | 0 (0.0%) |
| Administrative & Support | 0 (0.0%) | 0 (0.0%) |
| Educational Services | 0 (0.0%) | 0 (0.0%) |
| Health Care & Social Assistance | 0 (0.0%) | 0 (0.0%) |
| Arts, Entertainment & Recreation | 0 (0.0%) | 0 (0.0%) |
| Accommodation & Food Services | 0 (0.0%) | 0 (0.0%) |
| Public Administration | 0 (0.0%) | 0 (0.0%) |
| Total | 14 (100.0%) | 0 (0.0%) |
Education in Dayton
School Enrollment in Dayton
| School Level | # Students | % Students |
| Nursery / Preschool | 0 | 0.0% |
| Kindergarten | 0 | 0.0% |
| Elementary School | 0 | 0.0% |
| Middle School | 0 | 0.0% |
| High School | 0 | 0.0% |
| College / Undergraduate | 0 | 0.0% |
| Graduate / Professional | 0 | 0.0% |
| Total | 0 | 0.0% |
School Enrollment by Age by Funding Source in Dayton
| Age Bracket | Public School | Private School |
| 3 to 4 Year Olds | 0 (0.0%) | 0 (0.0%) |
| 5 to 9 Year Old | 0 (0.0%) | 0 (0.0%) |
| 10 to 14 Year Olds | 0 (0.0%) | 0 (0.0%) |
| 15 to 17 Year Olds | 0 (0.0%) | 0 (0.0%) |
| 18 to 19 Year Olds | 0 (0.0%) | 0 (0.0%) |
| 20 to 24 Year Olds | 0 (0.0%) | 0 (0.0%) |
| 25 to 34 Year Olds | 0 (0.0%) | 0 (0.0%) |
| 35 Years and over | 0 (0.0%) | 0 (0.0%) |
| Total | 0 (0.0%) | 0 (0.0%) |
Educational Attainment by Field of Study in Dayton
Business (12 | 23.5%), bio, nature & agricultural (8 | 15.7%), education (8 | 15.7%), psychology (5 | 9.8%), and engineering (5 | 9.8%) are the most common fields of study among 51 individuals in Dayton who have obtained a bachelor's degree or higher.
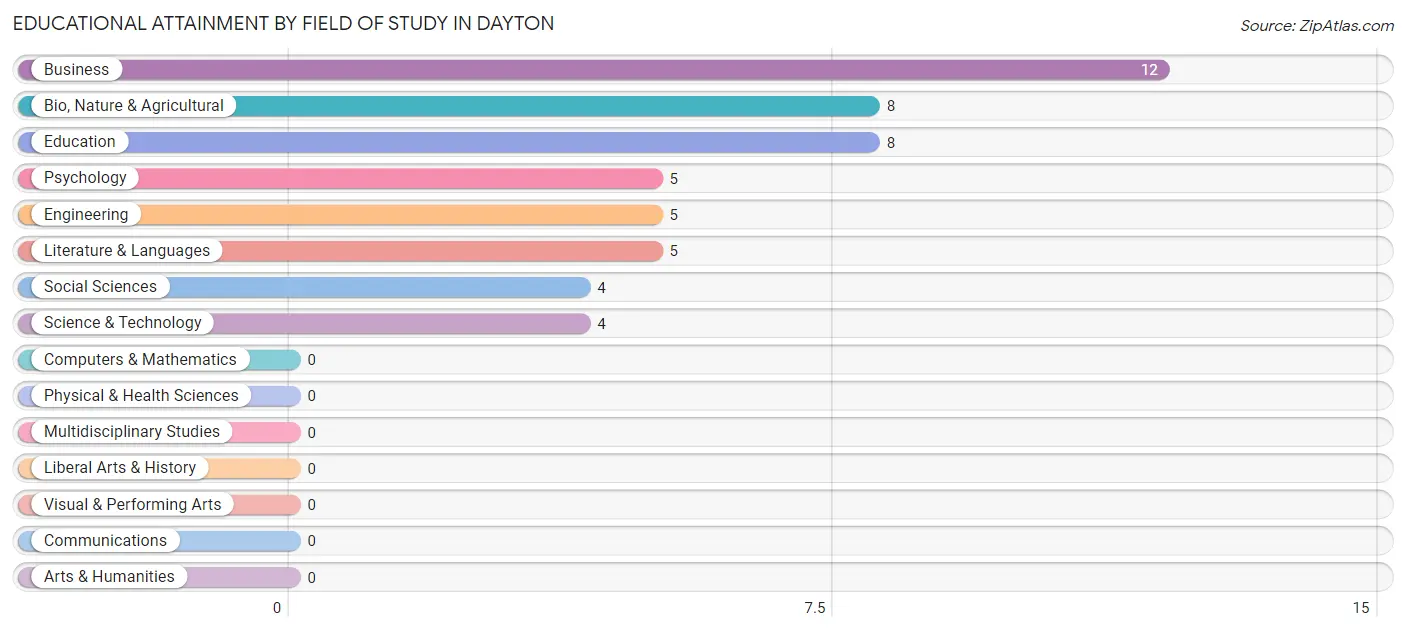
| Field of Study | # Graduates | % Graduates |
| Computers & Mathematics | 0 | 0.0% |
| Bio, Nature & Agricultural | 8 | 15.7% |
| Physical & Health Sciences | 0 | 0.0% |
| Psychology | 5 | 9.8% |
| Social Sciences | 4 | 7.8% |
| Engineering | 5 | 9.8% |
| Multidisciplinary Studies | 0 | 0.0% |
| Science & Technology | 4 | 7.8% |
| Business | 12 | 23.5% |
| Education | 8 | 15.7% |
| Literature & Languages | 5 | 9.8% |
| Liberal Arts & History | 0 | 0.0% |
| Visual & Performing Arts | 0 | 0.0% |
| Communications | 0 | 0.0% |
| Arts & Humanities | 0 | 0.0% |
| Total | 51 | 100.0% |
Transportation & Commute in Dayton
Vehicle Availability by Sex in Dayton
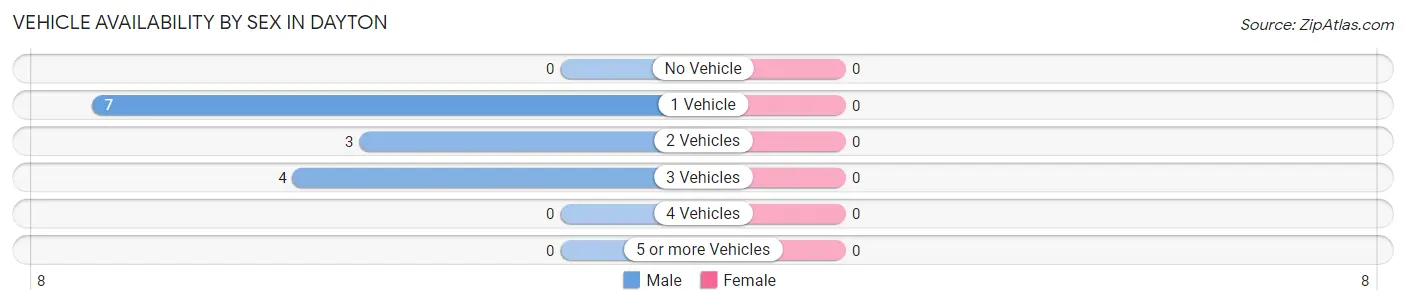
| Vehicles Available | Male | Female |
| No Vehicle | 0 (0.0%) | 0 (0.0%) |
| 1 Vehicle | 7 (50.0%) | 0 (0.0%) |
| 2 Vehicles | 3 (21.4%) | 0 (0.0%) |
| 3 Vehicles | 4 (28.6%) | 0 (0.0%) |
| 4 Vehicles | 0 (0.0%) | 0 (0.0%) |
| 5 or more Vehicles | 0 (0.0%) | 0 (0.0%) |
| Total | 14 (100.0%) | 0 (0.0%) |
Commute Time in Dayton
The most frequently occuring commute durations in Dayton are 25 to 29 minutes (7 commuters, 50.0%), 30 to 34 minutes (4 commuters, 28.6%), and 90 or more minutes (3 commuters, 21.4%).
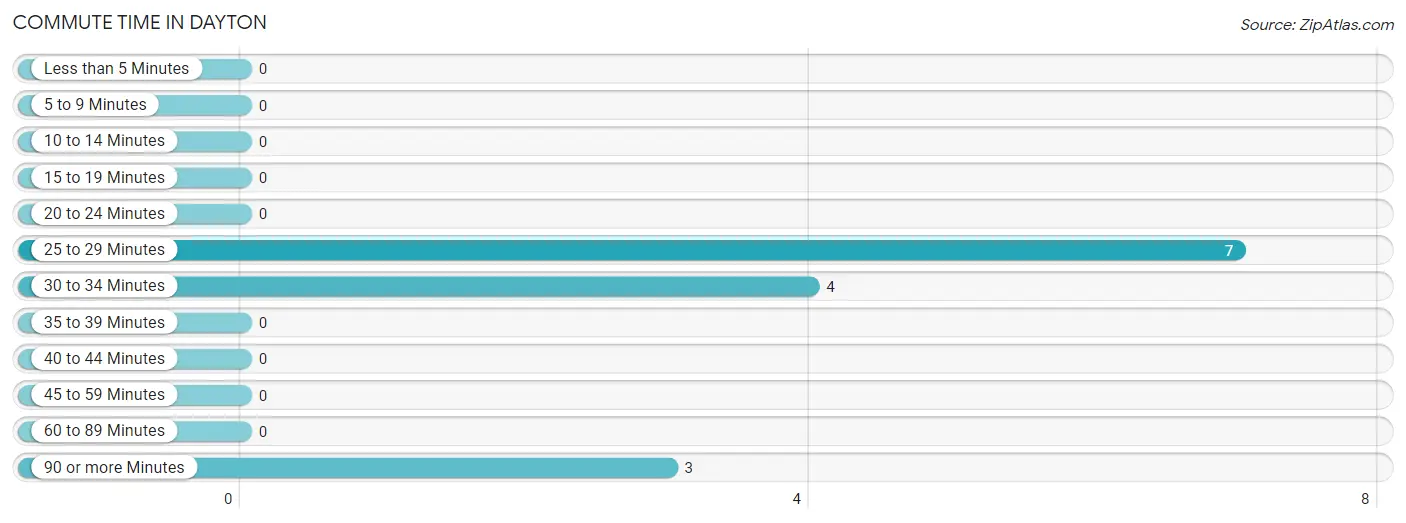
| Commute Time | # Commuters | % Commuters |
| Less than 5 Minutes | 0 | 0.0% |
| 5 to 9 Minutes | 0 | 0.0% |
| 10 to 14 Minutes | 0 | 0.0% |
| 15 to 19 Minutes | 0 | 0.0% |
| 20 to 24 Minutes | 0 | 0.0% |
| 25 to 29 Minutes | 7 | 50.0% |
| 30 to 34 Minutes | 4 | 28.6% |
| 35 to 39 Minutes | 0 | 0.0% |
| 40 to 44 Minutes | 0 | 0.0% |
| 45 to 59 Minutes | 0 | 0.0% |
| 60 to 89 Minutes | 0 | 0.0% |
| 90 or more Minutes | 3 | 21.4% |
Commute Time by Sex in Dayton
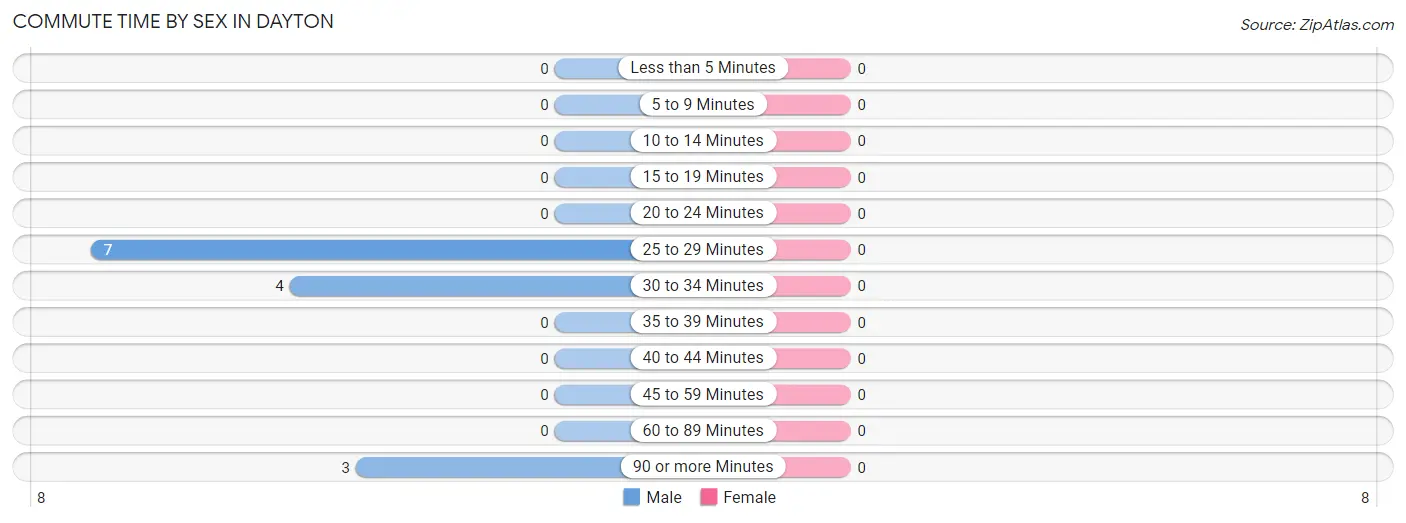
| Commute Time | Male | Female |
| Less than 5 Minutes | 0 (0.0%) | 0 (0.0%) |
| 5 to 9 Minutes | 0 (0.0%) | 0 (0.0%) |
| 10 to 14 Minutes | 0 (0.0%) | 0 (0.0%) |
| 15 to 19 Minutes | 0 (0.0%) | 0 (0.0%) |
| 20 to 24 Minutes | 0 (0.0%) | 0 (0.0%) |
| 25 to 29 Minutes | 7 (50.0%) | 0 (0.0%) |
| 30 to 34 Minutes | 4 (28.6%) | 0 (0.0%) |
| 35 to 39 Minutes | 0 (0.0%) | 0 (0.0%) |
| 40 to 44 Minutes | 0 (0.0%) | 0 (0.0%) |
| 45 to 59 Minutes | 0 (0.0%) | 0 (0.0%) |
| 60 to 89 Minutes | 0 (0.0%) | 0 (0.0%) |
| 90 or more Minutes | 3 (21.4%) | 0 (0.0%) |
Time of Departure to Work by Sex in Dayton
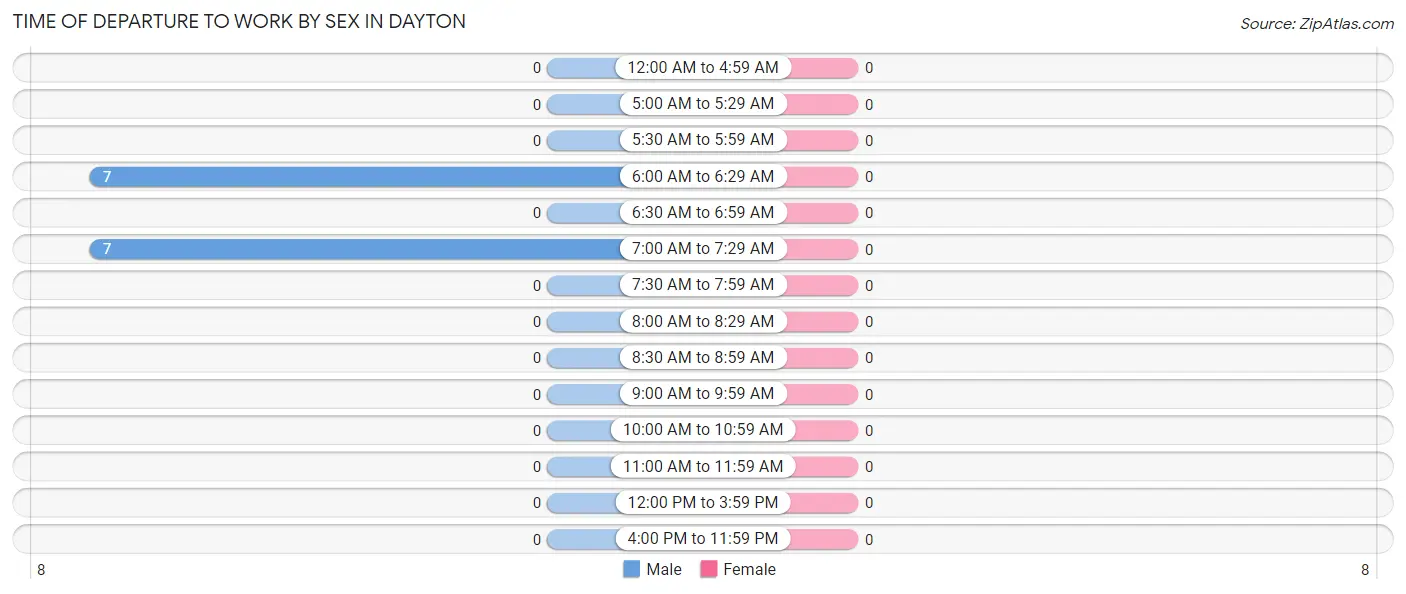
| Time of Departure | Male | Female |
| 12:00 AM to 4:59 AM | 0 (0.0%) | 0 (0.0%) |
| 5:00 AM to 5:29 AM | 0 (0.0%) | 0 (0.0%) |
| 5:30 AM to 5:59 AM | 0 (0.0%) | 0 (0.0%) |
| 6:00 AM to 6:29 AM | 7 (50.0%) | 0 (0.0%) |
| 6:30 AM to 6:59 AM | 0 (0.0%) | 0 (0.0%) |
| 7:00 AM to 7:29 AM | 7 (50.0%) | 0 (0.0%) |
| 7:30 AM to 7:59 AM | 0 (0.0%) | 0 (0.0%) |
| 8:00 AM to 8:29 AM | 0 (0.0%) | 0 (0.0%) |
| 8:30 AM to 8:59 AM | 0 (0.0%) | 0 (0.0%) |
| 9:00 AM to 9:59 AM | 0 (0.0%) | 0 (0.0%) |
| 10:00 AM to 10:59 AM | 0 (0.0%) | 0 (0.0%) |
| 11:00 AM to 11:59 AM | 0 (0.0%) | 0 (0.0%) |
| 12:00 PM to 3:59 PM | 0 (0.0%) | 0 (0.0%) |
| 4:00 PM to 11:59 PM | 0 (0.0%) | 0 (0.0%) |
| Total | 14 (100.0%) | 0 (0.0%) |
Housing Occupancy in Dayton
Occupancy by Ownership in Dayton
Of the total 57 dwellings in Dayton, owner-occupied units account for 38 (66.7%), while renter-occupied units make up 19 (33.3%).
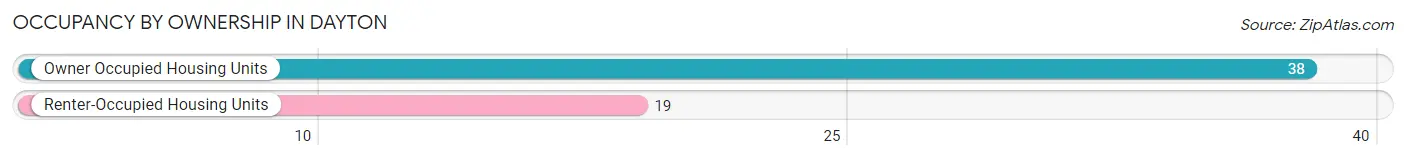
| Occupancy | # Housing Units | % Housing Units |
| Owner Occupied Housing Units | 38 | 66.7% |
| Renter-Occupied Housing Units | 19 | 33.3% |
| Total Occupied Housing Units | 57 | 100.0% |
Occupancy by Household Size in Dayton
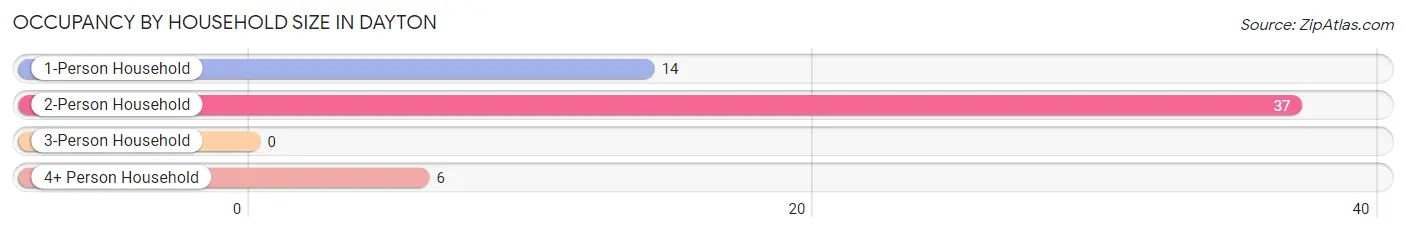
| Household Size | # Housing Units | % Housing Units |
| 1-Person Household | 14 | 24.6% |
| 2-Person Household | 37 | 64.9% |
| 3-Person Household | 0 | 0.0% |
| 4+ Person Household | 6 | 10.5% |
| Total Housing Units | 57 | 100.0% |
Occupancy by Ownership by Household Size in Dayton
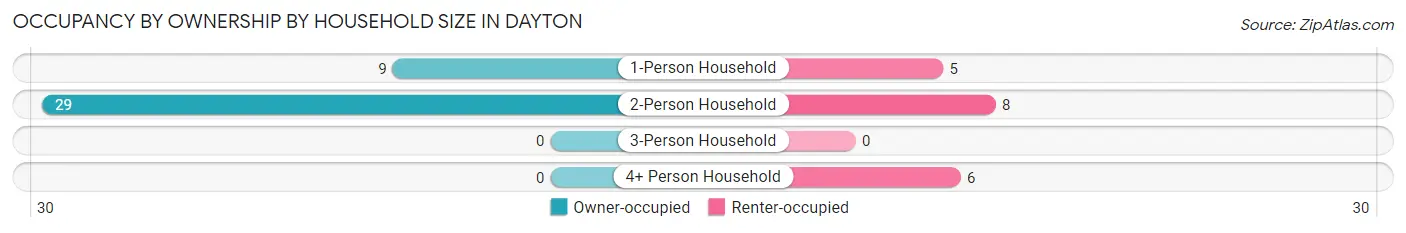
| Household Size | Owner-occupied | Renter-occupied |
| 1-Person Household | 9 (64.3%) | 5 (35.7%) |
| 2-Person Household | 29 (78.4%) | 8 (21.6%) |
| 3-Person Household | 0 (0.0%) | 0 (0.0%) |
| 4+ Person Household | 0 (0.0%) | 6 (100.0%) |
| Total Housing Units | 38 (66.7%) | 19 (33.3%) |
Occupancy by Educational Attainment in Dayton
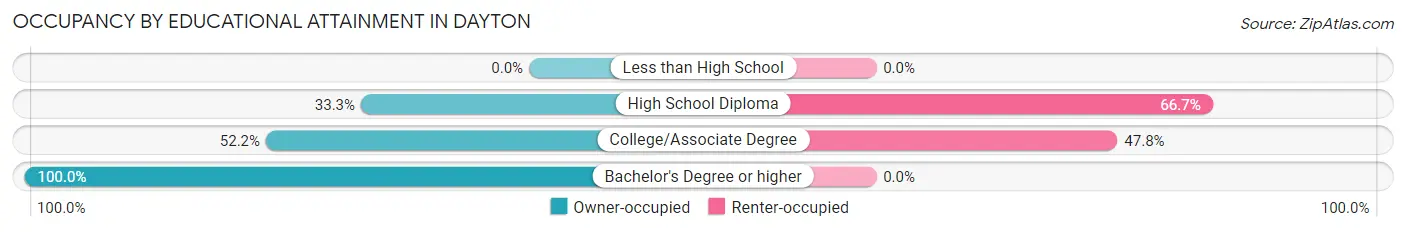
| Household Size | Owner-occupied | Renter-occupied |
| Less than High School | 0 (0.0%) | 0 (0.0%) |
| High School Diploma | 4 (33.3%) | 8 (66.7%) |
| College/Associate Degree | 12 (52.2%) | 11 (47.8%) |
| Bachelor's Degree or higher | 22 (100.0%) | 0 (0.0%) |
Occupancy by Age of Householder in Dayton
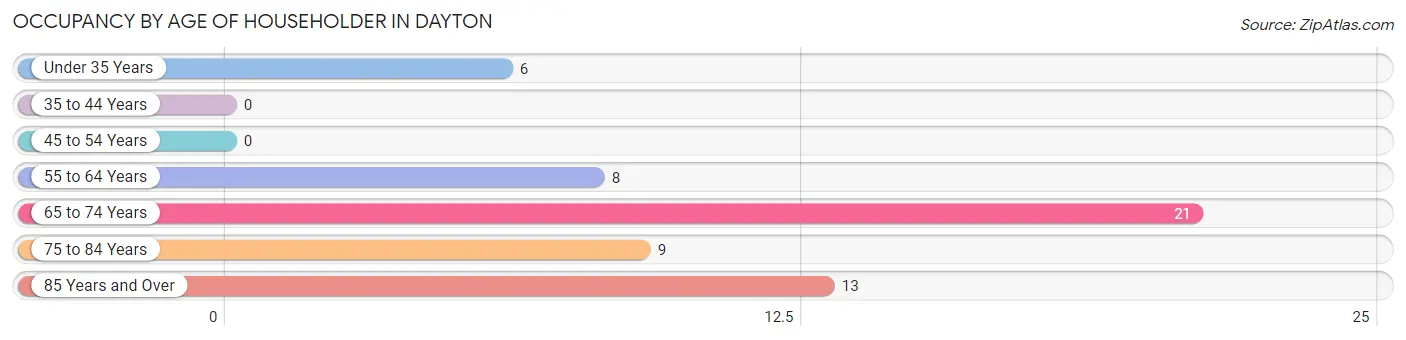
| Age Bracket | # Households | % Households |
| Under 35 Years | 6 | 10.5% |
| 35 to 44 Years | 0 | 0.0% |
| 45 to 54 Years | 0 | 0.0% |
| 55 to 64 Years | 8 | 14.0% |
| 65 to 74 Years | 21 | 36.8% |
| 75 to 84 Years | 9 | 15.8% |
| 85 Years and Over | 13 | 22.8% |
| Total | 57 | 100.0% |
Housing Finances in Dayton
Median Income by Occupancy in Dayton
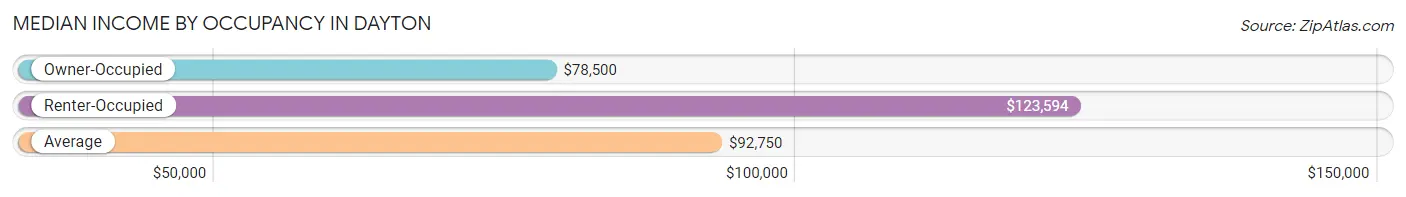
| Occupancy Type | # Households | Median Income |
| Owner-Occupied | 38 (66.7%) | $78,500 |
| Renter-Occupied | 19 (33.3%) | $123,594 |
| Average | 57 (100.0%) | $92,750 |
Occupancy by Householder Income Bracket in Dayton
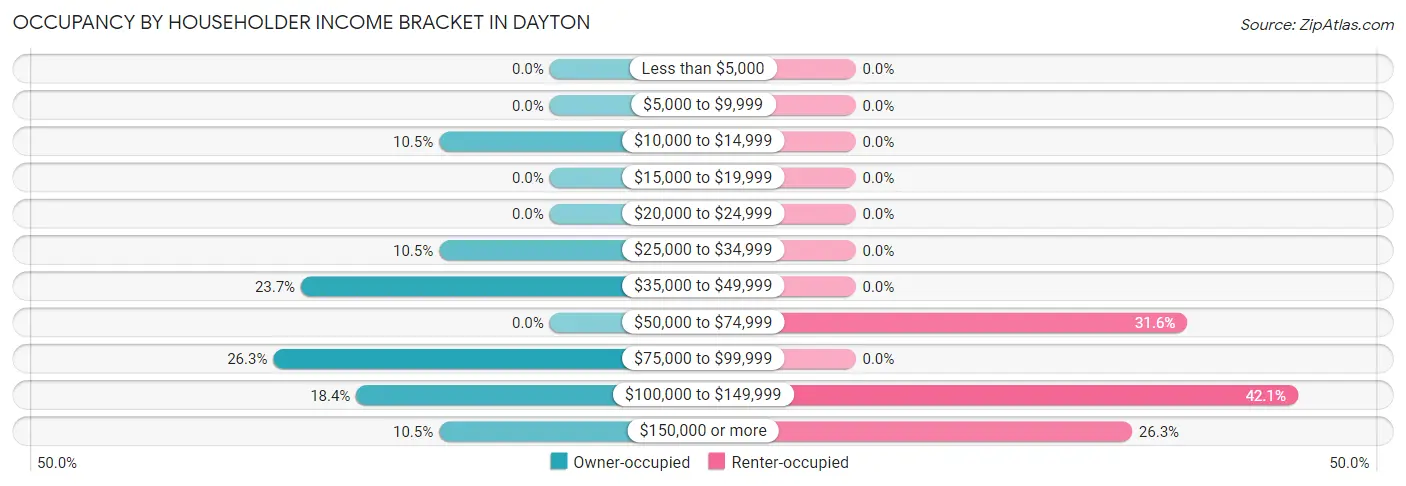
| Income Bracket | Owner-occupied | Renter-occupied |
| Less than $5,000 | 0 (0.0%) | 0 (0.0%) |
| $5,000 to $9,999 | 0 (0.0%) | 0 (0.0%) |
| $10,000 to $14,999 | 4 (10.5%) | 0 (0.0%) |
| $15,000 to $19,999 | 0 (0.0%) | 0 (0.0%) |
| $20,000 to $24,999 | 0 (0.0%) | 0 (0.0%) |
| $25,000 to $34,999 | 4 (10.5%) | 0 (0.0%) |
| $35,000 to $49,999 | 9 (23.7%) | 0 (0.0%) |
| $50,000 to $74,999 | 0 (0.0%) | 6 (31.6%) |
| $75,000 to $99,999 | 10 (26.3%) | 0 (0.0%) |
| $100,000 to $149,999 | 7 (18.4%) | 8 (42.1%) |
| $150,000 or more | 4 (10.5%) | 5 (26.3%) |
| Total | 38 (100.0%) | 19 (100.0%) |
Monthly Housing Cost Tiers in Dayton
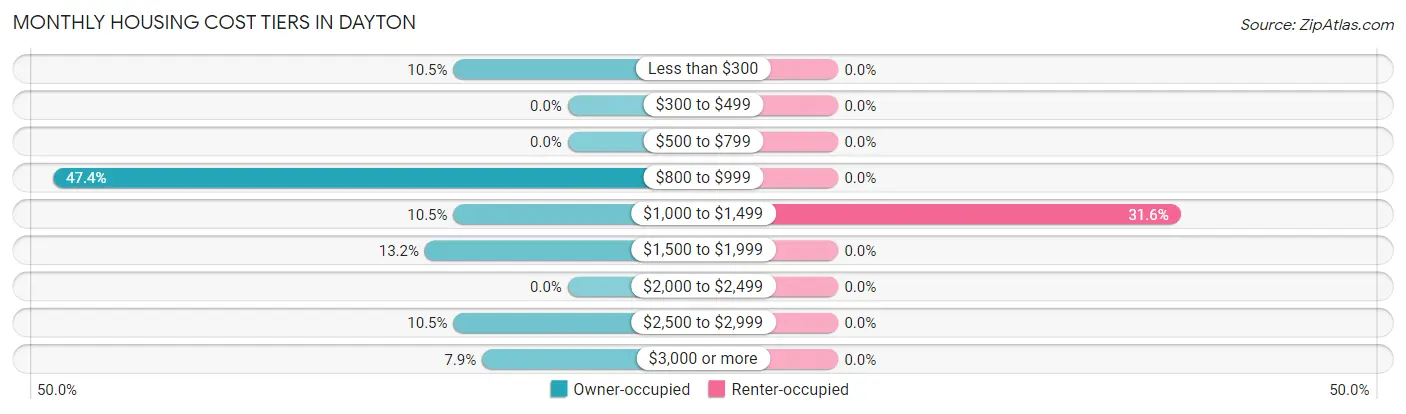
| Monthly Cost | Owner-occupied | Renter-occupied |
| Less than $300 | 4 (10.5%) | 0 (0.0%) |
| $300 to $499 | 0 (0.0%) | 0 (0.0%) |
| $500 to $799 | 0 (0.0%) | 0 (0.0%) |
| $800 to $999 | 18 (47.4%) | 0 (0.0%) |
| $1,000 to $1,499 | 4 (10.5%) | 6 (31.6%) |
| $1,500 to $1,999 | 5 (13.2%) | 0 (0.0%) |
| $2,000 to $2,499 | 0 (0.0%) | 0 (0.0%) |
| $2,500 to $2,999 | 4 (10.5%) | 0 (0.0%) |
| $3,000 or more | 3 (7.9%) | 0 (0.0%) |
| Total | 38 (100.0%) | 19 (100.0%) |
Physical Housing Characteristics in Dayton
Housing Structures in Dayton
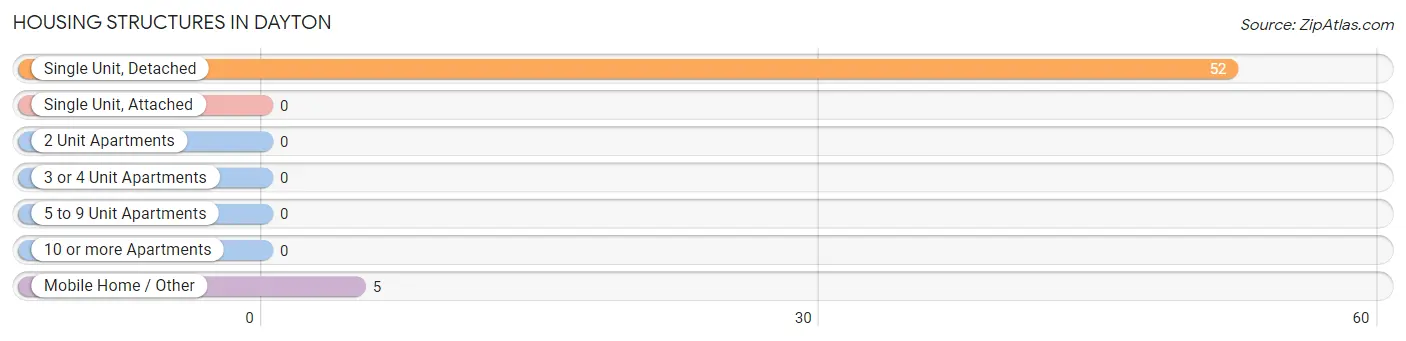
| Structure Type | # Housing Units | % Housing Units |
| Single Unit, Detached | 52 | 91.2% |
| Single Unit, Attached | 0 | 0.0% |
| 2 Unit Apartments | 0 | 0.0% |
| 3 or 4 Unit Apartments | 0 | 0.0% |
| 5 to 9 Unit Apartments | 0 | 0.0% |
| 10 or more Apartments | 0 | 0.0% |
| Mobile Home / Other | 5 | 8.8% |
| Total | 57 | 100.0% |
Housing Structures by Occupancy in Dayton
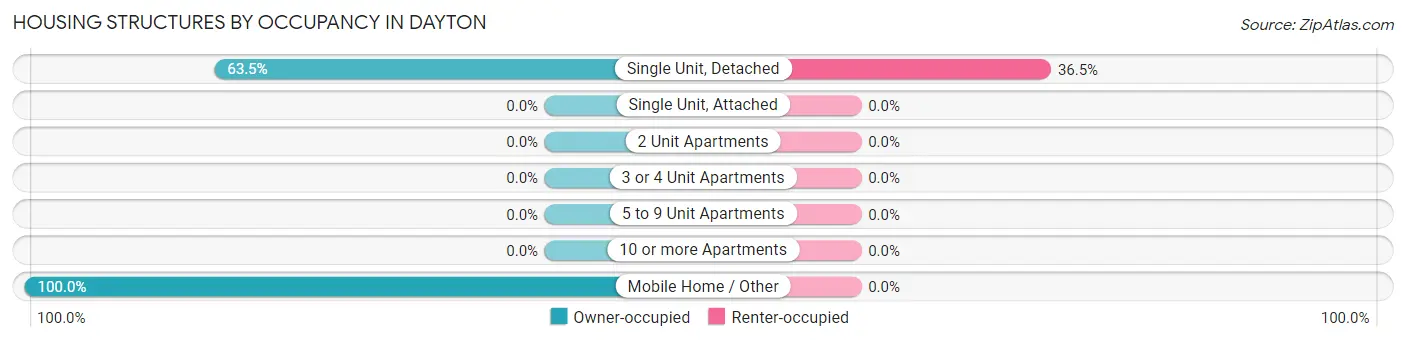
| Structure Type | Owner-occupied | Renter-occupied |
| Single Unit, Detached | 33 (63.5%) | 19 (36.5%) |
| Single Unit, Attached | 0 (0.0%) | 0 (0.0%) |
| 2 Unit Apartments | 0 (0.0%) | 0 (0.0%) |
| 3 or 4 Unit Apartments | 0 (0.0%) | 0 (0.0%) |
| 5 to 9 Unit Apartments | 0 (0.0%) | 0 (0.0%) |
| 10 or more Apartments | 0 (0.0%) | 0 (0.0%) |
| Mobile Home / Other | 5 (100.0%) | 0 (0.0%) |
| Total | 38 (66.7%) | 19 (33.3%) |
Housing Structures by Number of Rooms in Dayton
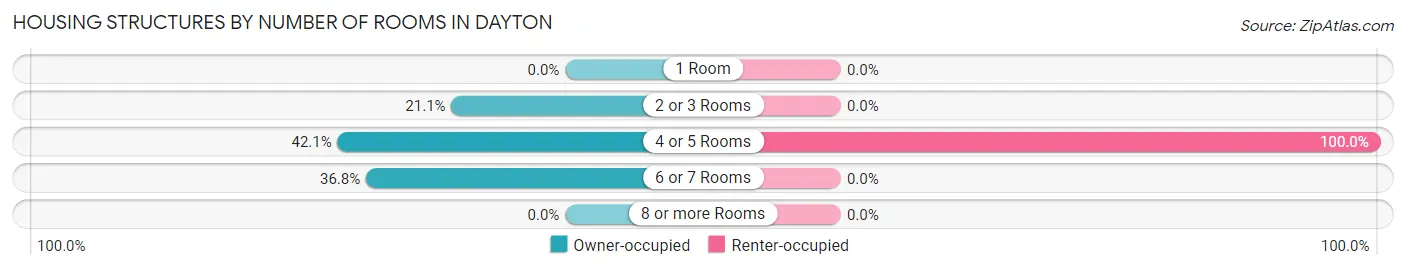
| Number of Rooms | Owner-occupied | Renter-occupied |
| 1 Room | 0 (0.0%) | 0 (0.0%) |
| 2 or 3 Rooms | 8 (21.0%) | 0 (0.0%) |
| 4 or 5 Rooms | 16 (42.1%) | 19 (100.0%) |
| 6 or 7 Rooms | 14 (36.8%) | 0 (0.0%) |
| 8 or more Rooms | 0 (0.0%) | 0 (0.0%) |
| Total | 38 (100.0%) | 19 (100.0%) |
Housing Structure by Heating Type in Dayton
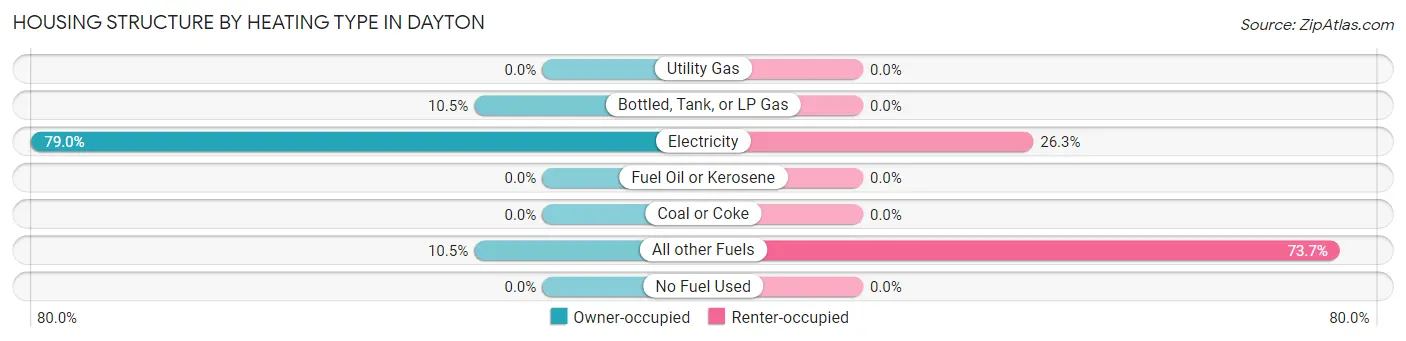
| Heating Type | Owner-occupied | Renter-occupied |
| Utility Gas | 0 (0.0%) | 0 (0.0%) |
| Bottled, Tank, or LP Gas | 4 (10.5%) | 0 (0.0%) |
| Electricity | 30 (78.9%) | 5 (26.3%) |
| Fuel Oil or Kerosene | 0 (0.0%) | 0 (0.0%) |
| Coal or Coke | 0 (0.0%) | 0 (0.0%) |
| All other Fuels | 4 (10.5%) | 14 (73.7%) |
| No Fuel Used | 0 (0.0%) | 0 (0.0%) |
| Total | 38 (100.0%) | 19 (100.0%) |
Household Vehicle Usage in Dayton
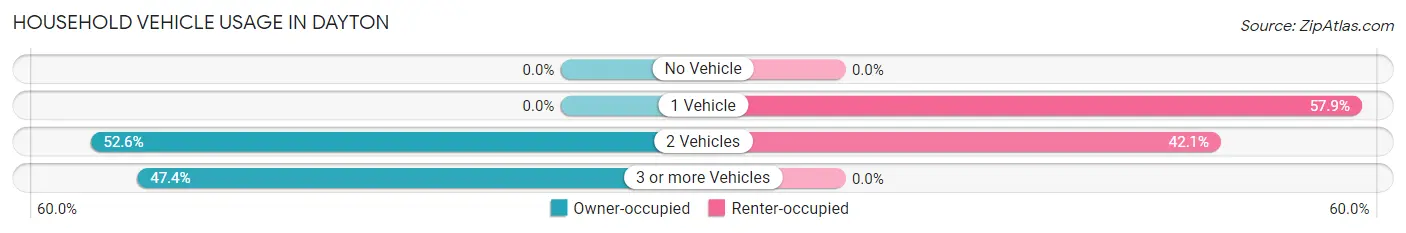
| Vehicles per Household | Owner-occupied | Renter-occupied |
| No Vehicle | 0 (0.0%) | 0 (0.0%) |
| 1 Vehicle | 0 (0.0%) | 11 (57.9%) |
| 2 Vehicles | 20 (52.6%) | 8 (42.1%) |
| 3 or more Vehicles | 18 (47.4%) | 0 (0.0%) |
| Total | 38 (100.0%) | 19 (100.0%) |
Real Estate & Mortgages in Dayton
Real Estate and Mortgage Overview in Dayton
| Characteristic | Without Mortgage | With Mortgage |
| Housing Units | 22 | 16 |
| Median Property Value | - | - |
| Median Household Income | - | - |
| Monthly Housing Costs | $850 | $3 |
| Real Estate Taxes | - | - |
Property Value by Mortgage Status in Dayton
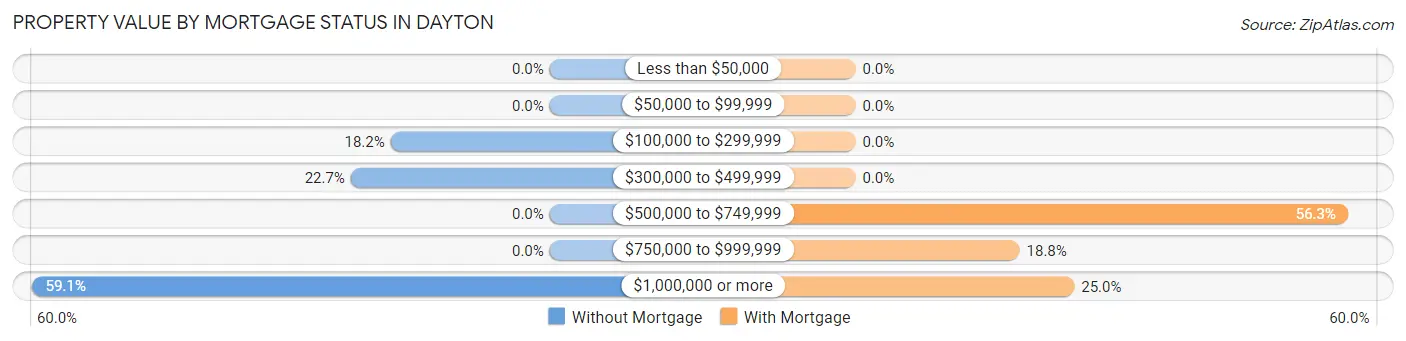
| Property Value | Without Mortgage | With Mortgage |
| Less than $50,000 | 0 (0.0%) | 0 (0.0%) |
| $50,000 to $99,999 | 0 (0.0%) | 0 (0.0%) |
| $100,000 to $299,999 | 4 (18.2%) | 0 (0.0%) |
| $300,000 to $499,999 | 5 (22.7%) | 0 (0.0%) |
| $500,000 to $749,999 | 0 (0.0%) | 9 (56.2%) |
| $750,000 to $999,999 | 0 (0.0%) | 3 (18.8%) |
| $1,000,000 or more | 13 (59.1%) | 4 (25.0%) |
| Total | 22 (100.0%) | 16 (100.0%) |
Household Income by Mortgage Status in Dayton
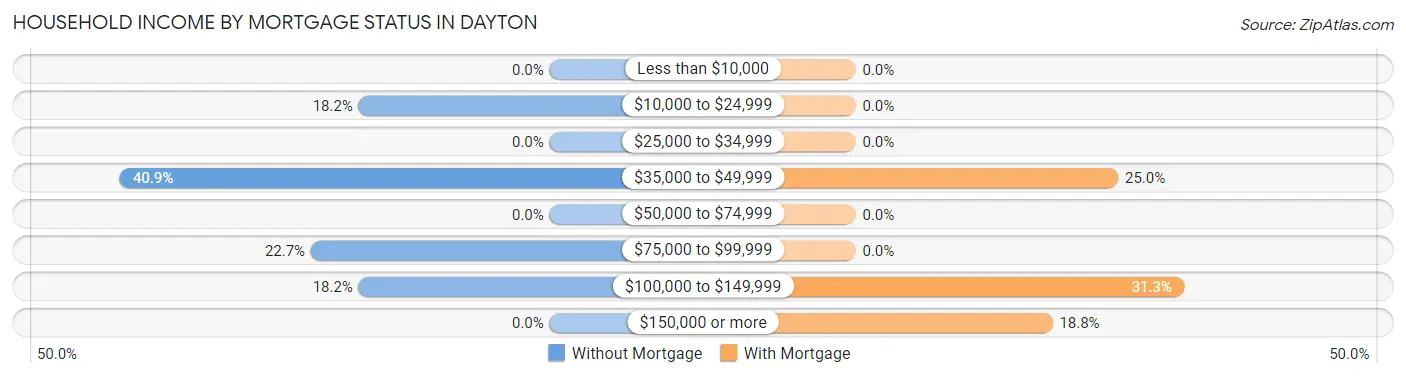
| Household Income | Without Mortgage | With Mortgage |
| Less than $10,000 | 0 (0.0%) | 0 (0.0%) |
| $10,000 to $24,999 | 4 (18.2%) | 0 (0.0%) |
| $25,000 to $34,999 | 0 (0.0%) | 0 (0.0%) |
| $35,000 to $49,999 | 9 (40.9%) | 4 (25.0%) |
| $50,000 to $74,999 | 0 (0.0%) | 0 (0.0%) |
| $75,000 to $99,999 | 5 (22.7%) | 0 (0.0%) |
| $100,000 to $149,999 | 4 (18.2%) | 5 (31.2%) |
| $150,000 or more | 0 (0.0%) | 3 (18.8%) |
| Total | 22 (100.0%) | 16 (100.0%) |
Property Value to Household Income Ratio in Dayton
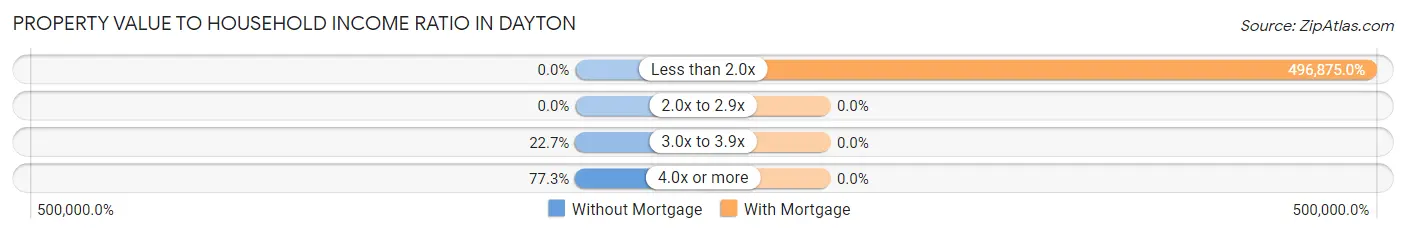
| Value-to-Income Ratio | Without Mortgage | With Mortgage |
| Less than 2.0x | 0 (0.0%) | 79,500 (496,875.0%) |
| 2.0x to 2.9x | 0 (0.0%) | 0 (0.0%) |
| 3.0x to 3.9x | 5 (22.7%) | 0 (0.0%) |
| 4.0x or more | 17 (77.3%) | 0 (0.0%) |
| Total | 22 (100.0%) | 16 (100.0%) |
Real Estate Taxes by Mortgage Status in Dayton
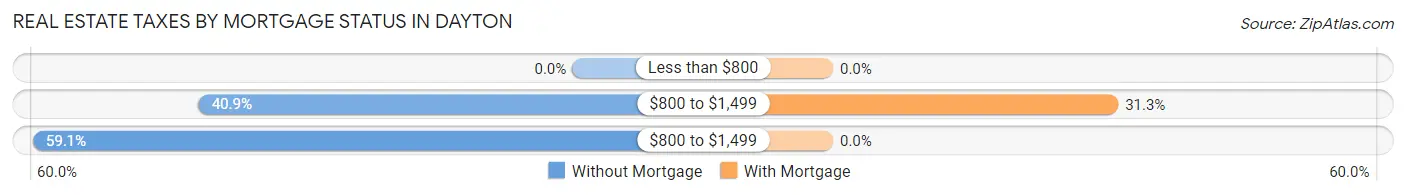
| Property Taxes | Without Mortgage | With Mortgage |
| Less than $800 | 0 (0.0%) | 0 (0.0%) |
| $800 to $1,499 | 9 (40.9%) | 5 (31.2%) |
| $800 to $1,499 | 13 (59.1%) | 0 (0.0%) |
| Total | 22 (100.0%) | 16 (100.0%) |
Health & Disability in Dayton
Health Insurance Coverage by Age in Dayton
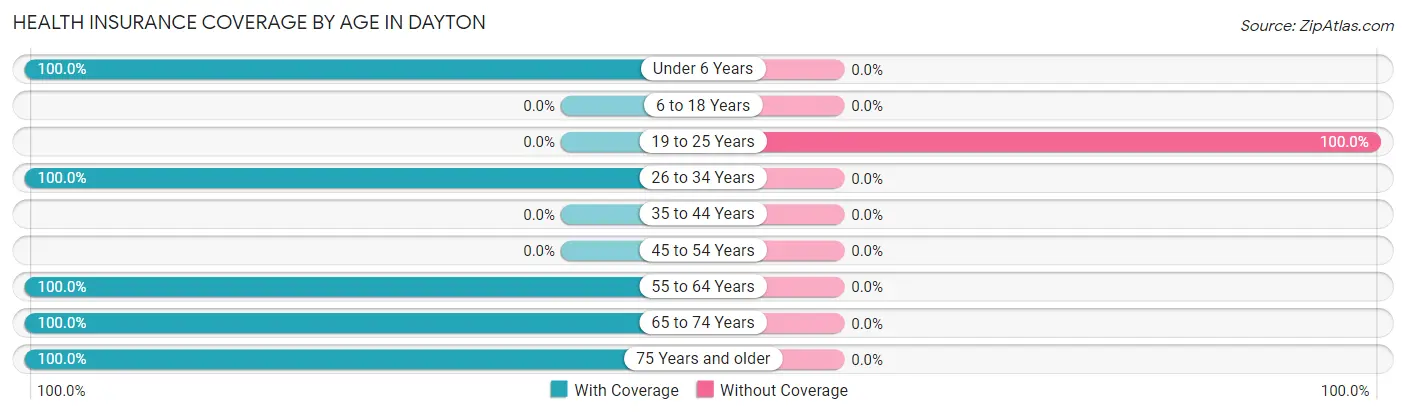
| Age Bracket | With Coverage | Without Coverage |
| Under 6 Years | 13 (100.0%) | 0 (0.0%) |
| 6 to 18 Years | 0 (0.0%) | 0 (0.0%) |
| 19 to 25 Years | 0 (0.0%) | 7 (100.0%) |
| 26 to 34 Years | 6 (100.0%) | 0 (0.0%) |
| 35 to 44 Years | 0 (0.0%) | 0 (0.0%) |
| 45 to 54 Years | 0 (0.0%) | 0 (0.0%) |
| 55 to 64 Years | 20 (100.0%) | 0 (0.0%) |
| 65 to 74 Years | 39 (100.0%) | 0 (0.0%) |
| 75 Years and older | 29 (100.0%) | 0 (0.0%) |
| Total | 107 (93.9%) | 7 (6.1%) |
Health Insurance Coverage by Citizenship Status in Dayton
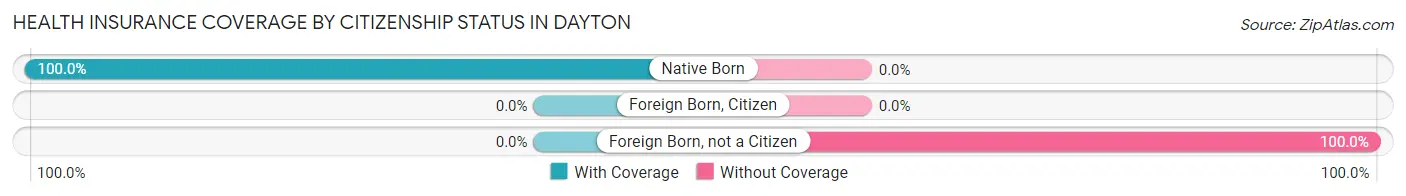
| Citizenship Status | With Coverage | Without Coverage |
| Native Born | 13 (100.0%) | 0 (0.0%) |
| Foreign Born, Citizen | 0 (0.0%) | 0 (0.0%) |
| Foreign Born, not a Citizen | 0 (0.0%) | 7 (100.0%) |
Health Insurance Coverage by Household Income in Dayton
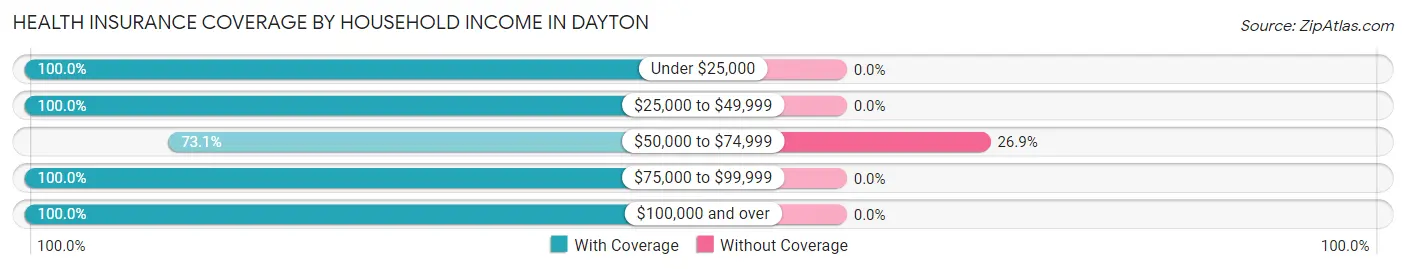
| Household Income | With Coverage | Without Coverage |
| Under $25,000 | 4 (100.0%) | 0 (0.0%) |
| $25,000 to $49,999 | 26 (100.0%) | 0 (0.0%) |
| $50,000 to $74,999 | 19 (73.1%) | 7 (26.9%) |
| $75,000 to $99,999 | 12 (100.0%) | 0 (0.0%) |
| $100,000 and over | 46 (100.0%) | 0 (0.0%) |
Public vs Private Health Insurance Coverage by Age in Dayton
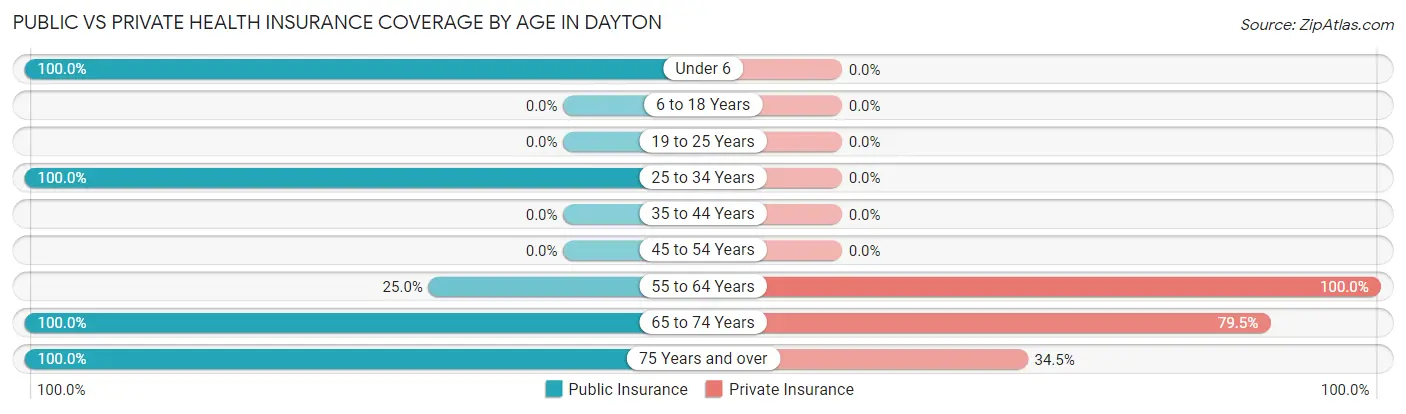
| Age Bracket | Public Insurance | Private Insurance |
| Under 6 | 13 (100.0%) | 0 (0.0%) |
| 6 to 18 Years | 0 (0.0%) | 0 (0.0%) |
| 19 to 25 Years | 0 (0.0%) | 0 (0.0%) |
| 25 to 34 Years | 6 (100.0%) | 0 (0.0%) |
| 35 to 44 Years | 0 (0.0%) | 0 (0.0%) |
| 45 to 54 Years | 0 (0.0%) | 0 (0.0%) |
| 55 to 64 Years | 5 (25.0%) | 20 (100.0%) |
| 65 to 74 Years | 39 (100.0%) | 31 (79.5%) |
| 75 Years and over | 29 (100.0%) | 10 (34.5%) |
| Total | 92 (80.7%) | 61 (53.5%) |
Disability Status by Sex by Age in Dayton
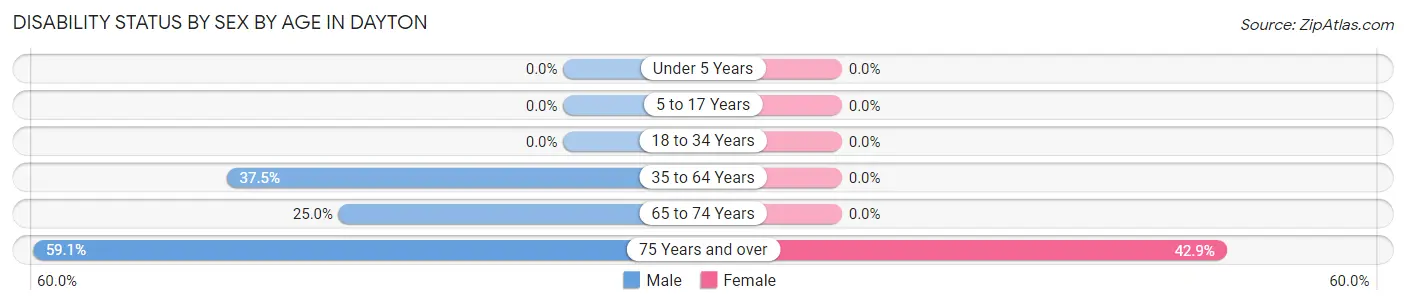
| Age Bracket | Male | Female |
| Under 5 Years | 0 (0.0%) | 0 (0.0%) |
| 5 to 17 Years | 0 (0.0%) | 0 (0.0%) |
| 18 to 34 Years | 0 (0.0%) | 0 (0.0%) |
| 35 to 64 Years | 3 (37.5%) | 0 (0.0%) |
| 65 to 74 Years | 4 (25.0%) | 0 (0.0%) |
| 75 Years and over | 13 (59.1%) | 3 (42.9%) |
Disability Class by Sex by Age in Dayton
Disability Class: Hearing Difficulty
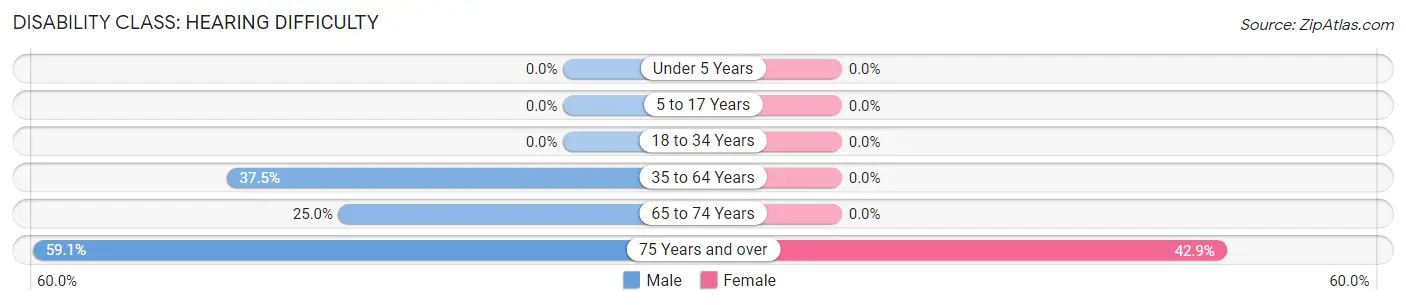
| Age Bracket | Male | Female |
| Under 5 Years | 0 (0.0%) | 0 (0.0%) |
| 5 to 17 Years | 0 (0.0%) | 0 (0.0%) |
| 18 to 34 Years | 0 (0.0%) | 0 (0.0%) |
| 35 to 64 Years | 3 (37.5%) | 0 (0.0%) |
| 65 to 74 Years | 4 (25.0%) | 0 (0.0%) |
| 75 Years and over | 13 (59.1%) | 3 (42.9%) |
Disability Class: Vision Difficulty
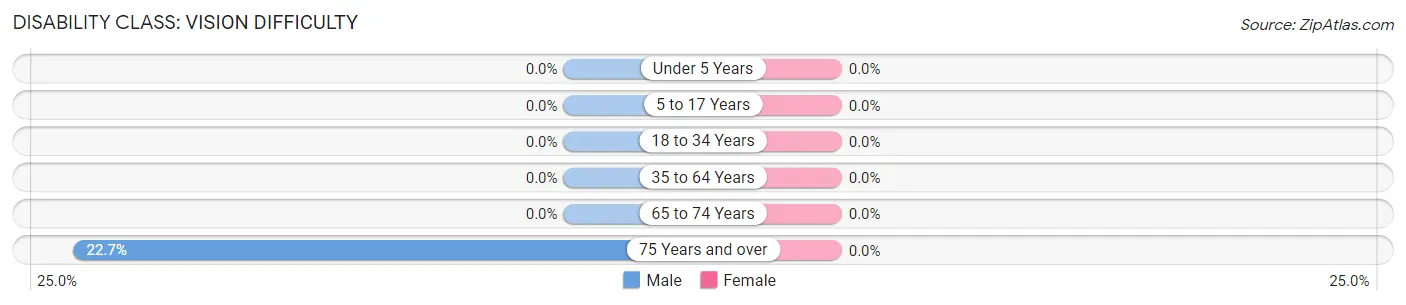
| Age Bracket | Male | Female |
| Under 5 Years | 0 (0.0%) | 0 (0.0%) |
| 5 to 17 Years | 0 (0.0%) | 0 (0.0%) |
| 18 to 34 Years | 0 (0.0%) | 0 (0.0%) |
| 35 to 64 Years | 0 (0.0%) | 0 (0.0%) |
| 65 to 74 Years | 0 (0.0%) | 0 (0.0%) |
| 75 Years and over | 5 (22.7%) | 0 (0.0%) |
Disability Class: Cognitive Difficulty
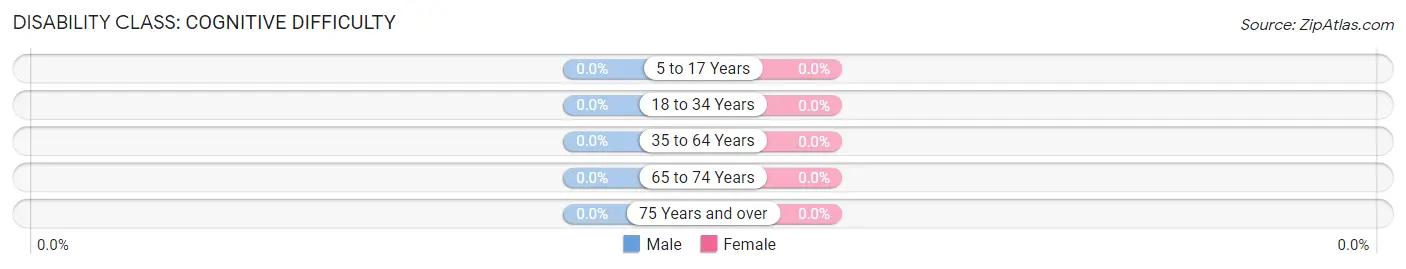
| Age Bracket | Male | Female |
| 5 to 17 Years | 0 (0.0%) | 0 (0.0%) |
| 18 to 34 Years | 0 (0.0%) | 0 (0.0%) |
| 35 to 64 Years | 0 (0.0%) | 0 (0.0%) |
| 65 to 74 Years | 0 (0.0%) | 0 (0.0%) |
| 75 Years and over | 0 (0.0%) | 0 (0.0%) |
Disability Class: Ambulatory Difficulty
| Age Bracket | Male | Female |
| 5 to 17 Years | 0 (0.0%) | 0 (0.0%) |
| 18 to 34 Years | 0 (0.0%) | 0 (0.0%) |
| 35 to 64 Years | 0 (0.0%) | 0 (0.0%) |
| 65 to 74 Years | 0 (0.0%) | 0 (0.0%) |
| 75 Years and over | 0 (0.0%) | 0 (0.0%) |
Disability Class: Self-Care Difficulty
| Age Bracket | Male | Female |
| 5 to 17 Years | 0 (0.0%) | 0 (0.0%) |
| 18 to 34 Years | 0 (0.0%) | 0 (0.0%) |
| 35 to 64 Years | 0 (0.0%) | 0 (0.0%) |
| 65 to 74 Years | 0 (0.0%) | 0 (0.0%) |
| 75 Years and over | 0 (0.0%) | 0 (0.0%) |
Technology Access in Dayton
Computing Device Access in Dayton
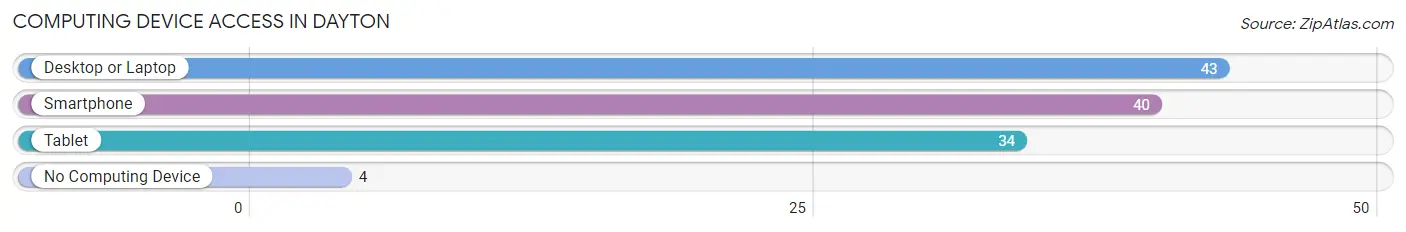
| Device Type | # Households | % Households |
| Desktop or Laptop | 43 | 75.4% |
| Smartphone | 40 | 70.2% |
| Tablet | 34 | 59.7% |
| No Computing Device | 4 | 7.0% |
| Total | 57 | 100.0% |
Internet Access in Dayton
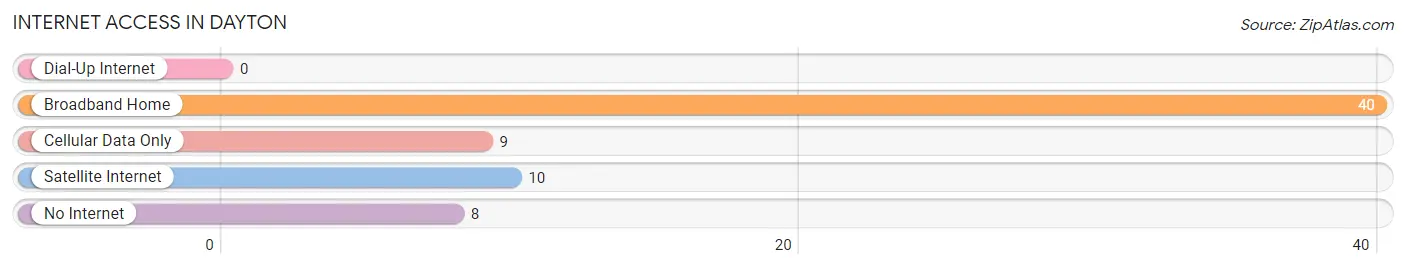
| Internet Type | # Households | % Households |
| Dial-Up Internet | 0 | 0.0% |
| Broadband Home | 40 | 70.2% |
| Cellular Data Only | 9 | 15.8% |
| Satellite Internet | 10 | 17.5% |
| No Internet | 8 | 14.0% |
| Total | 57 | 100.0% |
Dayton Summary
Dayton, Montana is a small town located in Ravalli County, Montana. It is situated in the Bitterroot Valley, which is a major agricultural region in the state. The town has a population of approximately 1,000 people and is located about 25 miles south of Missoula.
Dayton was founded in 1883 by a group of settlers from the Midwest. The town was named after Dayton, Ohio, the hometown of one of the settlers. The town was originally a farming community, but it soon became a center for logging and mining. The town was also home to a number of sawmills and other businesses.
Dayton is located in a beautiful valley surrounded by mountains. The Bitterroot Mountains to the east and the Sapphire Mountains to the west provide a stunning backdrop to the town. The Bitterroot River runs through the valley and provides a source of recreation for the locals.
The economy of Dayton is largely based on agriculture and tourism. The town is home to a number of farms and ranches, as well as a number of tourist attractions. The town is also home to a number of small businesses, including restaurants, shops, and other services.
The demographics of Dayton are largely white, with a small percentage of Native Americans and Hispanics. The median household income is around $40,000, and the median home value is around $150,000. The town has a low unemployment rate and a high rate of home ownership.
Dayton is a small town with a lot of charm. It is a great place to live and work, and it offers a variety of activities for residents and visitors alike. The town is home to a number of parks and trails, as well as a number of historic sites. The town also has a number of festivals and events throughout the year.
Dayton is a great place to live and work, and it offers a variety of activities for residents and visitors alike. The town is home to a number of parks and trails, as well as a number of historic sites. The town also has a number of festivals and events throughout the year. The town is a great place to raise a family, and it offers a variety of educational opportunities for children. The town is also home to a number of small businesses, including restaurants, shops, and other services.
Common Questions
What is Per Capita Income in Dayton?
Per Capita income in Dayton is $45,576.
What is the Median Family Income in Dayton?
Median Family Income in Dayton is $93,750.
What is the Median Household income in Dayton?
Median Household Income in Dayton is $92,750.
What is Inequality or Gini Index in Dayton?
Inequality or Gini Index in Dayton is 0.33.
What is the Total Population of Dayton?
Total Population of Dayton is 114.
What is the Total Male Population of Dayton?
Total Male Population of Dayton is 53.
What is the Total Female Population of Dayton?
Total Female Population of Dayton is 61.
What is the Ratio of Males per 100 Females in Dayton?
There are 86.89 Males per 100 Females in Dayton.
What is the Ratio of Females per 100 Males in Dayton?
There are 115.09 Females per 100 Males in Dayton.
What is the Median Population Age in Dayton?
Median Population Age in Dayton is 67.9 Years.
What is the Average Family Size in Dayton
Average Family Size in Dayton is 2.3 People.
What is the Average Household Size in Dayton
Average Household Size in Dayton is 2.0 People.
How Large is the Labor Force in Dayton?
There are 14 People in the Labor Forcein in Dayton.
What is the Percentage of People in the Labor Force in Dayton?
13.9% of People are in the Labor Force in Dayton.