Somers, MT Map & Demographics
Somers Map
Somers Overview
$32,038
PER CAPITA INCOME
$54,712
AVG FAMILY INCOME
$54,466
AVG HOUSEHOLD INCOME
0.33
INEQUALITY / GINI INDEX
1,037
TOTAL POPULATION
566
MALE POPULATION
471
FEMALE POPULATION
120.17
MALES / 100 FEMALES
83.22
FEMALES / 100 MALES
64.2
MEDIAN AGE
2.5
AVG FAMILY SIZE
2.2
AVG HOUSEHOLD SIZE
458
LABOR FORCE [ PEOPLE ]
45.3%
PERCENT IN LABOR FORCE
Somers Zip Codes
Somers Area Codes
Income in Somers
Income Overview in Somers
Per Capita Income in Somers is $32,038, while median incomes of families and households are $54,712 and $54,466 respectively.
| Characteristic | Number | Measure |
| Per Capita Income | 1,037 | $32,038 |
| Median Family Income | 371 | $54,712 |
| Mean Family Income | 371 | $67,902 |
| Median Household Income | 468 | $54,466 |
| Mean Household Income | 468 | $62,425 |
| Income Deficit | 371 | $0 |
| Wage / Income Gap (%) | 1,037 | 0.00% |
| Wage / Income Gap ($) | 1,037 | 100.00¢ per $1 |
| Gini / Inequality Index | 1,037 | 0.33 |
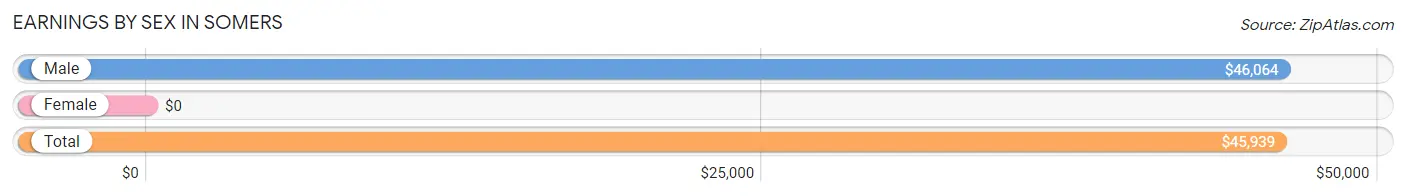
Earnings by Sex in Somers
| Sex | Number | Average Earnings |
| Male | 359 (75.1%) | $46,064 |
| Female | 119 (24.9%) | $0 |
| Total | 478 (100.0%) | $45,939 |
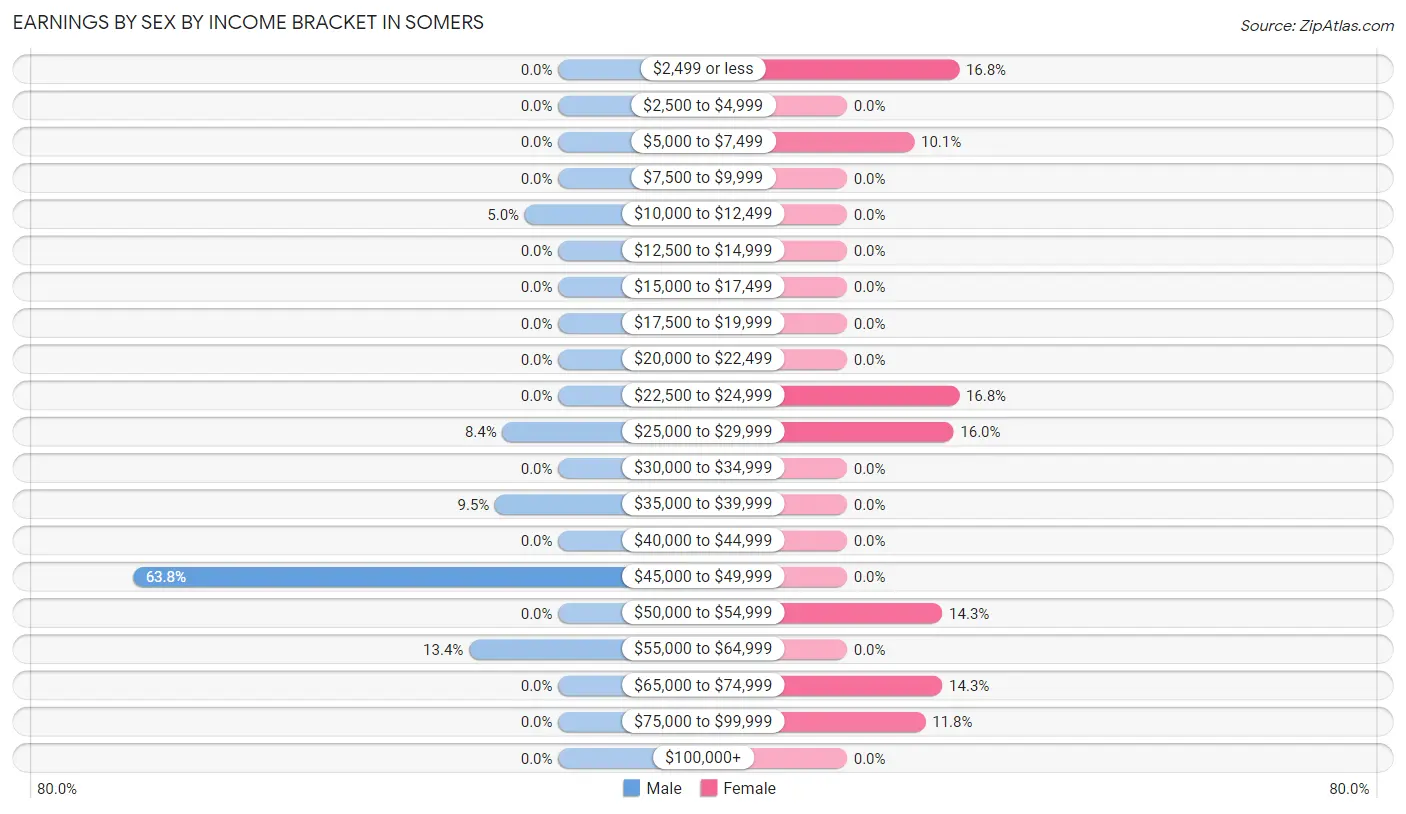
Earnings by Sex by Income Bracket in Somers
The most common earnings brackets in Somers are $45,000 to $49,999 for men (229 | 63.8%) and $2,499 or less for women (20 | 16.8%).
| Income | Male | Female |
| $2,499 or less | 0 (0.0%) | 20 (16.8%) |
| $2,500 to $4,999 | 0 (0.0%) | 0 (0.0%) |
| $5,000 to $7,499 | 0 (0.0%) | 12 (10.1%) |
| $7,500 to $9,999 | 0 (0.0%) | 0 (0.0%) |
| $10,000 to $12,499 | 18 (5.0%) | 0 (0.0%) |
| $12,500 to $14,999 | 0 (0.0%) | 0 (0.0%) |
| $15,000 to $17,499 | 0 (0.0%) | 0 (0.0%) |
| $17,500 to $19,999 | 0 (0.0%) | 0 (0.0%) |
| $20,000 to $22,499 | 0 (0.0%) | 0 (0.0%) |
| $22,500 to $24,999 | 0 (0.0%) | 20 (16.8%) |
| $25,000 to $29,999 | 30 (8.4%) | 19 (16.0%) |
| $30,000 to $34,999 | 0 (0.0%) | 0 (0.0%) |
| $35,000 to $39,999 | 34 (9.5%) | 0 (0.0%) |
| $40,000 to $44,999 | 0 (0.0%) | 0 (0.0%) |
| $45,000 to $49,999 | 229 (63.8%) | 0 (0.0%) |
| $50,000 to $54,999 | 0 (0.0%) | 17 (14.3%) |
| $55,000 to $64,999 | 48 (13.4%) | 0 (0.0%) |
| $65,000 to $74,999 | 0 (0.0%) | 17 (14.3%) |
| $75,000 to $99,999 | 0 (0.0%) | 14 (11.8%) |
| $100,000+ | 0 (0.0%) | 0 (0.0%) |
| Total | 359 (100.0%) | 119 (100.0%) |
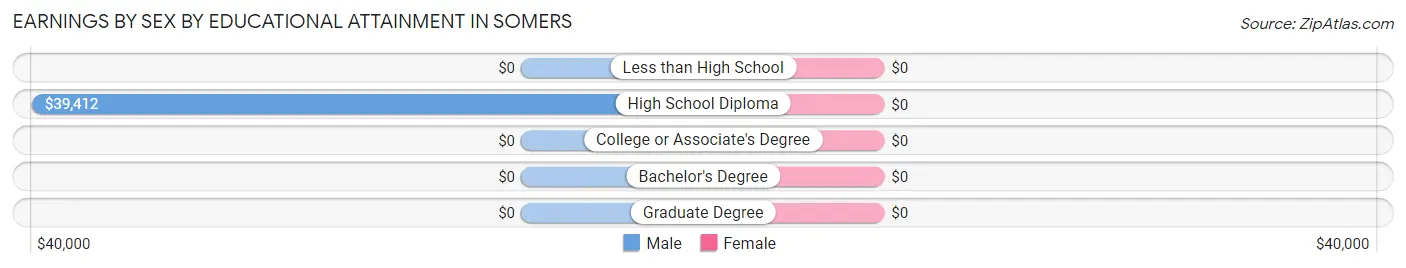
Earnings by Sex by Educational Attainment in Somers
| Educational Attainment | Male Income | Female Income |
| Less than High School | - | - |
| High School Diploma | $39,412 | $0 |
| College or Associate's Degree | - | - |
| Bachelor's Degree | - | - |
| Graduate Degree | - | - |
| Total | $46,163 | $0 |
Family Income in Somers
Family Income Brackets in Somers
According to the Somers family income data, there are 293 families falling into the $50,000 to $74,999 income range, which is the most common income bracket and makes up 79.0% of all families.
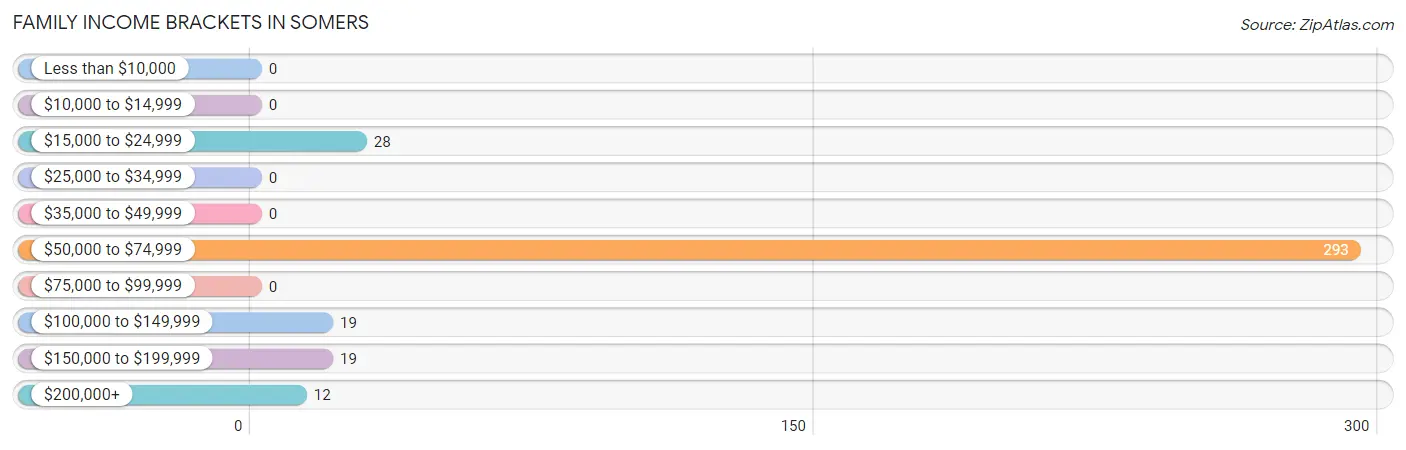
| Income Bracket | # Families | % Families |
| Less than $10,000 | 0 | 0.0% |
| $10,000 to $14,999 | 0 | 0.0% |
| $15,000 to $24,999 | 28 | 7.5% |
| $25,000 to $34,999 | 0 | 0.0% |
| $35,000 to $49,999 | 0 | 0.0% |
| $50,000 to $74,999 | 293 | 79.0% |
| $75,000 to $99,999 | 0 | 0.0% |
| $100,000 to $149,999 | 19 | 5.1% |
| $150,000 to $199,999 | 19 | 5.1% |
| $200,000+ | 12 | 3.2% |
Family Income by Famaliy Size in Somers
2-person families (335 | 90.3%) account for the highest median family income in Somers with $54,459 per family, while 2-person families (335 | 90.3%) have the highest median income of $27,230 per family member.
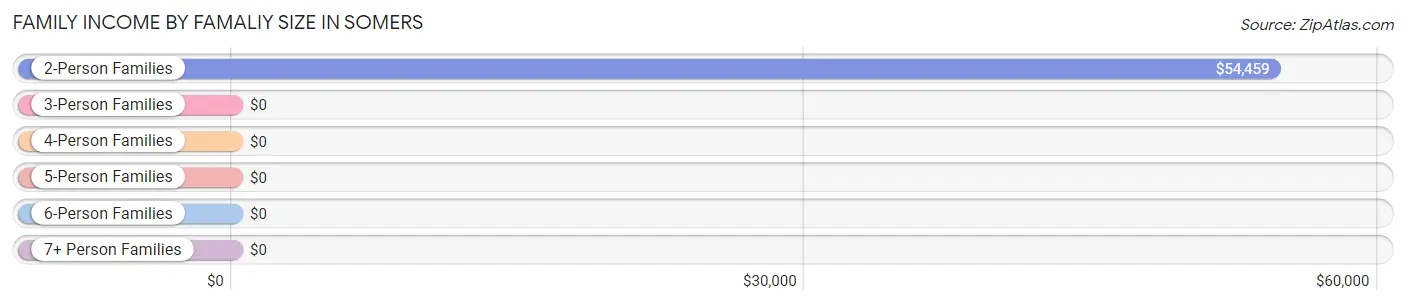
| Income Bracket | # Families | Median Income |
| 2-Person Families | 335 (90.3%) | $54,459 |
| 3-Person Families | 17 (4.6%) | $0 |
| 4-Person Families | 19 (5.1%) | $0 |
| 5-Person Families | 0 (0.0%) | $0 |
| 6-Person Families | 0 (0.0%) | $0 |
| 7+ Person Families | 0 (0.0%) | $0 |
| Total | 371 (100.0%) | $54,712 |
Family Income by Number of Earners in Somers
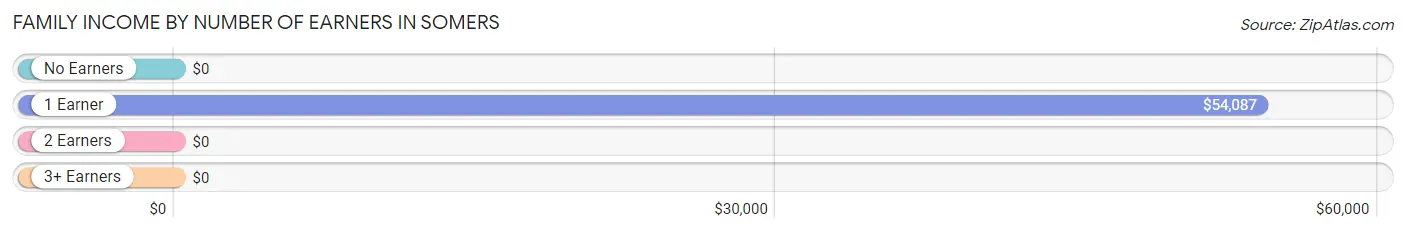
| Number of Earners | # Families | Median Income |
| No Earners | 89 (24.0%) | $0 |
| 1 Earner | 226 (60.9%) | $54,087 |
| 2 Earners | 37 (10.0%) | $0 |
| 3+ Earners | 19 (5.1%) | $0 |
| Total | 371 (100.0%) | $54,712 |
Household Income in Somers
Household Income Brackets in Somers
With 293 households falling in the category, the $50,000 to $74,999 income range is the most frequent in Somers, accounting for 62.6% of all households.
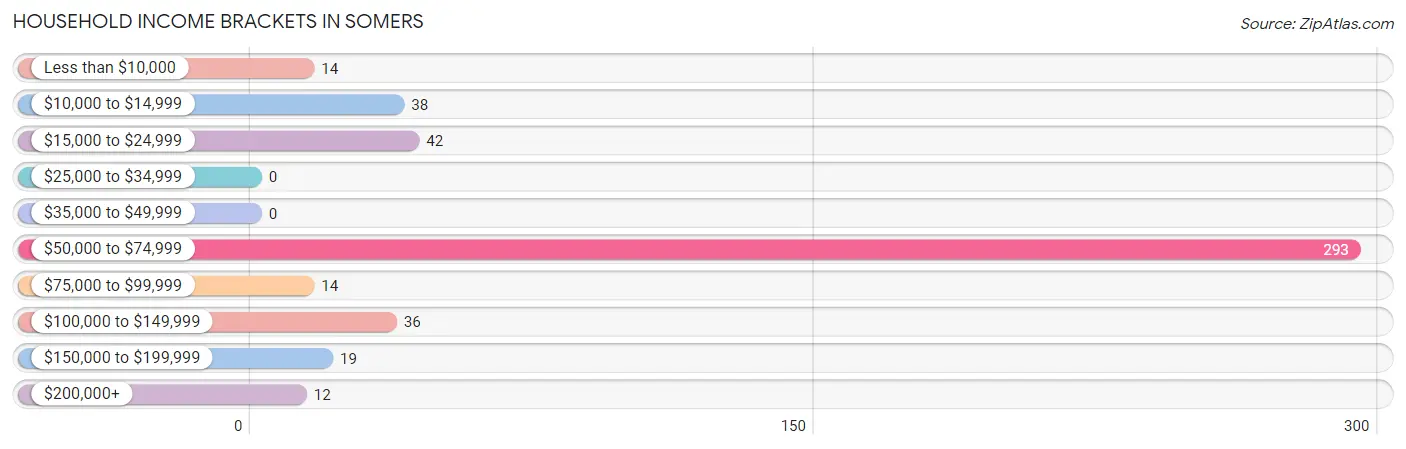
| Income Bracket | # Households | % Households |
| Less than $10,000 | 14 | 3.0% |
| $10,000 to $14,999 | 38 | 8.1% |
| $15,000 to $24,999 | 42 | 9.0% |
| $25,000 to $34,999 | 0 | 0.0% |
| $35,000 to $49,999 | 0 | 0.0% |
| $50,000 to $74,999 | 293 | 62.6% |
| $75,000 to $99,999 | 14 | 3.0% |
| $100,000 to $149,999 | 36 | 7.7% |
| $150,000 to $199,999 | 19 | 4.1% |
| $200,000+ | 12 | 2.6% |
Household Income by Householder Age in Somers
The median household income in Somers is $54,466, with the highest median household income of $58,801 found in the 45 to 64 years age bracket for the primary householder. A total of 194 households (41.4%) fall into this category.
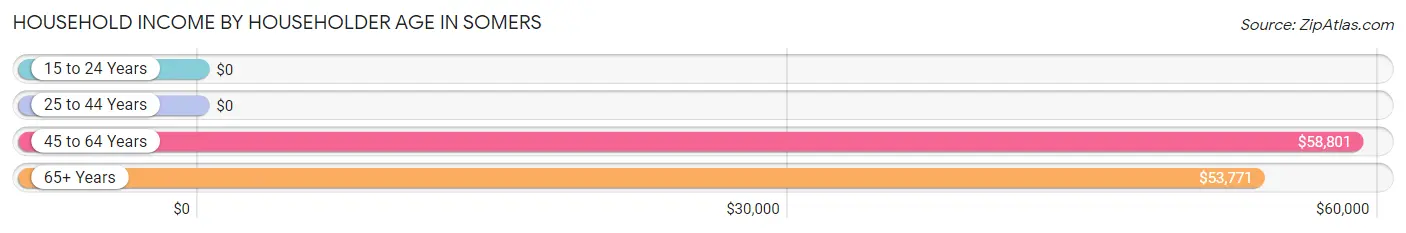
| Income Bracket | # Households | Median Income |
| 15 to 24 Years | 0 (0.0%) | $0 |
| 25 to 44 Years | 37 (7.9%) | $0 |
| 45 to 64 Years | 194 (41.4%) | $58,801 |
| 65+ Years | 237 (50.6%) | $53,771 |
| Total | 468 (100.0%) | $54,466 |
Poverty in Somers
Income Below Poverty by Sex and Age in Somers
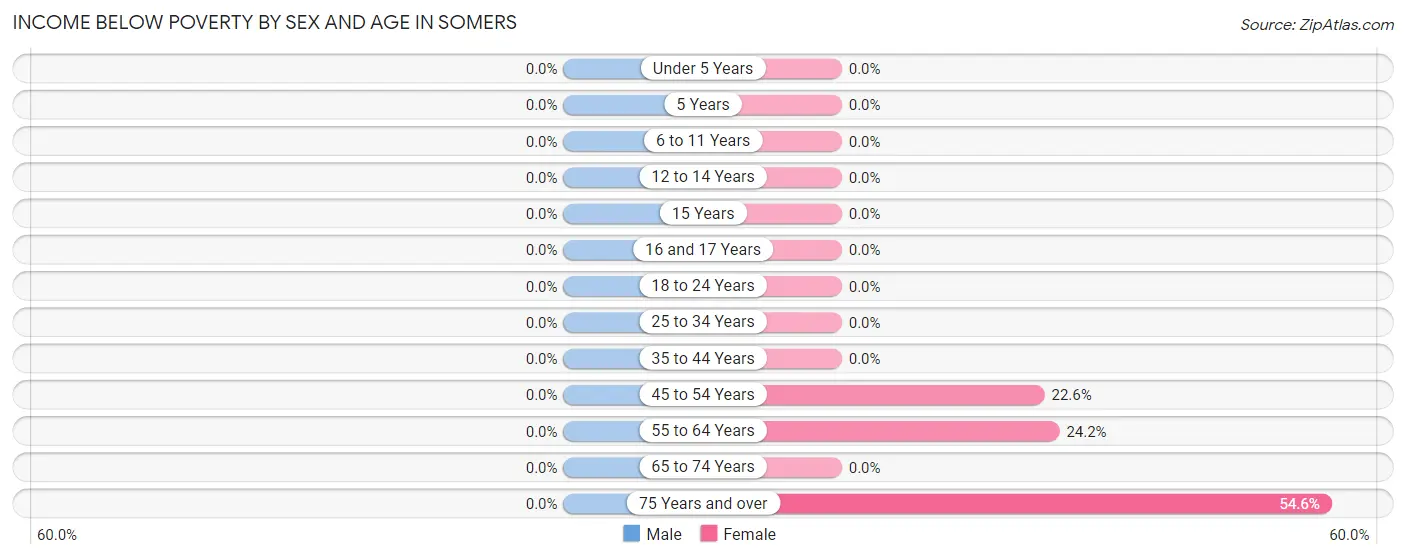
| Age Bracket | Male | Female |
| Under 5 Years | 0 (0.0%) | 0 (0.0%) |
| 5 Years | 0 (0.0%) | 0 (0.0%) |
| 6 to 11 Years | 0 (0.0%) | 0 (0.0%) |
| 12 to 14 Years | 0 (0.0%) | 0 (0.0%) |
| 15 Years | 0 (0.0%) | 0 (0.0%) |
| 16 and 17 Years | 0 (0.0%) | 0 (0.0%) |
| 18 to 24 Years | 0 (0.0%) | 0 (0.0%) |
| 25 to 34 Years | 0 (0.0%) | 0 (0.0%) |
| 35 to 44 Years | 0 (0.0%) | 0 (0.0%) |
| 45 to 54 Years | 0 (0.0%) | 14 (22.6%) |
| 55 to 64 Years | 0 (0.0%) | 32 (24.2%) |
| 65 to 74 Years | 0 (0.0%) | 0 (0.0%) |
| 75 Years and over | 0 (0.0%) | 6 (54.5%) |
| Total | 0 (0.0%) | 52 (11.0%) |
Income Above Poverty by Sex and Age in Somers
According to the poverty statistics in Somers, males aged 12 to 14 years and females aged 16 and 17 years are the age groups that are most secure financially, with 100.0% of males and 100.0% of females in these age groups living above the poverty line.
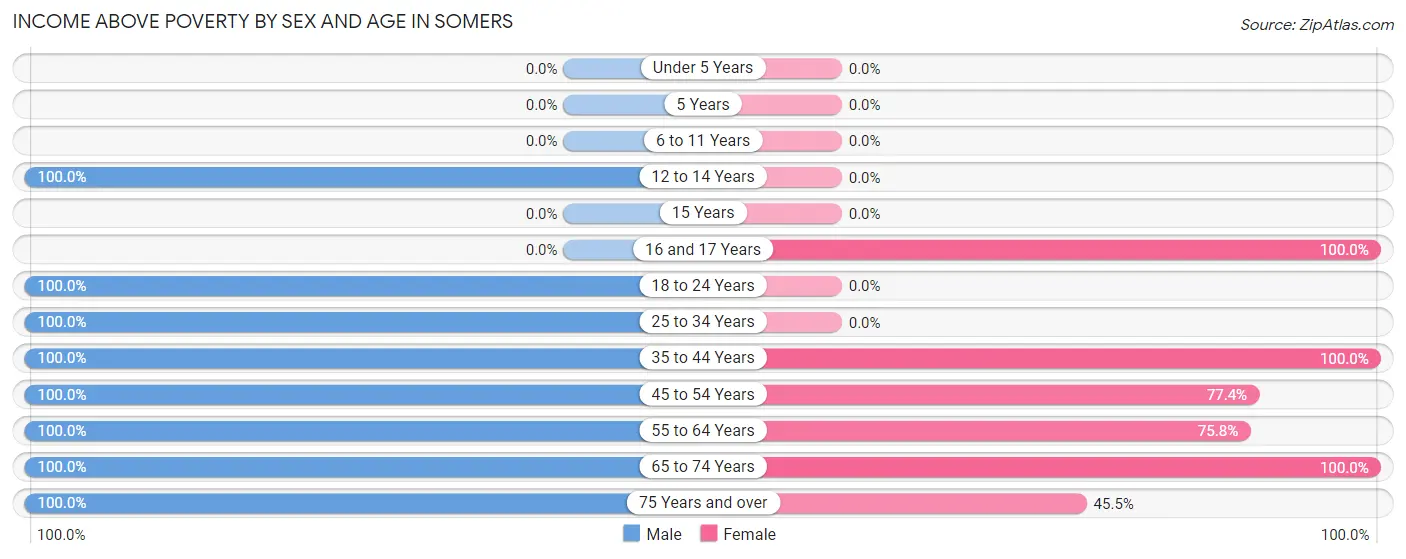
| Age Bracket | Male | Female |
| Under 5 Years | 0 (0.0%) | 0 (0.0%) |
| 5 Years | 0 (0.0%) | 0 (0.0%) |
| 6 to 11 Years | 0 (0.0%) | 0 (0.0%) |
| 12 to 14 Years | 18 (100.0%) | 0 (0.0%) |
| 15 Years | 0 (0.0%) | 0 (0.0%) |
| 16 and 17 Years | 0 (0.0%) | 20 (100.0%) |
| 18 to 24 Years | 53 (100.0%) | 0 (0.0%) |
| 25 to 34 Years | 30 (100.0%) | 0 (0.0%) |
| 35 to 44 Years | 34 (100.0%) | 37 (100.0%) |
| 45 to 54 Years | 48 (100.0%) | 48 (77.4%) |
| 55 to 64 Years | 309 (100.0%) | 100 (75.8%) |
| 65 to 74 Years | 43 (100.0%) | 209 (100.0%) |
| 75 Years and over | 21 (100.0%) | 5 (45.5%) |
| Total | 556 (100.0%) | 419 (89.0%) |
Income Below Poverty Among Married-Couple Families in Somers
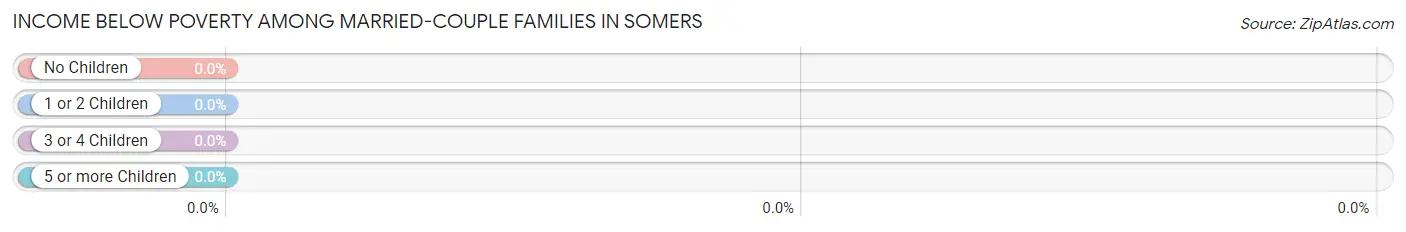
| Children | Above Poverty | Below Poverty |
| No Children | 315 (100.0%) | 0 (0.0%) |
| 1 or 2 Children | 0 (0.0%) | 0 (0.0%) |
| 3 or 4 Children | 0 (0.0%) | 0 (0.0%) |
| 5 or more Children | 0 (0.0%) | 0 (0.0%) |
| Total | 315 (100.0%) | 0 (0.0%) |
Income Below Poverty Among Single-Parent Households in Somers
| Children | Single Father | Single Mother |
| No Children | 0 (0.0%) | 0 (0.0%) |
| 1 or 2 Children | 0 (0.0%) | 0 (0.0%) |
| 3 or 4 Children | 0 (0.0%) | 0 (0.0%) |
| 5 or more Children | 0 (0.0%) | 0 (0.0%) |
| Total | 0 (0.0%) | 0 (0.0%) |
Income Below Poverty Among Married-Couple vs Single-Parent Households in Somers
| Children | Married-Couple Families | Single-Parent Households |
| No Children | 0 (0.0%) | 0 (0.0%) |
| 1 or 2 Children | 0 (0.0%) | 0 (0.0%) |
| 3 or 4 Children | 0 (0.0%) | 0 (0.0%) |
| 5 or more Children | 0 (0.0%) | 0 (0.0%) |
| Total | 0 (0.0%) | 0 (0.0%) |
Race in Somers
The most populous races in Somers are White / Caucasian (1,034 | 99.7%), Native / Alaskan (3 | 0.3%), and Hispanic or Latino (2 | 0.2%).
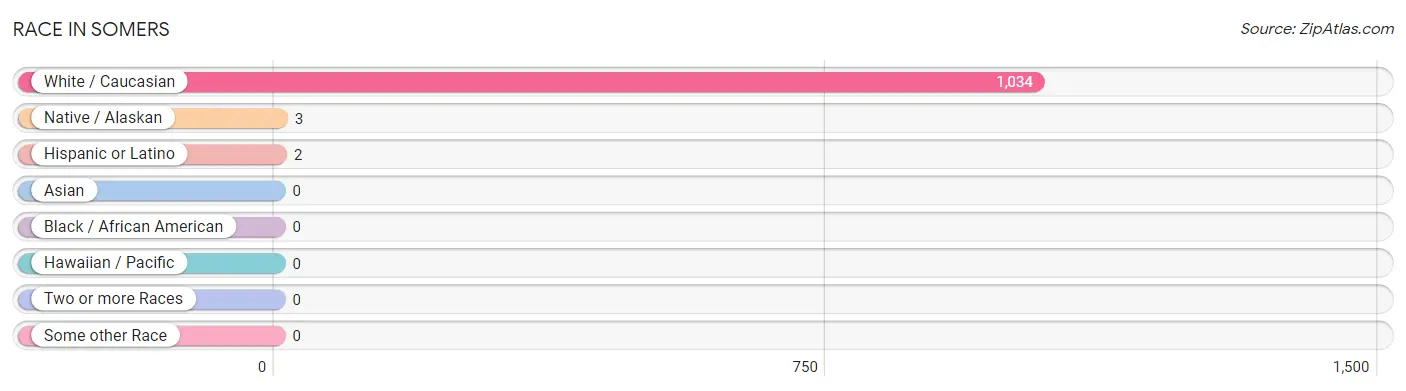
| Race | # Population | % Population |
| Asian | 0 | 0.0% |
| Black / African American | 0 | 0.0% |
| Hawaiian / Pacific | 0 | 0.0% |
| Hispanic or Latino | 2 | 0.2% |
| Native / Alaskan | 3 | 0.3% |
| White / Caucasian | 1,034 | 99.7% |
| Two or more Races | 0 | 0.0% |
| Some other Race | 0 | 0.0% |
| Total | 1,037 | 100.0% |
Ancestry in Somers
The most populous ancestries reported in Somers are German (339 | 32.7%), Irish (256 | 24.7%), American (175 | 16.9%), English (106 | 10.2%), and Italian (60 | 5.8%), together accounting for 90.3% of all Somers residents.
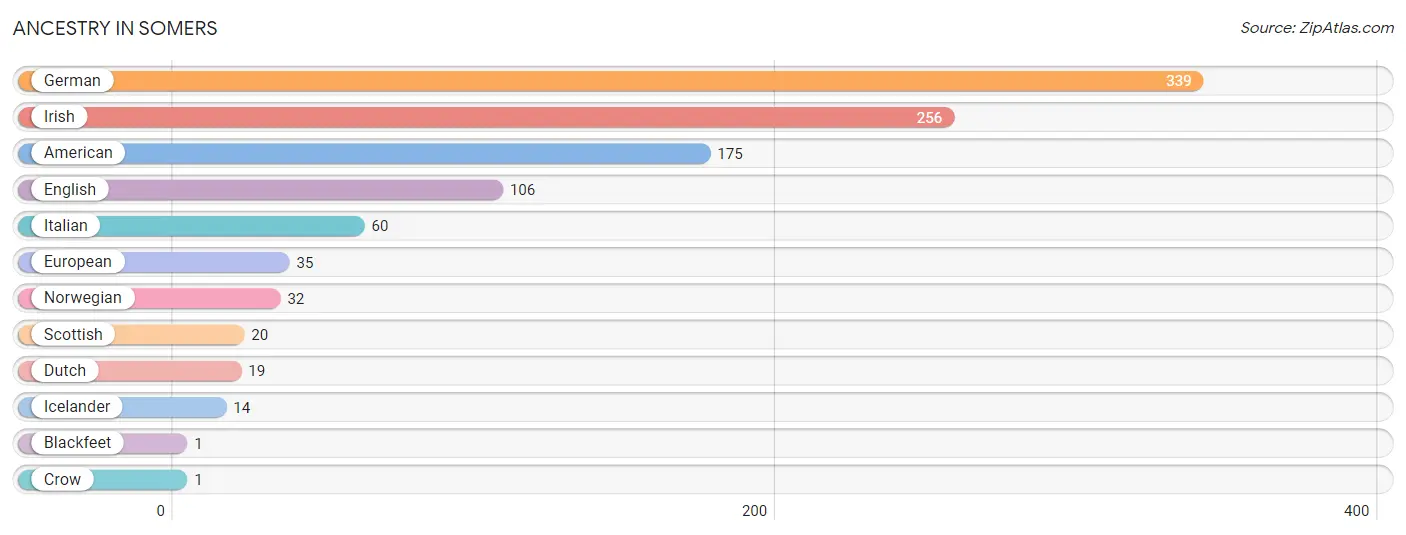
| Ancestry | # Population | % Population |
| American | 175 | 16.9% |
| Blackfeet | 1 | 0.1% |
| Crow | 1 | 0.1% |
| Dutch | 19 | 1.8% |
| English | 106 | 10.2% |
| European | 35 | 3.4% |
| German | 339 | 32.7% |
| Icelander | 14 | 1.3% |
| Irish | 256 | 24.7% |
| Italian | 60 | 5.8% |
| Norwegian | 32 | 3.1% |
| Scottish | 20 | 1.9% | View All 12 Rows |
Immigrants in Somers

| Immigration Origin | # Population | % Population | View All 0 Rows |
Sex and Age in Somers
Sex and Age in Somers
The most populous age groups in Somers are 60 to 64 Years (249 | 44.0%) for men and 65 to 69 Years (208 | 44.2%) for women.
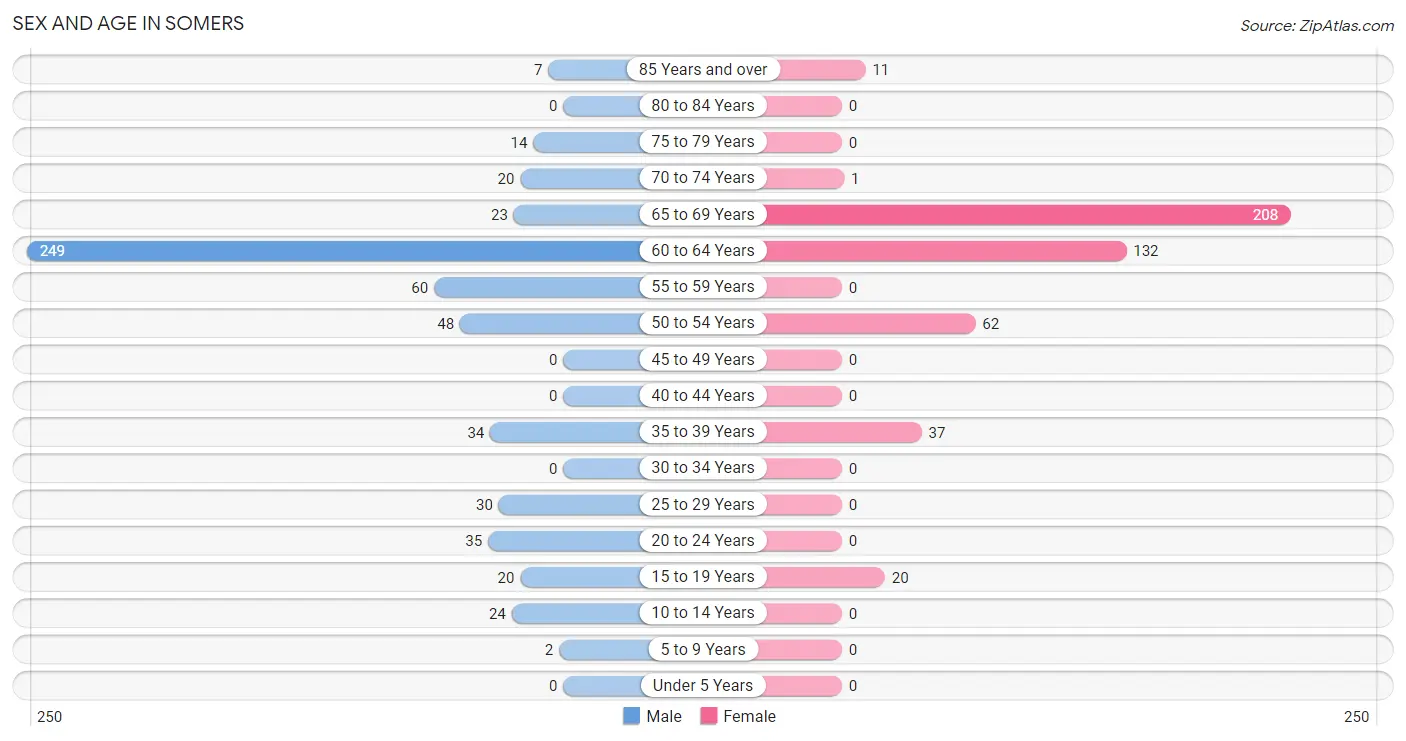
| Age Bracket | Male | Female |
| Under 5 Years | 0 (0.0%) | 0 (0.0%) |
| 5 to 9 Years | 2 (0.4%) | 0 (0.0%) |
| 10 to 14 Years | 24 (4.2%) | 0 (0.0%) |
| 15 to 19 Years | 20 (3.5%) | 20 (4.3%) |
| 20 to 24 Years | 35 (6.2%) | 0 (0.0%) |
| 25 to 29 Years | 30 (5.3%) | 0 (0.0%) |
| 30 to 34 Years | 0 (0.0%) | 0 (0.0%) |
| 35 to 39 Years | 34 (6.0%) | 37 (7.9%) |
| 40 to 44 Years | 0 (0.0%) | 0 (0.0%) |
| 45 to 49 Years | 0 (0.0%) | 0 (0.0%) |
| 50 to 54 Years | 48 (8.5%) | 62 (13.2%) |
| 55 to 59 Years | 60 (10.6%) | 0 (0.0%) |
| 60 to 64 Years | 249 (44.0%) | 132 (28.0%) |
| 65 to 69 Years | 23 (4.1%) | 208 (44.2%) |
| 70 to 74 Years | 20 (3.5%) | 1 (0.2%) |
| 75 to 79 Years | 14 (2.5%) | 0 (0.0%) |
| 80 to 84 Years | 0 (0.0%) | 0 (0.0%) |
| 85 Years and over | 7 (1.2%) | 11 (2.3%) |
| Total | 566 (100.0%) | 471 (100.0%) |
Families and Households in Somers
Median Family Size in Somers
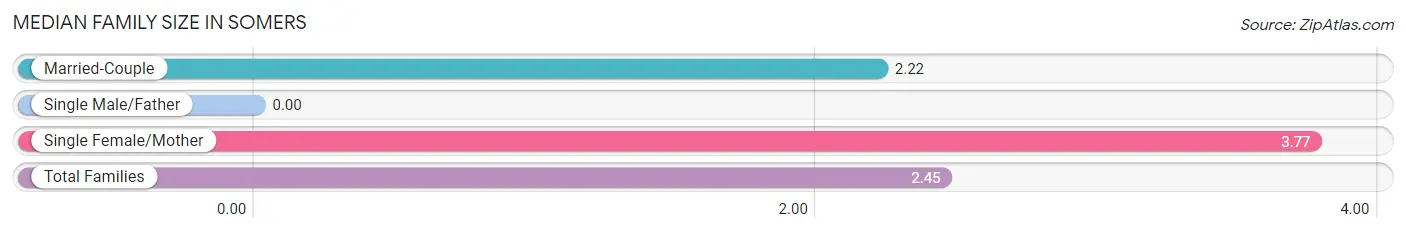
| Family Type | # Families | Family Size |
| Married-Couple | 315 (84.9%) | 2.22 |
| Single Male/Father | 0 (0.0%) | - |
| Single Female/Mother | 56 (15.1%) | 3.77 |
| Total Families | 371 (100.0%) | 2.45 |
Median Household Size in Somers
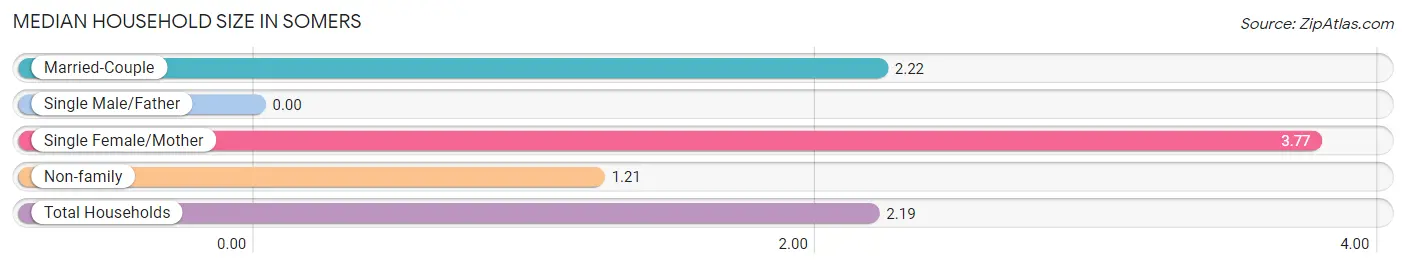
| Household Type | # Households | Household Size |
| Married-Couple | 315 (67.3%) | 2.22 |
| Single Male/Father | 0 (0.0%) | - |
| Single Female/Mother | 56 (12.0%) | 3.77 |
| Non-family | 97 (20.7%) | 1.21 |
| Total Households | 468 (100.0%) | 2.19 |
Household Size by Marriage Status in Somers
Out of a total of 468 households in Somers, 371 (79.3%) are family households, while 97 (20.7%) are nonfamily households. The most numerous type of family households are 2-person households, comprising 335, and the most common type of nonfamily households are 1-person households, comprising 80.
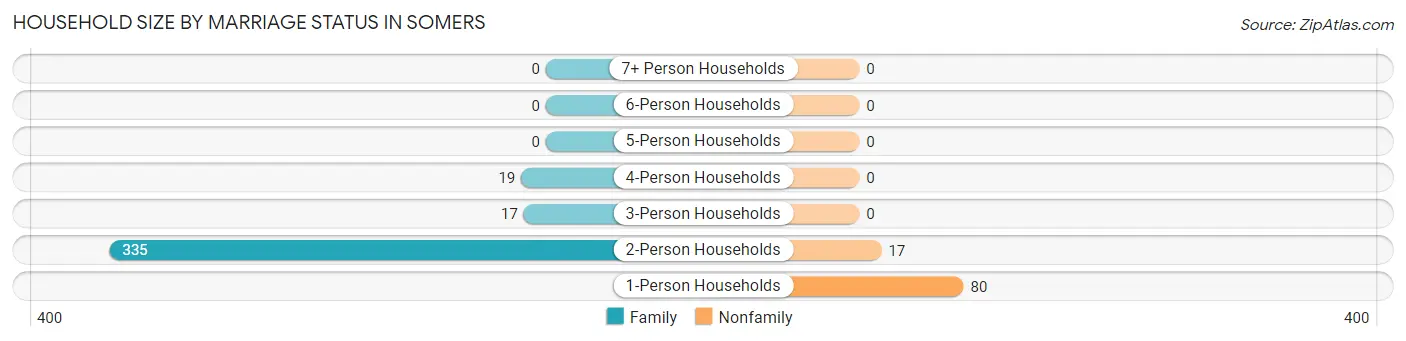
| Household Size | Family Households | Nonfamily Households |
| 1-Person Households | - | 80 (17.1%) |
| 2-Person Households | 335 (71.6%) | 17 (3.6%) |
| 3-Person Households | 17 (3.6%) | 0 (0.0%) |
| 4-Person Households | 19 (4.1%) | 0 (0.0%) |
| 5-Person Households | 0 (0.0%) | 0 (0.0%) |
| 6-Person Households | 0 (0.0%) | 0 (0.0%) |
| 7+ Person Households | 0 (0.0%) | 0 (0.0%) |
| Total | 371 (79.3%) | 97 (20.7%) |
Female Fertility in Somers
Fertility by Age in Somers
| Age Bracket | Women with Births | Births / 1,000 Women |
| 15 to 19 years | 0 (0.0%) | 0.0 |
| 20 to 34 years | 0 (0.0%) | 0.0 |
| 35 to 50 years | 0 (0.0%) | 0.0 |
| Total | 0 (0.0%) | 0.0 |
Fertility by Age by Marriage Status in Somers
| Age Bracket | Married | Unmarried |
| 15 to 19 years | 0 (0.0%) | 0 (0.0%) |
| 20 to 34 years | 0 (0.0%) | 0 (0.0%) |
| 35 to 50 years | 0 (0.0%) | 0 (0.0%) |
| Total | 0 (0.0%) | 0 (0.0%) |
Fertility by Education in Somers
| Educational Attainment | Women with Births | Births / 1,000 Women |
| Less than High School | 0 (0.0%) | 0.0 |
| High School Diploma | 0 (0.0%) | 0.0 |
| College or Associate's Degree | 0 (0.0%) | 0.0 |
| Bachelor's Degree | 0 (0.0%) | 0.0 |
| Graduate Degree | 0 (0.0%) | 0.0 |
| Total | 0 (0.0%) | 0.0 |
Fertility by Education by Marriage Status in Somers
| Educational Attainment | Married | Unmarried |
| Less than High School | 0 (0.0%) | 0 (0.0%) |
| High School Diploma | 0 (0.0%) | 0 (0.0%) |
| College or Associate's Degree | 0 (0.0%) | 0 (0.0%) |
| Bachelor's Degree | 0 (0.0%) | 0 (0.0%) |
| Graduate Degree | 0 (0.0%) | 0 (0.0%) |
| Total | 0 (0.0%) | 0 (0.0%) |
Employment Characteristics in Somers
Employment by Class of Employer in Somers
Among the 458 employed individuals in Somers, private company employees (415 | 90.6%), not-for-profit organizations (17 | 3.7%), and local government employees (14 | 3.1%) make up the most common classes of employment.
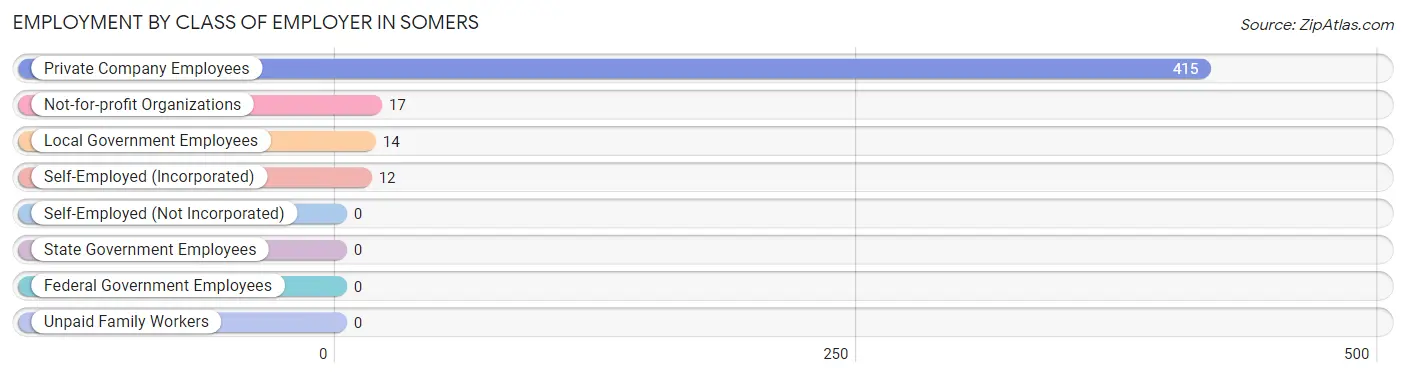
| Employer Class | # Employees | % Employees |
| Private Company Employees | 415 | 90.6% |
| Self-Employed (Incorporated) | 12 | 2.6% |
| Self-Employed (Not Incorporated) | 0 | 0.0% |
| Not-for-profit Organizations | 17 | 3.7% |
| Local Government Employees | 14 | 3.1% |
| State Government Employees | 0 | 0.0% |
| Federal Government Employees | 0 | 0.0% |
| Unpaid Family Workers | 0 | 0.0% |
| Total | 458 | 100.0% |
Employment Status by Age in Somers
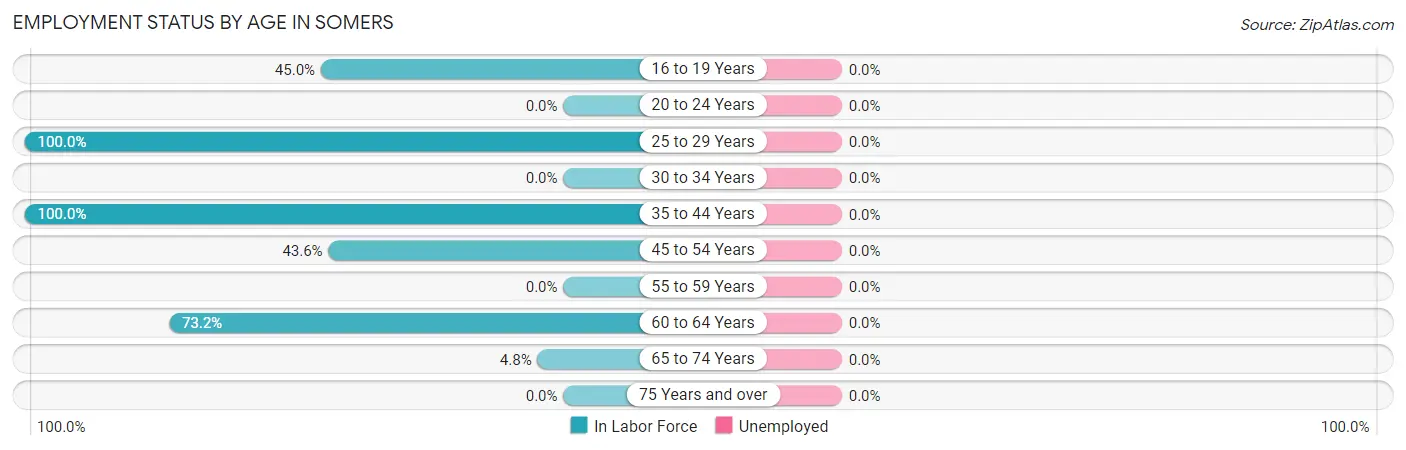
| Age Bracket | In Labor Force | Unemployed |
| 16 to 19 Years | 18 (45.0%) | 0 (0.0%) |
| 20 to 24 Years | 0 (0.0%) | 0 (0.0%) |
| 25 to 29 Years | 30 (100.0%) | 0 (0.0%) |
| 30 to 34 Years | 0 (0.0%) | 0 (0.0%) |
| 35 to 44 Years | 71 (100.0%) | 0 (0.0%) |
| 45 to 54 Years | 48 (43.6%) | 0 (0.0%) |
| 55 to 59 Years | 0 (0.0%) | 0 (0.0%) |
| 60 to 64 Years | 279 (73.2%) | 0 (0.0%) |
| 65 to 74 Years | 12 (4.8%) | 0 (0.0%) |
| 75 Years and over | 0 (0.0%) | 0 (0.0%) |
| Total | 458 (45.3%) | 0 (0.0%) |
Employment Status by Educational Attainment in Somers
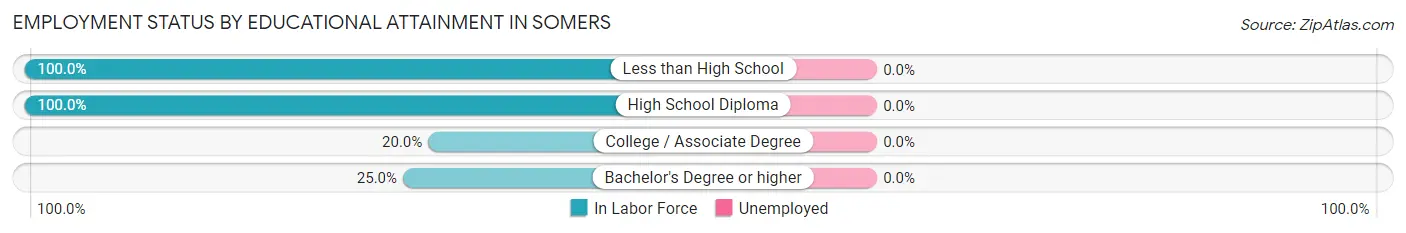
| Educational Attainment | In Labor Force | Unemployed |
| Less than High School | 229 (100.0%) | 0 (0.0%) |
| High School Diploma | 131 (100.0%) | 0 (0.0%) |
| College / Associate Degree | 20 (20.0%) | 0 (0.0%) |
| Bachelor's Degree or higher | 48 (25.0%) | 0 (0.0%) |
| Total | 428 (65.6%) | 0 (0.0%) |
Employment Occupations by Sex in Somers
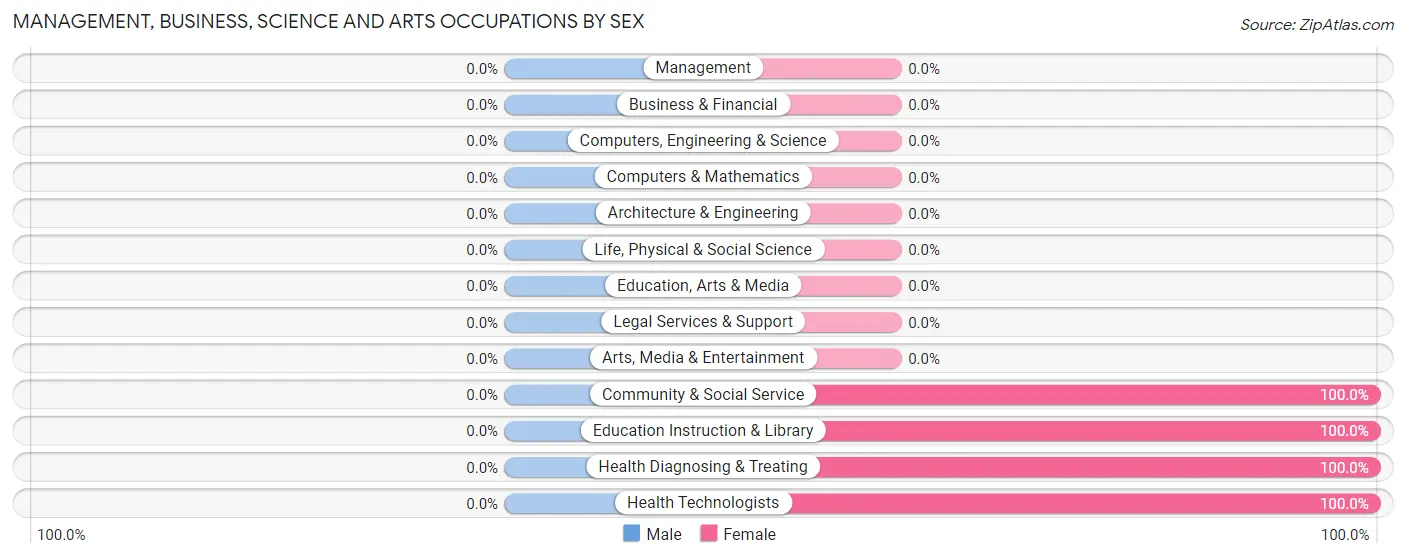
Management, Business, Science and Arts Occupations
The most common Management, Business, Science and Arts occupations in Somers are Health Diagnosing & Treating (17 | 3.7%), Health Technologists (17 | 3.7%), Community & Social Service (14 | 3.1%), and Education Instruction & Library (14 | 3.1%).
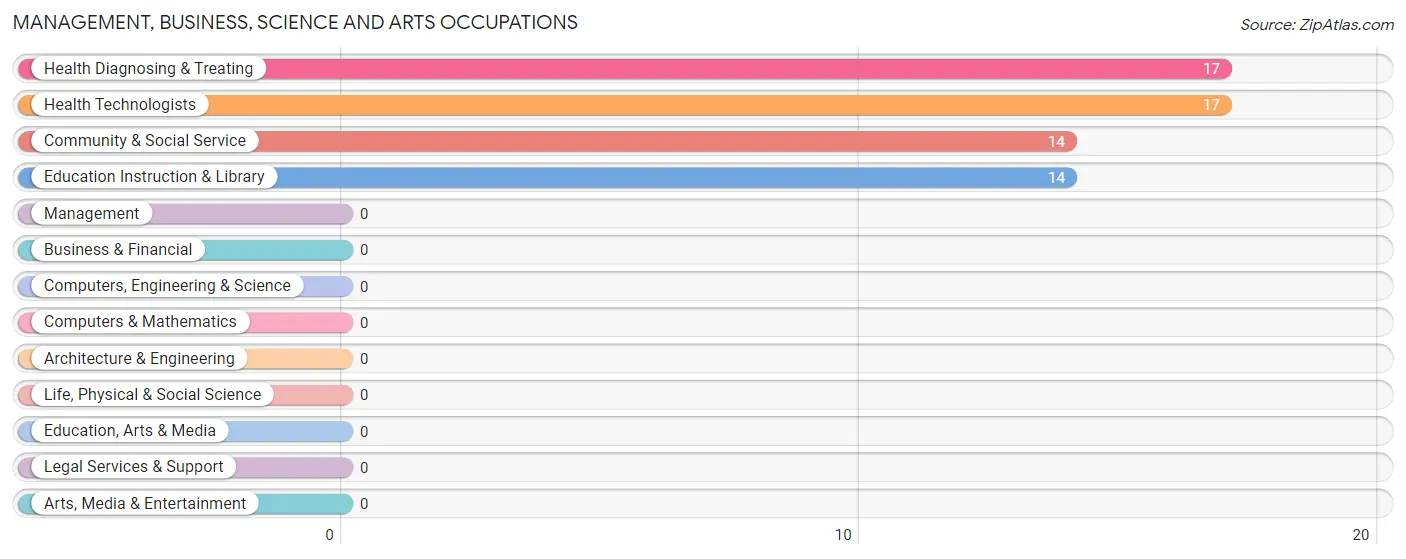
Management, Business, Science and Arts Occupations by Sex
| Occupation | Male | Female |
| Management | 0 (0.0%) | 0 (0.0%) |
| Business & Financial | 0 (0.0%) | 0 (0.0%) |
| Computers, Engineering & Science | 0 (0.0%) | 0 (0.0%) |
| Computers & Mathematics | 0 (0.0%) | 0 (0.0%) |
| Architecture & Engineering | 0 (0.0%) | 0 (0.0%) |
| Life, Physical & Social Science | 0 (0.0%) | 0 (0.0%) |
| Community & Social Service | 0 (0.0%) | 14 (100.0%) |
| Education, Arts & Media | 0 (0.0%) | 0 (0.0%) |
| Legal Services & Support | 0 (0.0%) | 0 (0.0%) |
| Education Instruction & Library | 0 (0.0%) | 14 (100.0%) |
| Arts, Media & Entertainment | 0 (0.0%) | 0 (0.0%) |
| Health Diagnosing & Treating | 0 (0.0%) | 17 (100.0%) |
| Health Technologists | 0 (0.0%) | 17 (100.0%) |
| Total (Category) | 0 (0.0%) | 31 (100.0%) |
| Total (Overall) | 359 (78.4%) | 99 (21.6%) |
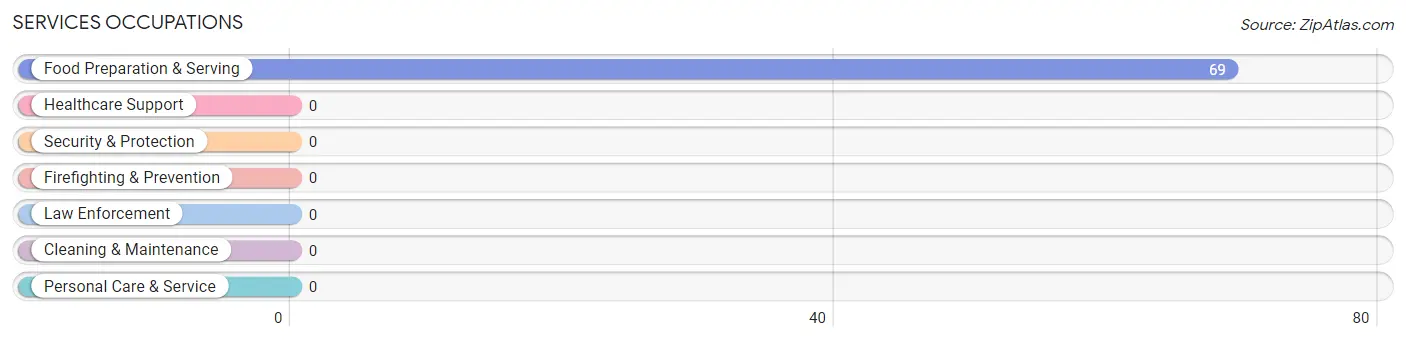
Services Occupations
The most common Services occupations in Somers are , and Food Preparation & Serving (69 | 15.1%).
Services Occupations by Sex
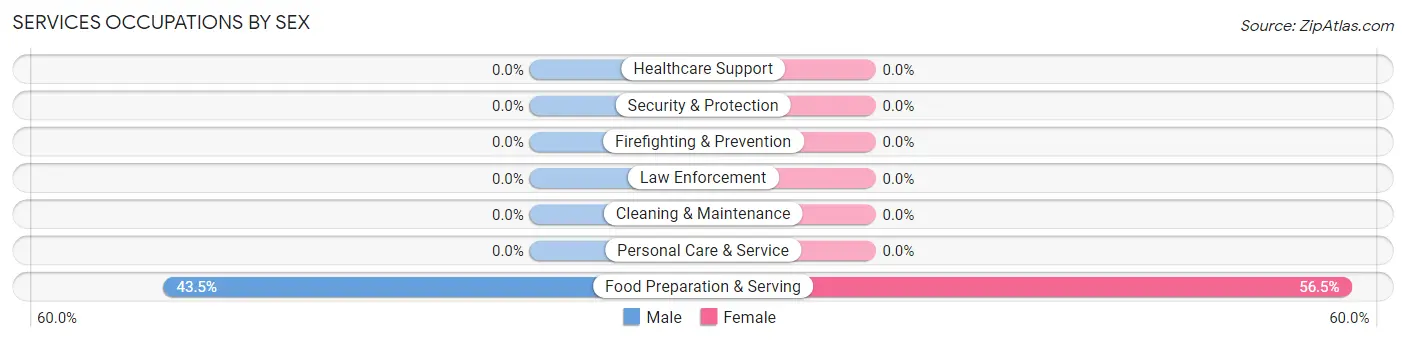
| Occupation | Male | Female |
| Healthcare Support | 0 (0.0%) | 0 (0.0%) |
| Security & Protection | 0 (0.0%) | 0 (0.0%) |
| Firefighting & Prevention | 0 (0.0%) | 0 (0.0%) |
| Law Enforcement | 0 (0.0%) | 0 (0.0%) |
| Food Preparation & Serving | 30 (43.5%) | 39 (56.5%) |
| Cleaning & Maintenance | 0 (0.0%) | 0 (0.0%) |
| Personal Care & Service | 0 (0.0%) | 0 (0.0%) |
| Total (Category) | 30 (43.5%) | 39 (56.5%) |
| Total (Overall) | 359 (78.4%) | 99 (21.6%) |
Sales and Office Occupations
The most common Sales and Office occupations in Somers are , and Office & Administration (29 | 6.3%).
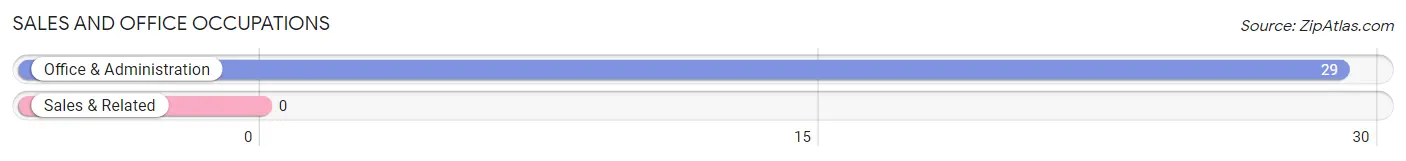
Sales and Office Occupations by Sex
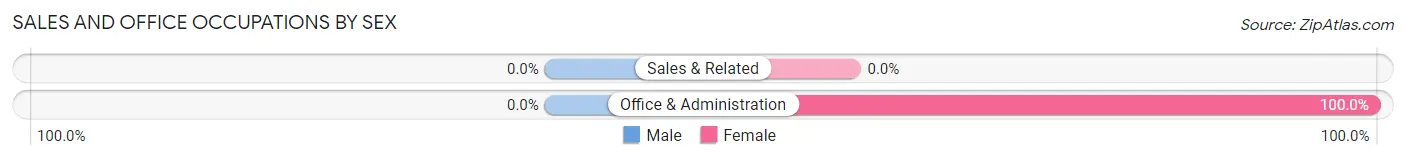
| Occupation | Male | Female |
| Sales & Related | 0 (0.0%) | 0 (0.0%) |
| Office & Administration | 0 (0.0%) | 29 (100.0%) |
| Total (Category) | 0 (0.0%) | 29 (100.0%) |
| Total (Overall) | 359 (78.4%) | 99 (21.6%) |
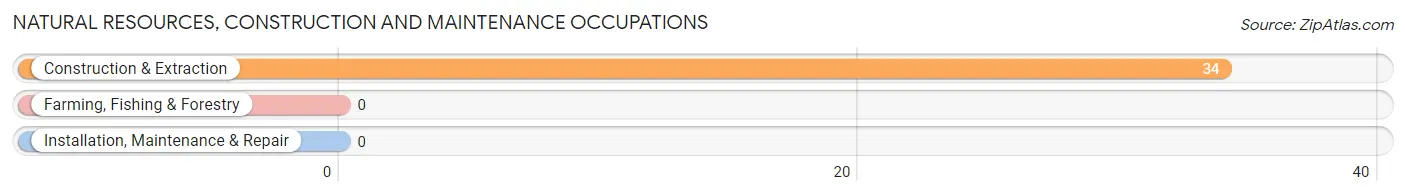
Natural Resources, Construction and Maintenance Occupations
The most common Natural Resources, Construction and Maintenance occupations in Somers are , and Construction & Extraction (34 | 7.4%).
Natural Resources, Construction and Maintenance Occupations by Sex
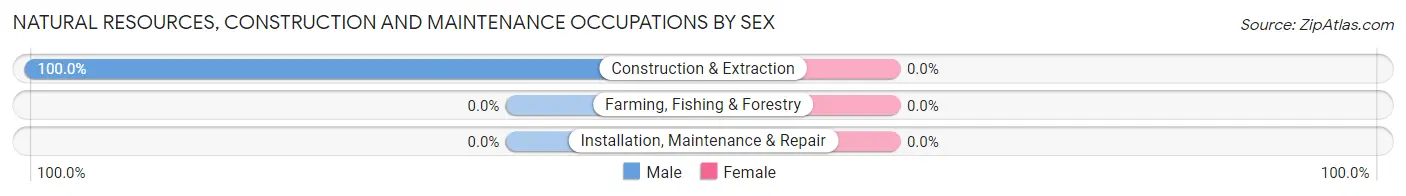
| Occupation | Male | Female |
| Farming, Fishing & Forestry | 0 (0.0%) | 0 (0.0%) |
| Construction & Extraction | 34 (100.0%) | 0 (0.0%) |
| Installation, Maintenance & Repair | 0 (0.0%) | 0 (0.0%) |
| Total (Category) | 34 (100.0%) | 0 (0.0%) |
| Total (Overall) | 359 (78.4%) | 99 (21.6%) |
Production, Transportation and Moving Occupations
The most common Production, Transportation and Moving occupations in Somers are Transportation (247 | 53.9%), and Material Moving (48 | 10.5%).
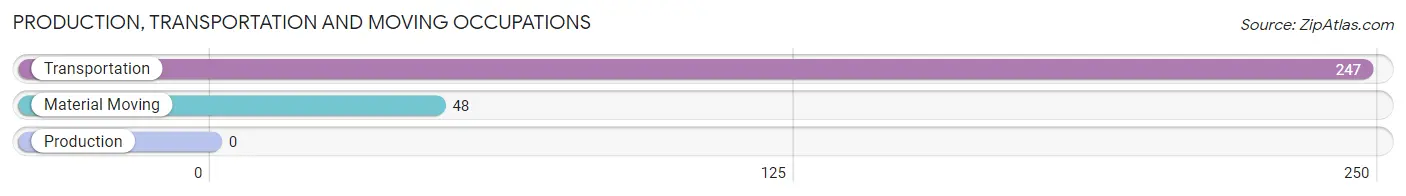
Production, Transportation and Moving Occupations by Sex
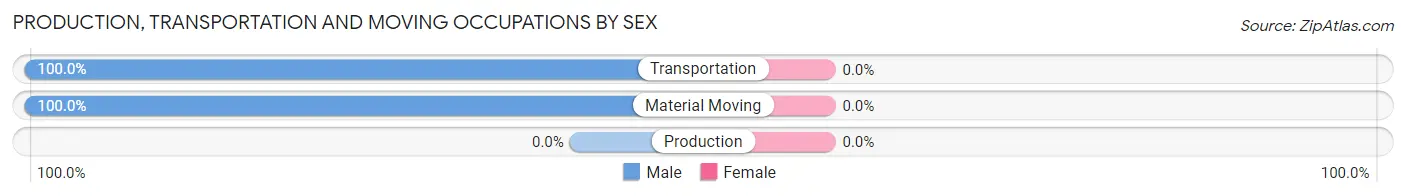
| Occupation | Male | Female |
| Production | 0 (0.0%) | 0 (0.0%) |
| Transportation | 247 (100.0%) | 0 (0.0%) |
| Material Moving | 48 (100.0%) | 0 (0.0%) |
| Total (Category) | 295 (100.0%) | 0 (0.0%) |
| Total (Overall) | 359 (78.4%) | 99 (21.6%) |
Employment Industries by Sex in Somers
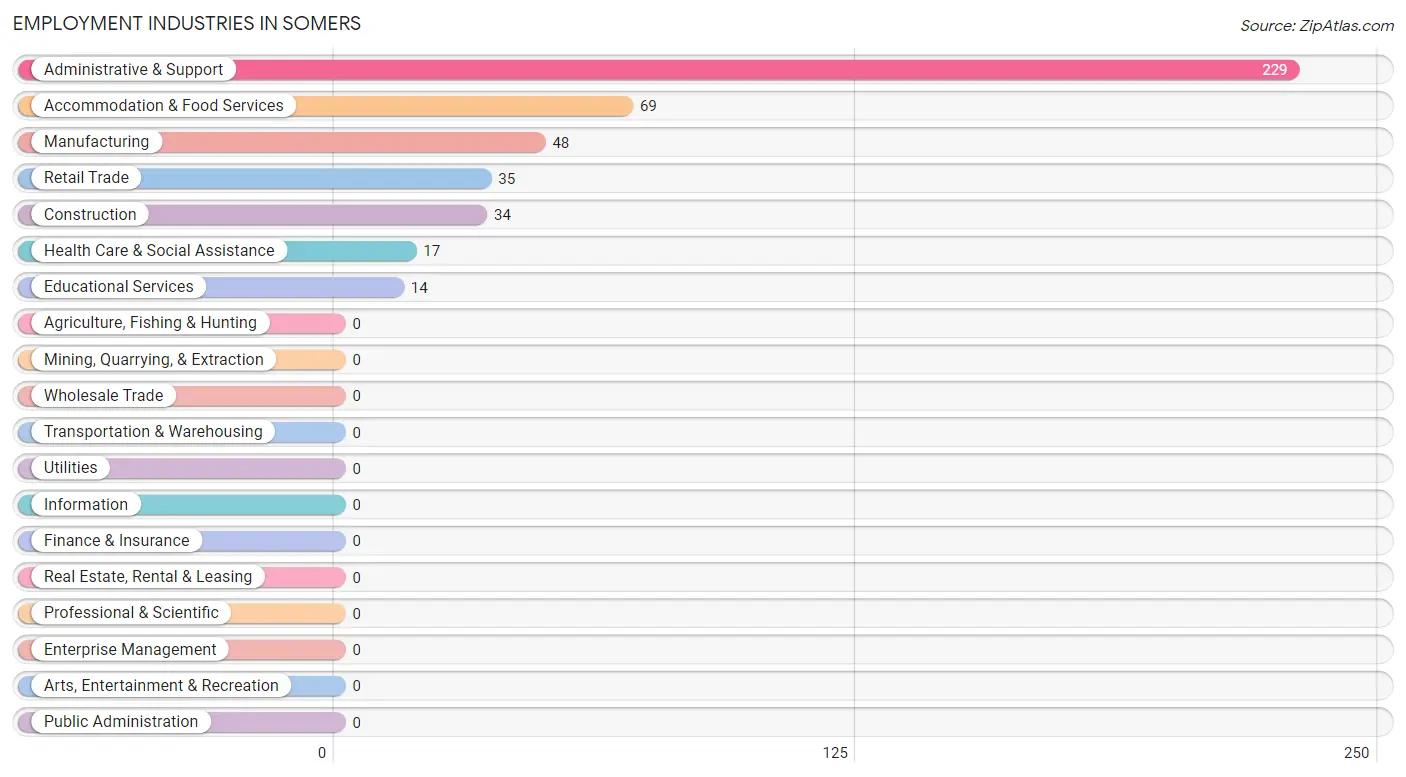
Employment Industries in Somers
The major employment industries in Somers include Administrative & Support (229 | 50.0%), Accommodation & Food Services (69 | 15.1%), Manufacturing (48 | 10.5%), Retail Trade (35 | 7.6%), and Construction (34 | 7.4%).
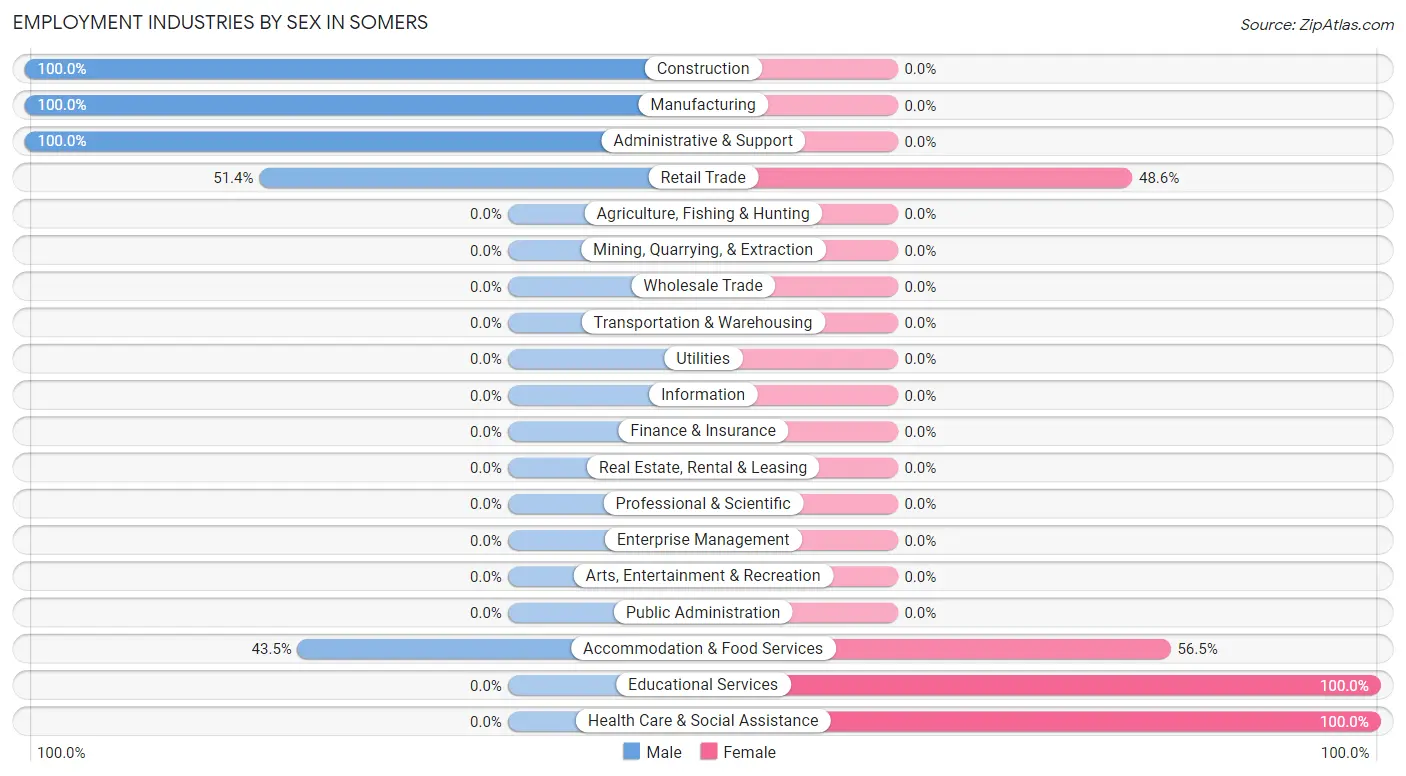
Employment Industries by Sex in Somers
The Somers industries that see more men than women are Construction (100.0%), Manufacturing (100.0%), and Administrative & Support (100.0%), whereas the industries that tend to have a higher number of women are Educational Services (100.0%), Health Care & Social Assistance (100.0%), and Accommodation & Food Services (56.5%).
| Industry | Male | Female |
| Agriculture, Fishing & Hunting | 0 (0.0%) | 0 (0.0%) |
| Mining, Quarrying, & Extraction | 0 (0.0%) | 0 (0.0%) |
| Construction | 34 (100.0%) | 0 (0.0%) |
| Manufacturing | 48 (100.0%) | 0 (0.0%) |
| Wholesale Trade | 0 (0.0%) | 0 (0.0%) |
| Retail Trade | 18 (51.4%) | 17 (48.6%) |
| Transportation & Warehousing | 0 (0.0%) | 0 (0.0%) |
| Utilities | 0 (0.0%) | 0 (0.0%) |
| Information | 0 (0.0%) | 0 (0.0%) |
| Finance & Insurance | 0 (0.0%) | 0 (0.0%) |
| Real Estate, Rental & Leasing | 0 (0.0%) | 0 (0.0%) |
| Professional & Scientific | 0 (0.0%) | 0 (0.0%) |
| Enterprise Management | 0 (0.0%) | 0 (0.0%) |
| Administrative & Support | 229 (100.0%) | 0 (0.0%) |
| Educational Services | 0 (0.0%) | 14 (100.0%) |
| Health Care & Social Assistance | 0 (0.0%) | 17 (100.0%) |
| Arts, Entertainment & Recreation | 0 (0.0%) | 0 (0.0%) |
| Accommodation & Food Services | 30 (43.5%) | 39 (56.5%) |
| Public Administration | 0 (0.0%) | 0 (0.0%) |
| Total | 359 (78.4%) | 99 (21.6%) |
Education in Somers
School Enrollment in Somers
The most common levels of schooling among the 66 students in Somers are high school (58 | 87.9%), and elementary school (8 | 12.1%).
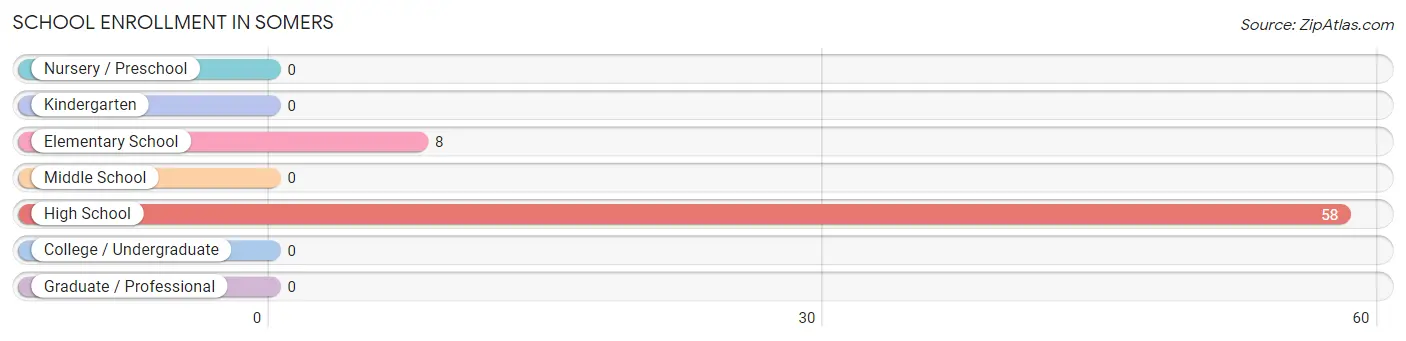
| School Level | # Students | % Students |
| Nursery / Preschool | 0 | 0.0% |
| Kindergarten | 0 | 0.0% |
| Elementary School | 8 | 12.1% |
| Middle School | 0 | 0.0% |
| High School | 58 | 87.9% |
| College / Undergraduate | 0 | 0.0% |
| Graduate / Professional | 0 | 0.0% |
| Total | 66 | 100.0% |
School Enrollment by Age by Funding Source in Somers
Out of a total of 66 students who are enrolled in schools in Somers, 5 (7.6%) attend a private institution, while the remaining 61 (92.4%) are enrolled in public schools. The age group of 5 to 9 year old has the highest likelihood of being enrolled in private schools, with 2 (100.0% in the age bracket) enrolled. Conversely, the age group of 18 to 19 year olds has the lowest likelihood of being enrolled in a private school, with 18 (100.0% in the age bracket) attending a public institution.
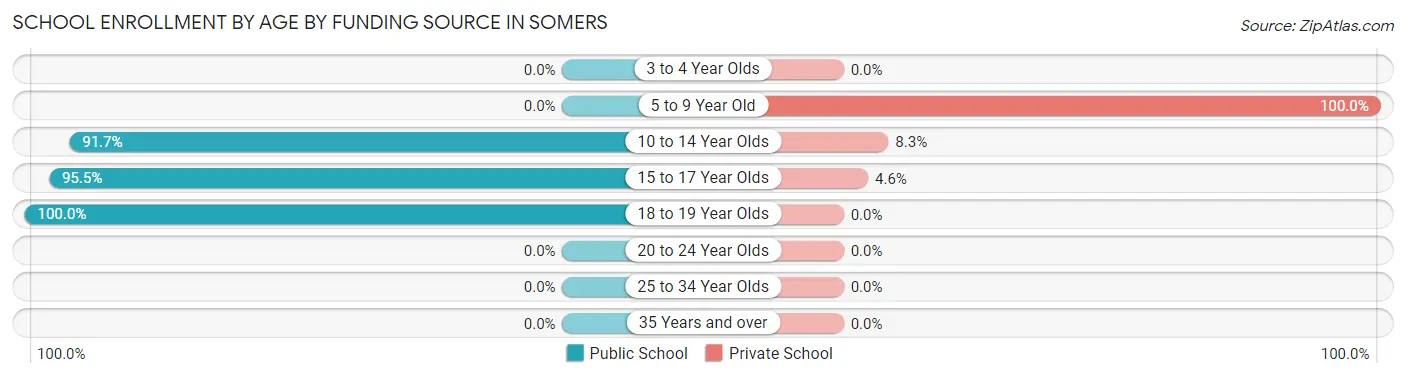
| Age Bracket | Public School | Private School |
| 3 to 4 Year Olds | 0 (0.0%) | 0 (0.0%) |
| 5 to 9 Year Old | 0 (0.0%) | 2 (100.0%) |
| 10 to 14 Year Olds | 22 (91.7%) | 2 (8.3%) |
| 15 to 17 Year Olds | 21 (95.5%) | 1 (4.5%) |
| 18 to 19 Year Olds | 18 (100.0%) | 0 (0.0%) |
| 20 to 24 Year Olds | 0 (0.0%) | 0 (0.0%) |
| 25 to 34 Year Olds | 0 (0.0%) | 0 (0.0%) |
| 35 Years and over | 0 (0.0%) | 0 (0.0%) |
| Total | 61 (92.4%) | 5 (7.6%) |
Educational Attainment by Field of Study in Somers
Business (159 | 58.0%), education (28 | 10.2%), communications (20 | 7.3%), engineering (19 | 6.9%), and physical & health sciences (17 | 6.2%) are the most common fields of study among 274 individuals in Somers who have obtained a bachelor's degree or higher.
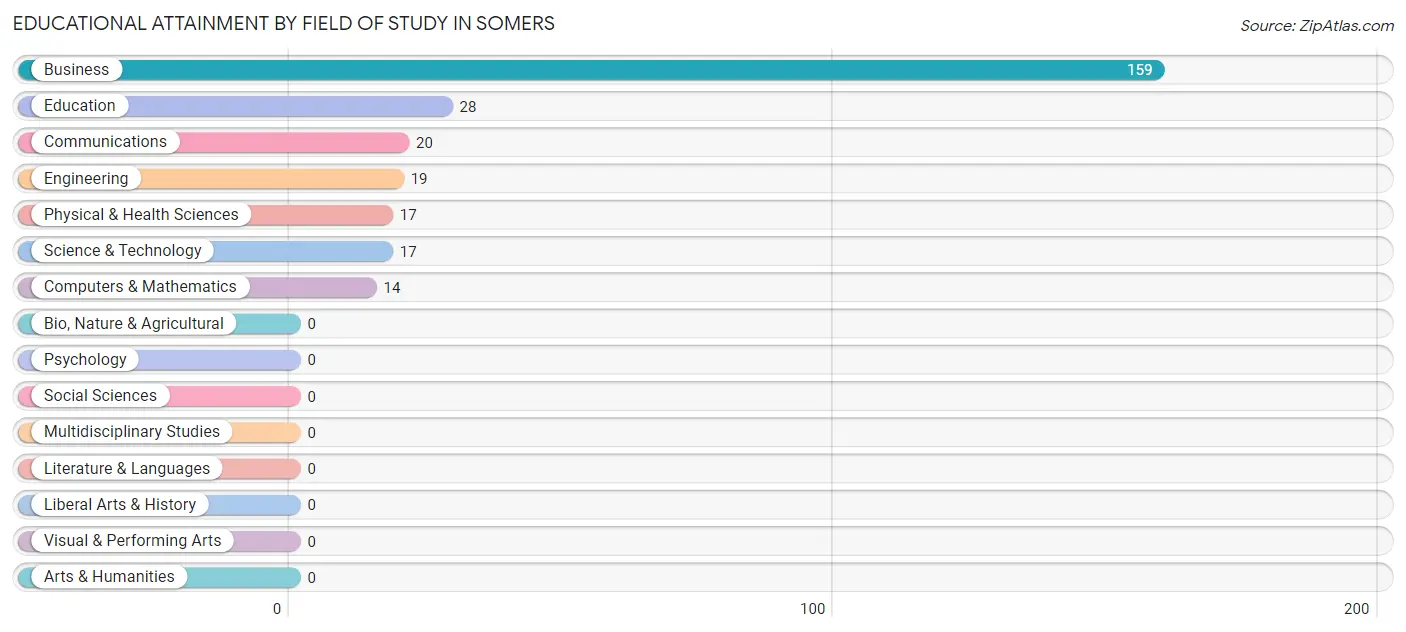
| Field of Study | # Graduates | % Graduates |
| Computers & Mathematics | 14 | 5.1% |
| Bio, Nature & Agricultural | 0 | 0.0% |
| Physical & Health Sciences | 17 | 6.2% |
| Psychology | 0 | 0.0% |
| Social Sciences | 0 | 0.0% |
| Engineering | 19 | 6.9% |
| Multidisciplinary Studies | 0 | 0.0% |
| Science & Technology | 17 | 6.2% |
| Business | 159 | 58.0% |
| Education | 28 | 10.2% |
| Literature & Languages | 0 | 0.0% |
| Liberal Arts & History | 0 | 0.0% |
| Visual & Performing Arts | 0 | 0.0% |
| Communications | 20 | 7.3% |
| Arts & Humanities | 0 | 0.0% |
| Total | 274 | 100.0% |
Transportation & Commute in Somers
Vehicle Availability by Sex in Somers
The most prevalent vehicle ownership categories in Somers are males with 1 vehicle (229, accounting for 63.8%) and females with 1 vehicle (20, making up 231.3%).
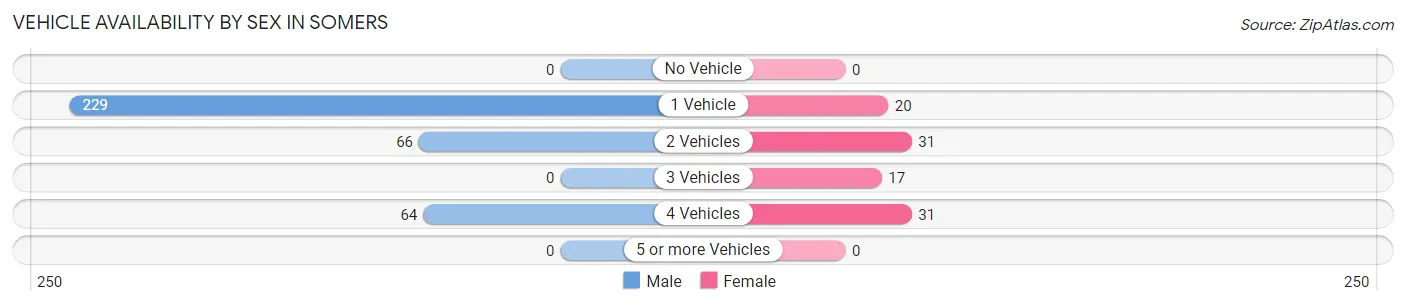
| Vehicles Available | Male | Female |
| No Vehicle | 0 (0.0%) | 0 (0.0%) |
| 1 Vehicle | 229 (63.8%) | 20 (20.2%) |
| 2 Vehicles | 66 (18.4%) | 31 (31.3%) |
| 3 Vehicles | 0 (0.0%) | 17 (17.2%) |
| 4 Vehicles | 64 (17.8%) | 31 (31.3%) |
| 5 or more Vehicles | 0 (0.0%) | 0 (0.0%) |
| Total | 359 (100.0%) | 99 (100.0%) |
Commute Time in Somers
The most frequently occuring commute durations in Somers are 20 to 24 minutes (71 commuters, 31.0%), 10 to 14 minutes (67 commuters, 29.3%), and 40 to 44 minutes (48 commuters, 21.0%).
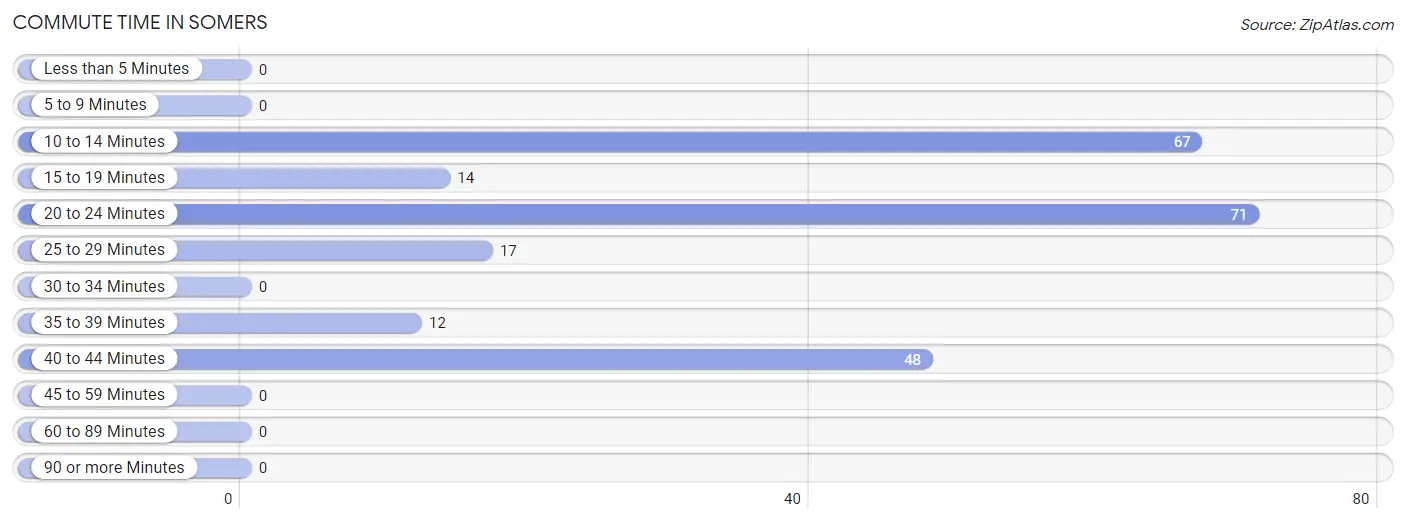
| Commute Time | # Commuters | % Commuters |
| Less than 5 Minutes | 0 | 0.0% |
| 5 to 9 Minutes | 0 | 0.0% |
| 10 to 14 Minutes | 67 | 29.3% |
| 15 to 19 Minutes | 14 | 6.1% |
| 20 to 24 Minutes | 71 | 31.0% |
| 25 to 29 Minutes | 17 | 7.4% |
| 30 to 34 Minutes | 0 | 0.0% |
| 35 to 39 Minutes | 12 | 5.2% |
| 40 to 44 Minutes | 48 | 21.0% |
| 45 to 59 Minutes | 0 | 0.0% |
| 60 to 89 Minutes | 0 | 0.0% |
| 90 or more Minutes | 0 | 0.0% |
Commute Time by Sex in Somers
The most common commute times in Somers are 10 to 14 minutes (48 commuters, 36.9%) for males and 20 to 24 minutes (37 commuters, 37.4%) for females.
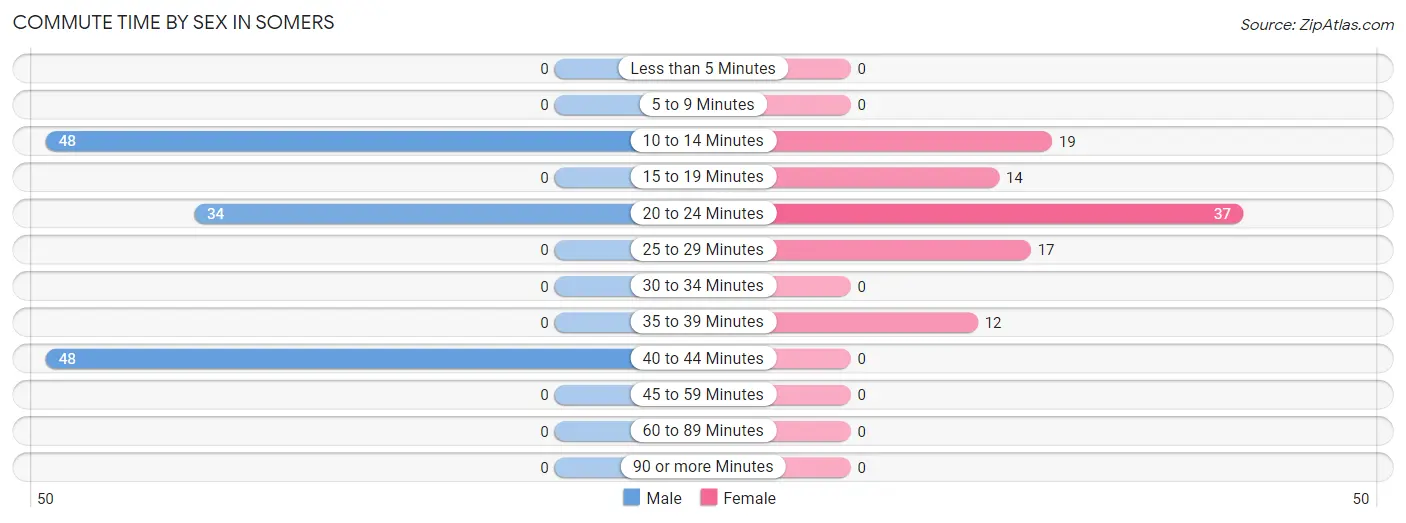
| Commute Time | Male | Female |
| Less than 5 Minutes | 0 (0.0%) | 0 (0.0%) |
| 5 to 9 Minutes | 0 (0.0%) | 0 (0.0%) |
| 10 to 14 Minutes | 48 (36.9%) | 19 (19.2%) |
| 15 to 19 Minutes | 0 (0.0%) | 14 (14.1%) |
| 20 to 24 Minutes | 34 (26.2%) | 37 (37.4%) |
| 25 to 29 Minutes | 0 (0.0%) | 17 (17.2%) |
| 30 to 34 Minutes | 0 (0.0%) | 0 (0.0%) |
| 35 to 39 Minutes | 0 (0.0%) | 12 (12.1%) |
| 40 to 44 Minutes | 48 (36.9%) | 0 (0.0%) |
| 45 to 59 Minutes | 0 (0.0%) | 0 (0.0%) |
| 60 to 89 Minutes | 0 (0.0%) | 0 (0.0%) |
| 90 or more Minutes | 0 (0.0%) | 0 (0.0%) |
Time of Departure to Work by Sex in Somers
The most frequent times of departure to work in Somers are 8:30 AM to 8:59 AM (48, 36.9%) for males and 7:30 AM to 7:59 AM (34, 34.3%) for females.
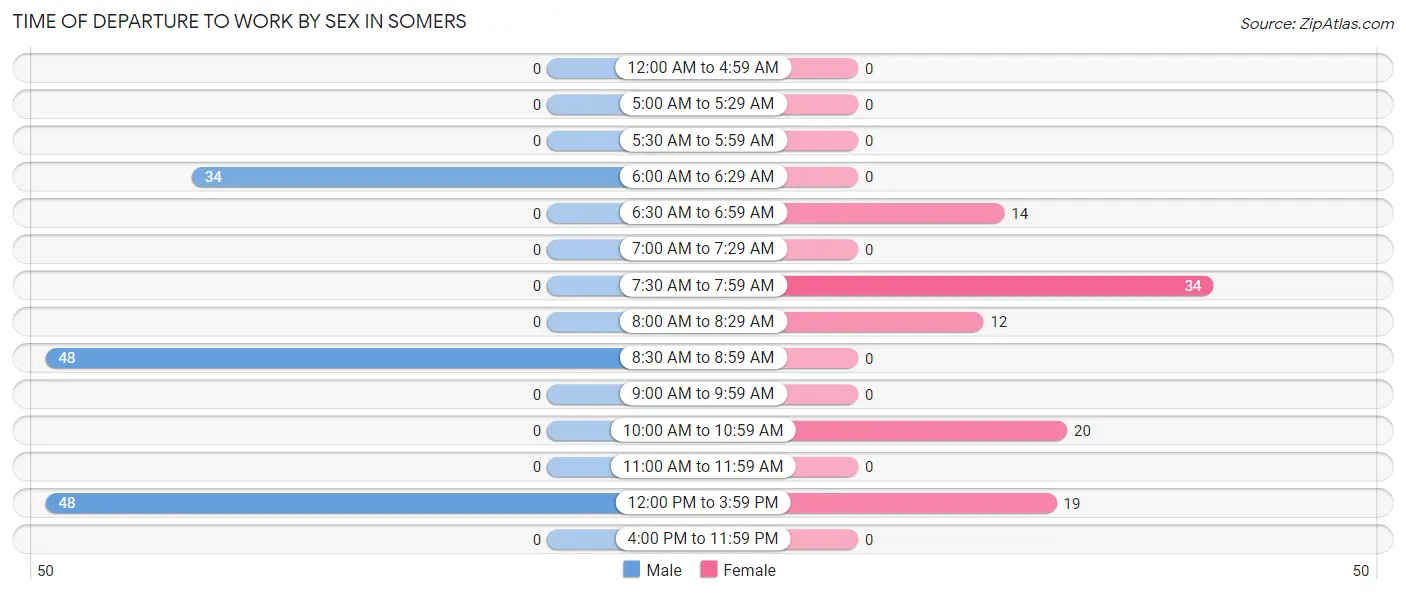
| Time of Departure | Male | Female |
| 12:00 AM to 4:59 AM | 0 (0.0%) | 0 (0.0%) |
| 5:00 AM to 5:29 AM | 0 (0.0%) | 0 (0.0%) |
| 5:30 AM to 5:59 AM | 0 (0.0%) | 0 (0.0%) |
| 6:00 AM to 6:29 AM | 34 (26.2%) | 0 (0.0%) |
| 6:30 AM to 6:59 AM | 0 (0.0%) | 14 (14.1%) |
| 7:00 AM to 7:29 AM | 0 (0.0%) | 0 (0.0%) |
| 7:30 AM to 7:59 AM | 0 (0.0%) | 34 (34.3%) |
| 8:00 AM to 8:29 AM | 0 (0.0%) | 12 (12.1%) |
| 8:30 AM to 8:59 AM | 48 (36.9%) | 0 (0.0%) |
| 9:00 AM to 9:59 AM | 0 (0.0%) | 0 (0.0%) |
| 10:00 AM to 10:59 AM | 0 (0.0%) | 20 (20.2%) |
| 11:00 AM to 11:59 AM | 0 (0.0%) | 0 (0.0%) |
| 12:00 PM to 3:59 PM | 48 (36.9%) | 19 (19.2%) |
| 4:00 PM to 11:59 PM | 0 (0.0%) | 0 (0.0%) |
| Total | 130 (100.0%) | 99 (100.0%) |
Housing Occupancy in Somers
Occupancy by Ownership in Somers
Of the total 468 dwellings in Somers, owner-occupied units account for 229 (48.9%), while renter-occupied units make up 239 (51.1%).
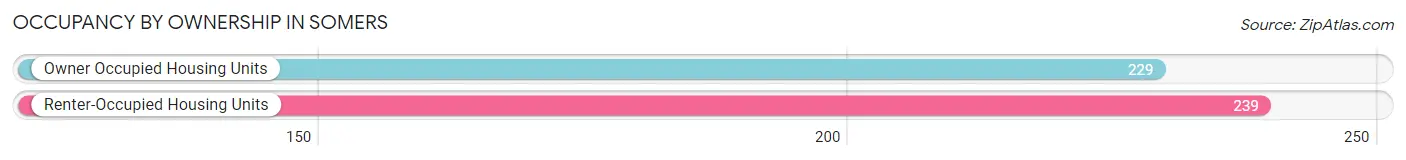
| Occupancy | # Housing Units | % Housing Units |
| Owner Occupied Housing Units | 229 | 48.9% |
| Renter-Occupied Housing Units | 239 | 51.1% |
| Total Occupied Housing Units | 468 | 100.0% |
Occupancy by Household Size in Somers
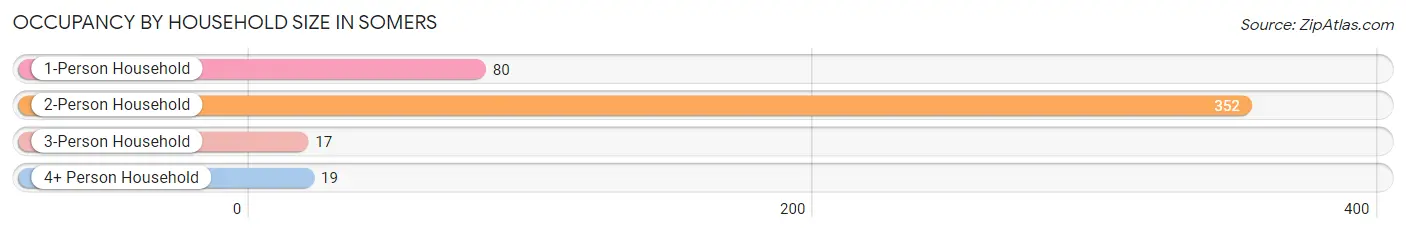
| Household Size | # Housing Units | % Housing Units |
| 1-Person Household | 80 | 17.1% |
| 2-Person Household | 352 | 75.2% |
| 3-Person Household | 17 | 3.6% |
| 4+ Person Household | 19 | 4.1% |
| Total Housing Units | 468 | 100.0% |
Occupancy by Ownership by Household Size in Somers
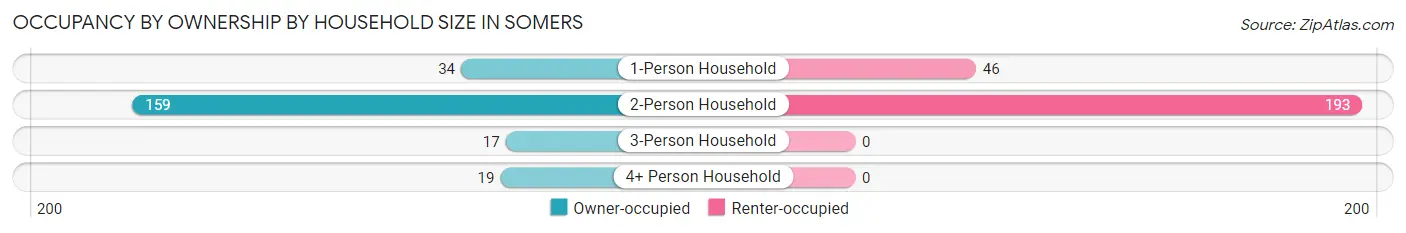
| Household Size | Owner-occupied | Renter-occupied |
| 1-Person Household | 34 (42.5%) | 46 (57.5%) |
| 2-Person Household | 159 (45.2%) | 193 (54.8%) |
| 3-Person Household | 17 (100.0%) | 0 (0.0%) |
| 4+ Person Household | 19 (100.0%) | 0 (0.0%) |
| Total Housing Units | 229 (48.9%) | 239 (51.1%) |
Occupancy by Educational Attainment in Somers
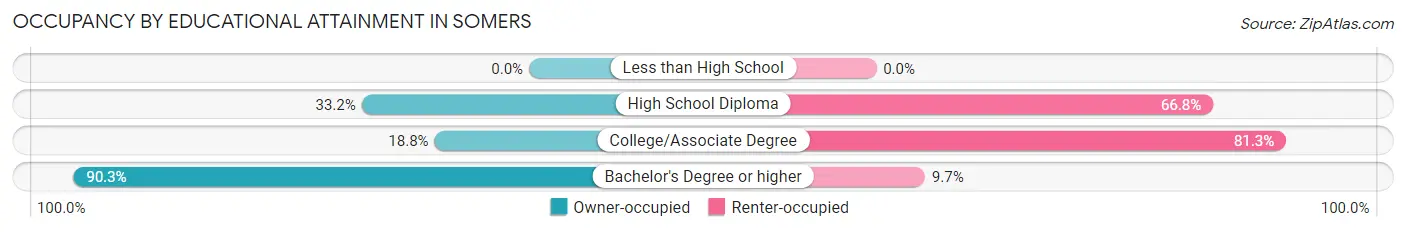
| Household Size | Owner-occupied | Renter-occupied |
| Less than High School | 0 (0.0%) | 0 (0.0%) |
| High School Diploma | 86 (33.2%) | 173 (66.8%) |
| College/Associate Degree | 12 (18.8%) | 52 (81.2%) |
| Bachelor's Degree or higher | 131 (90.3%) | 14 (9.7%) |
Occupancy by Age of Householder in Somers
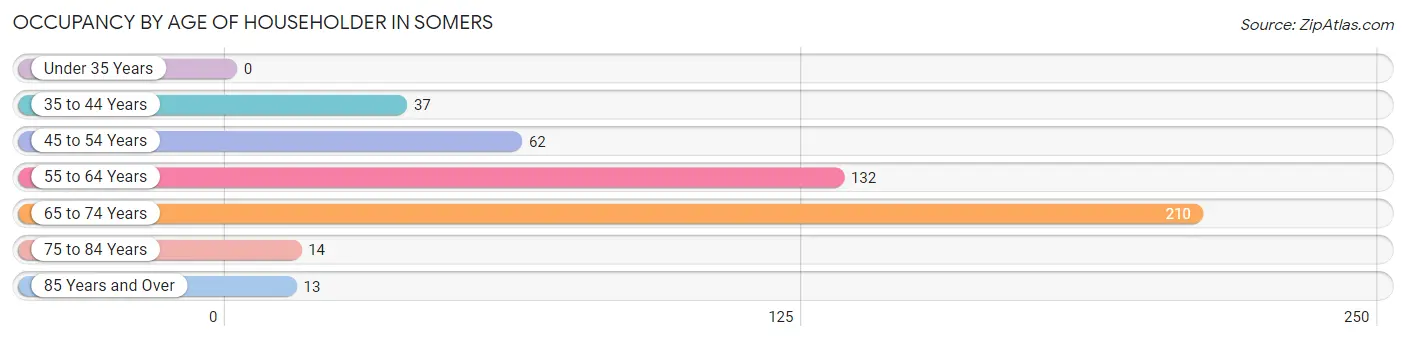
| Age Bracket | # Households | % Households |
| Under 35 Years | 0 | 0.0% |
| 35 to 44 Years | 37 | 7.9% |
| 45 to 54 Years | 62 | 13.3% |
| 55 to 64 Years | 132 | 28.2% |
| 65 to 74 Years | 210 | 44.9% |
| 75 to 84 Years | 14 | 3.0% |
| 85 Years and Over | 13 | 2.8% |
| Total | 468 | 100.0% |
Housing Finances in Somers
Median Income by Occupancy in Somers
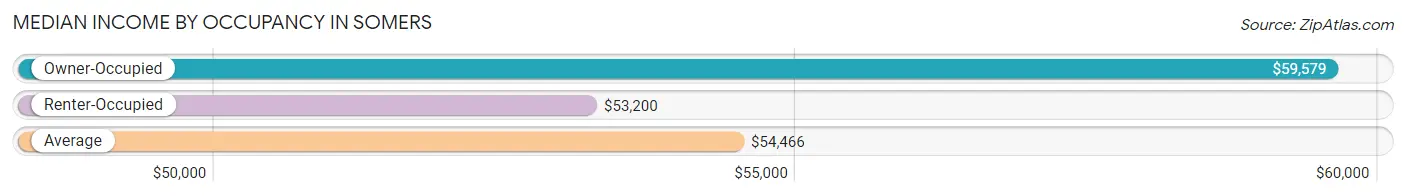
| Occupancy Type | # Households | Median Income |
| Owner-Occupied | 229 (48.9%) | $59,579 |
| Renter-Occupied | 239 (51.1%) | $53,200 |
| Average | 468 (100.0%) | $54,466 |
Occupancy by Householder Income Bracket in Somers
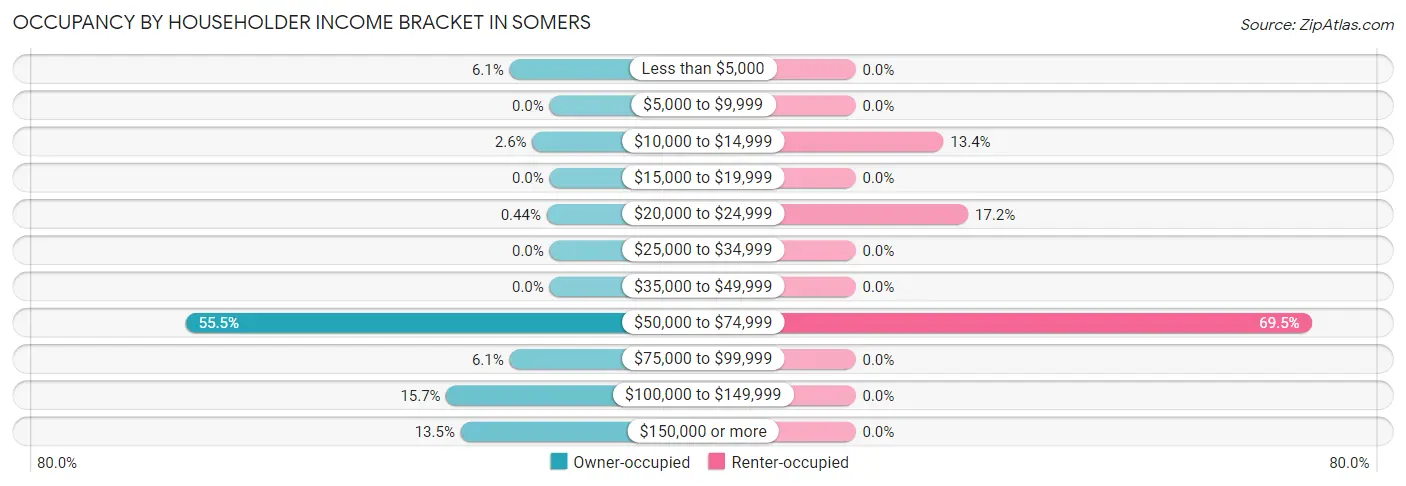
| Income Bracket | Owner-occupied | Renter-occupied |
| Less than $5,000 | 14 (6.1%) | 0 (0.0%) |
| $5,000 to $9,999 | 0 (0.0%) | 0 (0.0%) |
| $10,000 to $14,999 | 6 (2.6%) | 32 (13.4%) |
| $15,000 to $19,999 | 0 (0.0%) | 0 (0.0%) |
| $20,000 to $24,999 | 1 (0.4%) | 41 (17.2%) |
| $25,000 to $34,999 | 0 (0.0%) | 0 (0.0%) |
| $35,000 to $49,999 | 0 (0.0%) | 0 (0.0%) |
| $50,000 to $74,999 | 127 (55.5%) | 166 (69.5%) |
| $75,000 to $99,999 | 14 (6.1%) | 0 (0.0%) |
| $100,000 to $149,999 | 36 (15.7%) | 0 (0.0%) |
| $150,000 or more | 31 (13.5%) | 0 (0.0%) |
| Total | 229 (100.0%) | 239 (100.0%) |
Monthly Housing Cost Tiers in Somers
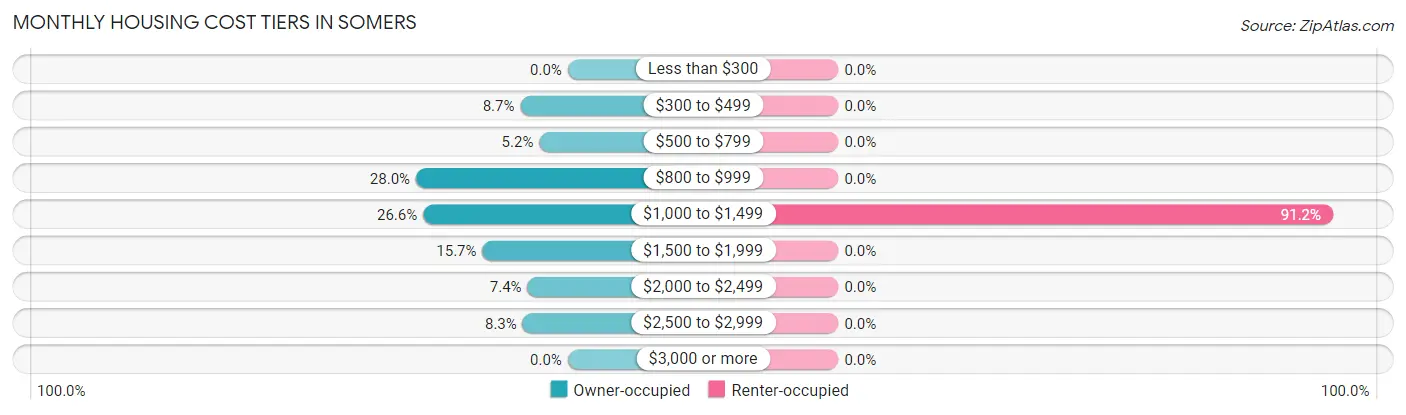
| Monthly Cost | Owner-occupied | Renter-occupied |
| Less than $300 | 0 (0.0%) | 0 (0.0%) |
| $300 to $499 | 20 (8.7%) | 0 (0.0%) |
| $500 to $799 | 12 (5.2%) | 0 (0.0%) |
| $800 to $999 | 64 (28.0%) | 0 (0.0%) |
| $1,000 to $1,499 | 61 (26.6%) | 218 (91.2%) |
| $1,500 to $1,999 | 36 (15.7%) | 0 (0.0%) |
| $2,000 to $2,499 | 17 (7.4%) | 0 (0.0%) |
| $2,500 to $2,999 | 19 (8.3%) | 0 (0.0%) |
| $3,000 or more | 0 (0.0%) | 0 (0.0%) |
| Total | 229 (100.0%) | 239 (100.0%) |
Physical Housing Characteristics in Somers
Housing Structures in Somers
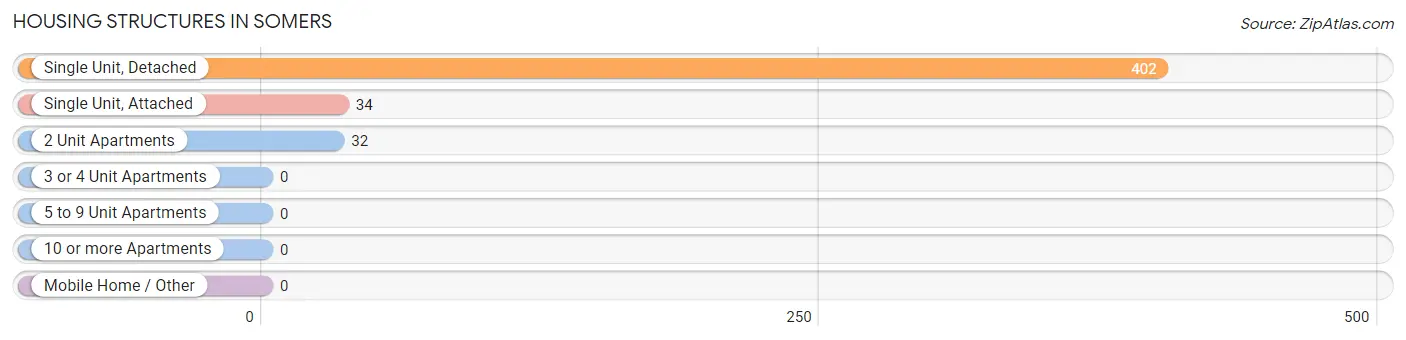
| Structure Type | # Housing Units | % Housing Units |
| Single Unit, Detached | 402 | 85.9% |
| Single Unit, Attached | 34 | 7.3% |
| 2 Unit Apartments | 32 | 6.8% |
| 3 or 4 Unit Apartments | 0 | 0.0% |
| 5 to 9 Unit Apartments | 0 | 0.0% |
| 10 or more Apartments | 0 | 0.0% |
| Mobile Home / Other | 0 | 0.0% |
| Total | 468 | 100.0% |
Housing Structures by Occupancy in Somers
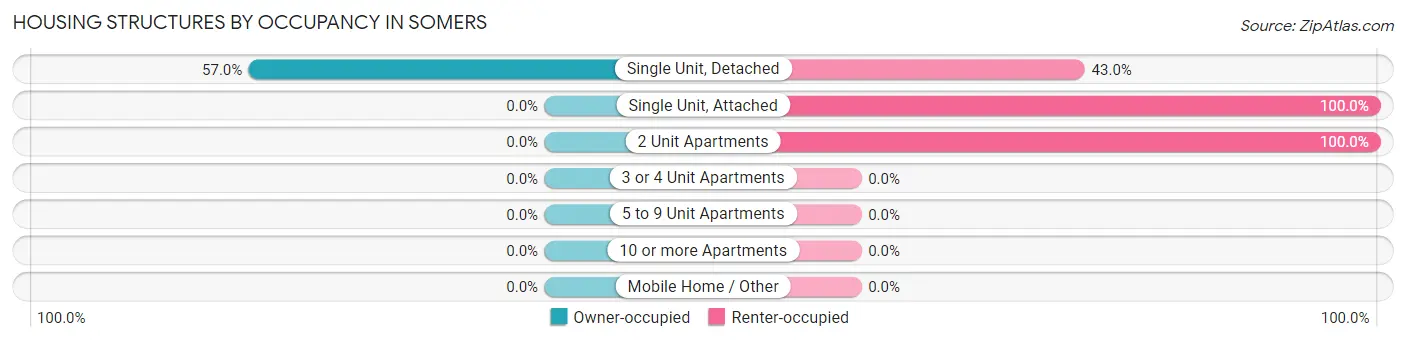
| Structure Type | Owner-occupied | Renter-occupied |
| Single Unit, Detached | 229 (57.0%) | 173 (43.0%) |
| Single Unit, Attached | 0 (0.0%) | 34 (100.0%) |
| 2 Unit Apartments | 0 (0.0%) | 32 (100.0%) |
| 3 or 4 Unit Apartments | 0 (0.0%) | 0 (0.0%) |
| 5 to 9 Unit Apartments | 0 (0.0%) | 0 (0.0%) |
| 10 or more Apartments | 0 (0.0%) | 0 (0.0%) |
| Mobile Home / Other | 0 (0.0%) | 0 (0.0%) |
| Total | 229 (48.9%) | 239 (51.1%) |
Housing Structures by Number of Rooms in Somers
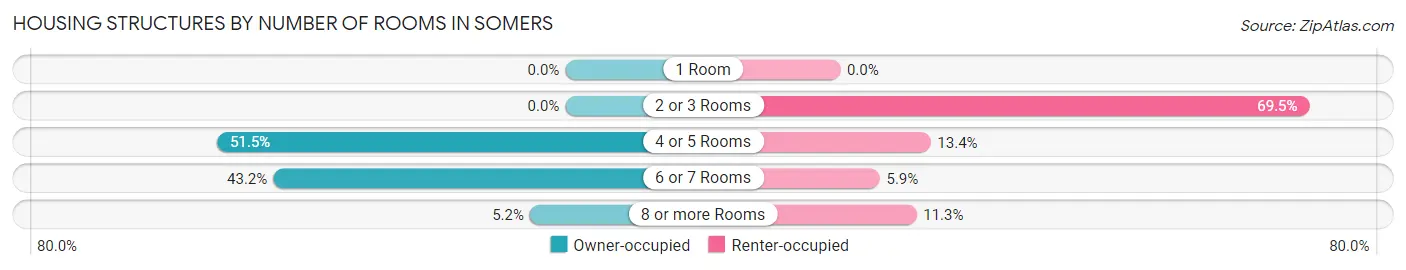
| Number of Rooms | Owner-occupied | Renter-occupied |
| 1 Room | 0 (0.0%) | 0 (0.0%) |
| 2 or 3 Rooms | 0 (0.0%) | 166 (69.5%) |
| 4 or 5 Rooms | 118 (51.5%) | 32 (13.4%) |
| 6 or 7 Rooms | 99 (43.2%) | 14 (5.9%) |
| 8 or more Rooms | 12 (5.2%) | 27 (11.3%) |
| Total | 229 (100.0%) | 239 (100.0%) |
Housing Structure by Heating Type in Somers
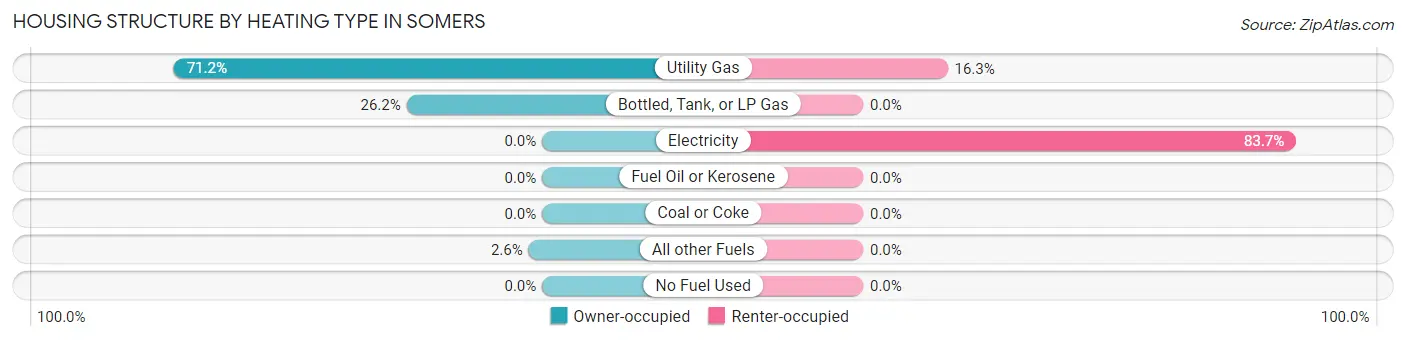
| Heating Type | Owner-occupied | Renter-occupied |
| Utility Gas | 163 (71.2%) | 39 (16.3%) |
| Bottled, Tank, or LP Gas | 60 (26.2%) | 0 (0.0%) |
| Electricity | 0 (0.0%) | 200 (83.7%) |
| Fuel Oil or Kerosene | 0 (0.0%) | 0 (0.0%) |
| Coal or Coke | 0 (0.0%) | 0 (0.0%) |
| All other Fuels | 6 (2.6%) | 0 (0.0%) |
| No Fuel Used | 0 (0.0%) | 0 (0.0%) |
| Total | 229 (100.0%) | 239 (100.0%) |
Household Vehicle Usage in Somers
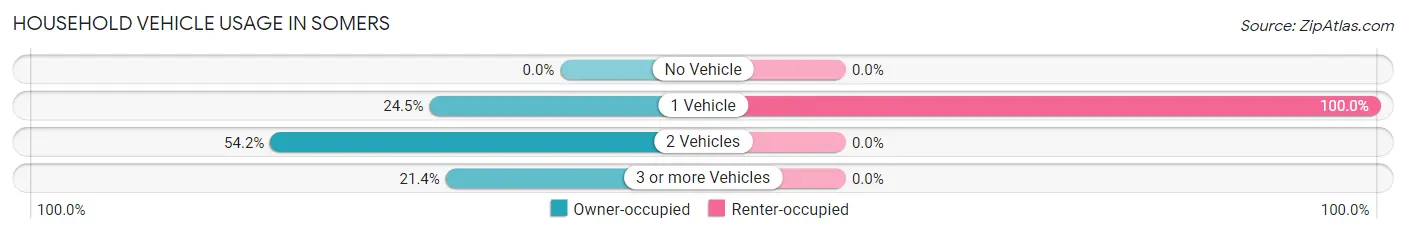
| Vehicles per Household | Owner-occupied | Renter-occupied |
| No Vehicle | 0 (0.0%) | 0 (0.0%) |
| 1 Vehicle | 56 (24.4%) | 239 (100.0%) |
| 2 Vehicles | 124 (54.1%) | 0 (0.0%) |
| 3 or more Vehicles | 49 (21.4%) | 0 (0.0%) |
| Total | 229 (100.0%) | 239 (100.0%) |
Real Estate & Mortgages in Somers
Real Estate and Mortgage Overview in Somers
| Characteristic | Without Mortgage | With Mortgage |
| Housing Units | 144 | 85 |
| Median Property Value | $709,700 | $445,800 |
| Median Household Income | $58,827 | $19 |
| Monthly Housing Costs | $880 | $0 |
| Real Estate Taxes | $5,893 | $0 |
Property Value by Mortgage Status in Somers
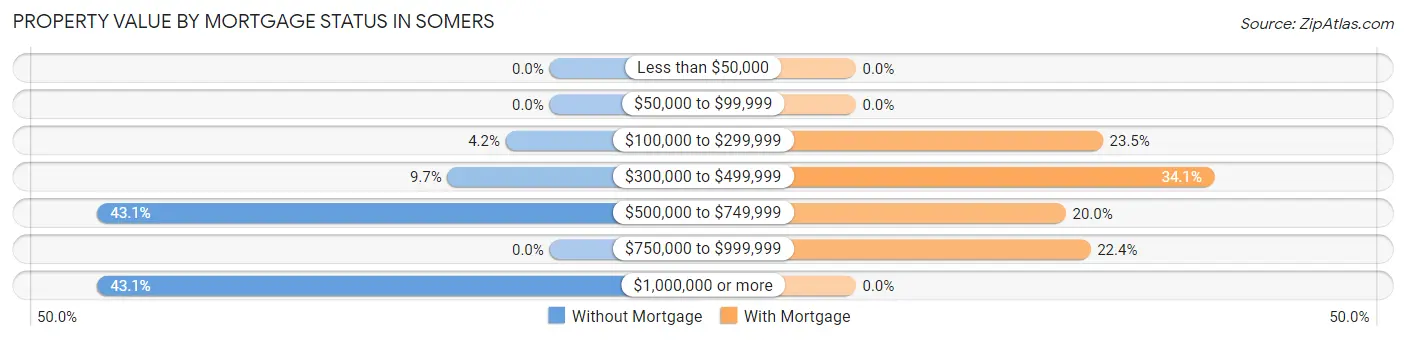
| Property Value | Without Mortgage | With Mortgage |
| Less than $50,000 | 0 (0.0%) | 0 (0.0%) |
| $50,000 to $99,999 | 0 (0.0%) | 0 (0.0%) |
| $100,000 to $299,999 | 6 (4.2%) | 20 (23.5%) |
| $300,000 to $499,999 | 14 (9.7%) | 29 (34.1%) |
| $500,000 to $749,999 | 62 (43.1%) | 17 (20.0%) |
| $750,000 to $999,999 | 0 (0.0%) | 19 (22.4%) |
| $1,000,000 or more | 62 (43.1%) | 0 (0.0%) |
| Total | 144 (100.0%) | 85 (100.0%) |
Household Income by Mortgage Status in Somers
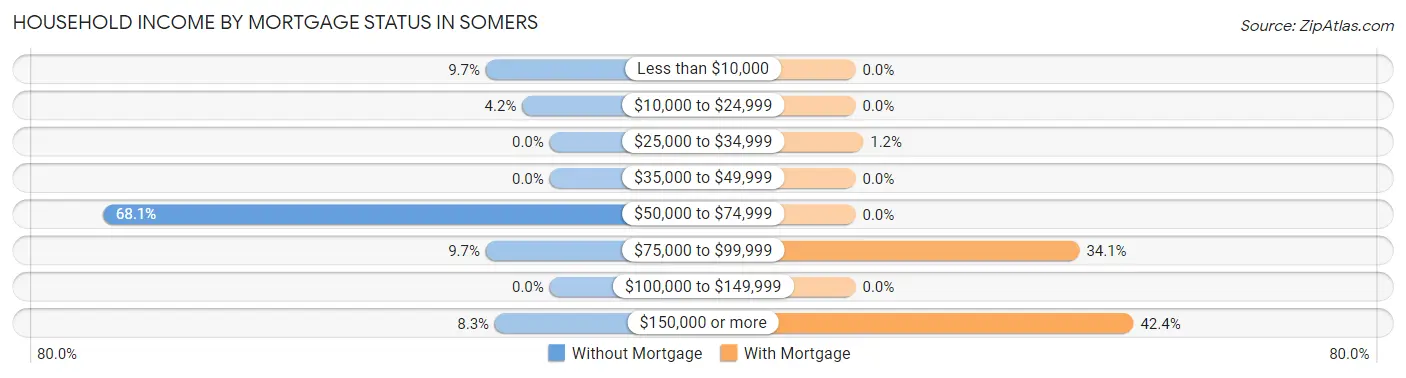
| Household Income | Without Mortgage | With Mortgage |
| Less than $10,000 | 14 (9.7%) | 0 (0.0%) |
| $10,000 to $24,999 | 6 (4.2%) | 0 (0.0%) |
| $25,000 to $34,999 | 0 (0.0%) | 1 (1.2%) |
| $35,000 to $49,999 | 0 (0.0%) | 0 (0.0%) |
| $50,000 to $74,999 | 98 (68.1%) | 0 (0.0%) |
| $75,000 to $99,999 | 14 (9.7%) | 29 (34.1%) |
| $100,000 to $149,999 | 0 (0.0%) | 0 (0.0%) |
| $150,000 or more | 12 (8.3%) | 36 (42.3%) |
| Total | 144 (100.0%) | 85 (100.0%) |
Property Value to Household Income Ratio in Somers
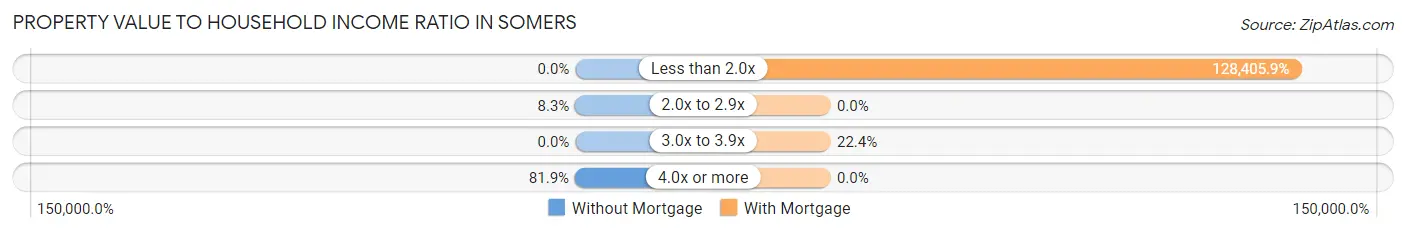
| Value-to-Income Ratio | Without Mortgage | With Mortgage |
| Less than 2.0x | 0 (0.0%) | 109,145 (128,405.9%) |
| 2.0x to 2.9x | 12 (8.3%) | 0 (0.0%) |
| 3.0x to 3.9x | 0 (0.0%) | 19 (22.4%) |
| 4.0x or more | 118 (81.9%) | 0 (0.0%) |
| Total | 144 (100.0%) | 85 (100.0%) |
Real Estate Taxes by Mortgage Status in Somers
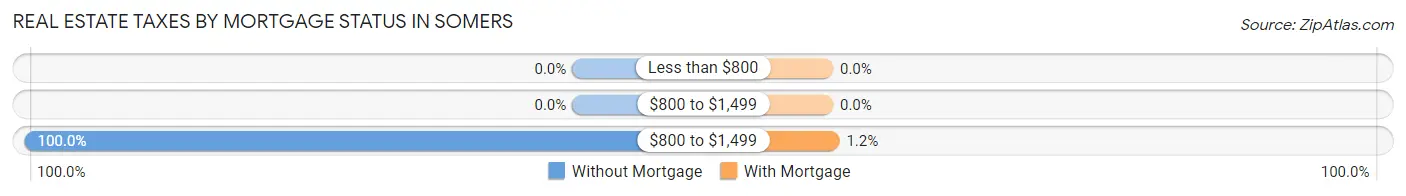
| Property Taxes | Without Mortgage | With Mortgage |
| Less than $800 | 0 (0.0%) | 0 (0.0%) |
| $800 to $1,499 | 0 (0.0%) | 0 (0.0%) |
| $800 to $1,499 | 144 (100.0%) | 1 (1.2%) |
| Total | 144 (100.0%) | 85 (100.0%) |
Health & Disability in Somers
Health Insurance Coverage by Age in Somers
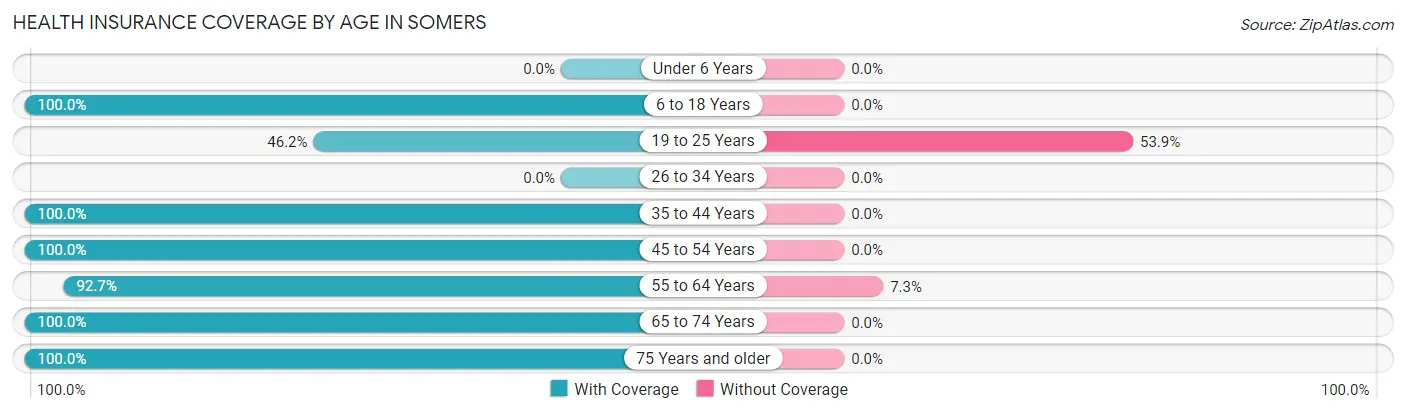
| Age Bracket | With Coverage | Without Coverage |
| Under 6 Years | 0 (0.0%) | 0 (0.0%) |
| 6 to 18 Years | 56 (100.0%) | 0 (0.0%) |
| 19 to 25 Years | 30 (46.2%) | 35 (53.8%) |
| 26 to 34 Years | 0 (0.0%) | 0 (0.0%) |
| 35 to 44 Years | 71 (100.0%) | 0 (0.0%) |
| 45 to 54 Years | 110 (100.0%) | 0 (0.0%) |
| 55 to 64 Years | 409 (92.7%) | 32 (7.3%) |
| 65 to 74 Years | 252 (100.0%) | 0 (0.0%) |
| 75 Years and older | 32 (100.0%) | 0 (0.0%) |
| Total | 960 (93.5%) | 67 (6.5%) |
Health Insurance Coverage by Citizenship Status in Somers
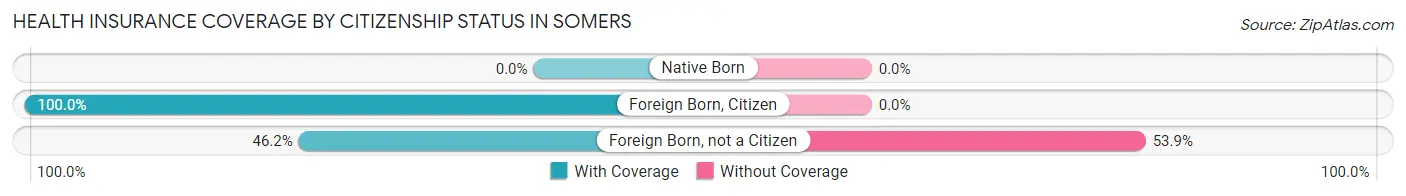
| Citizenship Status | With Coverage | Without Coverage |
| Native Born | 0 (0.0%) | 0 (0.0%) |
| Foreign Born, Citizen | 56 (100.0%) | 0 (0.0%) |
| Foreign Born, not a Citizen | 30 (46.2%) | 35 (53.8%) |
Health Insurance Coverage by Household Income in Somers
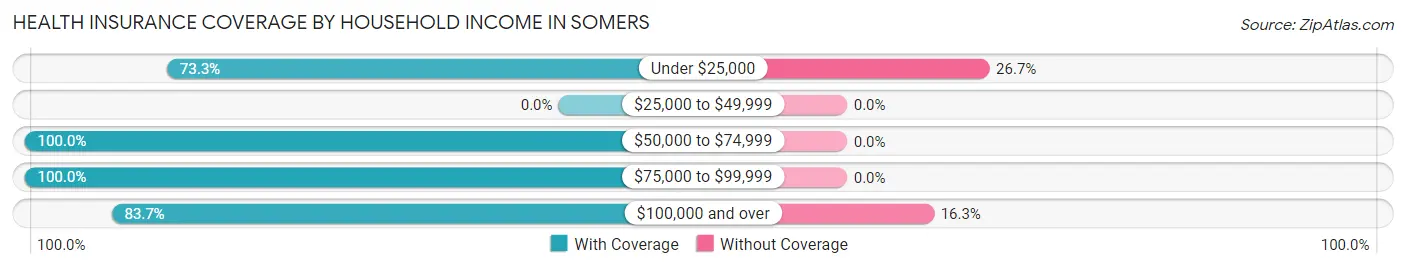
| Household Income | With Coverage | Without Coverage |
| Under $25,000 | 88 (73.3%) | 32 (26.7%) |
| $25,000 to $49,999 | 0 (0.0%) | 0 (0.0%) |
| $50,000 to $74,999 | 678 (100.0%) | 0 (0.0%) |
| $75,000 to $99,999 | 14 (100.0%) | 0 (0.0%) |
| $100,000 and over | 180 (83.7%) | 35 (16.3%) |
Public vs Private Health Insurance Coverage by Age in Somers
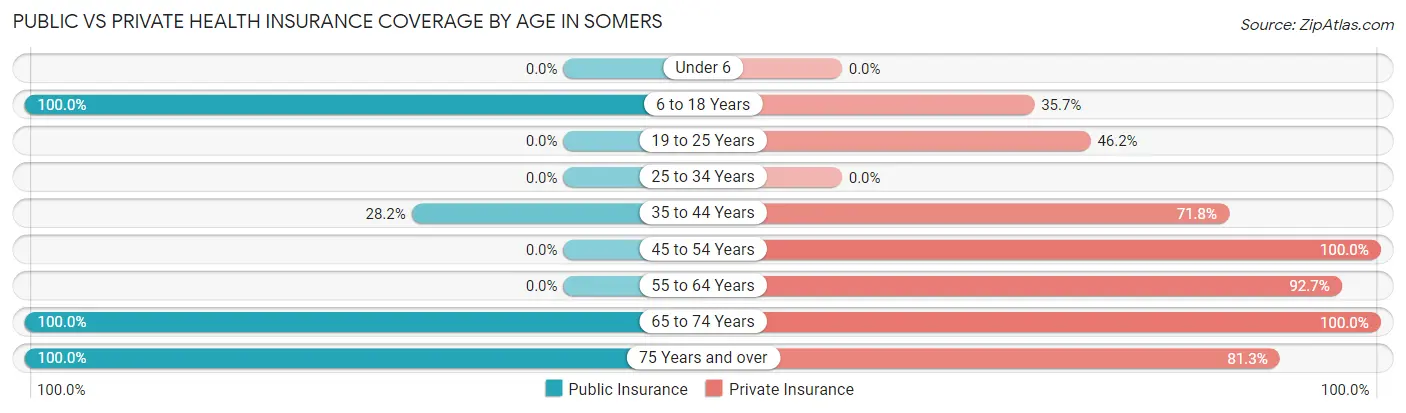
| Age Bracket | Public Insurance | Private Insurance |
| Under 6 | 0 (0.0%) | 0 (0.0%) |
| 6 to 18 Years | 56 (100.0%) | 20 (35.7%) |
| 19 to 25 Years | 0 (0.0%) | 30 (46.2%) |
| 25 to 34 Years | 0 (0.0%) | 0 (0.0%) |
| 35 to 44 Years | 20 (28.2%) | 51 (71.8%) |
| 45 to 54 Years | 0 (0.0%) | 110 (100.0%) |
| 55 to 64 Years | 0 (0.0%) | 409 (92.7%) |
| 65 to 74 Years | 252 (100.0%) | 252 (100.0%) |
| 75 Years and over | 32 (100.0%) | 26 (81.2%) |
| Total | 360 (35.0%) | 898 (87.4%) |
Disability Status by Sex by Age in Somers
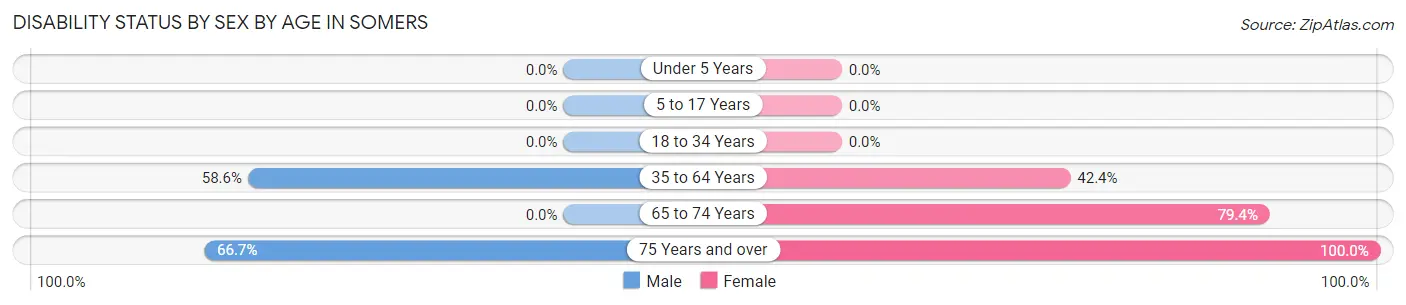
| Age Bracket | Male | Female |
| Under 5 Years | 0 (0.0%) | 0 (0.0%) |
| 5 to 17 Years | 0 (0.0%) | 0 (0.0%) |
| 18 to 34 Years | 0 (0.0%) | 0 (0.0%) |
| 35 to 64 Years | 229 (58.6%) | 98 (42.4%) |
| 65 to 74 Years | 0 (0.0%) | 166 (79.4%) |
| 75 Years and over | 14 (66.7%) | 11 (100.0%) |
Disability Class by Sex by Age in Somers
Disability Class: Hearing Difficulty
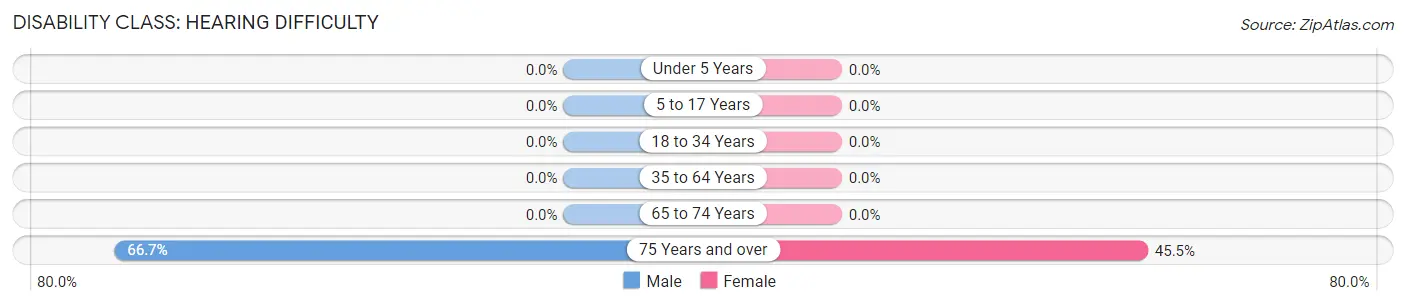
| Age Bracket | Male | Female |
| Under 5 Years | 0 (0.0%) | 0 (0.0%) |
| 5 to 17 Years | 0 (0.0%) | 0 (0.0%) |
| 18 to 34 Years | 0 (0.0%) | 0 (0.0%) |
| 35 to 64 Years | 0 (0.0%) | 0 (0.0%) |
| 65 to 74 Years | 0 (0.0%) | 0 (0.0%) |
| 75 Years and over | 14 (66.7%) | 5 (45.5%) |
Disability Class: Vision Difficulty
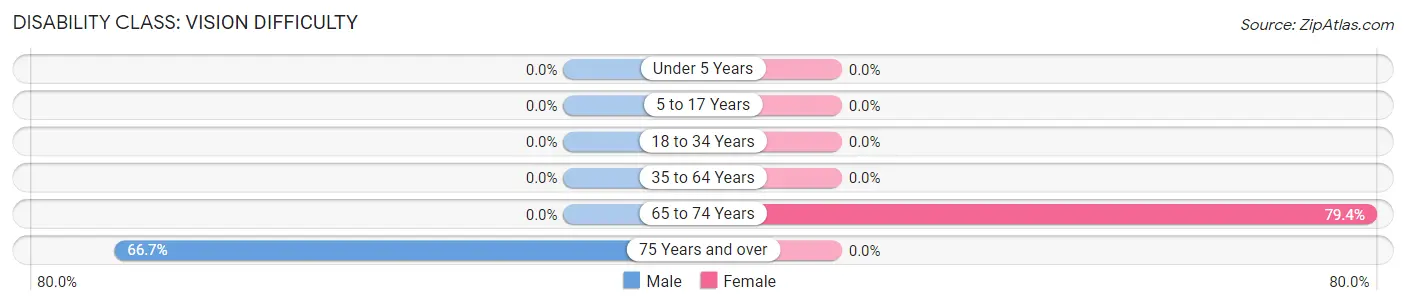
| Age Bracket | Male | Female |
| Under 5 Years | 0 (0.0%) | 0 (0.0%) |
| 5 to 17 Years | 0 (0.0%) | 0 (0.0%) |
| 18 to 34 Years | 0 (0.0%) | 0 (0.0%) |
| 35 to 64 Years | 0 (0.0%) | 0 (0.0%) |
| 65 to 74 Years | 0 (0.0%) | 166 (79.4%) |
| 75 Years and over | 14 (66.7%) | 0 (0.0%) |
Disability Class: Cognitive Difficulty
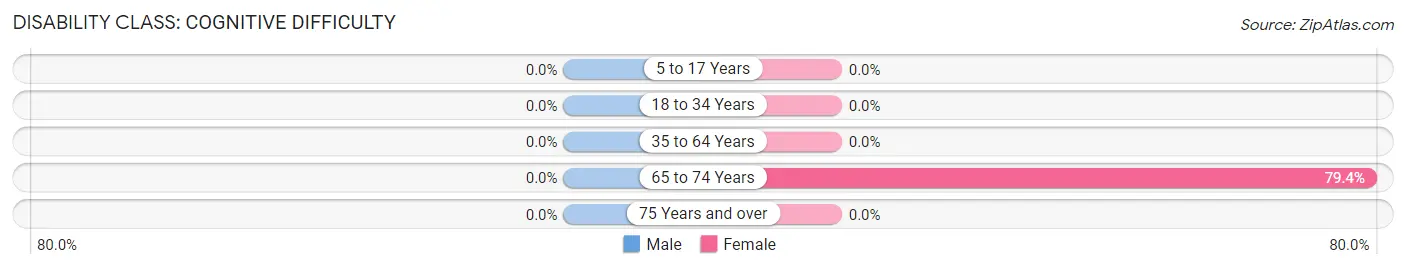
| Age Bracket | Male | Female |
| 5 to 17 Years | 0 (0.0%) | 0 (0.0%) |
| 18 to 34 Years | 0 (0.0%) | 0 (0.0%) |
| 35 to 64 Years | 0 (0.0%) | 0 (0.0%) |
| 65 to 74 Years | 0 (0.0%) | 166 (79.4%) |
| 75 Years and over | 0 (0.0%) | 0 (0.0%) |
Disability Class: Ambulatory Difficulty
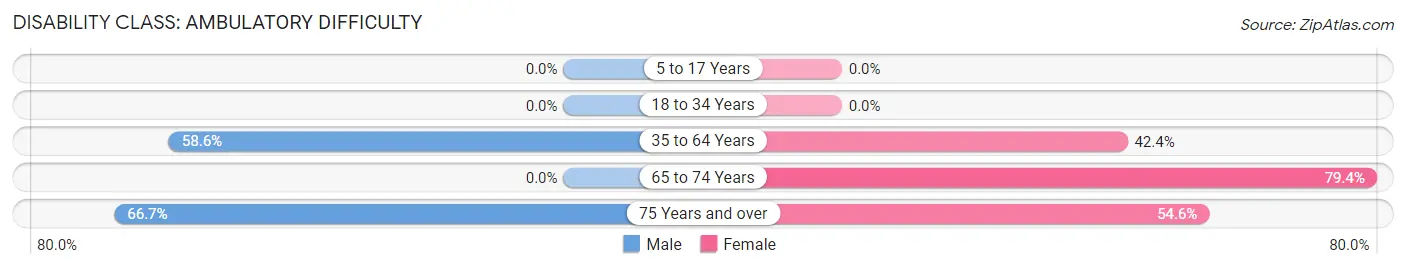
| Age Bracket | Male | Female |
| 5 to 17 Years | 0 (0.0%) | 0 (0.0%) |
| 18 to 34 Years | 0 (0.0%) | 0 (0.0%) |
| 35 to 64 Years | 229 (58.6%) | 98 (42.4%) |
| 65 to 74 Years | 0 (0.0%) | 166 (79.4%) |
| 75 Years and over | 14 (66.7%) | 6 (54.5%) |
Disability Class: Self-Care Difficulty
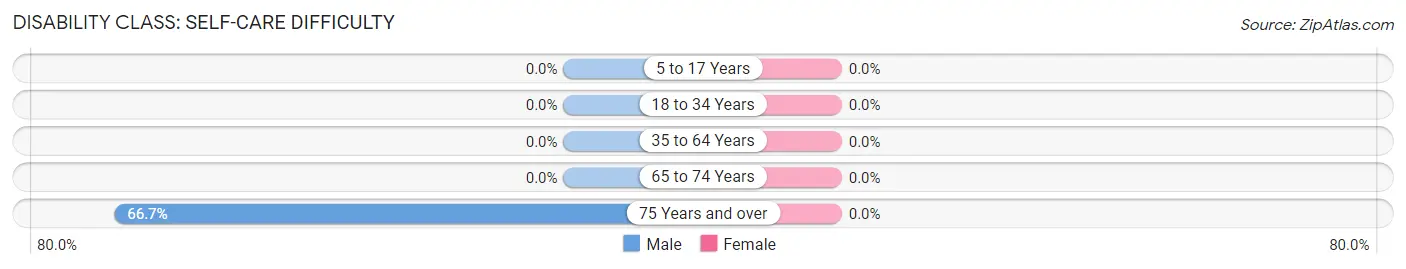
| Age Bracket | Male | Female |
| 5 to 17 Years | 0 (0.0%) | 0 (0.0%) |
| 18 to 34 Years | 0 (0.0%) | 0 (0.0%) |
| 35 to 64 Years | 0 (0.0%) | 0 (0.0%) |
| 65 to 74 Years | 0 (0.0%) | 0 (0.0%) |
| 75 Years and over | 14 (66.7%) | 0 (0.0%) |
Technology Access in Somers
Computing Device Access in Somers
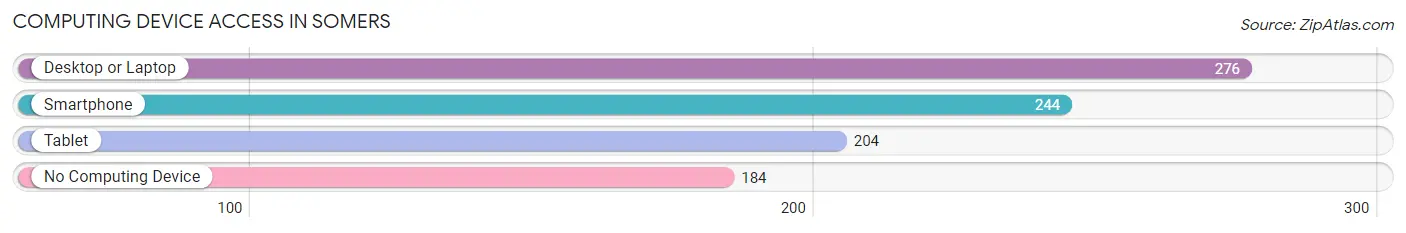
| Device Type | # Households | % Households |
| Desktop or Laptop | 276 | 59.0% |
| Smartphone | 244 | 52.1% |
| Tablet | 204 | 43.6% |
| No Computing Device | 184 | 39.3% |
| Total | 468 | 100.0% |
Internet Access in Somers
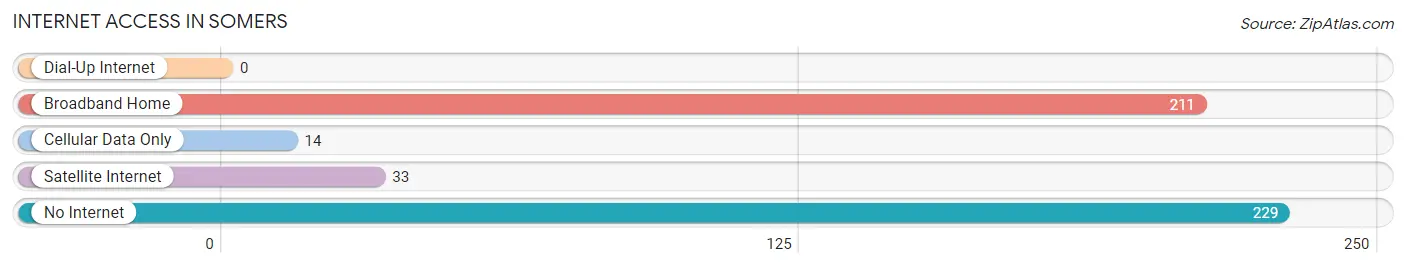
| Internet Type | # Households | % Households |
| Dial-Up Internet | 0 | 0.0% |
| Broadband Home | 211 | 45.1% |
| Cellular Data Only | 14 | 3.0% |
| Satellite Internet | 33 | 7.0% |
| No Internet | 229 | 48.9% |
| Total | 468 | 100.0% |
Somers Summary
Somers, Montana is a small town located in Flathead County, Montana. It is situated on the western shore of Flathead Lake, the largest natural freshwater lake in the western United States. The town has a population of approximately 1,500 people and is located about 20 miles north of Kalispell, the county seat.
History
Somers was founded in 1891 by a group of homesteaders who were attracted to the area by the abundance of timber and the potential for farming. The town was named after the Somers family, who were among the first settlers. The Somers family built a sawmill and a general store, which served as the town’s first businesses.
In the early 1900s, Somers began to grow as a logging and farming community. The town was home to several sawmills, a flour mill, a creamery, and a cannery. The Somers Canning Company was the largest employer in the area, and it produced canned fruits and vegetables for the local market.
In the 1920s, Somers began to attract tourists who were drawn to the area’s natural beauty. The town was home to several resorts, including the Somers Beach Resort, which was a popular destination for families.
Geography
Somers is located in the Flathead Valley, which is part of the Rocky Mountain Front. The town is situated on the western shore of Flathead Lake, which is the largest natural freshwater lake in the western United States. The lake is surrounded by the Mission Mountains to the east and the Swan Mountains to the west.
The town is located about 20 miles north of Kalispell, the county seat. The nearest major city is Missoula, which is about 90 miles to the south.
Economy
Somers’ economy is largely based on tourism and agriculture. The town is home to several resorts, including the Somers Beach Resort, which is a popular destination for families. The town also has several wineries, which attract visitors from all over the region.
Agriculture is also an important part of the local economy. The area is home to several farms, which produce a variety of crops, including wheat, barley, hay, and potatoes.
Demographics
As of the 2010 census, the population of Somers was 1,500. The town is predominantly white, with about 95% of the population identifying as Caucasian. The median household income is $45,000, and the median age is 44.
Conclusion
Somers, Montana is a small town located in Flathead County, Montana. It is situated on the western shore of Flathead Lake, the largest natural freshwater lake in the western United States. The town has a population of approximately 1,500 people and is located about 20 miles north of Kalispell, the county seat. The town’s economy is largely based on tourism and agriculture, and it is home to several resorts and wineries. The population is predominantly white, with a median household income of $45,000 and a median age of 44.
Common Questions
What is Per Capita Income in Somers?
Per Capita income in Somers is $32,038.
What is the Median Family Income in Somers?
Median Family Income in Somers is $54,712.
What is the Median Household income in Somers?
Median Household Income in Somers is $54,466.
What is Inequality or Gini Index in Somers?
Inequality or Gini Index in Somers is 0.33.
What is the Total Population of Somers?
Total Population of Somers is 1,037.
What is the Total Male Population of Somers?
Total Male Population of Somers is 566.
What is the Total Female Population of Somers?
Total Female Population of Somers is 471.
What is the Ratio of Males per 100 Females in Somers?
There are 120.17 Males per 100 Females in Somers.
What is the Ratio of Females per 100 Males in Somers?
There are 83.22 Females per 100 Males in Somers.
What is the Median Population Age in Somers?
Median Population Age in Somers is 64.2 Years.
What is the Average Family Size in Somers
Average Family Size in Somers is 2.5 People.
What is the Average Household Size in Somers
Average Household Size in Somers is 2.2 People.
How Large is the Labor Force in Somers?
There are 458 People in the Labor Forcein in Somers.
What is the Percentage of People in the Labor Force in Somers?
45.3% of People are in the Labor Force in Somers.