Mingoville, PA Map & Demographics
Mingoville Map
Mingoville Overview
$32,978
PER CAPITA INCOME
$89,438
AVG FAMILY INCOME
$89,438
AVG HOUSEHOLD INCOME
0.16
INEQUALITY / GINI INDEX
214
TOTAL POPULATION
80
MALE POPULATION
134
FEMALE POPULATION
59.70
MALES / 100 FEMALES
167.50
FEMALES / 100 MALES
32.1
MEDIAN AGE
3.4
AVG FAMILY SIZE
3.4
AVG HOUSEHOLD SIZE
69
LABOR FORCE [ PEOPLE ]
55.2%
PERCENT IN LABOR FORCE
Mingoville Zip Codes
Mingoville Area Codes
Income in Mingoville
Income Overview in Mingoville
Per Capita Income in Mingoville is $32,978, while median incomes of families and households are $89,438 and $89,438 respectively.
| Characteristic | Number | Measure |
| Per Capita Income | 214 | $32,978 |
| Median Family Income | 63 | $89,438 |
| Mean Family Income | 63 | $116,108 |
| Median Household Income | 63 | $89,438 |
| Mean Household Income | 63 | $116,108 |
| Income Deficit | 63 | $0 |
| Wage / Income Gap (%) | 214 | 0.00% |
| Wage / Income Gap ($) | 214 | 100.00¢ per $1 |
| Gini / Inequality Index | 214 | 0.16 |
Earnings by Sex in Mingoville
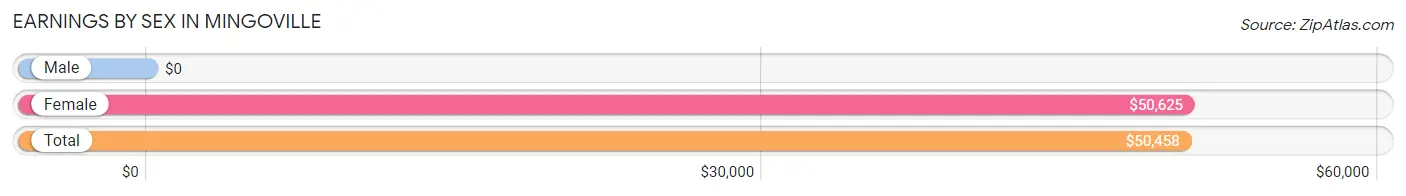
| Sex | Number | Average Earnings |
| Male | 36 (44.4%) | $0 |
| Female | 45 (55.6%) | $50,625 |
| Total | 81 (100.0%) | $50,458 |
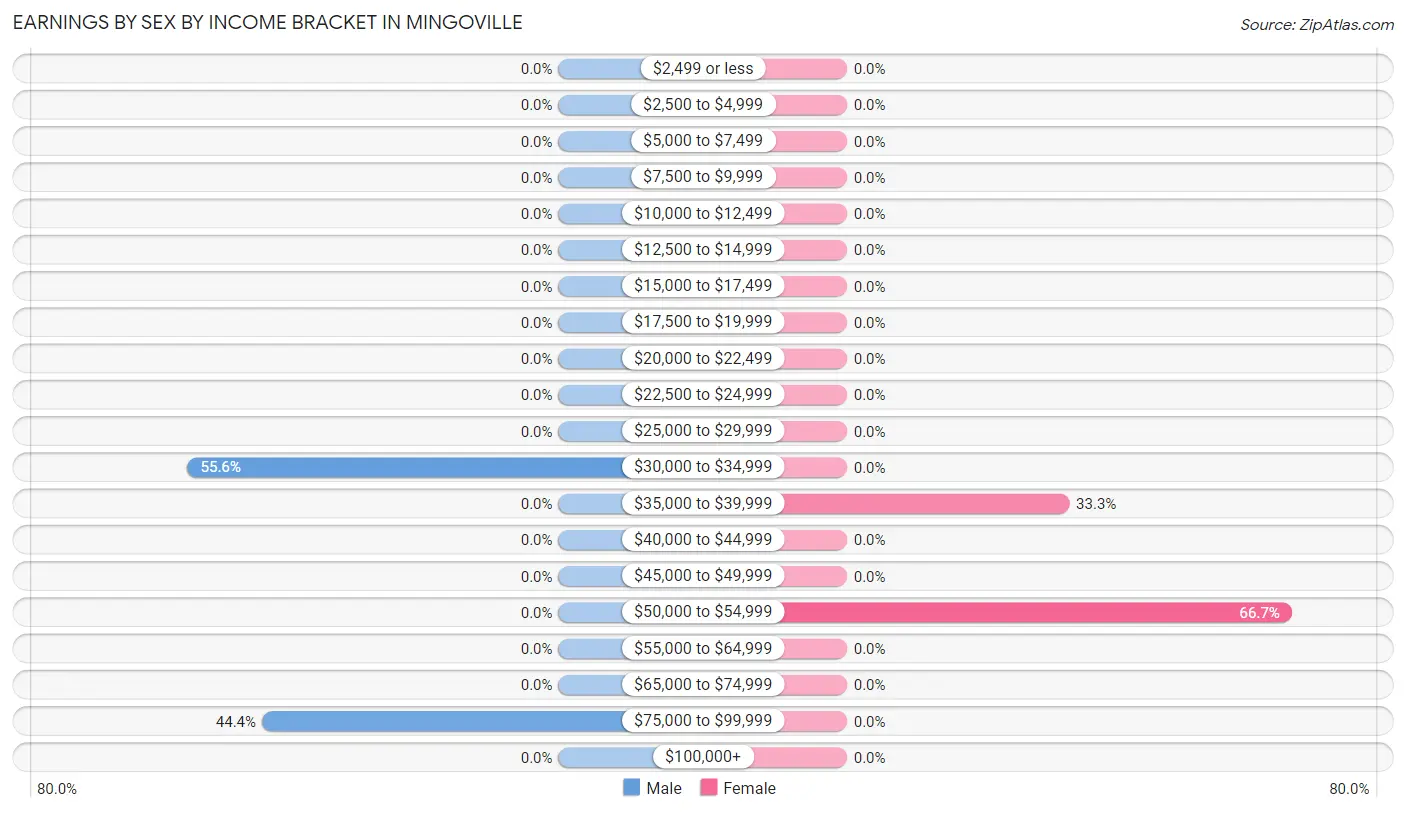
Earnings by Sex by Income Bracket in Mingoville
The most common earnings brackets in Mingoville are $30,000 to $34,999 for men (20 | 55.6%) and $50,000 to $54,999 for women (30 | 66.7%).
| Income | Male | Female |
| $2,499 or less | 0 (0.0%) | 0 (0.0%) |
| $2,500 to $4,999 | 0 (0.0%) | 0 (0.0%) |
| $5,000 to $7,499 | 0 (0.0%) | 0 (0.0%) |
| $7,500 to $9,999 | 0 (0.0%) | 0 (0.0%) |
| $10,000 to $12,499 | 0 (0.0%) | 0 (0.0%) |
| $12,500 to $14,999 | 0 (0.0%) | 0 (0.0%) |
| $15,000 to $17,499 | 0 (0.0%) | 0 (0.0%) |
| $17,500 to $19,999 | 0 (0.0%) | 0 (0.0%) |
| $20,000 to $22,499 | 0 (0.0%) | 0 (0.0%) |
| $22,500 to $24,999 | 0 (0.0%) | 0 (0.0%) |
| $25,000 to $29,999 | 0 (0.0%) | 0 (0.0%) |
| $30,000 to $34,999 | 20 (55.6%) | 0 (0.0%) |
| $35,000 to $39,999 | 0 (0.0%) | 15 (33.3%) |
| $40,000 to $44,999 | 0 (0.0%) | 0 (0.0%) |
| $45,000 to $49,999 | 0 (0.0%) | 0 (0.0%) |
| $50,000 to $54,999 | 0 (0.0%) | 30 (66.7%) |
| $55,000 to $64,999 | 0 (0.0%) | 0 (0.0%) |
| $65,000 to $74,999 | 0 (0.0%) | 0 (0.0%) |
| $75,000 to $99,999 | 16 (44.4%) | 0 (0.0%) |
| $100,000+ | 0 (0.0%) | 0 (0.0%) |
| Total | 36 (100.0%) | 45 (100.0%) |
Earnings by Sex by Educational Attainment in Mingoville
| Educational Attainment | Male Income | Female Income |
| Less than High School | - | - |
| High School Diploma | - | - |
| College or Associate's Degree | - | - |
| Bachelor's Degree | - | - |
| Graduate Degree | - | - |
| Total | - | - |
Family Income in Mingoville
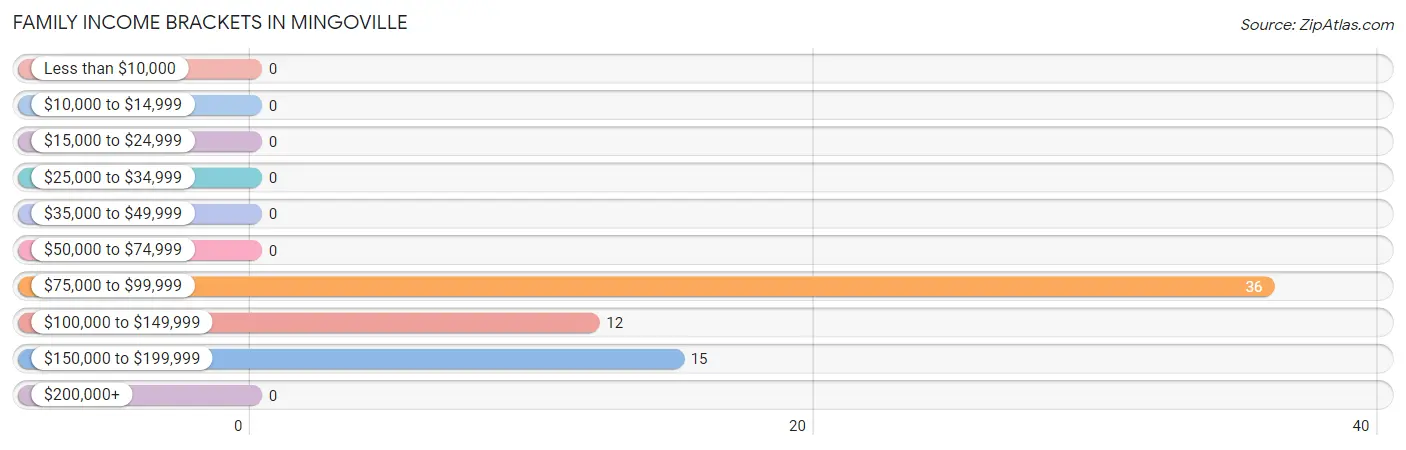
Family Income Brackets in Mingoville
According to the Mingoville family income data, there are 36 families falling into the $75,000 to $99,999 income range, which is the most common income bracket and makes up 57.1% of all families.
| Income Bracket | # Families | % Families |
| Less than $10,000 | 0 | 0.0% |
| $10,000 to $14,999 | 0 | 0.0% |
| $15,000 to $24,999 | 0 | 0.0% |
| $25,000 to $34,999 | 0 | 0.0% |
| $35,000 to $49,999 | 0 | 0.0% |
| $50,000 to $74,999 | 0 | 0.0% |
| $75,000 to $99,999 | 36 | 57.1% |
| $100,000 to $149,999 | 12 | 19.0% |
| $150,000 to $199,999 | 15 | 23.8% |
| $200,000+ | 0 | 0.0% |
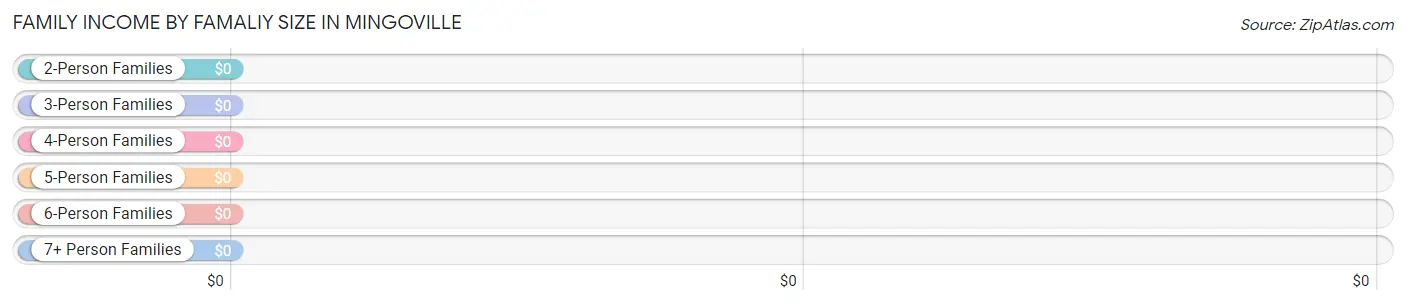
Family Income by Famaliy Size in Mingoville
| Income Bracket | # Families | Median Income |
| 2-Person Families | 27 (42.9%) | $0 |
| 3-Person Families | 0 (0.0%) | $0 |
| 4-Person Families | 20 (31.8%) | $0 |
| 5-Person Families | 16 (25.4%) | $0 |
| 6-Person Families | 0 (0.0%) | $0 |
| 7+ Person Families | 0 (0.0%) | $0 |
| Total | 63 (100.0%) | $89,438 |
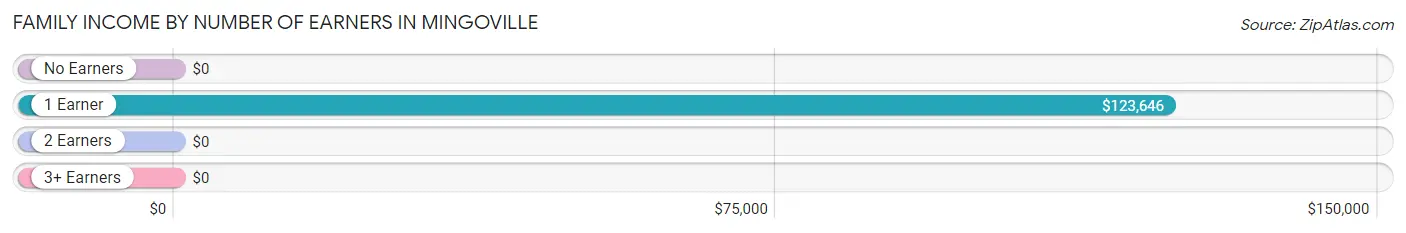
Family Income by Number of Earners in Mingoville
| Number of Earners | # Families | Median Income |
| No Earners | 0 (0.0%) | $0 |
| 1 Earner | 43 (68.2%) | $123,646 |
| 2 Earners | 20 (31.8%) | $0 |
| 3+ Earners | 0 (0.0%) | $0 |
| Total | 63 (100.0%) | $89,438 |
Household Income in Mingoville
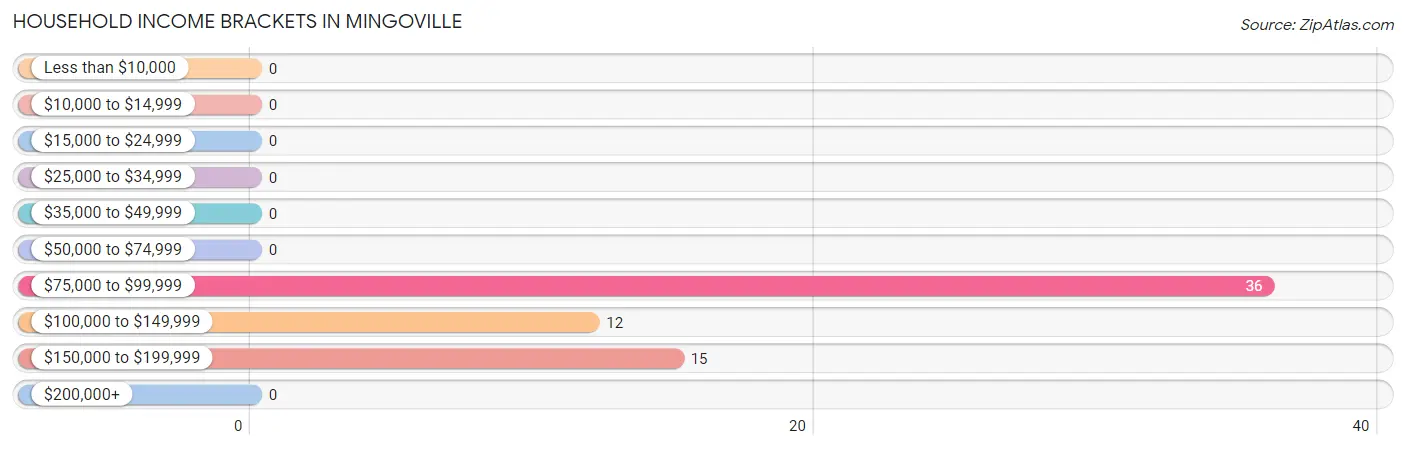
Household Income Brackets in Mingoville
With 36 households falling in the category, the $75,000 to $99,999 income range is the most frequent in Mingoville, accounting for 57.1% of all households.
| Income Bracket | # Households | % Households |
| Less than $10,000 | 0 | 0.0% |
| $10,000 to $14,999 | 0 | 0.0% |
| $15,000 to $24,999 | 0 | 0.0% |
| $25,000 to $34,999 | 0 | 0.0% |
| $35,000 to $49,999 | 0 | 0.0% |
| $50,000 to $74,999 | 0 | 0.0% |
| $75,000 to $99,999 | 36 | 57.1% |
| $100,000 to $149,999 | 12 | 19.0% |
| $150,000 to $199,999 | 15 | 23.8% |
| $200,000+ | 0 | 0.0% |
Household Income by Householder Age in Mingoville
| Income Bracket | # Households | Median Income |
| 15 to 24 Years | 0 (0.0%) | $0 |
| 25 to 44 Years | 36 (57.1%) | $0 |
| 45 to 64 Years | 0 (0.0%) | $0 |
| 65+ Years | 27 (42.9%) | $0 |
| Total | 63 (100.0%) | $89,438 |
Poverty in Mingoville
Income Below Poverty by Sex and Age in Mingoville
| Age Bracket | Male | Female |
| Under 5 Years | 0 (0.0%) | 0 (0.0%) |
| 5 Years | 0 (0.0%) | 0 (0.0%) |
| 6 to 11 Years | 0 (0.0%) | 0 (0.0%) |
| 12 to 14 Years | 0 (0.0%) | 0 (0.0%) |
| 15 Years | 0 (0.0%) | 0 (0.0%) |
| 16 and 17 Years | 0 (0.0%) | 0 (0.0%) |
| 18 to 24 Years | 0 (0.0%) | 0 (0.0%) |
| 25 to 34 Years | 0 (0.0%) | 0 (0.0%) |
| 35 to 44 Years | 0 (0.0%) | 0 (0.0%) |
| 45 to 54 Years | 0 (0.0%) | 0 (0.0%) |
| 55 to 64 Years | 0 (0.0%) | 0 (0.0%) |
| 65 to 74 Years | 0 (0.0%) | 0 (0.0%) |
| 75 Years and over | 0 (0.0%) | 0 (0.0%) |
| Total | 0 (0.0%) | 0 (0.0%) |
Income Above Poverty by Sex and Age in Mingoville
According to the poverty statistics in Mingoville, males aged 6 to 11 years and females aged under 5 years are the age groups that are most secure financially, with 100.0% of males and 100.0% of females in these age groups living above the poverty line.
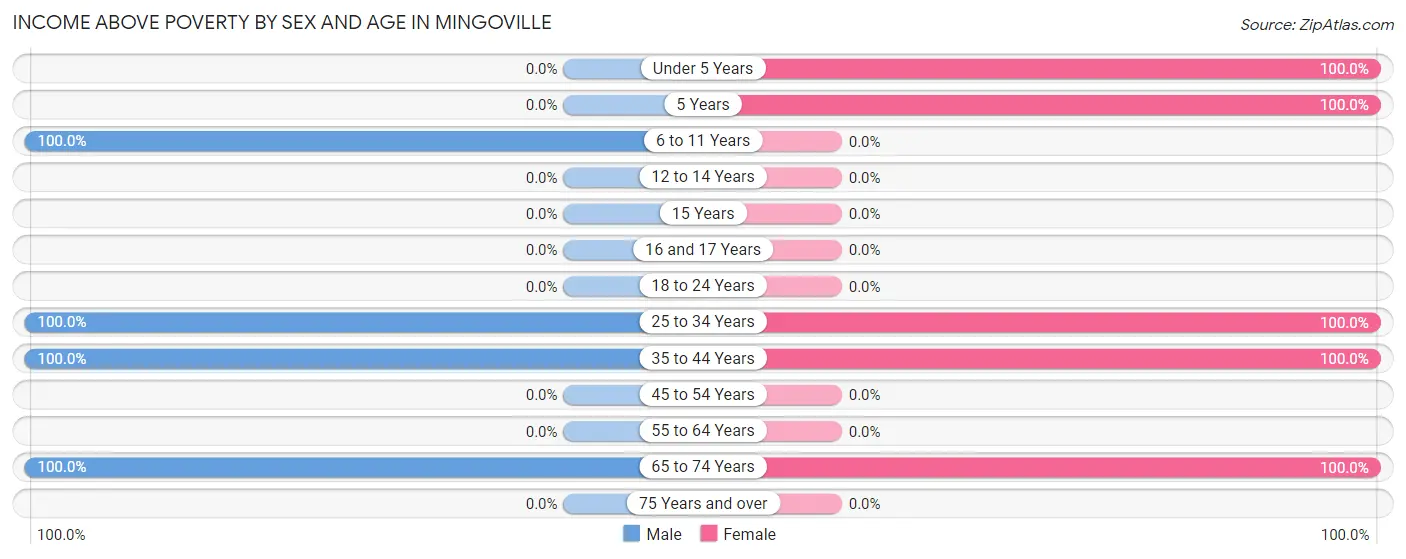
| Age Bracket | Male | Female |
| Under 5 Years | 0 (0.0%) | 53 (100.0%) |
| 5 Years | 0 (0.0%) | 17 (100.0%) |
| 6 to 11 Years | 19 (100.0%) | 0 (0.0%) |
| 12 to 14 Years | 0 (0.0%) | 0 (0.0%) |
| 15 Years | 0 (0.0%) | 0 (0.0%) |
| 16 and 17 Years | 0 (0.0%) | 0 (0.0%) |
| 18 to 24 Years | 0 (0.0%) | 0 (0.0%) |
| 25 to 34 Years | 16 (100.0%) | 19 (100.0%) |
| 35 to 44 Years | 20 (100.0%) | 18 (100.0%) |
| 45 to 54 Years | 0 (0.0%) | 0 (0.0%) |
| 55 to 64 Years | 0 (0.0%) | 0 (0.0%) |
| 65 to 74 Years | 25 (100.0%) | 27 (100.0%) |
| 75 Years and over | 0 (0.0%) | 0 (0.0%) |
| Total | 80 (100.0%) | 134 (100.0%) |
Income Below Poverty Among Married-Couple Families in Mingoville
| Children | Above Poverty | Below Poverty |
| No Children | 27 (100.0%) | 0 (0.0%) |
| 1 or 2 Children | 20 (100.0%) | 0 (0.0%) |
| 3 or 4 Children | 16 (100.0%) | 0 (0.0%) |
| 5 or more Children | 0 (0.0%) | 0 (0.0%) |
| Total | 63 (100.0%) | 0 (0.0%) |
Income Below Poverty Among Single-Parent Households in Mingoville
| Children | Single Father | Single Mother |
| No Children | 0 (0.0%) | 0 (0.0%) |
| 1 or 2 Children | 0 (0.0%) | 0 (0.0%) |
| 3 or 4 Children | 0 (0.0%) | 0 (0.0%) |
| 5 or more Children | 0 (0.0%) | 0 (0.0%) |
| Total | 0 (0.0%) | 0 (0.0%) |
Income Below Poverty Among Married-Couple vs Single-Parent Households in Mingoville
| Children | Married-Couple Families | Single-Parent Households |
| No Children | 0 (0.0%) | 0 (0.0%) |
| 1 or 2 Children | 0 (0.0%) | 0 (0.0%) |
| 3 or 4 Children | 0 (0.0%) | 0 (0.0%) |
| 5 or more Children | 0 (0.0%) | 0 (0.0%) |
| Total | 0 (0.0%) | 0 (0.0%) |
Race in Mingoville
The most populous races in Mingoville are , and White / Caucasian (214 | 100.0%).
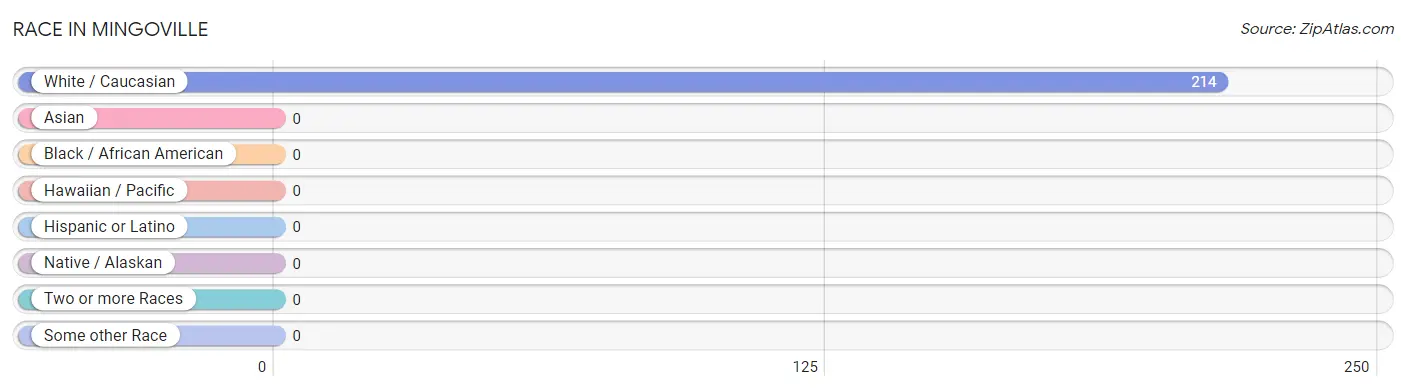
| Race | # Population | % Population |
| Asian | 0 | 0.0% |
| Black / African American | 0 | 0.0% |
| Hawaiian / Pacific | 0 | 0.0% |
| Hispanic or Latino | 0 | 0.0% |
| Native / Alaskan | 0 | 0.0% |
| White / Caucasian | 214 | 100.0% |
| Two or more Races | 0 | 0.0% |
| Some other Race | 0 | 0.0% |
| Total | 214 | 100.0% |
Ancestry in Mingoville
The most populous ancestries reported in Mingoville are English (31 | 14.5%), German (31 | 14.5%), French (19 | 8.9%), Slovak (16 | 7.5%), and Eastern European (12 | 5.6%), together accounting for 51.0% of all Mingoville residents.
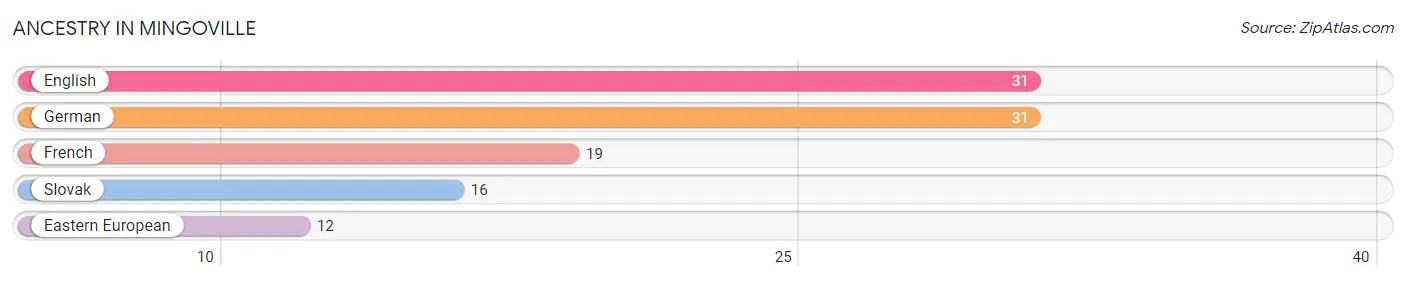
| Ancestry | # Population | % Population |
| Eastern European | 12 | 5.6% |
| English | 31 | 14.5% |
| French | 19 | 8.9% |
| German | 31 | 14.5% |
| Slovak | 16 | 7.5% | View All 5 Rows |
Immigrants in Mingoville

| Immigration Origin | # Population | % Population | View All 0 Rows |
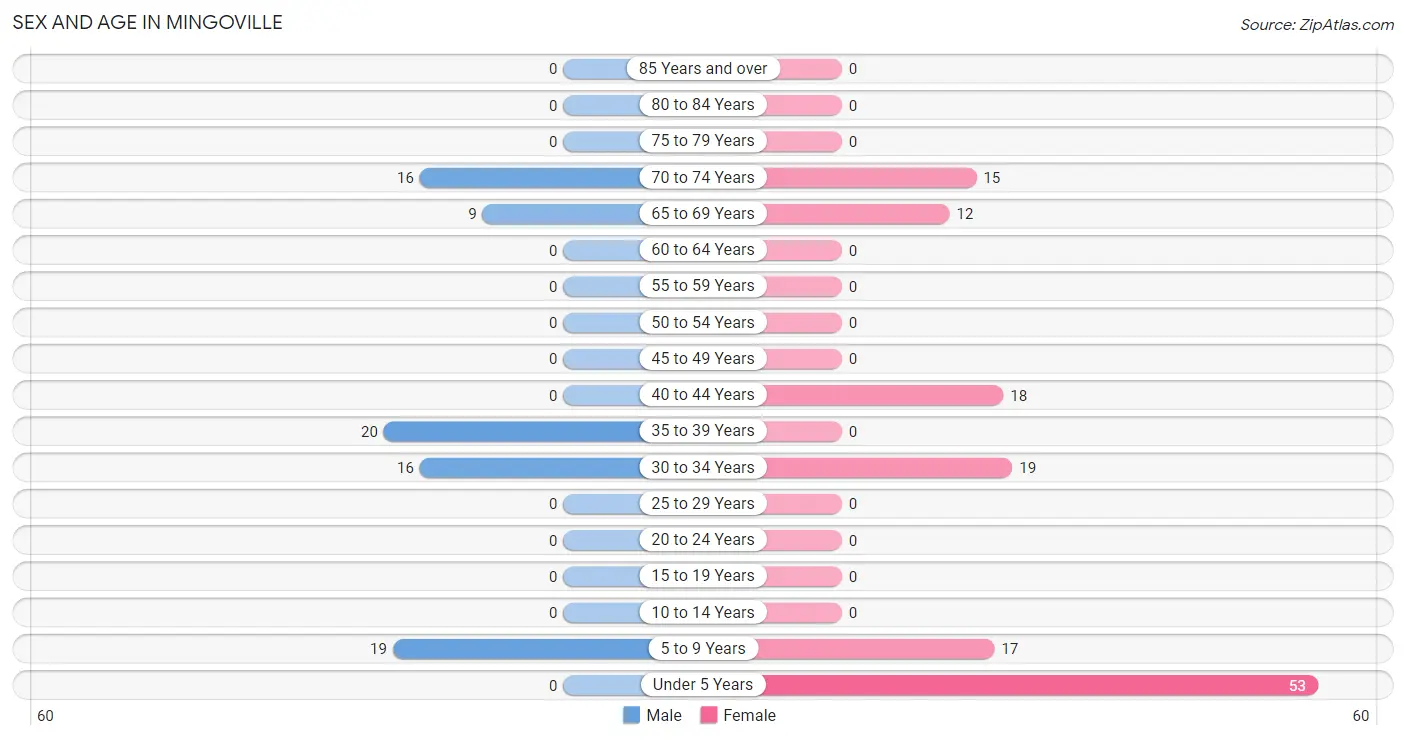
Sex and Age in Mingoville
Sex and Age in Mingoville
The most populous age groups in Mingoville are 35 to 39 Years (20 | 25.0%) for men and Under 5 Years (53 | 39.6%) for women.
| Age Bracket | Male | Female |
| Under 5 Years | 0 (0.0%) | 53 (39.6%) |
| 5 to 9 Years | 19 (23.7%) | 17 (12.7%) |
| 10 to 14 Years | 0 (0.0%) | 0 (0.0%) |
| 15 to 19 Years | 0 (0.0%) | 0 (0.0%) |
| 20 to 24 Years | 0 (0.0%) | 0 (0.0%) |
| 25 to 29 Years | 0 (0.0%) | 0 (0.0%) |
| 30 to 34 Years | 16 (20.0%) | 19 (14.2%) |
| 35 to 39 Years | 20 (25.0%) | 0 (0.0%) |
| 40 to 44 Years | 0 (0.0%) | 18 (13.4%) |
| 45 to 49 Years | 0 (0.0%) | 0 (0.0%) |
| 50 to 54 Years | 0 (0.0%) | 0 (0.0%) |
| 55 to 59 Years | 0 (0.0%) | 0 (0.0%) |
| 60 to 64 Years | 0 (0.0%) | 0 (0.0%) |
| 65 to 69 Years | 9 (11.3%) | 12 (9.0%) |
| 70 to 74 Years | 16 (20.0%) | 15 (11.2%) |
| 75 to 79 Years | 0 (0.0%) | 0 (0.0%) |
| 80 to 84 Years | 0 (0.0%) | 0 (0.0%) |
| 85 Years and over | 0 (0.0%) | 0 (0.0%) |
| Total | 80 (100.0%) | 134 (100.0%) |
Families and Households in Mingoville
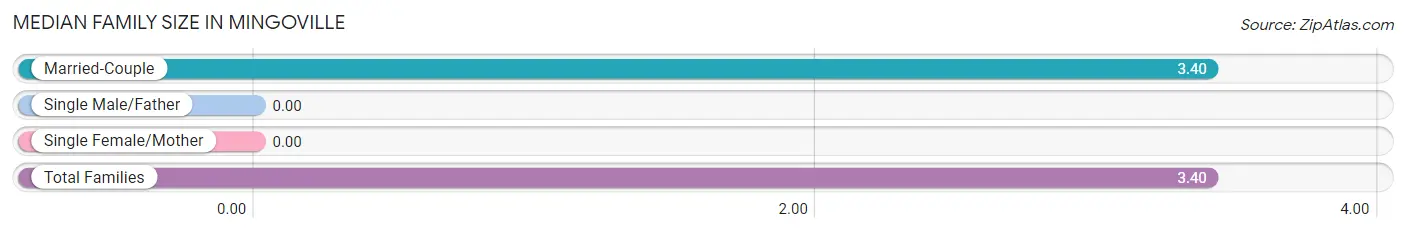
Median Family Size in Mingoville
| Family Type | # Families | Family Size |
| Married-Couple | 63 (100.0%) | 3.40 |
| Single Male/Father | 0 (0.0%) | - |
| Single Female/Mother | 0 (0.0%) | - |
| Total Families | 63 (100.0%) | 3.40 |
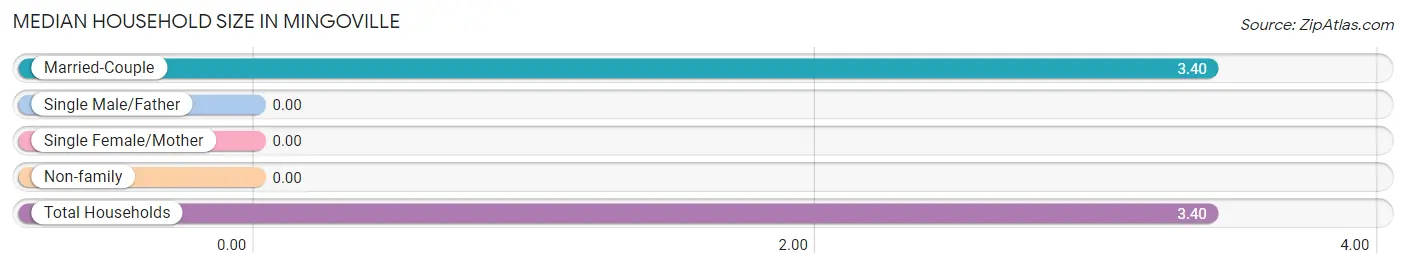
Median Household Size in Mingoville
| Household Type | # Households | Household Size |
| Married-Couple | 63 (100.0%) | 3.40 |
| Single Male/Father | 0 (0.0%) | - |
| Single Female/Mother | 0 (0.0%) | - |
| Non-family | 0 (0.0%) | - |
| Total Households | 63 (100.0%) | 3.40 |
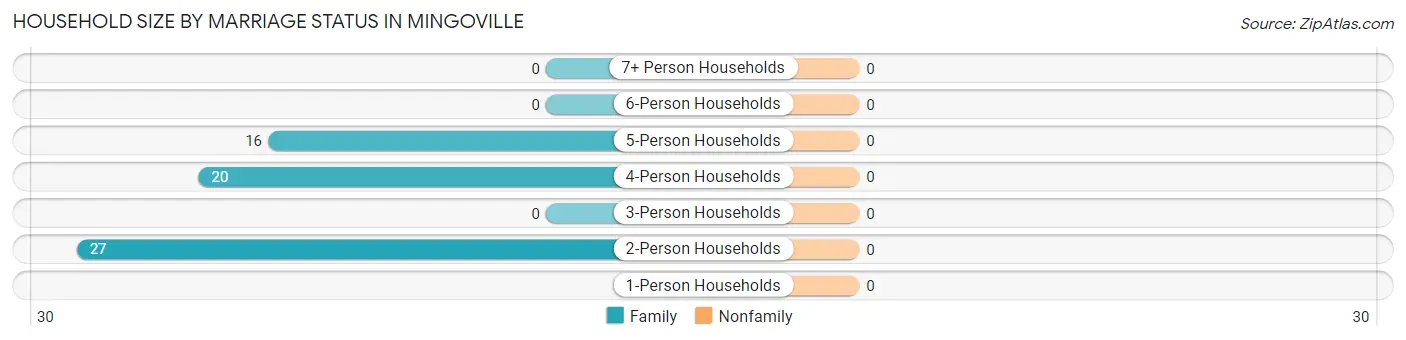
Household Size by Marriage Status in Mingoville
| Household Size | Family Households | Nonfamily Households |
| 1-Person Households | - | 0 (0.0%) |
| 2-Person Households | 27 (42.9%) | 0 (0.0%) |
| 3-Person Households | 0 (0.0%) | 0 (0.0%) |
| 4-Person Households | 20 (31.8%) | 0 (0.0%) |
| 5-Person Households | 16 (25.4%) | 0 (0.0%) |
| 6-Person Households | 0 (0.0%) | 0 (0.0%) |
| 7+ Person Households | 0 (0.0%) | 0 (0.0%) |
| Total | 63 (100.0%) | 0 (0.0%) |
Female Fertility in Mingoville
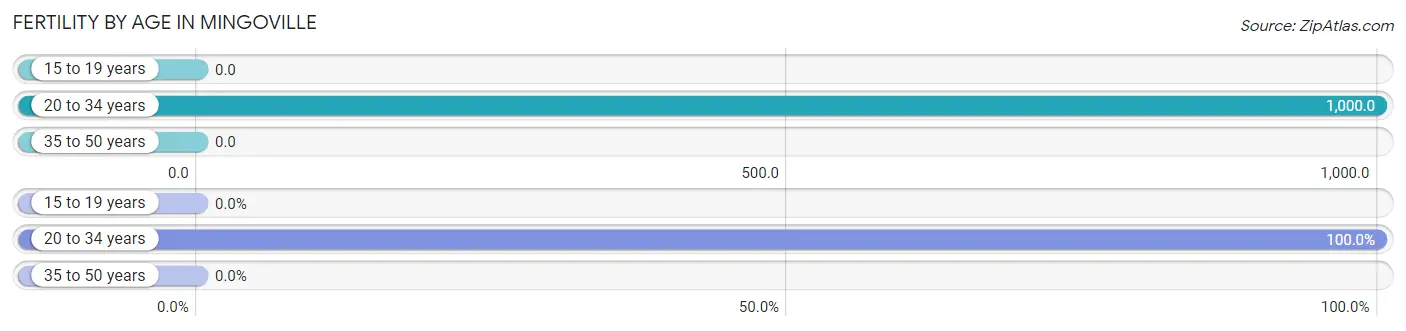
Fertility by Age in Mingoville
Average fertility rate in Mingoville is 514.0 births per 1,000 women. Women in the age bracket of 20 to 34 years have the highest fertility rate with 1,000.0 births per 1,000 women. Women in the age bracket of 20 to 34 years acount for 100.0% of all women with births.
| Age Bracket | Women with Births | Births / 1,000 Women |
| 15 to 19 years | 0 (0.0%) | 0.0 |
| 20 to 34 years | 19 (100.0%) | 1,000.0 |
| 35 to 50 years | 0 (0.0%) | 0.0 |
| Total | 19 (100.0%) | 514.0 |
Fertility by Age by Marriage Status in Mingoville
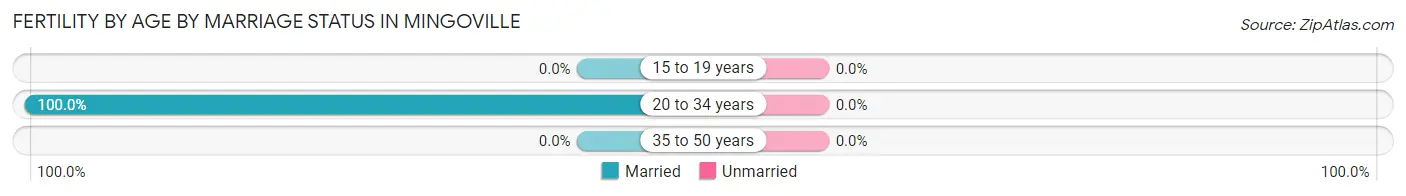
| Age Bracket | Married | Unmarried |
| 15 to 19 years | 0 (0.0%) | 0 (0.0%) |
| 20 to 34 years | 19 (100.0%) | 0 (0.0%) |
| 35 to 50 years | 0 (0.0%) | 0 (0.0%) |
| Total | 19 (100.0%) | 0 (0.0%) |
Fertility by Education in Mingoville
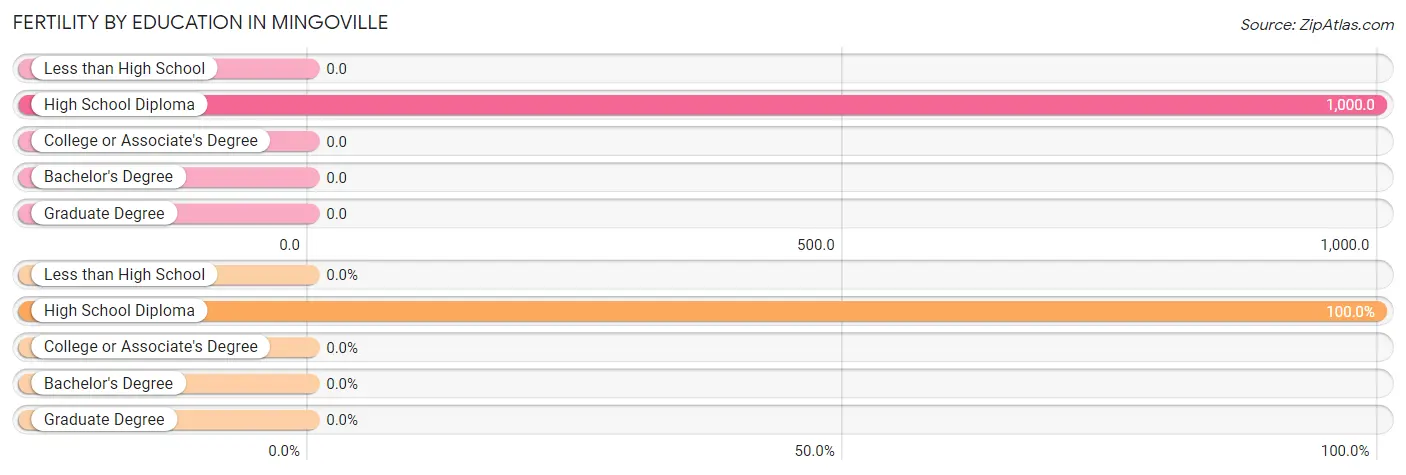
| Educational Attainment | Women with Births | Births / 1,000 Women |
| Less than High School | 0 (0.0%) | 0.0 |
| High School Diploma | 19 (100.0%) | 1,000.0 |
| College or Associate's Degree | 0 (0.0%) | 0.0 |
| Bachelor's Degree | 0 (0.0%) | 0.0 |
| Graduate Degree | 0 (0.0%) | 0.0 |
| Total | 19 (100.0%) | 514.0 |
Fertility by Education by Marriage Status in Mingoville
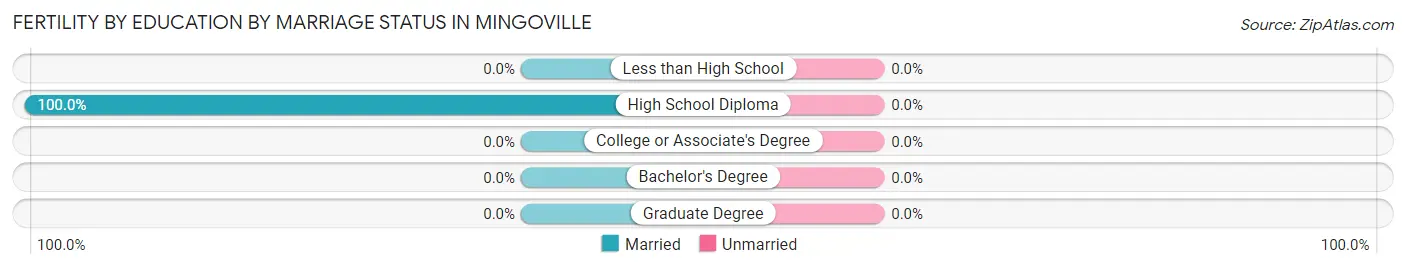
| Educational Attainment | Married | Unmarried |
| Less than High School | 0 (0.0%) | 0 (0.0%) |
| High School Diploma | 19 (100.0%) | 0 (0.0%) |
| College or Associate's Degree | 0 (0.0%) | 0 (0.0%) |
| Bachelor's Degree | 0 (0.0%) | 0 (0.0%) |
| Graduate Degree | 0 (0.0%) | 0 (0.0%) |
| Total | 19 (100.0%) | 0 (0.0%) |
Employment Characteristics in Mingoville
Employment by Class of Employer in Mingoville
Among the 69 employed individuals in Mingoville, private company employees (53 | 76.8%), and state government employees (16 | 23.2%) make up the most common classes of employment.
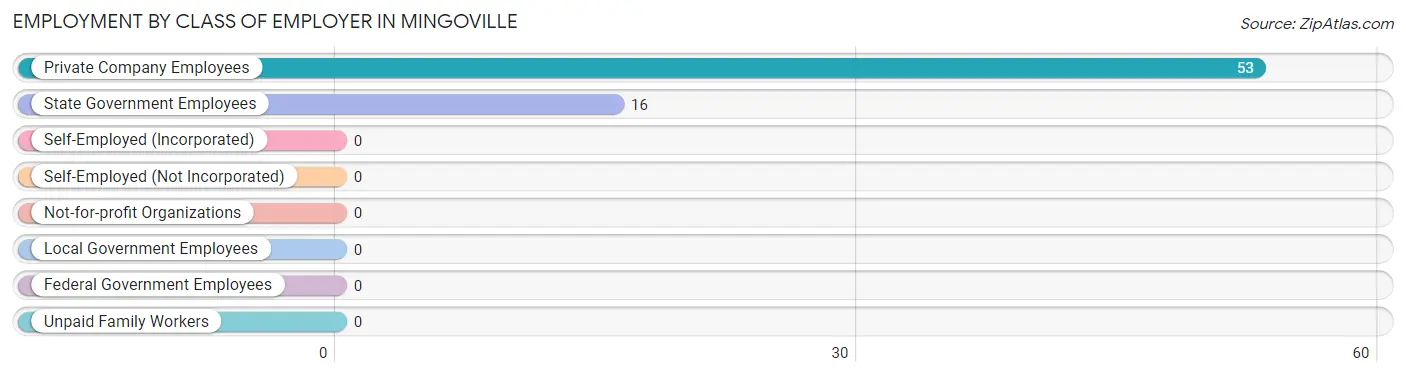
| Employer Class | # Employees | % Employees |
| Private Company Employees | 53 | 76.8% |
| Self-Employed (Incorporated) | 0 | 0.0% |
| Self-Employed (Not Incorporated) | 0 | 0.0% |
| Not-for-profit Organizations | 0 | 0.0% |
| Local Government Employees | 0 | 0.0% |
| State Government Employees | 16 | 23.2% |
| Federal Government Employees | 0 | 0.0% |
| Unpaid Family Workers | 0 | 0.0% |
| Total | 69 | 100.0% |
Employment Status by Age in Mingoville
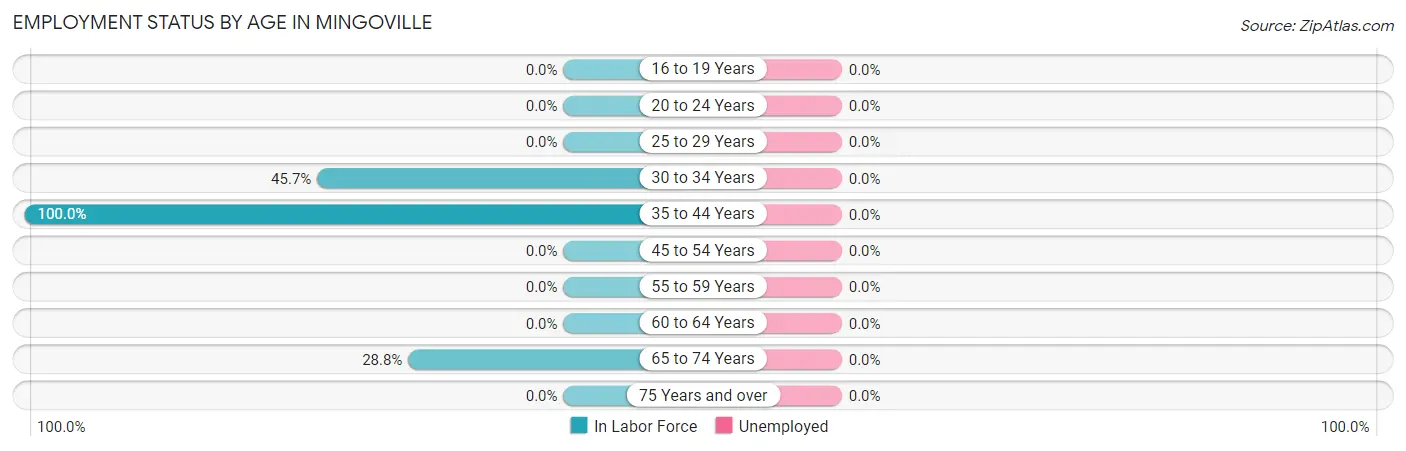
| Age Bracket | In Labor Force | Unemployed |
| 16 to 19 Years | 0 (0.0%) | 0 (0.0%) |
| 20 to 24 Years | 0 (0.0%) | 0 (0.0%) |
| 25 to 29 Years | 0 (0.0%) | 0 (0.0%) |
| 30 to 34 Years | 16 (45.7%) | 0 (0.0%) |
| 35 to 44 Years | 38 (100.0%) | 0 (0.0%) |
| 45 to 54 Years | 0 (0.0%) | 0 (0.0%) |
| 55 to 59 Years | 0 (0.0%) | 0 (0.0%) |
| 60 to 64 Years | 0 (0.0%) | 0 (0.0%) |
| 65 to 74 Years | 15 (28.8%) | 0 (0.0%) |
| 75 Years and over | 0 (0.0%) | 0 (0.0%) |
| Total | 69 (55.2%) | 0 (0.0%) |
Employment Status by Educational Attainment in Mingoville
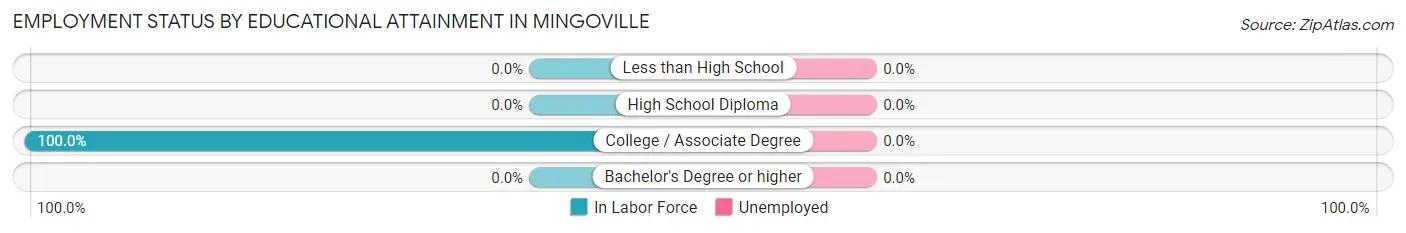
| Educational Attainment | In Labor Force | Unemployed |
| Less than High School | 0 (0.0%) | 0 (0.0%) |
| High School Diploma | 0 (0.0%) | 0 (0.0%) |
| College / Associate Degree | 54 (100.0%) | 0 (0.0%) |
| Bachelor's Degree or higher | 0 (0.0%) | 0 (0.0%) |
| Total | 54 (74.0%) | 0 (0.0%) |
Employment Occupations by Sex in Mingoville
Management, Business, Science and Arts Occupations
The most common Management, Business, Science and Arts occupations in Mingoville are , and Management (18 | 26.1%).
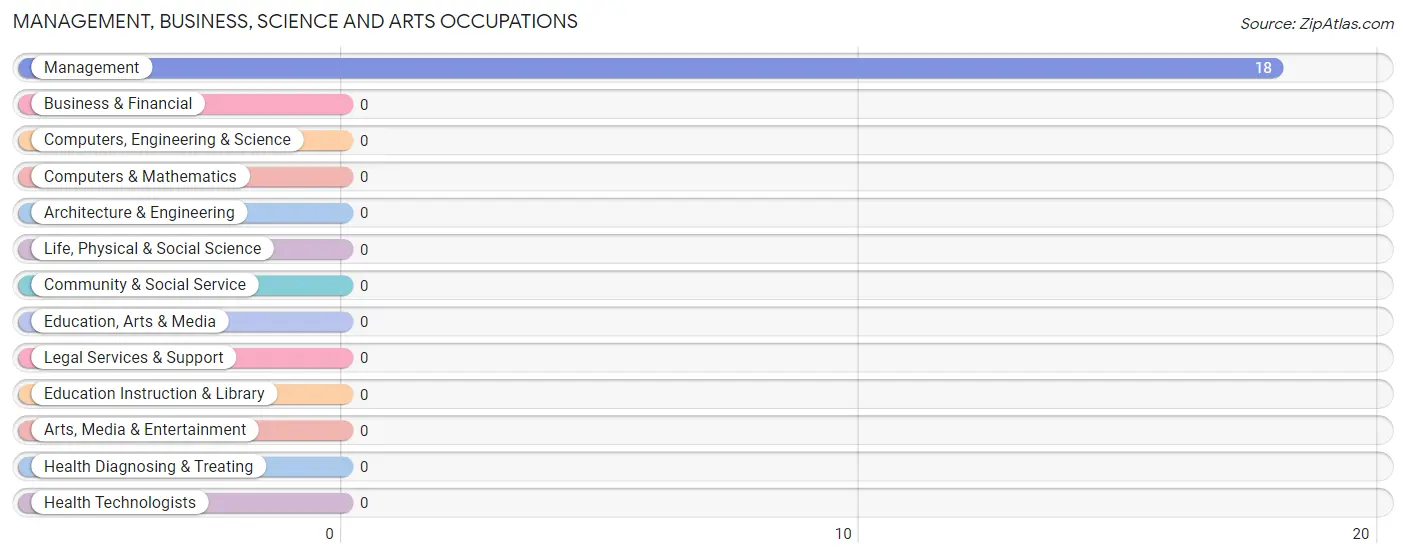
Management, Business, Science and Arts Occupations by Sex
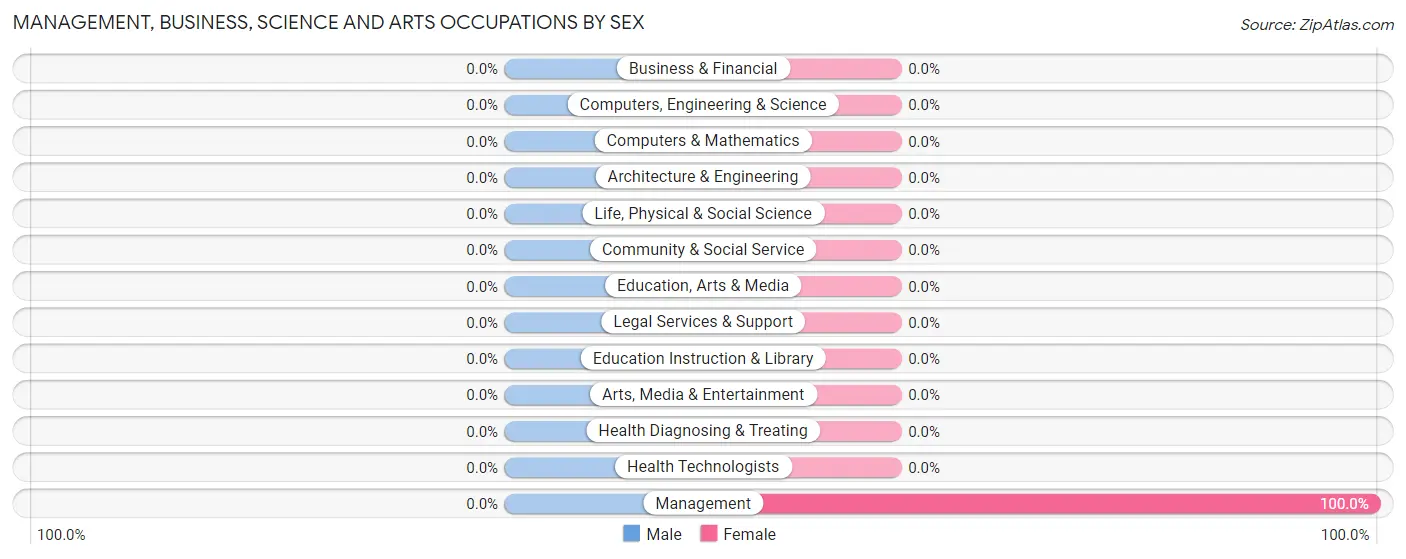
| Occupation | Male | Female |
| Management | 0 (0.0%) | 18 (100.0%) |
| Business & Financial | 0 (0.0%) | 0 (0.0%) |
| Computers, Engineering & Science | 0 (0.0%) | 0 (0.0%) |
| Computers & Mathematics | 0 (0.0%) | 0 (0.0%) |
| Architecture & Engineering | 0 (0.0%) | 0 (0.0%) |
| Life, Physical & Social Science | 0 (0.0%) | 0 (0.0%) |
| Community & Social Service | 0 (0.0%) | 0 (0.0%) |
| Education, Arts & Media | 0 (0.0%) | 0 (0.0%) |
| Legal Services & Support | 0 (0.0%) | 0 (0.0%) |
| Education Instruction & Library | 0 (0.0%) | 0 (0.0%) |
| Arts, Media & Entertainment | 0 (0.0%) | 0 (0.0%) |
| Health Diagnosing & Treating | 0 (0.0%) | 0 (0.0%) |
| Health Technologists | 0 (0.0%) | 0 (0.0%) |
| Total (Category) | 0 (0.0%) | 18 (100.0%) |
| Total (Overall) | 36 (52.2%) | 33 (47.8%) |
Services Occupations
Services Occupations by Sex
| Occupation | Male | Female |
| Healthcare Support | 0 (0.0%) | 0 (0.0%) |
| Security & Protection | 0 (0.0%) | 0 (0.0%) |
| Firefighting & Prevention | 0 (0.0%) | 0 (0.0%) |
| Law Enforcement | 0 (0.0%) | 0 (0.0%) |
| Food Preparation & Serving | 0 (0.0%) | 0 (0.0%) |
| Cleaning & Maintenance | 0 (0.0%) | 0 (0.0%) |
| Personal Care & Service | 0 (0.0%) | 0 (0.0%) |
| Total (Category) | 0 (0.0%) | 0 (0.0%) |
| Total (Overall) | 36 (52.2%) | 33 (47.8%) |
Sales and Office Occupations
The most common Sales and Office occupations in Mingoville are , and Sales & Related (15 | 21.7%).
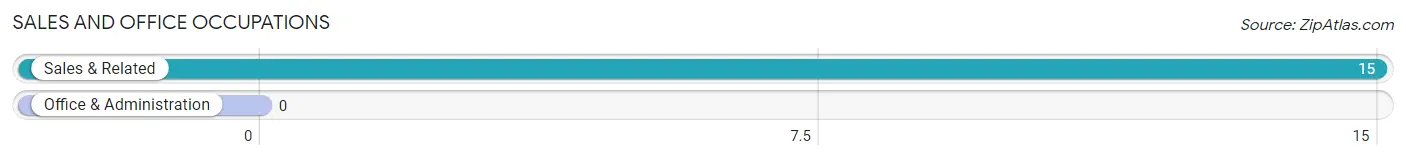
Sales and Office Occupations by Sex
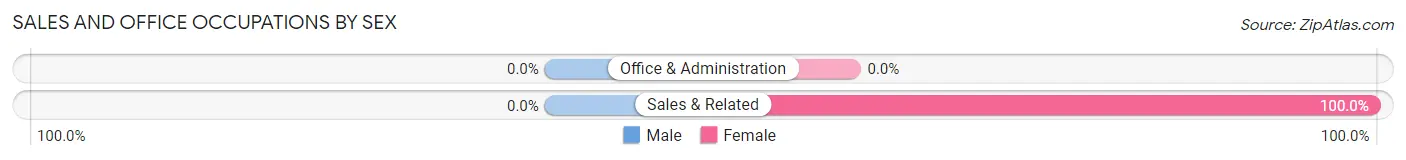
| Occupation | Male | Female |
| Sales & Related | 0 (0.0%) | 15 (100.0%) |
| Office & Administration | 0 (0.0%) | 0 (0.0%) |
| Total (Category) | 0 (0.0%) | 15 (100.0%) |
| Total (Overall) | 36 (52.2%) | 33 (47.8%) |
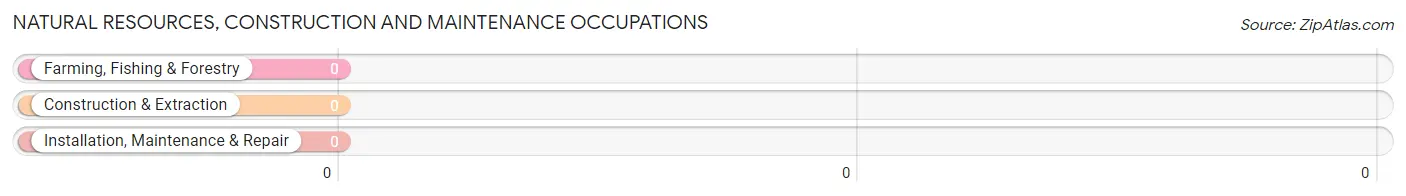
Natural Resources, Construction and Maintenance Occupations
Natural Resources, Construction and Maintenance Occupations by Sex
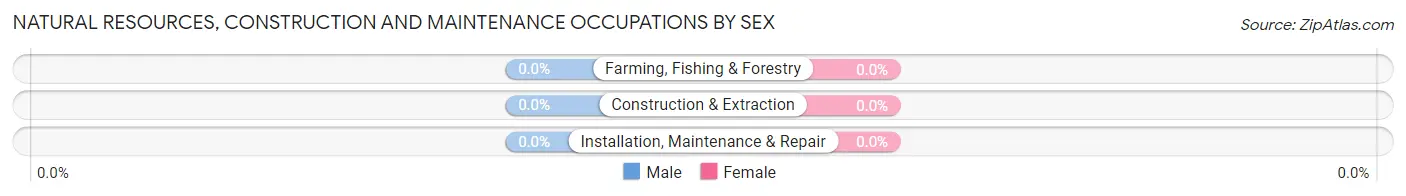
| Occupation | Male | Female |
| Farming, Fishing & Forestry | 0 (0.0%) | 0 (0.0%) |
| Construction & Extraction | 0 (0.0%) | 0 (0.0%) |
| Installation, Maintenance & Repair | 0 (0.0%) | 0 (0.0%) |
| Total (Category) | 0 (0.0%) | 0 (0.0%) |
| Total (Overall) | 36 (52.2%) | 33 (47.8%) |
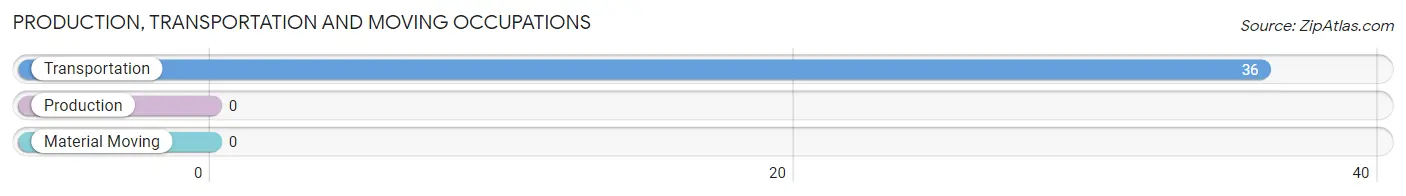
Production, Transportation and Moving Occupations
The most common Production, Transportation and Moving occupations in Mingoville are , and Transportation (36 | 52.2%).
Production, Transportation and Moving Occupations by Sex
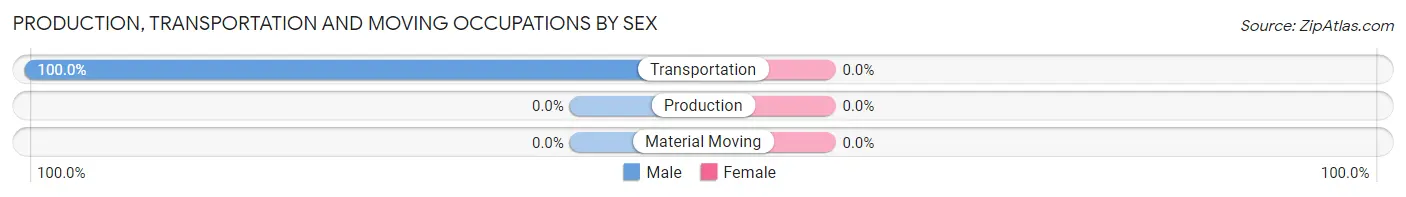
| Occupation | Male | Female |
| Production | 0 (0.0%) | 0 (0.0%) |
| Transportation | 36 (100.0%) | 0 (0.0%) |
| Material Moving | 0 (0.0%) | 0 (0.0%) |
| Total (Category) | 36 (100.0%) | 0 (0.0%) |
| Total (Overall) | 36 (52.2%) | 33 (47.8%) |
Employment Industries by Sex in Mingoville
Employment Industries in Mingoville
The major employment industries in Mingoville include Manufacturing (20 | 29.0%), Health Care & Social Assistance (18 | 26.1%), Public Administration (16 | 23.2%), and Finance & Insurance (15 | 21.7%).
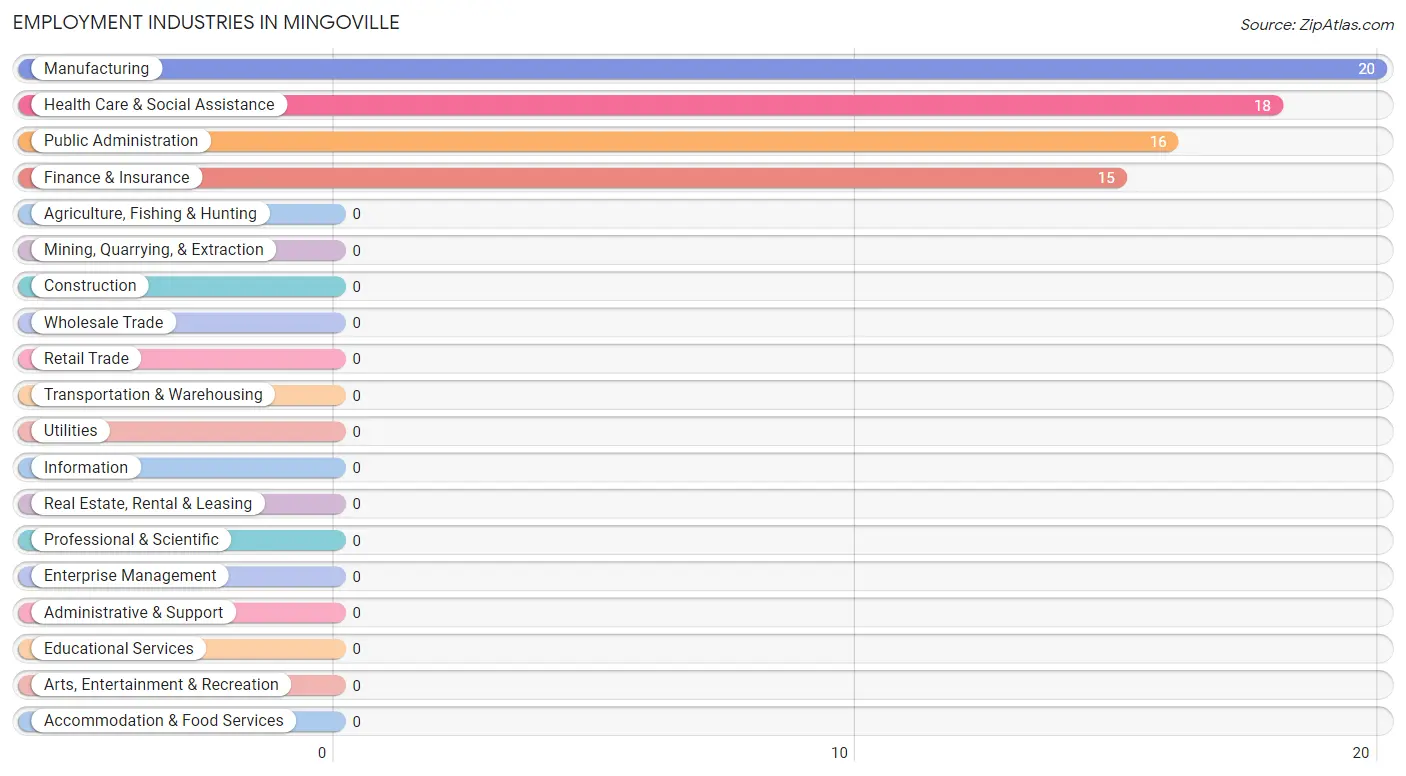
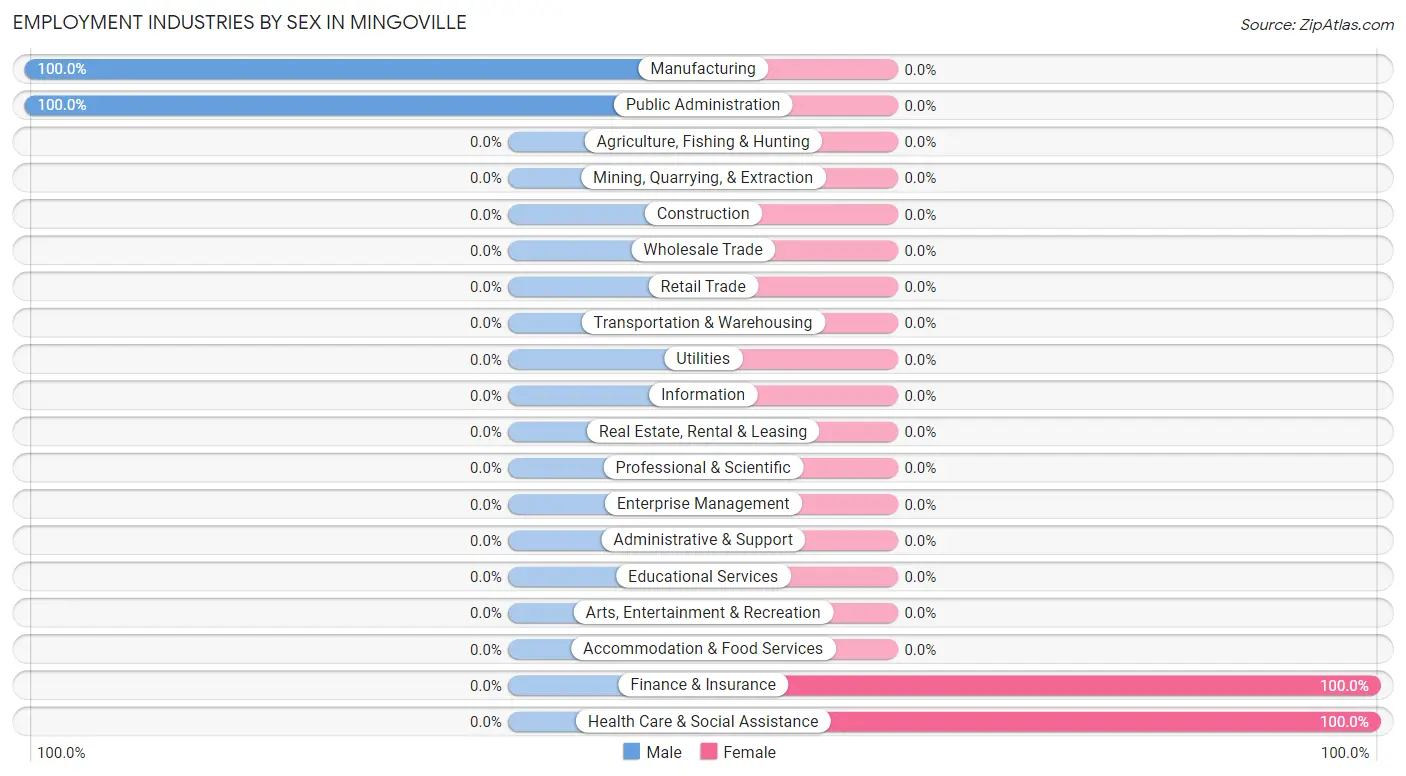
Employment Industries by Sex in Mingoville
The Mingoville industries that see more men than women are Manufacturing (100.0%), and Public Administration (100.0%), whereas the industries that tend to have a higher number of women are Finance & Insurance (100.0%), and Health Care & Social Assistance (100.0%).
| Industry | Male | Female |
| Agriculture, Fishing & Hunting | 0 (0.0%) | 0 (0.0%) |
| Mining, Quarrying, & Extraction | 0 (0.0%) | 0 (0.0%) |
| Construction | 0 (0.0%) | 0 (0.0%) |
| Manufacturing | 20 (100.0%) | 0 (0.0%) |
| Wholesale Trade | 0 (0.0%) | 0 (0.0%) |
| Retail Trade | 0 (0.0%) | 0 (0.0%) |
| Transportation & Warehousing | 0 (0.0%) | 0 (0.0%) |
| Utilities | 0 (0.0%) | 0 (0.0%) |
| Information | 0 (0.0%) | 0 (0.0%) |
| Finance & Insurance | 0 (0.0%) | 15 (100.0%) |
| Real Estate, Rental & Leasing | 0 (0.0%) | 0 (0.0%) |
| Professional & Scientific | 0 (0.0%) | 0 (0.0%) |
| Enterprise Management | 0 (0.0%) | 0 (0.0%) |
| Administrative & Support | 0 (0.0%) | 0 (0.0%) |
| Educational Services | 0 (0.0%) | 0 (0.0%) |
| Health Care & Social Assistance | 0 (0.0%) | 18 (100.0%) |
| Arts, Entertainment & Recreation | 0 (0.0%) | 0 (0.0%) |
| Accommodation & Food Services | 0 (0.0%) | 0 (0.0%) |
| Public Administration | 16 (100.0%) | 0 (0.0%) |
| Total | 36 (52.2%) | 33 (47.8%) |
Education in Mingoville
School Enrollment in Mingoville
The most common levels of schooling among the 36 students in Mingoville are elementary school (19 | 52.8%), and nursery / preschool (17 | 47.2%).
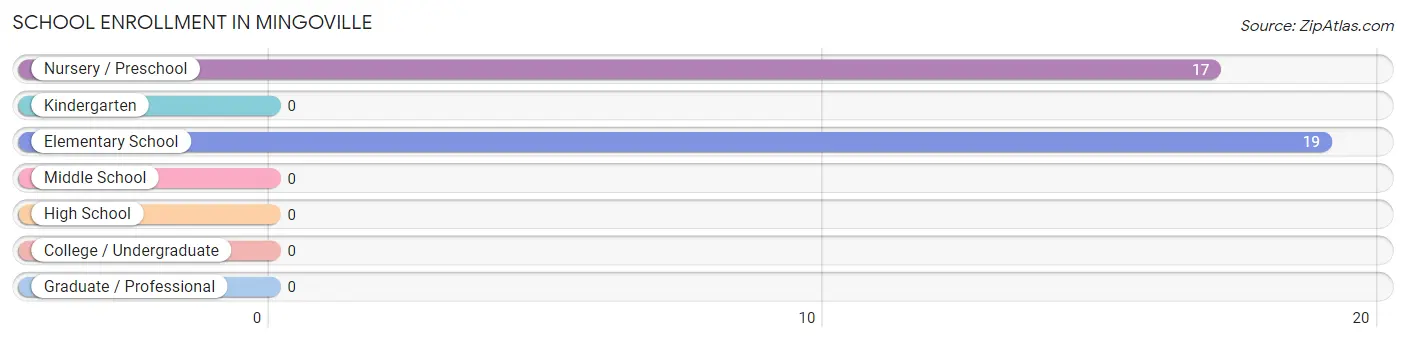
| School Level | # Students | % Students |
| Nursery / Preschool | 17 | 47.2% |
| Kindergarten | 0 | 0.0% |
| Elementary School | 19 | 52.8% |
| Middle School | 0 | 0.0% |
| High School | 0 | 0.0% |
| College / Undergraduate | 0 | 0.0% |
| Graduate / Professional | 0 | 0.0% |
| Total | 36 | 100.0% |
School Enrollment by Age by Funding Source in Mingoville
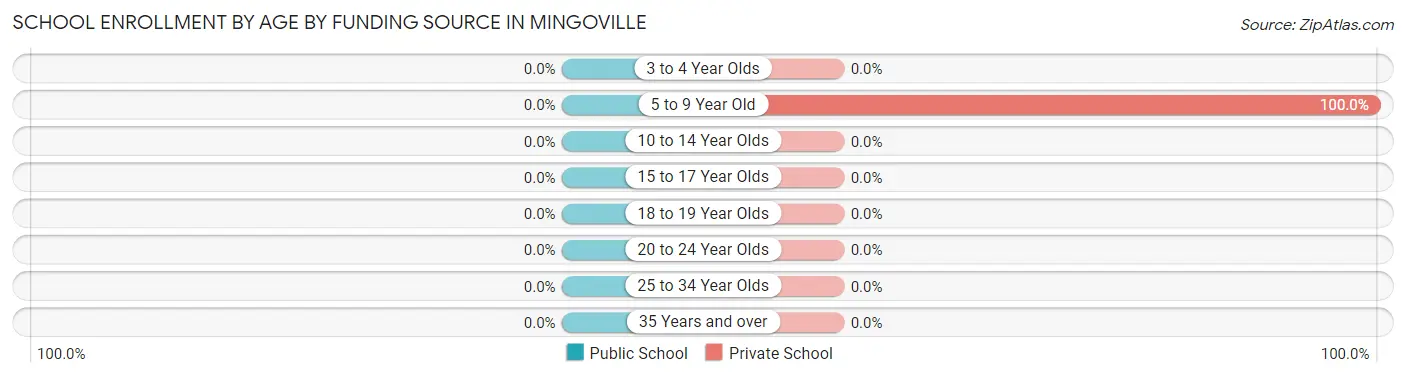
| Age Bracket | Public School | Private School |
| 3 to 4 Year Olds | 0 (0.0%) | 0 (0.0%) |
| 5 to 9 Year Old | 0 (0.0%) | 36 (100.0%) |
| 10 to 14 Year Olds | 0 (0.0%) | 0 (0.0%) |
| 15 to 17 Year Olds | 0 (0.0%) | 0 (0.0%) |
| 18 to 19 Year Olds | 0 (0.0%) | 0 (0.0%) |
| 20 to 24 Year Olds | 0 (0.0%) | 0 (0.0%) |
| 25 to 34 Year Olds | 0 (0.0%) | 0 (0.0%) |
| 35 Years and over | 0 (0.0%) | 0 (0.0%) |
| Total | 0 (0.0%) | 36 (100.0%) |
Educational Attainment by Field of Study in Mingoville
Bio, nature & agricultural (12 | 57.1%), and arts & humanities (9 | 42.9%) are the most common fields of study among 21 individuals in Mingoville who have obtained a bachelor's degree or higher.
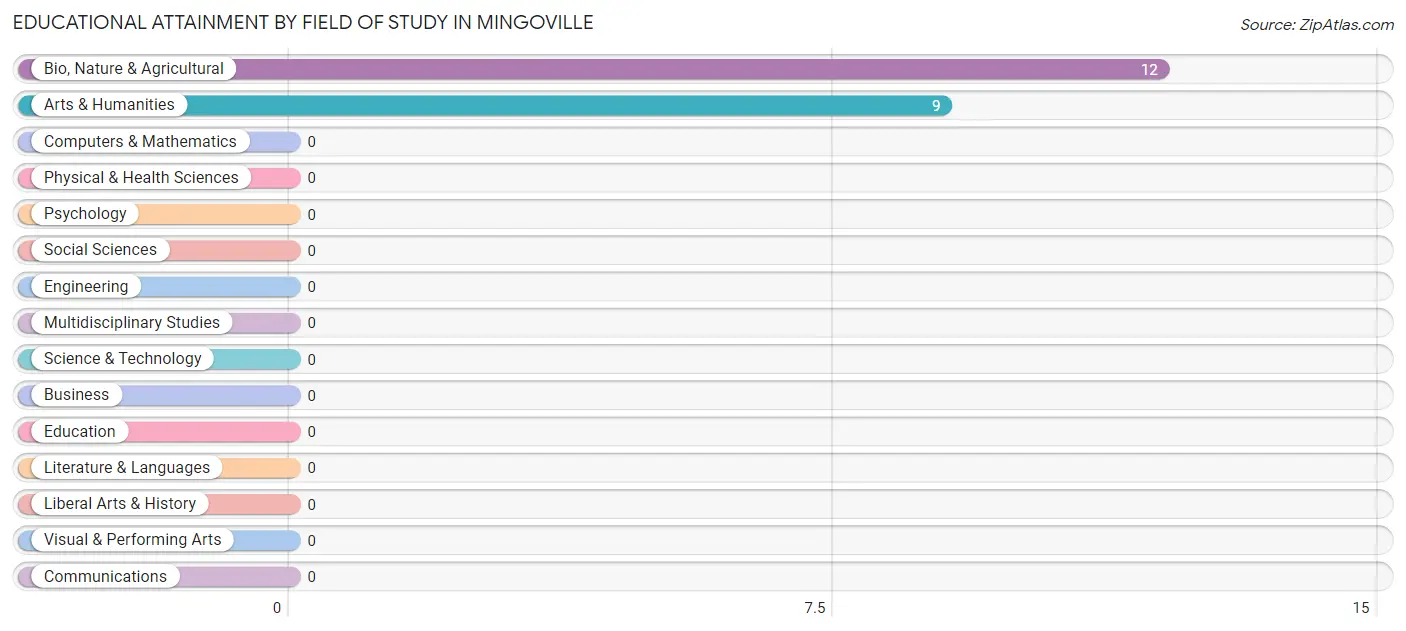
| Field of Study | # Graduates | % Graduates |
| Computers & Mathematics | 0 | 0.0% |
| Bio, Nature & Agricultural | 12 | 57.1% |
| Physical & Health Sciences | 0 | 0.0% |
| Psychology | 0 | 0.0% |
| Social Sciences | 0 | 0.0% |
| Engineering | 0 | 0.0% |
| Multidisciplinary Studies | 0 | 0.0% |
| Science & Technology | 0 | 0.0% |
| Business | 0 | 0.0% |
| Education | 0 | 0.0% |
| Literature & Languages | 0 | 0.0% |
| Liberal Arts & History | 0 | 0.0% |
| Visual & Performing Arts | 0 | 0.0% |
| Communications | 0 | 0.0% |
| Arts & Humanities | 9 | 42.9% |
| Total | 21 | 100.0% |
Transportation & Commute in Mingoville
Vehicle Availability by Sex in Mingoville
The most prevalent vehicle ownership categories in Mingoville are males with 2 vehicles (20, accounting for 55.6%) and females with 2 vehicles (18, making up 60.6%).
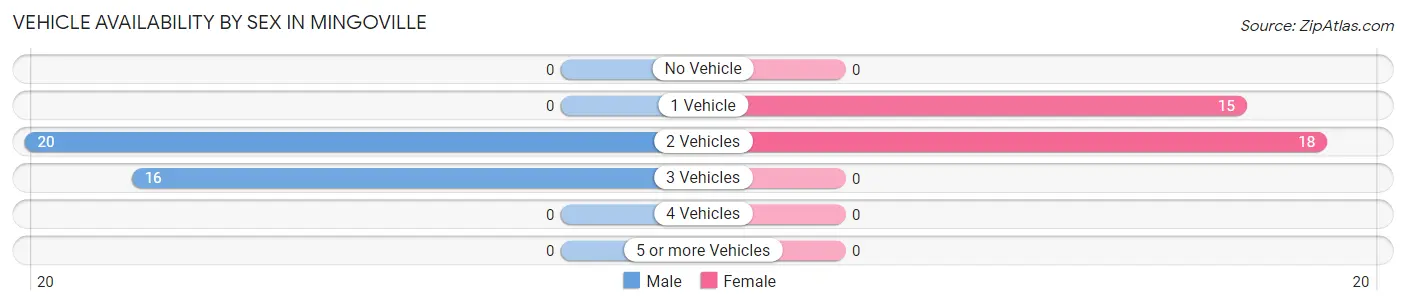
| Vehicles Available | Male | Female |
| No Vehicle | 0 (0.0%) | 0 (0.0%) |
| 1 Vehicle | 0 (0.0%) | 15 (45.5%) |
| 2 Vehicles | 20 (55.6%) | 18 (54.5%) |
| 3 Vehicles | 16 (44.4%) | 0 (0.0%) |
| 4 Vehicles | 0 (0.0%) | 0 (0.0%) |
| 5 or more Vehicles | 0 (0.0%) | 0 (0.0%) |
| Total | 36 (100.0%) | 33 (100.0%) |
Commute Time in Mingoville
The most frequently occuring commute durations in Mingoville are 25 to 29 minutes (20 commuters, 29.0%), 30 to 34 minutes (18 commuters, 26.1%), and 20 to 24 minutes (16 commuters, 23.2%).
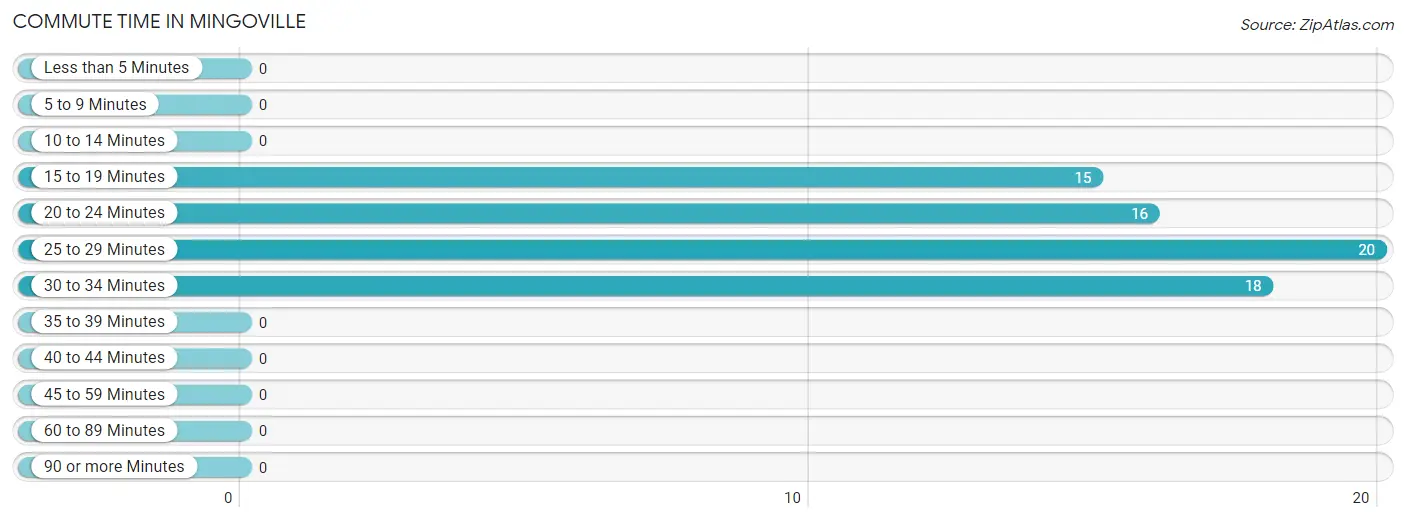
| Commute Time | # Commuters | % Commuters |
| Less than 5 Minutes | 0 | 0.0% |
| 5 to 9 Minutes | 0 | 0.0% |
| 10 to 14 Minutes | 0 | 0.0% |
| 15 to 19 Minutes | 15 | 21.7% |
| 20 to 24 Minutes | 16 | 23.2% |
| 25 to 29 Minutes | 20 | 29.0% |
| 30 to 34 Minutes | 18 | 26.1% |
| 35 to 39 Minutes | 0 | 0.0% |
| 40 to 44 Minutes | 0 | 0.0% |
| 45 to 59 Minutes | 0 | 0.0% |
| 60 to 89 Minutes | 0 | 0.0% |
| 90 or more Minutes | 0 | 0.0% |
Commute Time by Sex in Mingoville
The most common commute times in Mingoville are 25 to 29 minutes (20 commuters, 55.6%) for males and 30 to 34 minutes (18 commuters, 54.5%) for females.
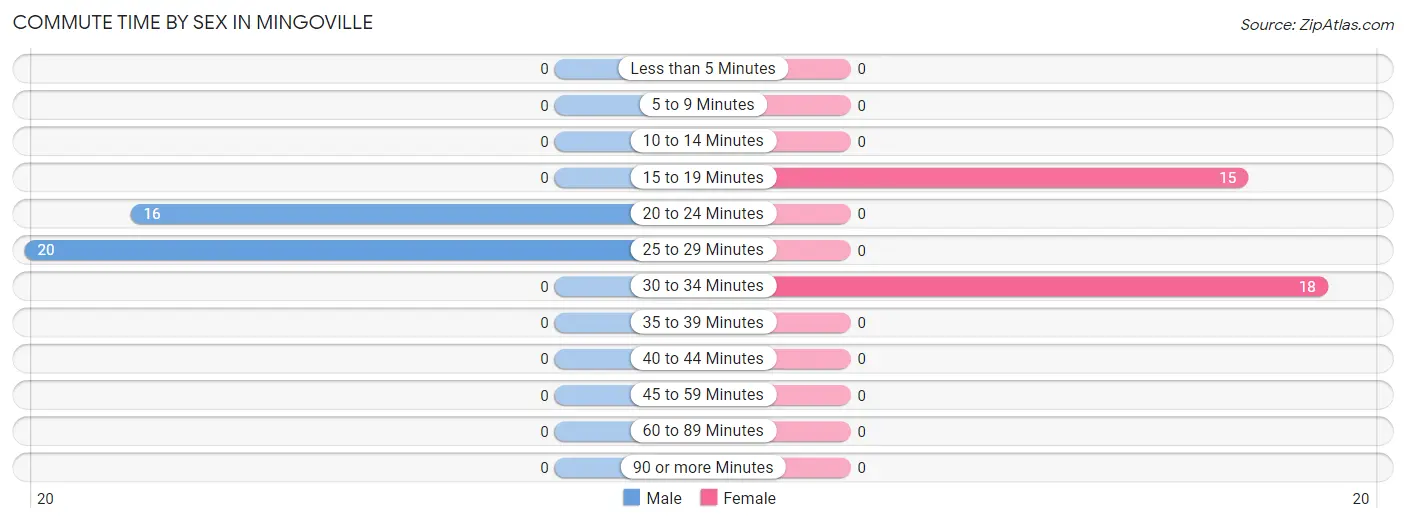
| Commute Time | Male | Female |
| Less than 5 Minutes | 0 (0.0%) | 0 (0.0%) |
| 5 to 9 Minutes | 0 (0.0%) | 0 (0.0%) |
| 10 to 14 Minutes | 0 (0.0%) | 0 (0.0%) |
| 15 to 19 Minutes | 0 (0.0%) | 15 (45.5%) |
| 20 to 24 Minutes | 16 (44.4%) | 0 (0.0%) |
| 25 to 29 Minutes | 20 (55.6%) | 0 (0.0%) |
| 30 to 34 Minutes | 0 (0.0%) | 18 (54.5%) |
| 35 to 39 Minutes | 0 (0.0%) | 0 (0.0%) |
| 40 to 44 Minutes | 0 (0.0%) | 0 (0.0%) |
| 45 to 59 Minutes | 0 (0.0%) | 0 (0.0%) |
| 60 to 89 Minutes | 0 (0.0%) | 0 (0.0%) |
| 90 or more Minutes | 0 (0.0%) | 0 (0.0%) |
Time of Departure to Work by Sex in Mingoville
The most frequent times of departure to work in Mingoville are 8:00 AM to 8:29 AM (20, 55.6%) for males and 7:00 AM to 7:29 AM (18, 54.5%) for females.
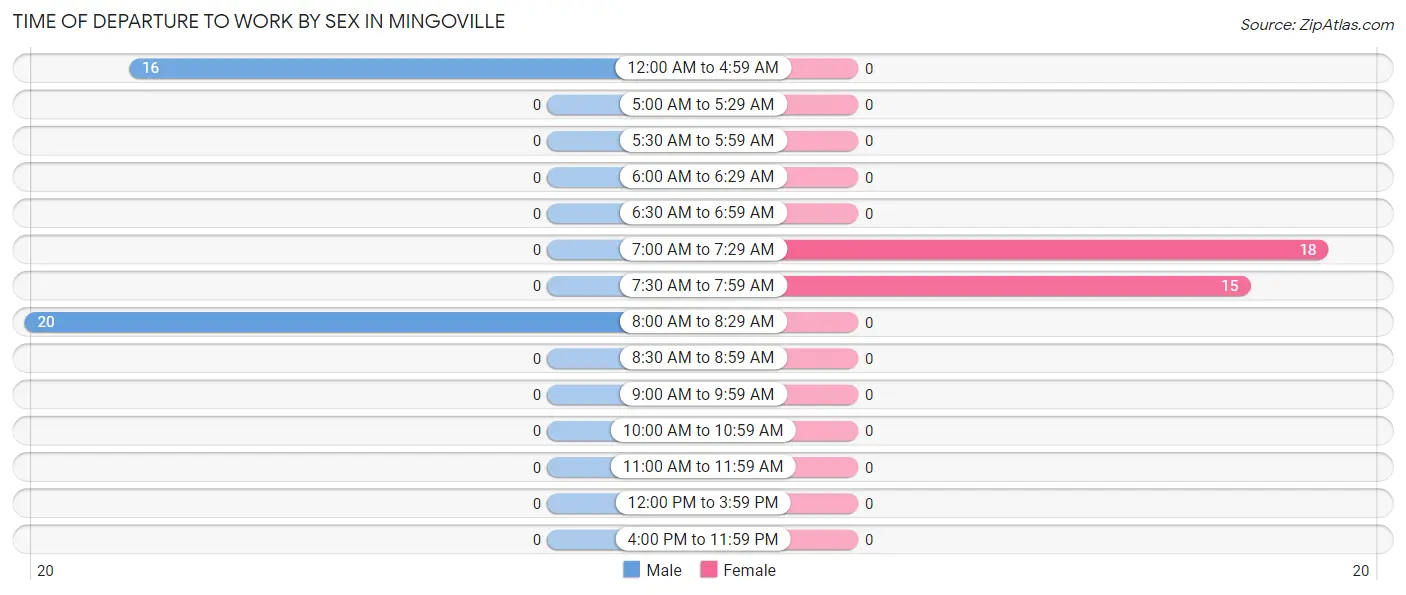
| Time of Departure | Male | Female |
| 12:00 AM to 4:59 AM | 16 (44.4%) | 0 (0.0%) |
| 5:00 AM to 5:29 AM | 0 (0.0%) | 0 (0.0%) |
| 5:30 AM to 5:59 AM | 0 (0.0%) | 0 (0.0%) |
| 6:00 AM to 6:29 AM | 0 (0.0%) | 0 (0.0%) |
| 6:30 AM to 6:59 AM | 0 (0.0%) | 0 (0.0%) |
| 7:00 AM to 7:29 AM | 0 (0.0%) | 18 (54.5%) |
| 7:30 AM to 7:59 AM | 0 (0.0%) | 15 (45.5%) |
| 8:00 AM to 8:29 AM | 20 (55.6%) | 0 (0.0%) |
| 8:30 AM to 8:59 AM | 0 (0.0%) | 0 (0.0%) |
| 9:00 AM to 9:59 AM | 0 (0.0%) | 0 (0.0%) |
| 10:00 AM to 10:59 AM | 0 (0.0%) | 0 (0.0%) |
| 11:00 AM to 11:59 AM | 0 (0.0%) | 0 (0.0%) |
| 12:00 PM to 3:59 PM | 0 (0.0%) | 0 (0.0%) |
| 4:00 PM to 11:59 PM | 0 (0.0%) | 0 (0.0%) |
| Total | 36 (100.0%) | 33 (100.0%) |
Housing Occupancy in Mingoville
Occupancy by Ownership in Mingoville
Of the total 63 dwellings in Mingoville, owner-occupied units account for 63 (100.0%), while renter-occupied units make up 0 (0.0%).
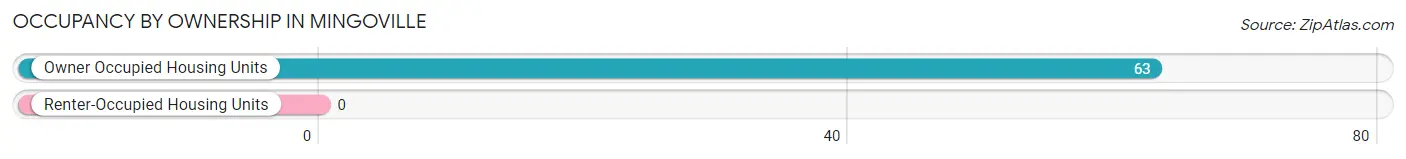
| Occupancy | # Housing Units | % Housing Units |
| Owner Occupied Housing Units | 63 | 100.0% |
| Renter-Occupied Housing Units | 0 | 0.0% |
| Total Occupied Housing Units | 63 | 100.0% |
Occupancy by Household Size in Mingoville
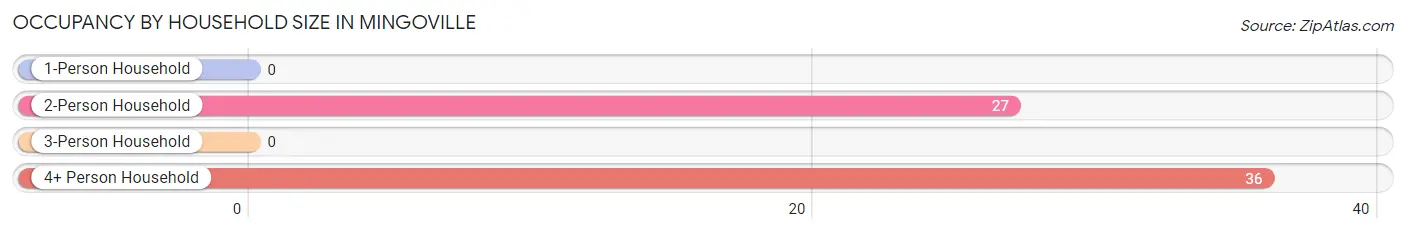
| Household Size | # Housing Units | % Housing Units |
| 1-Person Household | 0 | 0.0% |
| 2-Person Household | 27 | 42.9% |
| 3-Person Household | 0 | 0.0% |
| 4+ Person Household | 36 | 57.1% |
| Total Housing Units | 63 | 100.0% |
Occupancy by Ownership by Household Size in Mingoville
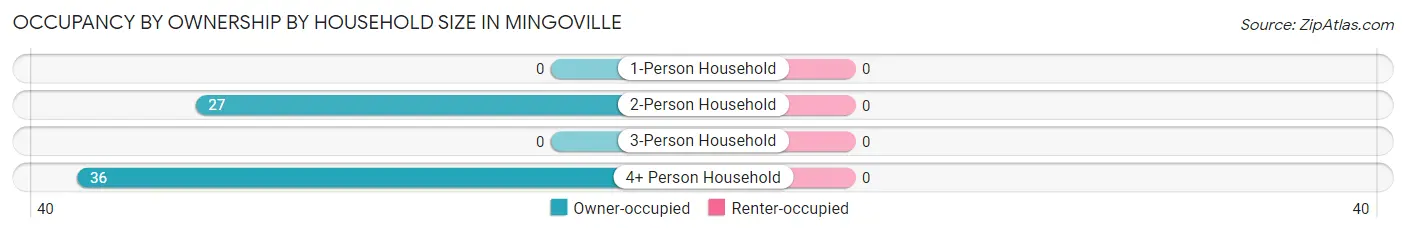
| Household Size | Owner-occupied | Renter-occupied |
| 1-Person Household | 0 (0.0%) | 0 (0.0%) |
| 2-Person Household | 27 (100.0%) | 0 (0.0%) |
| 3-Person Household | 0 (0.0%) | 0 (0.0%) |
| 4+ Person Household | 36 (100.0%) | 0 (0.0%) |
| Total Housing Units | 63 (100.0%) | 0 (0.0%) |
Occupancy by Educational Attainment in Mingoville
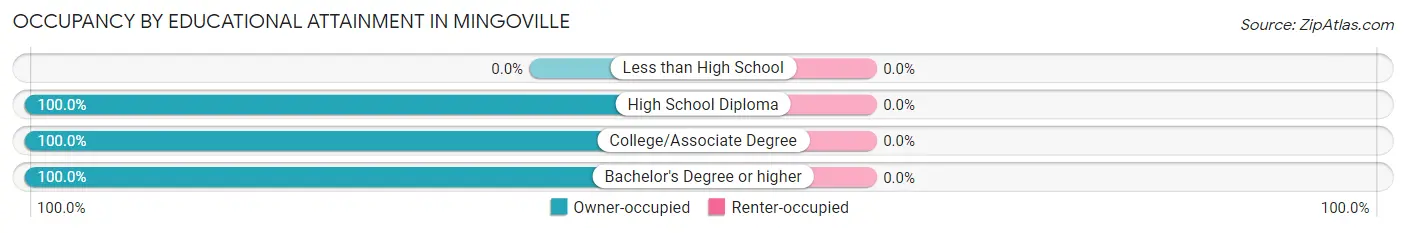
| Household Size | Owner-occupied | Renter-occupied |
| Less than High School | 0 (0.0%) | 0 (0.0%) |
| High School Diploma | 15 (100.0%) | 0 (0.0%) |
| College/Associate Degree | 36 (100.0%) | 0 (0.0%) |
| Bachelor's Degree or higher | 12 (100.0%) | 0 (0.0%) |
Occupancy by Age of Householder in Mingoville
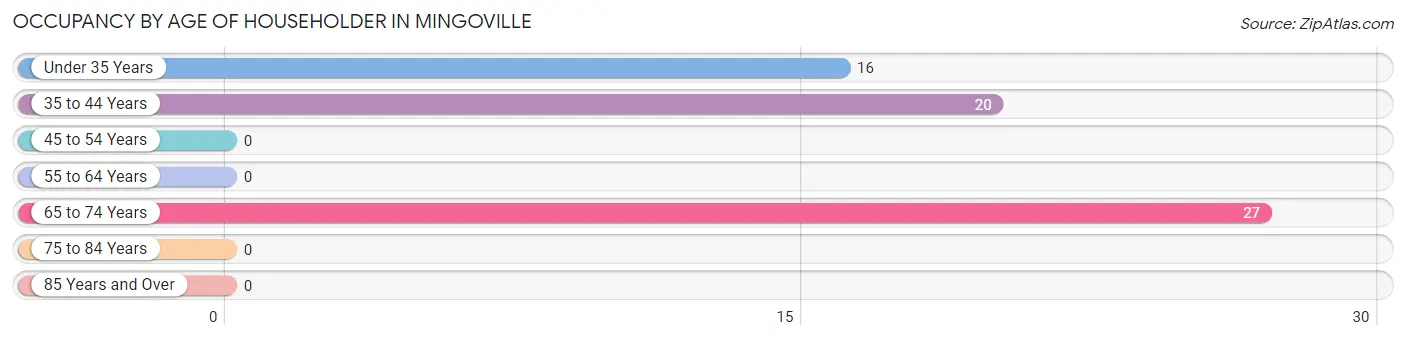
| Age Bracket | # Households | % Households |
| Under 35 Years | 16 | 25.4% |
| 35 to 44 Years | 20 | 31.8% |
| 45 to 54 Years | 0 | 0.0% |
| 55 to 64 Years | 0 | 0.0% |
| 65 to 74 Years | 27 | 42.9% |
| 75 to 84 Years | 0 | 0.0% |
| 85 Years and Over | 0 | 0.0% |
| Total | 63 | 100.0% |
Housing Finances in Mingoville
Median Income by Occupancy in Mingoville
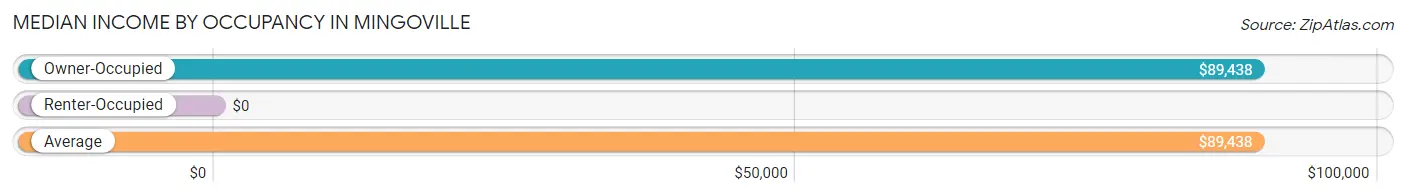
| Occupancy Type | # Households | Median Income |
| Owner-Occupied | 63 (100.0%) | $89,438 |
| Renter-Occupied | 0 (0.0%) | $0 |
| Average | 63 (100.0%) | $89,438 |
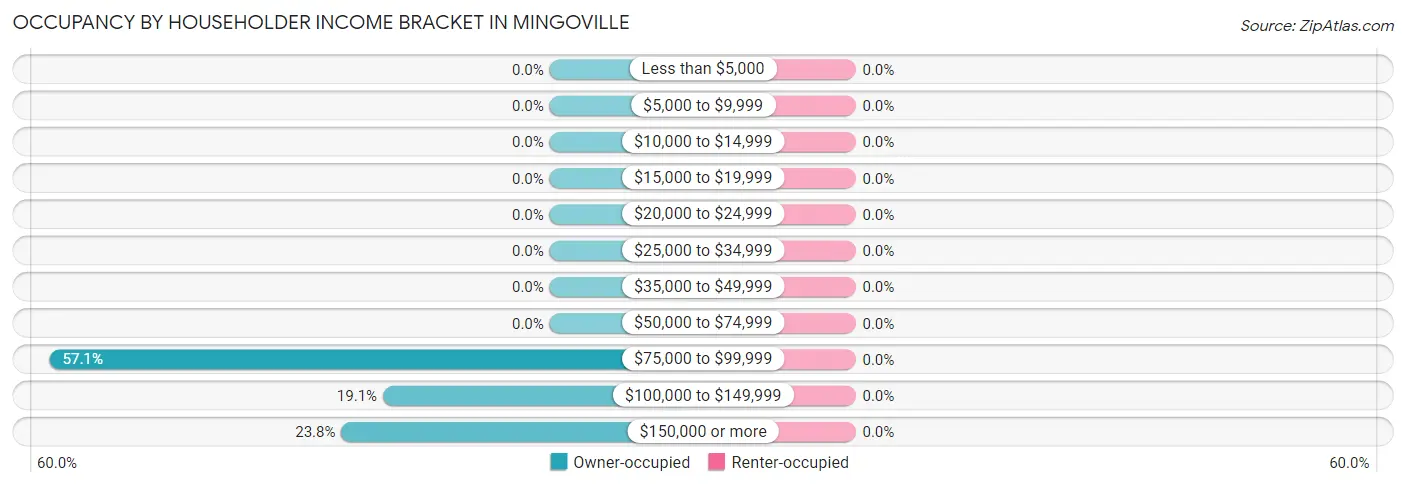
Occupancy by Householder Income Bracket in Mingoville
| Income Bracket | Owner-occupied | Renter-occupied |
| Less than $5,000 | 0 (0.0%) | 0 (0.0%) |
| $5,000 to $9,999 | 0 (0.0%) | 0 (0.0%) |
| $10,000 to $14,999 | 0 (0.0%) | 0 (0.0%) |
| $15,000 to $19,999 | 0 (0.0%) | 0 (0.0%) |
| $20,000 to $24,999 | 0 (0.0%) | 0 (0.0%) |
| $25,000 to $34,999 | 0 (0.0%) | 0 (0.0%) |
| $35,000 to $49,999 | 0 (0.0%) | 0 (0.0%) |
| $50,000 to $74,999 | 0 (0.0%) | 0 (0.0%) |
| $75,000 to $99,999 | 36 (57.1%) | 0 (0.0%) |
| $100,000 to $149,999 | 12 (19.1%) | 0 (0.0%) |
| $150,000 or more | 15 (23.8%) | 0 (0.0%) |
| Total | 63 (100.0%) | 0 (0.0%) |
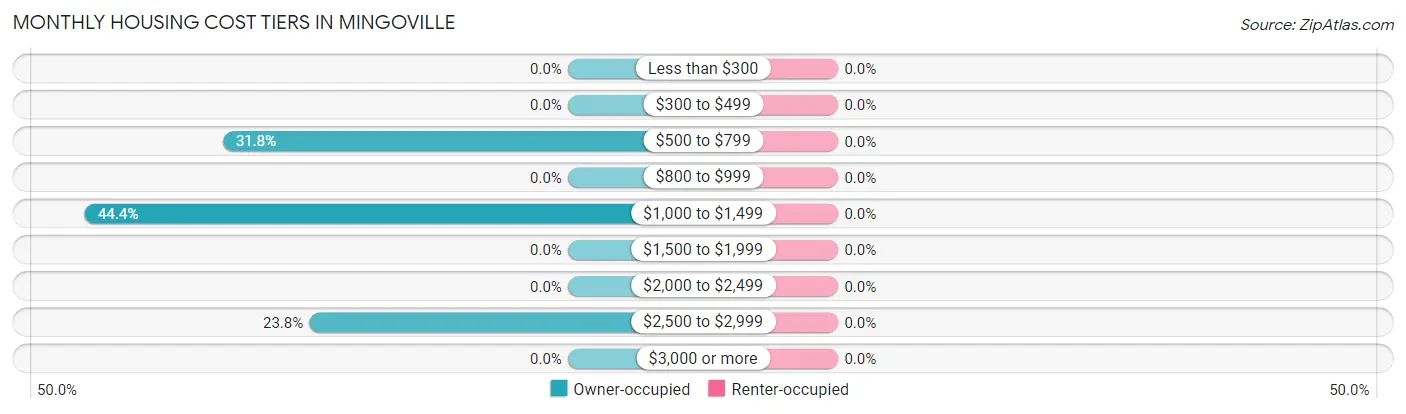
Monthly Housing Cost Tiers in Mingoville
| Monthly Cost | Owner-occupied | Renter-occupied |
| Less than $300 | 0 (0.0%) | 0 (0.0%) |
| $300 to $499 | 0 (0.0%) | 0 (0.0%) |
| $500 to $799 | 20 (31.8%) | 0 (0.0%) |
| $800 to $999 | 0 (0.0%) | 0 (0.0%) |
| $1,000 to $1,499 | 28 (44.4%) | 0 (0.0%) |
| $1,500 to $1,999 | 0 (0.0%) | 0 (0.0%) |
| $2,000 to $2,499 | 0 (0.0%) | 0 (0.0%) |
| $2,500 to $2,999 | 15 (23.8%) | 0 (0.0%) |
| $3,000 or more | 0 (0.0%) | 0 (0.0%) |
| Total | 63 (100.0%) | 0 (0.0%) |
Physical Housing Characteristics in Mingoville
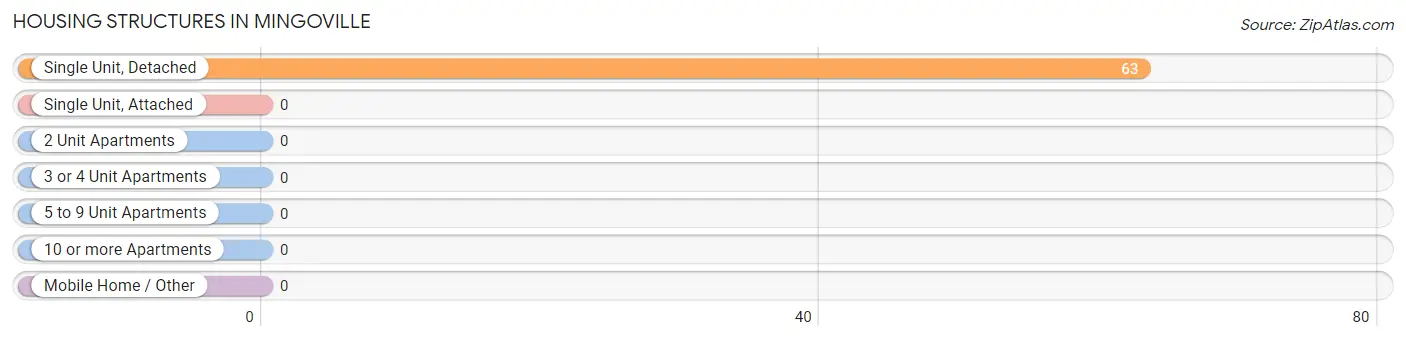
Housing Structures in Mingoville
| Structure Type | # Housing Units | % Housing Units |
| Single Unit, Detached | 63 | 100.0% |
| Single Unit, Attached | 0 | 0.0% |
| 2 Unit Apartments | 0 | 0.0% |
| 3 or 4 Unit Apartments | 0 | 0.0% |
| 5 to 9 Unit Apartments | 0 | 0.0% |
| 10 or more Apartments | 0 | 0.0% |
| Mobile Home / Other | 0 | 0.0% |
| Total | 63 | 100.0% |
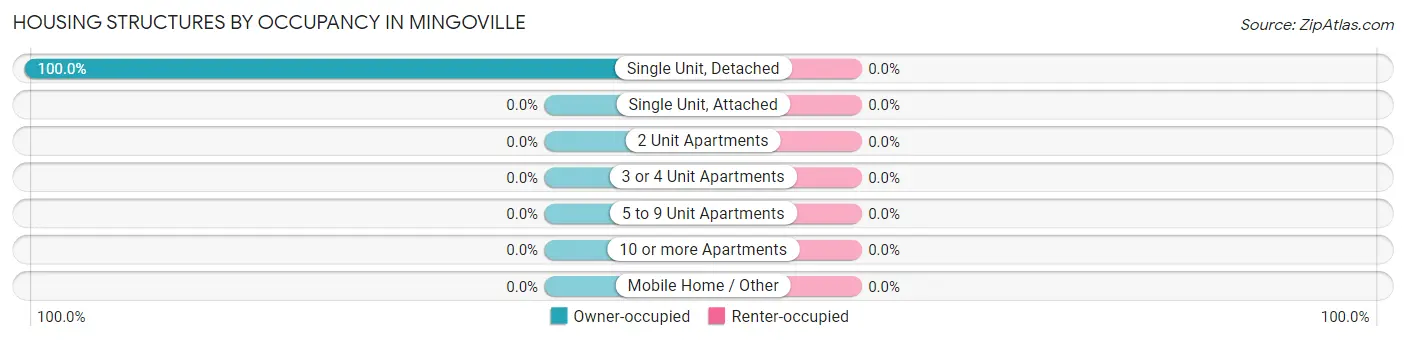
Housing Structures by Occupancy in Mingoville
| Structure Type | Owner-occupied | Renter-occupied |
| Single Unit, Detached | 63 (100.0%) | 0 (0.0%) |
| Single Unit, Attached | 0 (0.0%) | 0 (0.0%) |
| 2 Unit Apartments | 0 (0.0%) | 0 (0.0%) |
| 3 or 4 Unit Apartments | 0 (0.0%) | 0 (0.0%) |
| 5 to 9 Unit Apartments | 0 (0.0%) | 0 (0.0%) |
| 10 or more Apartments | 0 (0.0%) | 0 (0.0%) |
| Mobile Home / Other | 0 (0.0%) | 0 (0.0%) |
| Total | 63 (100.0%) | 0 (0.0%) |
Housing Structures by Number of Rooms in Mingoville
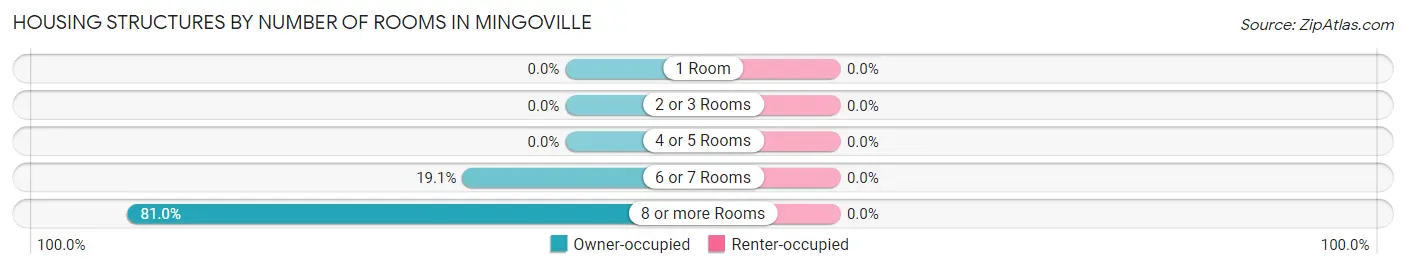
| Number of Rooms | Owner-occupied | Renter-occupied |
| 1 Room | 0 (0.0%) | 0 (0.0%) |
| 2 or 3 Rooms | 0 (0.0%) | 0 (0.0%) |
| 4 or 5 Rooms | 0 (0.0%) | 0 (0.0%) |
| 6 or 7 Rooms | 12 (19.1%) | 0 (0.0%) |
| 8 or more Rooms | 51 (80.9%) | 0 (0.0%) |
| Total | 63 (100.0%) | 0 (0.0%) |
Housing Structure by Heating Type in Mingoville
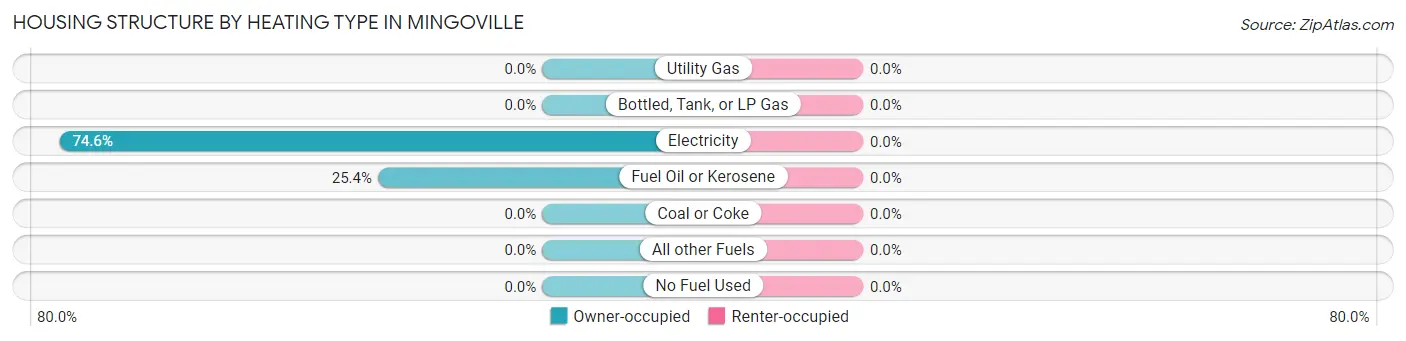
| Heating Type | Owner-occupied | Renter-occupied |
| Utility Gas | 0 (0.0%) | 0 (0.0%) |
| Bottled, Tank, or LP Gas | 0 (0.0%) | 0 (0.0%) |
| Electricity | 47 (74.6%) | 0 (0.0%) |
| Fuel Oil or Kerosene | 16 (25.4%) | 0 (0.0%) |
| Coal or Coke | 0 (0.0%) | 0 (0.0%) |
| All other Fuels | 0 (0.0%) | 0 (0.0%) |
| No Fuel Used | 0 (0.0%) | 0 (0.0%) |
| Total | 63 (100.0%) | 0 (0.0%) |
Household Vehicle Usage in Mingoville
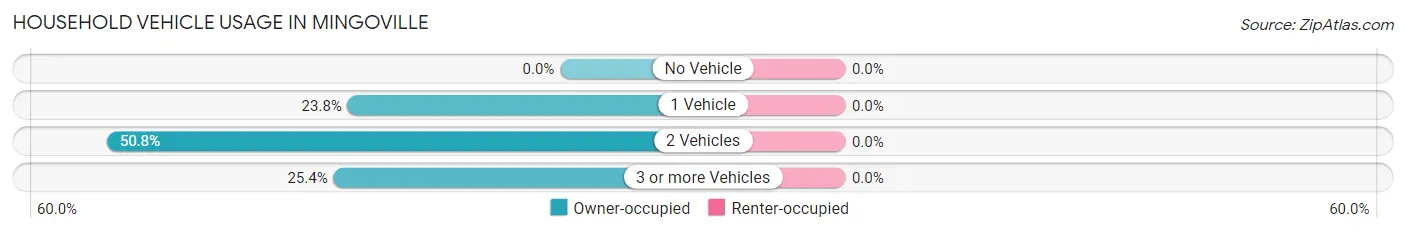
| Vehicles per Household | Owner-occupied | Renter-occupied |
| No Vehicle | 0 (0.0%) | 0 (0.0%) |
| 1 Vehicle | 15 (23.8%) | 0 (0.0%) |
| 2 Vehicles | 32 (50.8%) | 0 (0.0%) |
| 3 or more Vehicles | 16 (25.4%) | 0 (0.0%) |
| Total | 63 (100.0%) | 0 (0.0%) |
Real Estate & Mortgages in Mingoville
Real Estate and Mortgage Overview in Mingoville
| Characteristic | Without Mortgage | With Mortgage |
| Housing Units | 20 | 43 |
| Median Property Value | - | - |
| Median Household Income | - | - |
| Monthly Housing Costs | - | - |
| Real Estate Taxes | - | - |
Property Value by Mortgage Status in Mingoville
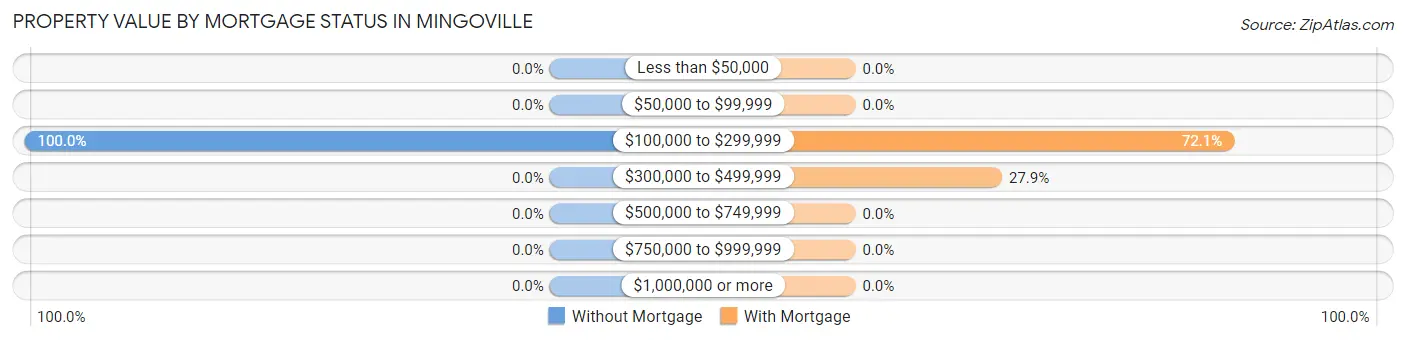
| Property Value | Without Mortgage | With Mortgage |
| Less than $50,000 | 0 (0.0%) | 0 (0.0%) |
| $50,000 to $99,999 | 0 (0.0%) | 0 (0.0%) |
| $100,000 to $299,999 | 20 (100.0%) | 31 (72.1%) |
| $300,000 to $499,999 | 0 (0.0%) | 12 (27.9%) |
| $500,000 to $749,999 | 0 (0.0%) | 0 (0.0%) |
| $750,000 to $999,999 | 0 (0.0%) | 0 (0.0%) |
| $1,000,000 or more | 0 (0.0%) | 0 (0.0%) |
| Total | 20 (100.0%) | 43 (100.0%) |
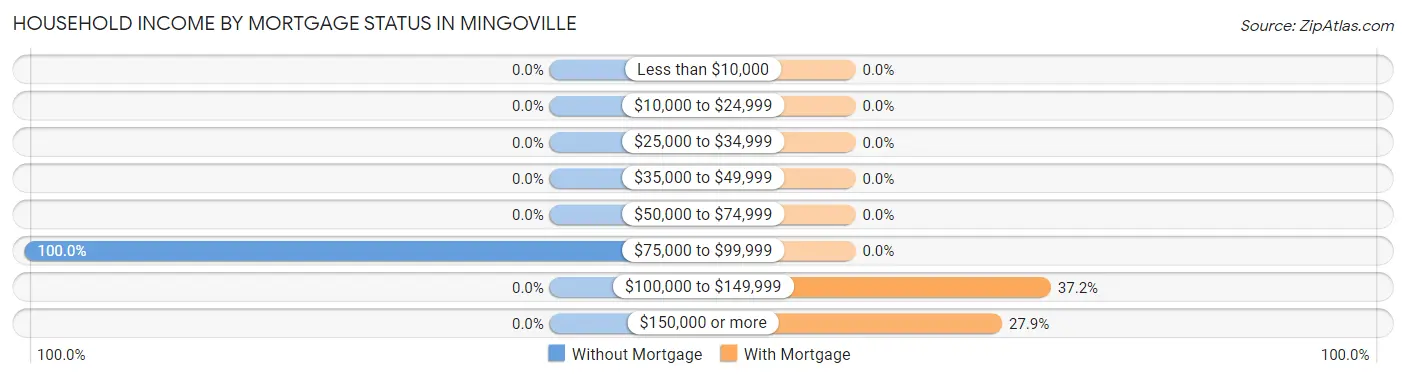
Household Income by Mortgage Status in Mingoville
| Household Income | Without Mortgage | With Mortgage |
| Less than $10,000 | 0 (0.0%) | 0 (0.0%) |
| $10,000 to $24,999 | 0 (0.0%) | 0 (0.0%) |
| $25,000 to $34,999 | 0 (0.0%) | 0 (0.0%) |
| $35,000 to $49,999 | 0 (0.0%) | 0 (0.0%) |
| $50,000 to $74,999 | 0 (0.0%) | 0 (0.0%) |
| $75,000 to $99,999 | 20 (100.0%) | 0 (0.0%) |
| $100,000 to $149,999 | 0 (0.0%) | 16 (37.2%) |
| $150,000 or more | 0 (0.0%) | 12 (27.9%) |
| Total | 20 (100.0%) | 43 (100.0%) |
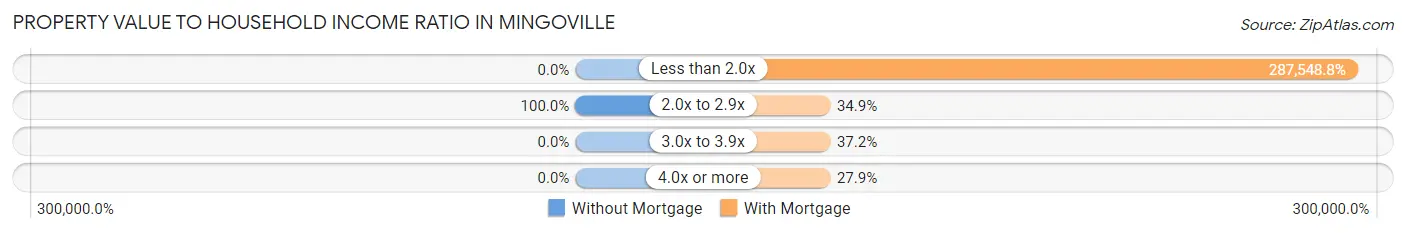
Property Value to Household Income Ratio in Mingoville
| Value-to-Income Ratio | Without Mortgage | With Mortgage |
| Less than 2.0x | 0 (0.0%) | 123,646 (287,548.8%) |
| 2.0x to 2.9x | 20 (100.0%) | 15 (34.9%) |
| 3.0x to 3.9x | 0 (0.0%) | 16 (37.2%) |
| 4.0x or more | 0 (0.0%) | 12 (27.9%) |
| Total | 20 (100.0%) | 43 (100.0%) |
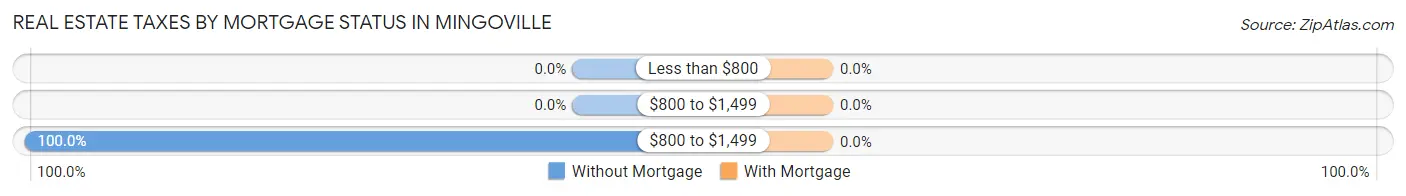
Real Estate Taxes by Mortgage Status in Mingoville
| Property Taxes | Without Mortgage | With Mortgage |
| Less than $800 | 0 (0.0%) | 0 (0.0%) |
| $800 to $1,499 | 0 (0.0%) | 0 (0.0%) |
| $800 to $1,499 | 20 (100.0%) | 0 (0.0%) |
| Total | 20 (100.0%) | 43 (100.0%) |
Health & Disability in Mingoville
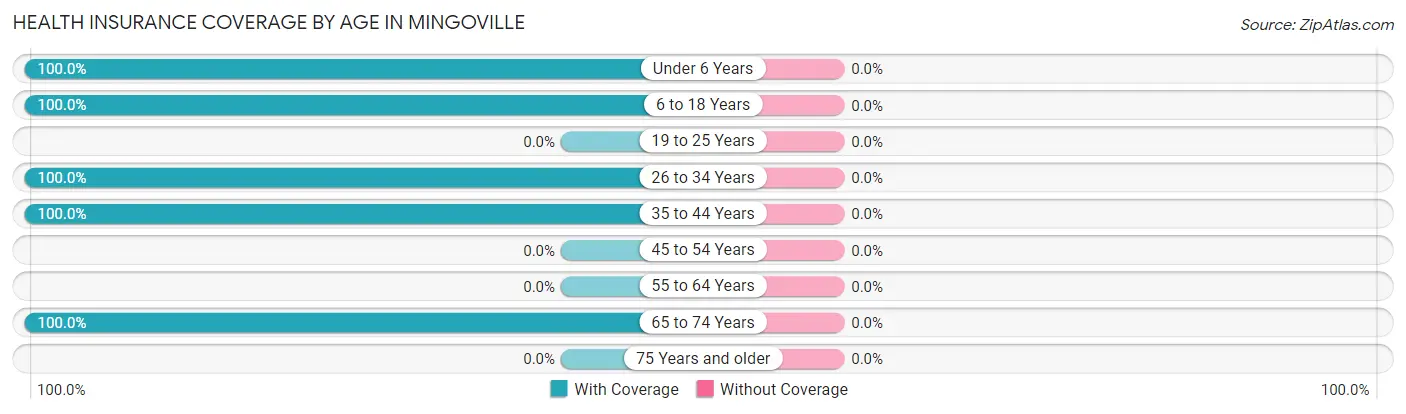
Health Insurance Coverage by Age in Mingoville
| Age Bracket | With Coverage | Without Coverage |
| Under 6 Years | 70 (100.0%) | 0 (0.0%) |
| 6 to 18 Years | 19 (100.0%) | 0 (0.0%) |
| 19 to 25 Years | 0 (0.0%) | 0 (0.0%) |
| 26 to 34 Years | 35 (100.0%) | 0 (0.0%) |
| 35 to 44 Years | 38 (100.0%) | 0 (0.0%) |
| 45 to 54 Years | 0 (0.0%) | 0 (0.0%) |
| 55 to 64 Years | 0 (0.0%) | 0 (0.0%) |
| 65 to 74 Years | 52 (100.0%) | 0 (0.0%) |
| 75 Years and older | 0 (0.0%) | 0 (0.0%) |
| Total | 214 (100.0%) | 0 (0.0%) |
Health Insurance Coverage by Citizenship Status in Mingoville
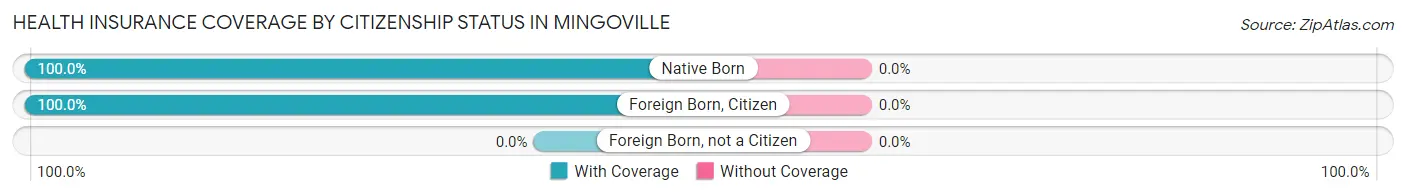
| Citizenship Status | With Coverage | Without Coverage |
| Native Born | 70 (100.0%) | 0 (0.0%) |
| Foreign Born, Citizen | 19 (100.0%) | 0 (0.0%) |
| Foreign Born, not a Citizen | 0 (0.0%) | 0 (0.0%) |
Health Insurance Coverage by Household Income in Mingoville
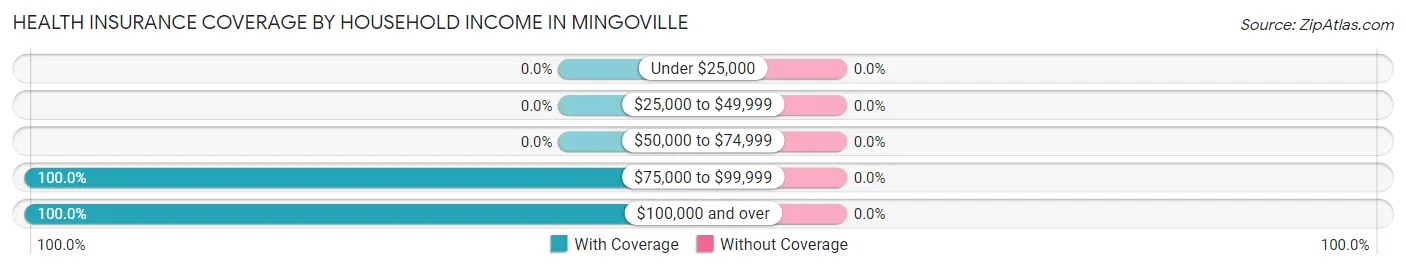
| Household Income | With Coverage | Without Coverage |
| Under $25,000 | 0 (0.0%) | 0 (0.0%) |
| $25,000 to $49,999 | 0 (0.0%) | 0 (0.0%) |
| $50,000 to $74,999 | 0 (0.0%) | 0 (0.0%) |
| $75,000 to $99,999 | 162 (100.0%) | 0 (0.0%) |
| $100,000 and over | 52 (100.0%) | 0 (0.0%) |
Public vs Private Health Insurance Coverage by Age in Mingoville
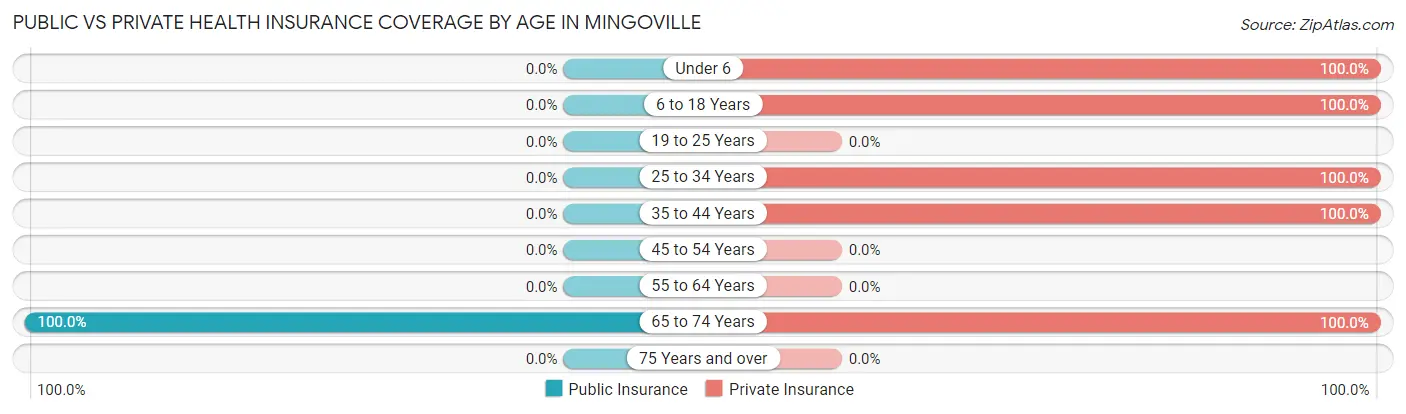
| Age Bracket | Public Insurance | Private Insurance |
| Under 6 | 0 (0.0%) | 70 (100.0%) |
| 6 to 18 Years | 0 (0.0%) | 19 (100.0%) |
| 19 to 25 Years | 0 (0.0%) | 0 (0.0%) |
| 25 to 34 Years | 0 (0.0%) | 35 (100.0%) |
| 35 to 44 Years | 0 (0.0%) | 38 (100.0%) |
| 45 to 54 Years | 0 (0.0%) | 0 (0.0%) |
| 55 to 64 Years | 0 (0.0%) | 0 (0.0%) |
| 65 to 74 Years | 52 (100.0%) | 52 (100.0%) |
| 75 Years and over | 0 (0.0%) | 0 (0.0%) |
| Total | 52 (24.3%) | 214 (100.0%) |
Disability Status by Sex by Age in Mingoville
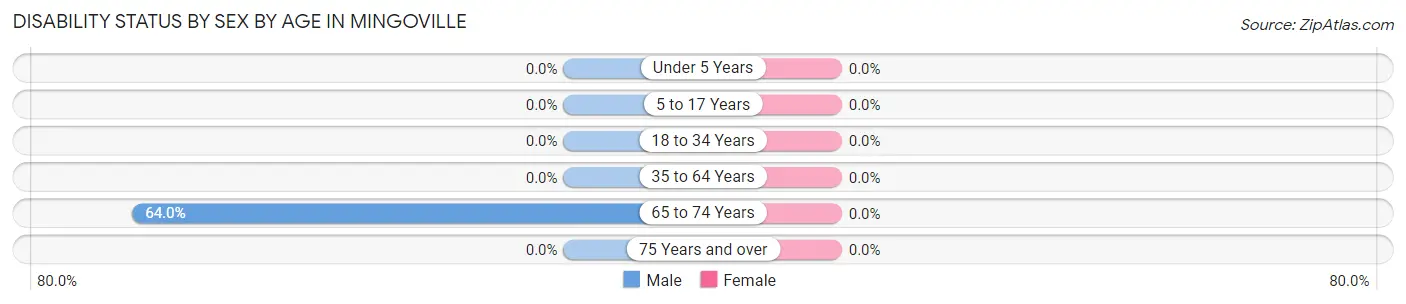
| Age Bracket | Male | Female |
| Under 5 Years | 0 (0.0%) | 0 (0.0%) |
| 5 to 17 Years | 0 (0.0%) | 0 (0.0%) |
| 18 to 34 Years | 0 (0.0%) | 0 (0.0%) |
| 35 to 64 Years | 0 (0.0%) | 0 (0.0%) |
| 65 to 74 Years | 16 (64.0%) | 0 (0.0%) |
| 75 Years and over | 0 (0.0%) | 0 (0.0%) |
Disability Class by Sex by Age in Mingoville
Disability Class: Hearing Difficulty
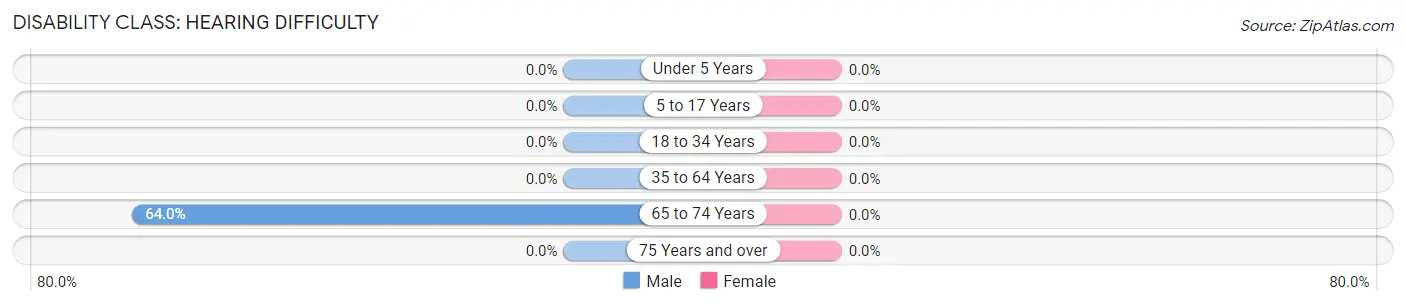
| Age Bracket | Male | Female |
| Under 5 Years | 0 (0.0%) | 0 (0.0%) |
| 5 to 17 Years | 0 (0.0%) | 0 (0.0%) |
| 18 to 34 Years | 0 (0.0%) | 0 (0.0%) |
| 35 to 64 Years | 0 (0.0%) | 0 (0.0%) |
| 65 to 74 Years | 16 (64.0%) | 0 (0.0%) |
| 75 Years and over | 0 (0.0%) | 0 (0.0%) |
Disability Class: Vision Difficulty
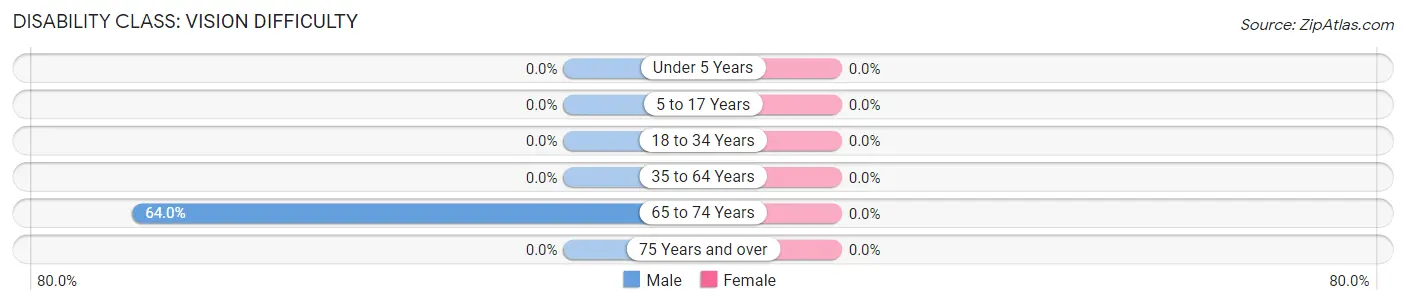
| Age Bracket | Male | Female |
| Under 5 Years | 0 (0.0%) | 0 (0.0%) |
| 5 to 17 Years | 0 (0.0%) | 0 (0.0%) |
| 18 to 34 Years | 0 (0.0%) | 0 (0.0%) |
| 35 to 64 Years | 0 (0.0%) | 0 (0.0%) |
| 65 to 74 Years | 16 (64.0%) | 0 (0.0%) |
| 75 Years and over | 0 (0.0%) | 0 (0.0%) |
Disability Class: Cognitive Difficulty
| Age Bracket | Male | Female |
| 5 to 17 Years | 0 (0.0%) | 0 (0.0%) |
| 18 to 34 Years | 0 (0.0%) | 0 (0.0%) |
| 35 to 64 Years | 0 (0.0%) | 0 (0.0%) |
| 65 to 74 Years | 0 (0.0%) | 0 (0.0%) |
| 75 Years and over | 0 (0.0%) | 0 (0.0%) |
Disability Class: Ambulatory Difficulty
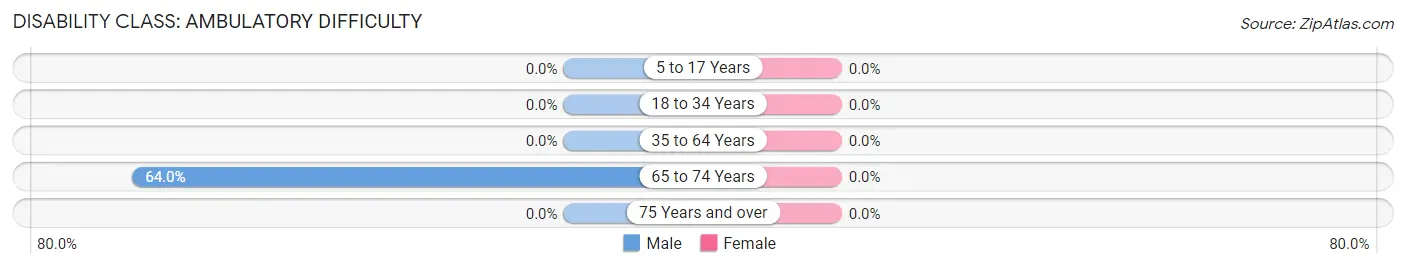
| Age Bracket | Male | Female |
| 5 to 17 Years | 0 (0.0%) | 0 (0.0%) |
| 18 to 34 Years | 0 (0.0%) | 0 (0.0%) |
| 35 to 64 Years | 0 (0.0%) | 0 (0.0%) |
| 65 to 74 Years | 16 (64.0%) | 0 (0.0%) |
| 75 Years and over | 0 (0.0%) | 0 (0.0%) |
Disability Class: Self-Care Difficulty
| Age Bracket | Male | Female |
| 5 to 17 Years | 0 (0.0%) | 0 (0.0%) |
| 18 to 34 Years | 0 (0.0%) | 0 (0.0%) |
| 35 to 64 Years | 0 (0.0%) | 0 (0.0%) |
| 65 to 74 Years | 0 (0.0%) | 0 (0.0%) |
| 75 Years and over | 0 (0.0%) | 0 (0.0%) |
Technology Access in Mingoville
Computing Device Access in Mingoville
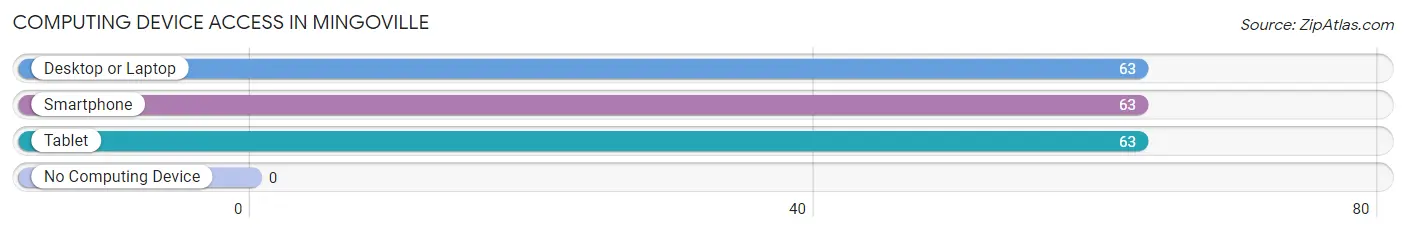
| Device Type | # Households | % Households |
| Desktop or Laptop | 63 | 100.0% |
| Smartphone | 63 | 100.0% |
| Tablet | 63 | 100.0% |
| No Computing Device | 0 | 0.0% |
| Total | 63 | 100.0% |
Internet Access in Mingoville
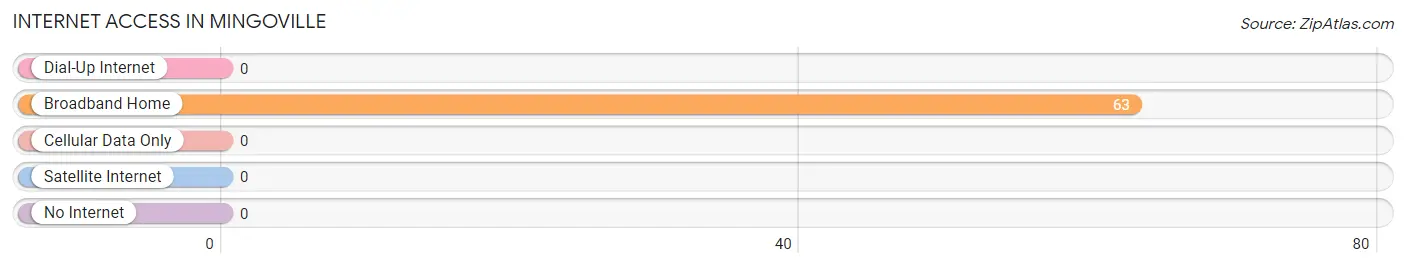
| Internet Type | # Households | % Households |
| Dial-Up Internet | 0 | 0.0% |
| Broadband Home | 63 | 100.0% |
| Cellular Data Only | 0 | 0.0% |
| Satellite Internet | 0 | 0.0% |
| No Internet | 0 | 0.0% |
| Total | 63 | 100.0% |
Mingoville Summary
Mingoville is a small borough located in Centre County, Pennsylvania, United States. It is situated in the Nittany Valley, approximately 8 miles south of State College and 8 miles north of Bellefonte. The population was 1,093 at the 2010 census.
History
Mingoville was founded in 1845 by John Mingo, a local farmer. The town was originally known as Mingo’s Crossroads, but was later changed to Mingoville. The town was incorporated in 1875.
Mingoville was a small farming community until the 1950s, when the population began to grow due to the influx of people from the nearby cities of State College and Bellefonte. The town has since become a bedroom community for the two cities, with many of its residents commuting to work in either one.
Geography
Mingoville is located at 40°48'17" North, 77°48'45" West (40.804722, -77.812500). According to the United States Census Bureau, the borough has a total area of 0.7 square miles, all of it land.
The borough is located in the Nittany Valley, which is part of the Ridge and Valley physiographic province of the Appalachian Mountains. The valley is surrounded by several ridges, including Bald Eagle Mountain to the east and Nittany Mountain to the west.
Economy
Mingoville’s economy is largely based on agriculture and tourism. The town is home to several small farms, which produce a variety of crops, including corn, soybeans, hay, and wheat. The town also has several small businesses, including a grocery store, a hardware store, and a few restaurants.
The town is also a popular tourist destination, due to its proximity to State College and Bellefonte. The town is home to several historic sites, including the Mingoville Historic District, which is listed on the National Register of Historic Places.
Demographics
As of the 2010 census, there were 1,093 people, 441 households, and 294 families residing in the borough. The population density was 1,541.4 people per square mile (595.2/km2). There were 471 housing units at an average density of 667.1 per square mile (257.7/km2). The racial makeup of the borough was 97.7% White, 0.5% African American, 0.2% Native American, 0.2% Asian, 0.2% from other races, and 1.2% from two or more races. Hispanic or Latino of any race were 0.7% of the population.
There were 441 households, out of which 28.2% had children under the age of 18 living with them, 51.6% were married couples living together, 9.3% had a female householder with no husband present, and 34.7% were non-families. 29.2% of all households were made up of individuals, and 11.6% had someone living alone who was 65 years of age or older. The average household size was 2.47 and the average family size was 3.06.
In the borough, the population was spread out, with 24.2% under the age of 18, 6.7% from 18 to 24, 28.2% from 25 to 44, 25.2% from 45 to 64, and 15.7% who were 65 years of age or older. The median age was 39 years. For every 100 females, there were 97.2 males. For every 100 females age 18 and over, there were 94.2 males.
The median income for a household in the borough was $41,250, and the median income for a family was $50,000. Males had a median income of $35,000 versus $25,000 for females. The per capita income for the borough was $20,945. About 4.2% of families and 6.2% of the population were below the poverty line, including 8.3% of those under age 18 and 4.2% of those age 65 or over.
Common Questions
What is Per Capita Income in Mingoville?
Per Capita income in Mingoville is $32,978.
What is the Median Family Income in Mingoville?
Median Family Income in Mingoville is $89,438.
What is the Median Household income in Mingoville?
Median Household Income in Mingoville is $89,438.
What is Inequality or Gini Index in Mingoville?
Inequality or Gini Index in Mingoville is 0.16.
What is the Total Population of Mingoville?
Total Population of Mingoville is 214.
What is the Total Male Population of Mingoville?
Total Male Population of Mingoville is 80.
What is the Total Female Population of Mingoville?
Total Female Population of Mingoville is 134.
What is the Ratio of Males per 100 Females in Mingoville?
There are 59.70 Males per 100 Females in Mingoville.
What is the Ratio of Females per 100 Males in Mingoville?
There are 167.50 Females per 100 Males in Mingoville.
What is the Median Population Age in Mingoville?
Median Population Age in Mingoville is 32.1 Years.
What is the Average Family Size in Mingoville
Average Family Size in Mingoville is 3.4 People.
What is the Average Household Size in Mingoville
Average Household Size in Mingoville is 3.4 People.
How Large is the Labor Force in Mingoville?
There are 69 People in the Labor Forcein in Mingoville.
What is the Percentage of People in the Labor Force in Mingoville?
55.2% of People are in the Labor Force in Mingoville.