Hartly, DE Map & Demographics
Hartly Map
Hartly Overview
$47,549
PER CAPITA INCOME
$143,494
AVG FAMILY INCOME
$143,153
AVG HOUSEHOLD INCOME
59.7%
WAGE / INCOME GAP [ % ]
40.3¢/ $1
WAGE / INCOME GAP [ $ ]
0.17
INEQUALITY / GINI INDEX
161
TOTAL POPULATION
118
MALE POPULATION
43
FEMALE POPULATION
274.42
MALES / 100 FEMALES
36.44
FEMALES / 100 MALES
43.4
MEDIAN AGE
2.7
AVG FAMILY SIZE
2.5
AVG HOUSEHOLD SIZE
69
LABOR FORCE [ PEOPLE ]
42.9%
PERCENT IN LABOR FORCE
Hartly Zip Codes
Hartly Area Codes
Income in Hartly
Income Overview in Hartly
Per Capita Income in Hartly is $47,549, while median incomes of families and households are $143,494 and $143,153 respectively.
| Characteristic | Number | Measure |
| Per Capita Income | 161 | $47,549 |
| Median Family Income | 53 | $143,494 |
| Mean Family Income | 53 | $132,357 |
| Median Household Income | 65 | $143,153 |
| Mean Household Income | 65 | $117,842 |
| Income Deficit | 53 | $0 |
| Wage / Income Gap (%) | 161 | 59.73% |
| Wage / Income Gap ($) | 161 | 40.27¢ per $1 |
| Gini / Inequality Index | 161 | 0.17 |
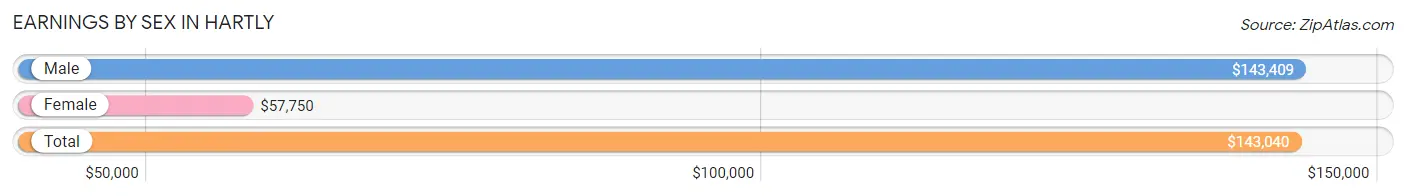
Earnings by Sex in Hartly
Average Earnings in Hartly are $143,040, $143,409 for men and $57,750 for women, a difference of 59.7%.
| Sex | Number | Average Earnings |
| Male | 56 (81.2%) | $143,409 |
| Female | 13 (18.8%) | $57,750 |
| Total | 69 (100.0%) | $143,040 |
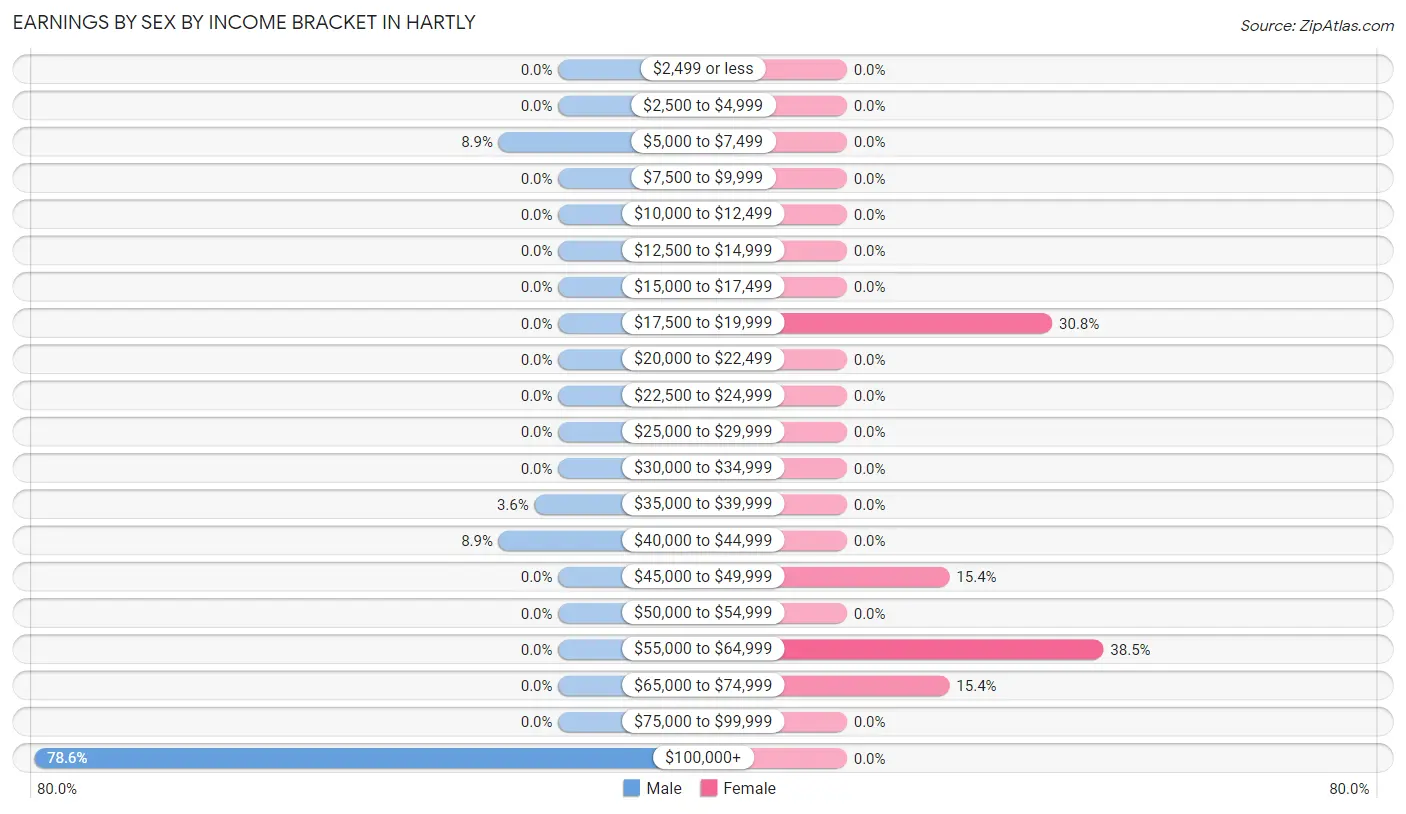
Earnings by Sex by Income Bracket in Hartly
The most common earnings brackets in Hartly are $100,000+ for men (44 | 78.6%) and $55,000 to $64,999 for women (5 | 38.5%).
| Income | Male | Female |
| $2,499 or less | 0 (0.0%) | 0 (0.0%) |
| $2,500 to $4,999 | 0 (0.0%) | 0 (0.0%) |
| $5,000 to $7,499 | 5 (8.9%) | 0 (0.0%) |
| $7,500 to $9,999 | 0 (0.0%) | 0 (0.0%) |
| $10,000 to $12,499 | 0 (0.0%) | 0 (0.0%) |
| $12,500 to $14,999 | 0 (0.0%) | 0 (0.0%) |
| $15,000 to $17,499 | 0 (0.0%) | 0 (0.0%) |
| $17,500 to $19,999 | 0 (0.0%) | 4 (30.8%) |
| $20,000 to $22,499 | 0 (0.0%) | 0 (0.0%) |
| $22,500 to $24,999 | 0 (0.0%) | 0 (0.0%) |
| $25,000 to $29,999 | 0 (0.0%) | 0 (0.0%) |
| $30,000 to $34,999 | 0 (0.0%) | 0 (0.0%) |
| $35,000 to $39,999 | 2 (3.6%) | 0 (0.0%) |
| $40,000 to $44,999 | 5 (8.9%) | 0 (0.0%) |
| $45,000 to $49,999 | 0 (0.0%) | 2 (15.4%) |
| $50,000 to $54,999 | 0 (0.0%) | 0 (0.0%) |
| $55,000 to $64,999 | 0 (0.0%) | 5 (38.5%) |
| $65,000 to $74,999 | 0 (0.0%) | 2 (15.4%) |
| $75,000 to $99,999 | 0 (0.0%) | 0 (0.0%) |
| $100,000+ | 44 (78.6%) | 0 (0.0%) |
| Total | 56 (100.0%) | 13 (100.0%) |
Earnings by Sex by Educational Attainment in Hartly
| Educational Attainment | Male Income | Female Income |
| Less than High School | - | - |
| High School Diploma | - | - |
| College or Associate's Degree | - | - |
| Bachelor's Degree | - | - |
| Graduate Degree | - | - |
| Total | $143,409 | $57,750 |
Family Income in Hartly
Family Income Brackets in Hartly
According to the Hartly family income data, there are 49 families falling into the $100,000 to $149,999 income range, which is the most common income bracket and makes up 92.4% of all families.
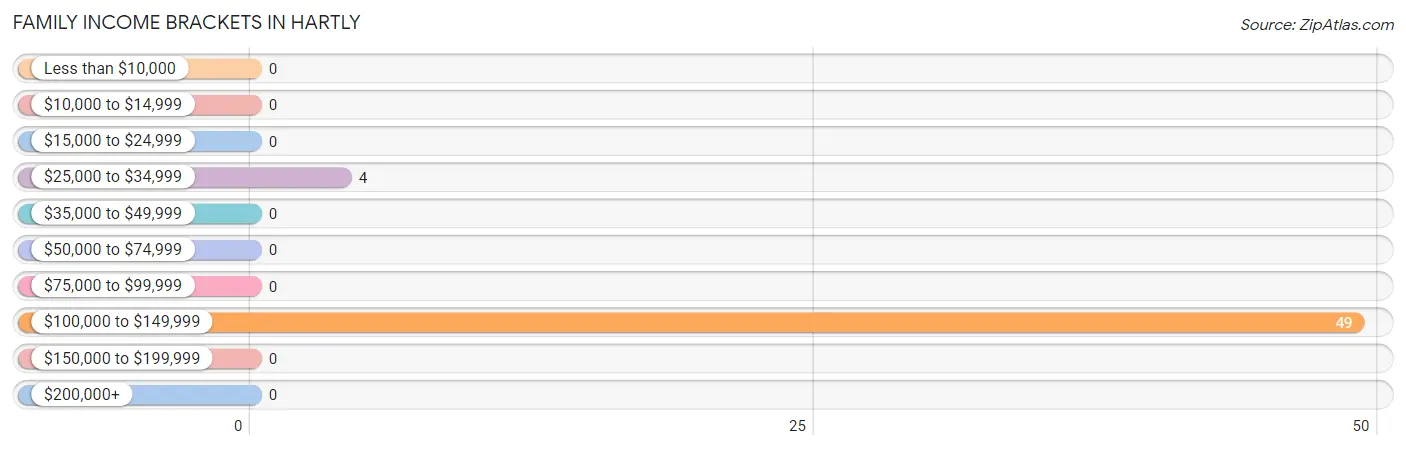
| Income Bracket | # Families | % Families |
| Less than $10,000 | 0 | 0.0% |
| $10,000 to $14,999 | 0 | 0.0% |
| $15,000 to $24,999 | 0 | 0.0% |
| $25,000 to $34,999 | 4 | 7.5% |
| $35,000 to $49,999 | 0 | 0.0% |
| $50,000 to $74,999 | 0 | 0.0% |
| $75,000 to $99,999 | 0 | 0.0% |
| $100,000 to $149,999 | 49 | 92.5% |
| $150,000 to $199,999 | 0 | 0.0% |
| $200,000+ | 0 | 0.0% |
Family Income by Famaliy Size in Hartly
| Income Bracket | # Families | Median Income |
| 2-Person Families | 9 (17.0%) | $0 |
| 3-Person Families | 0 (0.0%) | $0 |
| 4-Person Families | 44 (83.0%) | $0 |
| 5-Person Families | 0 (0.0%) | $0 |
| 6-Person Families | 0 (0.0%) | $0 |
| 7+ Person Families | 0 (0.0%) | $0 |
| Total | 53 (100.0%) | $143,494 |
Family Income by Number of Earners in Hartly
| Number of Earners | # Families | Median Income |
| No Earners | 3 (5.7%) | $0 |
| 1 Earner | 44 (83.0%) | $0 |
| 2 Earners | 6 (11.3%) | $0 |
| 3+ Earners | 0 (0.0%) | $0 |
| Total | 53 (100.0%) | $143,494 |
Household Income in Hartly
Household Income Brackets in Hartly
With 54 households falling in the category, the $100,000 to $149,999 income range is the most frequent in Hartly, accounting for 83.1% of all households.
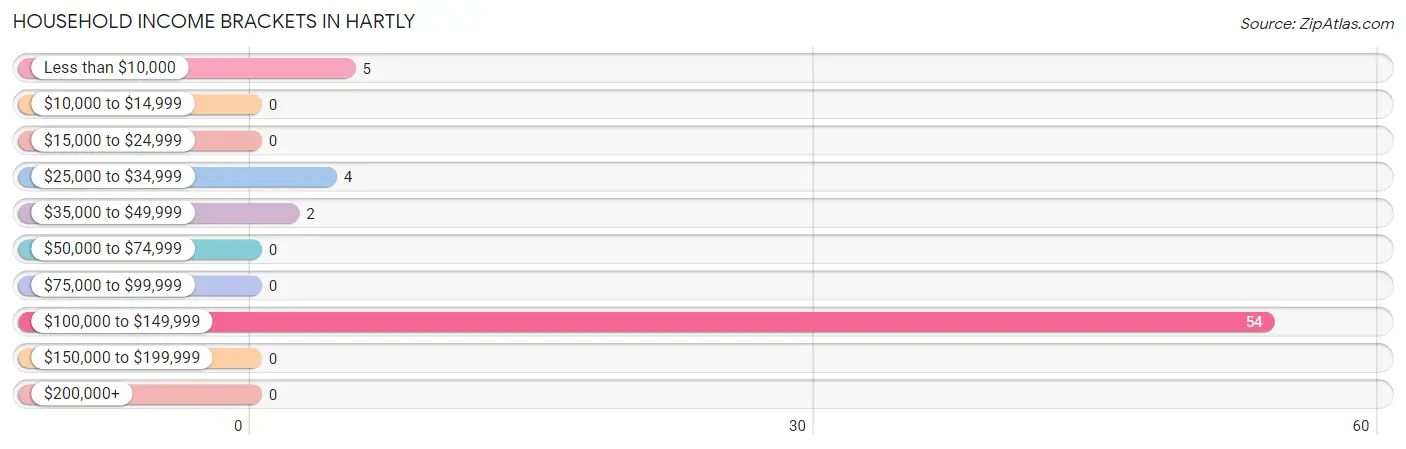
| Income Bracket | # Households | % Households |
| Less than $10,000 | 5 | 7.7% |
| $10,000 to $14,999 | 0 | 0.0% |
| $15,000 to $24,999 | 0 | 0.0% |
| $25,000 to $34,999 | 4 | 6.2% |
| $35,000 to $49,999 | 2 | 3.1% |
| $50,000 to $74,999 | 0 | 0.0% |
| $75,000 to $99,999 | 0 | 0.0% |
| $100,000 to $149,999 | 54 | 83.1% |
| $150,000 to $199,999 | 0 | 0.0% |
| $200,000+ | 0 | 0.0% |
Household Income by Householder Age in Hartly
The median household income in Hartly is $143,153, with the highest median household income of $143,438 found in the 45 to 64 years age bracket for the primary householder. A total of 55 households (84.6%) fall into this category.
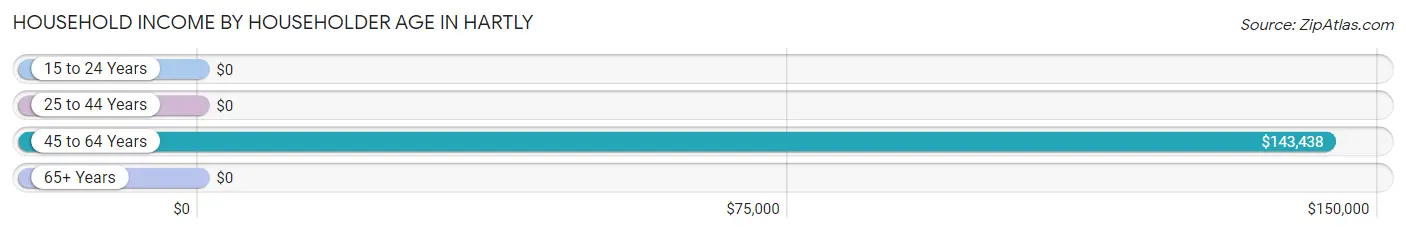
| Income Bracket | # Households | Median Income |
| 15 to 24 Years | 0 (0.0%) | $0 |
| 25 to 44 Years | 5 (7.7%) | $0 |
| 45 to 64 Years | 55 (84.6%) | $143,438 |
| 65+ Years | 5 (7.7%) | $0 |
| Total | 65 (100.0%) | $143,153 |
Poverty in Hartly
Income Below Poverty by Sex and Age in Hartly
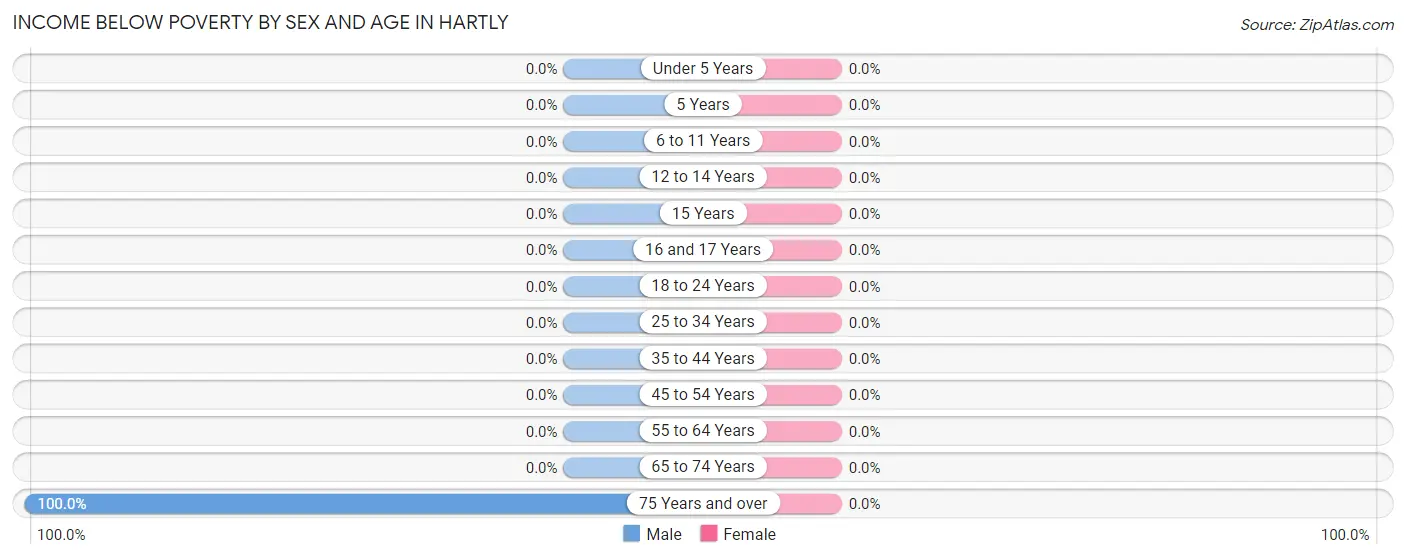
| Age Bracket | Male | Female |
| Under 5 Years | 0 (0.0%) | 0 (0.0%) |
| 5 Years | 0 (0.0%) | 0 (0.0%) |
| 6 to 11 Years | 0 (0.0%) | 0 (0.0%) |
| 12 to 14 Years | 0 (0.0%) | 0 (0.0%) |
| 15 Years | 0 (0.0%) | 0 (0.0%) |
| 16 and 17 Years | 0 (0.0%) | 0 (0.0%) |
| 18 to 24 Years | 0 (0.0%) | 0 (0.0%) |
| 25 to 34 Years | 0 (0.0%) | 0 (0.0%) |
| 35 to 44 Years | 0 (0.0%) | 0 (0.0%) |
| 45 to 54 Years | 0 (0.0%) | 0 (0.0%) |
| 55 to 64 Years | 0 (0.0%) | 0 (0.0%) |
| 65 to 74 Years | 0 (0.0%) | 0 (0.0%) |
| 75 Years and over | 5 (100.0%) | 0 (0.0%) |
| Total | 5 (4.2%) | 0 (0.0%) |
Income Above Poverty by Sex and Age in Hartly
According to the poverty statistics in Hartly, males aged 16 and 17 years and females aged 25 to 34 years are the age groups that are most secure financially, with 100.0% of males and 100.0% of females in these age groups living above the poverty line.
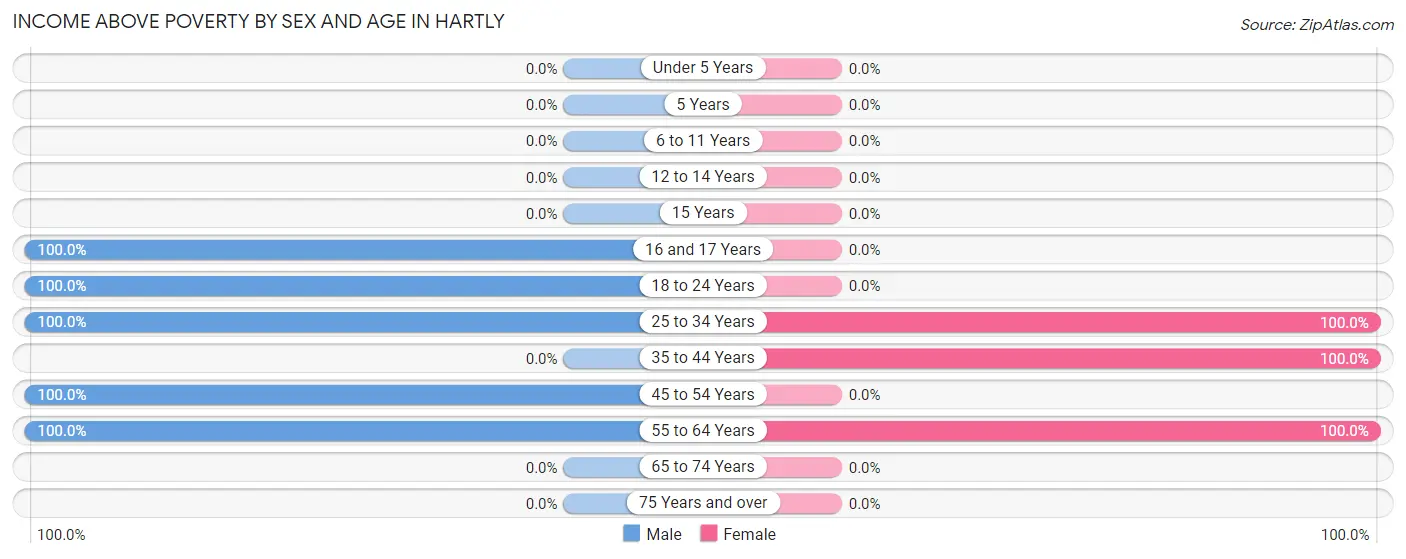
| Age Bracket | Male | Female |
| Under 5 Years | 0 (0.0%) | 0 (0.0%) |
| 5 Years | 0 (0.0%) | 0 (0.0%) |
| 6 to 11 Years | 0 (0.0%) | 0 (0.0%) |
| 12 to 14 Years | 0 (0.0%) | 0 (0.0%) |
| 15 Years | 0 (0.0%) | 0 (0.0%) |
| 16 and 17 Years | 12 (100.0%) | 0 (0.0%) |
| 18 to 24 Years | 42 (100.0%) | 0 (0.0%) |
| 25 to 34 Years | 10 (100.0%) | 5 (100.0%) |
| 35 to 44 Years | 0 (0.0%) | 28 (100.0%) |
| 45 to 54 Years | 44 (100.0%) | 0 (0.0%) |
| 55 to 64 Years | 5 (100.0%) | 10 (100.0%) |
| 65 to 74 Years | 0 (0.0%) | 0 (0.0%) |
| 75 Years and over | 0 (0.0%) | 0 (0.0%) |
| Total | 113 (95.8%) | 43 (100.0%) |
Income Below Poverty Among Married-Couple Families in Hartly
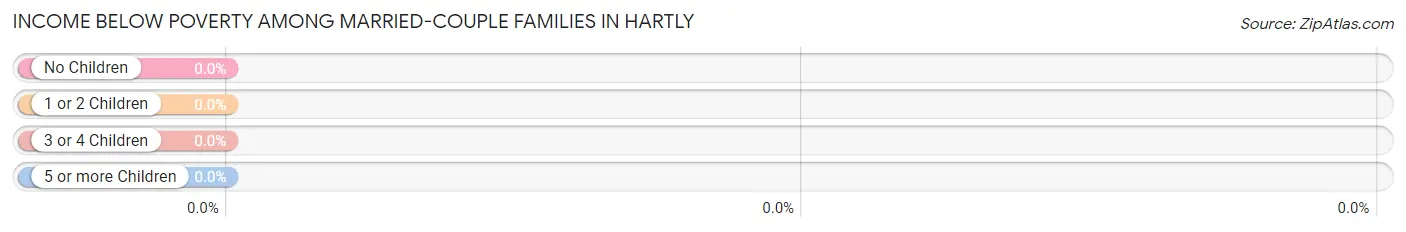
| Children | Above Poverty | Below Poverty |
| No Children | 5 (100.0%) | 0 (0.0%) |
| 1 or 2 Children | 44 (100.0%) | 0 (0.0%) |
| 3 or 4 Children | 0 (0.0%) | 0 (0.0%) |
| 5 or more Children | 0 (0.0%) | 0 (0.0%) |
| Total | 49 (100.0%) | 0 (0.0%) |
Income Below Poverty Among Single-Parent Households in Hartly
| Children | Single Father | Single Mother |
| No Children | 0 (0.0%) | 0 (0.0%) |
| 1 or 2 Children | 0 (0.0%) | 0 (0.0%) |
| 3 or 4 Children | 0 (0.0%) | 0 (0.0%) |
| 5 or more Children | 0 (0.0%) | 0 (0.0%) |
| Total | 0 (0.0%) | 0 (0.0%) |
Income Below Poverty Among Married-Couple vs Single-Parent Households in Hartly
| Children | Married-Couple Families | Single-Parent Households |
| No Children | 0 (0.0%) | 0 (0.0%) |
| 1 or 2 Children | 0 (0.0%) | 0 (0.0%) |
| 3 or 4 Children | 0 (0.0%) | 0 (0.0%) |
| 5 or more Children | 0 (0.0%) | 0 (0.0%) |
| Total | 0 (0.0%) | 0 (0.0%) |
Race in Hartly
The most populous races in Hartly are , and White / Caucasian (161 | 100.0%).
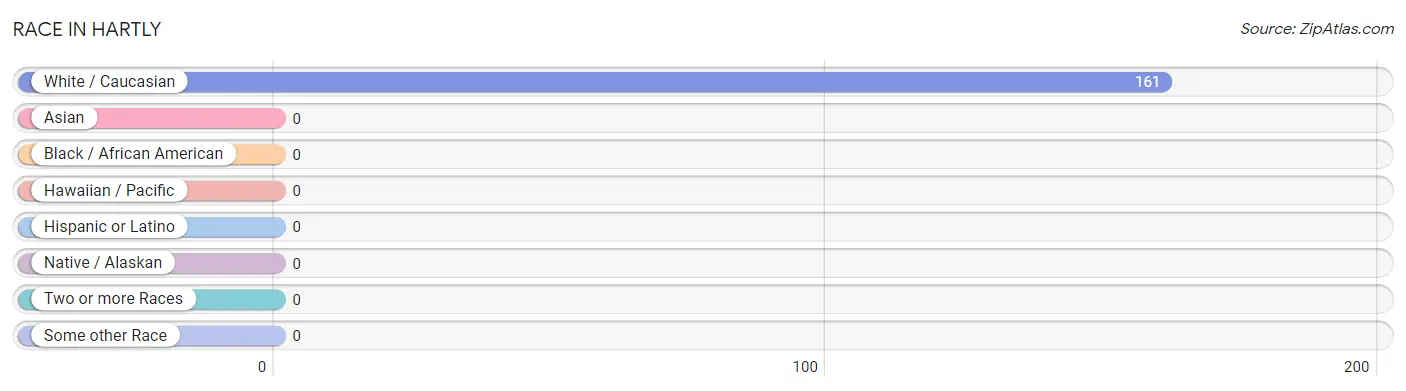
| Race | # Population | % Population |
| Asian | 0 | 0.0% |
| Black / African American | 0 | 0.0% |
| Hawaiian / Pacific | 0 | 0.0% |
| Hispanic or Latino | 0 | 0.0% |
| Native / Alaskan | 0 | 0.0% |
| White / Caucasian | 161 | 100.0% |
| Two or more Races | 0 | 0.0% |
| Some other Race | 0 | 0.0% |
| Total | 161 | 100.0% |
Ancestry in Hartly
The most populous ancestries reported in Hartly are German (128 | 79.5%), French (14 | 8.7%), American (10 | 6.2%), and Dutch (9 | 5.6%), together accounting for 100.0% of all Hartly residents.
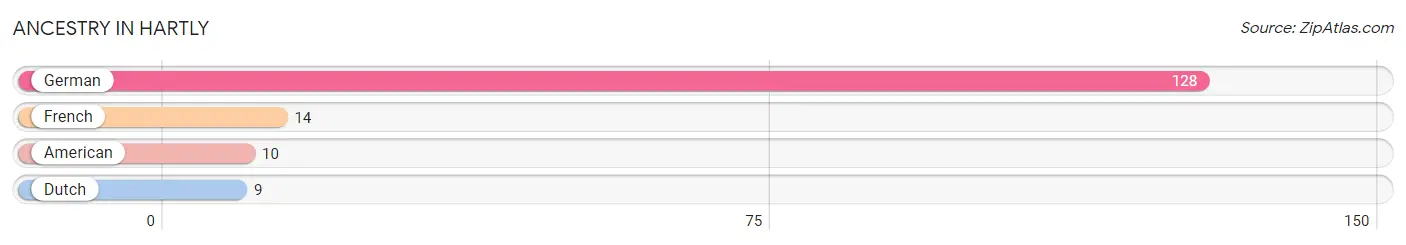
| Ancestry | # Population | % Population |
| American | 10 | 6.2% |
| Dutch | 9 | 5.6% |
| French | 14 | 8.7% |
| German | 128 | 79.5% | View All 4 Rows |
Immigrants in Hartly

| Immigration Origin | # Population | % Population | View All 0 Rows |
Sex and Age in Hartly
Sex and Age in Hartly
The most populous age groups in Hartly are 15 to 19 Years (54 | 45.8%) for men and 40 to 44 Years (28 | 65.1%) for women.
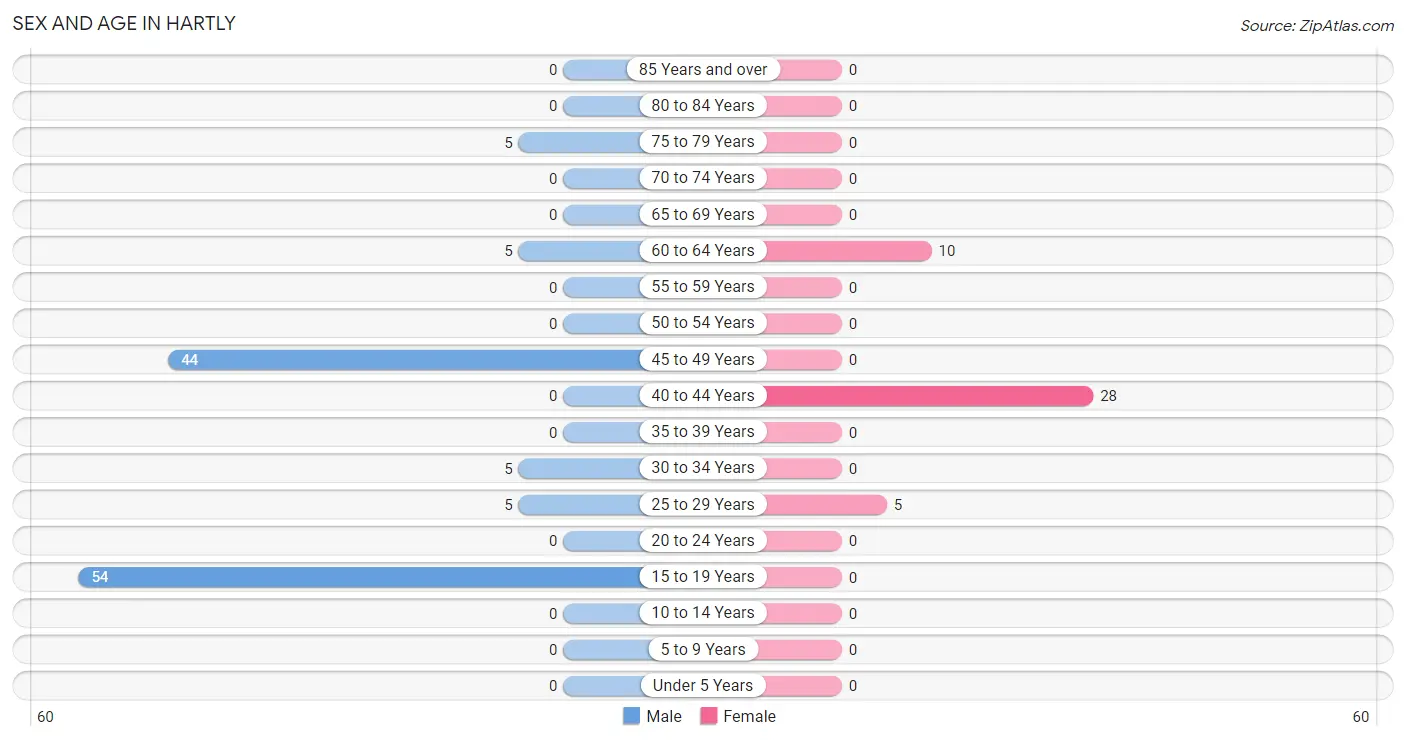
| Age Bracket | Male | Female |
| Under 5 Years | 0 (0.0%) | 0 (0.0%) |
| 5 to 9 Years | 0 (0.0%) | 0 (0.0%) |
| 10 to 14 Years | 0 (0.0%) | 0 (0.0%) |
| 15 to 19 Years | 54 (45.8%) | 0 (0.0%) |
| 20 to 24 Years | 0 (0.0%) | 0 (0.0%) |
| 25 to 29 Years | 5 (4.2%) | 5 (11.6%) |
| 30 to 34 Years | 5 (4.2%) | 0 (0.0%) |
| 35 to 39 Years | 0 (0.0%) | 0 (0.0%) |
| 40 to 44 Years | 0 (0.0%) | 28 (65.1%) |
| 45 to 49 Years | 44 (37.3%) | 0 (0.0%) |
| 50 to 54 Years | 0 (0.0%) | 0 (0.0%) |
| 55 to 59 Years | 0 (0.0%) | 0 (0.0%) |
| 60 to 64 Years | 5 (4.2%) | 10 (23.3%) |
| 65 to 69 Years | 0 (0.0%) | 0 (0.0%) |
| 70 to 74 Years | 0 (0.0%) | 0 (0.0%) |
| 75 to 79 Years | 5 (4.2%) | 0 (0.0%) |
| 80 to 84 Years | 0 (0.0%) | 0 (0.0%) |
| 85 Years and over | 0 (0.0%) | 0 (0.0%) |
| Total | 118 (100.0%) | 43 (100.0%) |
Families and Households in Hartly
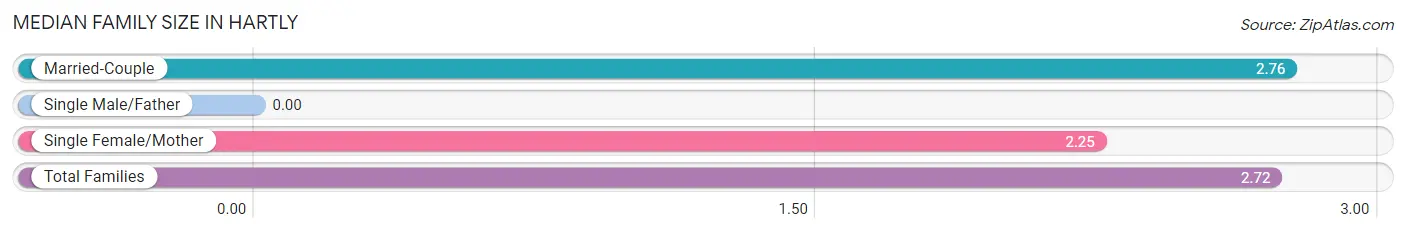
Median Family Size in Hartly
| Family Type | # Families | Family Size |
| Married-Couple | 49 (92.4%) | 2.76 |
| Single Male/Father | 0 (0.0%) | - |
| Single Female/Mother | 4 (7.5%) | 2.25 |
| Total Families | 53 (100.0%) | 2.72 |
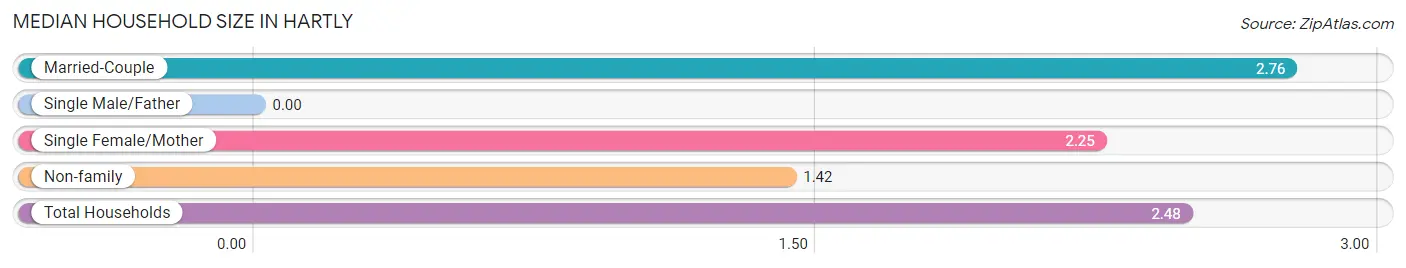
Median Household Size in Hartly
| Household Type | # Households | Household Size |
| Married-Couple | 49 (75.4%) | 2.76 |
| Single Male/Father | 0 (0.0%) | - |
| Single Female/Mother | 4 (6.1%) | 2.25 |
| Non-family | 12 (18.5%) | 1.42 |
| Total Households | 65 (100.0%) | 2.48 |
Household Size by Marriage Status in Hartly
Out of a total of 65 households in Hartly, 53 (81.5%) are family households, while 12 (18.5%) are nonfamily households. The most numerous type of family households are 4-person households, comprising 44, and the most common type of nonfamily households are 1-person households, comprising 7.
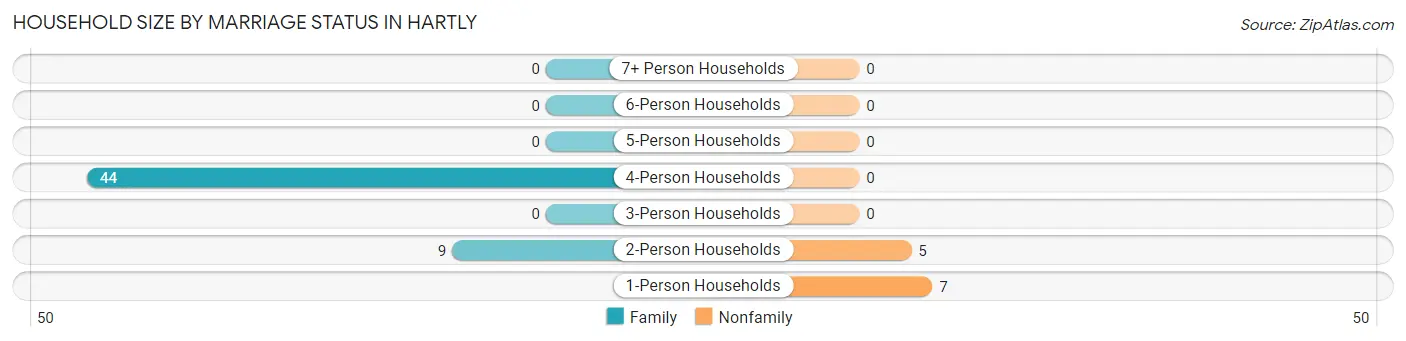
| Household Size | Family Households | Nonfamily Households |
| 1-Person Households | - | 7 (10.8%) |
| 2-Person Households | 9 (13.9%) | 5 (7.7%) |
| 3-Person Households | 0 (0.0%) | 0 (0.0%) |
| 4-Person Households | 44 (67.7%) | 0 (0.0%) |
| 5-Person Households | 0 (0.0%) | 0 (0.0%) |
| 6-Person Households | 0 (0.0%) | 0 (0.0%) |
| 7+ Person Households | 0 (0.0%) | 0 (0.0%) |
| Total | 53 (81.5%) | 12 (18.5%) |
Female Fertility in Hartly
Fertility by Age in Hartly
| Age Bracket | Women with Births | Births / 1,000 Women |
| 15 to 19 years | 0 (0.0%) | 0.0 |
| 20 to 34 years | 0 (0.0%) | 0.0 |
| 35 to 50 years | 0 (0.0%) | 0.0 |
| Total | 0 (0.0%) | 0.0 |
Fertility by Age by Marriage Status in Hartly
| Age Bracket | Married | Unmarried |
| 15 to 19 years | 0 (0.0%) | 0 (0.0%) |
| 20 to 34 years | 0 (0.0%) | 0 (0.0%) |
| 35 to 50 years | 0 (0.0%) | 0 (0.0%) |
| Total | 0 (0.0%) | 0 (0.0%) |
Fertility by Education in Hartly
| Educational Attainment | Women with Births | Births / 1,000 Women |
| Less than High School | 0 (0.0%) | 0.0 |
| High School Diploma | 0 (0.0%) | 0.0 |
| College or Associate's Degree | 0 (0.0%) | 0.0 |
| Bachelor's Degree | 0 (0.0%) | 0.0 |
| Graduate Degree | 0 (0.0%) | 0.0 |
| Total | 0 (0.0%) | 0.0 |
Fertility by Education by Marriage Status in Hartly
| Educational Attainment | Married | Unmarried |
| Less than High School | 0 (0.0%) | 0 (0.0%) |
| High School Diploma | 0 (0.0%) | 0 (0.0%) |
| College or Associate's Degree | 0 (0.0%) | 0 (0.0%) |
| Bachelor's Degree | 0 (0.0%) | 0 (0.0%) |
| Graduate Degree | 0 (0.0%) | 0 (0.0%) |
| Total | 0 (0.0%) | 0 (0.0%) |
Employment Characteristics in Hartly
Employment by Class of Employer in Hartly
Among the 69 employed individuals in Hartly, private company employees (60 | 87.0%), local government employees (5 | 7.2%), and state government employees (4 | 5.8%) make up the most common classes of employment.
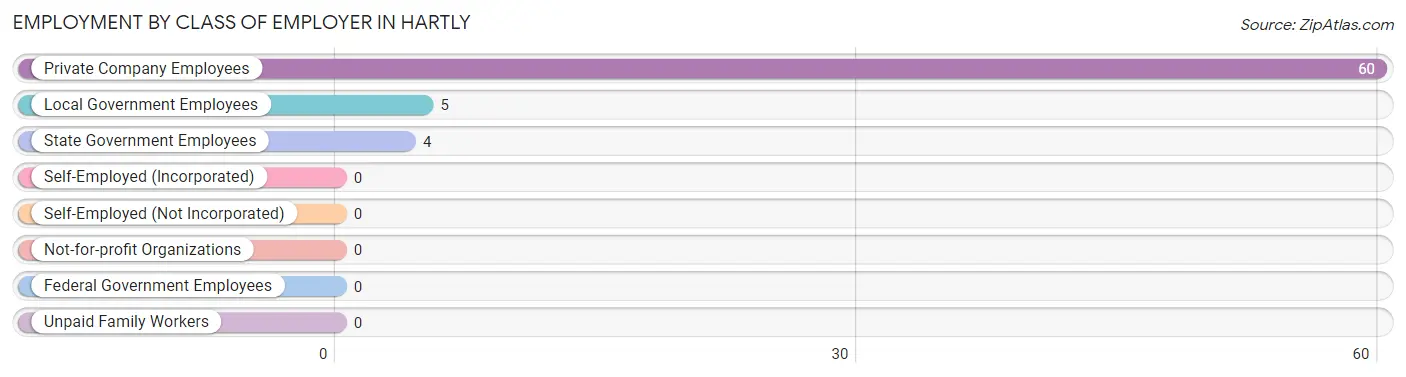
| Employer Class | # Employees | % Employees |
| Private Company Employees | 60 | 87.0% |
| Self-Employed (Incorporated) | 0 | 0.0% |
| Self-Employed (Not Incorporated) | 0 | 0.0% |
| Not-for-profit Organizations | 0 | 0.0% |
| Local Government Employees | 5 | 7.2% |
| State Government Employees | 4 | 5.8% |
| Federal Government Employees | 0 | 0.0% |
| Unpaid Family Workers | 0 | 0.0% |
| Total | 69 | 100.0% |
Employment Status by Age in Hartly
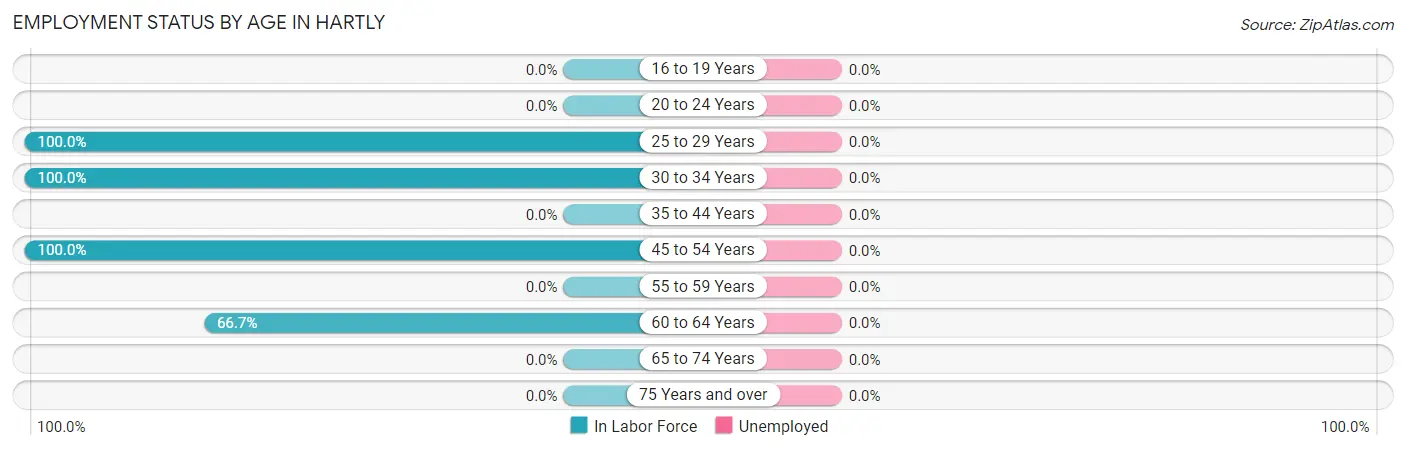
| Age Bracket | In Labor Force | Unemployed |
| 16 to 19 Years | 0 (0.0%) | 0 (0.0%) |
| 20 to 24 Years | 0 (0.0%) | 0 (0.0%) |
| 25 to 29 Years | 10 (100.0%) | 0 (0.0%) |
| 30 to 34 Years | 5 (100.0%) | 0 (0.0%) |
| 35 to 44 Years | 0 (0.0%) | 0 (0.0%) |
| 45 to 54 Years | 44 (100.0%) | 0 (0.0%) |
| 55 to 59 Years | 0 (0.0%) | 0 (0.0%) |
| 60 to 64 Years | 10 (66.7%) | 0 (0.0%) |
| 65 to 74 Years | 0 (0.0%) | 0 (0.0%) |
| 75 Years and over | 0 (0.0%) | 0 (0.0%) |
| Total | 69 (42.9%) | 0 (0.0%) |
Employment Status by Educational Attainment in Hartly
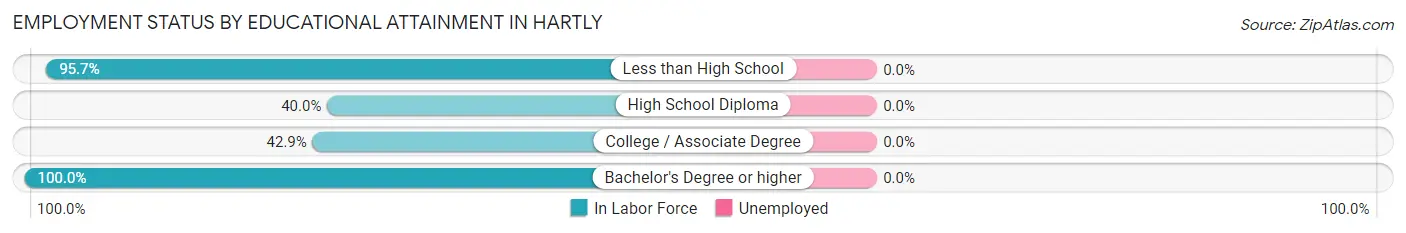
| Educational Attainment | In Labor Force | Unemployed |
| Less than High School | 44 (95.7%) | 0 (0.0%) |
| High School Diploma | 2 (40.0%) | 0 (0.0%) |
| College / Associate Degree | 21 (42.9%) | 0 (0.0%) |
| Bachelor's Degree or higher | 2 (100.0%) | 0 (0.0%) |
| Total | 69 (67.6%) | 0 (0.0%) |
Employment Occupations by Sex in Hartly
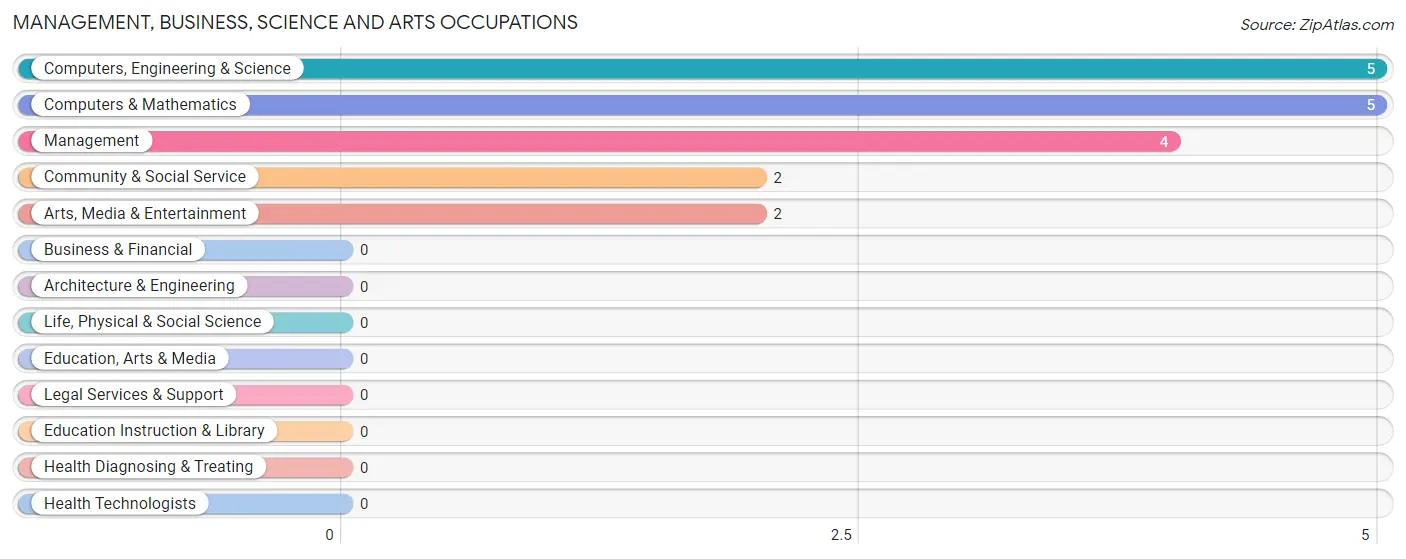
Management, Business, Science and Arts Occupations
The most common Management, Business, Science and Arts occupations in Hartly are Computers, Engineering & Science (5 | 7.2%), Computers & Mathematics (5 | 7.2%), Management (4 | 5.8%), Community & Social Service (2 | 2.9%), and Arts, Media & Entertainment (2 | 2.9%).
Management, Business, Science and Arts Occupations by Sex
Within the Management, Business, Science and Arts occupations in Hartly, the most male-oriented occupations are Computers, Engineering & Science (100.0%), and Computers & Mathematics (100.0%), while the most female-oriented occupations are Management (100.0%), Community & Social Service (100.0%), and Arts, Media & Entertainment (100.0%).
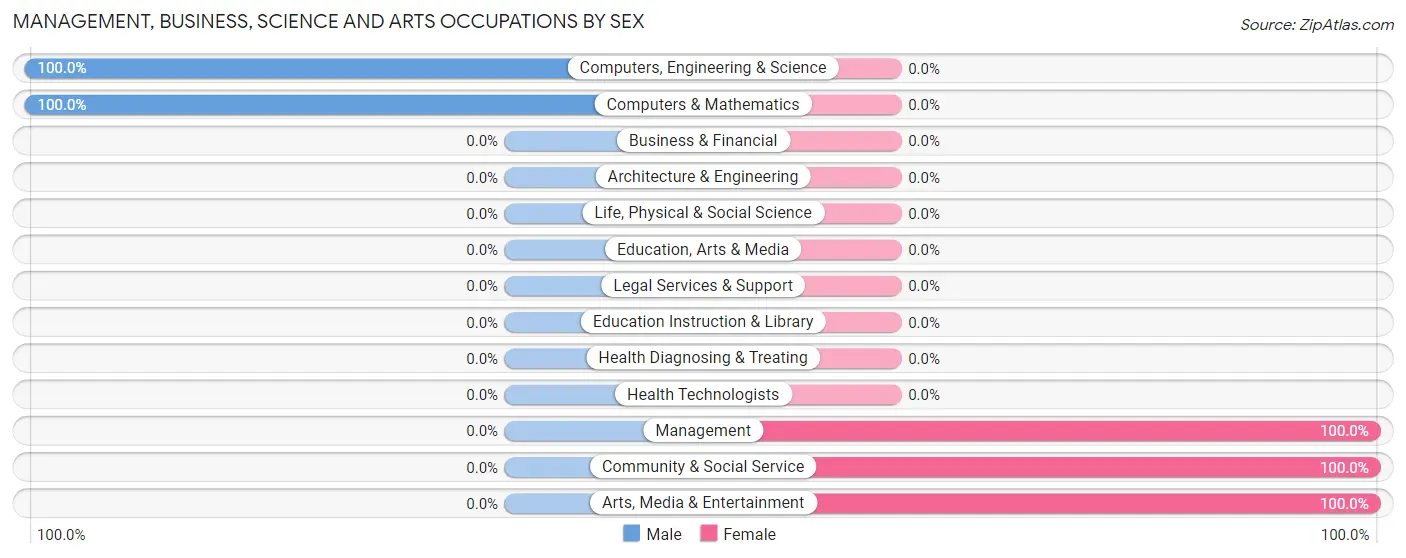
| Occupation | Male | Female |
| Management | 0 (0.0%) | 4 (100.0%) |
| Business & Financial | 0 (0.0%) | 0 (0.0%) |
| Computers, Engineering & Science | 5 (100.0%) | 0 (0.0%) |
| Computers & Mathematics | 5 (100.0%) | 0 (0.0%) |
| Architecture & Engineering | 0 (0.0%) | 0 (0.0%) |
| Life, Physical & Social Science | 0 (0.0%) | 0 (0.0%) |
| Community & Social Service | 0 (0.0%) | 2 (100.0%) |
| Education, Arts & Media | 0 (0.0%) | 0 (0.0%) |
| Legal Services & Support | 0 (0.0%) | 0 (0.0%) |
| Education Instruction & Library | 0 (0.0%) | 0 (0.0%) |
| Arts, Media & Entertainment | 0 (0.0%) | 2 (100.0%) |
| Health Diagnosing & Treating | 0 (0.0%) | 0 (0.0%) |
| Health Technologists | 0 (0.0%) | 0 (0.0%) |
| Total (Category) | 5 (45.5%) | 6 (54.5%) |
| Total (Overall) | 56 (81.2%) | 13 (18.8%) |
Services Occupations
The most common Services occupations in Hartly are Healthcare Support (5 | 7.2%), Food Preparation & Serving (5 | 7.2%), and Cleaning & Maintenance (2 | 2.9%).
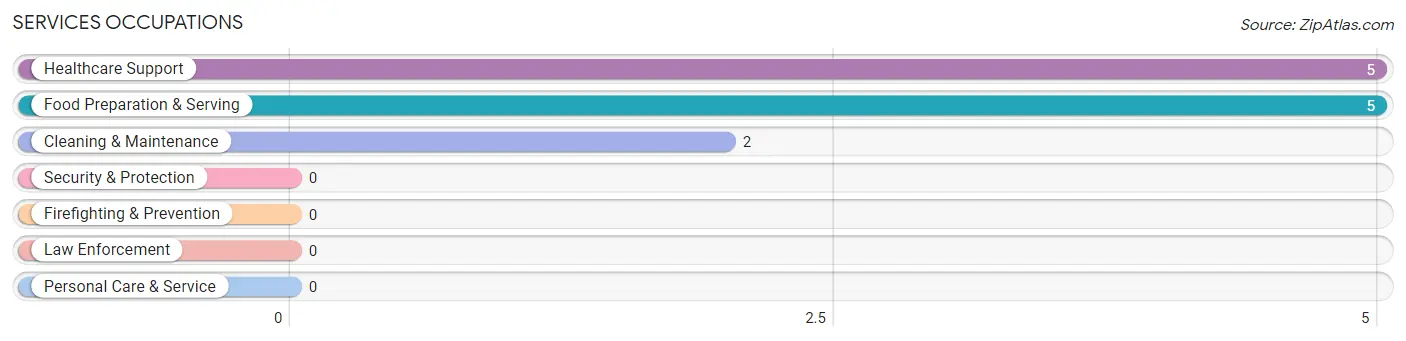
Services Occupations by Sex
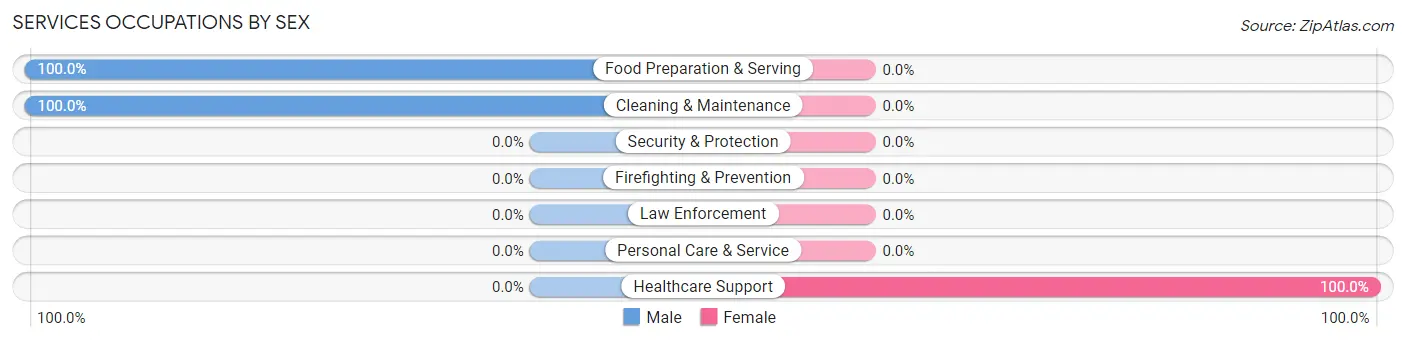
| Occupation | Male | Female |
| Healthcare Support | 0 (0.0%) | 5 (100.0%) |
| Security & Protection | 0 (0.0%) | 0 (0.0%) |
| Firefighting & Prevention | 0 (0.0%) | 0 (0.0%) |
| Law Enforcement | 0 (0.0%) | 0 (0.0%) |
| Food Preparation & Serving | 5 (100.0%) | 0 (0.0%) |
| Cleaning & Maintenance | 2 (100.0%) | 0 (0.0%) |
| Personal Care & Service | 0 (0.0%) | 0 (0.0%) |
| Total (Category) | 7 (58.3%) | 5 (41.7%) |
| Total (Overall) | 56 (81.2%) | 13 (18.8%) |
Sales and Office Occupations
The most common Sales and Office occupations in Hartly are , and Sales & Related (2 | 2.9%).
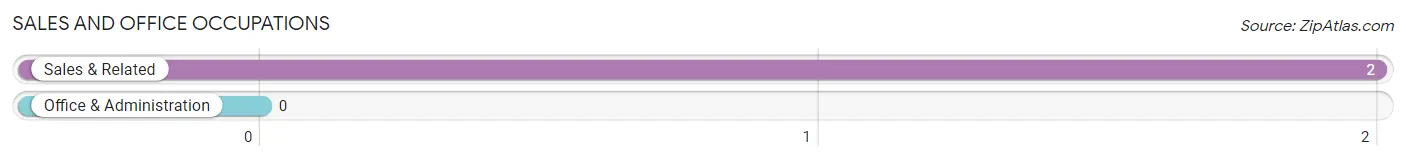
Sales and Office Occupations by Sex
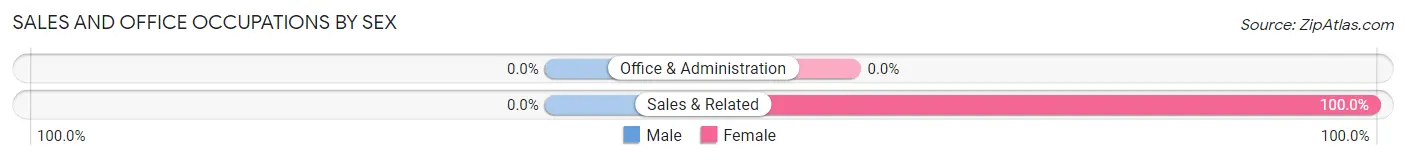
| Occupation | Male | Female |
| Sales & Related | 0 (0.0%) | 2 (100.0%) |
| Office & Administration | 0 (0.0%) | 0 (0.0%) |
| Total (Category) | 0 (0.0%) | 2 (100.0%) |
| Total (Overall) | 56 (81.2%) | 13 (18.8%) |
Natural Resources, Construction and Maintenance Occupations
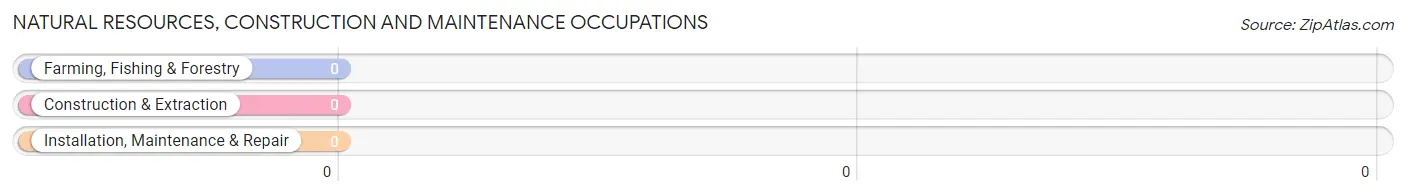
Natural Resources, Construction and Maintenance Occupations by Sex
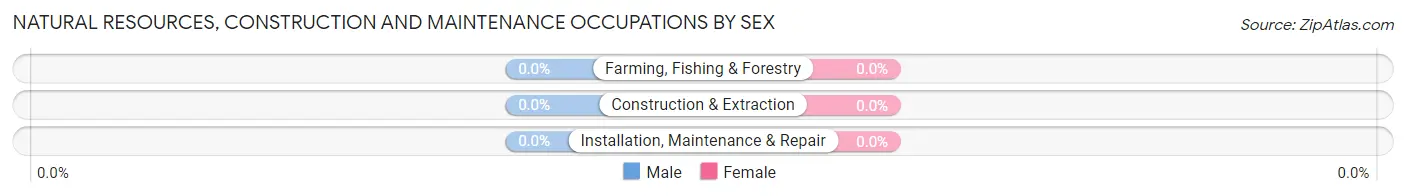
| Occupation | Male | Female |
| Farming, Fishing & Forestry | 0 (0.0%) | 0 (0.0%) |
| Construction & Extraction | 0 (0.0%) | 0 (0.0%) |
| Installation, Maintenance & Repair | 0 (0.0%) | 0 (0.0%) |
| Total (Category) | 0 (0.0%) | 0 (0.0%) |
| Total (Overall) | 56 (81.2%) | 13 (18.8%) |
Production, Transportation and Moving Occupations
The most common Production, Transportation and Moving occupations in Hartly are , and Material Moving (44 | 63.8%).
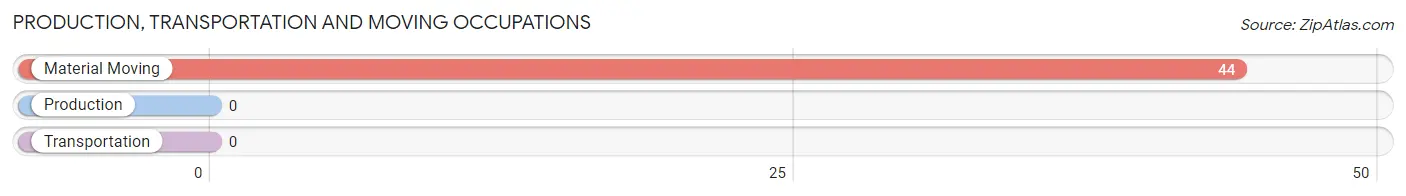
Production, Transportation and Moving Occupations by Sex
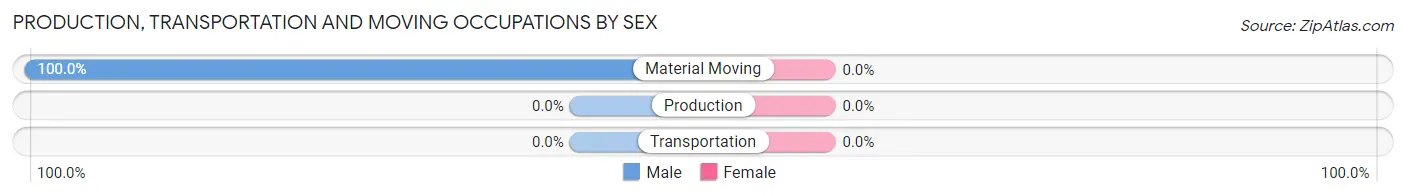
| Occupation | Male | Female |
| Production | 0 (0.0%) | 0 (0.0%) |
| Transportation | 0 (0.0%) | 0 (0.0%) |
| Material Moving | 44 (100.0%) | 0 (0.0%) |
| Total (Category) | 44 (100.0%) | 0 (0.0%) |
| Total (Overall) | 56 (81.2%) | 13 (18.8%) |
Employment Industries by Sex in Hartly
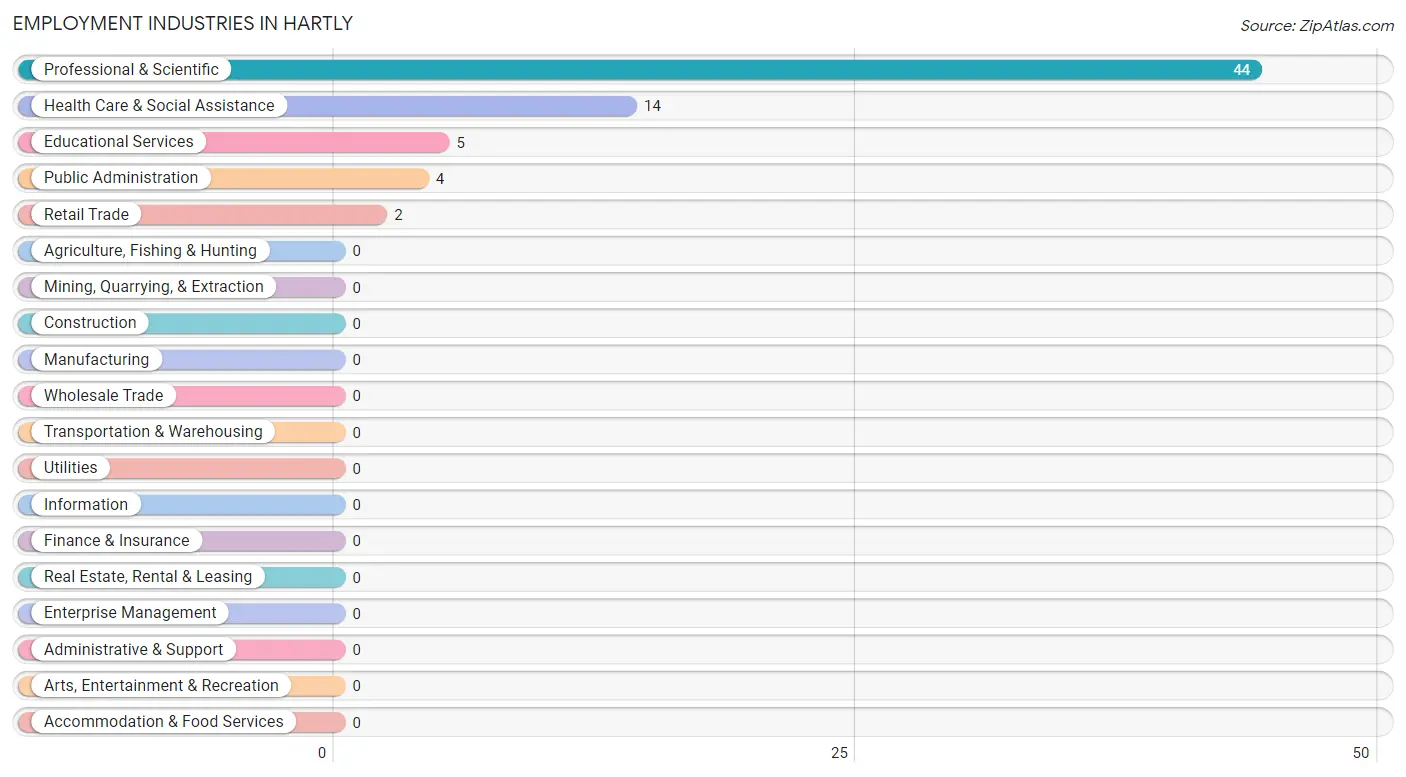
Employment Industries in Hartly
The major employment industries in Hartly include Professional & Scientific (44 | 63.8%), Health Care & Social Assistance (14 | 20.3%), Educational Services (5 | 7.2%), Public Administration (4 | 5.8%), and Retail Trade (2 | 2.9%).
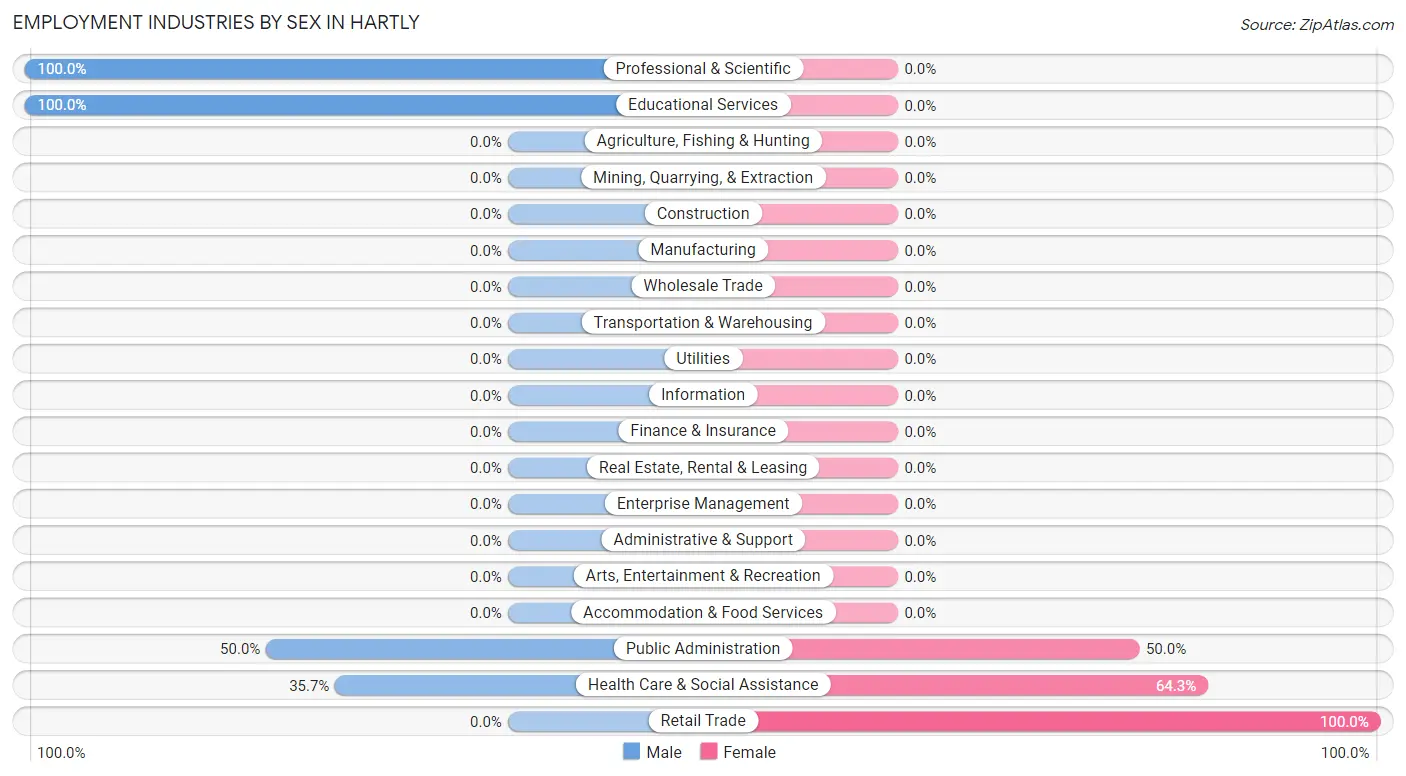
Employment Industries by Sex in Hartly
The Hartly industries that see more men than women are Professional & Scientific (100.0%), Educational Services (100.0%), and Public Administration (50.0%), whereas the industries that tend to have a higher number of women are Retail Trade (100.0%), Health Care & Social Assistance (64.3%), and Public Administration (50.0%).
| Industry | Male | Female |
| Agriculture, Fishing & Hunting | 0 (0.0%) | 0 (0.0%) |
| Mining, Quarrying, & Extraction | 0 (0.0%) | 0 (0.0%) |
| Construction | 0 (0.0%) | 0 (0.0%) |
| Manufacturing | 0 (0.0%) | 0 (0.0%) |
| Wholesale Trade | 0 (0.0%) | 0 (0.0%) |
| Retail Trade | 0 (0.0%) | 2 (100.0%) |
| Transportation & Warehousing | 0 (0.0%) | 0 (0.0%) |
| Utilities | 0 (0.0%) | 0 (0.0%) |
| Information | 0 (0.0%) | 0 (0.0%) |
| Finance & Insurance | 0 (0.0%) | 0 (0.0%) |
| Real Estate, Rental & Leasing | 0 (0.0%) | 0 (0.0%) |
| Professional & Scientific | 44 (100.0%) | 0 (0.0%) |
| Enterprise Management | 0 (0.0%) | 0 (0.0%) |
| Administrative & Support | 0 (0.0%) | 0 (0.0%) |
| Educational Services | 5 (100.0%) | 0 (0.0%) |
| Health Care & Social Assistance | 5 (35.7%) | 9 (64.3%) |
| Arts, Entertainment & Recreation | 0 (0.0%) | 0 (0.0%) |
| Accommodation & Food Services | 0 (0.0%) | 0 (0.0%) |
| Public Administration | 2 (50.0%) | 2 (50.0%) |
| Total | 56 (81.2%) | 13 (18.8%) |
Education in Hartly
School Enrollment in Hartly
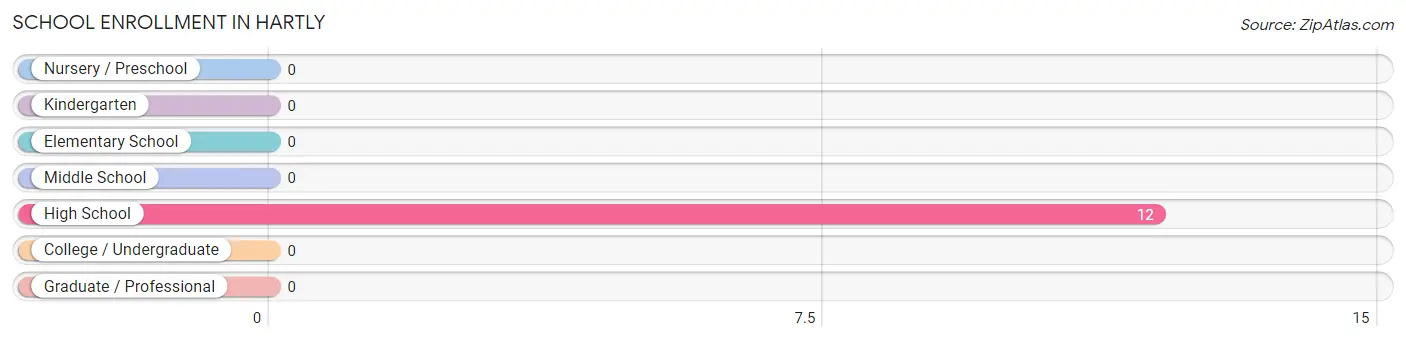
| School Level | # Students | % Students |
| Nursery / Preschool | 0 | 0.0% |
| Kindergarten | 0 | 0.0% |
| Elementary School | 0 | 0.0% |
| Middle School | 0 | 0.0% |
| High School | 12 | 100.0% |
| College / Undergraduate | 0 | 0.0% |
| Graduate / Professional | 0 | 0.0% |
| Total | 12 | 100.0% |
School Enrollment by Age by Funding Source in Hartly
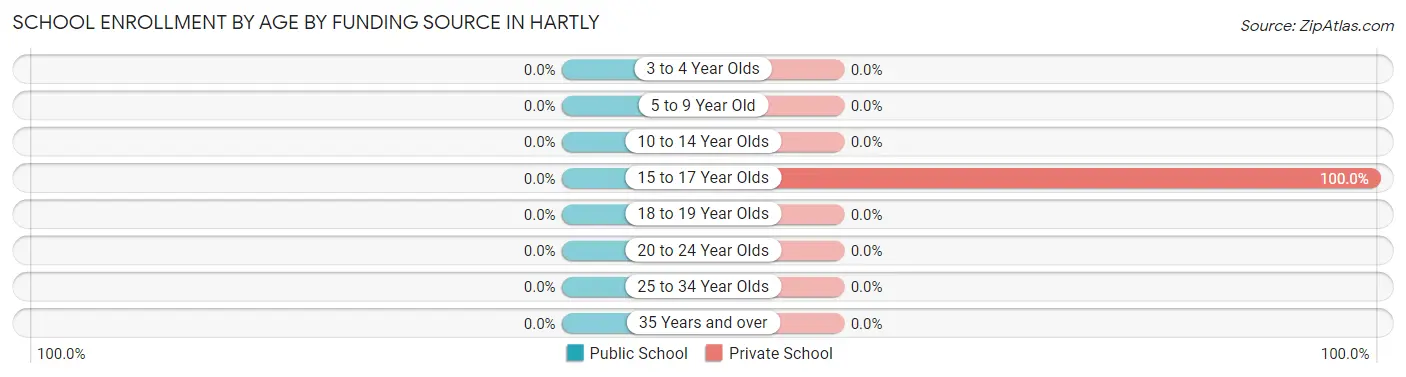
| Age Bracket | Public School | Private School |
| 3 to 4 Year Olds | 0 (0.0%) | 0 (0.0%) |
| 5 to 9 Year Old | 0 (0.0%) | 0 (0.0%) |
| 10 to 14 Year Olds | 0 (0.0%) | 0 (0.0%) |
| 15 to 17 Year Olds | 0 (0.0%) | 12 (100.0%) |
| 18 to 19 Year Olds | 0 (0.0%) | 0 (0.0%) |
| 20 to 24 Year Olds | 0 (0.0%) | 0 (0.0%) |
| 25 to 34 Year Olds | 0 (0.0%) | 0 (0.0%) |
| 35 Years and over | 0 (0.0%) | 0 (0.0%) |
| Total | 0 (0.0%) | 12 (100.0%) |
Educational Attainment by Field of Study in Hartly
, and business (2 | 100.0%) are the most common fields of study among 2 individuals in Hartly who have obtained a bachelor's degree or higher.
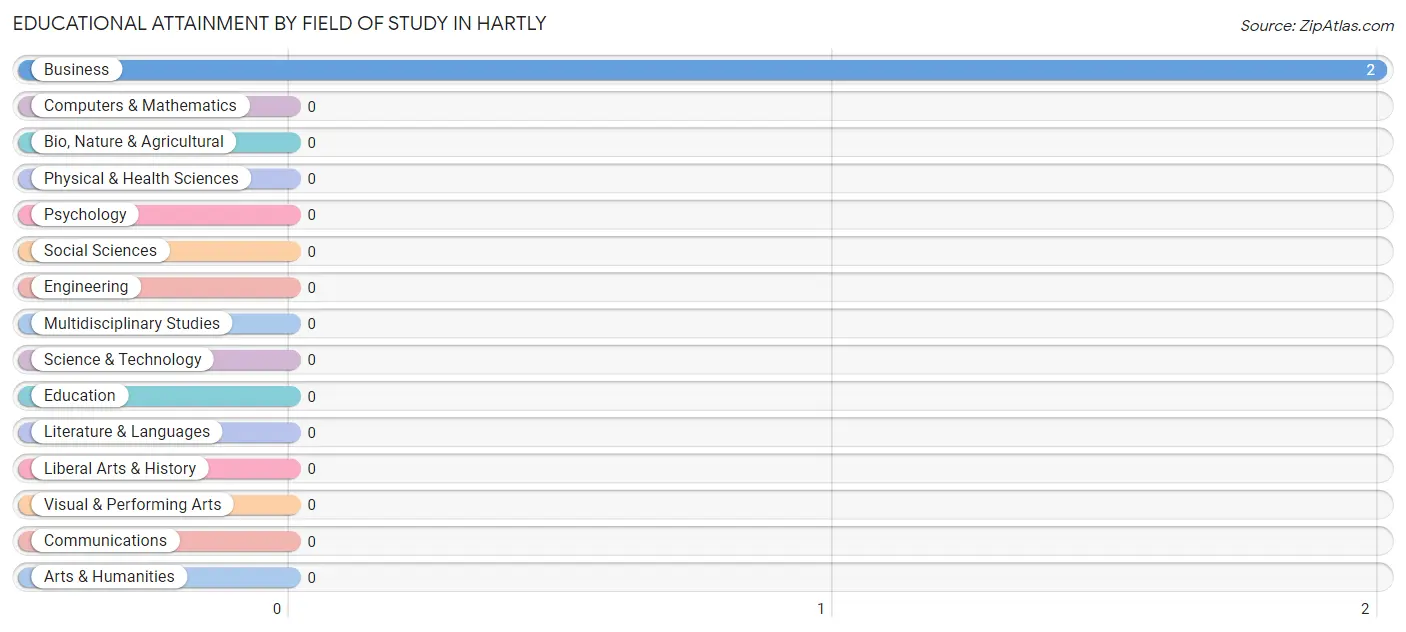
| Field of Study | # Graduates | % Graduates |
| Computers & Mathematics | 0 | 0.0% |
| Bio, Nature & Agricultural | 0 | 0.0% |
| Physical & Health Sciences | 0 | 0.0% |
| Psychology | 0 | 0.0% |
| Social Sciences | 0 | 0.0% |
| Engineering | 0 | 0.0% |
| Multidisciplinary Studies | 0 | 0.0% |
| Science & Technology | 0 | 0.0% |
| Business | 2 | 100.0% |
| Education | 0 | 0.0% |
| Literature & Languages | 0 | 0.0% |
| Liberal Arts & History | 0 | 0.0% |
| Visual & Performing Arts | 0 | 0.0% |
| Communications | 0 | 0.0% |
| Arts & Humanities | 0 | 0.0% |
| Total | 2 | 100.0% |
Transportation & Commute in Hartly
Vehicle Availability by Sex in Hartly
The most prevalent vehicle ownership categories in Hartly are males with 3 vehicles (44, accounting for 78.6%) and females with 3 vehicles (0, making up 338.5%).
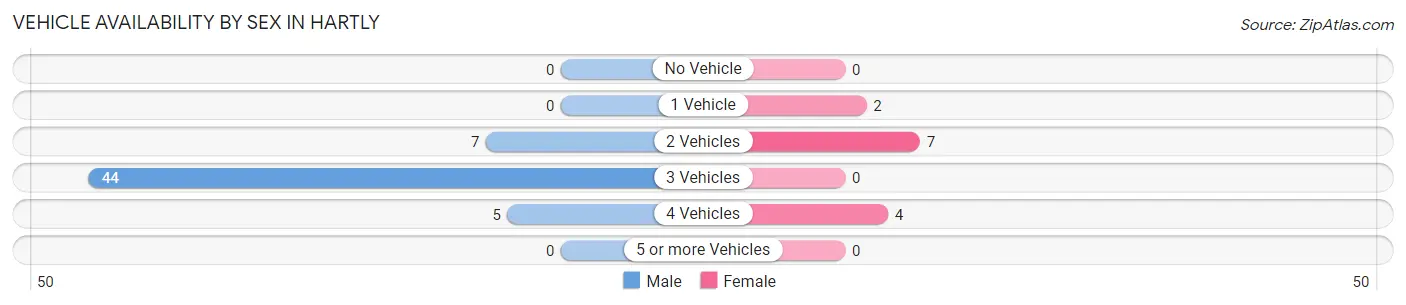
| Vehicles Available | Male | Female |
| No Vehicle | 0 (0.0%) | 0 (0.0%) |
| 1 Vehicle | 0 (0.0%) | 2 (15.4%) |
| 2 Vehicles | 7 (12.5%) | 7 (53.8%) |
| 3 Vehicles | 44 (78.6%) | 0 (0.0%) |
| 4 Vehicles | 5 (8.9%) | 4 (30.8%) |
| 5 or more Vehicles | 0 (0.0%) | 0 (0.0%) |
| Total | 56 (100.0%) | 13 (100.0%) |
Commute Time in Hartly
The most frequently occuring commute durations in Hartly are 20 to 24 minutes (49 commuters, 73.1%), less than 5 minutes (9 commuters, 13.4%), and 30 to 34 minutes (7 commuters, 10.4%).
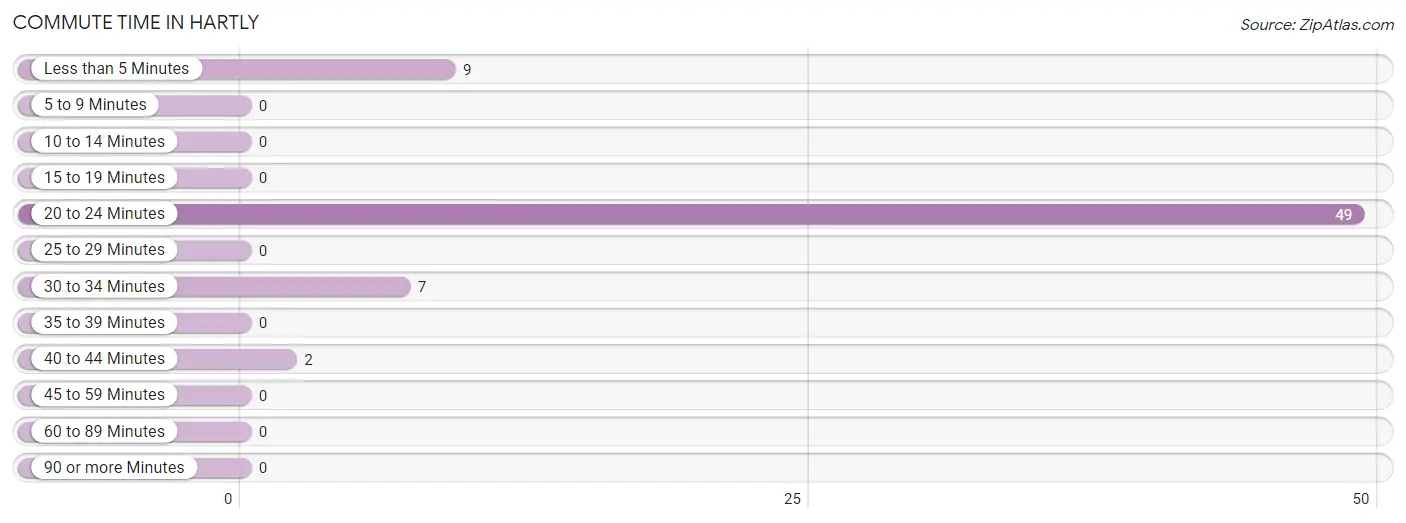
| Commute Time | # Commuters | % Commuters |
| Less than 5 Minutes | 9 | 13.4% |
| 5 to 9 Minutes | 0 | 0.0% |
| 10 to 14 Minutes | 0 | 0.0% |
| 15 to 19 Minutes | 0 | 0.0% |
| 20 to 24 Minutes | 49 | 73.1% |
| 25 to 29 Minutes | 0 | 0.0% |
| 30 to 34 Minutes | 7 | 10.4% |
| 35 to 39 Minutes | 0 | 0.0% |
| 40 to 44 Minutes | 2 | 3.0% |
| 45 to 59 Minutes | 0 | 0.0% |
| 60 to 89 Minutes | 0 | 0.0% |
| 90 or more Minutes | 0 | 0.0% |
Commute Time by Sex in Hartly
The most common commute times in Hartly are 20 to 24 minutes (44 commuters, 78.6%) for males and 20 to 24 minutes (5 commuters, 45.5%) for females.
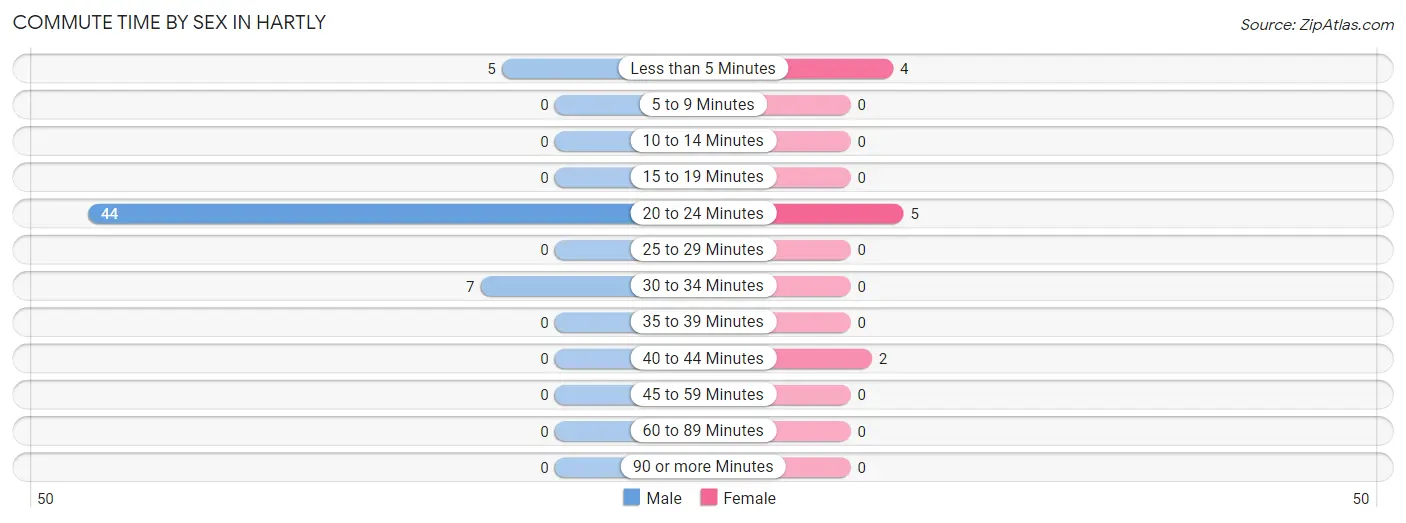
| Commute Time | Male | Female |
| Less than 5 Minutes | 5 (8.9%) | 4 (36.4%) |
| 5 to 9 Minutes | 0 (0.0%) | 0 (0.0%) |
| 10 to 14 Minutes | 0 (0.0%) | 0 (0.0%) |
| 15 to 19 Minutes | 0 (0.0%) | 0 (0.0%) |
| 20 to 24 Minutes | 44 (78.6%) | 5 (45.5%) |
| 25 to 29 Minutes | 0 (0.0%) | 0 (0.0%) |
| 30 to 34 Minutes | 7 (12.5%) | 0 (0.0%) |
| 35 to 39 Minutes | 0 (0.0%) | 0 (0.0%) |
| 40 to 44 Minutes | 0 (0.0%) | 2 (18.2%) |
| 45 to 59 Minutes | 0 (0.0%) | 0 (0.0%) |
| 60 to 89 Minutes | 0 (0.0%) | 0 (0.0%) |
| 90 or more Minutes | 0 (0.0%) | 0 (0.0%) |
Time of Departure to Work by Sex in Hartly
The most frequent times of departure to work in Hartly are 5:30 AM to 5:59 AM (44, 78.6%) for males and 6:30 AM to 6:59 AM (5, 45.5%) for females.
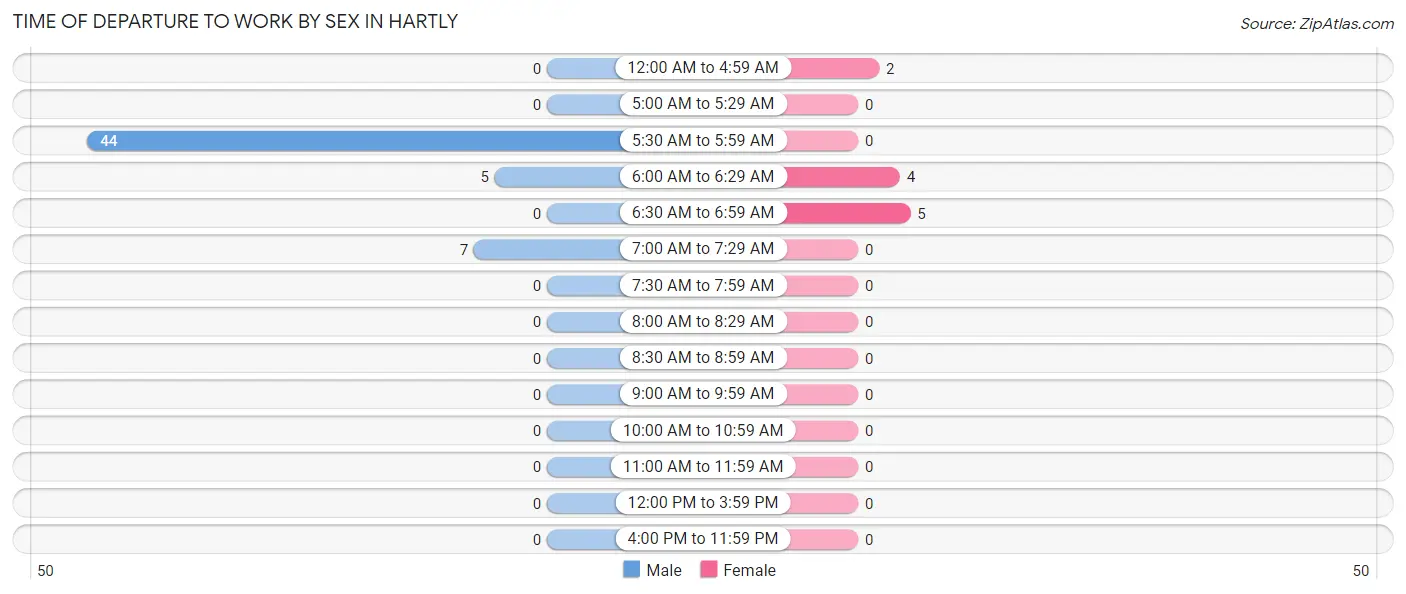
| Time of Departure | Male | Female |
| 12:00 AM to 4:59 AM | 0 (0.0%) | 2 (18.2%) |
| 5:00 AM to 5:29 AM | 0 (0.0%) | 0 (0.0%) |
| 5:30 AM to 5:59 AM | 44 (78.6%) | 0 (0.0%) |
| 6:00 AM to 6:29 AM | 5 (8.9%) | 4 (36.4%) |
| 6:30 AM to 6:59 AM | 0 (0.0%) | 5 (45.5%) |
| 7:00 AM to 7:29 AM | 7 (12.5%) | 0 (0.0%) |
| 7:30 AM to 7:59 AM | 0 (0.0%) | 0 (0.0%) |
| 8:00 AM to 8:29 AM | 0 (0.0%) | 0 (0.0%) |
| 8:30 AM to 8:59 AM | 0 (0.0%) | 0 (0.0%) |
| 9:00 AM to 9:59 AM | 0 (0.0%) | 0 (0.0%) |
| 10:00 AM to 10:59 AM | 0 (0.0%) | 0 (0.0%) |
| 11:00 AM to 11:59 AM | 0 (0.0%) | 0 (0.0%) |
| 12:00 PM to 3:59 PM | 0 (0.0%) | 0 (0.0%) |
| 4:00 PM to 11:59 PM | 0 (0.0%) | 0 (0.0%) |
| Total | 56 (100.0%) | 11 (100.0%) |
Housing Occupancy in Hartly
Occupancy by Ownership in Hartly
Of the total 65 dwellings in Hartly, owner-occupied units account for 65 (100.0%), while renter-occupied units make up 0 (0.0%).
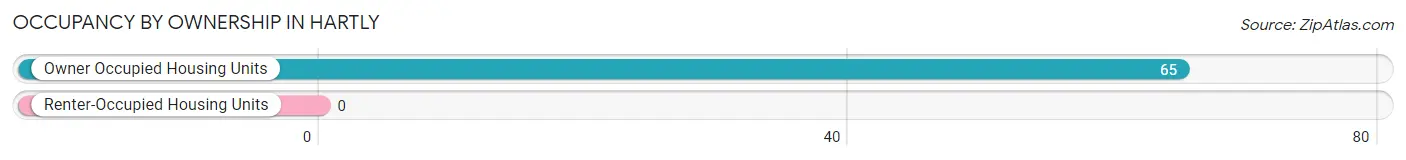
| Occupancy | # Housing Units | % Housing Units |
| Owner Occupied Housing Units | 65 | 100.0% |
| Renter-Occupied Housing Units | 0 | 0.0% |
| Total Occupied Housing Units | 65 | 100.0% |
Occupancy by Household Size in Hartly
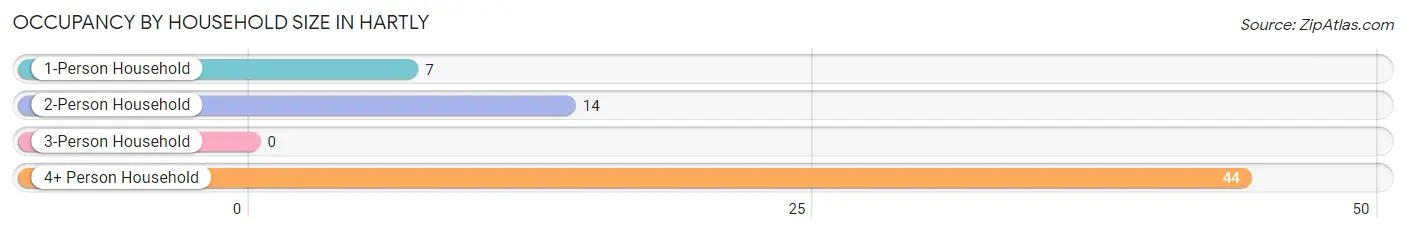
| Household Size | # Housing Units | % Housing Units |
| 1-Person Household | 7 | 10.8% |
| 2-Person Household | 14 | 21.5% |
| 3-Person Household | 0 | 0.0% |
| 4+ Person Household | 44 | 67.7% |
| Total Housing Units | 65 | 100.0% |
Occupancy by Ownership by Household Size in Hartly
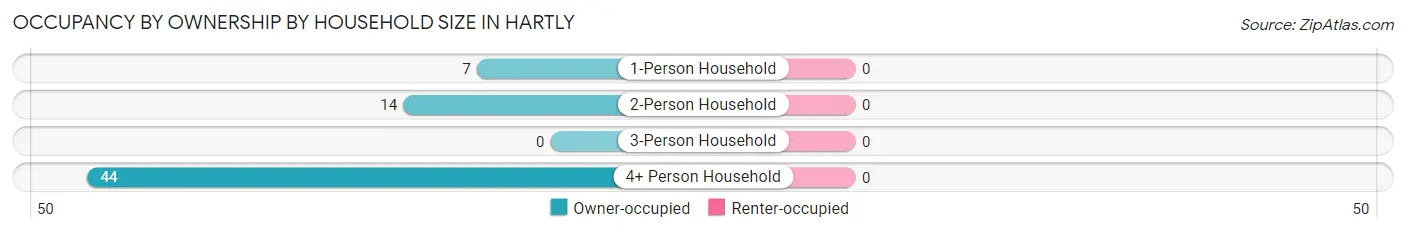
| Household Size | Owner-occupied | Renter-occupied |
| 1-Person Household | 7 (100.0%) | 0 (0.0%) |
| 2-Person Household | 14 (100.0%) | 0 (0.0%) |
| 3-Person Household | 0 (0.0%) | 0 (0.0%) |
| 4+ Person Household | 44 (100.0%) | 0 (0.0%) |
| Total Housing Units | 65 (100.0%) | 0 (0.0%) |
Occupancy by Educational Attainment in Hartly
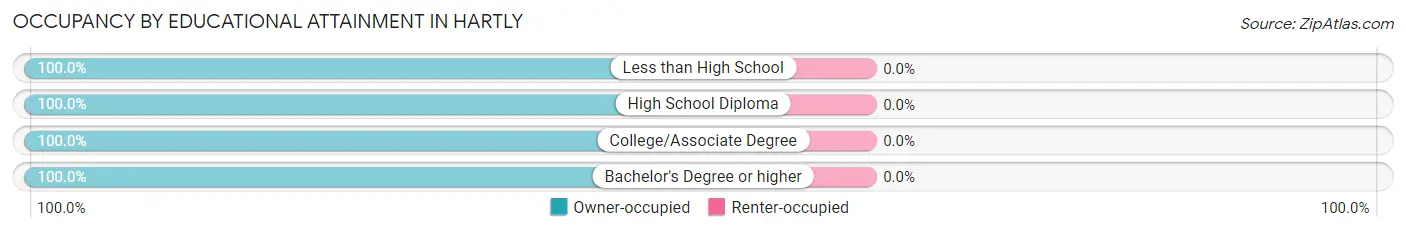
| Household Size | Owner-occupied | Renter-occupied |
| Less than High School | 44 (100.0%) | 0 (0.0%) |
| High School Diploma | 10 (100.0%) | 0 (0.0%) |
| College/Associate Degree | 9 (100.0%) | 0 (0.0%) |
| Bachelor's Degree or higher | 2 (100.0%) | 0 (0.0%) |
Occupancy by Age of Householder in Hartly
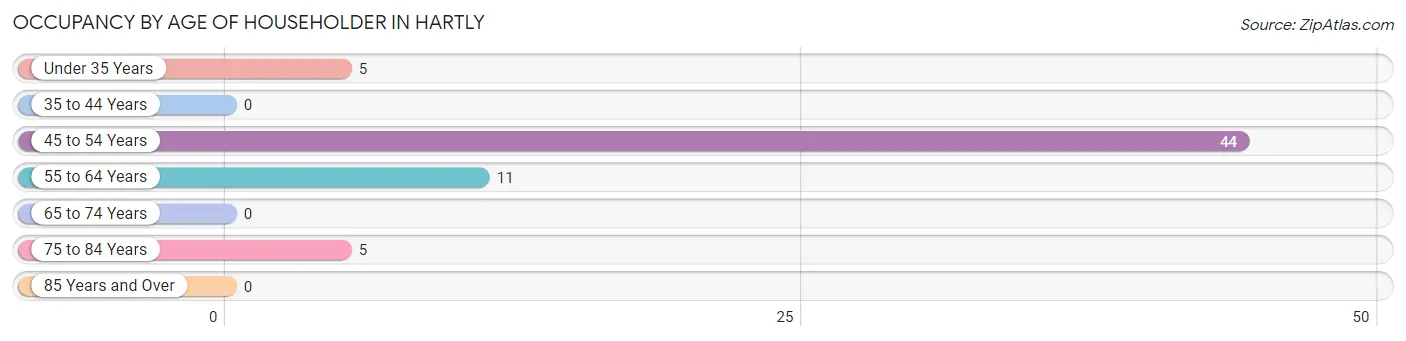
| Age Bracket | # Households | % Households |
| Under 35 Years | 5 | 7.7% |
| 35 to 44 Years | 0 | 0.0% |
| 45 to 54 Years | 44 | 67.7% |
| 55 to 64 Years | 11 | 16.9% |
| 65 to 74 Years | 0 | 0.0% |
| 75 to 84 Years | 5 | 7.7% |
| 85 Years and Over | 0 | 0.0% |
| Total | 65 | 100.0% |
Housing Finances in Hartly
Median Income by Occupancy in Hartly
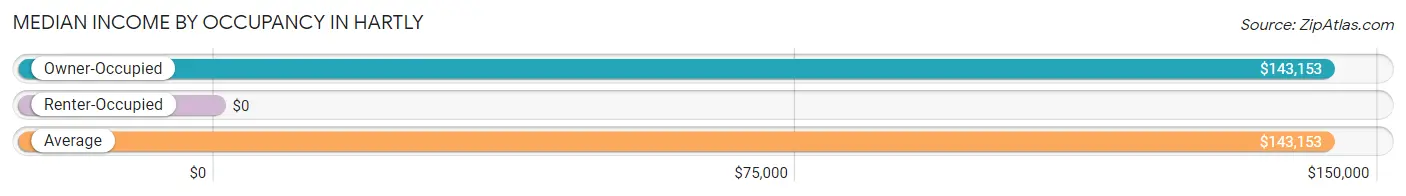
| Occupancy Type | # Households | Median Income |
| Owner-Occupied | 65 (100.0%) | $143,153 |
| Renter-Occupied | 0 (0.0%) | $0 |
| Average | 65 (100.0%) | $143,153 |
Occupancy by Householder Income Bracket in Hartly
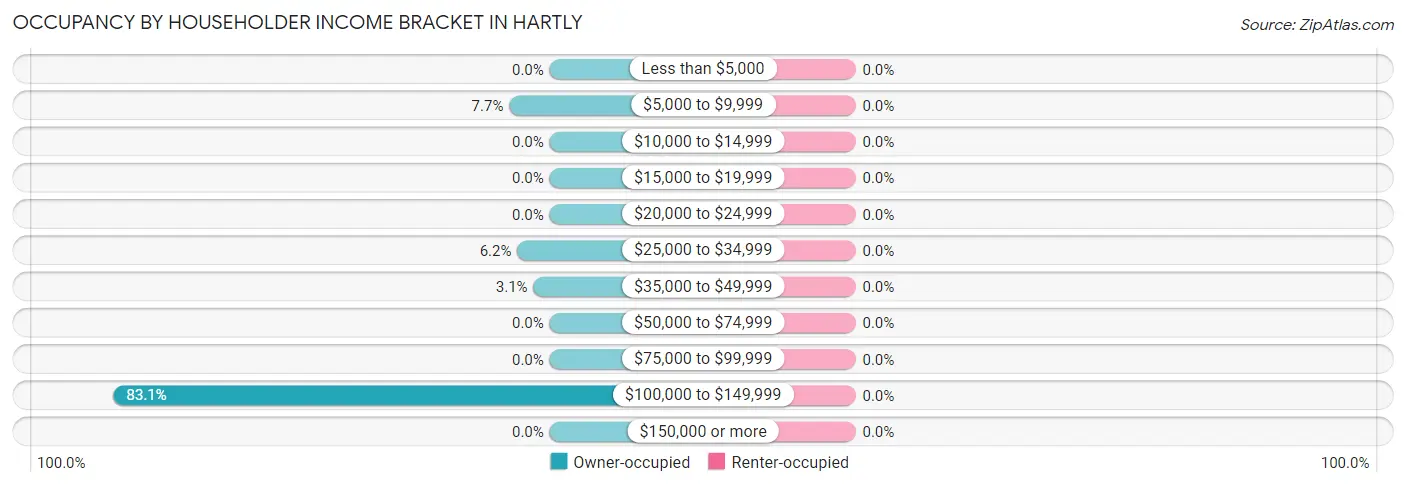
| Income Bracket | Owner-occupied | Renter-occupied |
| Less than $5,000 | 0 (0.0%) | 0 (0.0%) |
| $5,000 to $9,999 | 5 (7.7%) | 0 (0.0%) |
| $10,000 to $14,999 | 0 (0.0%) | 0 (0.0%) |
| $15,000 to $19,999 | 0 (0.0%) | 0 (0.0%) |
| $20,000 to $24,999 | 0 (0.0%) | 0 (0.0%) |
| $25,000 to $34,999 | 4 (6.1%) | 0 (0.0%) |
| $35,000 to $49,999 | 2 (3.1%) | 0 (0.0%) |
| $50,000 to $74,999 | 0 (0.0%) | 0 (0.0%) |
| $75,000 to $99,999 | 0 (0.0%) | 0 (0.0%) |
| $100,000 to $149,999 | 54 (83.1%) | 0 (0.0%) |
| $150,000 or more | 0 (0.0%) | 0 (0.0%) |
| Total | 65 (100.0%) | 0 (0.0%) |
Monthly Housing Cost Tiers in Hartly
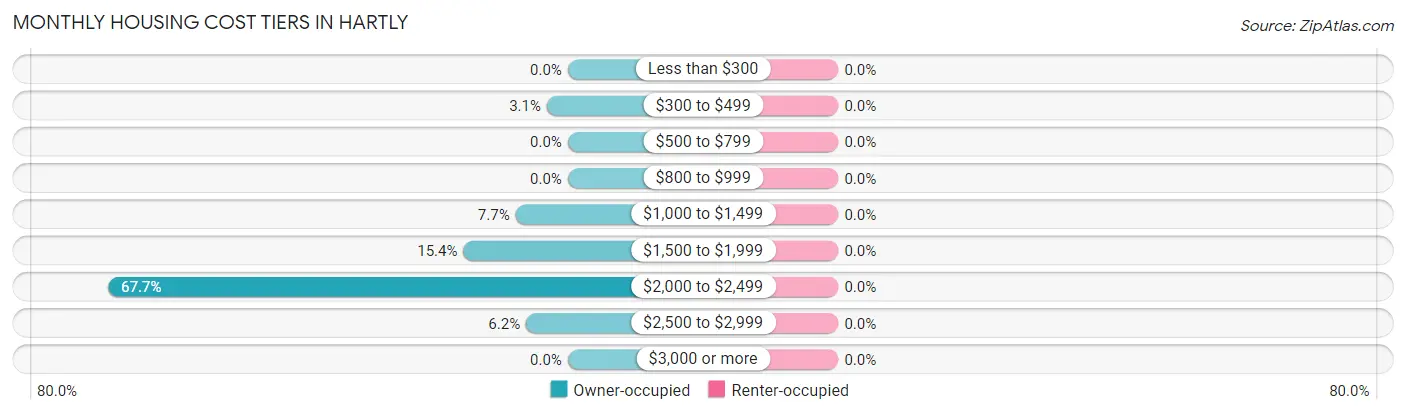
| Monthly Cost | Owner-occupied | Renter-occupied |
| Less than $300 | 0 (0.0%) | 0 (0.0%) |
| $300 to $499 | 2 (3.1%) | 0 (0.0%) |
| $500 to $799 | 0 (0.0%) | 0 (0.0%) |
| $800 to $999 | 0 (0.0%) | 0 (0.0%) |
| $1,000 to $1,499 | 5 (7.7%) | 0 (0.0%) |
| $1,500 to $1,999 | 10 (15.4%) | 0 (0.0%) |
| $2,000 to $2,499 | 44 (67.7%) | 0 (0.0%) |
| $2,500 to $2,999 | 4 (6.1%) | 0 (0.0%) |
| $3,000 or more | 0 (0.0%) | 0 (0.0%) |
| Total | 65 (100.0%) | 0 (0.0%) |
Physical Housing Characteristics in Hartly
Housing Structures in Hartly
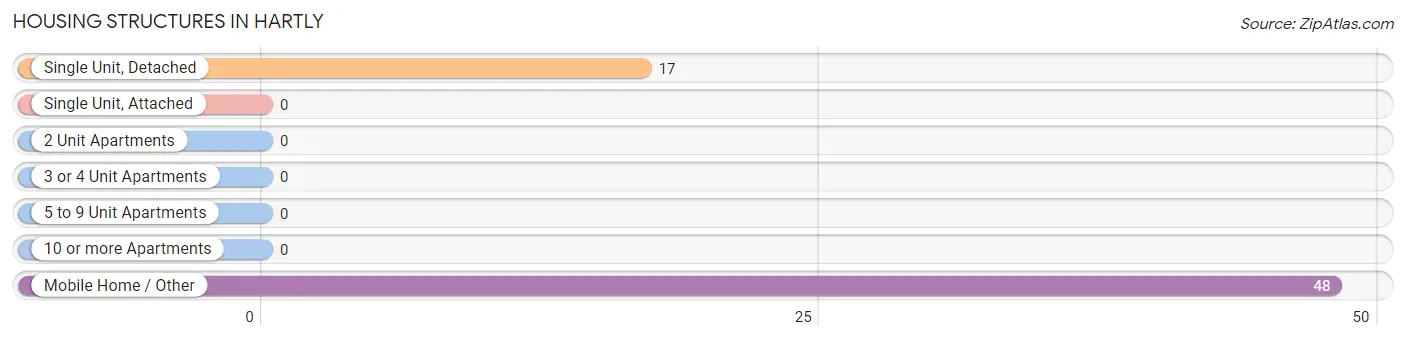
| Structure Type | # Housing Units | % Housing Units |
| Single Unit, Detached | 17 | 26.2% |
| Single Unit, Attached | 0 | 0.0% |
| 2 Unit Apartments | 0 | 0.0% |
| 3 or 4 Unit Apartments | 0 | 0.0% |
| 5 to 9 Unit Apartments | 0 | 0.0% |
| 10 or more Apartments | 0 | 0.0% |
| Mobile Home / Other | 48 | 73.9% |
| Total | 65 | 100.0% |
Housing Structures by Occupancy in Hartly
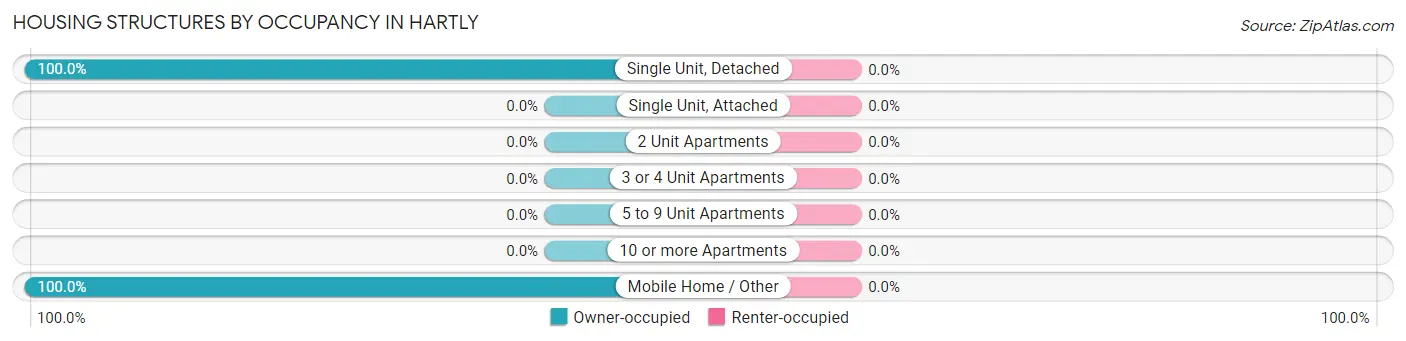
| Structure Type | Owner-occupied | Renter-occupied |
| Single Unit, Detached | 17 (100.0%) | 0 (0.0%) |
| Single Unit, Attached | 0 (0.0%) | 0 (0.0%) |
| 2 Unit Apartments | 0 (0.0%) | 0 (0.0%) |
| 3 or 4 Unit Apartments | 0 (0.0%) | 0 (0.0%) |
| 5 to 9 Unit Apartments | 0 (0.0%) | 0 (0.0%) |
| 10 or more Apartments | 0 (0.0%) | 0 (0.0%) |
| Mobile Home / Other | 48 (100.0%) | 0 (0.0%) |
| Total | 65 (100.0%) | 0 (0.0%) |
Housing Structures by Number of Rooms in Hartly
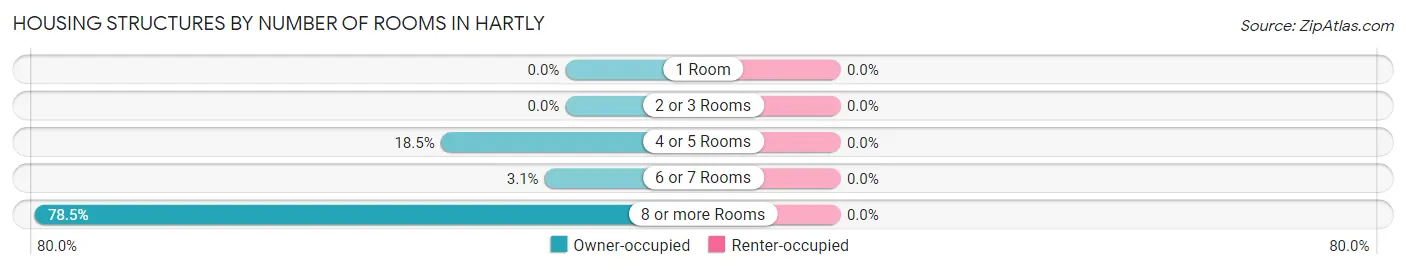
| Number of Rooms | Owner-occupied | Renter-occupied |
| 1 Room | 0 (0.0%) | 0 (0.0%) |
| 2 or 3 Rooms | 0 (0.0%) | 0 (0.0%) |
| 4 or 5 Rooms | 12 (18.5%) | 0 (0.0%) |
| 6 or 7 Rooms | 2 (3.1%) | 0 (0.0%) |
| 8 or more Rooms | 51 (78.5%) | 0 (0.0%) |
| Total | 65 (100.0%) | 0 (0.0%) |
Housing Structure by Heating Type in Hartly
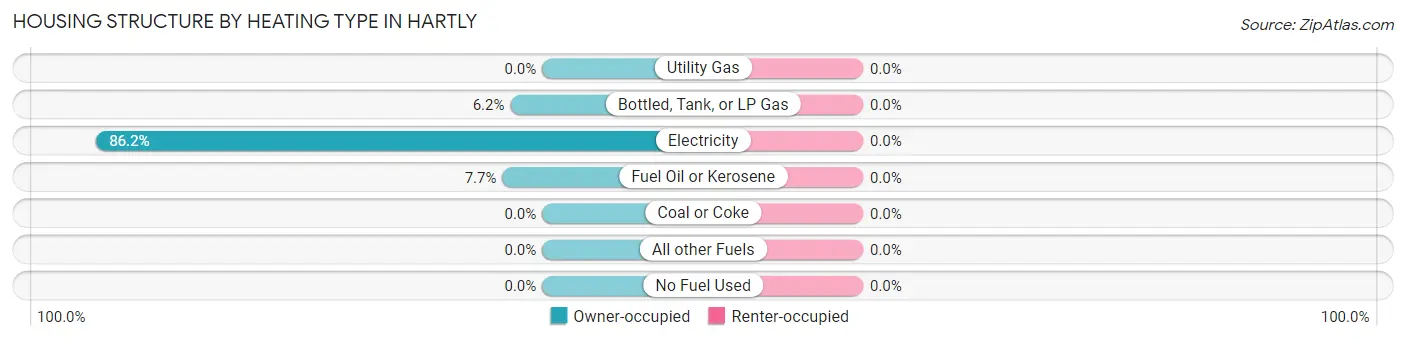
| Heating Type | Owner-occupied | Renter-occupied |
| Utility Gas | 0 (0.0%) | 0 (0.0%) |
| Bottled, Tank, or LP Gas | 4 (6.1%) | 0 (0.0%) |
| Electricity | 56 (86.2%) | 0 (0.0%) |
| Fuel Oil or Kerosene | 5 (7.7%) | 0 (0.0%) |
| Coal or Coke | 0 (0.0%) | 0 (0.0%) |
| All other Fuels | 0 (0.0%) | 0 (0.0%) |
| No Fuel Used | 0 (0.0%) | 0 (0.0%) |
| Total | 65 (100.0%) | 0 (0.0%) |
Household Vehicle Usage in Hartly
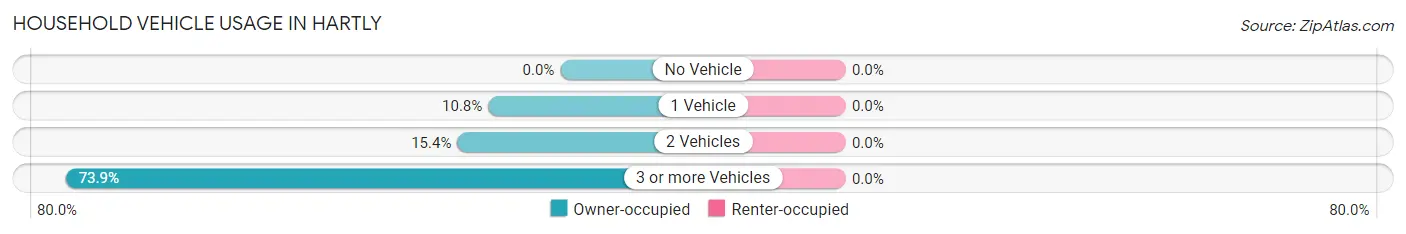
| Vehicles per Household | Owner-occupied | Renter-occupied |
| No Vehicle | 0 (0.0%) | 0 (0.0%) |
| 1 Vehicle | 7 (10.8%) | 0 (0.0%) |
| 2 Vehicles | 10 (15.4%) | 0 (0.0%) |
| 3 or more Vehicles | 48 (73.9%) | 0 (0.0%) |
| Total | 65 (100.0%) | 0 (0.0%) |
Real Estate & Mortgages in Hartly
Real Estate and Mortgage Overview in Hartly
| Characteristic | Without Mortgage | With Mortgage |
| Housing Units | 2 | 63 |
| Median Property Value | - | - |
| Median Household Income | - | - |
| Monthly Housing Costs | - | - |
| Real Estate Taxes | - | - |
Property Value by Mortgage Status in Hartly
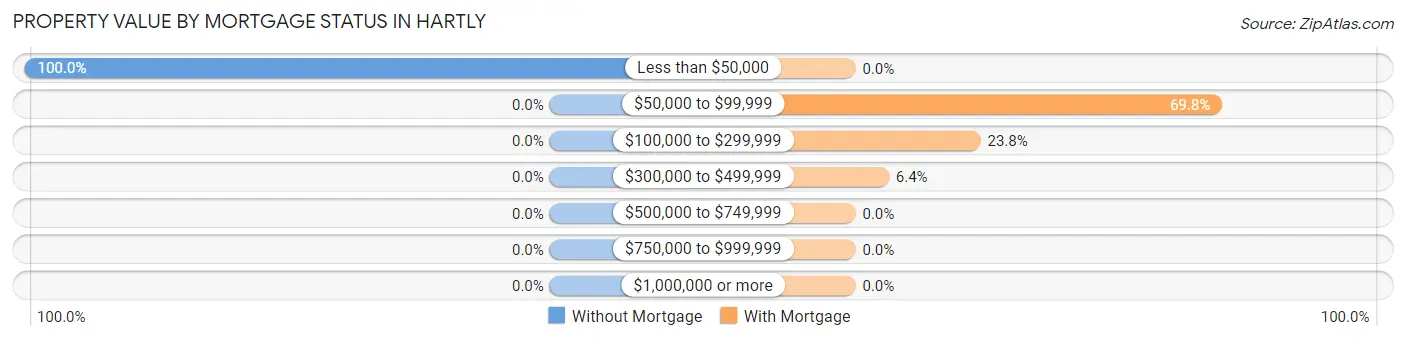
| Property Value | Without Mortgage | With Mortgage |
| Less than $50,000 | 2 (100.0%) | 0 (0.0%) |
| $50,000 to $99,999 | 0 (0.0%) | 44 (69.8%) |
| $100,000 to $299,999 | 0 (0.0%) | 15 (23.8%) |
| $300,000 to $499,999 | 0 (0.0%) | 4 (6.4%) |
| $500,000 to $749,999 | 0 (0.0%) | 0 (0.0%) |
| $750,000 to $999,999 | 0 (0.0%) | 0 (0.0%) |
| $1,000,000 or more | 0 (0.0%) | 0 (0.0%) |
| Total | 2 (100.0%) | 63 (100.0%) |
Household Income by Mortgage Status in Hartly
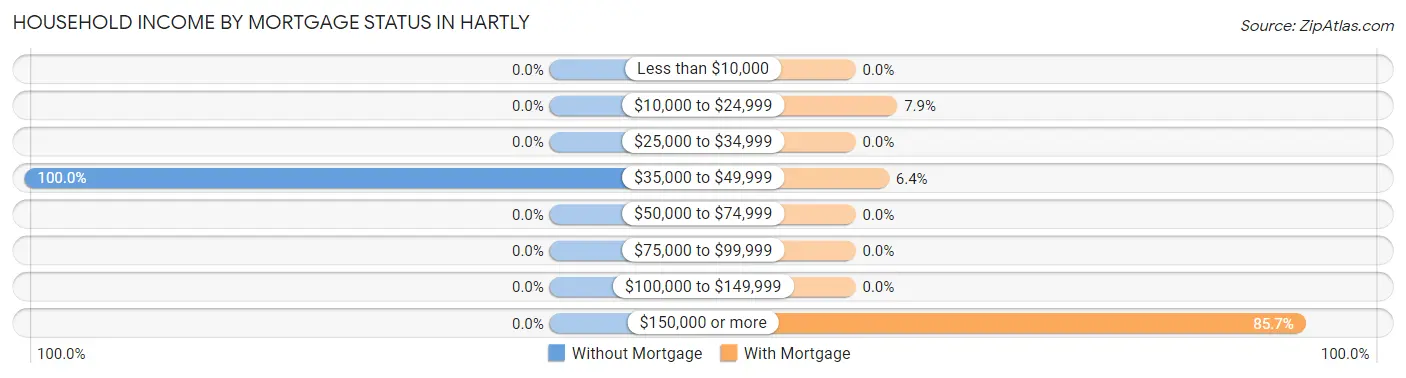
| Household Income | Without Mortgage | With Mortgage |
| Less than $10,000 | 0 (0.0%) | 0 (0.0%) |
| $10,000 to $24,999 | 0 (0.0%) | 5 (7.9%) |
| $25,000 to $34,999 | 0 (0.0%) | 0 (0.0%) |
| $35,000 to $49,999 | 2 (100.0%) | 4 (6.4%) |
| $50,000 to $74,999 | 0 (0.0%) | 0 (0.0%) |
| $75,000 to $99,999 | 0 (0.0%) | 0 (0.0%) |
| $100,000 to $149,999 | 0 (0.0%) | 0 (0.0%) |
| $150,000 or more | 0 (0.0%) | 54 (85.7%) |
| Total | 2 (100.0%) | 63 (100.0%) |
Property Value to Household Income Ratio in Hartly
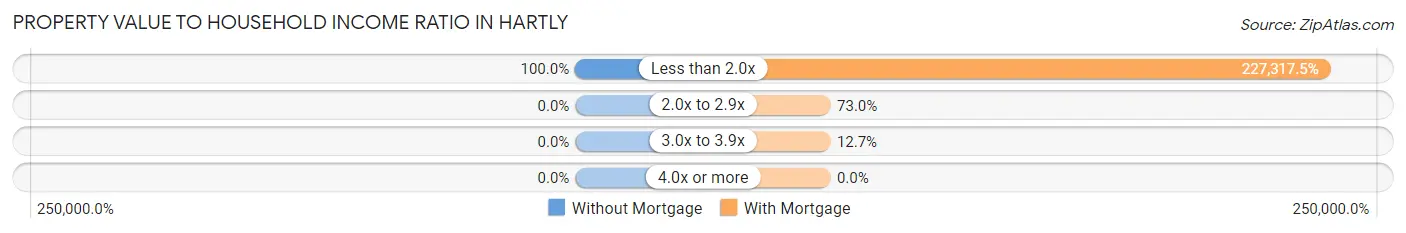
| Value-to-Income Ratio | Without Mortgage | With Mortgage |
| Less than 2.0x | 2 (100.0%) | 143,210 (227,317.5%) |
| 2.0x to 2.9x | 0 (0.0%) | 46 (73.0%) |
| 3.0x to 3.9x | 0 (0.0%) | 8 (12.7%) |
| 4.0x or more | 0 (0.0%) | 0 (0.0%) |
| Total | 2 (100.0%) | 63 (100.0%) |
Real Estate Taxes by Mortgage Status in Hartly
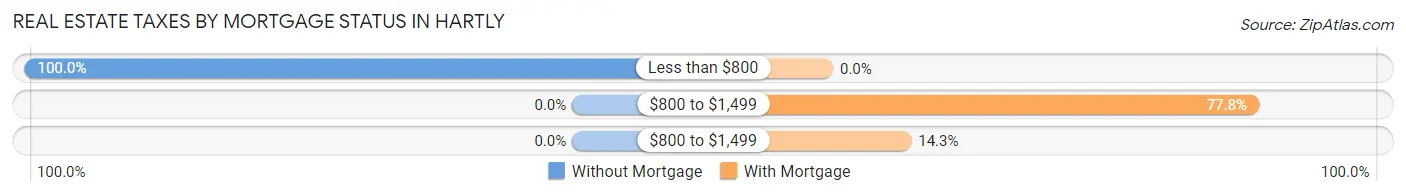
| Property Taxes | Without Mortgage | With Mortgage |
| Less than $800 | 2 (100.0%) | 0 (0.0%) |
| $800 to $1,499 | 0 (0.0%) | 49 (77.8%) |
| $800 to $1,499 | 0 (0.0%) | 9 (14.3%) |
| Total | 2 (100.0%) | 63 (100.0%) |
Health & Disability in Hartly
Health Insurance Coverage by Age in Hartly
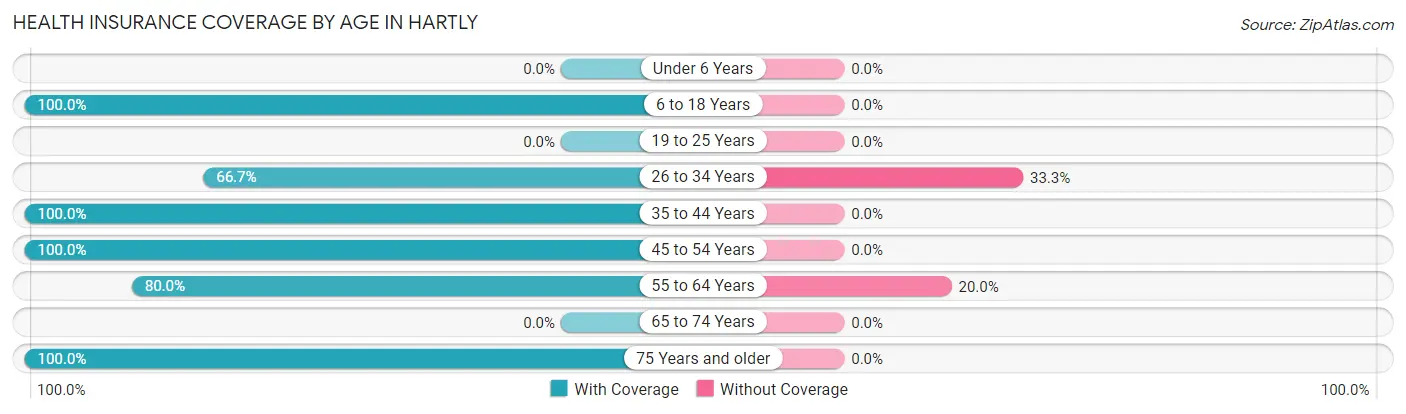
| Age Bracket | With Coverage | Without Coverage |
| Under 6 Years | 0 (0.0%) | 0 (0.0%) |
| 6 to 18 Years | 54 (100.0%) | 0 (0.0%) |
| 19 to 25 Years | 0 (0.0%) | 0 (0.0%) |
| 26 to 34 Years | 10 (66.7%) | 5 (33.3%) |
| 35 to 44 Years | 28 (100.0%) | 0 (0.0%) |
| 45 to 54 Years | 44 (100.0%) | 0 (0.0%) |
| 55 to 64 Years | 12 (80.0%) | 3 (20.0%) |
| 65 to 74 Years | 0 (0.0%) | 0 (0.0%) |
| 75 Years and older | 5 (100.0%) | 0 (0.0%) |
| Total | 153 (95.0%) | 8 (5.0%) |
Health Insurance Coverage by Citizenship Status in Hartly
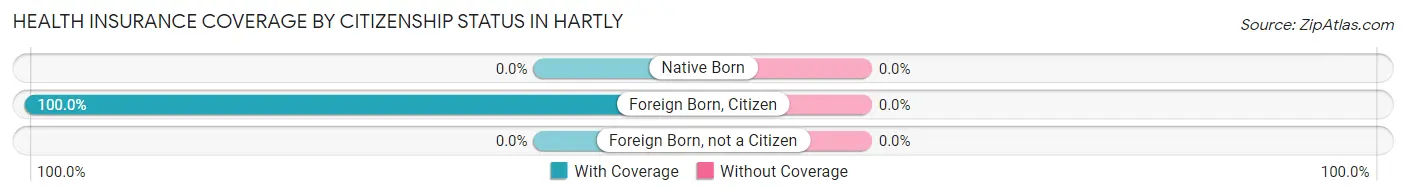
| Citizenship Status | With Coverage | Without Coverage |
| Native Born | 0 (0.0%) | 0 (0.0%) |
| Foreign Born, Citizen | 54 (100.0%) | 0 (0.0%) |
| Foreign Born, not a Citizen | 0 (0.0%) | 0 (0.0%) |
Health Insurance Coverage by Household Income in Hartly
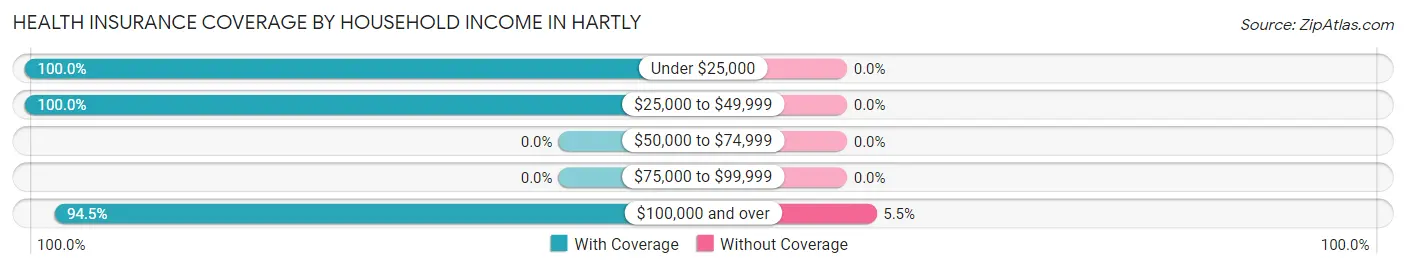
| Household Income | With Coverage | Without Coverage |
| Under $25,000 | 5 (100.0%) | 0 (0.0%) |
| $25,000 to $49,999 | 11 (100.0%) | 0 (0.0%) |
| $50,000 to $74,999 | 0 (0.0%) | 0 (0.0%) |
| $75,000 to $99,999 | 0 (0.0%) | 0 (0.0%) |
| $100,000 and over | 137 (94.5%) | 8 (5.5%) |
Public vs Private Health Insurance Coverage by Age in Hartly
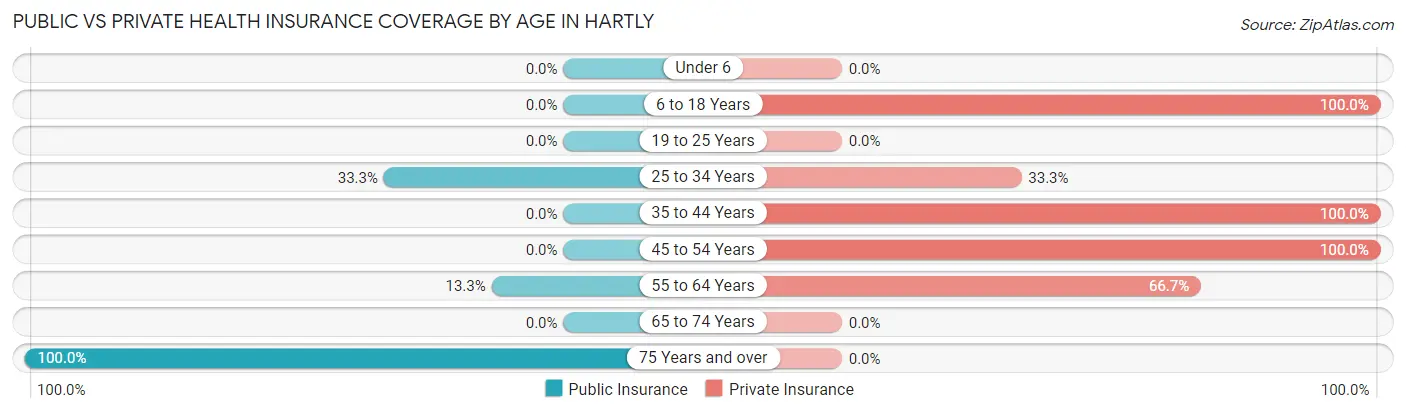
| Age Bracket | Public Insurance | Private Insurance |
| Under 6 | 0 (0.0%) | 0 (0.0%) |
| 6 to 18 Years | 0 (0.0%) | 54 (100.0%) |
| 19 to 25 Years | 0 (0.0%) | 0 (0.0%) |
| 25 to 34 Years | 5 (33.3%) | 5 (33.3%) |
| 35 to 44 Years | 0 (0.0%) | 28 (100.0%) |
| 45 to 54 Years | 0 (0.0%) | 44 (100.0%) |
| 55 to 64 Years | 2 (13.3%) | 10 (66.7%) |
| 65 to 74 Years | 0 (0.0%) | 0 (0.0%) |
| 75 Years and over | 5 (100.0%) | 0 (0.0%) |
| Total | 12 (7.4%) | 141 (87.6%) |
Disability Status by Sex by Age in Hartly
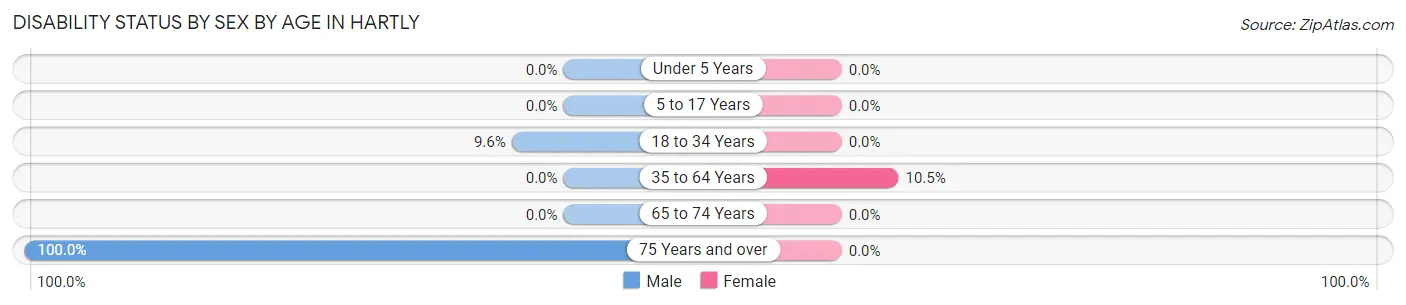
| Age Bracket | Male | Female |
| Under 5 Years | 0 (0.0%) | 0 (0.0%) |
| 5 to 17 Years | 0 (0.0%) | 0 (0.0%) |
| 18 to 34 Years | 5 (9.6%) | 0 (0.0%) |
| 35 to 64 Years | 0 (0.0%) | 4 (10.5%) |
| 65 to 74 Years | 0 (0.0%) | 0 (0.0%) |
| 75 Years and over | 5 (100.0%) | 0 (0.0%) |
Disability Class by Sex by Age in Hartly
Disability Class: Hearing Difficulty
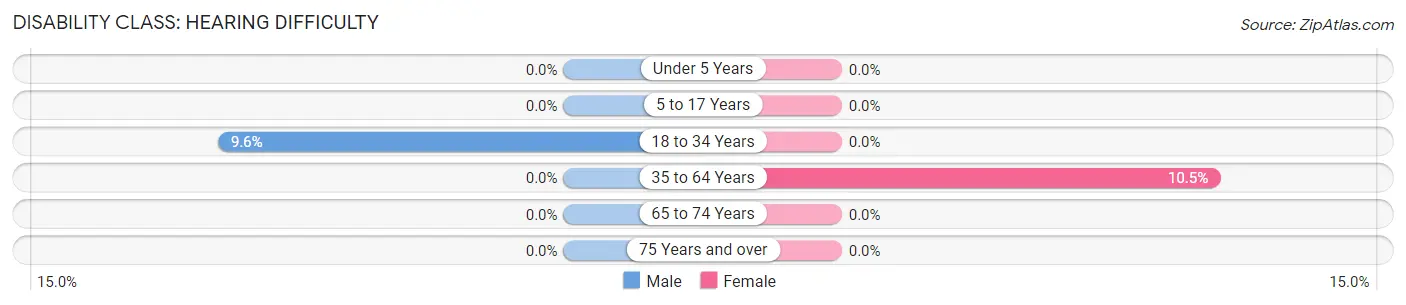
| Age Bracket | Male | Female |
| Under 5 Years | 0 (0.0%) | 0 (0.0%) |
| 5 to 17 Years | 0 (0.0%) | 0 (0.0%) |
| 18 to 34 Years | 5 (9.6%) | 0 (0.0%) |
| 35 to 64 Years | 0 (0.0%) | 4 (10.5%) |
| 65 to 74 Years | 0 (0.0%) | 0 (0.0%) |
| 75 Years and over | 0 (0.0%) | 0 (0.0%) |
Disability Class: Vision Difficulty
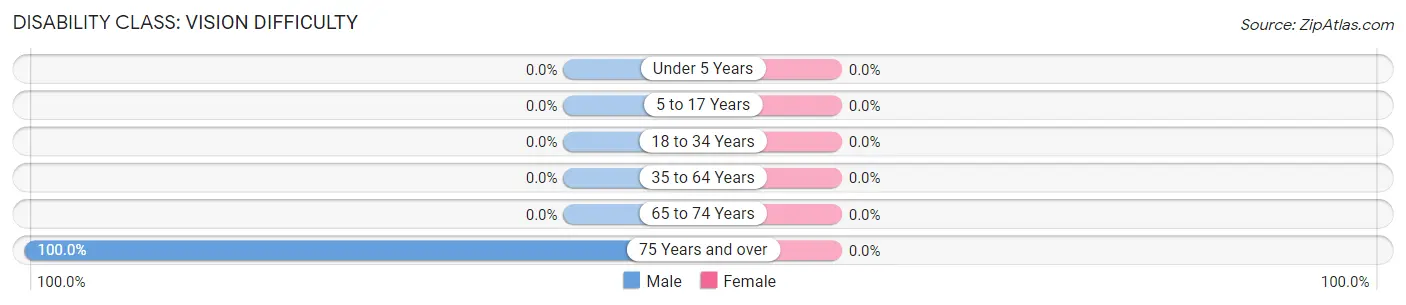
| Age Bracket | Male | Female |
| Under 5 Years | 0 (0.0%) | 0 (0.0%) |
| 5 to 17 Years | 0 (0.0%) | 0 (0.0%) |
| 18 to 34 Years | 0 (0.0%) | 0 (0.0%) |
| 35 to 64 Years | 0 (0.0%) | 0 (0.0%) |
| 65 to 74 Years | 0 (0.0%) | 0 (0.0%) |
| 75 Years and over | 5 (100.0%) | 0 (0.0%) |
Disability Class: Cognitive Difficulty
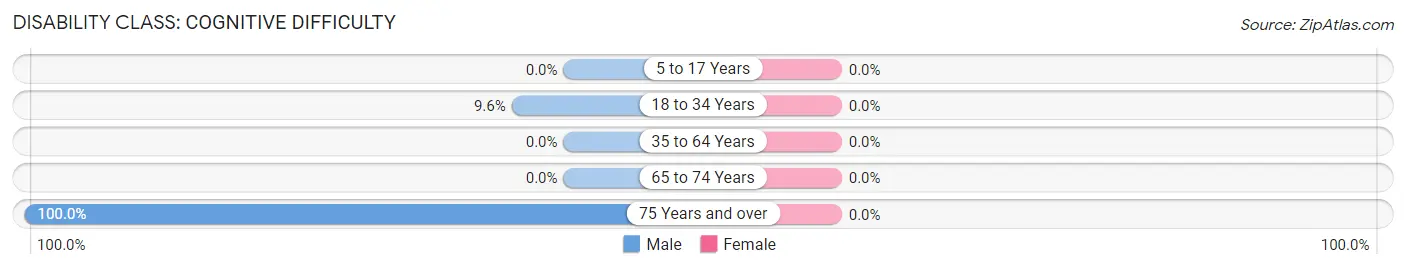
| Age Bracket | Male | Female |
| 5 to 17 Years | 0 (0.0%) | 0 (0.0%) |
| 18 to 34 Years | 5 (9.6%) | 0 (0.0%) |
| 35 to 64 Years | 0 (0.0%) | 0 (0.0%) |
| 65 to 74 Years | 0 (0.0%) | 0 (0.0%) |
| 75 Years and over | 5 (100.0%) | 0 (0.0%) |
Disability Class: Ambulatory Difficulty
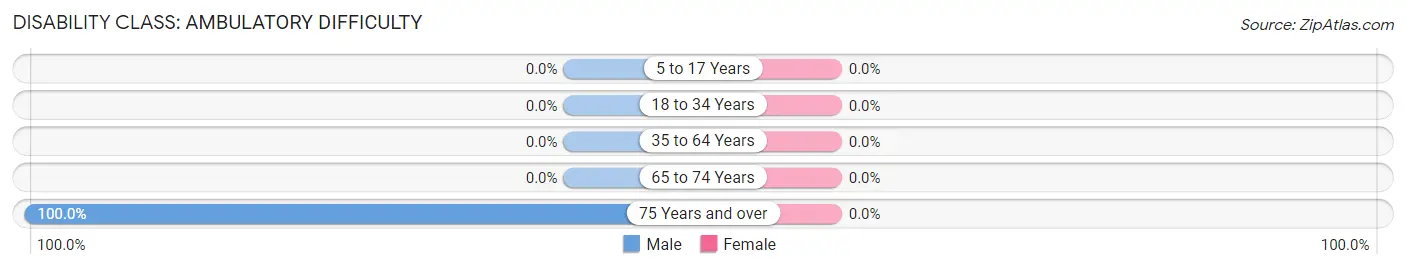
| Age Bracket | Male | Female |
| 5 to 17 Years | 0 (0.0%) | 0 (0.0%) |
| 18 to 34 Years | 0 (0.0%) | 0 (0.0%) |
| 35 to 64 Years | 0 (0.0%) | 0 (0.0%) |
| 65 to 74 Years | 0 (0.0%) | 0 (0.0%) |
| 75 Years and over | 5 (100.0%) | 0 (0.0%) |
Disability Class: Self-Care Difficulty
| Age Bracket | Male | Female |
| 5 to 17 Years | 0 (0.0%) | 0 (0.0%) |
| 18 to 34 Years | 0 (0.0%) | 0 (0.0%) |
| 35 to 64 Years | 0 (0.0%) | 0 (0.0%) |
| 65 to 74 Years | 0 (0.0%) | 0 (0.0%) |
| 75 Years and over | 0 (0.0%) | 0 (0.0%) |
Technology Access in Hartly
Computing Device Access in Hartly
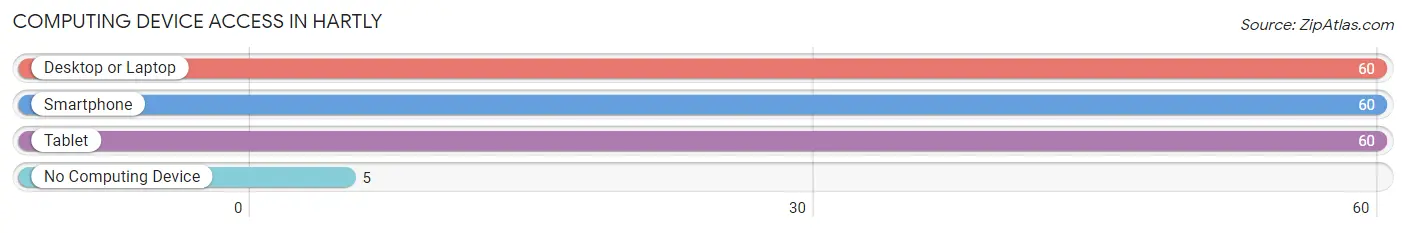
| Device Type | # Households | % Households |
| Desktop or Laptop | 60 | 92.3% |
| Smartphone | 60 | 92.3% |
| Tablet | 60 | 92.3% |
| No Computing Device | 5 | 7.7% |
| Total | 65 | 100.0% |
Internet Access in Hartly
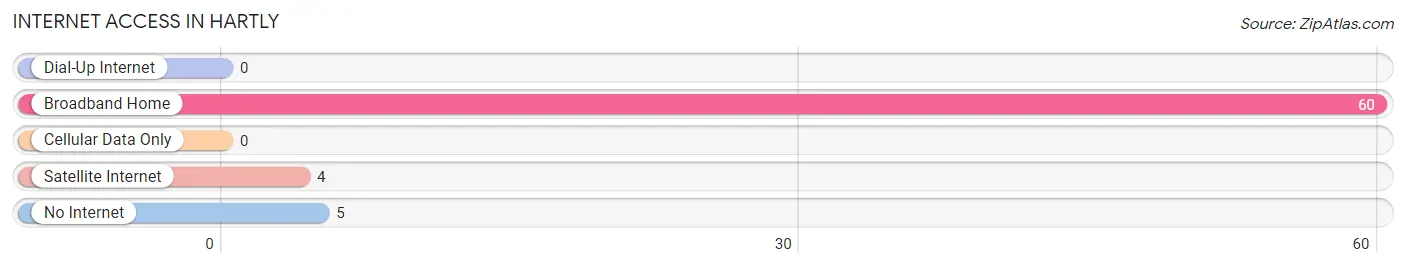
| Internet Type | # Households | % Households |
| Dial-Up Internet | 0 | 0.0% |
| Broadband Home | 60 | 92.3% |
| Cellular Data Only | 0 | 0.0% |
| Satellite Internet | 4 | 6.1% |
| No Internet | 5 | 7.7% |
| Total | 65 | 100.0% |
Hartly Summary
Hartly is an unincorporated community located in Kent County, Delaware. It is located in the northern part of the state, about 10 miles south of Dover, the state capital. The population of Hartly was estimated to be 1,845 in the year 2000.
History
Hartly was first settled in the late 1700s by a group of Quakers from Pennsylvania. The town was named after a local Quaker family, the Hartlys. The town was officially incorporated in 1883.
In the late 1800s, Hartly was a thriving agricultural community. The town was known for its production of apples, peaches, and other fruits. The town also had a thriving dairy industry.
In the early 1900s, Hartly began to experience a decline in its agricultural industry. This was due to the introduction of new technologies and the development of larger farms in other parts of the state.
In the mid-1900s, Hartly began to experience a resurgence in its economy. This was due to the development of new industries, such as manufacturing and transportation. The town also experienced an influx of new residents, as people moved to the area for employment opportunities.
Geography
Hartly is located in northern Kent County, Delaware. It is situated on the banks of the Murderkill River, which flows through the town. The town is located about 10 miles south of Dover, the state capital.
The town is located in a rural area, with rolling hills and forests. The town is surrounded by farmland and is home to several small lakes.
Economy
The economy of Hartly is largely based on agriculture and manufacturing. The town is home to several small farms, which produce a variety of fruits and vegetables. The town also has several small manufacturing businesses, which produce a variety of products, such as furniture and clothing.
The town is also home to several small businesses, such as restaurants, stores, and other services. The town is also home to a small airport, which serves the surrounding area.
Demographics
The population of Hartly was estimated to be 1,845 in the year 2000. The town is predominantly white, with a small African American population. The town also has a small Hispanic population.
The median household income in Hartly is $45,000, which is slightly lower than the state average. The town has a poverty rate of 11.3%, which is slightly higher than the state average.
Conclusion
Hartly is a small town located in northern Kent County, Delaware. The town has a long history, dating back to the late 1700s. The town is largely rural, with a strong agricultural and manufacturing base. The population of Hartly is estimated to be 1,845, with a median household income of $45,000. The town has a small African American and Hispanic population, and a poverty rate of 11.3%.
Common Questions
What is Per Capita Income in Hartly?
Per Capita income in Hartly is $47,549.
What is the Median Family Income in Hartly?
Median Family Income in Hartly is $143,494.
What is the Median Household income in Hartly?
Median Household Income in Hartly is $143,153.
What is Income or Wage Gap in Hartly?
Income or Wage Gap in Hartly is 59.7%.
Women in Hartly earn 40.3 cents for every dollar earned by a man.
What is Inequality or Gini Index in Hartly?
Inequality or Gini Index in Hartly is 0.17.
What is the Total Population of Hartly?
Total Population of Hartly is 161.
What is the Total Male Population of Hartly?
Total Male Population of Hartly is 118.
What is the Total Female Population of Hartly?
Total Female Population of Hartly is 43.
What is the Ratio of Males per 100 Females in Hartly?
There are 274.42 Males per 100 Females in Hartly.
What is the Ratio of Females per 100 Males in Hartly?
There are 36.44 Females per 100 Males in Hartly.
What is the Median Population Age in Hartly?
Median Population Age in Hartly is 43.4 Years.
What is the Average Family Size in Hartly
Average Family Size in Hartly is 2.7 People.
What is the Average Household Size in Hartly
Average Household Size in Hartly is 2.5 People.
How Large is the Labor Force in Hartly?
There are 69 People in the Labor Forcein in Hartly.
What is the Percentage of People in the Labor Force in Hartly?
42.9% of People are in the Labor Force in Hartly.