Crum, WV Map & Demographics
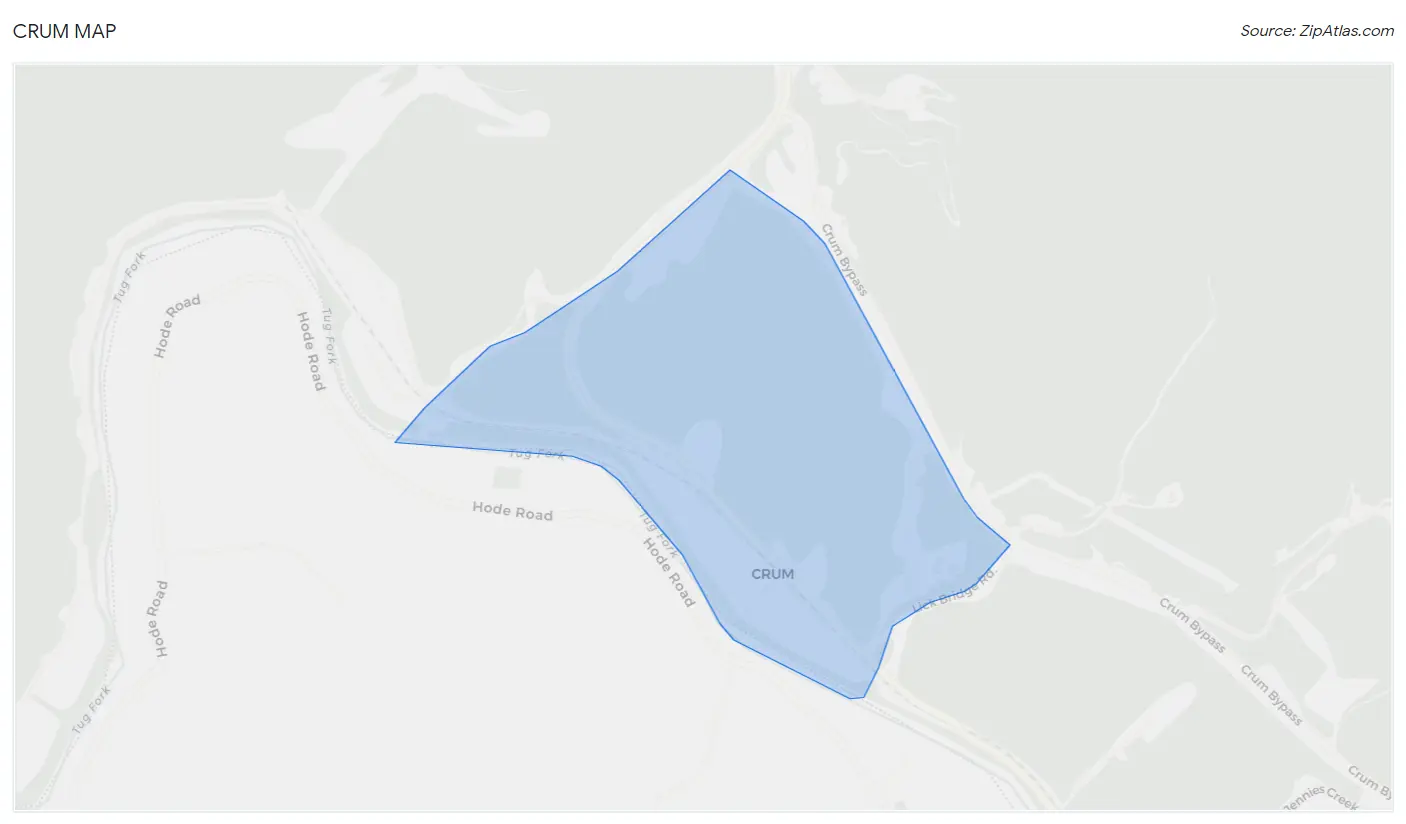
Crum Map
Crum Overview
$10,690
PER CAPITA INCOME
0.26
INEQUALITY / GINI INDEX
143
TOTAL POPULATION
78
MALE POPULATION
65
FEMALE POPULATION
120.00
MALES / 100 FEMALES
83.33
FEMALES / 100 MALES
63.1
MEDIAN AGE
3.2
AVG FAMILY SIZE
3.2
AVG HOUSEHOLD SIZE
32
LABOR FORCE [ PEOPLE ]
27.6%
PERCENT IN LABOR FORCE
28.1%
UNEMPLOYMENT RATE
Crum Zip Codes
Crum Area Codes
Income in Crum
Income Overview in Crum
| Characteristic | Number | Measure |
| Per Capita Income | 143 | $10,690 |
| Median Family Income | 44 | $0 |
| Mean Family Income | 44 | $30,770 |
| Median Household Income | 44 | $0 |
| Mean Household Income | 44 | $30,770 |
| Income Deficit | 44 | $0 |
| Wage / Income Gap (%) | 143 | 0.00% |
| Wage / Income Gap ($) | 143 | 100.00¢ per $1 |
| Gini / Inequality Index | 143 | 0.26 |
Earnings by Sex in Crum
| Sex | Number | Average Earnings |
| Male | 23 (100.0%) | $0 |
| Female | 0 (0.0%) | $0 |
| Total | 23 (100.0%) | $0 |
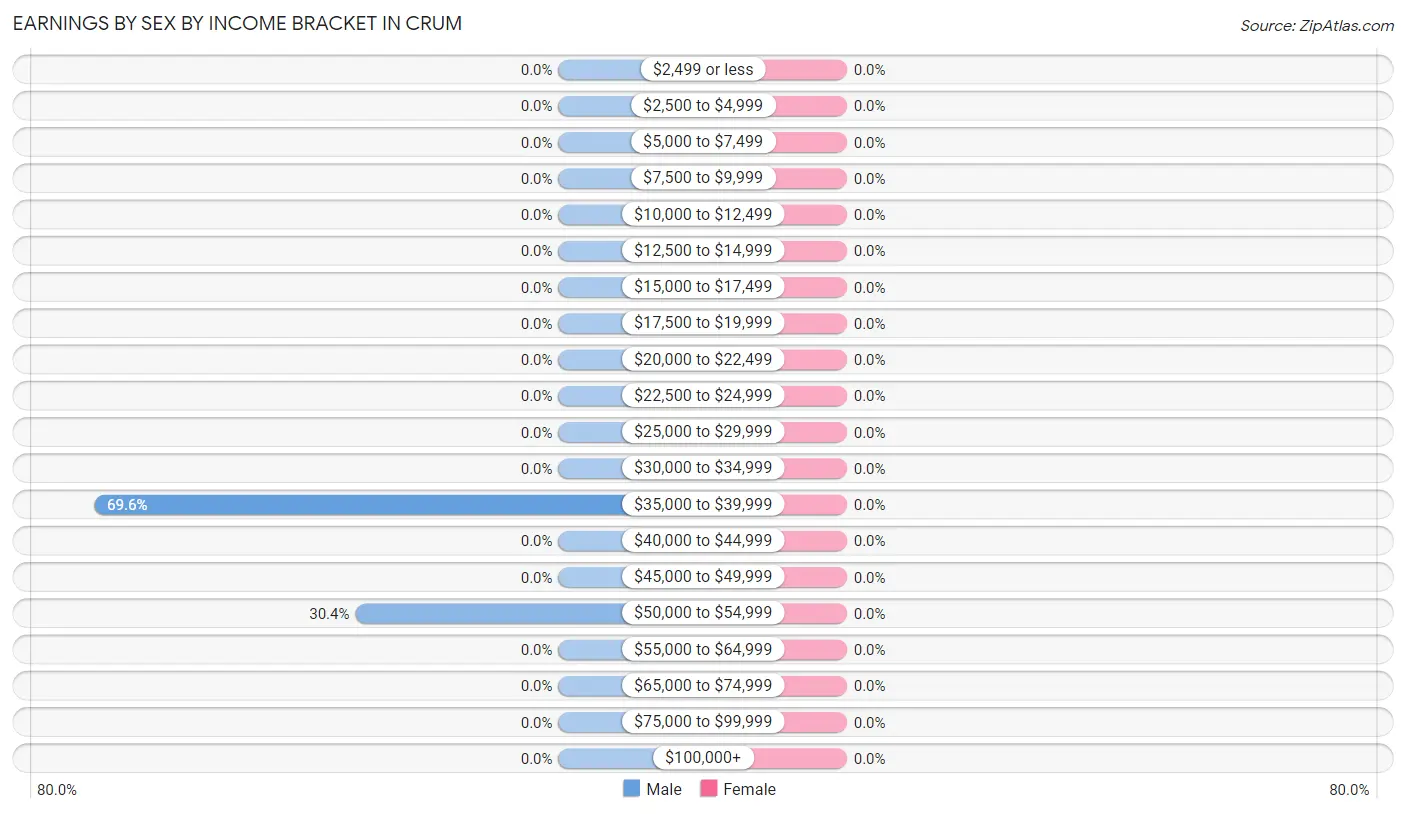
Earnings by Sex by Income Bracket in Crum
| Income | Male | Female |
| $2,499 or less | 0 (0.0%) | 0 (0.0%) |
| $2,500 to $4,999 | 0 (0.0%) | 0 (0.0%) |
| $5,000 to $7,499 | 0 (0.0%) | 0 (0.0%) |
| $7,500 to $9,999 | 0 (0.0%) | 0 (0.0%) |
| $10,000 to $12,499 | 0 (0.0%) | 0 (0.0%) |
| $12,500 to $14,999 | 0 (0.0%) | 0 (0.0%) |
| $15,000 to $17,499 | 0 (0.0%) | 0 (0.0%) |
| $17,500 to $19,999 | 0 (0.0%) | 0 (0.0%) |
| $20,000 to $22,499 | 0 (0.0%) | 0 (0.0%) |
| $22,500 to $24,999 | 0 (0.0%) | 0 (0.0%) |
| $25,000 to $29,999 | 0 (0.0%) | 0 (0.0%) |
| $30,000 to $34,999 | 0 (0.0%) | 0 (0.0%) |
| $35,000 to $39,999 | 16 (69.6%) | 0 (0.0%) |
| $40,000 to $44,999 | 0 (0.0%) | 0 (0.0%) |
| $45,000 to $49,999 | 0 (0.0%) | 0 (0.0%) |
| $50,000 to $54,999 | 7 (30.4%) | 0 (0.0%) |
| $55,000 to $64,999 | 0 (0.0%) | 0 (0.0%) |
| $65,000 to $74,999 | 0 (0.0%) | 0 (0.0%) |
| $75,000 to $99,999 | 0 (0.0%) | 0 (0.0%) |
| $100,000+ | 0 (0.0%) | 0 (0.0%) |
| Total | 23 (100.0%) | 0 (0.0%) |
Earnings by Sex by Educational Attainment in Crum
| Educational Attainment | Male Income | Female Income |
| Less than High School | - | - |
| High School Diploma | - | - |
| College or Associate's Degree | - | - |
| Bachelor's Degree | - | - |
| Graduate Degree | - | - |
| Total | - | - |
Family Income in Crum
Family Income Brackets in Crum
According to the Crum family income data, there are 24 families falling into the $15,000 to $24,999 income range, which is the most common income bracket and makes up 54.5% of all families.
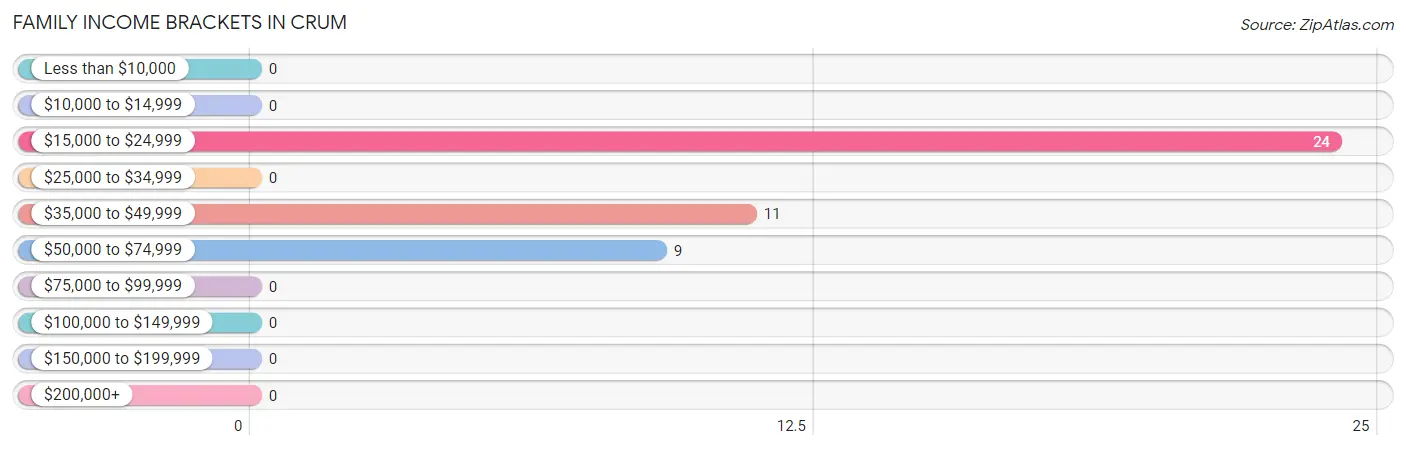
| Income Bracket | # Families | % Families |
| Less than $10,000 | 0 | 0.0% |
| $10,000 to $14,999 | 0 | 0.0% |
| $15,000 to $24,999 | 24 | 54.5% |
| $25,000 to $34,999 | 0 | 0.0% |
| $35,000 to $49,999 | 11 | 25.0% |
| $50,000 to $74,999 | 9 | 20.5% |
| $75,000 to $99,999 | 0 | 0.0% |
| $100,000 to $149,999 | 0 | 0.0% |
| $150,000 to $199,999 | 0 | 0.0% |
| $200,000+ | 0 | 0.0% |
Family Income by Famaliy Size in Crum
| Income Bracket | # Families | Median Income |
| 2-Person Families | 24 (54.5%) | $0 |
| 3-Person Families | 0 (0.0%) | $0 |
| 4-Person Families | 20 (45.5%) | $0 |
| 5-Person Families | 0 (0.0%) | $0 |
| 6-Person Families | 0 (0.0%) | $0 |
| 7+ Person Families | 0 (0.0%) | $0 |
| Total | 44 (100.0%) | $0 |
Family Income by Number of Earners in Crum
| Number of Earners | # Families | Median Income |
| No Earners | 24 (54.5%) | $0 |
| 1 Earner | 20 (45.5%) | $0 |
| 2 Earners | 0 (0.0%) | $0 |
| 3+ Earners | 0 (0.0%) | $0 |
| Total | 44 (100.0%) | $0 |
Household Income in Crum
Household Income Brackets in Crum
With 24 households falling in the category, the $15,000 to $24,999 income range is the most frequent in Crum, accounting for 54.5% of all households.
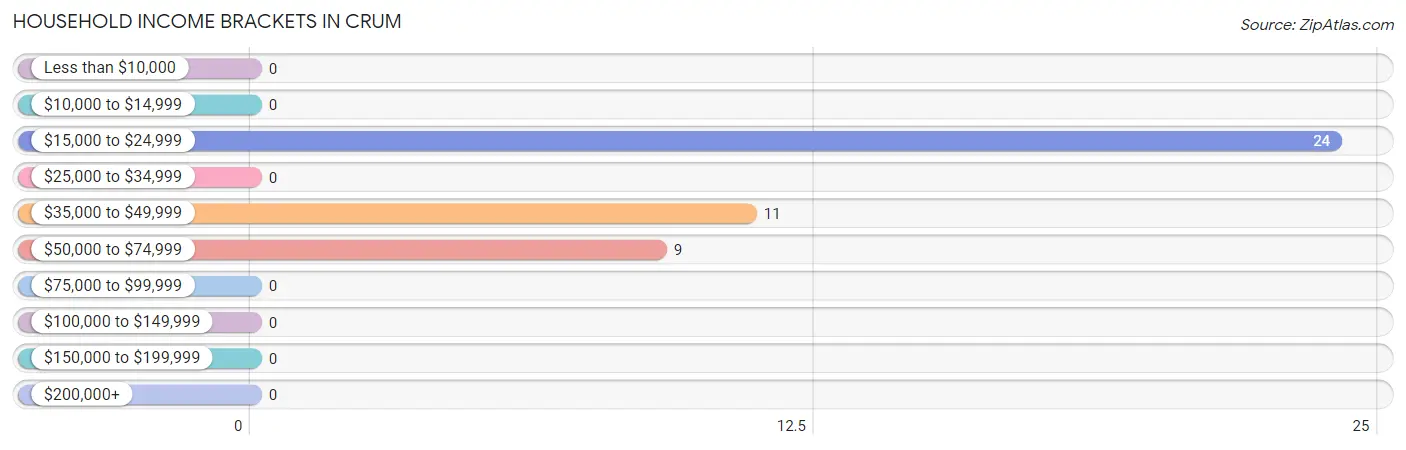
| Income Bracket | # Households | % Households |
| Less than $10,000 | 0 | 0.0% |
| $10,000 to $14,999 | 0 | 0.0% |
| $15,000 to $24,999 | 24 | 54.5% |
| $25,000 to $34,999 | 0 | 0.0% |
| $35,000 to $49,999 | 11 | 25.0% |
| $50,000 to $74,999 | 9 | 20.5% |
| $75,000 to $99,999 | 0 | 0.0% |
| $100,000 to $149,999 | 0 | 0.0% |
| $150,000 to $199,999 | 0 | 0.0% |
| $200,000+ | 0 | 0.0% |
Household Income by Householder Age in Crum
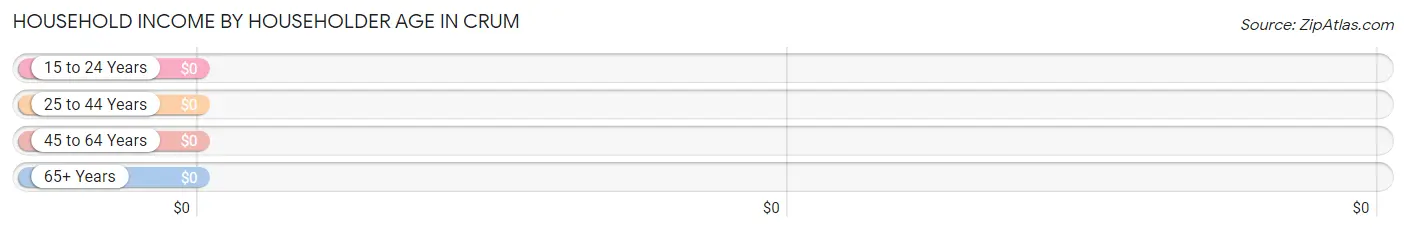
| Income Bracket | # Households | Median Income |
| 15 to 24 Years | 0 (0.0%) | $0 |
| 25 to 44 Years | 9 (20.4%) | $0 |
| 45 to 64 Years | 35 (79.5%) | $0 |
| 65+ Years | 0 (0.0%) | $0 |
| Total | 44 (100.0%) | $0 |
Poverty in Crum
Income Below Poverty by Sex and Age in Crum
With 48.7% poverty level for males and 36.9% for females among the residents of Crum, 65 to 74 year old males and 55 to 64 year old females are the most vulnerable to poverty, with 38 males (100.0%) and 24 females (68.6%) in their respective age groups living below the poverty level.
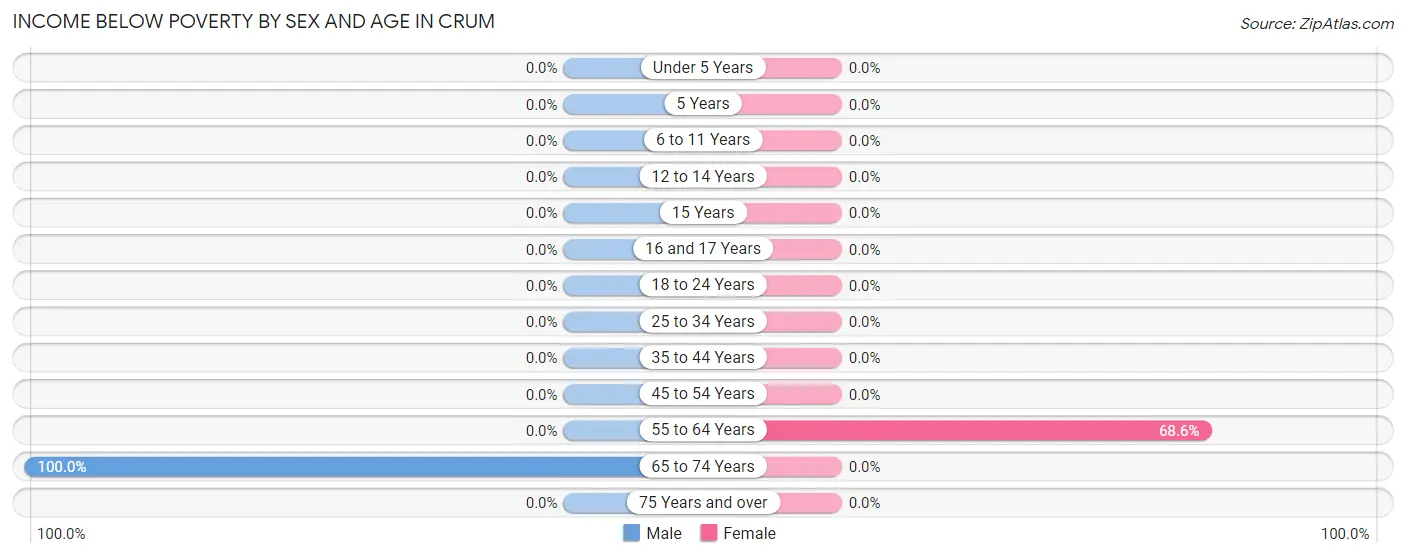
| Age Bracket | Male | Female |
| Under 5 Years | 0 (0.0%) | 0 (0.0%) |
| 5 Years | 0 (0.0%) | 0 (0.0%) |
| 6 to 11 Years | 0 (0.0%) | 0 (0.0%) |
| 12 to 14 Years | 0 (0.0%) | 0 (0.0%) |
| 15 Years | 0 (0.0%) | 0 (0.0%) |
| 16 and 17 Years | 0 (0.0%) | 0 (0.0%) |
| 18 to 24 Years | 0 (0.0%) | 0 (0.0%) |
| 25 to 34 Years | 0 (0.0%) | 0 (0.0%) |
| 35 to 44 Years | 0 (0.0%) | 0 (0.0%) |
| 45 to 54 Years | 0 (0.0%) | 0 (0.0%) |
| 55 to 64 Years | 0 (0.0%) | 24 (68.6%) |
| 65 to 74 Years | 38 (100.0%) | 0 (0.0%) |
| 75 Years and over | 0 (0.0%) | 0 (0.0%) |
| Total | 38 (48.7%) | 24 (36.9%) |
Income Above Poverty by Sex and Age in Crum
According to the poverty statistics in Crum, males aged 6 to 11 years and females aged under 5 years are the age groups that are most secure financially, with 100.0% of males and 100.0% of females in these age groups living above the poverty line.
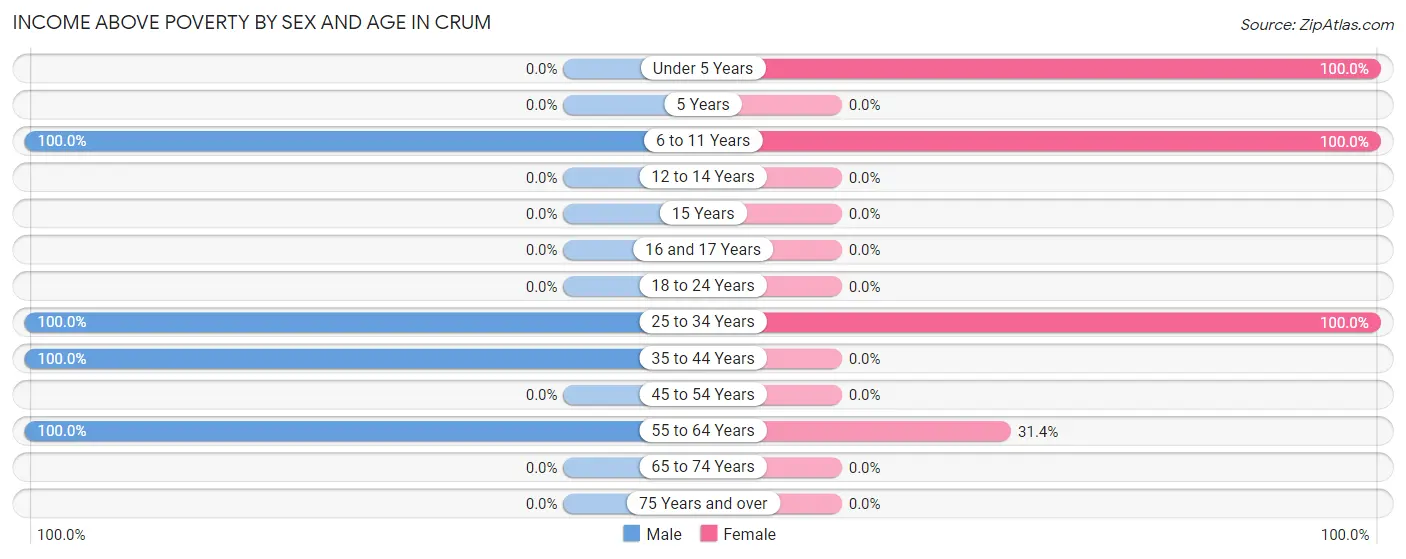
| Age Bracket | Male | Female |
| Under 5 Years | 0 (0.0%) | 8 (100.0%) |
| 5 Years | 0 (0.0%) | 0 (0.0%) |
| 6 to 11 Years | 6 (100.0%) | 13 (100.0%) |
| 12 to 14 Years | 0 (0.0%) | 0 (0.0%) |
| 15 Years | 0 (0.0%) | 0 (0.0%) |
| 16 and 17 Years | 0 (0.0%) | 0 (0.0%) |
| 18 to 24 Years | 0 (0.0%) | 0 (0.0%) |
| 25 to 34 Years | 7 (100.0%) | 9 (100.0%) |
| 35 to 44 Years | 16 (100.0%) | 0 (0.0%) |
| 45 to 54 Years | 0 (0.0%) | 0 (0.0%) |
| 55 to 64 Years | 11 (100.0%) | 11 (31.4%) |
| 65 to 74 Years | 0 (0.0%) | 0 (0.0%) |
| 75 Years and over | 0 (0.0%) | 0 (0.0%) |
| Total | 40 (51.3%) | 41 (63.1%) |
Income Below Poverty Among Married-Couple Families in Crum
| Children | Above Poverty | Below Poverty |
| No Children | 0 (0.0%) | 0 (0.0%) |
| 1 or 2 Children | 20 (100.0%) | 0 (0.0%) |
| 3 or 4 Children | 0 (0.0%) | 0 (0.0%) |
| 5 or more Children | 0 (0.0%) | 0 (0.0%) |
| Total | 20 (100.0%) | 0 (0.0%) |
Income Below Poverty Among Single-Parent Households in Crum
| Children | Single Father | Single Mother |
| No Children | 0 (0.0%) | 24 (100.0%) |
| 1 or 2 Children | 0 (0.0%) | 0 (0.0%) |
| 3 or 4 Children | 0 (0.0%) | 0 (0.0%) |
| 5 or more Children | 0 (0.0%) | 0 (0.0%) |
| Total | 0 (0.0%) | 24 (100.0%) |
Income Below Poverty Among Married-Couple vs Single-Parent Households in Crum
| Children | Married-Couple Families | Single-Parent Households |
| No Children | 0 (0.0%) | 24 (100.0%) |
| 1 or 2 Children | 0 (0.0%) | 0 (0.0%) |
| 3 or 4 Children | 0 (0.0%) | 0 (0.0%) |
| 5 or more Children | 0 (0.0%) | 0 (0.0%) |
| Total | 0 (0.0%) | 24 (100.0%) |
Race in Crum
The most populous races in Crum are , and White / Caucasian (143 | 100.0%).
| Race | # Population | % Population |
| Asian | 0 | 0.0% |
| Black / African American | 0 | 0.0% |
| Hawaiian / Pacific | 0 | 0.0% |
| Hispanic or Latino | 0 | 0.0% |
| Native / Alaskan | 0 | 0.0% |
| White / Caucasian | 143 | 100.0% |
| Two or more Races | 0 | 0.0% |
| Some other Race | 0 | 0.0% |
| Total | 143 | 100.0% |
Ancestry in Crum
The most populous ancestries reported in Crum are , and American (51 | 35.7%), together accounting for 35.7% of all Crum residents.

| Ancestry | # Population | % Population |
| American | 51 | 35.7% | View All 1 Rows |
Immigrants in Crum

| Immigration Origin | # Population | % Population | View All 0 Rows |
Sex and Age in Crum
Sex and Age in Crum
The most populous age groups in Crum are 65 to 69 Years (38 | 48.7%) for men and 60 to 64 Years (35 | 53.8%) for women.
| Age Bracket | Male | Female |
| Under 5 Years | 0 (0.0%) | 8 (12.3%) |
| 5 to 9 Years | 6 (7.7%) | 13 (20.0%) |
| 10 to 14 Years | 0 (0.0%) | 0 (0.0%) |
| 15 to 19 Years | 0 (0.0%) | 0 (0.0%) |
| 20 to 24 Years | 0 (0.0%) | 0 (0.0%) |
| 25 to 29 Years | 0 (0.0%) | 9 (13.9%) |
| 30 to 34 Years | 7 (9.0%) | 0 (0.0%) |
| 35 to 39 Years | 16 (20.5%) | 0 (0.0%) |
| 40 to 44 Years | 0 (0.0%) | 0 (0.0%) |
| 45 to 49 Years | 0 (0.0%) | 0 (0.0%) |
| 50 to 54 Years | 0 (0.0%) | 0 (0.0%) |
| 55 to 59 Years | 0 (0.0%) | 0 (0.0%) |
| 60 to 64 Years | 11 (14.1%) | 35 (53.8%) |
| 65 to 69 Years | 38 (48.7%) | 0 (0.0%) |
| 70 to 74 Years | 0 (0.0%) | 0 (0.0%) |
| 75 to 79 Years | 0 (0.0%) | 0 (0.0%) |
| 80 to 84 Years | 0 (0.0%) | 0 (0.0%) |
| 85 Years and over | 0 (0.0%) | 0 (0.0%) |
| Total | 78 (100.0%) | 65 (100.0%) |
Families and Households in Crum
Median Family Size in Crum
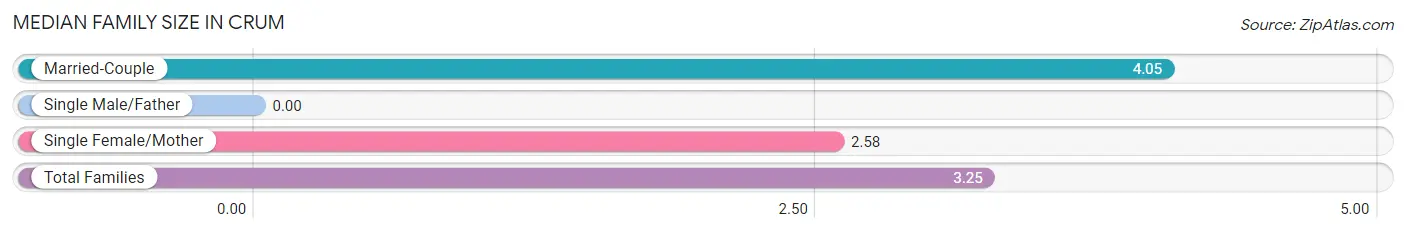
| Family Type | # Families | Family Size |
| Married-Couple | 20 (45.5%) | 4.05 |
| Single Male/Father | 0 (0.0%) | - |
| Single Female/Mother | 24 (54.5%) | 2.58 |
| Total Families | 44 (100.0%) | 3.25 |
Median Household Size in Crum
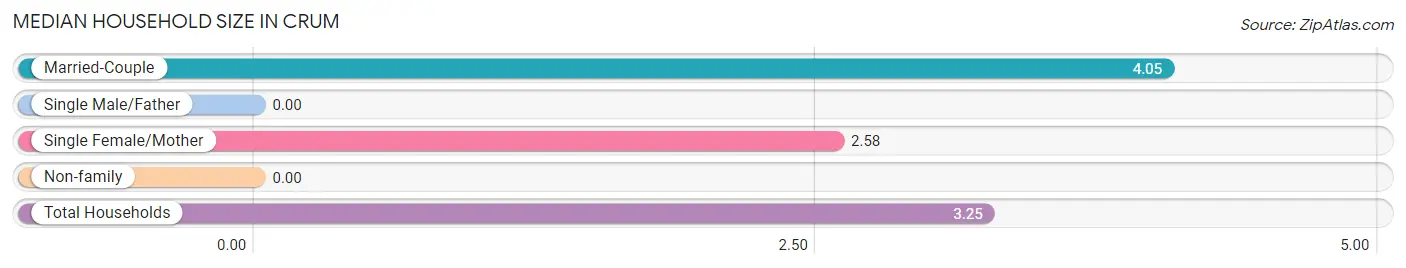
| Household Type | # Households | Household Size |
| Married-Couple | 20 (45.5%) | 4.05 |
| Single Male/Father | 0 (0.0%) | - |
| Single Female/Mother | 24 (54.5%) | 2.58 |
| Non-family | 0 (0.0%) | - |
| Total Households | 44 (100.0%) | 3.25 |
Household Size by Marriage Status in Crum
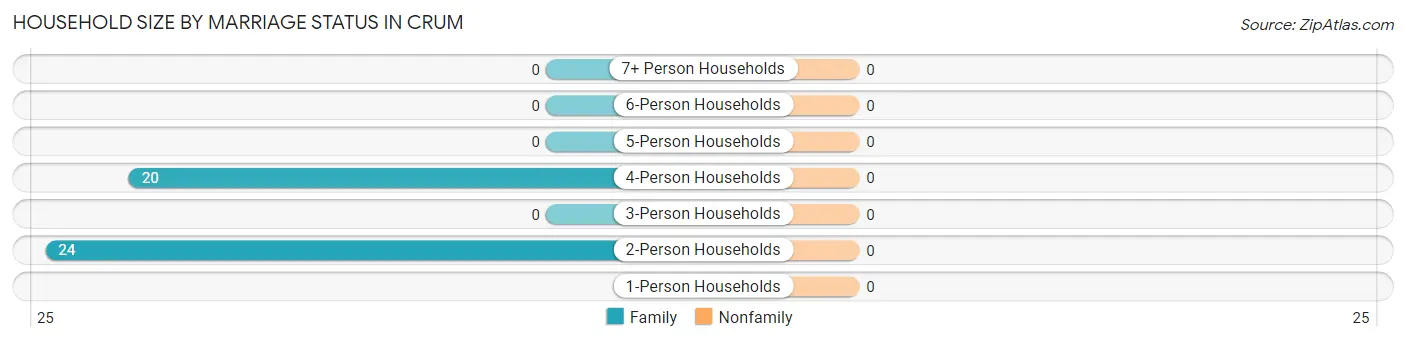
| Household Size | Family Households | Nonfamily Households |
| 1-Person Households | - | 0 (0.0%) |
| 2-Person Households | 24 (54.5%) | 0 (0.0%) |
| 3-Person Households | 0 (0.0%) | 0 (0.0%) |
| 4-Person Households | 20 (45.5%) | 0 (0.0%) |
| 5-Person Households | 0 (0.0%) | 0 (0.0%) |
| 6-Person Households | 0 (0.0%) | 0 (0.0%) |
| 7+ Person Households | 0 (0.0%) | 0 (0.0%) |
| Total | 44 (100.0%) | 0 (0.0%) |
Female Fertility in Crum
Fertility by Age in Crum
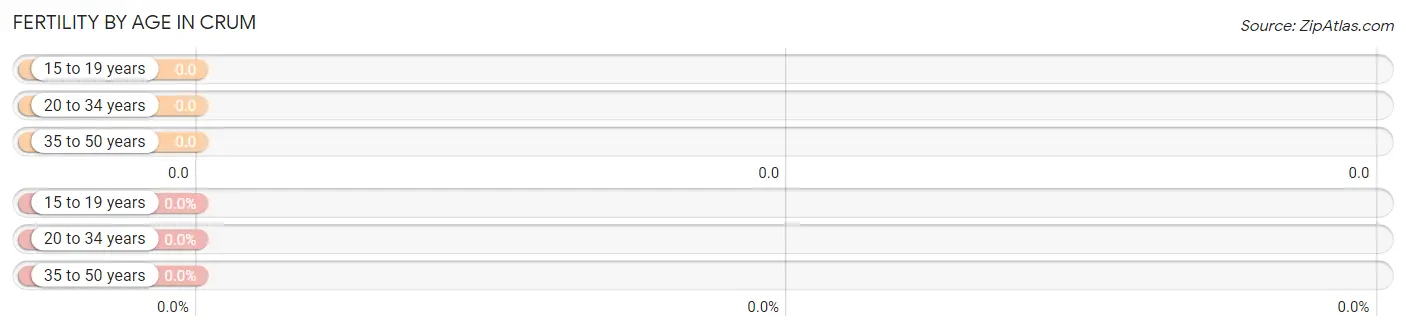
| Age Bracket | Women with Births | Births / 1,000 Women |
| 15 to 19 years | 0 (0.0%) | 0.0 |
| 20 to 34 years | 0 (0.0%) | 0.0 |
| 35 to 50 years | 0 (0.0%) | 0.0 |
| Total | 0 (0.0%) | 0.0 |
Fertility by Age by Marriage Status in Crum
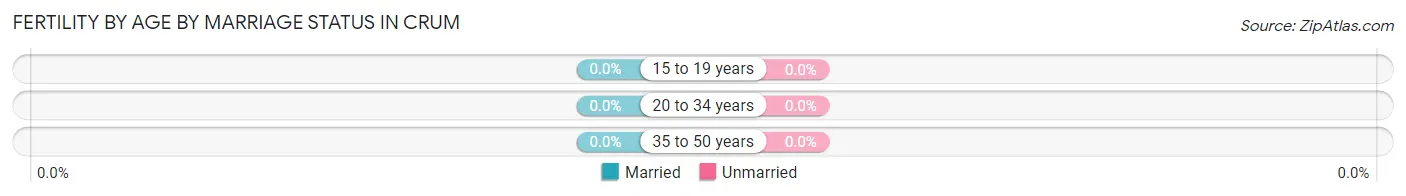
| Age Bracket | Married | Unmarried |
| 15 to 19 years | 0 (0.0%) | 0 (0.0%) |
| 20 to 34 years | 0 (0.0%) | 0 (0.0%) |
| 35 to 50 years | 0 (0.0%) | 0 (0.0%) |
| Total | 0 (0.0%) | 0 (0.0%) |
Fertility by Education in Crum
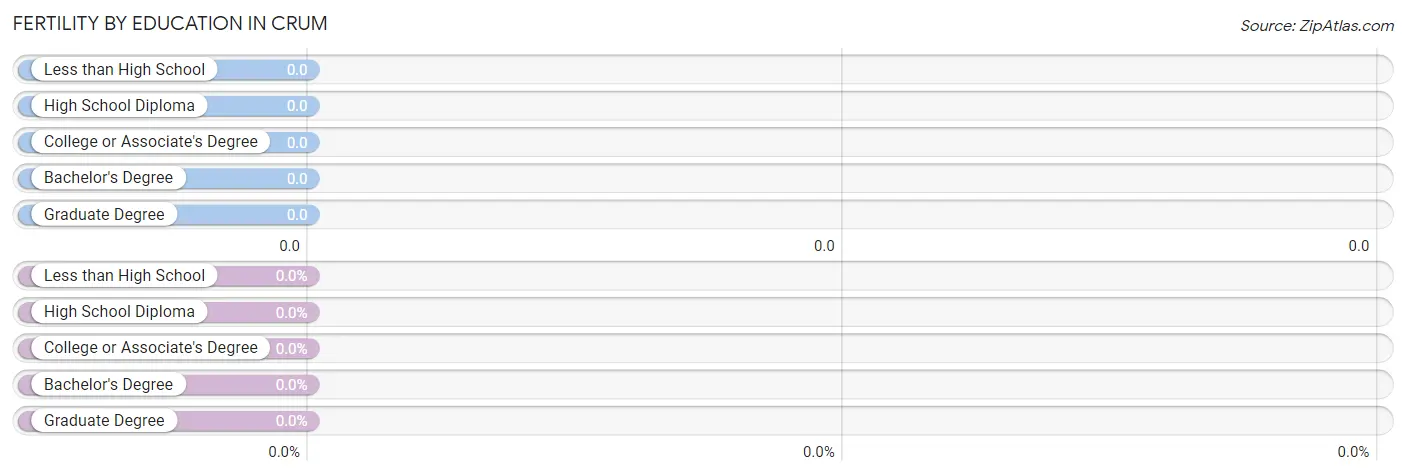
| Educational Attainment | Women with Births | Births / 1,000 Women |
| Less than High School | 0 (0.0%) | 0.0 |
| High School Diploma | 0 (0.0%) | 0.0 |
| College or Associate's Degree | 0 (0.0%) | 0.0 |
| Bachelor's Degree | 0 (0.0%) | 0.0 |
| Graduate Degree | 0 (0.0%) | 0.0 |
| Total | 0 (0.0%) | 0.0 |
Fertility by Education by Marriage Status in Crum
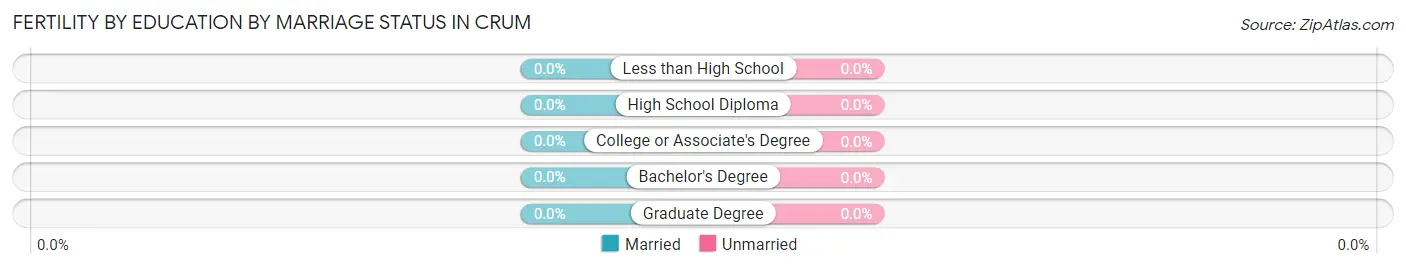
| Educational Attainment | Married | Unmarried |
| Less than High School | 0 (0.0%) | 0 (0.0%) |
| High School Diploma | 0 (0.0%) | 0 (0.0%) |
| College or Associate's Degree | 0 (0.0%) | 0 (0.0%) |
| Bachelor's Degree | 0 (0.0%) | 0 (0.0%) |
| Graduate Degree | 0 (0.0%) | 0 (0.0%) |
| Total | 0 (0.0%) | 0 (0.0%) |
Employment Characteristics in Crum
Employment by Class of Employer in Crum
Among the 23 employed individuals in Crum, federal government employees (16 | 69.6%), and private company employees (7 | 30.4%) make up the most common classes of employment.
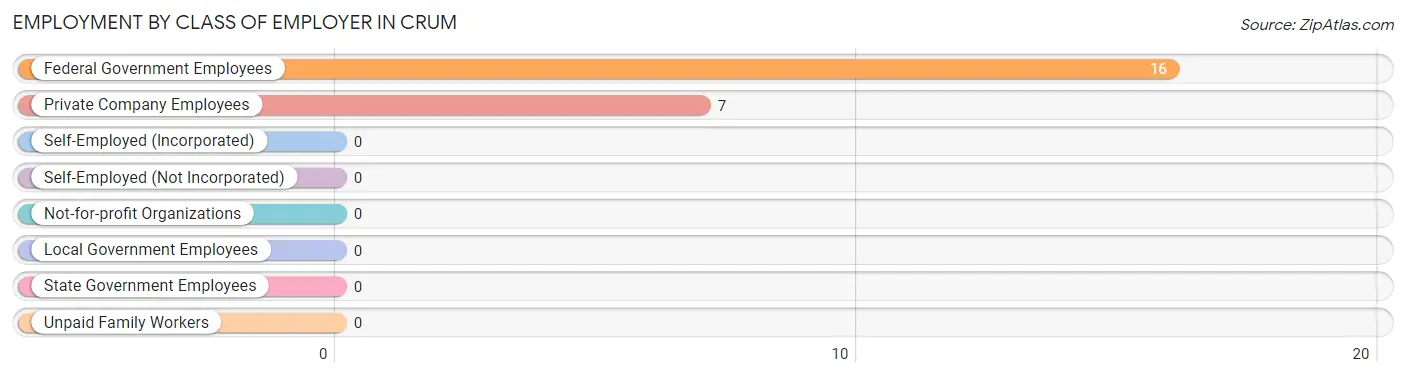
| Employer Class | # Employees | % Employees |
| Private Company Employees | 7 | 30.4% |
| Self-Employed (Incorporated) | 0 | 0.0% |
| Self-Employed (Not Incorporated) | 0 | 0.0% |
| Not-for-profit Organizations | 0 | 0.0% |
| Local Government Employees | 0 | 0.0% |
| State Government Employees | 0 | 0.0% |
| Federal Government Employees | 16 | 69.6% |
| Unpaid Family Workers | 0 | 0.0% |
| Total | 23 | 100.0% |
Employment Status by Age in Crum
According to the labor force statistics for Crum, out of the total population over 16 years of age (116), 27.6% or 32 individuals are in the labor force, with 28.1% or 9 of them unemployed. The age group with the highest labor force participation rate is 25 to 29 years, with 100.0% or 9 individuals in the labor force. Within the labor force, the 25 to 29 years age range has the highest percentage of unemployed individuals, with 100.0% or 9 of them being unemployed.
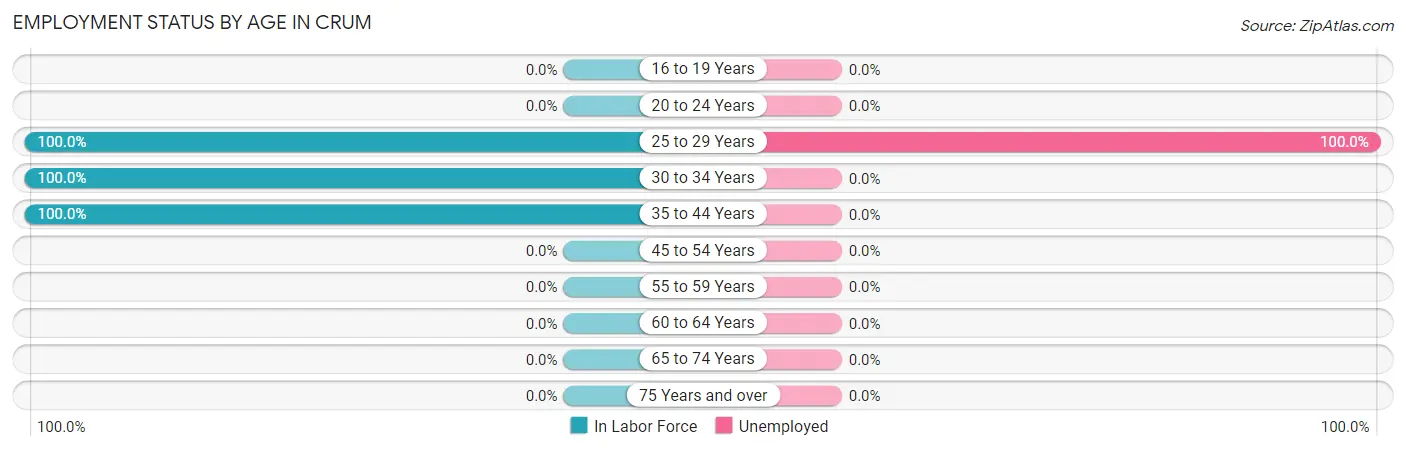
| Age Bracket | In Labor Force | Unemployed |
| 16 to 19 Years | 0 (0.0%) | 0 (0.0%) |
| 20 to 24 Years | 0 (0.0%) | 0 (0.0%) |
| 25 to 29 Years | 9 (100.0%) | 9 (100.0%) |
| 30 to 34 Years | 7 (100.0%) | 0 (0.0%) |
| 35 to 44 Years | 16 (100.0%) | 0 (0.0%) |
| 45 to 54 Years | 0 (0.0%) | 0 (0.0%) |
| 55 to 59 Years | 0 (0.0%) | 0 (0.0%) |
| 60 to 64 Years | 0 (0.0%) | 0 (0.0%) |
| 65 to 74 Years | 0 (0.0%) | 0 (0.0%) |
| 75 Years and over | 0 (0.0%) | 0 (0.0%) |
| Total | 32 (27.6%) | 9 (28.1%) |
Employment Status by Educational Attainment in Crum
According to labor force statistics for Crum, 41.0% of individuals (32) out of the total population between 25 and 64 years of age (78) are in the labor force, with 28.1% or 9 of them being unemployed. The group with the highest labor force participation rate are those with the educational attainment of high school diploma, with 42.1% or 16 individuals in the labor force. Within the labor force, individuals with high school diploma education have the highest percentage of unemployment, with 56.3% or 9 of them being unemployed.
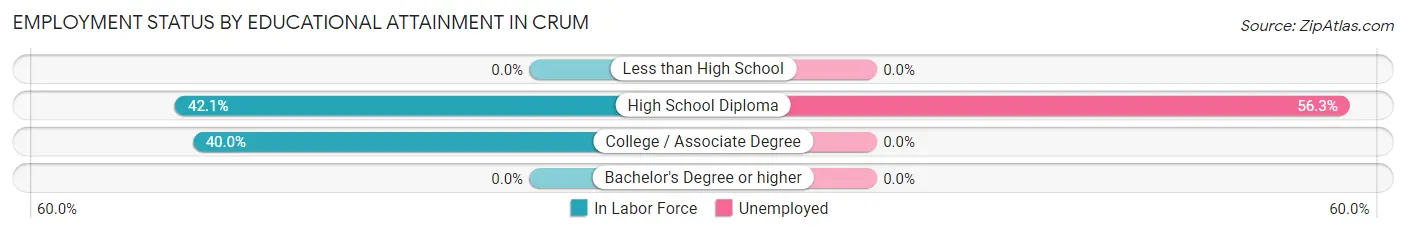
| Educational Attainment | In Labor Force | Unemployed |
| Less than High School | 0 (0.0%) | 0 (0.0%) |
| High School Diploma | 16 (42.1%) | 21 (56.3%) |
| College / Associate Degree | 16 (40.0%) | 0 (0.0%) |
| Bachelor's Degree or higher | 0 (0.0%) | 0 (0.0%) |
| Total | 32 (41.0%) | 22 (28.1%) |
Employment Occupations by Sex in Crum
Management, Business, Science and Arts Occupations
Management, Business, Science and Arts Occupations by Sex
| Occupation | Male | Female |
| Management | 0 (0.0%) | 0 (0.0%) |
| Business & Financial | 0 (0.0%) | 0 (0.0%) |
| Computers, Engineering & Science | 0 (0.0%) | 0 (0.0%) |
| Computers & Mathematics | 0 (0.0%) | 0 (0.0%) |
| Architecture & Engineering | 0 (0.0%) | 0 (0.0%) |
| Life, Physical & Social Science | 0 (0.0%) | 0 (0.0%) |
| Community & Social Service | 0 (0.0%) | 0 (0.0%) |
| Education, Arts & Media | 0 (0.0%) | 0 (0.0%) |
| Legal Services & Support | 0 (0.0%) | 0 (0.0%) |
| Education Instruction & Library | 0 (0.0%) | 0 (0.0%) |
| Arts, Media & Entertainment | 0 (0.0%) | 0 (0.0%) |
| Health Diagnosing & Treating | 0 (0.0%) | 0 (0.0%) |
| Health Technologists | 0 (0.0%) | 0 (0.0%) |
| Total (Category) | 0 (0.0%) | 0 (0.0%) |
| Total (Overall) | 23 (100.0%) | 0 (0.0%) |
Services Occupations
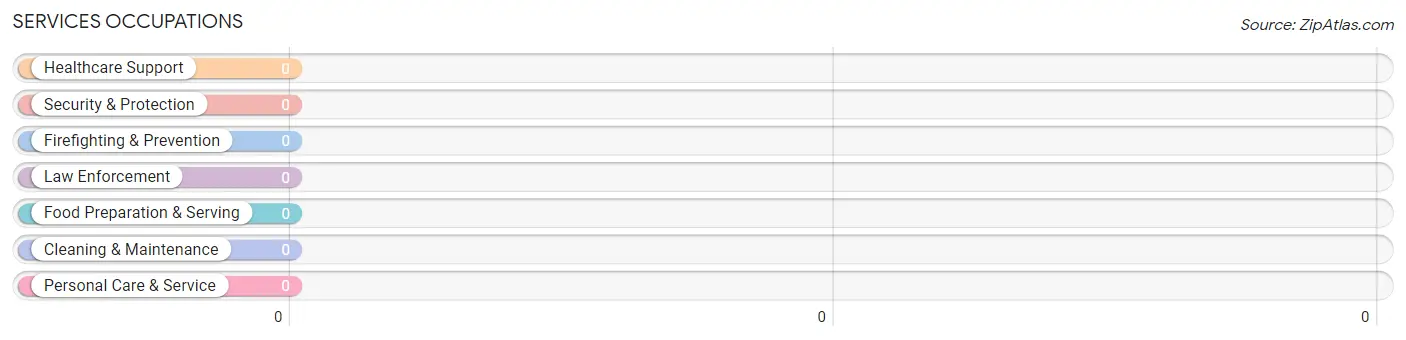
Services Occupations by Sex
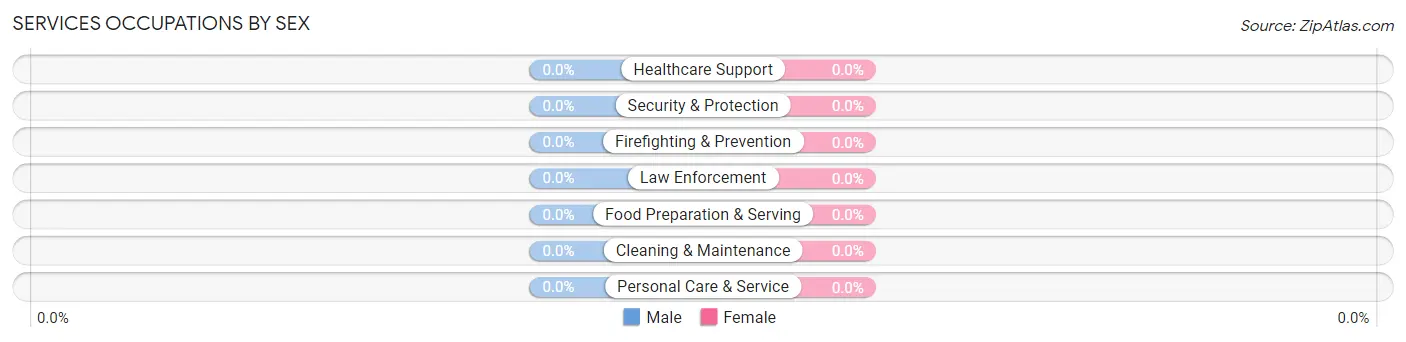
| Occupation | Male | Female |
| Healthcare Support | 0 (0.0%) | 0 (0.0%) |
| Security & Protection | 0 (0.0%) | 0 (0.0%) |
| Firefighting & Prevention | 0 (0.0%) | 0 (0.0%) |
| Law Enforcement | 0 (0.0%) | 0 (0.0%) |
| Food Preparation & Serving | 0 (0.0%) | 0 (0.0%) |
| Cleaning & Maintenance | 0 (0.0%) | 0 (0.0%) |
| Personal Care & Service | 0 (0.0%) | 0 (0.0%) |
| Total (Category) | 0 (0.0%) | 0 (0.0%) |
| Total (Overall) | 23 (100.0%) | 0 (0.0%) |
Sales and Office Occupations
The most common Sales and Office occupations in Crum are , and Office & Administration (16 | 69.6%).
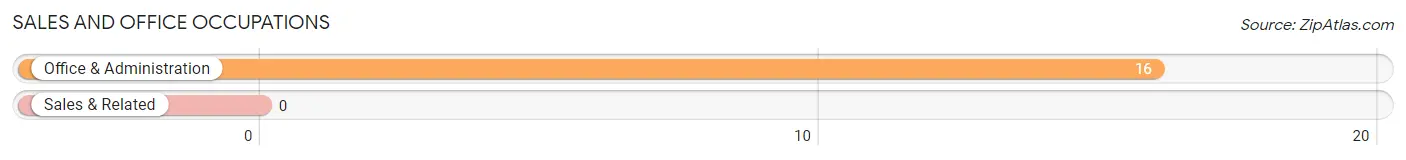
Sales and Office Occupations by Sex
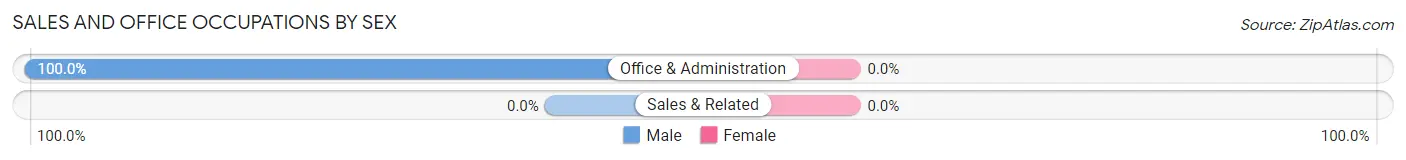
| Occupation | Male | Female |
| Sales & Related | 0 (0.0%) | 0 (0.0%) |
| Office & Administration | 16 (100.0%) | 0 (0.0%) |
| Total (Category) | 16 (100.0%) | 0 (0.0%) |
| Total (Overall) | 23 (100.0%) | 0 (0.0%) |
Natural Resources, Construction and Maintenance Occupations
Natural Resources, Construction and Maintenance Occupations by Sex
| Occupation | Male | Female |
| Farming, Fishing & Forestry | 0 (0.0%) | 0 (0.0%) |
| Construction & Extraction | 0 (0.0%) | 0 (0.0%) |
| Installation, Maintenance & Repair | 0 (0.0%) | 0 (0.0%) |
| Total (Category) | 0 (0.0%) | 0 (0.0%) |
| Total (Overall) | 23 (100.0%) | 0 (0.0%) |
Production, Transportation and Moving Occupations
The most common Production, Transportation and Moving occupations in Crum are , and Transportation (7 | 30.4%).
Production, Transportation and Moving Occupations by Sex
| Occupation | Male | Female |
| Production | 0 (0.0%) | 0 (0.0%) |
| Transportation | 7 (100.0%) | 0 (0.0%) |
| Material Moving | 0 (0.0%) | 0 (0.0%) |
| Total (Category) | 7 (100.0%) | 0 (0.0%) |
| Total (Overall) | 23 (100.0%) | 0 (0.0%) |
Employment Industries by Sex in Crum
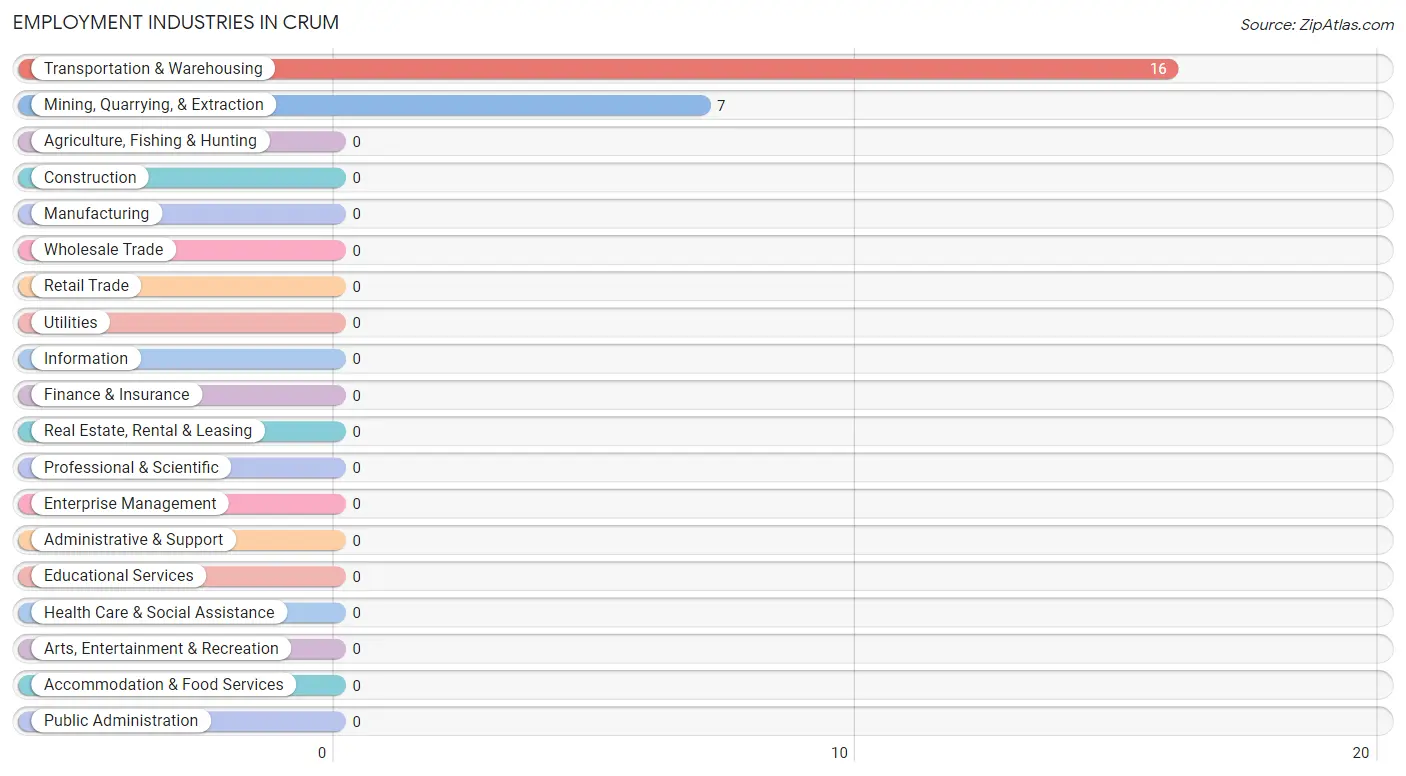
Employment Industries in Crum
The major employment industries in Crum include Transportation & Warehousing (16 | 69.6%), and Mining, Quarrying, & Extraction (7 | 30.4%).
Employment Industries by Sex in Crum
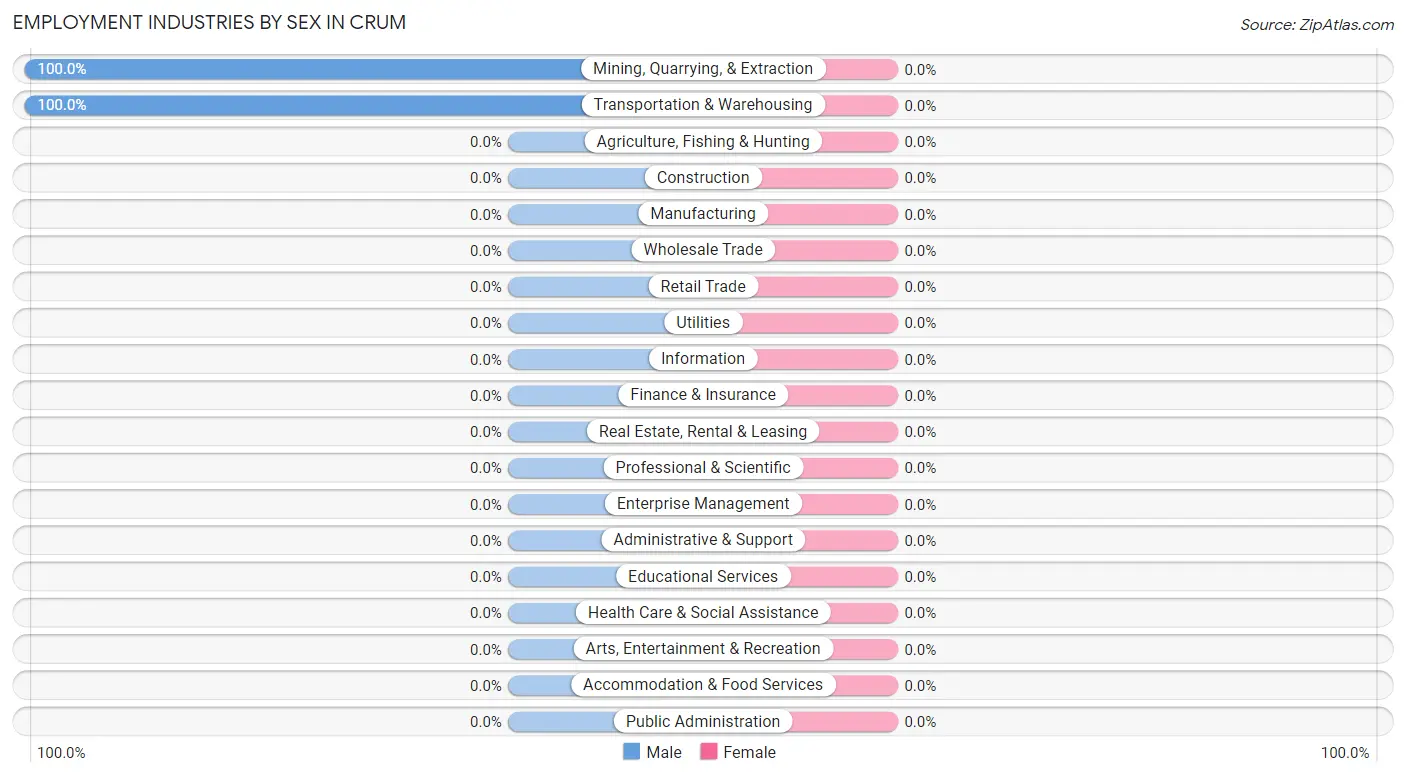
| Industry | Male | Female |
| Agriculture, Fishing & Hunting | 0 (0.0%) | 0 (0.0%) |
| Mining, Quarrying, & Extraction | 7 (100.0%) | 0 (0.0%) |
| Construction | 0 (0.0%) | 0 (0.0%) |
| Manufacturing | 0 (0.0%) | 0 (0.0%) |
| Wholesale Trade | 0 (0.0%) | 0 (0.0%) |
| Retail Trade | 0 (0.0%) | 0 (0.0%) |
| Transportation & Warehousing | 16 (100.0%) | 0 (0.0%) |
| Utilities | 0 (0.0%) | 0 (0.0%) |
| Information | 0 (0.0%) | 0 (0.0%) |
| Finance & Insurance | 0 (0.0%) | 0 (0.0%) |
| Real Estate, Rental & Leasing | 0 (0.0%) | 0 (0.0%) |
| Professional & Scientific | 0 (0.0%) | 0 (0.0%) |
| Enterprise Management | 0 (0.0%) | 0 (0.0%) |
| Administrative & Support | 0 (0.0%) | 0 (0.0%) |
| Educational Services | 0 (0.0%) | 0 (0.0%) |
| Health Care & Social Assistance | 0 (0.0%) | 0 (0.0%) |
| Arts, Entertainment & Recreation | 0 (0.0%) | 0 (0.0%) |
| Accommodation & Food Services | 0 (0.0%) | 0 (0.0%) |
| Public Administration | 0 (0.0%) | 0 (0.0%) |
| Total | 23 (100.0%) | 0 (0.0%) |
Education in Crum
School Enrollment in Crum
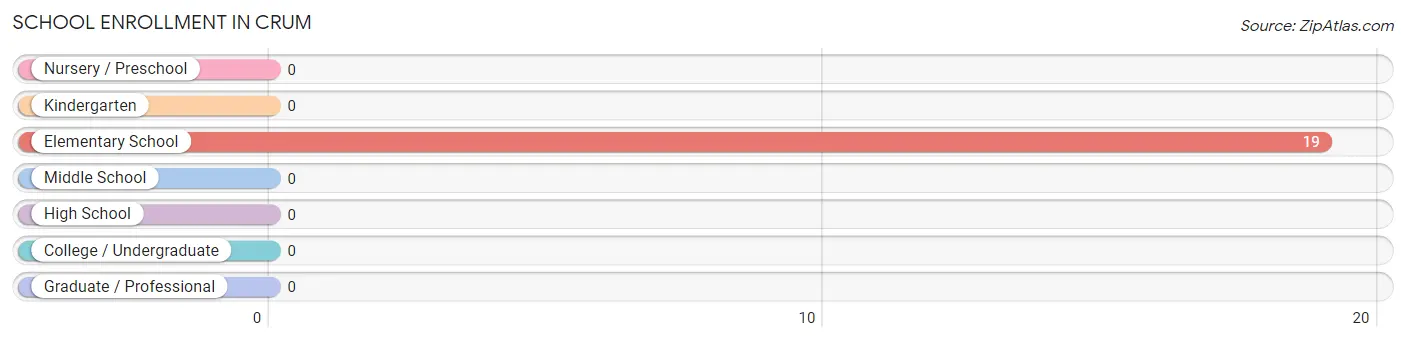
| School Level | # Students | % Students |
| Nursery / Preschool | 0 | 0.0% |
| Kindergarten | 0 | 0.0% |
| Elementary School | 19 | 100.0% |
| Middle School | 0 | 0.0% |
| High School | 0 | 0.0% |
| College / Undergraduate | 0 | 0.0% |
| Graduate / Professional | 0 | 0.0% |
| Total | 19 | 100.0% |
School Enrollment by Age by Funding Source in Crum
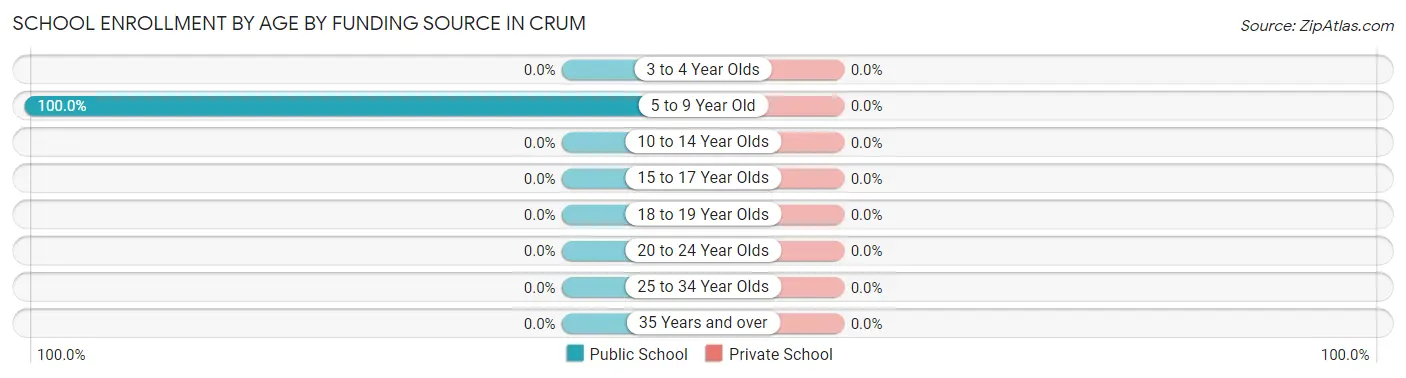
| Age Bracket | Public School | Private School |
| 3 to 4 Year Olds | 0 (0.0%) | 0 (0.0%) |
| 5 to 9 Year Old | 19 (100.0%) | 0 (0.0%) |
| 10 to 14 Year Olds | 0 (0.0%) | 0 (0.0%) |
| 15 to 17 Year Olds | 0 (0.0%) | 0 (0.0%) |
| 18 to 19 Year Olds | 0 (0.0%) | 0 (0.0%) |
| 20 to 24 Year Olds | 0 (0.0%) | 0 (0.0%) |
| 25 to 34 Year Olds | 0 (0.0%) | 0 (0.0%) |
| 35 Years and over | 0 (0.0%) | 0 (0.0%) |
| Total | 19 (100.0%) | 0 (0.0%) |
Educational Attainment by Field of Study in Crum
| Field of Study | # Graduates | % Graduates |
| Computers & Mathematics | 0 | 0.0% |
| Bio, Nature & Agricultural | 0 | 0.0% |
| Physical & Health Sciences | 0 | 0.0% |
| Psychology | 0 | 0.0% |
| Social Sciences | 0 | 0.0% |
| Engineering | 0 | 0.0% |
| Multidisciplinary Studies | 0 | 0.0% |
| Science & Technology | 0 | 0.0% |
| Business | 0 | 0.0% |
| Education | 0 | 0.0% |
| Literature & Languages | 0 | 0.0% |
| Liberal Arts & History | 0 | 0.0% |
| Visual & Performing Arts | 0 | 0.0% |
| Communications | 0 | 0.0% |
| Arts & Humanities | 0 | 0.0% |
| Total | 0 | 0.0% |
Transportation & Commute in Crum
Vehicle Availability by Sex in Crum
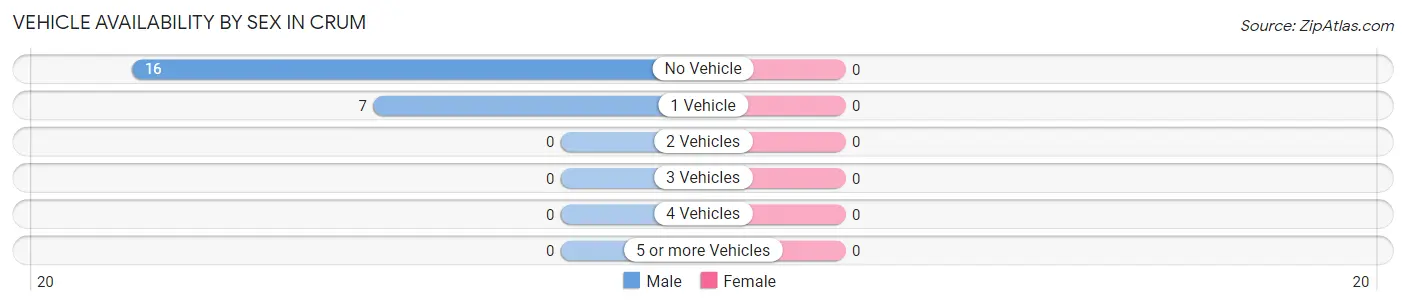
| Vehicles Available | Male | Female |
| No Vehicle | 16 (69.6%) | 0 (0.0%) |
| 1 Vehicle | 7 (30.4%) | 0 (0.0%) |
| 2 Vehicles | 0 (0.0%) | 0 (0.0%) |
| 3 Vehicles | 0 (0.0%) | 0 (0.0%) |
| 4 Vehicles | 0 (0.0%) | 0 (0.0%) |
| 5 or more Vehicles | 0 (0.0%) | 0 (0.0%) |
| Total | 23 (100.0%) | 0 (0.0%) |
Commute Time in Crum
The most frequently occuring commute durations in Crum are 45 to 59 minutes (16 commuters, 69.6%), 40 to 44 minutes (7 commuters, 30.4%), and less than 5 minutes (0 commuters, 0.0%).
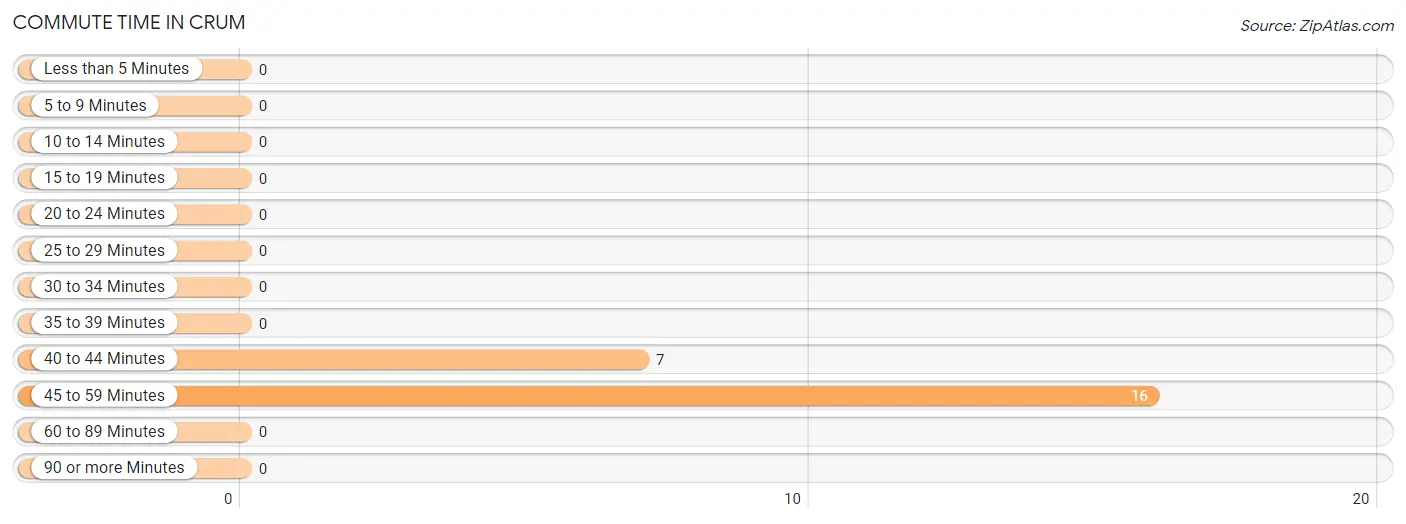
| Commute Time | # Commuters | % Commuters |
| Less than 5 Minutes | 0 | 0.0% |
| 5 to 9 Minutes | 0 | 0.0% |
| 10 to 14 Minutes | 0 | 0.0% |
| 15 to 19 Minutes | 0 | 0.0% |
| 20 to 24 Minutes | 0 | 0.0% |
| 25 to 29 Minutes | 0 | 0.0% |
| 30 to 34 Minutes | 0 | 0.0% |
| 35 to 39 Minutes | 0 | 0.0% |
| 40 to 44 Minutes | 7 | 30.4% |
| 45 to 59 Minutes | 16 | 69.6% |
| 60 to 89 Minutes | 0 | 0.0% |
| 90 or more Minutes | 0 | 0.0% |
Commute Time by Sex in Crum
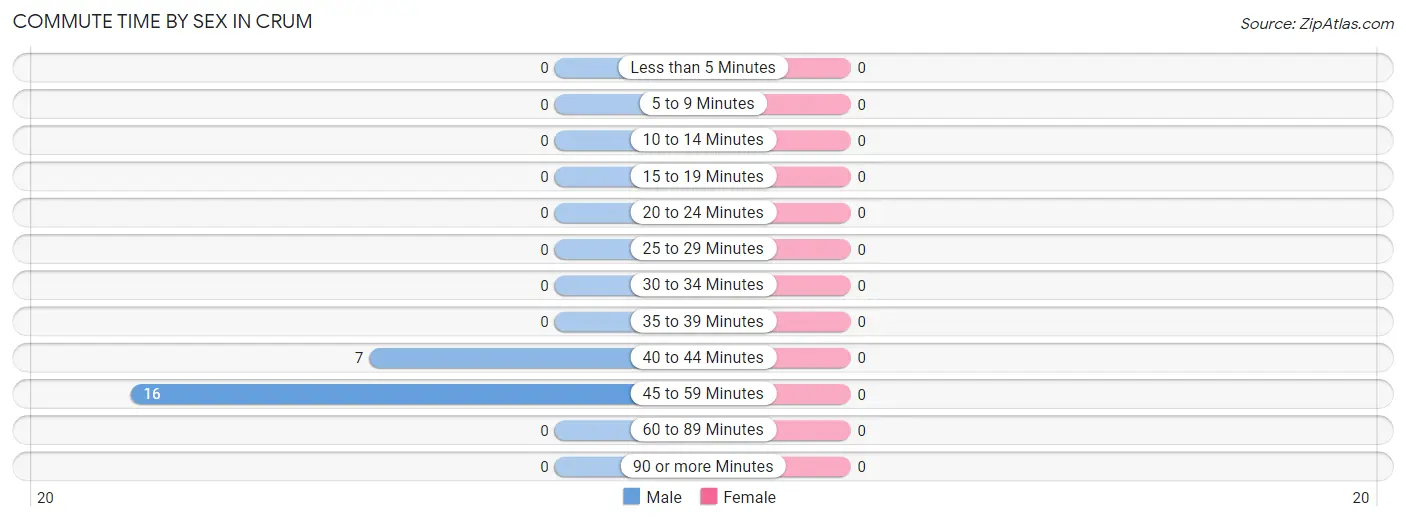
| Commute Time | Male | Female |
| Less than 5 Minutes | 0 (0.0%) | 0 (0.0%) |
| 5 to 9 Minutes | 0 (0.0%) | 0 (0.0%) |
| 10 to 14 Minutes | 0 (0.0%) | 0 (0.0%) |
| 15 to 19 Minutes | 0 (0.0%) | 0 (0.0%) |
| 20 to 24 Minutes | 0 (0.0%) | 0 (0.0%) |
| 25 to 29 Minutes | 0 (0.0%) | 0 (0.0%) |
| 30 to 34 Minutes | 0 (0.0%) | 0 (0.0%) |
| 35 to 39 Minutes | 0 (0.0%) | 0 (0.0%) |
| 40 to 44 Minutes | 7 (30.4%) | 0 (0.0%) |
| 45 to 59 Minutes | 16 (69.6%) | 0 (0.0%) |
| 60 to 89 Minutes | 0 (0.0%) | 0 (0.0%) |
| 90 or more Minutes | 0 (0.0%) | 0 (0.0%) |
Time of Departure to Work by Sex in Crum
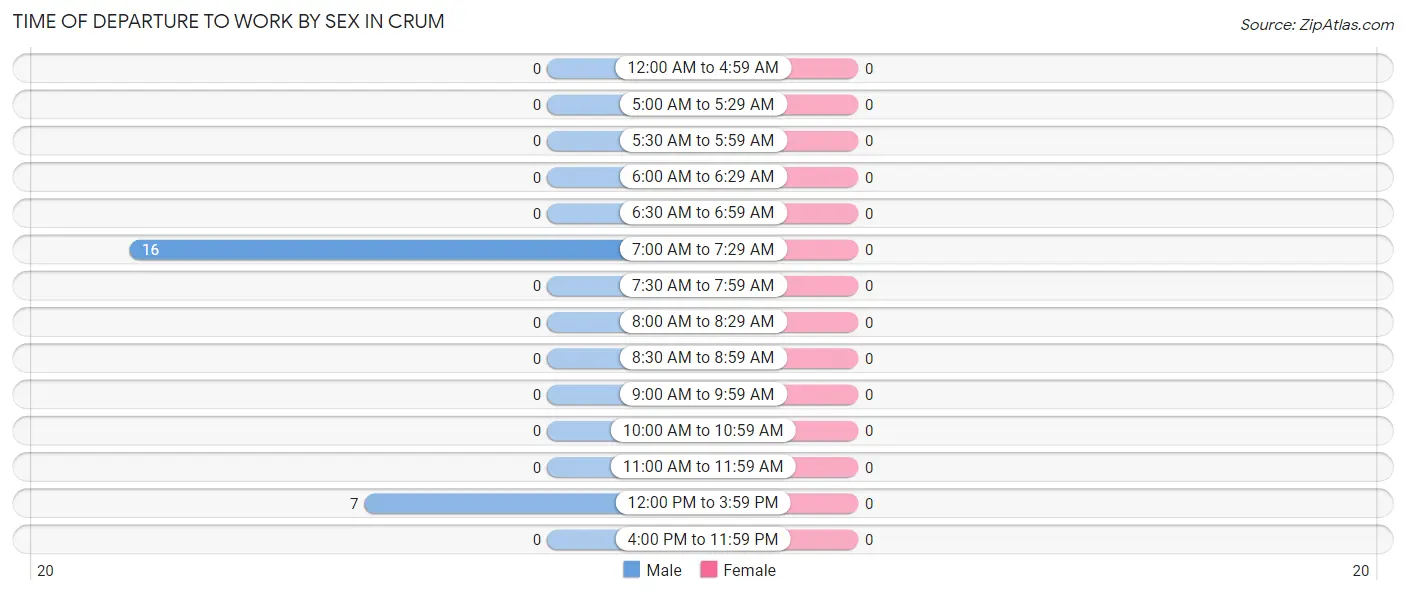
| Time of Departure | Male | Female |
| 12:00 AM to 4:59 AM | 0 (0.0%) | 0 (0.0%) |
| 5:00 AM to 5:29 AM | 0 (0.0%) | 0 (0.0%) |
| 5:30 AM to 5:59 AM | 0 (0.0%) | 0 (0.0%) |
| 6:00 AM to 6:29 AM | 0 (0.0%) | 0 (0.0%) |
| 6:30 AM to 6:59 AM | 0 (0.0%) | 0 (0.0%) |
| 7:00 AM to 7:29 AM | 16 (69.6%) | 0 (0.0%) |
| 7:30 AM to 7:59 AM | 0 (0.0%) | 0 (0.0%) |
| 8:00 AM to 8:29 AM | 0 (0.0%) | 0 (0.0%) |
| 8:30 AM to 8:59 AM | 0 (0.0%) | 0 (0.0%) |
| 9:00 AM to 9:59 AM | 0 (0.0%) | 0 (0.0%) |
| 10:00 AM to 10:59 AM | 0 (0.0%) | 0 (0.0%) |
| 11:00 AM to 11:59 AM | 0 (0.0%) | 0 (0.0%) |
| 12:00 PM to 3:59 PM | 7 (30.4%) | 0 (0.0%) |
| 4:00 PM to 11:59 PM | 0 (0.0%) | 0 (0.0%) |
| Total | 23 (100.0%) | 0 (0.0%) |
Housing Occupancy in Crum
Occupancy by Ownership in Crum
Of the total 44 dwellings in Crum, owner-occupied units account for 20 (45.5%), while renter-occupied units make up 24 (54.5%).
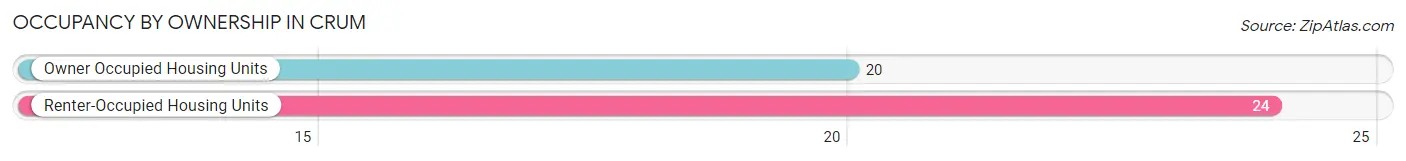
| Occupancy | # Housing Units | % Housing Units |
| Owner Occupied Housing Units | 20 | 45.5% |
| Renter-Occupied Housing Units | 24 | 54.5% |
| Total Occupied Housing Units | 44 | 100.0% |
Occupancy by Household Size in Crum
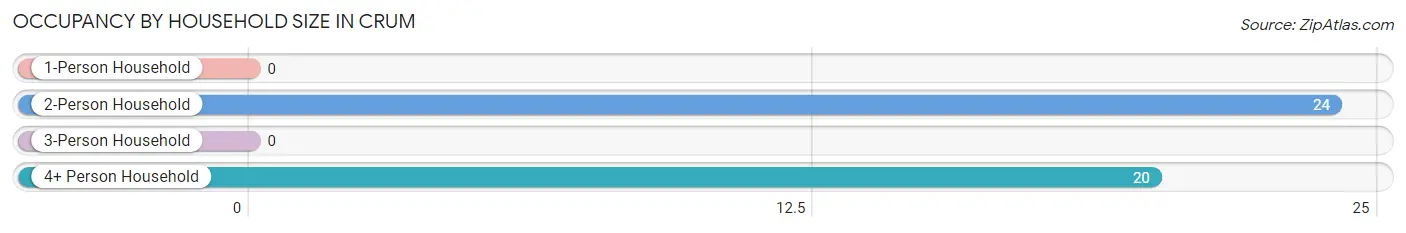
| Household Size | # Housing Units | % Housing Units |
| 1-Person Household | 0 | 0.0% |
| 2-Person Household | 24 | 54.5% |
| 3-Person Household | 0 | 0.0% |
| 4+ Person Household | 20 | 45.5% |
| Total Housing Units | 44 | 100.0% |
Occupancy by Ownership by Household Size in Crum
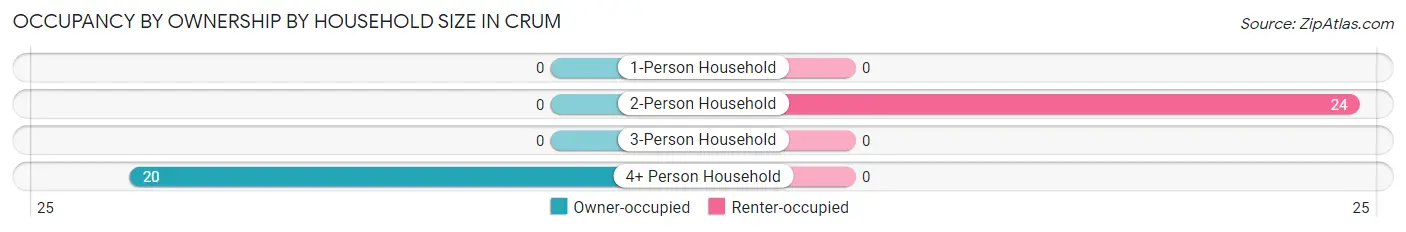
| Household Size | Owner-occupied | Renter-occupied |
| 1-Person Household | 0 (0.0%) | 0 (0.0%) |
| 2-Person Household | 0 (0.0%) | 24 (100.0%) |
| 3-Person Household | 0 (0.0%) | 0 (0.0%) |
| 4+ Person Household | 20 (100.0%) | 0 (0.0%) |
| Total Housing Units | 20 (45.5%) | 24 (54.5%) |
Occupancy by Educational Attainment in Crum
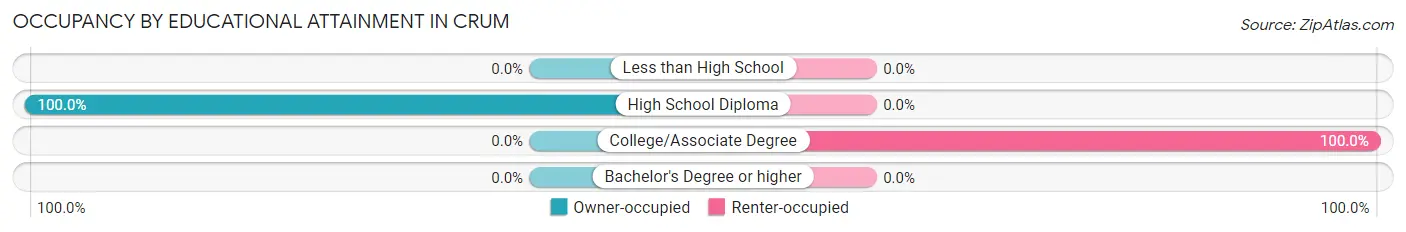
| Household Size | Owner-occupied | Renter-occupied |
| Less than High School | 0 (0.0%) | 0 (0.0%) |
| High School Diploma | 20 (100.0%) | 0 (0.0%) |
| College/Associate Degree | 0 (0.0%) | 24 (100.0%) |
| Bachelor's Degree or higher | 0 (0.0%) | 0 (0.0%) |
Occupancy by Age of Householder in Crum
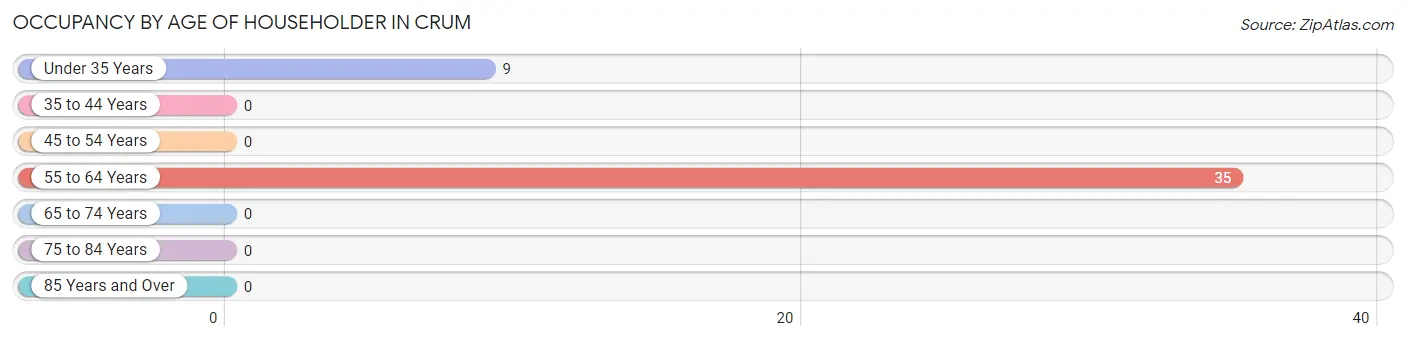
| Age Bracket | # Households | % Households |
| Under 35 Years | 9 | 20.4% |
| 35 to 44 Years | 0 | 0.0% |
| 45 to 54 Years | 0 | 0.0% |
| 55 to 64 Years | 35 | 79.5% |
| 65 to 74 Years | 0 | 0.0% |
| 75 to 84 Years | 0 | 0.0% |
| 85 Years and Over | 0 | 0.0% |
| Total | 44 | 100.0% |
Housing Finances in Crum
Median Income by Occupancy in Crum
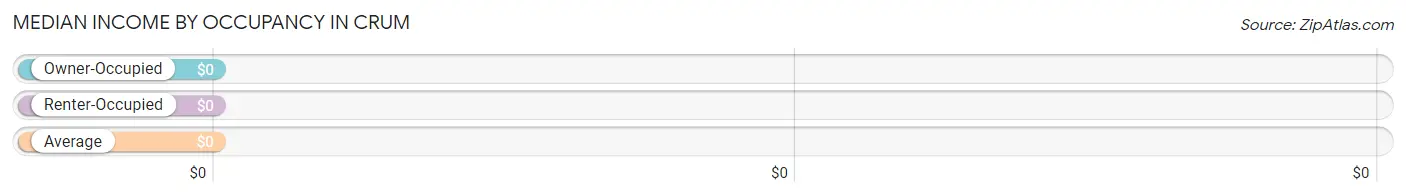
| Occupancy Type | # Households | Median Income |
| Owner-Occupied | 20 (45.5%) | $0 |
| Renter-Occupied | 24 (54.5%) | $0 |
| Average | 44 (100.0%) | $0 |
Occupancy by Householder Income Bracket in Crum
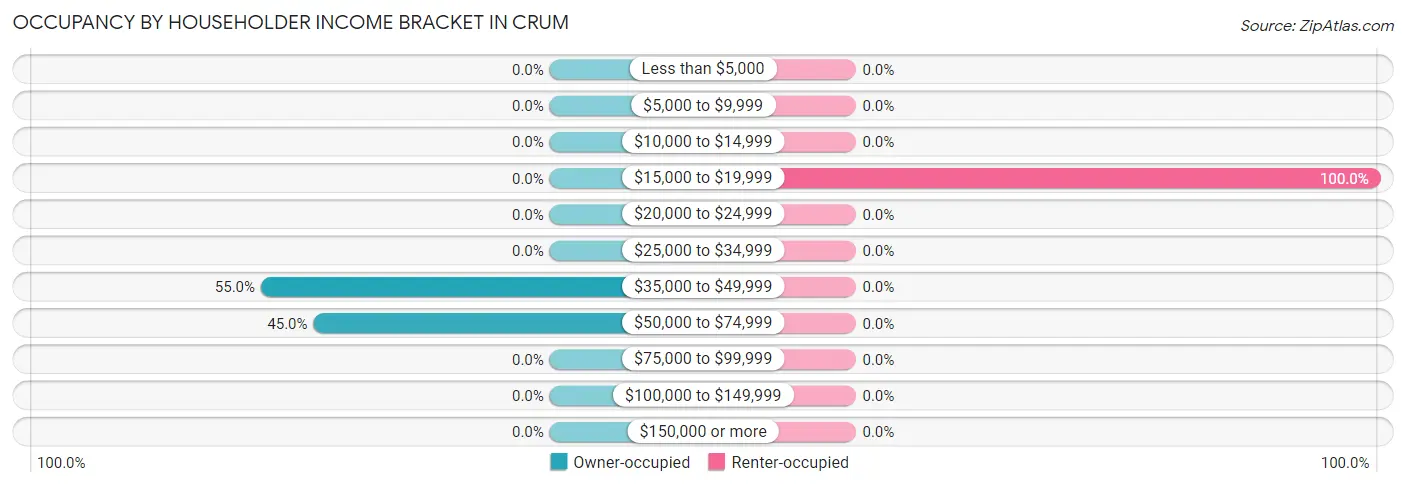
| Income Bracket | Owner-occupied | Renter-occupied |
| Less than $5,000 | 0 (0.0%) | 0 (0.0%) |
| $5,000 to $9,999 | 0 (0.0%) | 0 (0.0%) |
| $10,000 to $14,999 | 0 (0.0%) | 0 (0.0%) |
| $15,000 to $19,999 | 0 (0.0%) | 24 (100.0%) |
| $20,000 to $24,999 | 0 (0.0%) | 0 (0.0%) |
| $25,000 to $34,999 | 0 (0.0%) | 0 (0.0%) |
| $35,000 to $49,999 | 11 (55.0%) | 0 (0.0%) |
| $50,000 to $74,999 | 9 (45.0%) | 0 (0.0%) |
| $75,000 to $99,999 | 0 (0.0%) | 0 (0.0%) |
| $100,000 to $149,999 | 0 (0.0%) | 0 (0.0%) |
| $150,000 or more | 0 (0.0%) | 0 (0.0%) |
| Total | 20 (100.0%) | 24 (100.0%) |
Monthly Housing Cost Tiers in Crum
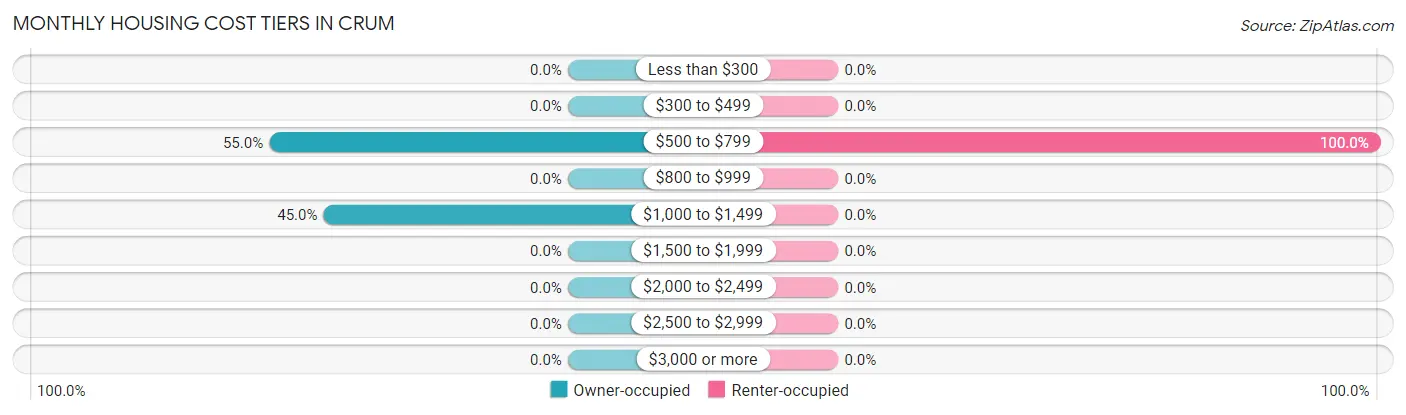
| Monthly Cost | Owner-occupied | Renter-occupied |
| Less than $300 | 0 (0.0%) | 0 (0.0%) |
| $300 to $499 | 0 (0.0%) | 0 (0.0%) |
| $500 to $799 | 11 (55.0%) | 24 (100.0%) |
| $800 to $999 | 0 (0.0%) | 0 (0.0%) |
| $1,000 to $1,499 | 9 (45.0%) | 0 (0.0%) |
| $1,500 to $1,999 | 0 (0.0%) | 0 (0.0%) |
| $2,000 to $2,499 | 0 (0.0%) | 0 (0.0%) |
| $2,500 to $2,999 | 0 (0.0%) | 0 (0.0%) |
| $3,000 or more | 0 (0.0%) | 0 (0.0%) |
| Total | 20 (100.0%) | 24 (100.0%) |
Physical Housing Characteristics in Crum
Housing Structures in Crum
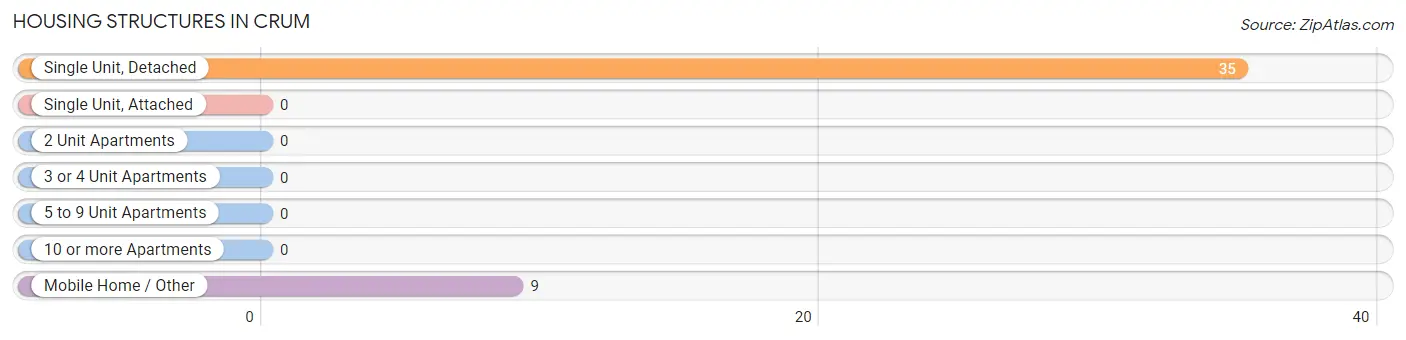
| Structure Type | # Housing Units | % Housing Units |
| Single Unit, Detached | 35 | 79.5% |
| Single Unit, Attached | 0 | 0.0% |
| 2 Unit Apartments | 0 | 0.0% |
| 3 or 4 Unit Apartments | 0 | 0.0% |
| 5 to 9 Unit Apartments | 0 | 0.0% |
| 10 or more Apartments | 0 | 0.0% |
| Mobile Home / Other | 9 | 20.4% |
| Total | 44 | 100.0% |
Housing Structures by Occupancy in Crum
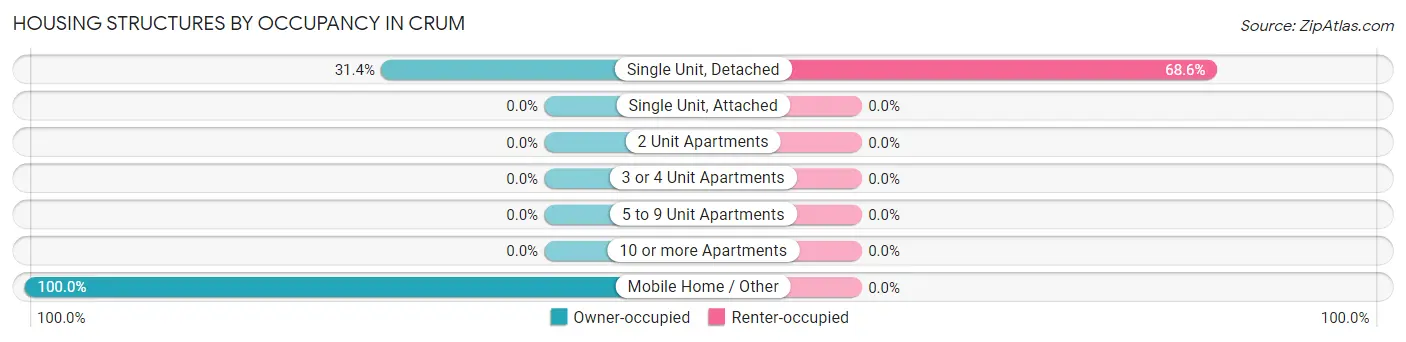
| Structure Type | Owner-occupied | Renter-occupied |
| Single Unit, Detached | 11 (31.4%) | 24 (68.6%) |
| Single Unit, Attached | 0 (0.0%) | 0 (0.0%) |
| 2 Unit Apartments | 0 (0.0%) | 0 (0.0%) |
| 3 or 4 Unit Apartments | 0 (0.0%) | 0 (0.0%) |
| 5 to 9 Unit Apartments | 0 (0.0%) | 0 (0.0%) |
| 10 or more Apartments | 0 (0.0%) | 0 (0.0%) |
| Mobile Home / Other | 9 (100.0%) | 0 (0.0%) |
| Total | 20 (45.5%) | 24 (54.5%) |
Housing Structures by Number of Rooms in Crum
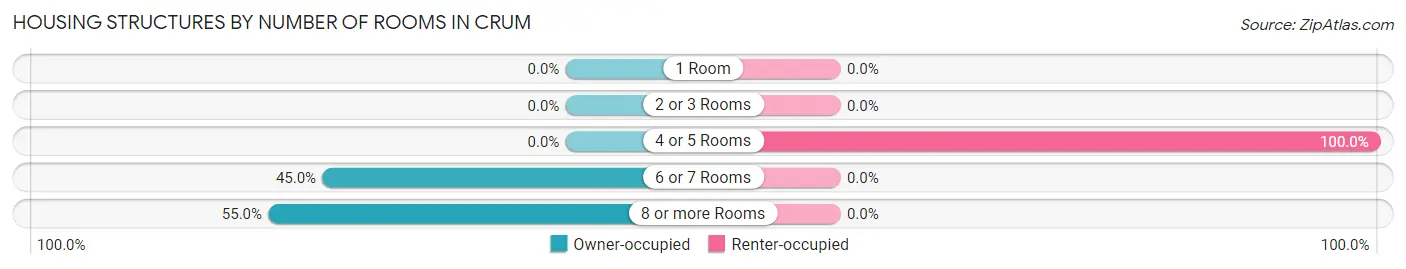
| Number of Rooms | Owner-occupied | Renter-occupied |
| 1 Room | 0 (0.0%) | 0 (0.0%) |
| 2 or 3 Rooms | 0 (0.0%) | 0 (0.0%) |
| 4 or 5 Rooms | 0 (0.0%) | 24 (100.0%) |
| 6 or 7 Rooms | 9 (45.0%) | 0 (0.0%) |
| 8 or more Rooms | 11 (55.0%) | 0 (0.0%) |
| Total | 20 (100.0%) | 24 (100.0%) |
Housing Structure by Heating Type in Crum
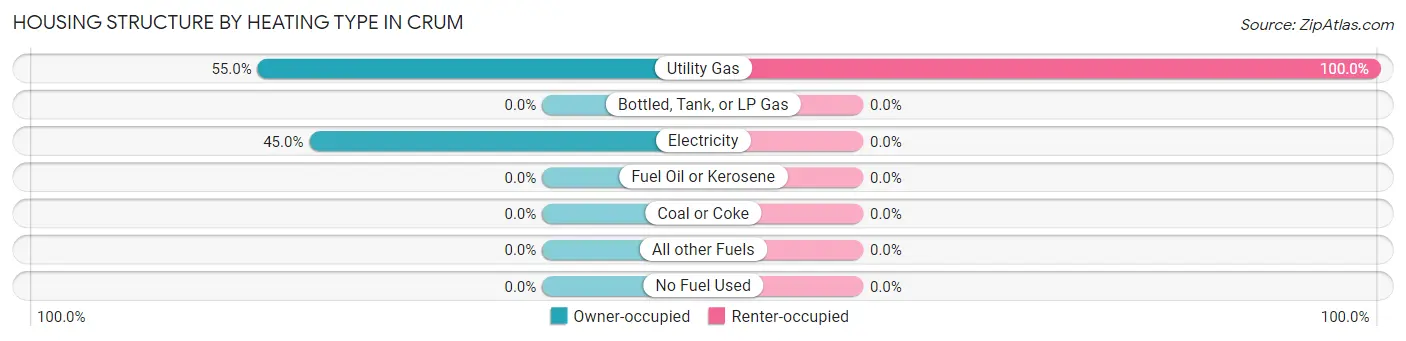
| Heating Type | Owner-occupied | Renter-occupied |
| Utility Gas | 11 (55.0%) | 24 (100.0%) |
| Bottled, Tank, or LP Gas | 0 (0.0%) | 0 (0.0%) |
| Electricity | 9 (45.0%) | 0 (0.0%) |
| Fuel Oil or Kerosene | 0 (0.0%) | 0 (0.0%) |
| Coal or Coke | 0 (0.0%) | 0 (0.0%) |
| All other Fuels | 0 (0.0%) | 0 (0.0%) |
| No Fuel Used | 0 (0.0%) | 0 (0.0%) |
| Total | 20 (100.0%) | 24 (100.0%) |
Household Vehicle Usage in Crum
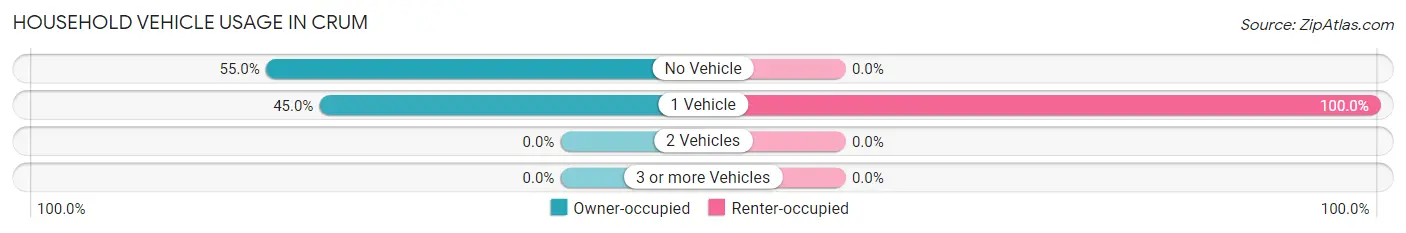
| Vehicles per Household | Owner-occupied | Renter-occupied |
| No Vehicle | 11 (55.0%) | 0 (0.0%) |
| 1 Vehicle | 9 (45.0%) | 24 (100.0%) |
| 2 Vehicles | 0 (0.0%) | 0 (0.0%) |
| 3 or more Vehicles | 0 (0.0%) | 0 (0.0%) |
| Total | 20 (100.0%) | 24 (100.0%) |
Real Estate & Mortgages in Crum
Real Estate and Mortgage Overview in Crum
| Characteristic | Without Mortgage | With Mortgage |
| Housing Units | 11 | 9 |
| Median Property Value | - | - |
| Median Household Income | - | - |
| Monthly Housing Costs | - | - |
| Real Estate Taxes | - | - |
Property Value by Mortgage Status in Crum
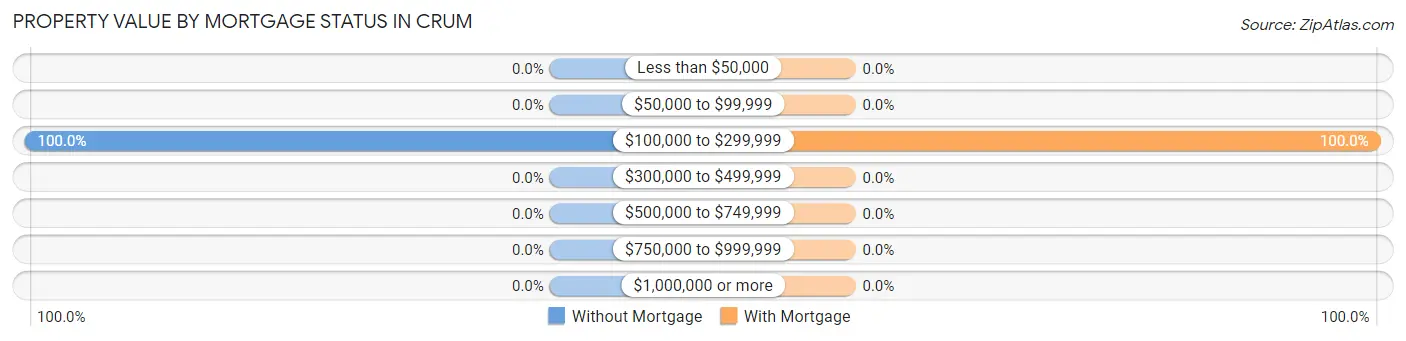
| Property Value | Without Mortgage | With Mortgage |
| Less than $50,000 | 0 (0.0%) | 0 (0.0%) |
| $50,000 to $99,999 | 0 (0.0%) | 0 (0.0%) |
| $100,000 to $299,999 | 11 (100.0%) | 9 (100.0%) |
| $300,000 to $499,999 | 0 (0.0%) | 0 (0.0%) |
| $500,000 to $749,999 | 0 (0.0%) | 0 (0.0%) |
| $750,000 to $999,999 | 0 (0.0%) | 0 (0.0%) |
| $1,000,000 or more | 0 (0.0%) | 0 (0.0%) |
| Total | 11 (100.0%) | 9 (100.0%) |
Household Income by Mortgage Status in Crum
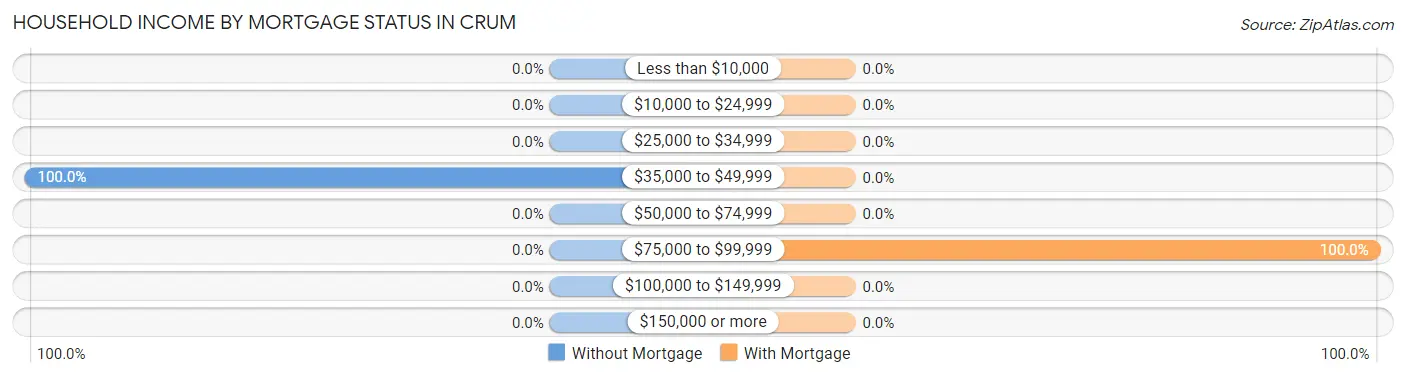
| Household Income | Without Mortgage | With Mortgage |
| Less than $10,000 | 0 (0.0%) | 0 (0.0%) |
| $10,000 to $24,999 | 0 (0.0%) | 0 (0.0%) |
| $25,000 to $34,999 | 0 (0.0%) | 0 (0.0%) |
| $35,000 to $49,999 | 11 (100.0%) | 0 (0.0%) |
| $50,000 to $74,999 | 0 (0.0%) | 0 (0.0%) |
| $75,000 to $99,999 | 0 (0.0%) | 9 (100.0%) |
| $100,000 to $149,999 | 0 (0.0%) | 0 (0.0%) |
| $150,000 or more | 0 (0.0%) | 0 (0.0%) |
| Total | 11 (100.0%) | 9 (100.0%) |
Property Value to Household Income Ratio in Crum
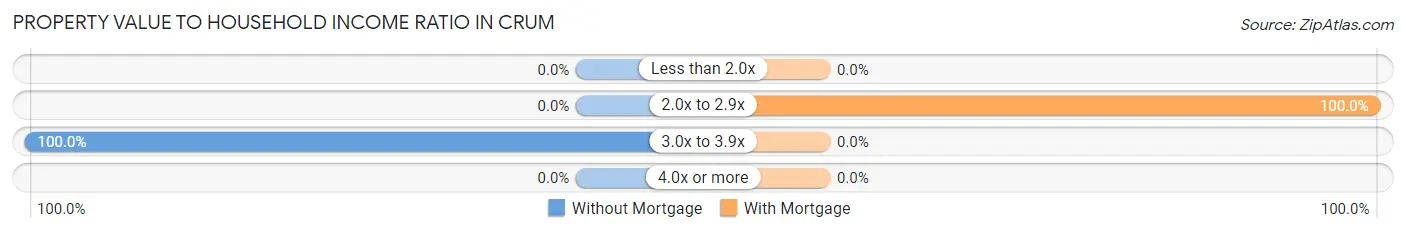
| Value-to-Income Ratio | Without Mortgage | With Mortgage |
| Less than 2.0x | 0 (0.0%) | 0 (0.0%) |
| 2.0x to 2.9x | 0 (0.0%) | 9 (100.0%) |
| 3.0x to 3.9x | 11 (100.0%) | 0 (0.0%) |
| 4.0x or more | 0 (0.0%) | 0 (0.0%) |
| Total | 11 (100.0%) | 9 (100.0%) |
Real Estate Taxes by Mortgage Status in Crum
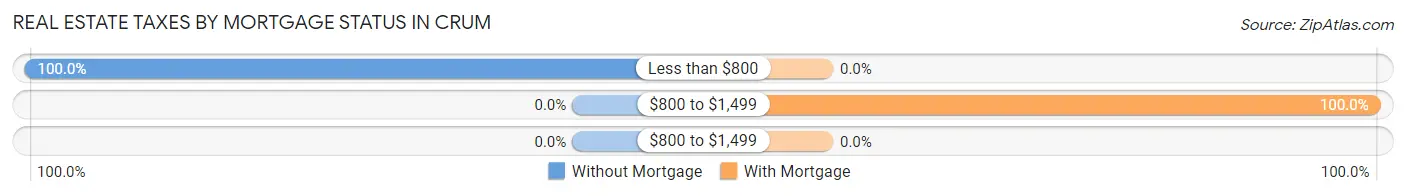
| Property Taxes | Without Mortgage | With Mortgage |
| Less than $800 | 11 (100.0%) | 0 (0.0%) |
| $800 to $1,499 | 0 (0.0%) | 9 (100.0%) |
| $800 to $1,499 | 0 (0.0%) | 0 (0.0%) |
| Total | 11 (100.0%) | 9 (100.0%) |
Health & Disability in Crum
Health Insurance Coverage by Age in Crum
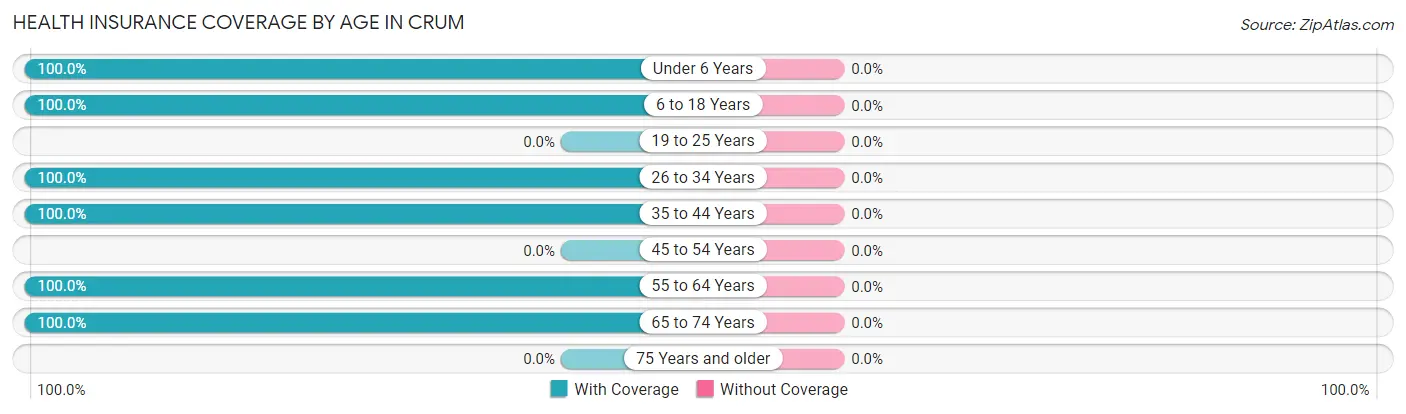
| Age Bracket | With Coverage | Without Coverage |
| Under 6 Years | 8 (100.0%) | 0 (0.0%) |
| 6 to 18 Years | 19 (100.0%) | 0 (0.0%) |
| 19 to 25 Years | 0 (0.0%) | 0 (0.0%) |
| 26 to 34 Years | 16 (100.0%) | 0 (0.0%) |
| 35 to 44 Years | 16 (100.0%) | 0 (0.0%) |
| 45 to 54 Years | 0 (0.0%) | 0 (0.0%) |
| 55 to 64 Years | 46 (100.0%) | 0 (0.0%) |
| 65 to 74 Years | 38 (100.0%) | 0 (0.0%) |
| 75 Years and older | 0 (0.0%) | 0 (0.0%) |
| Total | 143 (100.0%) | 0 (0.0%) |
Health Insurance Coverage by Citizenship Status in Crum
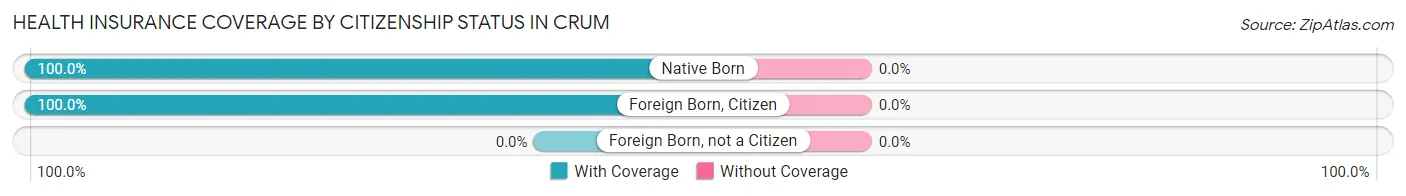
| Citizenship Status | With Coverage | Without Coverage |
| Native Born | 8 (100.0%) | 0 (0.0%) |
| Foreign Born, Citizen | 19 (100.0%) | 0 (0.0%) |
| Foreign Born, not a Citizen | 0 (0.0%) | 0 (0.0%) |
Health Insurance Coverage by Household Income in Crum
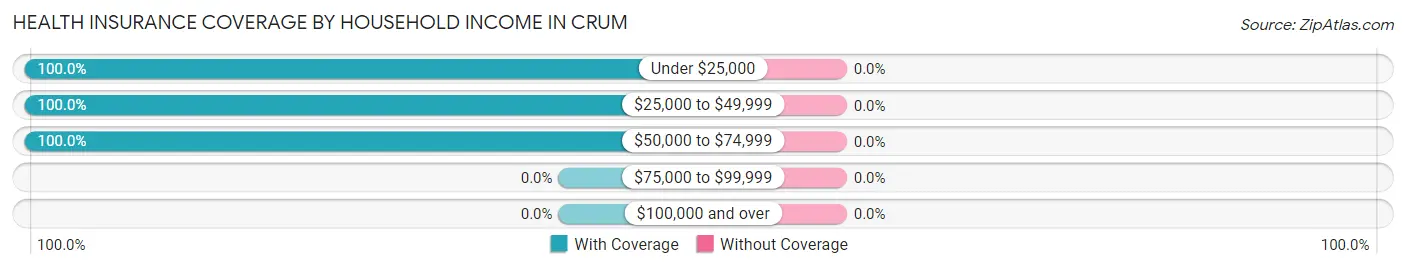
| Household Income | With Coverage | Without Coverage |
| Under $25,000 | 62 (100.0%) | 0 (0.0%) |
| $25,000 to $49,999 | 51 (100.0%) | 0 (0.0%) |
| $50,000 to $74,999 | 30 (100.0%) | 0 (0.0%) |
| $75,000 to $99,999 | 0 (0.0%) | 0 (0.0%) |
| $100,000 and over | 0 (0.0%) | 0 (0.0%) |
Public vs Private Health Insurance Coverage by Age in Crum
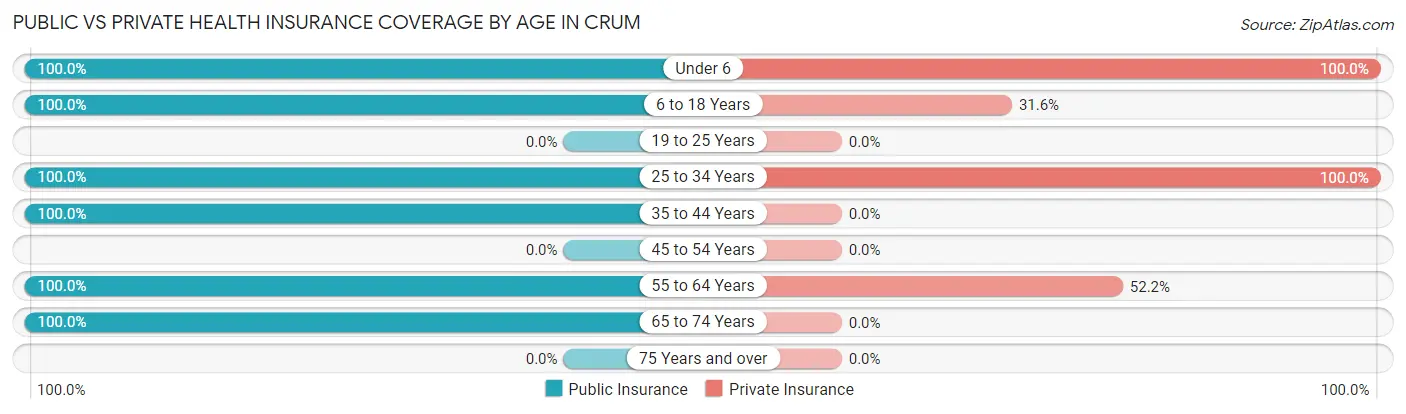
| Age Bracket | Public Insurance | Private Insurance |
| Under 6 | 8 (100.0%) | 8 (100.0%) |
| 6 to 18 Years | 19 (100.0%) | 6 (31.6%) |
| 19 to 25 Years | 0 (0.0%) | 0 (0.0%) |
| 25 to 34 Years | 16 (100.0%) | 16 (100.0%) |
| 35 to 44 Years | 16 (100.0%) | 0 (0.0%) |
| 45 to 54 Years | 0 (0.0%) | 0 (0.0%) |
| 55 to 64 Years | 46 (100.0%) | 24 (52.2%) |
| 65 to 74 Years | 38 (100.0%) | 0 (0.0%) |
| 75 Years and over | 0 (0.0%) | 0 (0.0%) |
| Total | 143 (100.0%) | 54 (37.8%) |
Disability Status by Sex by Age in Crum
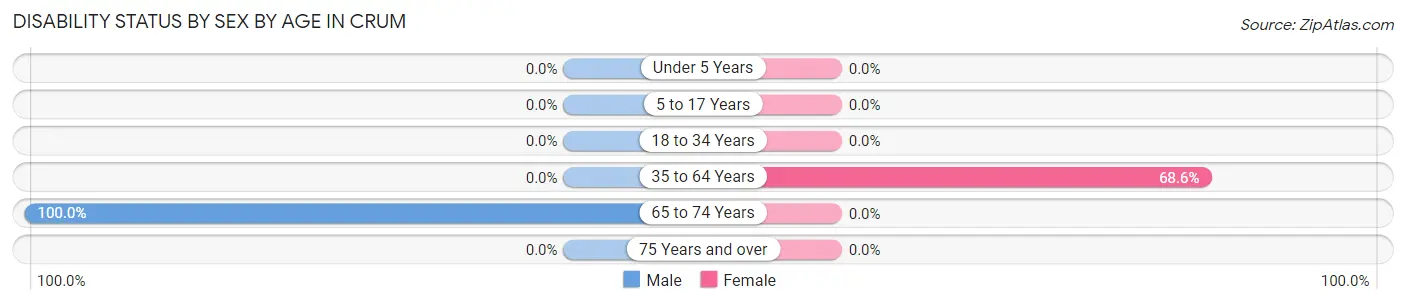
| Age Bracket | Male | Female |
| Under 5 Years | 0 (0.0%) | 0 (0.0%) |
| 5 to 17 Years | 0 (0.0%) | 0 (0.0%) |
| 18 to 34 Years | 0 (0.0%) | 0 (0.0%) |
| 35 to 64 Years | 0 (0.0%) | 24 (68.6%) |
| 65 to 74 Years | 38 (100.0%) | 0 (0.0%) |
| 75 Years and over | 0 (0.0%) | 0 (0.0%) |
Disability Class by Sex by Age in Crum
Disability Class: Hearing Difficulty
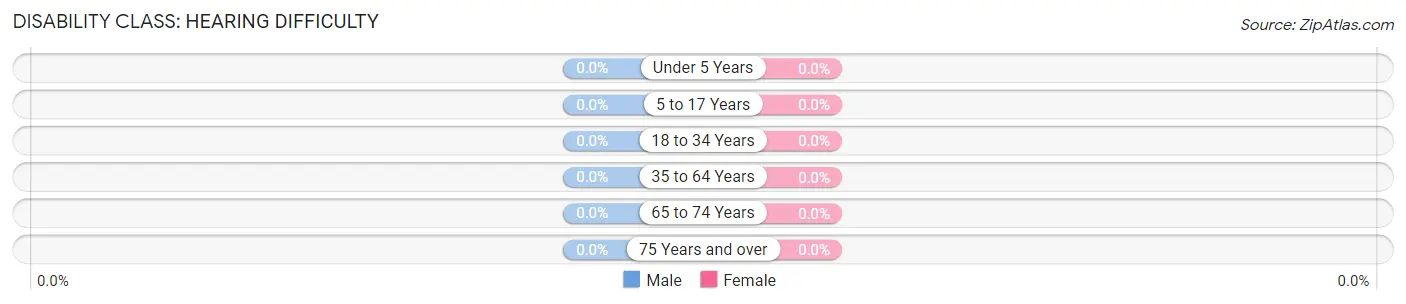
| Age Bracket | Male | Female |
| Under 5 Years | 0 (0.0%) | 0 (0.0%) |
| 5 to 17 Years | 0 (0.0%) | 0 (0.0%) |
| 18 to 34 Years | 0 (0.0%) | 0 (0.0%) |
| 35 to 64 Years | 0 (0.0%) | 0 (0.0%) |
| 65 to 74 Years | 0 (0.0%) | 0 (0.0%) |
| 75 Years and over | 0 (0.0%) | 0 (0.0%) |
Disability Class: Vision Difficulty
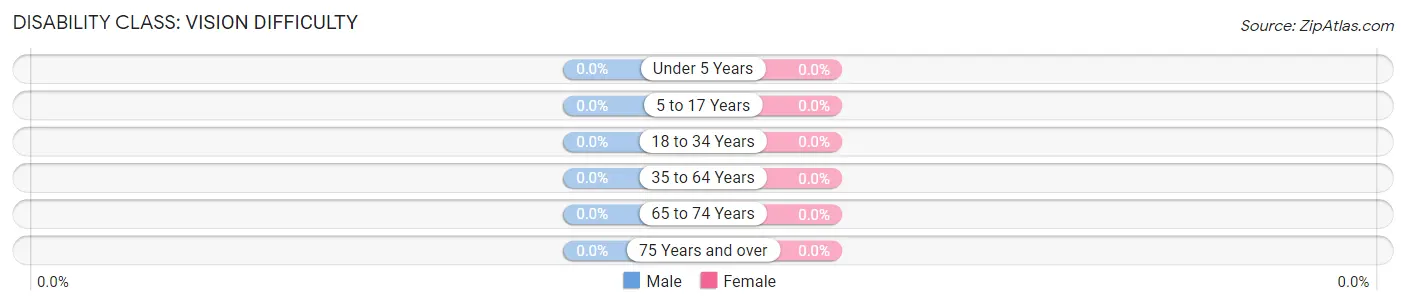
| Age Bracket | Male | Female |
| Under 5 Years | 0 (0.0%) | 0 (0.0%) |
| 5 to 17 Years | 0 (0.0%) | 0 (0.0%) |
| 18 to 34 Years | 0 (0.0%) | 0 (0.0%) |
| 35 to 64 Years | 0 (0.0%) | 0 (0.0%) |
| 65 to 74 Years | 0 (0.0%) | 0 (0.0%) |
| 75 Years and over | 0 (0.0%) | 0 (0.0%) |
Disability Class: Cognitive Difficulty
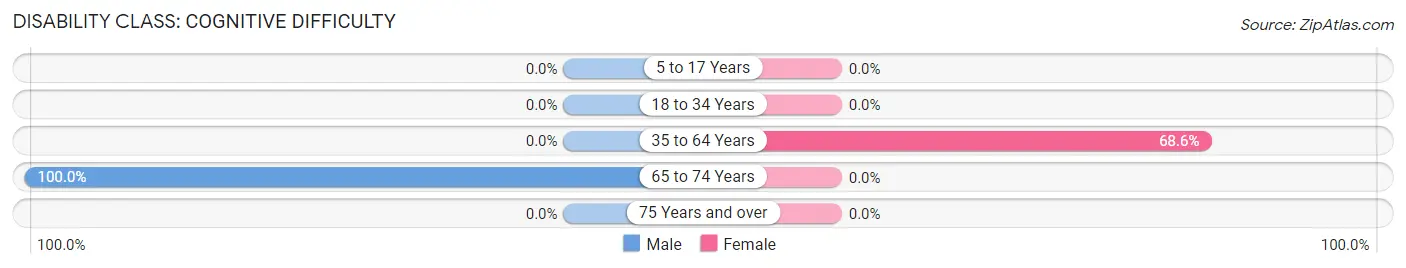
| Age Bracket | Male | Female |
| 5 to 17 Years | 0 (0.0%) | 0 (0.0%) |
| 18 to 34 Years | 0 (0.0%) | 0 (0.0%) |
| 35 to 64 Years | 0 (0.0%) | 24 (68.6%) |
| 65 to 74 Years | 38 (100.0%) | 0 (0.0%) |
| 75 Years and over | 0 (0.0%) | 0 (0.0%) |
Disability Class: Ambulatory Difficulty
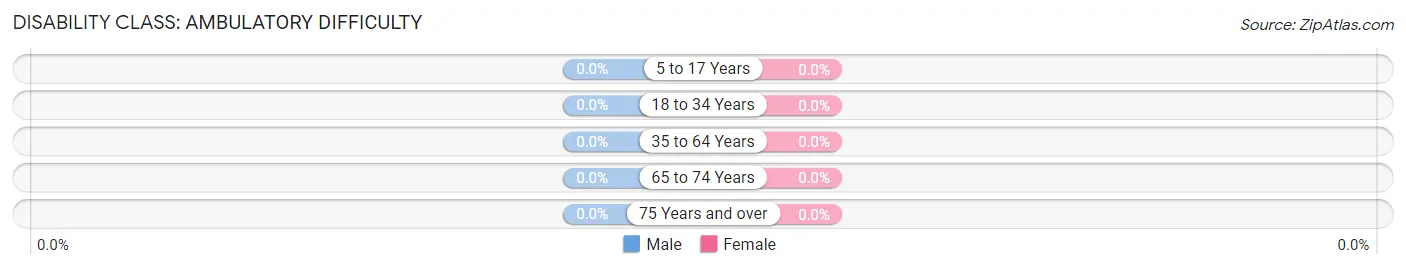
| Age Bracket | Male | Female |
| 5 to 17 Years | 0 (0.0%) | 0 (0.0%) |
| 18 to 34 Years | 0 (0.0%) | 0 (0.0%) |
| 35 to 64 Years | 0 (0.0%) | 0 (0.0%) |
| 65 to 74 Years | 0 (0.0%) | 0 (0.0%) |
| 75 Years and over | 0 (0.0%) | 0 (0.0%) |
Disability Class: Self-Care Difficulty
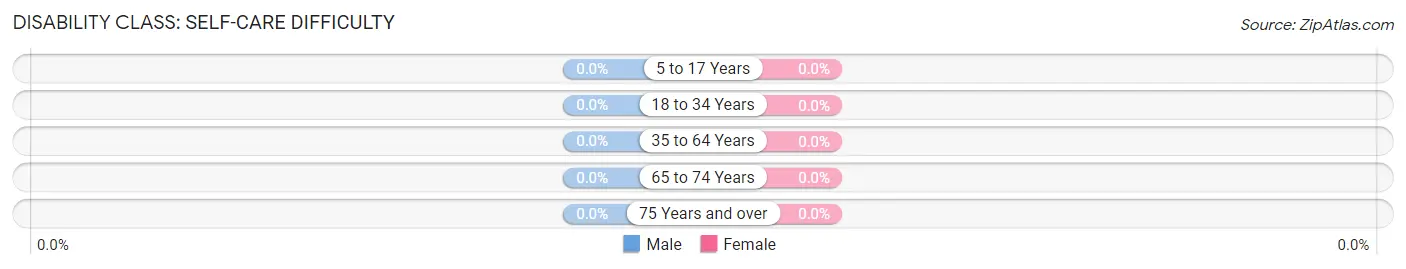
| Age Bracket | Male | Female |
| 5 to 17 Years | 0 (0.0%) | 0 (0.0%) |
| 18 to 34 Years | 0 (0.0%) | 0 (0.0%) |
| 35 to 64 Years | 0 (0.0%) | 0 (0.0%) |
| 65 to 74 Years | 0 (0.0%) | 0 (0.0%) |
| 75 Years and over | 0 (0.0%) | 0 (0.0%) |
Technology Access in Crum
Computing Device Access in Crum
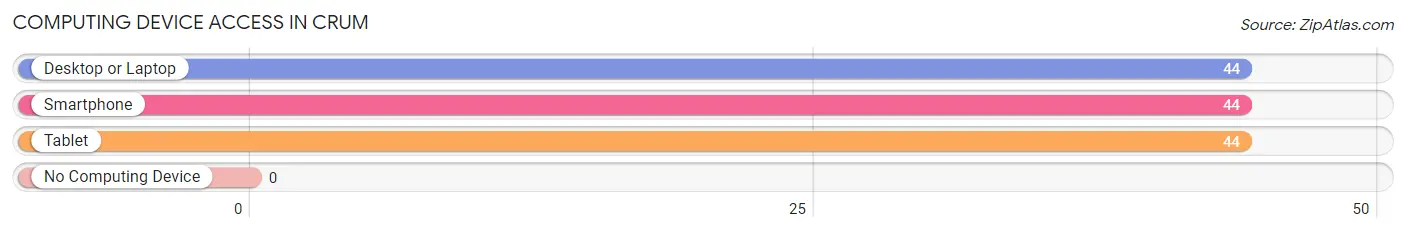
| Device Type | # Households | % Households |
| Desktop or Laptop | 44 | 100.0% |
| Smartphone | 44 | 100.0% |
| Tablet | 44 | 100.0% |
| No Computing Device | 0 | 0.0% |
| Total | 44 | 100.0% |
Internet Access in Crum
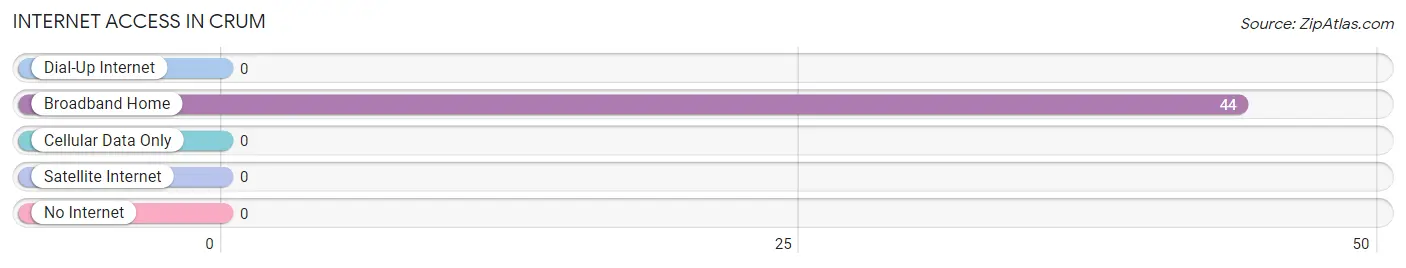
| Internet Type | # Households | % Households |
| Dial-Up Internet | 0 | 0.0% |
| Broadband Home | 44 | 100.0% |
| Cellular Data Only | 0 | 0.0% |
| Satellite Internet | 0 | 0.0% |
| No Internet | 0 | 0.0% |
| Total | 44 | 100.0% |
Crum Summary
Crum, West Virginia is a small unincorporated community located in Wayne County, West Virginia. It is situated along the banks of the Big Sandy River, and is home to approximately 200 people. The town was founded in the late 1800s and has a rich history of coal mining and timber production.
History
Crum was founded in the late 1800s by a group of settlers from Kentucky. The town was named after a local family, the Crums, who had settled in the area in the early 1800s. The town was originally a small farming community, but soon became a hub for coal mining and timber production. The coal industry in Crum was booming in the early 1900s, and the town was home to several coal mines. The timber industry also flourished in the area, and the town was home to several sawmills.
In the early 1900s, the town was home to a variety of businesses, including a general store, a post office, a blacksmith shop, and a hotel. The town also had a school, which was attended by children from the surrounding area.
In the late 1900s, the coal industry in Crum began to decline, and the town's population began to dwindle. The timber industry also began to decline, and the town's economy shifted to focus on tourism. Today, Crum is a small, quiet community, and is home to a variety of small businesses, including a gas station, a restaurant, and a few small shops.
Geography
Crum is located in Wayne County, West Virginia, along the banks of the Big Sandy River. The town is situated in the Appalachian Mountains, and is surrounded by rolling hills and lush forests. The town is located approximately 30 miles from Huntington, West Virginia, and is accessible via US Route 52.
Economy
The economy of Crum is largely based on tourism. The town is home to a variety of small businesses, including a gas station, a restaurant, and a few small shops. The town is also home to a number of bed and breakfasts, which attract visitors from all over the region.
The town is also home to a number of small farms, which produce a variety of crops, including corn, soybeans, and hay. The town is also home to a number of timber companies, which harvest the area's forests for lumber.
Demographics
As of the 2010 census, the population of Crum was approximately 200 people. The town is predominantly white, with a small minority population. The median household income in Crum is approximately $30,000, and the median home value is approximately $90,000. The town has a low unemployment rate, and the majority of the population is employed in the tourism and agriculture industries.
Common Questions
What is Per Capita Income in Crum?
Per Capita income in Crum is $10,690.
What is Inequality or Gini Index in Crum?
Inequality or Gini Index in Crum is 0.26.
What is the Total Population of Crum?
Total Population of Crum is 143.
What is the Total Male Population of Crum?
Total Male Population of Crum is 78.
What is the Total Female Population of Crum?
Total Female Population of Crum is 65.
What is the Ratio of Males per 100 Females in Crum?
There are 120.00 Males per 100 Females in Crum.
What is the Ratio of Females per 100 Males in Crum?
There are 83.33 Females per 100 Males in Crum.
What is the Median Population Age in Crum?
Median Population Age in Crum is 63.1 Years.
What is the Average Family Size in Crum
Average Family Size in Crum is 3.2 People.
What is the Average Household Size in Crum
Average Household Size in Crum is 3.2 People.
How Large is the Labor Force in Crum?
There are 32 People in the Labor Forcein in Crum.
What is the Percentage of People in the Labor Force in Crum?
27.6% of People are in the Labor Force in Crum.
What is the Unemployment Rate in Crum?
Unemployment Rate in Crum is 28.1%.