Red Jacket, WV Map & Demographics
Red Jacket Map
Red Jacket Overview
$10,454
PER CAPITA INCOME
0.61
INEQUALITY / GINI INDEX
512
TOTAL POPULATION
162
MALE POPULATION
350
FEMALE POPULATION
46.29
MALES / 100 FEMALES
216.05
FEMALES / 100 MALES
45.5
MEDIAN AGE
3.3
AVG FAMILY SIZE
2.0
AVG HOUSEHOLD SIZE
110
LABOR FORCE [ PEOPLE ]
29.3%
PERCENT IN LABOR FORCE
15.5%
UNEMPLOYMENT RATE
Red Jacket Zip Codes
Red Jacket Area Codes
Income in Red Jacket
Income Overview in Red Jacket
| Characteristic | Number | Measure |
| Per Capita Income | 512 | $10,454 |
| Median Family Income | 112 | $0 |
| Mean Family Income | 112 | $35,184 |
| Median Household Income | 258 | $0 |
| Mean Household Income | 258 | $19,699 |
| Income Deficit | 112 | $0 |
| Wage / Income Gap (%) | 512 | 0.00% |
| Wage / Income Gap ($) | 512 | 100.00¢ per $1 |
| Gini / Inequality Index | 512 | 0.61 |
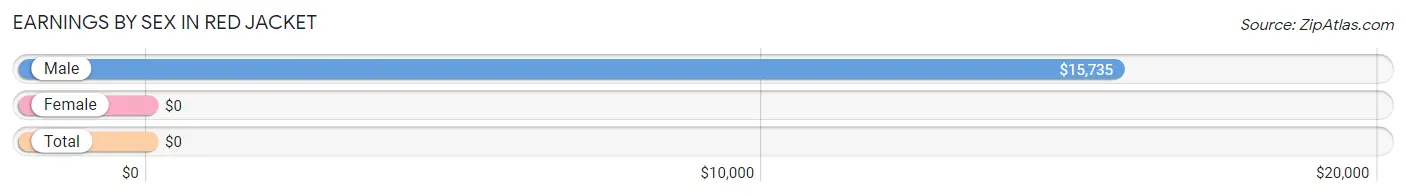
Earnings by Sex in Red Jacket
| Sex | Number | Average Earnings |
| Male | 80 (73.4%) | $15,735 |
| Female | 29 (26.6%) | $0 |
| Total | 109 (100.0%) | $0 |
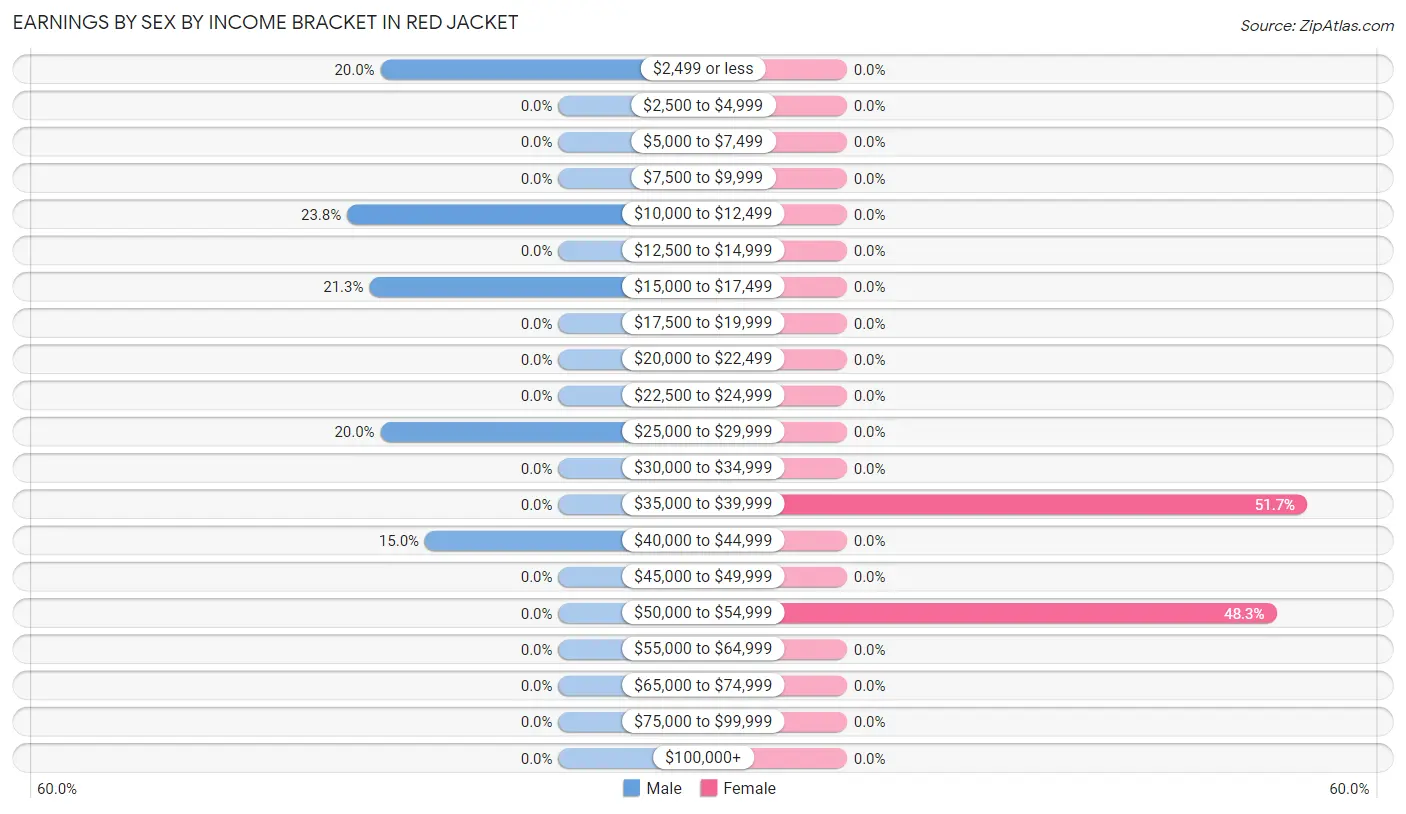
Earnings by Sex by Income Bracket in Red Jacket
The most common earnings brackets in Red Jacket are $10,000 to $12,499 for men (19 | 23.7%) and $35,000 to $39,999 for women (15 | 51.7%).
| Income | Male | Female |
| $2,499 or less | 16 (20.0%) | 0 (0.0%) |
| $2,500 to $4,999 | 0 (0.0%) | 0 (0.0%) |
| $5,000 to $7,499 | 0 (0.0%) | 0 (0.0%) |
| $7,500 to $9,999 | 0 (0.0%) | 0 (0.0%) |
| $10,000 to $12,499 | 19 (23.7%) | 0 (0.0%) |
| $12,500 to $14,999 | 0 (0.0%) | 0 (0.0%) |
| $15,000 to $17,499 | 17 (21.2%) | 0 (0.0%) |
| $17,500 to $19,999 | 0 (0.0%) | 0 (0.0%) |
| $20,000 to $22,499 | 0 (0.0%) | 0 (0.0%) |
| $22,500 to $24,999 | 0 (0.0%) | 0 (0.0%) |
| $25,000 to $29,999 | 16 (20.0%) | 0 (0.0%) |
| $30,000 to $34,999 | 0 (0.0%) | 0 (0.0%) |
| $35,000 to $39,999 | 0 (0.0%) | 15 (51.7%) |
| $40,000 to $44,999 | 12 (15.0%) | 0 (0.0%) |
| $45,000 to $49,999 | 0 (0.0%) | 0 (0.0%) |
| $50,000 to $54,999 | 0 (0.0%) | 14 (48.3%) |
| $55,000 to $64,999 | 0 (0.0%) | 0 (0.0%) |
| $65,000 to $74,999 | 0 (0.0%) | 0 (0.0%) |
| $75,000 to $99,999 | 0 (0.0%) | 0 (0.0%) |
| $100,000+ | 0 (0.0%) | 0 (0.0%) |
| Total | 80 (100.0%) | 29 (100.0%) |
Earnings by Sex by Educational Attainment in Red Jacket
| Educational Attainment | Male Income | Female Income |
| Less than High School | - | - |
| High School Diploma | - | - |
| College or Associate's Degree | - | - |
| Bachelor's Degree | - | - |
| Graduate Degree | - | - |
| Total | $28,359 | $0 |
Family Income in Red Jacket
Family Income Brackets in Red Jacket
According to the Red Jacket family income data, there are 34 families falling into the $15,000 to $24,999 income range, which is the most common income bracket and makes up 30.4% of all families.
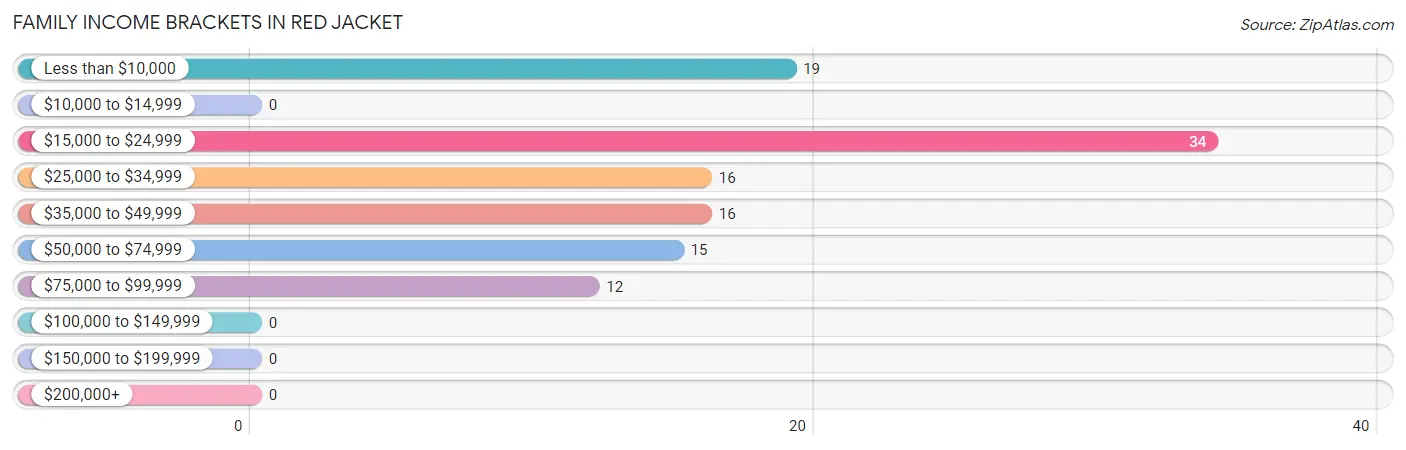
| Income Bracket | # Families | % Families |
| Less than $10,000 | 19 | 17.0% |
| $10,000 to $14,999 | 0 | 0.0% |
| $15,000 to $24,999 | 34 | 30.4% |
| $25,000 to $34,999 | 16 | 14.3% |
| $35,000 to $49,999 | 16 | 14.3% |
| $50,000 to $74,999 | 15 | 13.4% |
| $75,000 to $99,999 | 12 | 10.7% |
| $100,000 to $149,999 | 0 | 0.0% |
| $150,000 to $199,999 | 0 | 0.0% |
| $200,000+ | 0 | 0.0% |
Family Income by Famaliy Size in Red Jacket
| Income Bracket | # Families | Median Income |
| 2-Person Families | 52 (46.4%) | $0 |
| 3-Person Families | 33 (29.5%) | $0 |
| 4-Person Families | 15 (13.4%) | $0 |
| 5-Person Families | 12 (10.7%) | $0 |
| 6-Person Families | 0 (0.0%) | $0 |
| 7+ Person Families | 0 (0.0%) | $0 |
| Total | 112 (100.0%) | $0 |
Family Income by Number of Earners in Red Jacket
| Number of Earners | # Families | Median Income |
| No Earners | 52 (46.4%) | $0 |
| 1 Earner | 32 (28.6%) | $0 |
| 2 Earners | 12 (10.7%) | $0 |
| 3+ Earners | 16 (14.3%) | $0 |
| Total | 112 (100.0%) | $0 |
Household Income in Red Jacket
Household Income Brackets in Red Jacket
With 148 households falling in the category, the less than $10,000 income range is the most frequent in Red Jacket, accounting for 57.4% of all households.
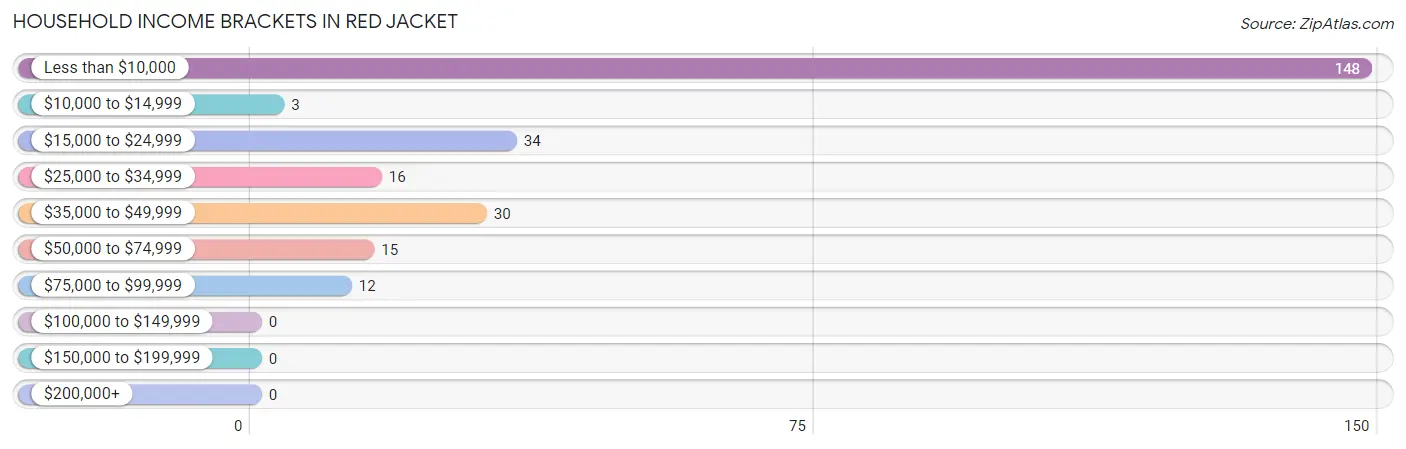
| Income Bracket | # Households | % Households |
| Less than $10,000 | 148 | 57.4% |
| $10,000 to $14,999 | 3 | 1.2% |
| $15,000 to $24,999 | 34 | 13.2% |
| $25,000 to $34,999 | 16 | 6.2% |
| $35,000 to $49,999 | 30 | 11.6% |
| $50,000 to $74,999 | 15 | 5.8% |
| $75,000 to $99,999 | 12 | 4.7% |
| $100,000 to $149,999 | 0 | 0.0% |
| $150,000 to $199,999 | 0 | 0.0% |
| $200,000+ | 0 | 0.0% |
Household Income by Householder Age in Red Jacket
The median household income in Red Jacket is $0, with the highest median household income of $30,781 found in the 45 to 64 years age bracket for the primary householder. A total of 82 households (31.8%) fall into this category.
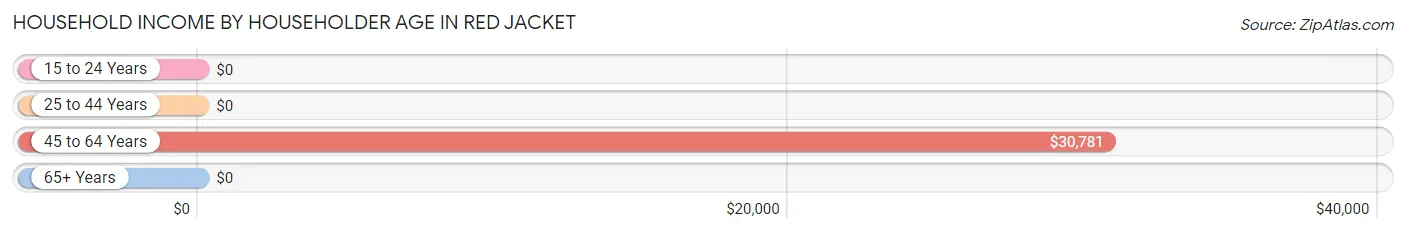
| Income Bracket | # Households | Median Income |
| 15 to 24 Years | 0 (0.0%) | $0 |
| 25 to 44 Years | 44 (17.1%) | $0 |
| 45 to 64 Years | 82 (31.8%) | $30,781 |
| 65+ Years | 132 (51.2%) | $0 |
| Total | 258 (100.0%) | $0 |
Poverty in Red Jacket
Income Below Poverty by Sex and Age in Red Jacket
With 29.6% poverty level for males and 59.1% for females among the residents of Red Jacket, 6 to 11 year old males and 25 to 34 year old females are the most vulnerable to poverty, with 19 males (100.0%) and 17 females (100.0%) in their respective age groups living below the poverty level.
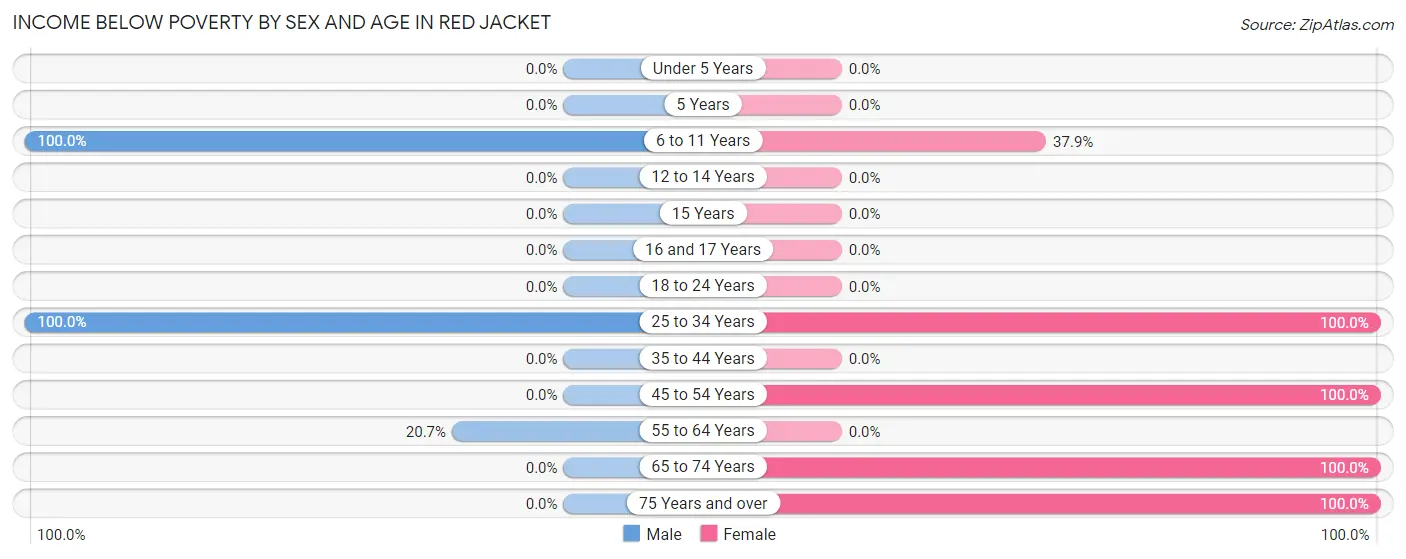
| Age Bracket | Male | Female |
| Under 5 Years | 0 (0.0%) | 0 (0.0%) |
| 5 Years | 0 (0.0%) | 0 (0.0%) |
| 6 to 11 Years | 19 (100.0%) | 22 (37.9%) |
| 12 to 14 Years | 0 (0.0%) | 0 (0.0%) |
| 15 Years | 0 (0.0%) | 0 (0.0%) |
| 16 and 17 Years | 0 (0.0%) | 0 (0.0%) |
| 18 to 24 Years | 0 (0.0%) | 0 (0.0%) |
| 25 to 34 Years | 17 (100.0%) | 17 (100.0%) |
| 35 to 44 Years | 0 (0.0%) | 0 (0.0%) |
| 45 to 54 Years | 0 (0.0%) | 36 (100.0%) |
| 55 to 64 Years | 12 (20.7%) | 0 (0.0%) |
| 65 to 74 Years | 0 (0.0%) | 129 (100.0%) |
| 75 Years and over | 0 (0.0%) | 3 (100.0%) |
| Total | 48 (29.6%) | 207 (59.1%) |
Income Above Poverty by Sex and Age in Red Jacket
According to the poverty statistics in Red Jacket, males aged 18 to 24 years and females aged 12 to 14 years are the age groups that are most secure financially, with 100.0% of males and 100.0% of females in these age groups living above the poverty line.
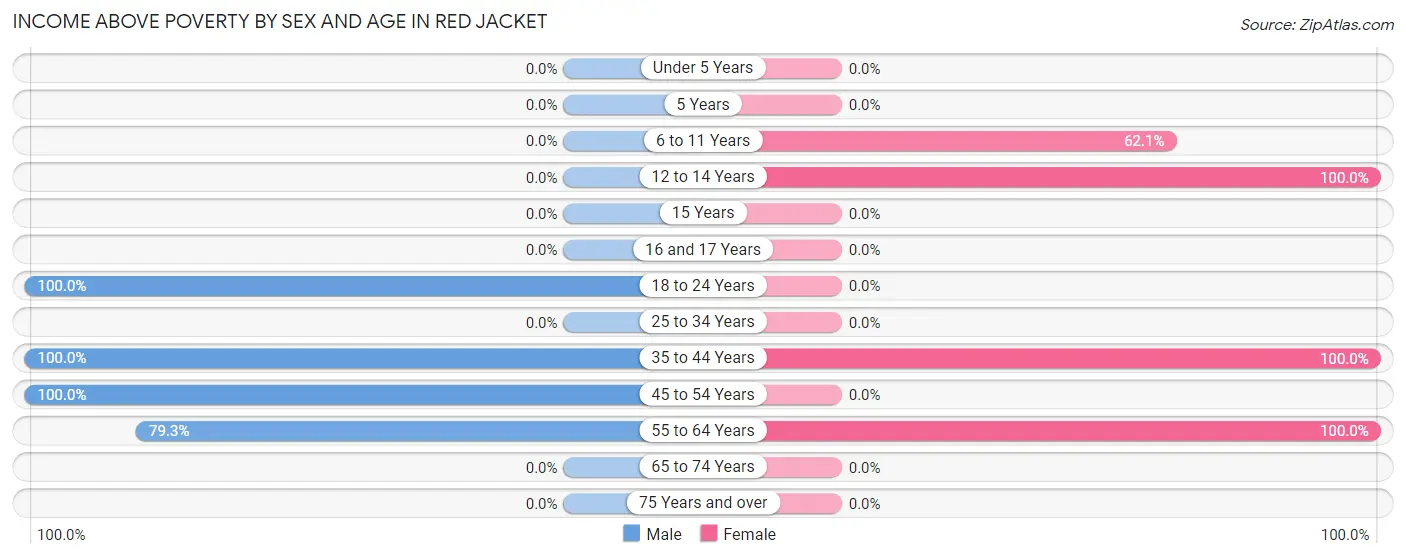
| Age Bracket | Male | Female |
| Under 5 Years | 0 (0.0%) | 0 (0.0%) |
| 5 Years | 0 (0.0%) | 0 (0.0%) |
| 6 to 11 Years | 0 (0.0%) | 36 (62.1%) |
| 12 to 14 Years | 0 (0.0%) | 59 (100.0%) |
| 15 Years | 0 (0.0%) | 0 (0.0%) |
| 16 and 17 Years | 0 (0.0%) | 0 (0.0%) |
| 18 to 24 Years | 35 (100.0%) | 0 (0.0%) |
| 25 to 34 Years | 0 (0.0%) | 0 (0.0%) |
| 35 to 44 Years | 12 (100.0%) | 29 (100.0%) |
| 45 to 54 Years | 21 (100.0%) | 0 (0.0%) |
| 55 to 64 Years | 46 (79.3%) | 19 (100.0%) |
| 65 to 74 Years | 0 (0.0%) | 0 (0.0%) |
| 75 Years and over | 0 (0.0%) | 0 (0.0%) |
| Total | 114 (70.4%) | 143 (40.9%) |
Income Below Poverty Among Married-Couple Families in Red Jacket
The poverty statistics for married-couple families in Red Jacket show that 44.2% or 34 of the total 77 families live below the poverty line. Families with 1 or 2 children have the highest poverty rate of 53.1%, comprising of 17 families. On the other hand, families with 3 or 4 children have the lowest poverty rate of 0.0%, which includes 0 families.
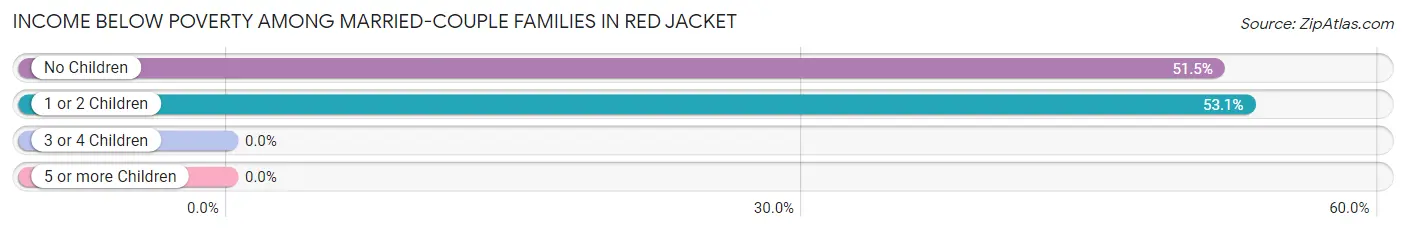
| Children | Above Poverty | Below Poverty |
| No Children | 16 (48.5%) | 17 (51.5%) |
| 1 or 2 Children | 15 (46.9%) | 17 (53.1%) |
| 3 or 4 Children | 12 (100.0%) | 0 (0.0%) |
| 5 or more Children | 0 (0.0%) | 0 (0.0%) |
| Total | 43 (55.8%) | 34 (44.2%) |
Income Below Poverty Among Single-Parent Households in Red Jacket
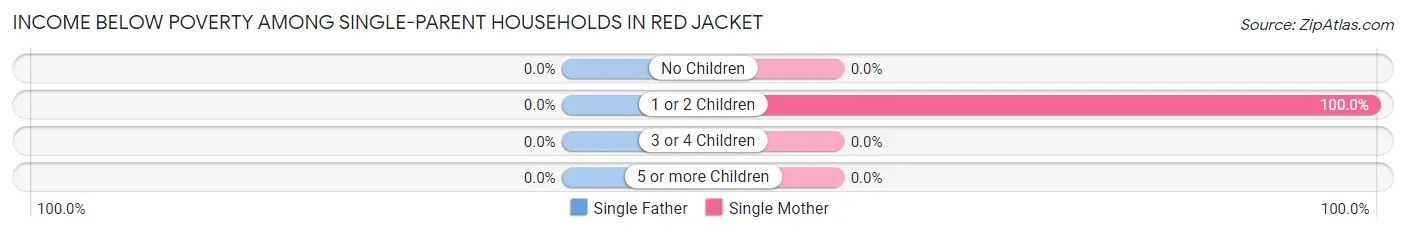
| Children | Single Father | Single Mother |
| No Children | 0 (0.0%) | 0 (0.0%) |
| 1 or 2 Children | 0 (0.0%) | 19 (100.0%) |
| 3 or 4 Children | 0 (0.0%) | 0 (0.0%) |
| 5 or more Children | 0 (0.0%) | 0 (0.0%) |
| Total | 0 (0.0%) | 19 (100.0%) |
Income Below Poverty Among Married-Couple vs Single-Parent Households in Red Jacket
The poverty data for Red Jacket shows that 34 of the married-couple family households (44.2%) and 19 of the single-parent households (54.3%) are living below the poverty level. Within the married-couple family households, those with 1 or 2 children have the highest poverty rate, with 17 households (53.1%) falling below the poverty line. Among the single-parent households, those with 1 or 2 children have the highest poverty rate, with 19 household (100.0%) living below poverty.
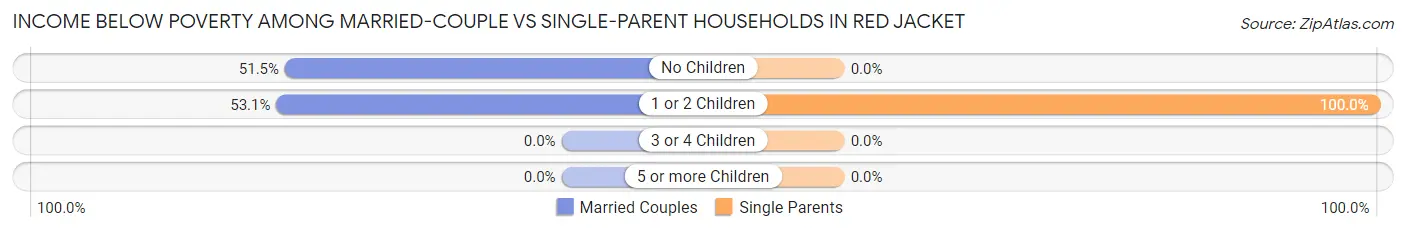
| Children | Married-Couple Families | Single-Parent Households |
| No Children | 17 (51.5%) | 0 (0.0%) |
| 1 or 2 Children | 17 (53.1%) | 19 (100.0%) |
| 3 or 4 Children | 0 (0.0%) | 0 (0.0%) |
| 5 or more Children | 0 (0.0%) | 0 (0.0%) |
| Total | 34 (44.2%) | 19 (54.3%) |
Race in Red Jacket
The most populous races in Red Jacket are White / Caucasian (350 | 68.4%), Black / African American (143 | 27.9%), and Two or more Races (19 | 3.7%).
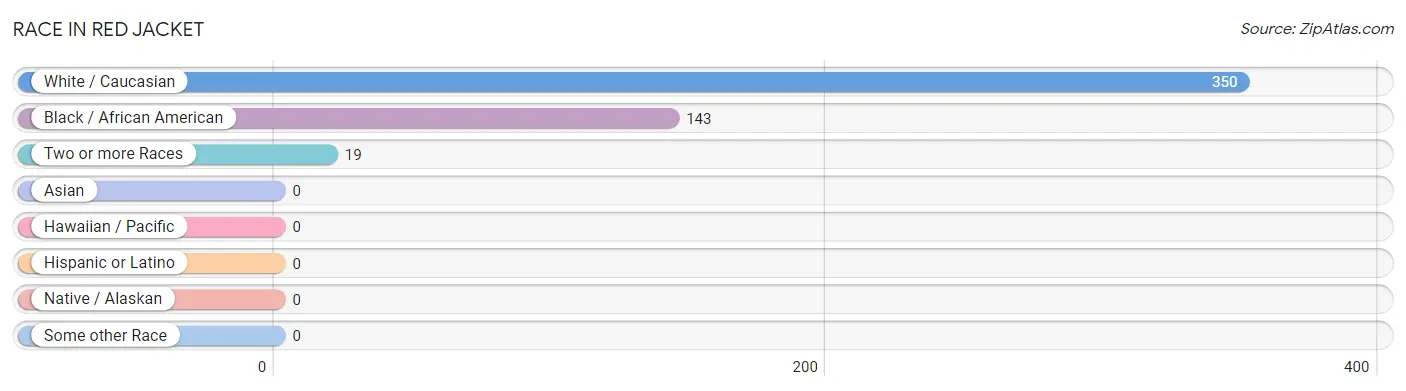
| Race | # Population | % Population |
| Asian | 0 | 0.0% |
| Black / African American | 143 | 27.9% |
| Hawaiian / Pacific | 0 | 0.0% |
| Hispanic or Latino | 0 | 0.0% |
| Native / Alaskan | 0 | 0.0% |
| White / Caucasian | 350 | 68.4% |
| Two or more Races | 19 | 3.7% |
| Some other Race | 0 | 0.0% |
| Total | 512 | 100.0% |
Ancestry in Red Jacket
The most populous ancestries reported in Red Jacket are Subsaharan African (143 | 27.9%), African (129 | 25.2%), Irish (36 | 7.0%), and American (12 | 2.3%), together accounting for 62.5% of all Red Jacket residents.
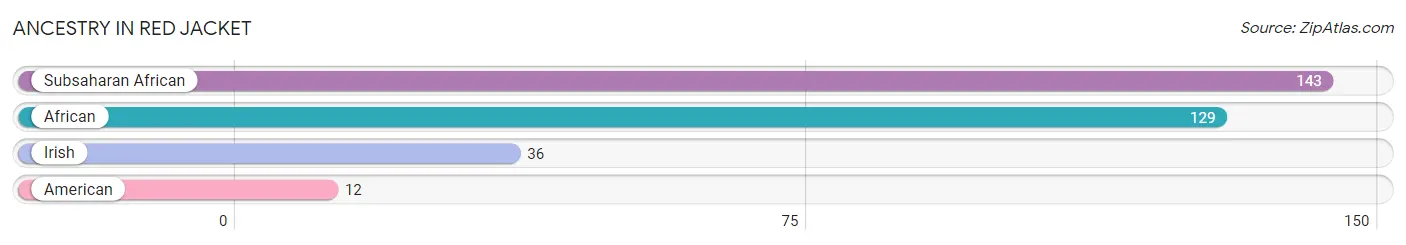
| Ancestry | # Population | % Population |
| African | 129 | 25.2% |
| American | 12 | 2.3% |
| Irish | 36 | 7.0% |
| Subsaharan African | 143 | 27.9% | View All 4 Rows |
Immigrants in Red Jacket

| Immigration Origin | # Population | % Population | View All 0 Rows |
Sex and Age in Red Jacket
Sex and Age in Red Jacket
The most populous age groups in Red Jacket are 55 to 59 Years (42 | 25.9%) for men and 70 to 74 Years (129 | 36.9%) for women.
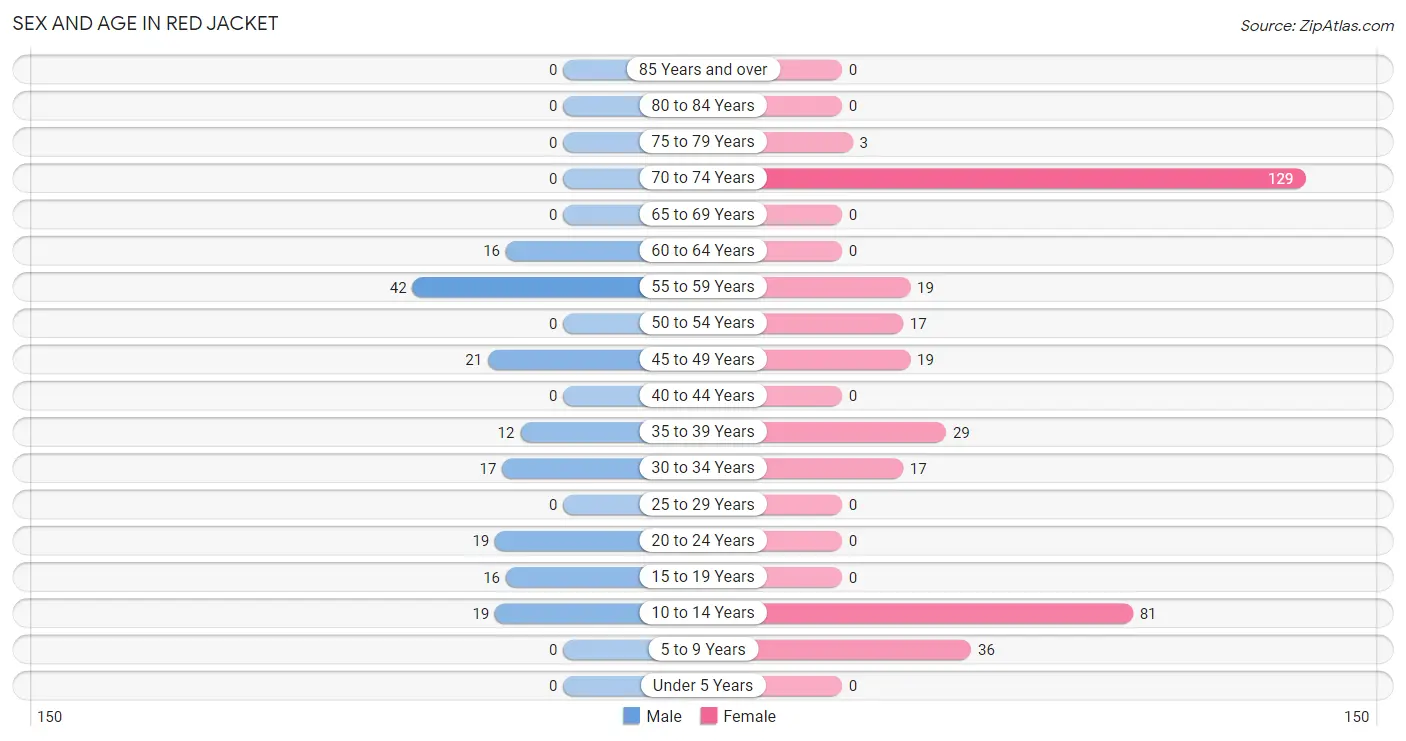
| Age Bracket | Male | Female |
| Under 5 Years | 0 (0.0%) | 0 (0.0%) |
| 5 to 9 Years | 0 (0.0%) | 36 (10.3%) |
| 10 to 14 Years | 19 (11.7%) | 81 (23.1%) |
| 15 to 19 Years | 16 (9.9%) | 0 (0.0%) |
| 20 to 24 Years | 19 (11.7%) | 0 (0.0%) |
| 25 to 29 Years | 0 (0.0%) | 0 (0.0%) |
| 30 to 34 Years | 17 (10.5%) | 17 (4.9%) |
| 35 to 39 Years | 12 (7.4%) | 29 (8.3%) |
| 40 to 44 Years | 0 (0.0%) | 0 (0.0%) |
| 45 to 49 Years | 21 (13.0%) | 19 (5.4%) |
| 50 to 54 Years | 0 (0.0%) | 17 (4.9%) |
| 55 to 59 Years | 42 (25.9%) | 19 (5.4%) |
| 60 to 64 Years | 16 (9.9%) | 0 (0.0%) |
| 65 to 69 Years | 0 (0.0%) | 0 (0.0%) |
| 70 to 74 Years | 0 (0.0%) | 129 (36.9%) |
| 75 to 79 Years | 0 (0.0%) | 3 (0.9%) |
| 80 to 84 Years | 0 (0.0%) | 0 (0.0%) |
| 85 Years and over | 0 (0.0%) | 0 (0.0%) |
| Total | 162 (100.0%) | 350 (100.0%) |
Families and Households in Red Jacket
Median Family Size in Red Jacket
The median family size in Red Jacket is 3.27 persons per family, with married-couple families (77 | 68.8%) accounting for the largest median family size of 3.56 persons per family. On the other hand, single female/mother families (19 | 17.0%) represent the smallest median family size with 2.16 persons per family.
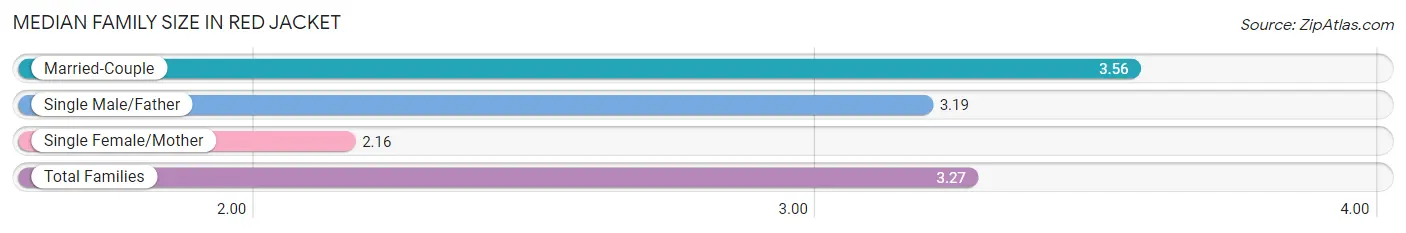
| Family Type | # Families | Family Size |
| Married-Couple | 77 (68.8%) | 3.56 |
| Single Male/Father | 16 (14.3%) | 3.19 |
| Single Female/Mother | 19 (17.0%) | 2.16 |
| Total Families | 112 (100.0%) | 3.27 |
Median Household Size in Red Jacket
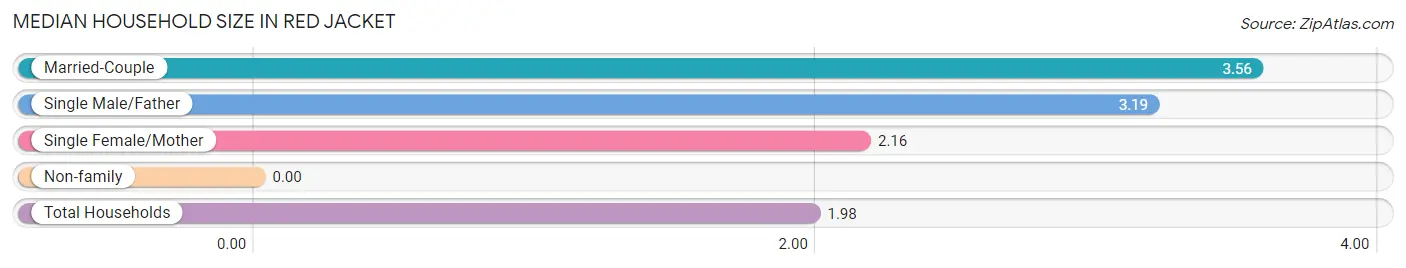
| Household Type | # Households | Household Size |
| Married-Couple | 77 (29.8%) | 3.56 |
| Single Male/Father | 16 (6.2%) | 3.19 |
| Single Female/Mother | 19 (7.4%) | 2.16 |
| Non-family | 146 (56.6%) | - |
| Total Households | 258 (100.0%) | 1.98 |
Household Size by Marriage Status in Red Jacket
Out of a total of 258 households in Red Jacket, 112 (43.4%) are family households, while 146 (56.6%) are nonfamily households. The most numerous type of family households are 2-person households, comprising 52, and the most common type of nonfamily households are 1-person households, comprising 146.
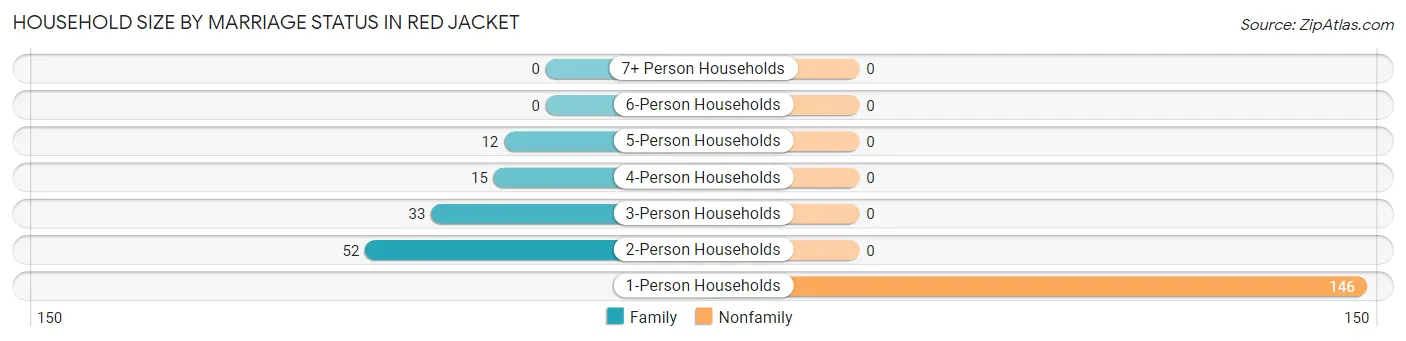
| Household Size | Family Households | Nonfamily Households |
| 1-Person Households | - | 146 (56.6%) |
| 2-Person Households | 52 (20.2%) | 0 (0.0%) |
| 3-Person Households | 33 (12.8%) | 0 (0.0%) |
| 4-Person Households | 15 (5.8%) | 0 (0.0%) |
| 5-Person Households | 12 (4.6%) | 0 (0.0%) |
| 6-Person Households | 0 (0.0%) | 0 (0.0%) |
| 7+ Person Households | 0 (0.0%) | 0 (0.0%) |
| Total | 112 (43.4%) | 146 (56.6%) |
Female Fertility in Red Jacket
Fertility by Age in Red Jacket
| Age Bracket | Women with Births | Births / 1,000 Women |
| 15 to 19 years | 0 (0.0%) | 0.0 |
| 20 to 34 years | 0 (0.0%) | 0.0 |
| 35 to 50 years | 0 (0.0%) | 0.0 |
| Total | 0 (0.0%) | 0.0 |
Fertility by Age by Marriage Status in Red Jacket
| Age Bracket | Married | Unmarried |
| 15 to 19 years | 0 (0.0%) | 0 (0.0%) |
| 20 to 34 years | 0 (0.0%) | 0 (0.0%) |
| 35 to 50 years | 0 (0.0%) | 0 (0.0%) |
| Total | 0 (0.0%) | 0 (0.0%) |
Fertility by Education in Red Jacket
| Educational Attainment | Women with Births | Births / 1,000 Women |
| Less than High School | 0 (0.0%) | 0.0 |
| High School Diploma | 0 (0.0%) | 0.0 |
| College or Associate's Degree | 0 (0.0%) | 0.0 |
| Bachelor's Degree | 0 (0.0%) | 0.0 |
| Graduate Degree | 0 (0.0%) | 0.0 |
| Total | 0 (0.0%) | 0.0 |
Fertility by Education by Marriage Status in Red Jacket
| Educational Attainment | Married | Unmarried |
| Less than High School | 0 (0.0%) | 0 (0.0%) |
| High School Diploma | 0 (0.0%) | 0 (0.0%) |
| College or Associate's Degree | 0 (0.0%) | 0 (0.0%) |
| Bachelor's Degree | 0 (0.0%) | 0 (0.0%) |
| Graduate Degree | 0 (0.0%) | 0 (0.0%) |
| Total | 0 (0.0%) | 0 (0.0%) |
Employment Characteristics in Red Jacket
Employment by Class of Employer in Red Jacket
Among the 78 employed individuals in Red Jacket, private company employees (35 | 44.9%), state government employees (26 | 33.3%), and self-employed (not incorporated) (17 | 21.8%) make up the most common classes of employment.
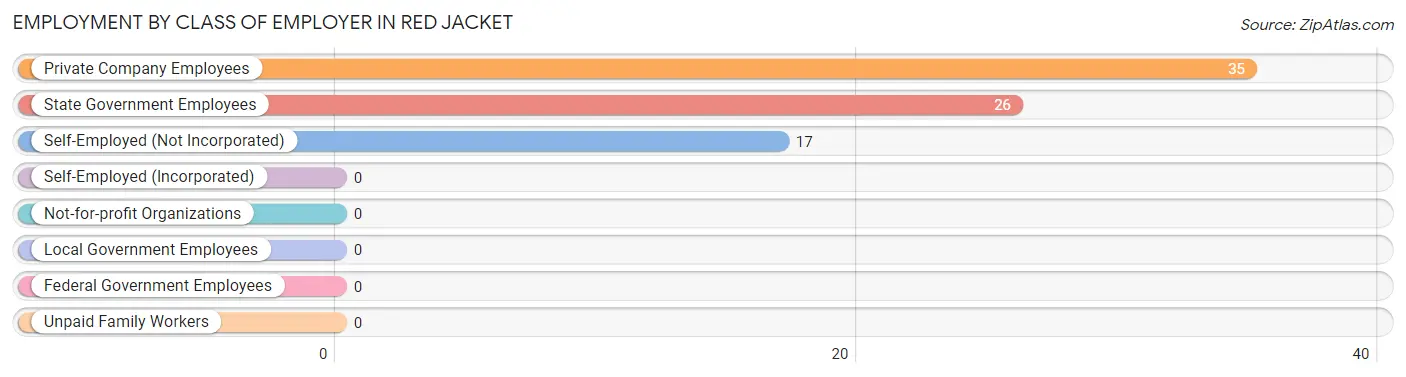
| Employer Class | # Employees | % Employees |
| Private Company Employees | 35 | 44.9% |
| Self-Employed (Incorporated) | 0 | 0.0% |
| Self-Employed (Not Incorporated) | 17 | 21.8% |
| Not-for-profit Organizations | 0 | 0.0% |
| Local Government Employees | 0 | 0.0% |
| State Government Employees | 26 | 33.3% |
| Federal Government Employees | 0 | 0.0% |
| Unpaid Family Workers | 0 | 0.0% |
| Total | 78 | 100.0% |
Employment Status by Age in Red Jacket
According to the labor force statistics for Red Jacket, out of the total population over 16 years of age (376), 29.3% or 110 individuals are in the labor force, with 15.5% or 17 of them unemployed. The age group with the highest labor force participation rate is 20 to 24 years, with 100.0% or 19 individuals in the labor force. Within the labor force, the 30 to 34 years age range has the highest percentage of unemployed individuals, with 50.0% or 17 of them being unemployed.
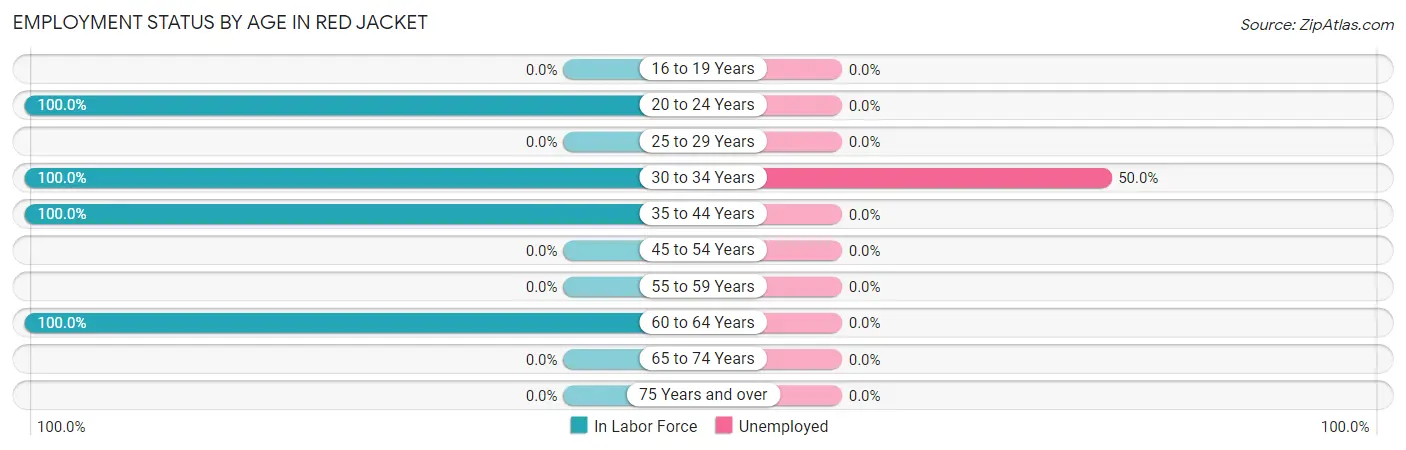
| Age Bracket | In Labor Force | Unemployed |
| 16 to 19 Years | 0 (0.0%) | 0 (0.0%) |
| 20 to 24 Years | 19 (100.0%) | 0 (0.0%) |
| 25 to 29 Years | 0 (0.0%) | 0 (0.0%) |
| 30 to 34 Years | 34 (100.0%) | 17 (50.0%) |
| 35 to 44 Years | 41 (100.0%) | 0 (0.0%) |
| 45 to 54 Years | 0 (0.0%) | 0 (0.0%) |
| 55 to 59 Years | 0 (0.0%) | 0 (0.0%) |
| 60 to 64 Years | 16 (100.0%) | 0 (0.0%) |
| 65 to 74 Years | 0 (0.0%) | 0 (0.0%) |
| 75 Years and over | 0 (0.0%) | 0 (0.0%) |
| Total | 110 (29.3%) | 17 (15.5%) |
Employment Status by Educational Attainment in Red Jacket
According to labor force statistics for Red Jacket, 43.5% of individuals (91) out of the total population between 25 and 64 years of age (209) are in the labor force, with 18.7% or 17 of them being unemployed. The group with the highest labor force participation rate are those with the educational attainment of bachelor's degree or higher, with 60.4% or 29 individuals in the labor force. Within the labor force, individuals with college / associate degree education have the highest percentage of unemployment, with 100.0% or 17 of them being unemployed.
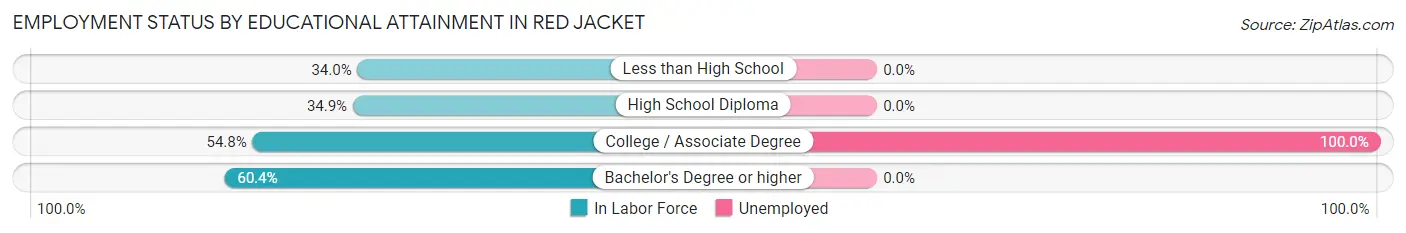
| Educational Attainment | In Labor Force | Unemployed |
| Less than High School | 16 (34.0%) | 0 (0.0%) |
| High School Diploma | 29 (34.9%) | 0 (0.0%) |
| College / Associate Degree | 17 (54.8%) | 31 (100.0%) |
| Bachelor's Degree or higher | 29 (60.4%) | 0 (0.0%) |
| Total | 91 (43.5%) | 39 (18.7%) |
Employment Occupations by Sex in Red Jacket
Management, Business, Science and Arts Occupations
The most common Management, Business, Science and Arts occupations in Red Jacket are Community & Social Service (29 | 31.2%), Education Instruction & Library (29 | 31.2%), and Management (17 | 18.3%).
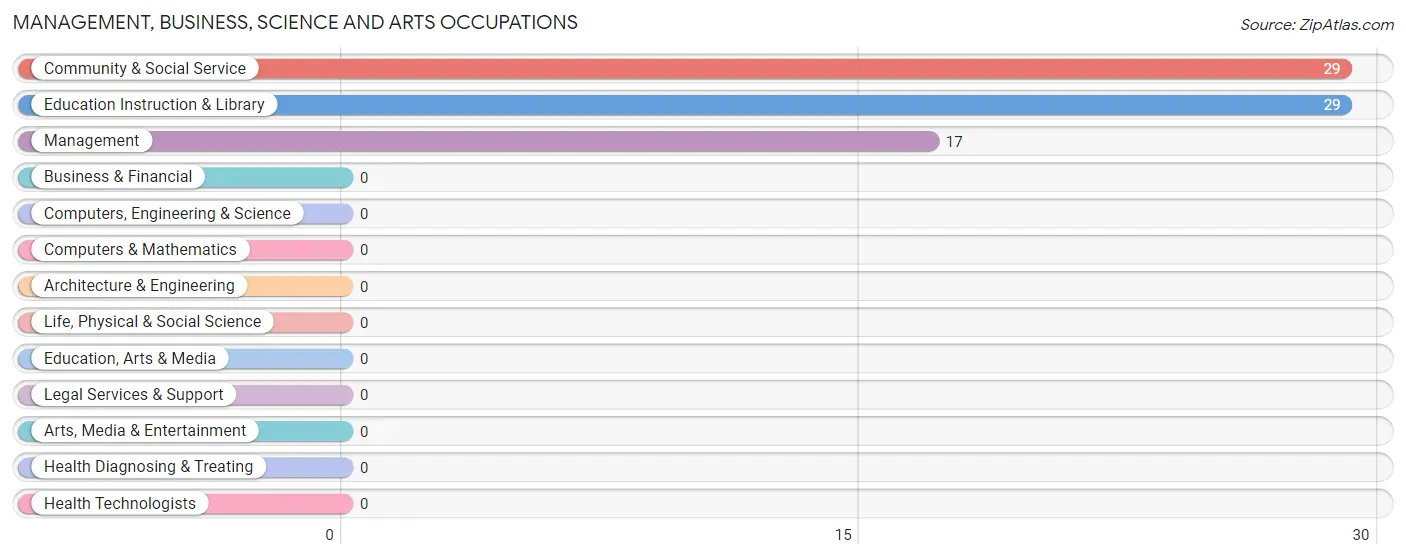
Management, Business, Science and Arts Occupations by Sex
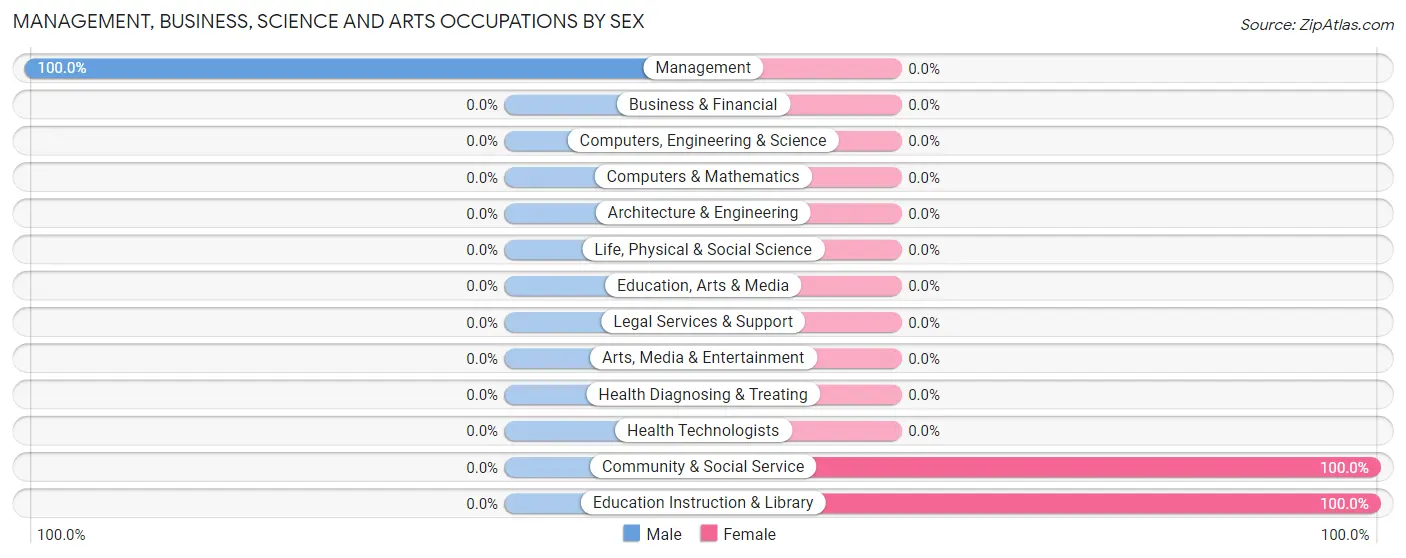
| Occupation | Male | Female |
| Management | 17 (100.0%) | 0 (0.0%) |
| Business & Financial | 0 (0.0%) | 0 (0.0%) |
| Computers, Engineering & Science | 0 (0.0%) | 0 (0.0%) |
| Computers & Mathematics | 0 (0.0%) | 0 (0.0%) |
| Architecture & Engineering | 0 (0.0%) | 0 (0.0%) |
| Life, Physical & Social Science | 0 (0.0%) | 0 (0.0%) |
| Community & Social Service | 0 (0.0%) | 29 (100.0%) |
| Education, Arts & Media | 0 (0.0%) | 0 (0.0%) |
| Legal Services & Support | 0 (0.0%) | 0 (0.0%) |
| Education Instruction & Library | 0 (0.0%) | 29 (100.0%) |
| Arts, Media & Entertainment | 0 (0.0%) | 0 (0.0%) |
| Health Diagnosing & Treating | 0 (0.0%) | 0 (0.0%) |
| Health Technologists | 0 (0.0%) | 0 (0.0%) |
| Total (Category) | 17 (37.0%) | 29 (63.0%) |
| Total (Overall) | 64 (68.8%) | 29 (31.2%) |
Services Occupations
Services Occupations by Sex
| Occupation | Male | Female |
| Healthcare Support | 0 (0.0%) | 0 (0.0%) |
| Security & Protection | 0 (0.0%) | 0 (0.0%) |
| Firefighting & Prevention | 0 (0.0%) | 0 (0.0%) |
| Law Enforcement | 0 (0.0%) | 0 (0.0%) |
| Food Preparation & Serving | 0 (0.0%) | 0 (0.0%) |
| Cleaning & Maintenance | 0 (0.0%) | 0 (0.0%) |
| Personal Care & Service | 0 (0.0%) | 0 (0.0%) |
| Total (Category) | 0 (0.0%) | 0 (0.0%) |
| Total (Overall) | 64 (68.8%) | 29 (31.2%) |
Sales and Office Occupations
Sales and Office Occupations by Sex
| Occupation | Male | Female |
| Sales & Related | 0 (0.0%) | 0 (0.0%) |
| Office & Administration | 0 (0.0%) | 0 (0.0%) |
| Total (Category) | 0 (0.0%) | 0 (0.0%) |
| Total (Overall) | 64 (68.8%) | 29 (31.2%) |
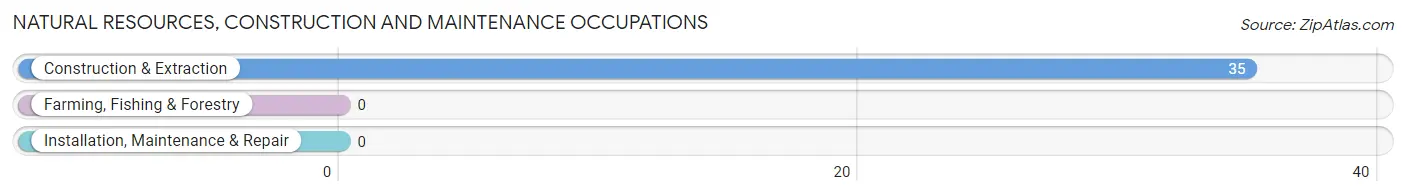
Natural Resources, Construction and Maintenance Occupations
The most common Natural Resources, Construction and Maintenance occupations in Red Jacket are , and Construction & Extraction (35 | 37.6%).
Natural Resources, Construction and Maintenance Occupations by Sex
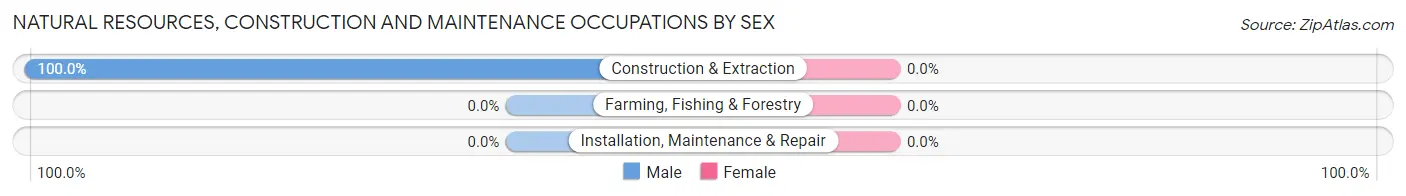
| Occupation | Male | Female |
| Farming, Fishing & Forestry | 0 (0.0%) | 0 (0.0%) |
| Construction & Extraction | 35 (100.0%) | 0 (0.0%) |
| Installation, Maintenance & Repair | 0 (0.0%) | 0 (0.0%) |
| Total (Category) | 35 (100.0%) | 0 (0.0%) |
| Total (Overall) | 64 (68.8%) | 29 (31.2%) |
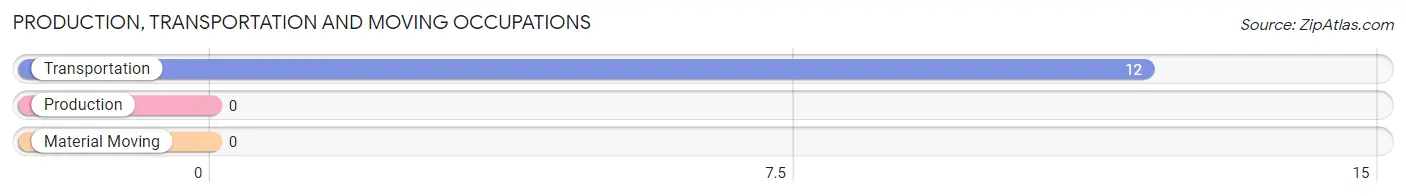
Production, Transportation and Moving Occupations
The most common Production, Transportation and Moving occupations in Red Jacket are , and Transportation (12 | 12.9%).
Production, Transportation and Moving Occupations by Sex
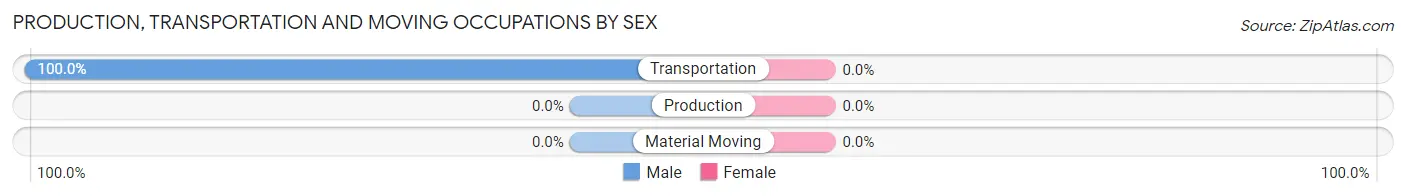
| Occupation | Male | Female |
| Production | 0 (0.0%) | 0 (0.0%) |
| Transportation | 12 (100.0%) | 0 (0.0%) |
| Material Moving | 0 (0.0%) | 0 (0.0%) |
| Total (Category) | 12 (100.0%) | 0 (0.0%) |
| Total (Overall) | 64 (68.8%) | 29 (31.2%) |
Employment Industries by Sex in Red Jacket
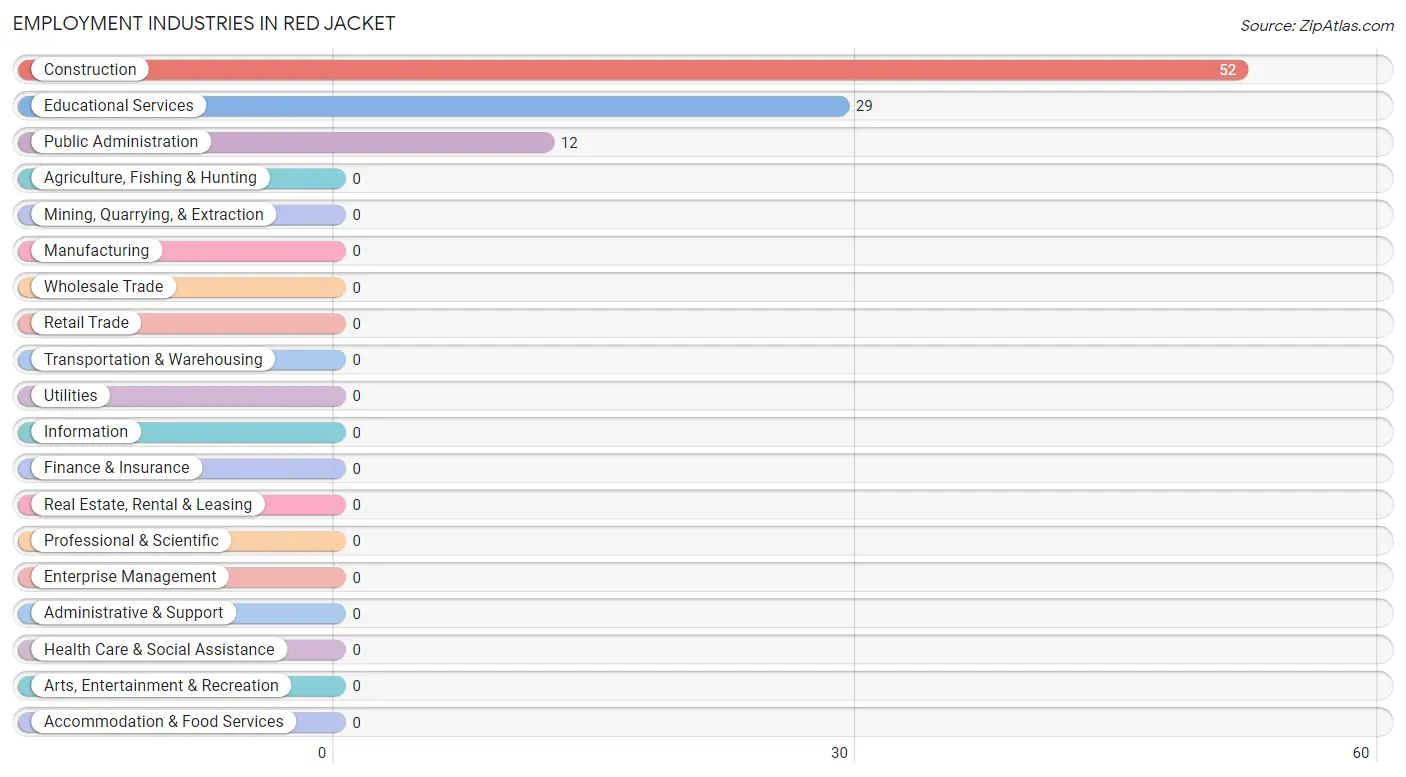
Employment Industries in Red Jacket
The major employment industries in Red Jacket include Construction (52 | 55.9%), Educational Services (29 | 31.2%), and Public Administration (12 | 12.9%).
Employment Industries by Sex in Red Jacket
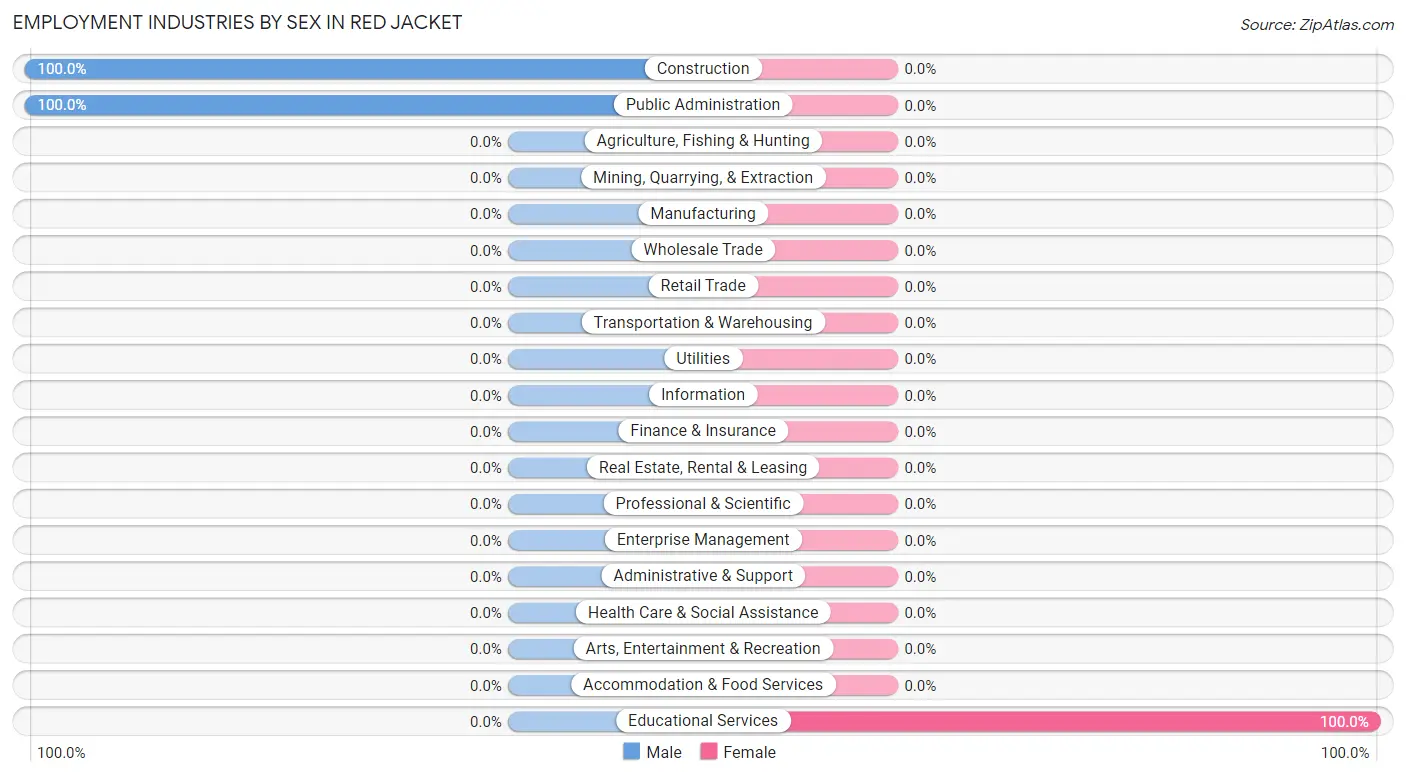
| Industry | Male | Female |
| Agriculture, Fishing & Hunting | 0 (0.0%) | 0 (0.0%) |
| Mining, Quarrying, & Extraction | 0 (0.0%) | 0 (0.0%) |
| Construction | 52 (100.0%) | 0 (0.0%) |
| Manufacturing | 0 (0.0%) | 0 (0.0%) |
| Wholesale Trade | 0 (0.0%) | 0 (0.0%) |
| Retail Trade | 0 (0.0%) | 0 (0.0%) |
| Transportation & Warehousing | 0 (0.0%) | 0 (0.0%) |
| Utilities | 0 (0.0%) | 0 (0.0%) |
| Information | 0 (0.0%) | 0 (0.0%) |
| Finance & Insurance | 0 (0.0%) | 0 (0.0%) |
| Real Estate, Rental & Leasing | 0 (0.0%) | 0 (0.0%) |
| Professional & Scientific | 0 (0.0%) | 0 (0.0%) |
| Enterprise Management | 0 (0.0%) | 0 (0.0%) |
| Administrative & Support | 0 (0.0%) | 0 (0.0%) |
| Educational Services | 0 (0.0%) | 29 (100.0%) |
| Health Care & Social Assistance | 0 (0.0%) | 0 (0.0%) |
| Arts, Entertainment & Recreation | 0 (0.0%) | 0 (0.0%) |
| Accommodation & Food Services | 0 (0.0%) | 0 (0.0%) |
| Public Administration | 12 (100.0%) | 0 (0.0%) |
| Total | 64 (68.8%) | 29 (31.2%) |
Education in Red Jacket
School Enrollment in Red Jacket
The most common levels of schooling among the 136 students in Red Jacket are elementary school (58 | 42.6%), middle school (58 | 42.6%), and high school (20 | 14.7%).
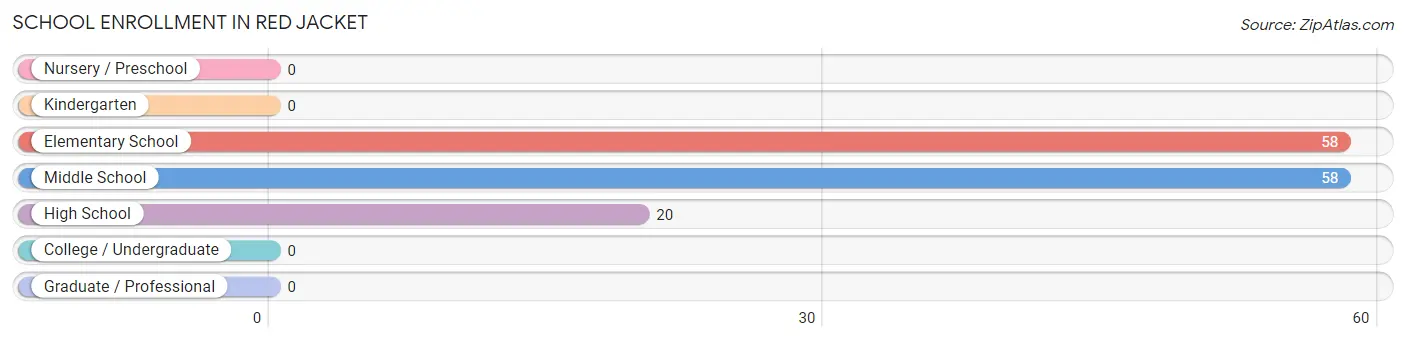
| School Level | # Students | % Students |
| Nursery / Preschool | 0 | 0.0% |
| Kindergarten | 0 | 0.0% |
| Elementary School | 58 | 42.6% |
| Middle School | 58 | 42.6% |
| High School | 20 | 14.7% |
| College / Undergraduate | 0 | 0.0% |
| Graduate / Professional | 0 | 0.0% |
| Total | 136 | 100.0% |
School Enrollment by Age by Funding Source in Red Jacket
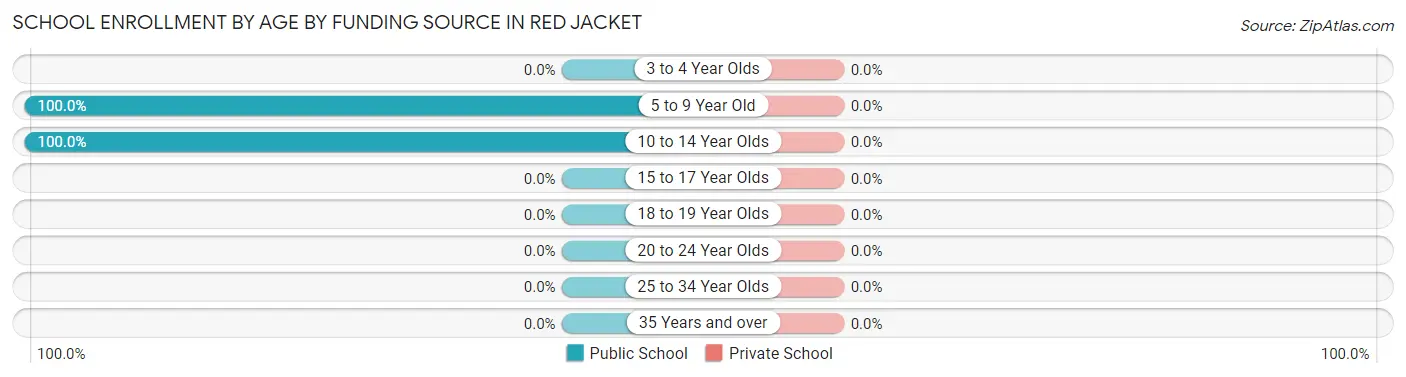
| Age Bracket | Public School | Private School |
| 3 to 4 Year Olds | 0 (0.0%) | 0 (0.0%) |
| 5 to 9 Year Old | 36 (100.0%) | 0 (0.0%) |
| 10 to 14 Year Olds | 100 (100.0%) | 0 (0.0%) |
| 15 to 17 Year Olds | 0 (0.0%) | 0 (0.0%) |
| 18 to 19 Year Olds | 0 (0.0%) | 0 (0.0%) |
| 20 to 24 Year Olds | 0 (0.0%) | 0 (0.0%) |
| 25 to 34 Year Olds | 0 (0.0%) | 0 (0.0%) |
| 35 Years and over | 0 (0.0%) | 0 (0.0%) |
| Total | 136 (100.0%) | 0 (0.0%) |
Educational Attainment by Field of Study in Red Jacket
Education (29 | 60.4%), and arts & humanities (19 | 39.6%) are the most common fields of study among 48 individuals in Red Jacket who have obtained a bachelor's degree or higher.
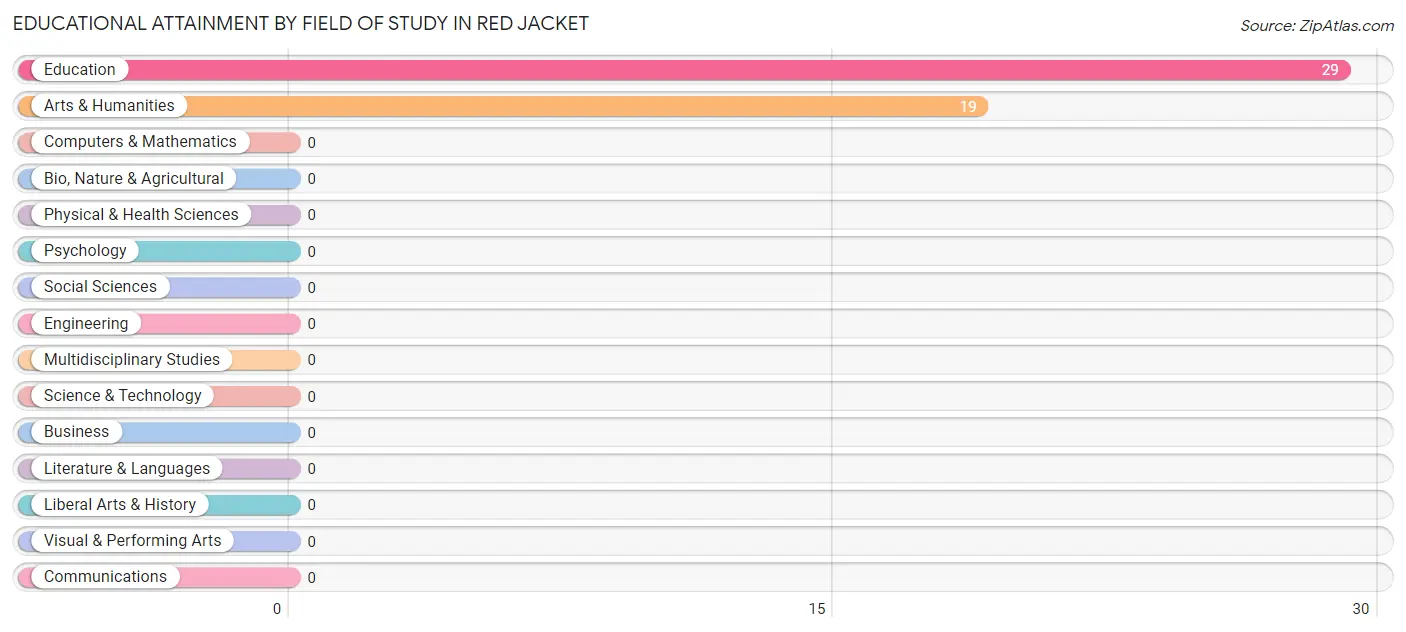
| Field of Study | # Graduates | % Graduates |
| Computers & Mathematics | 0 | 0.0% |
| Bio, Nature & Agricultural | 0 | 0.0% |
| Physical & Health Sciences | 0 | 0.0% |
| Psychology | 0 | 0.0% |
| Social Sciences | 0 | 0.0% |
| Engineering | 0 | 0.0% |
| Multidisciplinary Studies | 0 | 0.0% |
| Science & Technology | 0 | 0.0% |
| Business | 0 | 0.0% |
| Education | 29 | 60.4% |
| Literature & Languages | 0 | 0.0% |
| Liberal Arts & History | 0 | 0.0% |
| Visual & Performing Arts | 0 | 0.0% |
| Communications | 0 | 0.0% |
| Arts & Humanities | 19 | 39.6% |
| Total | 48 | 100.0% |
Transportation & Commute in Red Jacket
Vehicle Availability by Sex in Red Jacket
The most prevalent vehicle ownership categories in Red Jacket are males with 1 vehicle (35, accounting for 54.7%) and females with 1 vehicle (0, making up 250.0%).
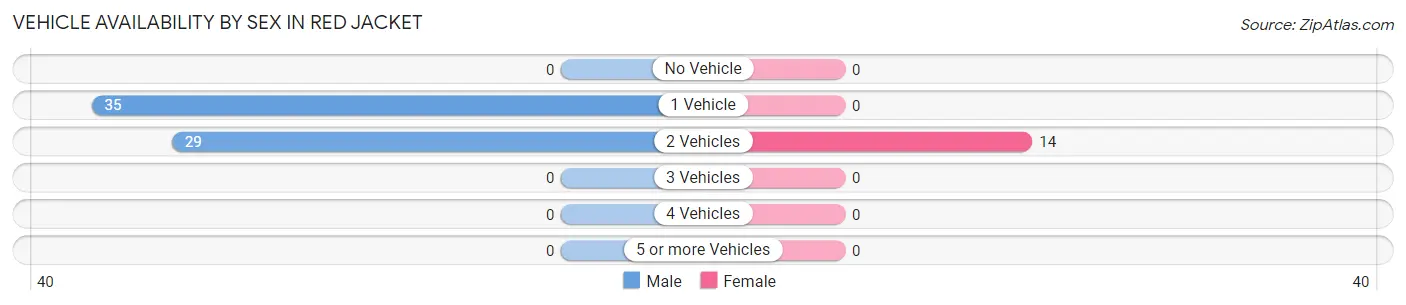
| Vehicles Available | Male | Female |
| No Vehicle | 0 (0.0%) | 0 (0.0%) |
| 1 Vehicle | 35 (54.7%) | 0 (0.0%) |
| 2 Vehicles | 29 (45.3%) | 14 (100.0%) |
| 3 Vehicles | 0 (0.0%) | 0 (0.0%) |
| 4 Vehicles | 0 (0.0%) | 0 (0.0%) |
| 5 or more Vehicles | 0 (0.0%) | 0 (0.0%) |
| Total | 64 (100.0%) | 14 (100.0%) |
Commute Time in Red Jacket
The most frequently occuring commute durations in Red Jacket are 20 to 24 minutes (19 commuters, 24.4%), 40 to 44 minutes (17 commuters, 21.8%), and 90 or more minutes (16 commuters, 20.5%).
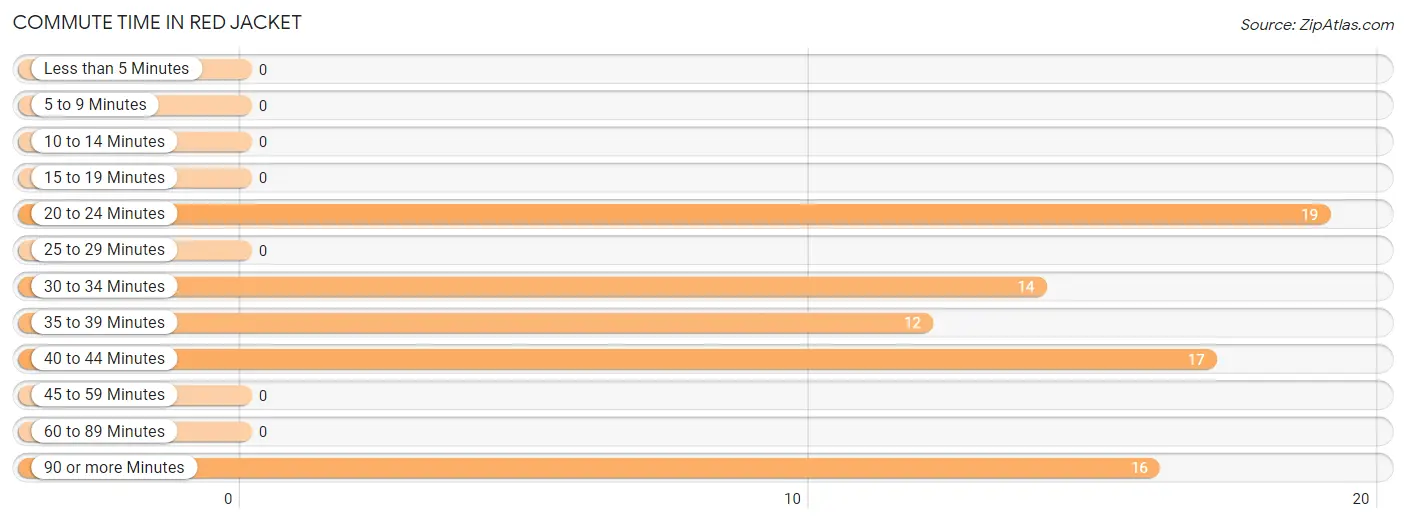
| Commute Time | # Commuters | % Commuters |
| Less than 5 Minutes | 0 | 0.0% |
| 5 to 9 Minutes | 0 | 0.0% |
| 10 to 14 Minutes | 0 | 0.0% |
| 15 to 19 Minutes | 0 | 0.0% |
| 20 to 24 Minutes | 19 | 24.4% |
| 25 to 29 Minutes | 0 | 0.0% |
| 30 to 34 Minutes | 14 | 17.9% |
| 35 to 39 Minutes | 12 | 15.4% |
| 40 to 44 Minutes | 17 | 21.8% |
| 45 to 59 Minutes | 0 | 0.0% |
| 60 to 89 Minutes | 0 | 0.0% |
| 90 or more Minutes | 16 | 20.5% |
Commute Time by Sex in Red Jacket
The most common commute times in Red Jacket are 20 to 24 minutes (19 commuters, 29.7%) for males and 30 to 34 minutes (14 commuters, 100.0%) for females.
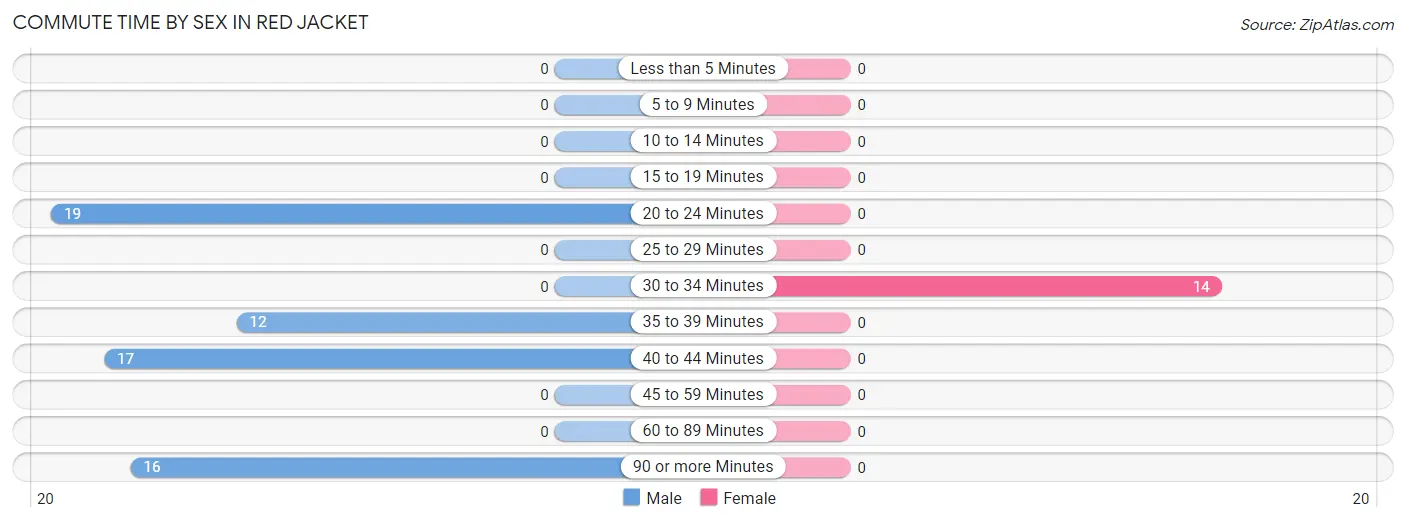
| Commute Time | Male | Female |
| Less than 5 Minutes | 0 (0.0%) | 0 (0.0%) |
| 5 to 9 Minutes | 0 (0.0%) | 0 (0.0%) |
| 10 to 14 Minutes | 0 (0.0%) | 0 (0.0%) |
| 15 to 19 Minutes | 0 (0.0%) | 0 (0.0%) |
| 20 to 24 Minutes | 19 (29.7%) | 0 (0.0%) |
| 25 to 29 Minutes | 0 (0.0%) | 0 (0.0%) |
| 30 to 34 Minutes | 0 (0.0%) | 14 (100.0%) |
| 35 to 39 Minutes | 12 (18.8%) | 0 (0.0%) |
| 40 to 44 Minutes | 17 (26.6%) | 0 (0.0%) |
| 45 to 59 Minutes | 0 (0.0%) | 0 (0.0%) |
| 60 to 89 Minutes | 0 (0.0%) | 0 (0.0%) |
| 90 or more Minutes | 16 (25.0%) | 0 (0.0%) |
Time of Departure to Work by Sex in Red Jacket
The most frequent times of departure to work in Red Jacket are 12:00 PM to 3:59 PM (19, 29.7%) for males and 7:00 AM to 7:29 AM (14, 100.0%) for females.
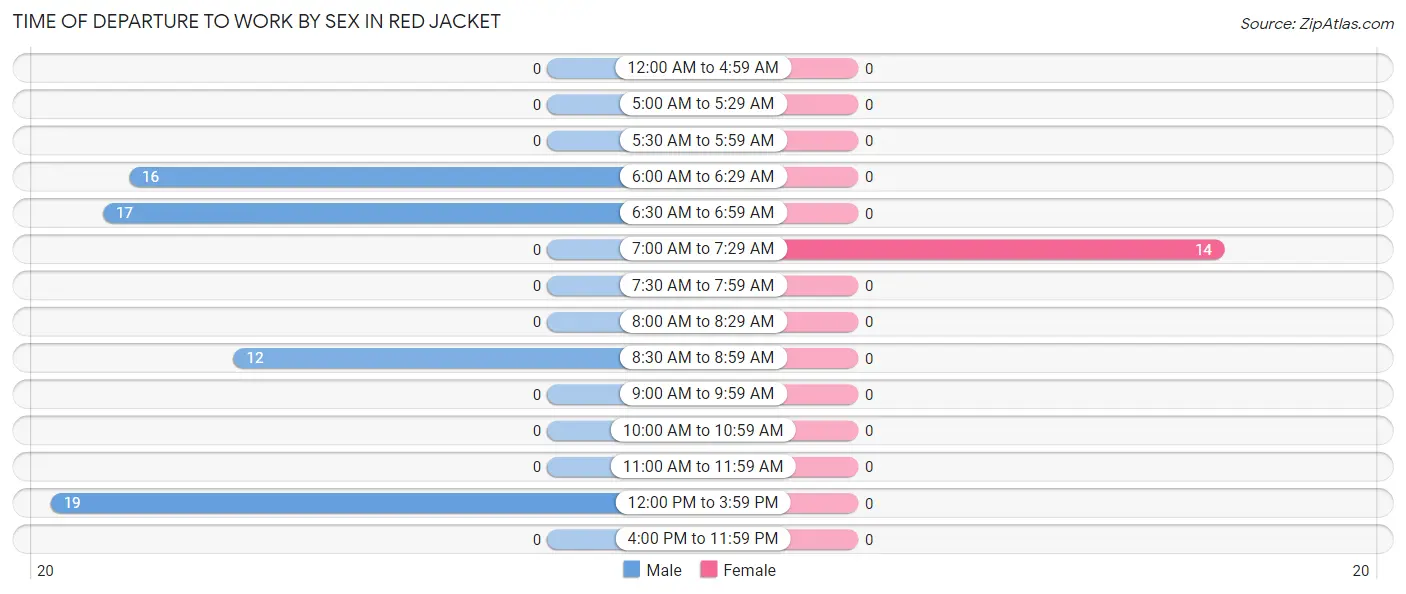
| Time of Departure | Male | Female |
| 12:00 AM to 4:59 AM | 0 (0.0%) | 0 (0.0%) |
| 5:00 AM to 5:29 AM | 0 (0.0%) | 0 (0.0%) |
| 5:30 AM to 5:59 AM | 0 (0.0%) | 0 (0.0%) |
| 6:00 AM to 6:29 AM | 16 (25.0%) | 0 (0.0%) |
| 6:30 AM to 6:59 AM | 17 (26.6%) | 0 (0.0%) |
| 7:00 AM to 7:29 AM | 0 (0.0%) | 14 (100.0%) |
| 7:30 AM to 7:59 AM | 0 (0.0%) | 0 (0.0%) |
| 8:00 AM to 8:29 AM | 0 (0.0%) | 0 (0.0%) |
| 8:30 AM to 8:59 AM | 12 (18.8%) | 0 (0.0%) |
| 9:00 AM to 9:59 AM | 0 (0.0%) | 0 (0.0%) |
| 10:00 AM to 10:59 AM | 0 (0.0%) | 0 (0.0%) |
| 11:00 AM to 11:59 AM | 0 (0.0%) | 0 (0.0%) |
| 12:00 PM to 3:59 PM | 19 (29.7%) | 0 (0.0%) |
| 4:00 PM to 11:59 PM | 0 (0.0%) | 0 (0.0%) |
| Total | 64 (100.0%) | 14 (100.0%) |
Housing Occupancy in Red Jacket
Occupancy by Ownership in Red Jacket
Of the total 258 dwellings in Red Jacket, owner-occupied units account for 203 (78.7%), while renter-occupied units make up 55 (21.3%).
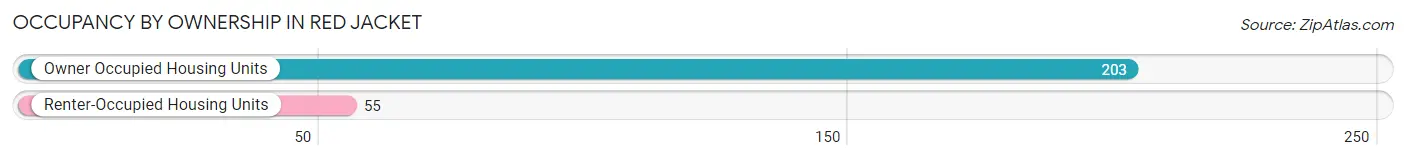
| Occupancy | # Housing Units | % Housing Units |
| Owner Occupied Housing Units | 203 | 78.7% |
| Renter-Occupied Housing Units | 55 | 21.3% |
| Total Occupied Housing Units | 258 | 100.0% |
Occupancy by Household Size in Red Jacket
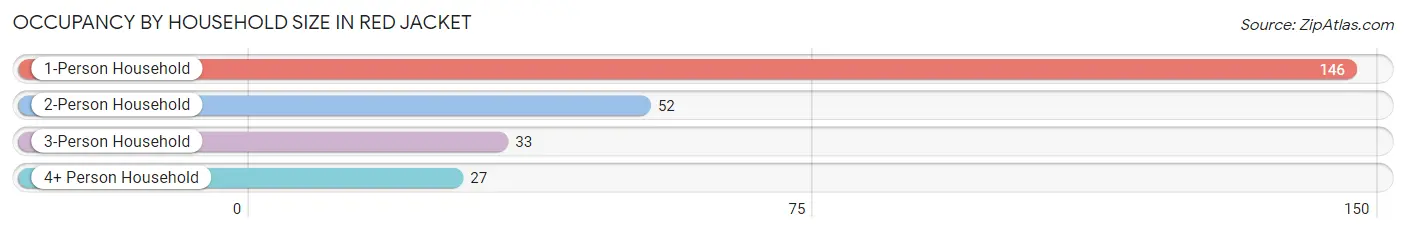
| Household Size | # Housing Units | % Housing Units |
| 1-Person Household | 146 | 56.6% |
| 2-Person Household | 52 | 20.2% |
| 3-Person Household | 33 | 12.8% |
| 4+ Person Household | 27 | 10.5% |
| Total Housing Units | 258 | 100.0% |
Occupancy by Ownership by Household Size in Red Jacket
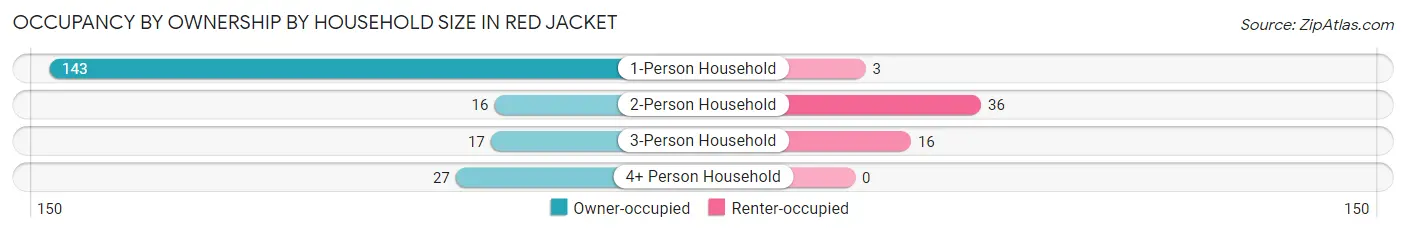
| Household Size | Owner-occupied | Renter-occupied |
| 1-Person Household | 143 (98.0%) | 3 (2.1%) |
| 2-Person Household | 16 (30.8%) | 36 (69.2%) |
| 3-Person Household | 17 (51.5%) | 16 (48.5%) |
| 4+ Person Household | 27 (100.0%) | 0 (0.0%) |
| Total Housing Units | 203 (78.7%) | 55 (21.3%) |
Occupancy by Educational Attainment in Red Jacket
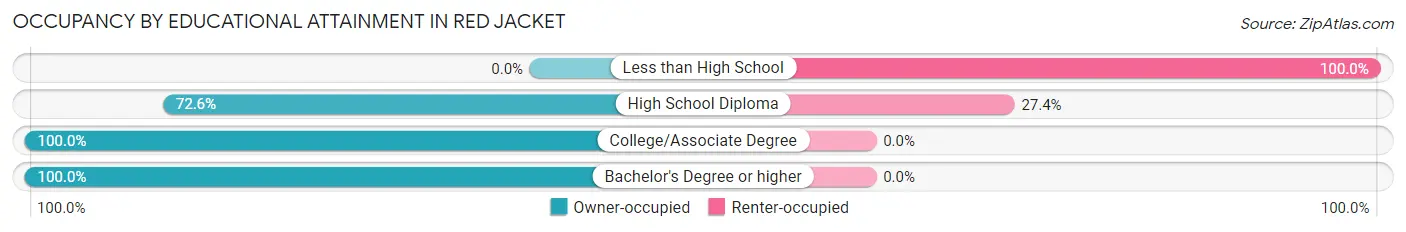
| Household Size | Owner-occupied | Renter-occupied |
| Less than High School | 0 (0.0%) | 38 (100.0%) |
| High School Diploma | 45 (72.6%) | 17 (27.4%) |
| College/Associate Degree | 143 (100.0%) | 0 (0.0%) |
| Bachelor's Degree or higher | 15 (100.0%) | 0 (0.0%) |
Occupancy by Age of Householder in Red Jacket
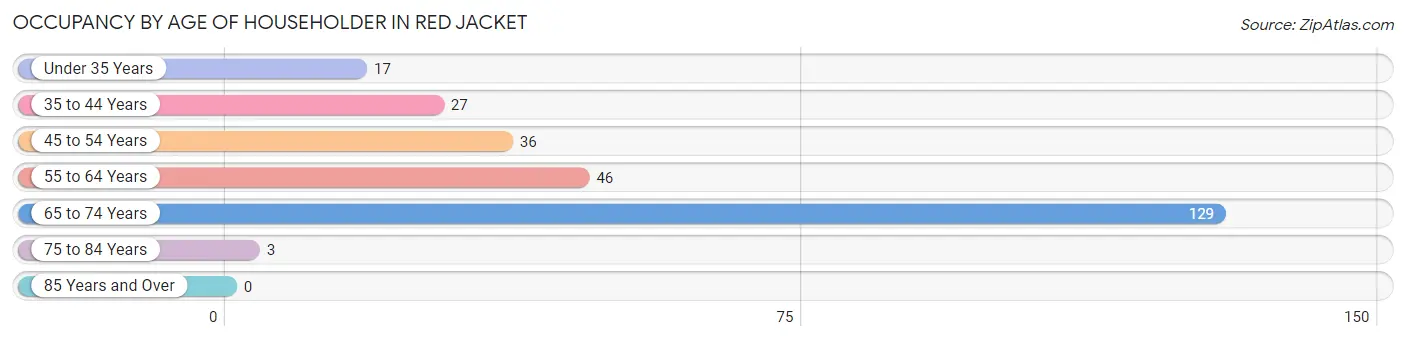
| Age Bracket | # Households | % Households |
| Under 35 Years | 17 | 6.6% |
| 35 to 44 Years | 27 | 10.5% |
| 45 to 54 Years | 36 | 14.0% |
| 55 to 64 Years | 46 | 17.8% |
| 65 to 74 Years | 129 | 50.0% |
| 75 to 84 Years | 3 | 1.2% |
| 85 Years and Over | 0 | 0.0% |
| Total | 258 | 100.0% |
Housing Finances in Red Jacket
Median Income by Occupancy in Red Jacket
| Occupancy Type | # Households | Median Income |
| Owner-Occupied | 203 (78.7%) | $0 |
| Renter-Occupied | 55 (21.3%) | $0 |
| Average | 258 (100.0%) | $0 |
Occupancy by Householder Income Bracket in Red Jacket
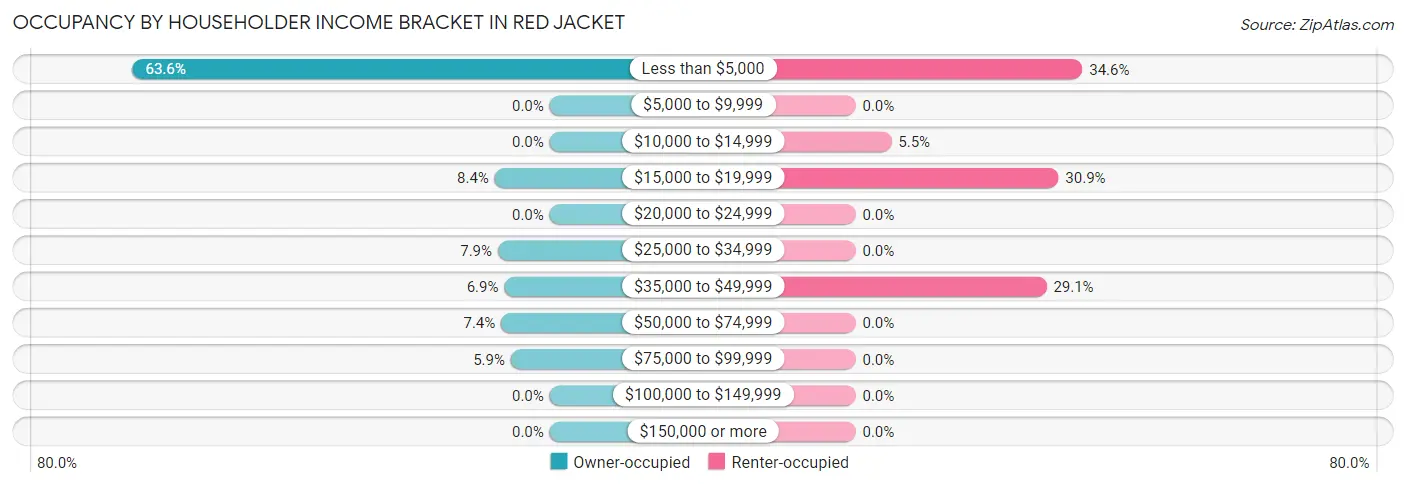
| Income Bracket | Owner-occupied | Renter-occupied |
| Less than $5,000 | 129 (63.5%) | 19 (34.5%) |
| $5,000 to $9,999 | 0 (0.0%) | 0 (0.0%) |
| $10,000 to $14,999 | 0 (0.0%) | 3 (5.4%) |
| $15,000 to $19,999 | 17 (8.4%) | 17 (30.9%) |
| $20,000 to $24,999 | 0 (0.0%) | 0 (0.0%) |
| $25,000 to $34,999 | 16 (7.9%) | 0 (0.0%) |
| $35,000 to $49,999 | 14 (6.9%) | 16 (29.1%) |
| $50,000 to $74,999 | 15 (7.4%) | 0 (0.0%) |
| $75,000 to $99,999 | 12 (5.9%) | 0 (0.0%) |
| $100,000 to $149,999 | 0 (0.0%) | 0 (0.0%) |
| $150,000 or more | 0 (0.0%) | 0 (0.0%) |
| Total | 203 (100.0%) | 55 (100.0%) |
Monthly Housing Cost Tiers in Red Jacket
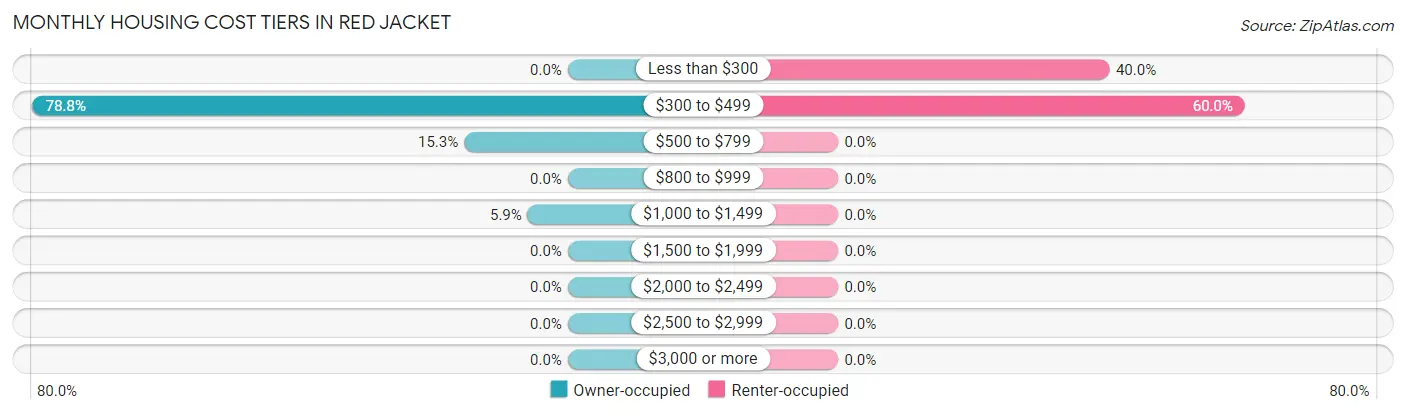
| Monthly Cost | Owner-occupied | Renter-occupied |
| Less than $300 | 0 (0.0%) | 22 (40.0%) |
| $300 to $499 | 160 (78.8%) | 33 (60.0%) |
| $500 to $799 | 31 (15.3%) | 0 (0.0%) |
| $800 to $999 | 0 (0.0%) | 0 (0.0%) |
| $1,000 to $1,499 | 12 (5.9%) | 0 (0.0%) |
| $1,500 to $1,999 | 0 (0.0%) | 0 (0.0%) |
| $2,000 to $2,499 | 0 (0.0%) | 0 (0.0%) |
| $2,500 to $2,999 | 0 (0.0%) | 0 (0.0%) |
| $3,000 or more | 0 (0.0%) | 0 (0.0%) |
| Total | 203 (100.0%) | 55 (100.0%) |
Physical Housing Characteristics in Red Jacket
Housing Structures in Red Jacket
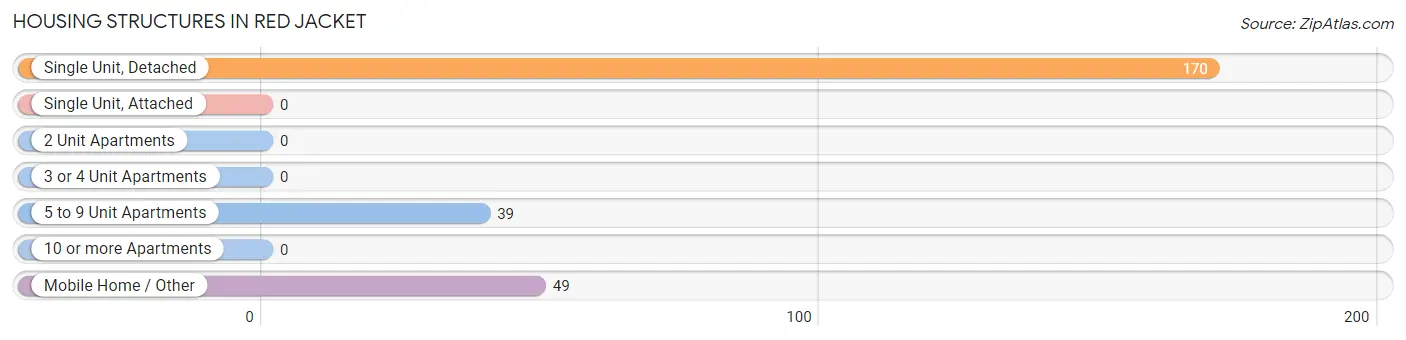
| Structure Type | # Housing Units | % Housing Units |
| Single Unit, Detached | 170 | 65.9% |
| Single Unit, Attached | 0 | 0.0% |
| 2 Unit Apartments | 0 | 0.0% |
| 3 or 4 Unit Apartments | 0 | 0.0% |
| 5 to 9 Unit Apartments | 39 | 15.1% |
| 10 or more Apartments | 0 | 0.0% |
| Mobile Home / Other | 49 | 19.0% |
| Total | 258 | 100.0% |
Housing Structures by Occupancy in Red Jacket
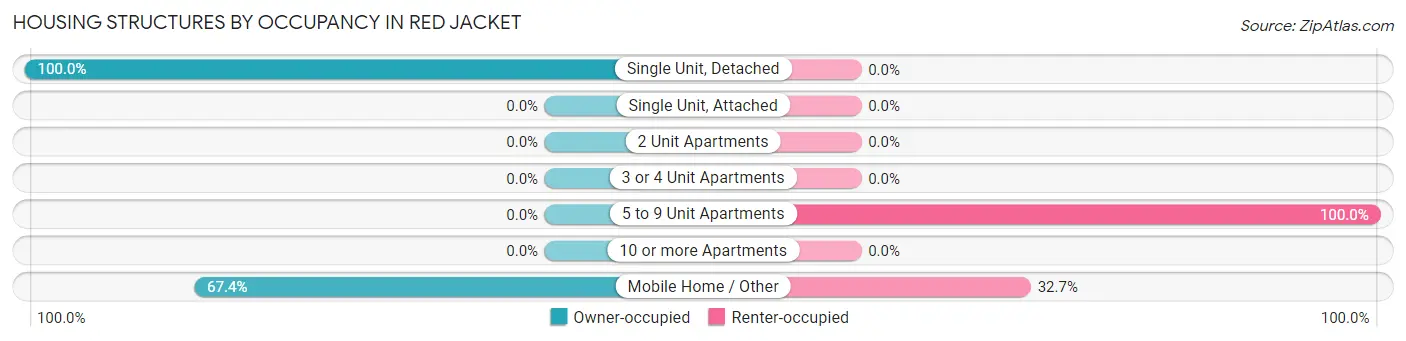
| Structure Type | Owner-occupied | Renter-occupied |
| Single Unit, Detached | 170 (100.0%) | 0 (0.0%) |
| Single Unit, Attached | 0 (0.0%) | 0 (0.0%) |
| 2 Unit Apartments | 0 (0.0%) | 0 (0.0%) |
| 3 or 4 Unit Apartments | 0 (0.0%) | 0 (0.0%) |
| 5 to 9 Unit Apartments | 0 (0.0%) | 39 (100.0%) |
| 10 or more Apartments | 0 (0.0%) | 0 (0.0%) |
| Mobile Home / Other | 33 (67.3%) | 16 (32.7%) |
| Total | 203 (78.7%) | 55 (21.3%) |
Housing Structures by Number of Rooms in Red Jacket
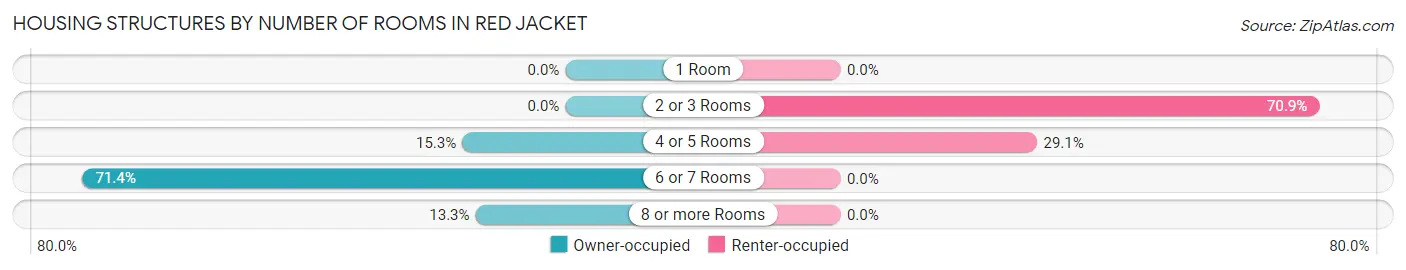
| Number of Rooms | Owner-occupied | Renter-occupied |
| 1 Room | 0 (0.0%) | 0 (0.0%) |
| 2 or 3 Rooms | 0 (0.0%) | 39 (70.9%) |
| 4 or 5 Rooms | 31 (15.3%) | 16 (29.1%) |
| 6 or 7 Rooms | 145 (71.4%) | 0 (0.0%) |
| 8 or more Rooms | 27 (13.3%) | 0 (0.0%) |
| Total | 203 (100.0%) | 55 (100.0%) |
Housing Structure by Heating Type in Red Jacket
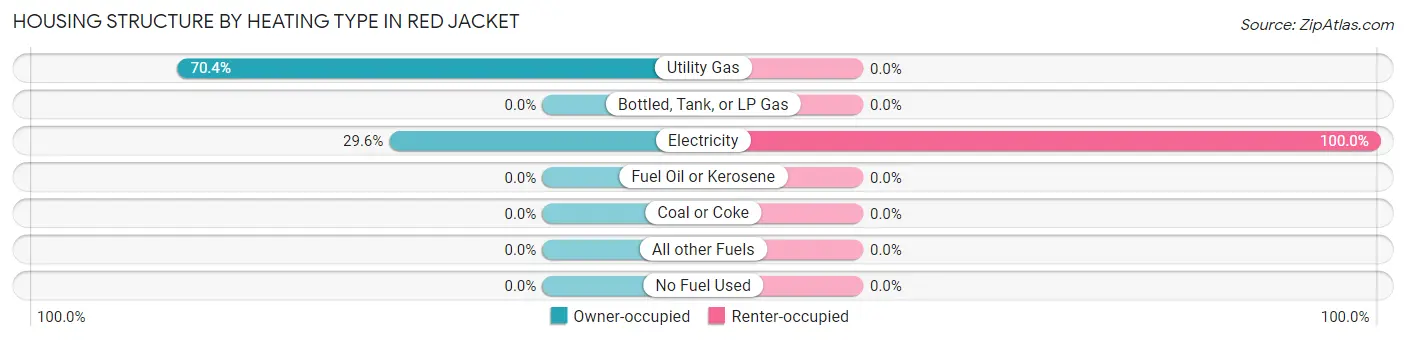
| Heating Type | Owner-occupied | Renter-occupied |
| Utility Gas | 143 (70.4%) | 0 (0.0%) |
| Bottled, Tank, or LP Gas | 0 (0.0%) | 0 (0.0%) |
| Electricity | 60 (29.6%) | 55 (100.0%) |
| Fuel Oil or Kerosene | 0 (0.0%) | 0 (0.0%) |
| Coal or Coke | 0 (0.0%) | 0 (0.0%) |
| All other Fuels | 0 (0.0%) | 0 (0.0%) |
| No Fuel Used | 0 (0.0%) | 0 (0.0%) |
| Total | 203 (100.0%) | 55 (100.0%) |
Household Vehicle Usage in Red Jacket
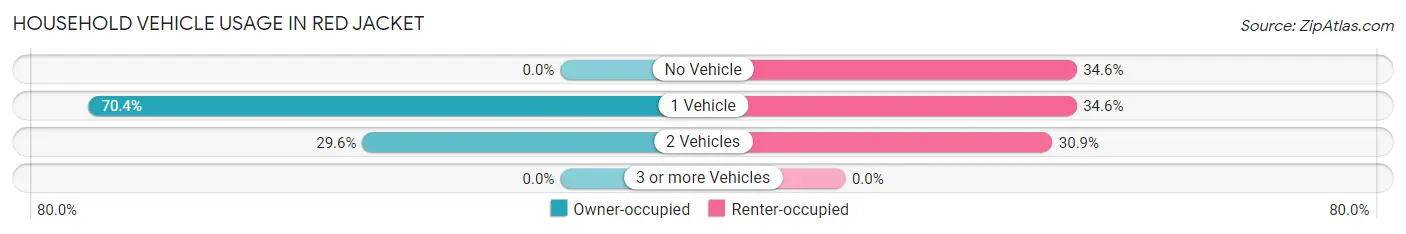
| Vehicles per Household | Owner-occupied | Renter-occupied |
| No Vehicle | 0 (0.0%) | 19 (34.5%) |
| 1 Vehicle | 143 (70.4%) | 19 (34.5%) |
| 2 Vehicles | 60 (29.6%) | 17 (30.9%) |
| 3 or more Vehicles | 0 (0.0%) | 0 (0.0%) |
| Total | 203 (100.0%) | 55 (100.0%) |
Real Estate & Mortgages in Red Jacket
Real Estate and Mortgage Overview in Red Jacket
| Characteristic | Without Mortgage | With Mortgage |
| Housing Units | 177 | 26 |
| Median Property Value | $215,700 | $0 |
| Median Household Income | - | - |
| Monthly Housing Costs | $450 | $0 |
| Real Estate Taxes | $1,188 | $0 |
Property Value by Mortgage Status in Red Jacket
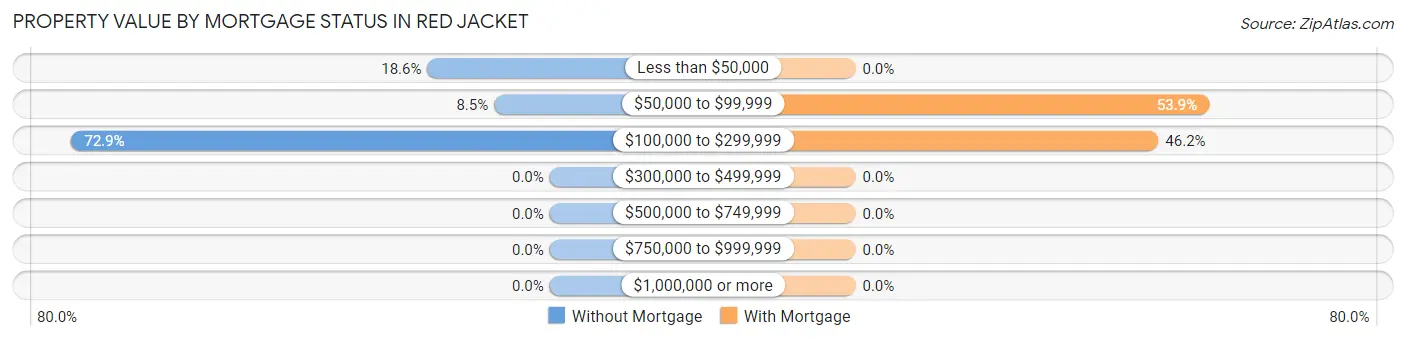
| Property Value | Without Mortgage | With Mortgage |
| Less than $50,000 | 33 (18.6%) | 0 (0.0%) |
| $50,000 to $99,999 | 15 (8.5%) | 14 (53.8%) |
| $100,000 to $299,999 | 129 (72.9%) | 12 (46.2%) |
| $300,000 to $499,999 | 0 (0.0%) | 0 (0.0%) |
| $500,000 to $749,999 | 0 (0.0%) | 0 (0.0%) |
| $750,000 to $999,999 | 0 (0.0%) | 0 (0.0%) |
| $1,000,000 or more | 0 (0.0%) | 0 (0.0%) |
| Total | 177 (100.0%) | 26 (100.0%) |
Household Income by Mortgage Status in Red Jacket
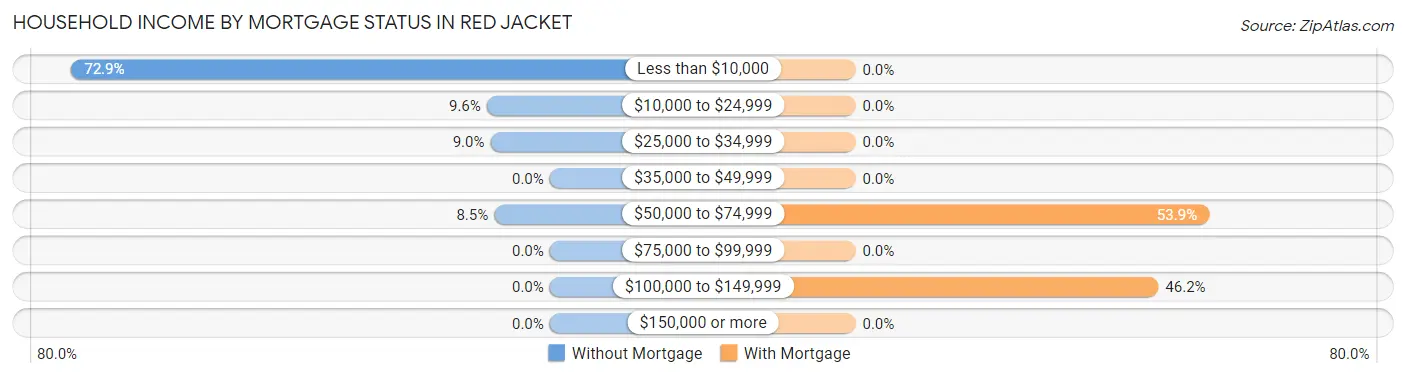
| Household Income | Without Mortgage | With Mortgage |
| Less than $10,000 | 129 (72.9%) | 0 (0.0%) |
| $10,000 to $24,999 | 17 (9.6%) | 0 (0.0%) |
| $25,000 to $34,999 | 16 (9.0%) | 0 (0.0%) |
| $35,000 to $49,999 | 0 (0.0%) | 0 (0.0%) |
| $50,000 to $74,999 | 15 (8.5%) | 14 (53.8%) |
| $75,000 to $99,999 | 0 (0.0%) | 0 (0.0%) |
| $100,000 to $149,999 | 0 (0.0%) | 12 (46.2%) |
| $150,000 or more | 0 (0.0%) | 0 (0.0%) |
| Total | 177 (100.0%) | 26 (100.0%) |
Property Value to Household Income Ratio in Red Jacket
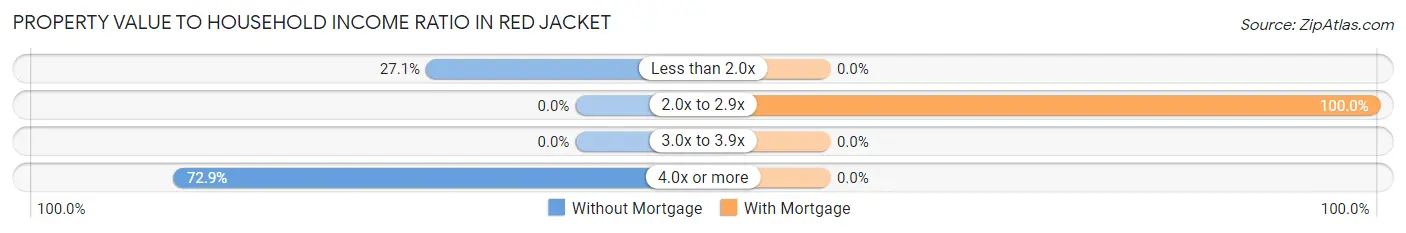
| Value-to-Income Ratio | Without Mortgage | With Mortgage |
| Less than 2.0x | 48 (27.1%) | 0 (0.0%) |
| 2.0x to 2.9x | 0 (0.0%) | 26 (100.0%) |
| 3.0x to 3.9x | 0 (0.0%) | 0 (0.0%) |
| 4.0x or more | 129 (72.9%) | 0 (0.0%) |
| Total | 177 (100.0%) | 26 (100.0%) |
Real Estate Taxes by Mortgage Status in Red Jacket
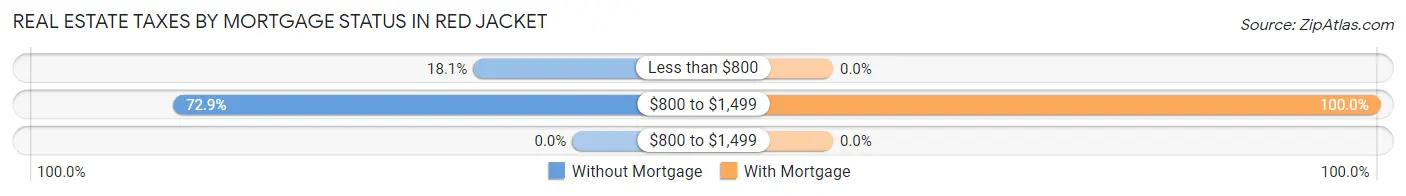
| Property Taxes | Without Mortgage | With Mortgage |
| Less than $800 | 32 (18.1%) | 0 (0.0%) |
| $800 to $1,499 | 129 (72.9%) | 26 (100.0%) |
| $800 to $1,499 | 0 (0.0%) | 0 (0.0%) |
| Total | 177 (100.0%) | 26 (100.0%) |
Health & Disability in Red Jacket
Health Insurance Coverage by Age in Red Jacket
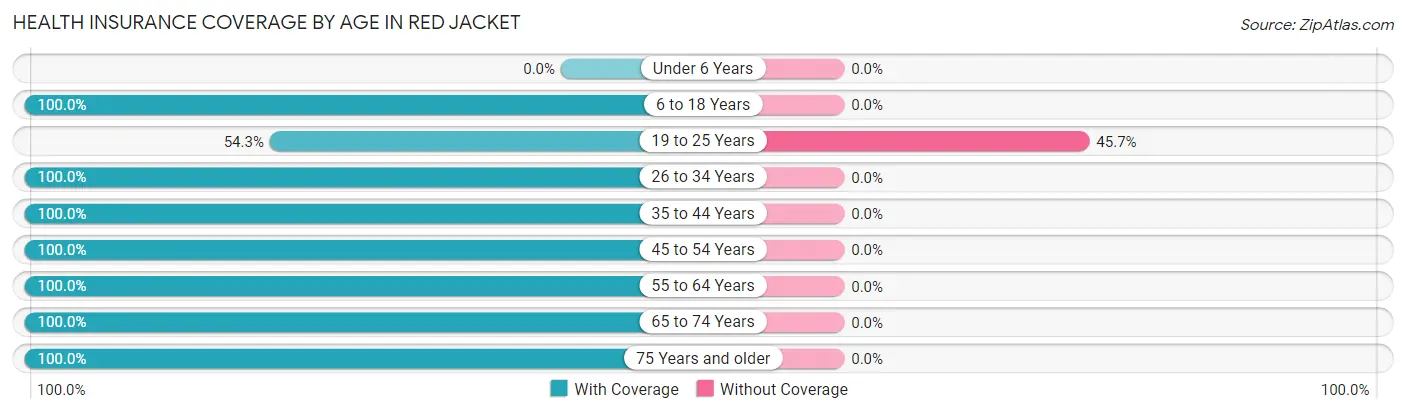
| Age Bracket | With Coverage | Without Coverage |
| Under 6 Years | 0 (0.0%) | 0 (0.0%) |
| 6 to 18 Years | 136 (100.0%) | 0 (0.0%) |
| 19 to 25 Years | 19 (54.3%) | 16 (45.7%) |
| 26 to 34 Years | 34 (100.0%) | 0 (0.0%) |
| 35 to 44 Years | 41 (100.0%) | 0 (0.0%) |
| 45 to 54 Years | 57 (100.0%) | 0 (0.0%) |
| 55 to 64 Years | 77 (100.0%) | 0 (0.0%) |
| 65 to 74 Years | 129 (100.0%) | 0 (0.0%) |
| 75 Years and older | 3 (100.0%) | 0 (0.0%) |
| Total | 496 (96.9%) | 16 (3.1%) |
Health Insurance Coverage by Citizenship Status in Red Jacket
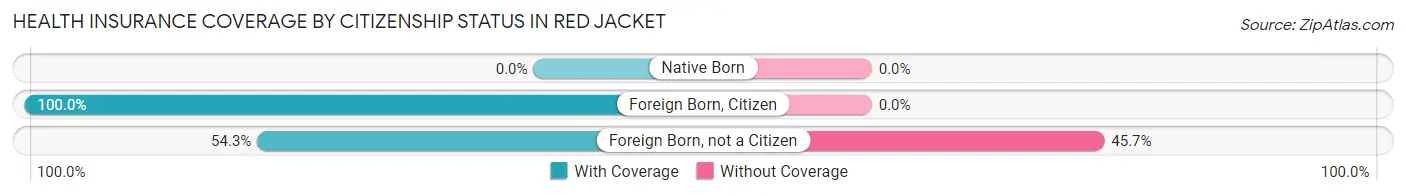
| Citizenship Status | With Coverage | Without Coverage |
| Native Born | 0 (0.0%) | 0 (0.0%) |
| Foreign Born, Citizen | 136 (100.0%) | 0 (0.0%) |
| Foreign Born, not a Citizen | 19 (54.3%) | 16 (45.7%) |
Health Insurance Coverage by Household Income in Red Jacket
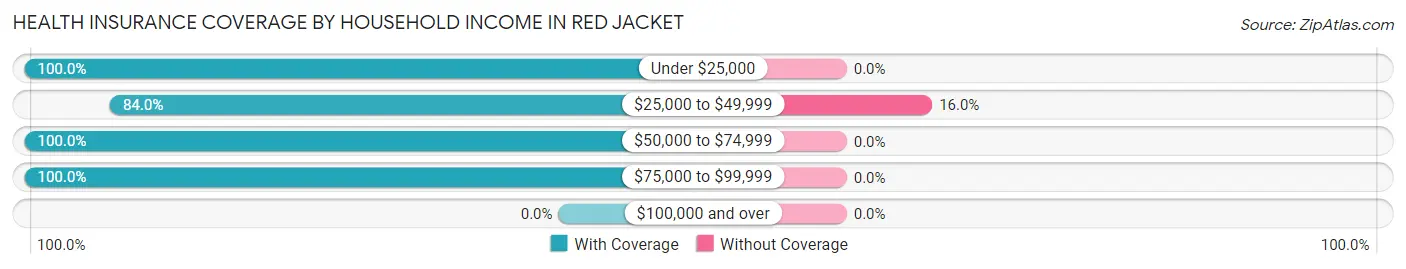
| Household Income | With Coverage | Without Coverage |
| Under $25,000 | 255 (100.0%) | 0 (0.0%) |
| $25,000 to $49,999 | 84 (84.0%) | 16 (16.0%) |
| $50,000 to $74,999 | 76 (100.0%) | 0 (0.0%) |
| $75,000 to $99,999 | 81 (100.0%) | 0 (0.0%) |
| $100,000 and over | 0 (0.0%) | 0 (0.0%) |
Public vs Private Health Insurance Coverage by Age in Red Jacket
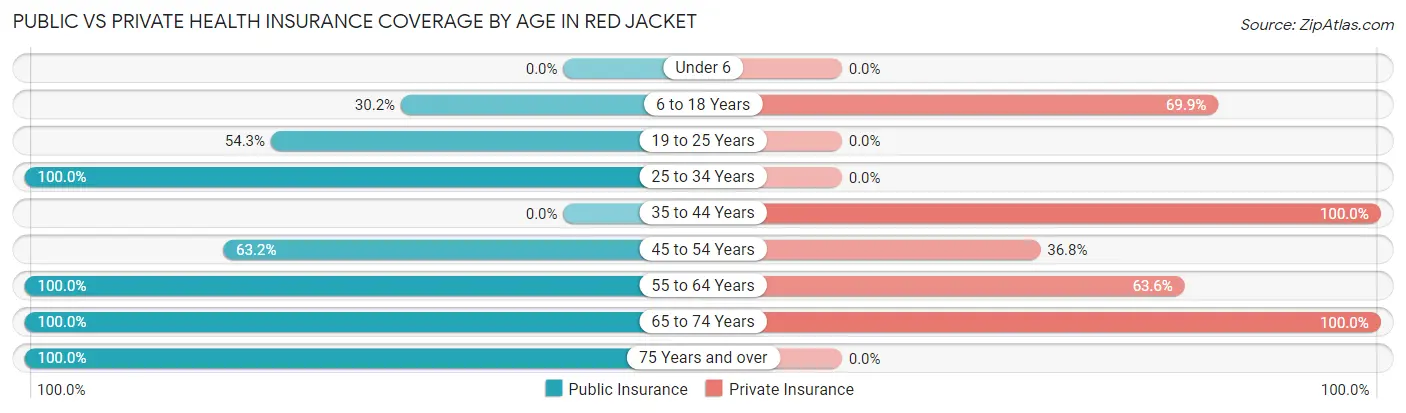
| Age Bracket | Public Insurance | Private Insurance |
| Under 6 | 0 (0.0%) | 0 (0.0%) |
| 6 to 18 Years | 41 (30.1%) | 95 (69.9%) |
| 19 to 25 Years | 19 (54.3%) | 0 (0.0%) |
| 25 to 34 Years | 34 (100.0%) | 0 (0.0%) |
| 35 to 44 Years | 0 (0.0%) | 41 (100.0%) |
| 45 to 54 Years | 36 (63.2%) | 21 (36.8%) |
| 55 to 64 Years | 77 (100.0%) | 49 (63.6%) |
| 65 to 74 Years | 129 (100.0%) | 129 (100.0%) |
| 75 Years and over | 3 (100.0%) | 0 (0.0%) |
| Total | 339 (66.2%) | 335 (65.4%) |
Disability Status by Sex by Age in Red Jacket
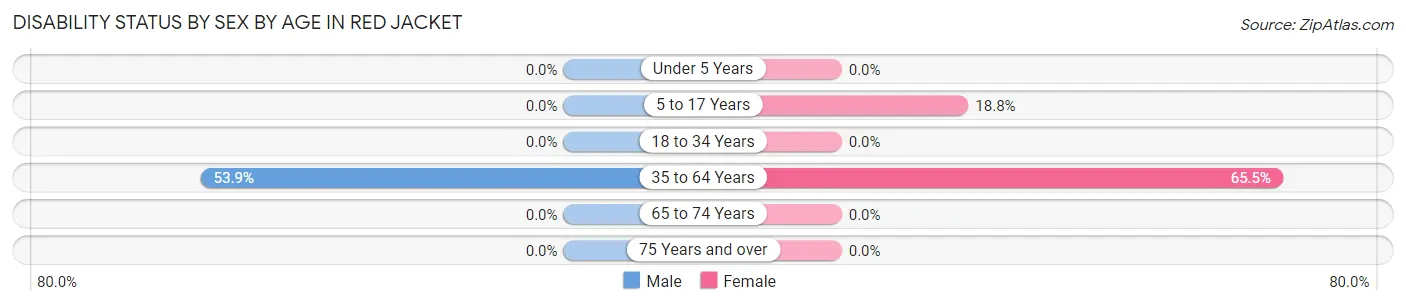
| Age Bracket | Male | Female |
| Under 5 Years | 0 (0.0%) | 0 (0.0%) |
| 5 to 17 Years | 0 (0.0%) | 22 (18.8%) |
| 18 to 34 Years | 0 (0.0%) | 0 (0.0%) |
| 35 to 64 Years | 49 (53.8%) | 55 (65.5%) |
| 65 to 74 Years | 0 (0.0%) | 0 (0.0%) |
| 75 Years and over | 0 (0.0%) | 0 (0.0%) |
Disability Class by Sex by Age in Red Jacket
Disability Class: Hearing Difficulty
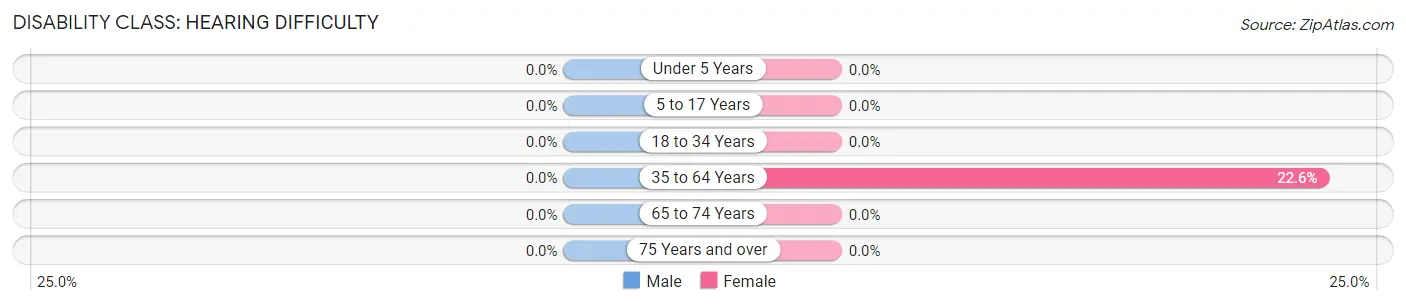
| Age Bracket | Male | Female |
| Under 5 Years | 0 (0.0%) | 0 (0.0%) |
| 5 to 17 Years | 0 (0.0%) | 0 (0.0%) |
| 18 to 34 Years | 0 (0.0%) | 0 (0.0%) |
| 35 to 64 Years | 0 (0.0%) | 19 (22.6%) |
| 65 to 74 Years | 0 (0.0%) | 0 (0.0%) |
| 75 Years and over | 0 (0.0%) | 0 (0.0%) |
Disability Class: Vision Difficulty
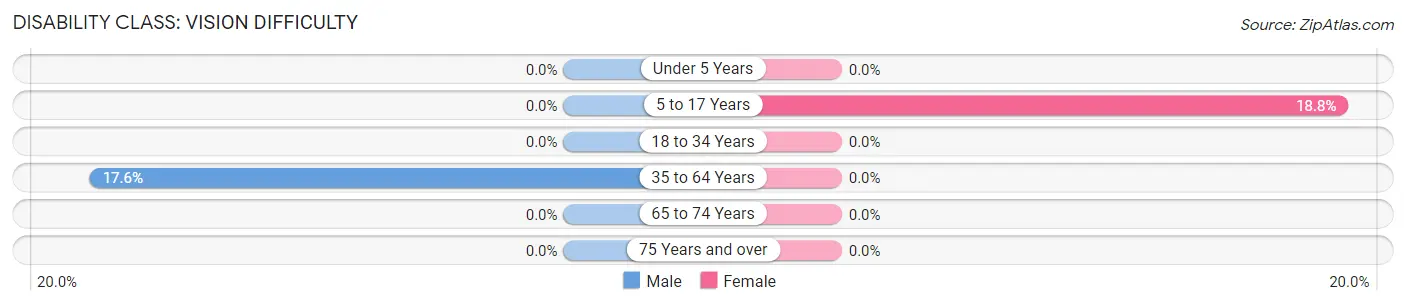
| Age Bracket | Male | Female |
| Under 5 Years | 0 (0.0%) | 0 (0.0%) |
| 5 to 17 Years | 0 (0.0%) | 22 (18.8%) |
| 18 to 34 Years | 0 (0.0%) | 0 (0.0%) |
| 35 to 64 Years | 16 (17.6%) | 0 (0.0%) |
| 65 to 74 Years | 0 (0.0%) | 0 (0.0%) |
| 75 Years and over | 0 (0.0%) | 0 (0.0%) |
Disability Class: Cognitive Difficulty
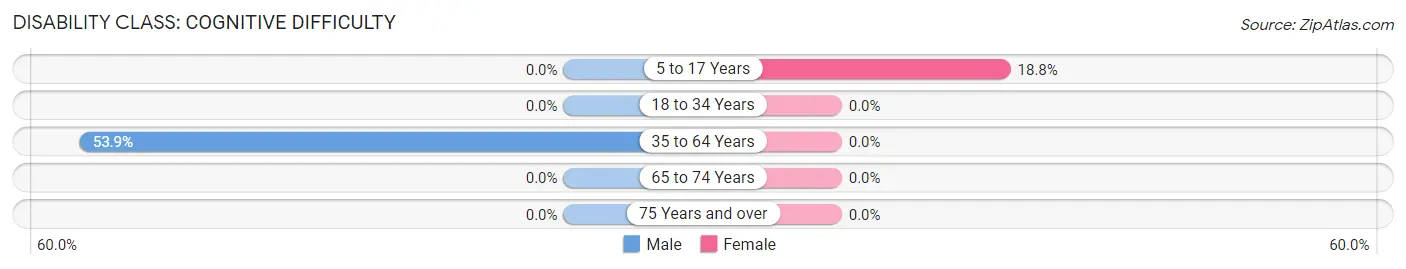
| Age Bracket | Male | Female |
| 5 to 17 Years | 0 (0.0%) | 22 (18.8%) |
| 18 to 34 Years | 0 (0.0%) | 0 (0.0%) |
| 35 to 64 Years | 49 (53.8%) | 0 (0.0%) |
| 65 to 74 Years | 0 (0.0%) | 0 (0.0%) |
| 75 Years and over | 0 (0.0%) | 0 (0.0%) |
Disability Class: Ambulatory Difficulty
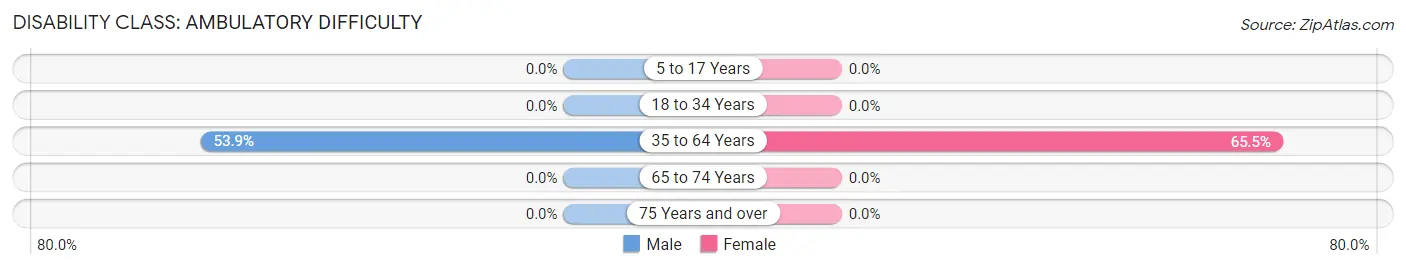
| Age Bracket | Male | Female |
| 5 to 17 Years | 0 (0.0%) | 0 (0.0%) |
| 18 to 34 Years | 0 (0.0%) | 0 (0.0%) |
| 35 to 64 Years | 49 (53.8%) | 55 (65.5%) |
| 65 to 74 Years | 0 (0.0%) | 0 (0.0%) |
| 75 Years and over | 0 (0.0%) | 0 (0.0%) |
Disability Class: Self-Care Difficulty
| Age Bracket | Male | Female |
| 5 to 17 Years | 0 (0.0%) | 0 (0.0%) |
| 18 to 34 Years | 0 (0.0%) | 0 (0.0%) |
| 35 to 64 Years | 0 (0.0%) | 0 (0.0%) |
| 65 to 74 Years | 0 (0.0%) | 0 (0.0%) |
| 75 Years and over | 0 (0.0%) | 0 (0.0%) |
Technology Access in Red Jacket
Computing Device Access in Red Jacket
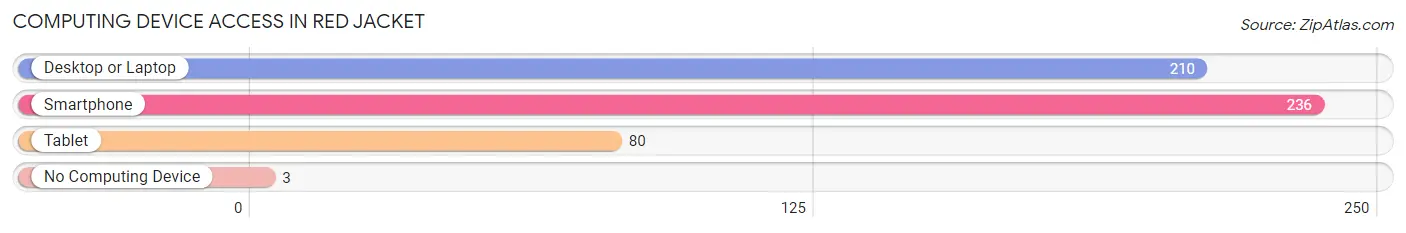
| Device Type | # Households | % Households |
| Desktop or Laptop | 210 | 81.4% |
| Smartphone | 236 | 91.5% |
| Tablet | 80 | 31.0% |
| No Computing Device | 3 | 1.2% |
| Total | 258 | 100.0% |
Internet Access in Red Jacket
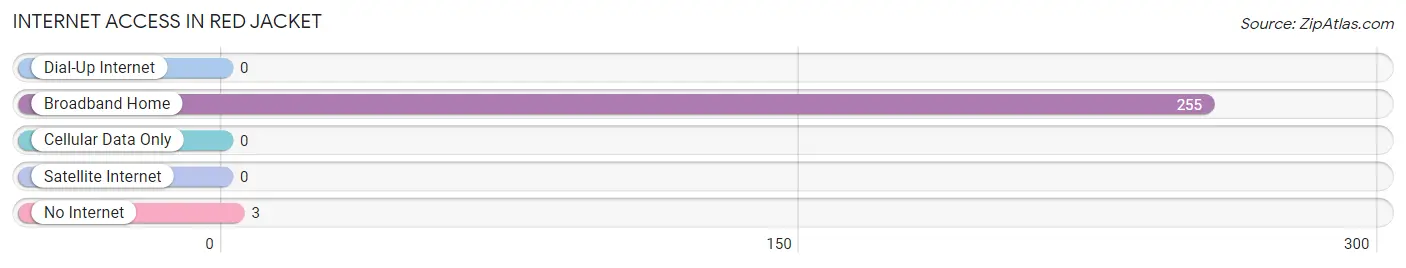
| Internet Type | # Households | % Households |
| Dial-Up Internet | 0 | 0.0% |
| Broadband Home | 255 | 98.8% |
| Cellular Data Only | 0 | 0.0% |
| Satellite Internet | 0 | 0.0% |
| No Internet | 3 | 1.2% |
| Total | 258 | 100.0% |
Red Jacket Summary
Introduction
Red Jacket, West Virginia is a small unincorporated community located in Mingo County, West Virginia. It is situated in the Appalachian Mountains and is part of the Hatfield-McCoy Trail System. Red Jacket is a rural community with a population of approximately 500 people. The town is known for its coal mining history and its strong sense of community.
History
Red Jacket was founded in the late 1800s by coal miners who were looking for work in the area. The town was named after a Native American chief who had lived in the area. The town was originally known as “Red Jacket Junction” because of its location at the junction of two railroads. The town was incorporated in 1891 and was home to several coal mines. The town was also home to a number of businesses, including a hotel, a general store, and a post office.
The town experienced a period of growth in the early 1900s, but the Great Depression caused the town to decline. The coal mines closed and many of the businesses shut down. The population of Red Jacket decreased significantly during this time.
In the 1950s, the town experienced a resurgence when the Hatfield-McCoy Trail System was established. The trail system brought in tourists and helped to revive the economy of the town. The town has since become a popular destination for outdoor recreation and is home to several businesses, including restaurants, lodging, and retail stores.
Geography
Red Jacket is located in the Appalachian Mountains in Mingo County, West Virginia. The town is situated at the junction of two railroads and is part of the Hatfield-McCoy Trail System. The town is surrounded by mountains and is located near the Tug Fork River. The town is located approximately 30 miles from the city of Williamson, West Virginia.
Economy
The economy of Red Jacket is largely based on tourism and outdoor recreation. The town is home to several businesses, including restaurants, lodging, and retail stores. The town is also home to several coal mines, which provide employment for many of the town’s residents.
Demographics
The population of Red Jacket is approximately 500 people. The town is predominantly white, with a small percentage of African American and Native American residents. The median household income in Red Jacket is $25,000, and the median age is 40 years old. The town has a high rate of poverty, with approximately 30% of the population living below the poverty line.
Conclusion
Red Jacket, West Virginia is a small unincorporated community located in Mingo County, West Virginia. The town is known for its coal mining history and its strong sense of community. The town is home to several businesses, including restaurants, lodging, and retail stores. The town is also home to several coal mines, which provide employment for many of the town’s residents. The population of Red Jacket is approximately 500 people, and the median household income is $25,000. Red Jacket is a rural community with a strong sense of community and a rich history.
Common Questions
What is Per Capita Income in Red Jacket?
Per Capita income in Red Jacket is $10,454.
What is Inequality or Gini Index in Red Jacket?
Inequality or Gini Index in Red Jacket is 0.61.
What is the Total Population of Red Jacket?
Total Population of Red Jacket is 512.
What is the Total Male Population of Red Jacket?
Total Male Population of Red Jacket is 162.
What is the Total Female Population of Red Jacket?
Total Female Population of Red Jacket is 350.
What is the Ratio of Males per 100 Females in Red Jacket?
There are 46.29 Males per 100 Females in Red Jacket.
What is the Ratio of Females per 100 Males in Red Jacket?
There are 216.05 Females per 100 Males in Red Jacket.
What is the Median Population Age in Red Jacket?
Median Population Age in Red Jacket is 45.5 Years.
What is the Average Family Size in Red Jacket
Average Family Size in Red Jacket is 3.3 People.
What is the Average Household Size in Red Jacket
Average Household Size in Red Jacket is 2.0 People.
How Large is the Labor Force in Red Jacket?
There are 110 People in the Labor Forcein in Red Jacket.
What is the Percentage of People in the Labor Force in Red Jacket?
29.3% of People are in the Labor Force in Red Jacket.
What is the Unemployment Rate in Red Jacket?
Unemployment Rate in Red Jacket is 15.5%.