Flat Lick, KY Map & Demographics
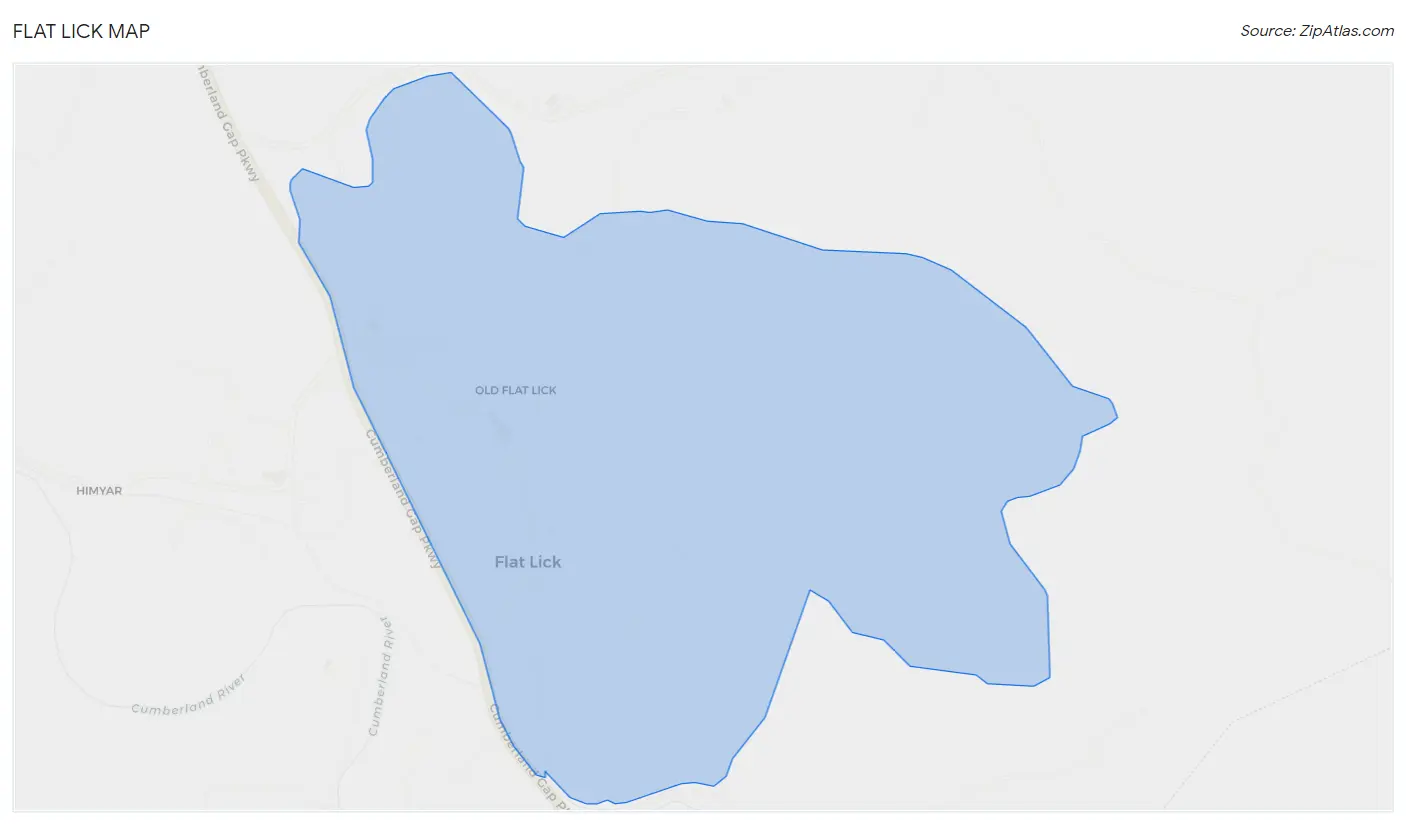
Flat Lick Map
Flat Lick Overview
$6,485
PER CAPITA INCOME
$16,990
AVG FAMILY INCOME
$16,327
AVG HOUSEHOLD INCOME
0.39
INEQUALITY / GINI INDEX
883
TOTAL POPULATION
469
MALE POPULATION
414
FEMALE POPULATION
113.29
MALES / 100 FEMALES
88.27
FEMALES / 100 MALES
33.8
MEDIAN AGE
3.4
AVG FAMILY SIZE
3.2
AVG HOUSEHOLD SIZE
164
LABOR FORCE [ PEOPLE ]
26.5%
PERCENT IN LABOR FORCE
16.5%
UNEMPLOYMENT RATE
Flat Lick Zip Codes
Flat Lick Area Codes
Income in Flat Lick
Income Overview in Flat Lick
Per Capita Income in Flat Lick is $6,485, while median incomes of families and households are $16,990 and $16,327 respectively.
| Characteristic | Number | Measure |
| Per Capita Income | 883 | $6,485 |
| Median Family Income | 250 | $16,990 |
| Mean Family Income | 250 | $22,467 |
| Median Household Income | 276 | $16,327 |
| Mean Household Income | 276 | $21,657 |
| Income Deficit | 250 | $0 |
| Wage / Income Gap (%) | 883 | 0.00% |
| Wage / Income Gap ($) | 883 | 100.00¢ per $1 |
| Gini / Inequality Index | 883 | 0.39 |
Earnings by Sex in Flat Lick
| Sex | Number | Average Earnings |
| Male | 98 (71.5%) | $0 |
| Female | 39 (28.5%) | $0 |
| Total | 137 (100.0%) | $0 |
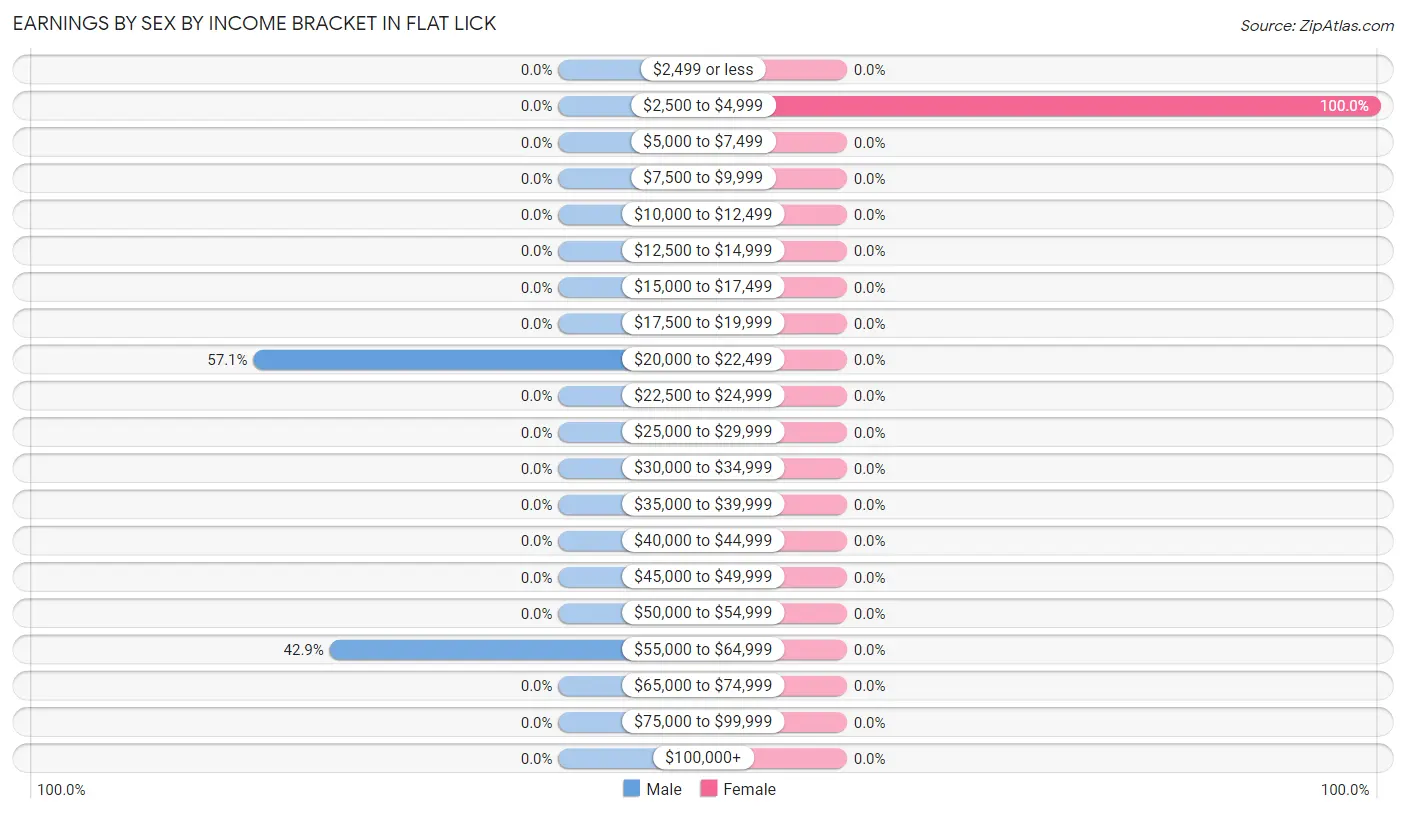
Earnings by Sex by Income Bracket in Flat Lick
The most common earnings brackets in Flat Lick are $20,000 to $22,499 for men (56 | 57.1%) and $2,500 to $4,999 for women (39 | 100.0%).
| Income | Male | Female |
| $2,499 or less | 0 (0.0%) | 0 (0.0%) |
| $2,500 to $4,999 | 0 (0.0%) | 39 (100.0%) |
| $5,000 to $7,499 | 0 (0.0%) | 0 (0.0%) |
| $7,500 to $9,999 | 0 (0.0%) | 0 (0.0%) |
| $10,000 to $12,499 | 0 (0.0%) | 0 (0.0%) |
| $12,500 to $14,999 | 0 (0.0%) | 0 (0.0%) |
| $15,000 to $17,499 | 0 (0.0%) | 0 (0.0%) |
| $17,500 to $19,999 | 0 (0.0%) | 0 (0.0%) |
| $20,000 to $22,499 | 56 (57.1%) | 0 (0.0%) |
| $22,500 to $24,999 | 0 (0.0%) | 0 (0.0%) |
| $25,000 to $29,999 | 0 (0.0%) | 0 (0.0%) |
| $30,000 to $34,999 | 0 (0.0%) | 0 (0.0%) |
| $35,000 to $39,999 | 0 (0.0%) | 0 (0.0%) |
| $40,000 to $44,999 | 0 (0.0%) | 0 (0.0%) |
| $45,000 to $49,999 | 0 (0.0%) | 0 (0.0%) |
| $50,000 to $54,999 | 0 (0.0%) | 0 (0.0%) |
| $55,000 to $64,999 | 42 (42.9%) | 0 (0.0%) |
| $65,000 to $74,999 | 0 (0.0%) | 0 (0.0%) |
| $75,000 to $99,999 | 0 (0.0%) | 0 (0.0%) |
| $100,000+ | 0 (0.0%) | 0 (0.0%) |
| Total | 98 (100.0%) | 39 (100.0%) |
Earnings by Sex by Educational Attainment in Flat Lick
| Educational Attainment | Male Income | Female Income |
| Less than High School | - | - |
| High School Diploma | - | - |
| College or Associate's Degree | - | - |
| Bachelor's Degree | - | - |
| Graduate Degree | - | - |
| Total | - | - |
Family Income in Flat Lick
Family Income Brackets in Flat Lick
According to the Flat Lick family income data, there are 116 families falling into the $15,000 to $24,999 income range, which is the most common income bracket and makes up 46.4% of all families.
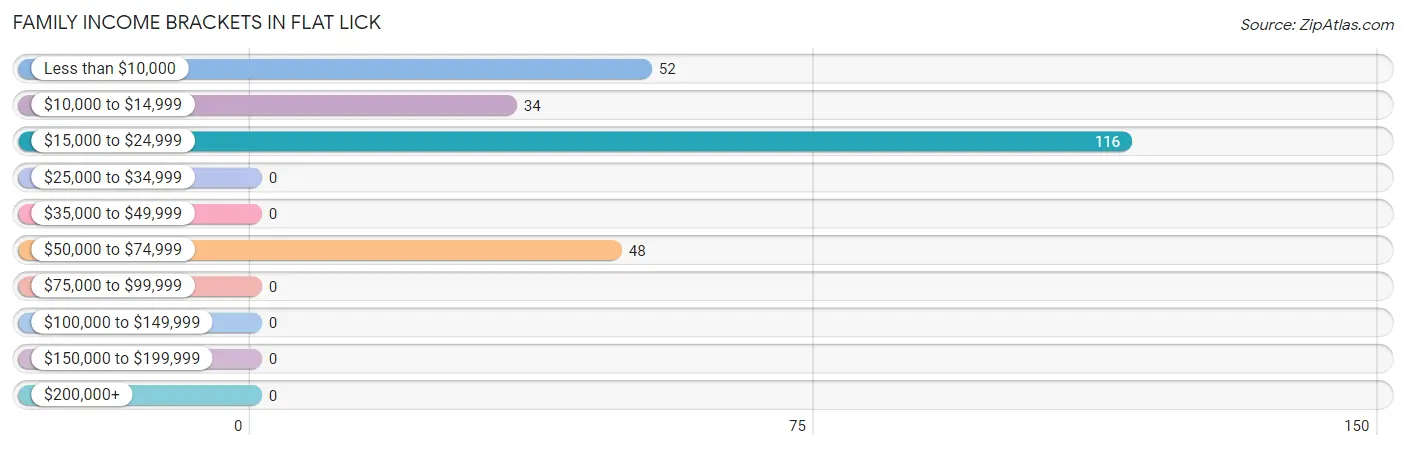
| Income Bracket | # Families | % Families |
| Less than $10,000 | 52 | 20.8% |
| $10,000 to $14,999 | 34 | 13.6% |
| $15,000 to $24,999 | 116 | 46.4% |
| $25,000 to $34,999 | 0 | 0.0% |
| $35,000 to $49,999 | 0 | 0.0% |
| $50,000 to $74,999 | 48 | 19.2% |
| $75,000 to $99,999 | 0 | 0.0% |
| $100,000 to $149,999 | 0 | 0.0% |
| $150,000 to $199,999 | 0 | 0.0% |
| $200,000+ | 0 | 0.0% |
Family Income by Famaliy Size in Flat Lick
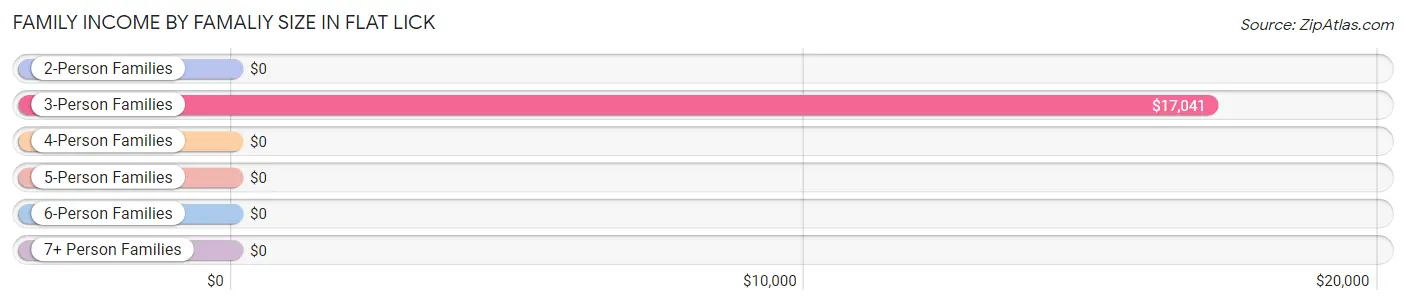
3-person families (130 | 52.0%) account for the highest median family income in Flat Lick with $17,041 per family, while 3-person families (130 | 52.0%) have the highest median income of $5,680 per family member.
| Income Bracket | # Families | Median Income |
| 2-Person Families | 61 (24.4%) | $0 |
| 3-Person Families | 130 (52.0%) | $17,041 |
| 4-Person Families | 0 (0.0%) | $0 |
| 5-Person Families | 59 (23.6%) | $0 |
| 6-Person Families | 0 (0.0%) | $0 |
| 7+ Person Families | 0 (0.0%) | $0 |
| Total | 250 (100.0%) | $16,990 |
Family Income by Number of Earners in Flat Lick
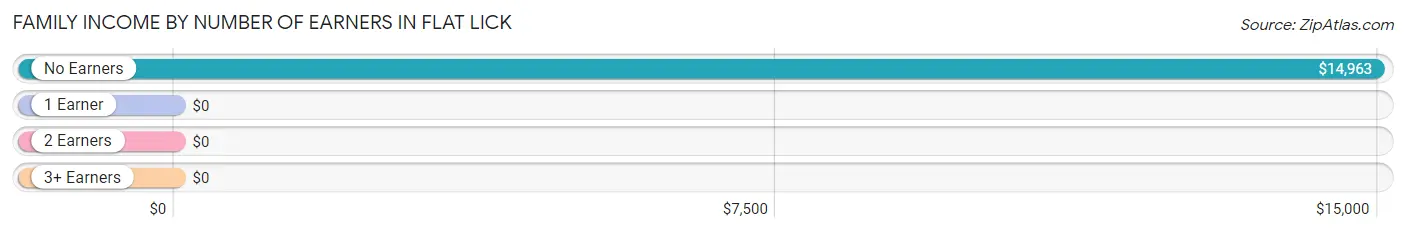
| Number of Earners | # Families | Median Income |
| No Earners | 121 (48.4%) | $14,963 |
| 1 Earner | 129 (51.6%) | $0 |
| 2 Earners | 0 (0.0%) | $0 |
| 3+ Earners | 0 (0.0%) | $0 |
| Total | 250 (100.0%) | $16,990 |
Household Income in Flat Lick
Household Income Brackets in Flat Lick
With 116 households falling in the category, the $15,000 to $24,999 income range is the most frequent in Flat Lick, accounting for 42.0% of all households.
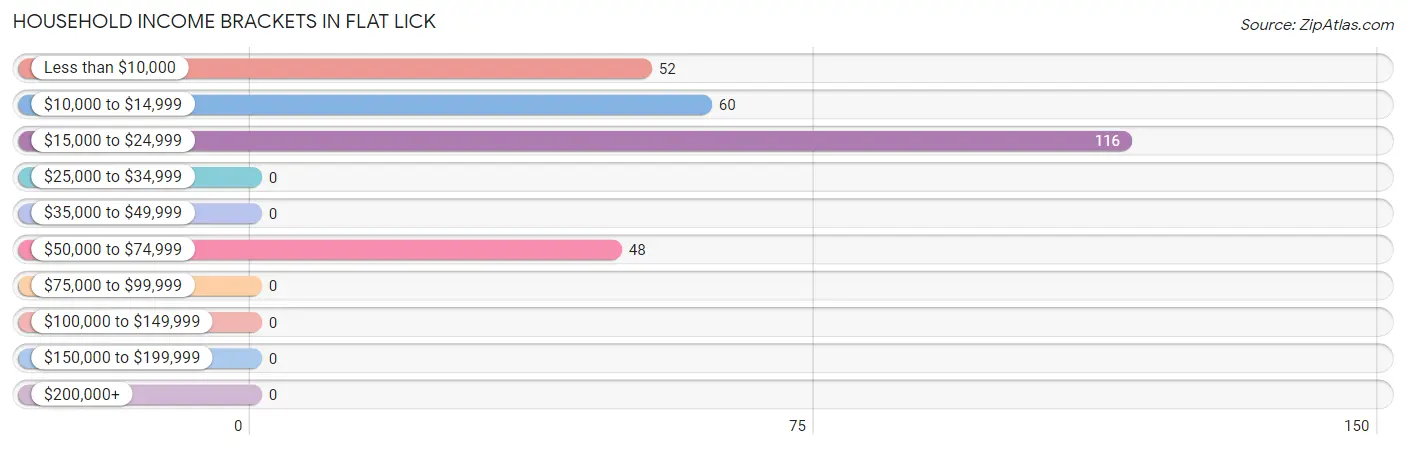
| Income Bracket | # Households | % Households |
| Less than $10,000 | 52 | 18.8% |
| $10,000 to $14,999 | 60 | 21.7% |
| $15,000 to $24,999 | 116 | 42.0% |
| $25,000 to $34,999 | 0 | 0.0% |
| $35,000 to $49,999 | 0 | 0.0% |
| $50,000 to $74,999 | 48 | 17.4% |
| $75,000 to $99,999 | 0 | 0.0% |
| $100,000 to $149,999 | 0 | 0.0% |
| $150,000 to $199,999 | 0 | 0.0% |
| $200,000+ | 0 | 0.0% |
Household Income by Householder Age in Flat Lick
The median household income in Flat Lick is $16,327, with the highest median household income of $15,026 found in the 45 to 64 years age bracket for the primary householder. A total of 119 households (43.1%) fall into this category.
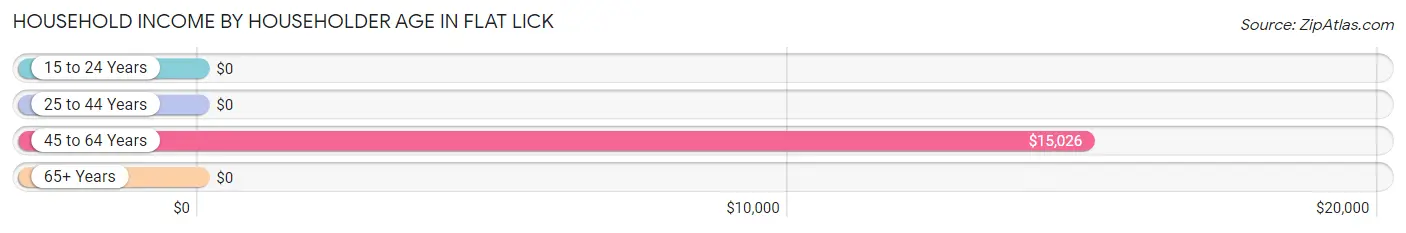
| Income Bracket | # Households | Median Income |
| 15 to 24 Years | 0 (0.0%) | $0 |
| 25 to 44 Years | 131 (47.5%) | $0 |
| 45 to 64 Years | 119 (43.1%) | $15,026 |
| 65+ Years | 26 (9.4%) | $0 |
| Total | 276 (100.0%) | $16,327 |
Poverty in Flat Lick
Income Below Poverty by Sex and Age in Flat Lick
With 71.6% poverty level for males and 75.8% for females among the residents of Flat Lick, 5 year old males and under 5 year old females are the most vulnerable to poverty, with 8 males (100.0%) and 62 females (100.0%) in their respective age groups living below the poverty level.
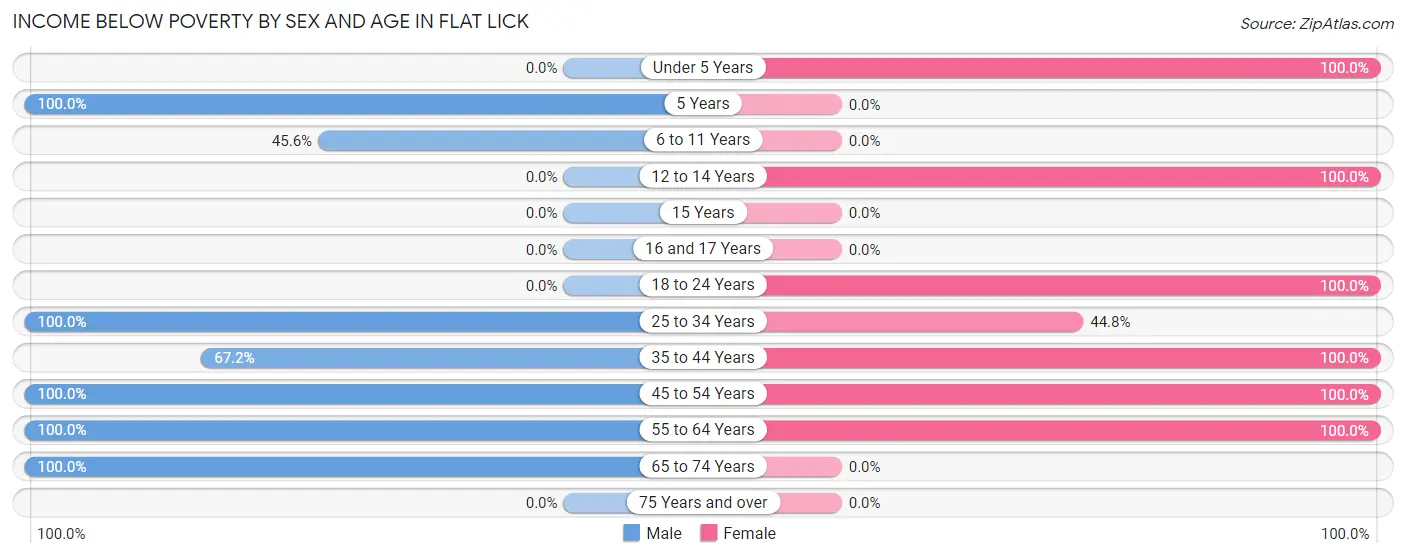
| Age Bracket | Male | Female |
| Under 5 Years | 0 (0.0%) | 62 (100.0%) |
| 5 Years | 8 (100.0%) | 0 (0.0%) |
| 6 to 11 Years | 41 (45.6%) | 0 (0.0%) |
| 12 to 14 Years | 0 (0.0%) | 9 (100.0%) |
| 15 Years | 0 (0.0%) | 0 (0.0%) |
| 16 and 17 Years | 0 (0.0%) | 0 (0.0%) |
| 18 to 24 Years | 0 (0.0%) | 44 (100.0%) |
| 25 to 34 Years | 56 (100.0%) | 39 (44.8%) |
| 35 to 44 Years | 86 (67.2%) | 27 (100.0%) |
| 45 to 54 Years | 53 (100.0%) | 75 (100.0%) |
| 55 to 64 Years | 66 (100.0%) | 58 (100.0%) |
| 65 to 74 Years | 26 (100.0%) | 0 (0.0%) |
| 75 Years and over | 0 (0.0%) | 0 (0.0%) |
| Total | 336 (71.6%) | 314 (75.8%) |
Income Above Poverty by Sex and Age in Flat Lick
According to the poverty statistics in Flat Lick, males aged under 5 years and females aged 5 years are the age groups that are most secure financially, with 100.0% of males and 100.0% of females in these age groups living above the poverty line.
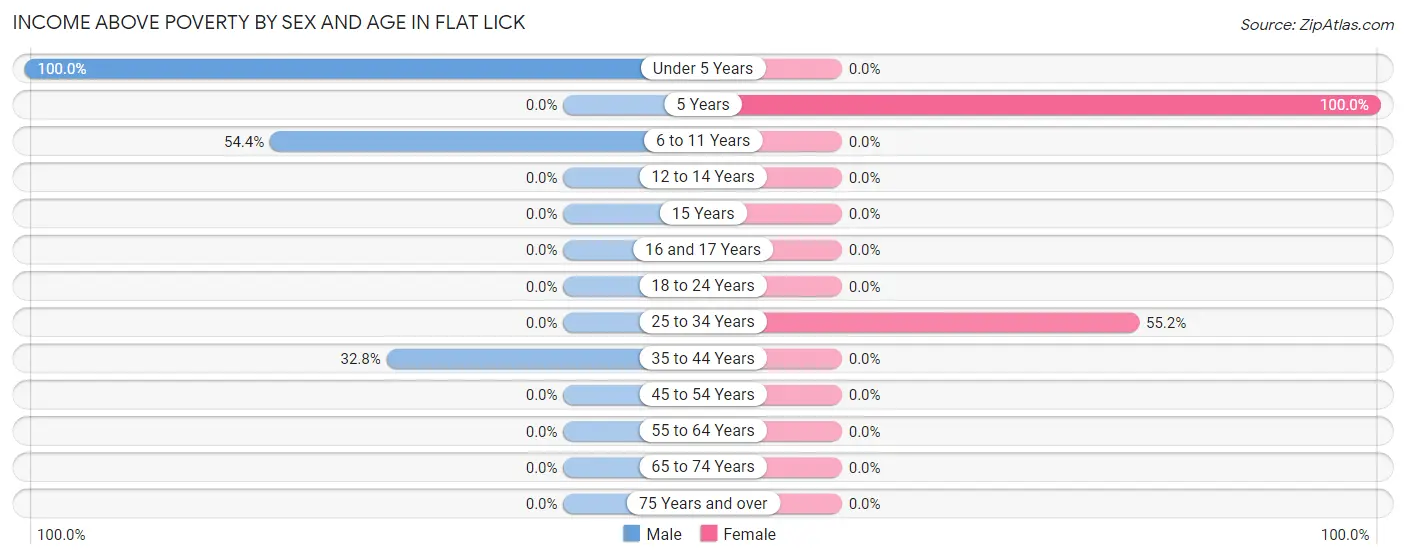
| Age Bracket | Male | Female |
| Under 5 Years | 42 (100.0%) | 0 (0.0%) |
| 5 Years | 0 (0.0%) | 52 (100.0%) |
| 6 to 11 Years | 49 (54.4%) | 0 (0.0%) |
| 12 to 14 Years | 0 (0.0%) | 0 (0.0%) |
| 15 Years | 0 (0.0%) | 0 (0.0%) |
| 16 and 17 Years | 0 (0.0%) | 0 (0.0%) |
| 18 to 24 Years | 0 (0.0%) | 0 (0.0%) |
| 25 to 34 Years | 0 (0.0%) | 48 (55.2%) |
| 35 to 44 Years | 42 (32.8%) | 0 (0.0%) |
| 45 to 54 Years | 0 (0.0%) | 0 (0.0%) |
| 55 to 64 Years | 0 (0.0%) | 0 (0.0%) |
| 65 to 74 Years | 0 (0.0%) | 0 (0.0%) |
| 75 Years and over | 0 (0.0%) | 0 (0.0%) |
| Total | 133 (28.4%) | 100 (24.1%) |
Income Below Poverty Among Married-Couple Families in Flat Lick
The poverty statistics for married-couple families in Flat Lick show that 78.5% or 175 of the total 223 families live below the poverty line. Families with no children have the highest poverty rate of 100.0%, comprising of 108 families. On the other hand, families with 3 or 4 children have the lowest poverty rate of 18.6%, which includes 11 families.
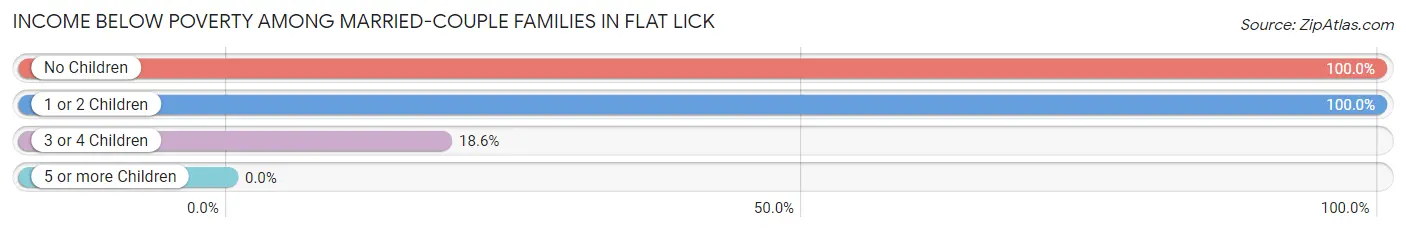
| Children | Above Poverty | Below Poverty |
| No Children | 0 (0.0%) | 108 (100.0%) |
| 1 or 2 Children | 0 (0.0%) | 56 (100.0%) |
| 3 or 4 Children | 48 (81.4%) | 11 (18.6%) |
| 5 or more Children | 0 (0.0%) | 0 (0.0%) |
| Total | 48 (21.5%) | 175 (78.5%) |
Income Below Poverty Among Single-Parent Households in Flat Lick
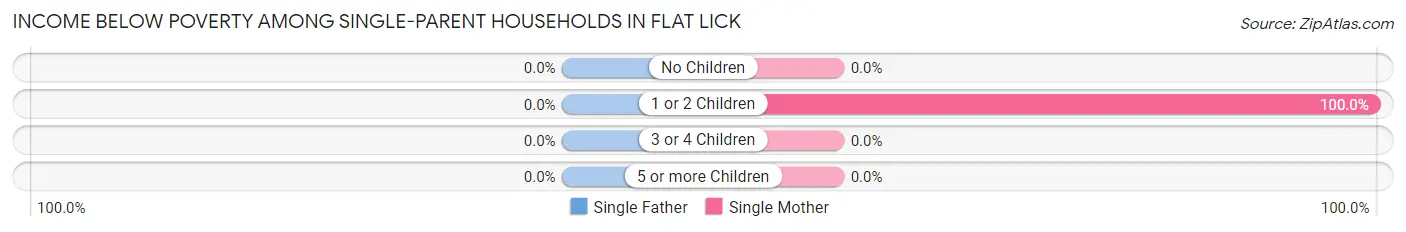
| Children | Single Father | Single Mother |
| No Children | 0 (0.0%) | 0 (0.0%) |
| 1 or 2 Children | 0 (0.0%) | 27 (100.0%) |
| 3 or 4 Children | 0 (0.0%) | 0 (0.0%) |
| 5 or more Children | 0 (0.0%) | 0 (0.0%) |
| Total | 0 (0.0%) | 27 (100.0%) |
Income Below Poverty Among Married-Couple vs Single-Parent Households in Flat Lick
The poverty data for Flat Lick shows that 175 of the married-couple family households (78.5%) and 27 of the single-parent households (100.0%) are living below the poverty level. Within the married-couple family households, those with no children have the highest poverty rate, with 108 households (100.0%) falling below the poverty line. Among the single-parent households, those with 1 or 2 children have the highest poverty rate, with 27 household (100.0%) living below poverty.
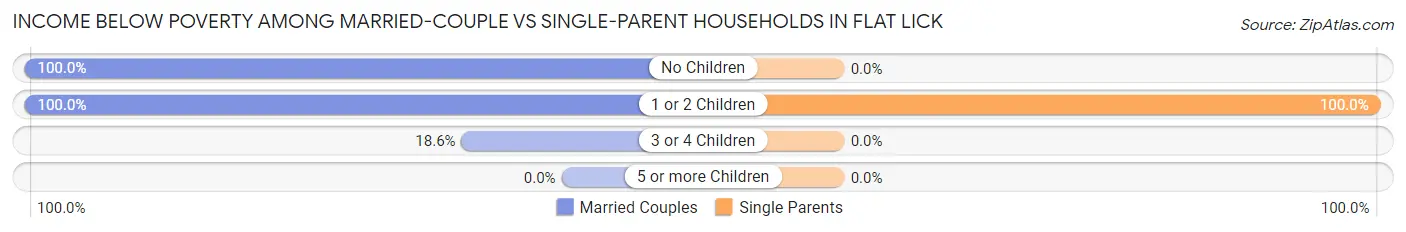
| Children | Married-Couple Families | Single-Parent Households |
| No Children | 108 (100.0%) | 0 (0.0%) |
| 1 or 2 Children | 56 (100.0%) | 27 (100.0%) |
| 3 or 4 Children | 11 (18.6%) | 0 (0.0%) |
| 5 or more Children | 0 (0.0%) | 0 (0.0%) |
| Total | 175 (78.5%) | 27 (100.0%) |
Race in Flat Lick
The most populous races in Flat Lick are , and White / Caucasian (883 | 100.0%).
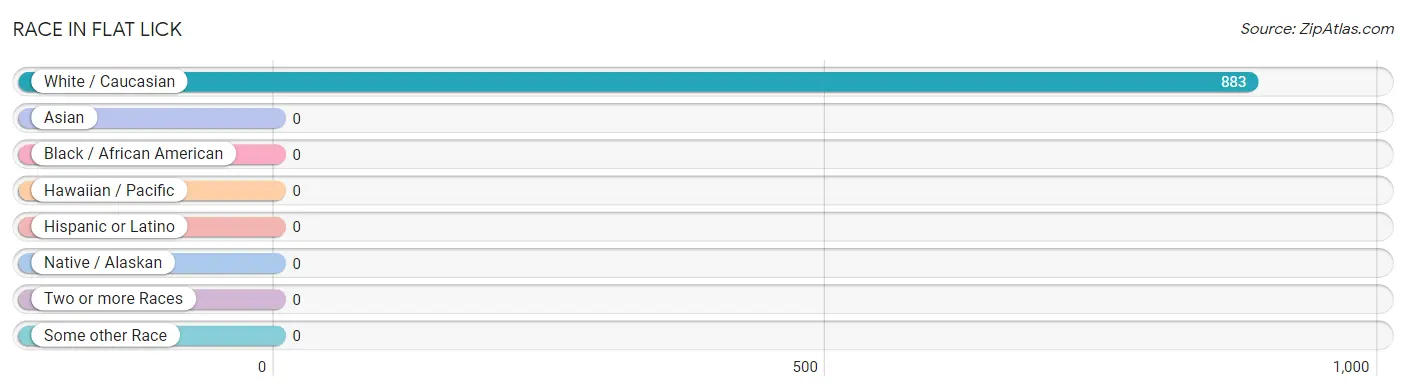
| Race | # Population | % Population |
| Asian | 0 | 0.0% |
| Black / African American | 0 | 0.0% |
| Hawaiian / Pacific | 0 | 0.0% |
| Hispanic or Latino | 0 | 0.0% |
| Native / Alaskan | 0 | 0.0% |
| White / Caucasian | 883 | 100.0% |
| Two or more Races | 0 | 0.0% |
| Some other Race | 0 | 0.0% |
| Total | 883 | 100.0% |
Ancestry in Flat Lick

| Ancestry | # Population | % Population | View All 0 Rows |
Immigrants in Flat Lick

| Immigration Origin | # Population | % Population | View All 0 Rows |
Sex and Age in Flat Lick
Sex and Age in Flat Lick
The most populous age groups in Flat Lick are 35 to 39 Years (128 | 27.3%) for men and Under 5 Years (62 | 15.0%) for women.
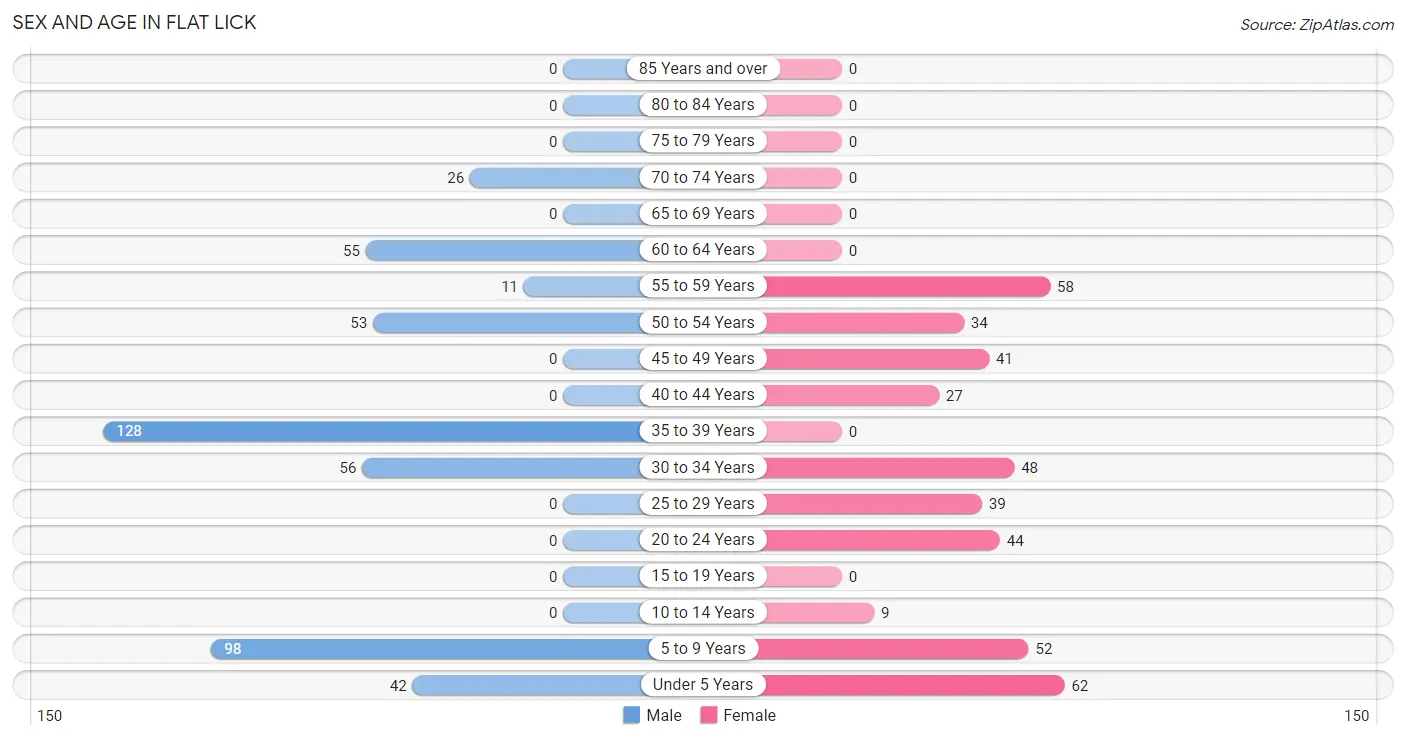
| Age Bracket | Male | Female |
| Under 5 Years | 42 (9.0%) | 62 (15.0%) |
| 5 to 9 Years | 98 (20.9%) | 52 (12.6%) |
| 10 to 14 Years | 0 (0.0%) | 9 (2.2%) |
| 15 to 19 Years | 0 (0.0%) | 0 (0.0%) |
| 20 to 24 Years | 0 (0.0%) | 44 (10.6%) |
| 25 to 29 Years | 0 (0.0%) | 39 (9.4%) |
| 30 to 34 Years | 56 (11.9%) | 48 (11.6%) |
| 35 to 39 Years | 128 (27.3%) | 0 (0.0%) |
| 40 to 44 Years | 0 (0.0%) | 27 (6.5%) |
| 45 to 49 Years | 0 (0.0%) | 41 (9.9%) |
| 50 to 54 Years | 53 (11.3%) | 34 (8.2%) |
| 55 to 59 Years | 11 (2.4%) | 58 (14.0%) |
| 60 to 64 Years | 55 (11.7%) | 0 (0.0%) |
| 65 to 69 Years | 0 (0.0%) | 0 (0.0%) |
| 70 to 74 Years | 26 (5.5%) | 0 (0.0%) |
| 75 to 79 Years | 0 (0.0%) | 0 (0.0%) |
| 80 to 84 Years | 0 (0.0%) | 0 (0.0%) |
| 85 Years and over | 0 (0.0%) | 0 (0.0%) |
| Total | 469 (100.0%) | 414 (100.0%) |
Families and Households in Flat Lick
Median Family Size in Flat Lick
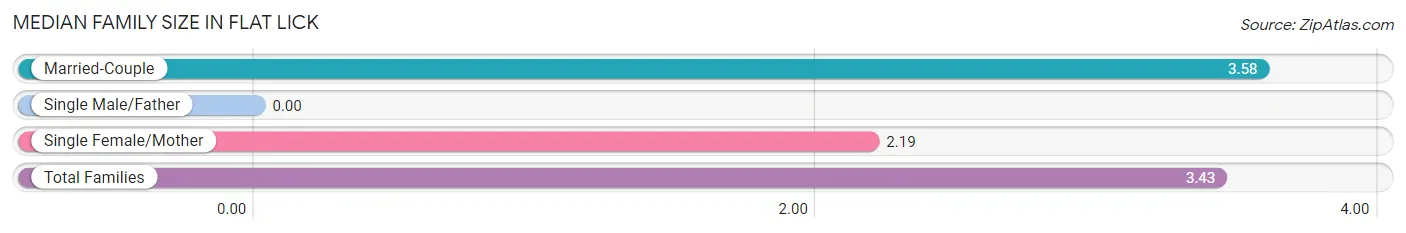
| Family Type | # Families | Family Size |
| Married-Couple | 223 (89.2%) | 3.58 |
| Single Male/Father | 0 (0.0%) | - |
| Single Female/Mother | 27 (10.8%) | 2.19 |
| Total Families | 250 (100.0%) | 3.43 |
Median Household Size in Flat Lick
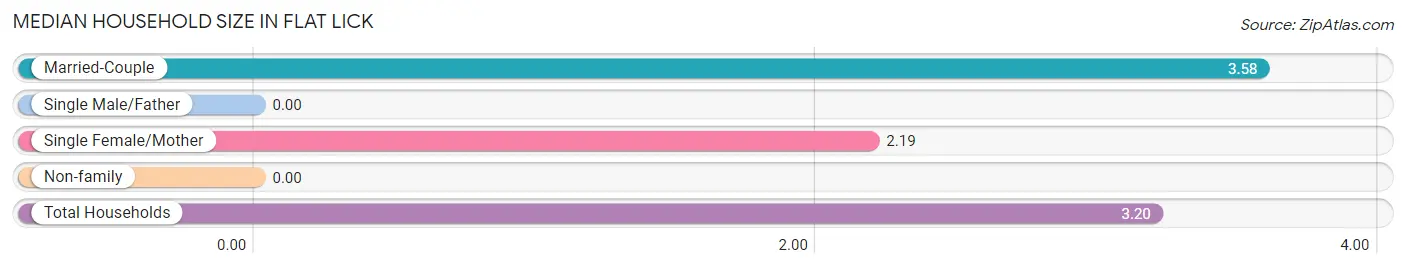
| Household Type | # Households | Household Size |
| Married-Couple | 223 (80.8%) | 3.58 |
| Single Male/Father | 0 (0.0%) | - |
| Single Female/Mother | 27 (9.8%) | 2.19 |
| Non-family | 26 (9.4%) | - |
| Total Households | 276 (100.0%) | 3.20 |
Household Size by Marriage Status in Flat Lick
Out of a total of 276 households in Flat Lick, 250 (90.6%) are family households, while 26 (9.4%) are nonfamily households. The most numerous type of family households are 3-person households, comprising 130, and the most common type of nonfamily households are 1-person households, comprising 26.
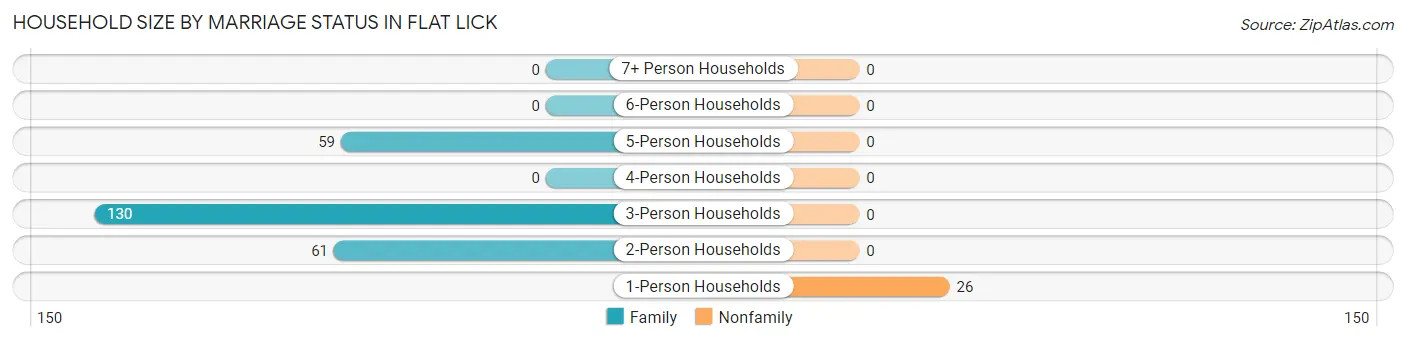
| Household Size | Family Households | Nonfamily Households |
| 1-Person Households | - | 26 (9.4%) |
| 2-Person Households | 61 (22.1%) | 0 (0.0%) |
| 3-Person Households | 130 (47.1%) | 0 (0.0%) |
| 4-Person Households | 0 (0.0%) | 0 (0.0%) |
| 5-Person Households | 59 (21.4%) | 0 (0.0%) |
| 6-Person Households | 0 (0.0%) | 0 (0.0%) |
| 7+ Person Households | 0 (0.0%) | 0 (0.0%) |
| Total | 250 (90.6%) | 26 (9.4%) |
Female Fertility in Flat Lick
Fertility by Age in Flat Lick
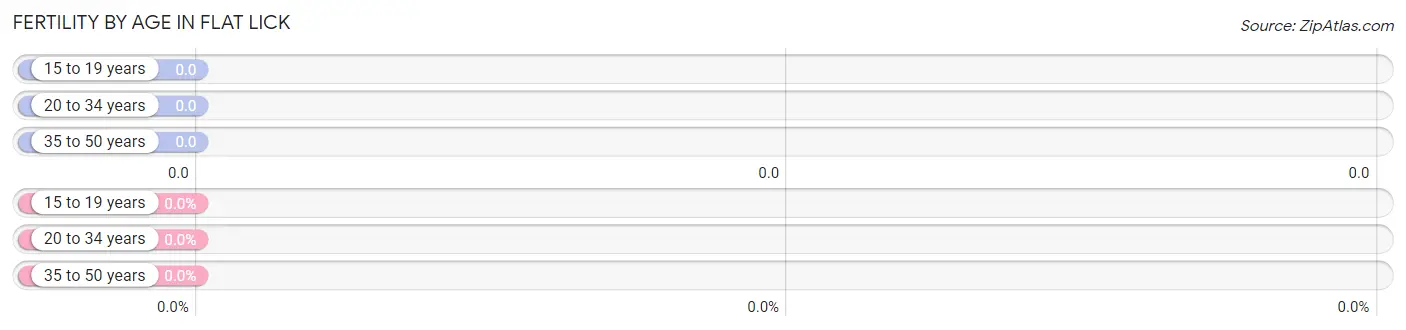
| Age Bracket | Women with Births | Births / 1,000 Women |
| 15 to 19 years | 0 (0.0%) | 0.0 |
| 20 to 34 years | 0 (0.0%) | 0.0 |
| 35 to 50 years | 0 (0.0%) | 0.0 |
| Total | 0 (0.0%) | 0.0 |
Fertility by Age by Marriage Status in Flat Lick
| Age Bracket | Married | Unmarried |
| 15 to 19 years | 0 (0.0%) | 0 (0.0%) |
| 20 to 34 years | 0 (0.0%) | 0 (0.0%) |
| 35 to 50 years | 0 (0.0%) | 0 (0.0%) |
| Total | 0 (0.0%) | 0 (0.0%) |
Fertility by Education in Flat Lick
| Educational Attainment | Women with Births | Births / 1,000 Women |
| Less than High School | 0 (0.0%) | 0.0 |
| High School Diploma | 0 (0.0%) | 0.0 |
| College or Associate's Degree | 0 (0.0%) | 0.0 |
| Bachelor's Degree | 0 (0.0%) | 0.0 |
| Graduate Degree | 0 (0.0%) | 0.0 |
| Total | 0 (0.0%) | 0.0 |
Fertility by Education by Marriage Status in Flat Lick
| Educational Attainment | Married | Unmarried |
| Less than High School | 0 (0.0%) | 0 (0.0%) |
| High School Diploma | 0 (0.0%) | 0 (0.0%) |
| College or Associate's Degree | 0 (0.0%) | 0 (0.0%) |
| Bachelor's Degree | 0 (0.0%) | 0 (0.0%) |
| Graduate Degree | 0 (0.0%) | 0 (0.0%) |
| Total | 0 (0.0%) | 0 (0.0%) |
Employment Characteristics in Flat Lick
Employment by Class of Employer in Flat Lick
Among the 137 employed individuals in Flat Lick, private company employees (98 | 71.5%), and federal government employees (39 | 28.5%) make up the most common classes of employment.
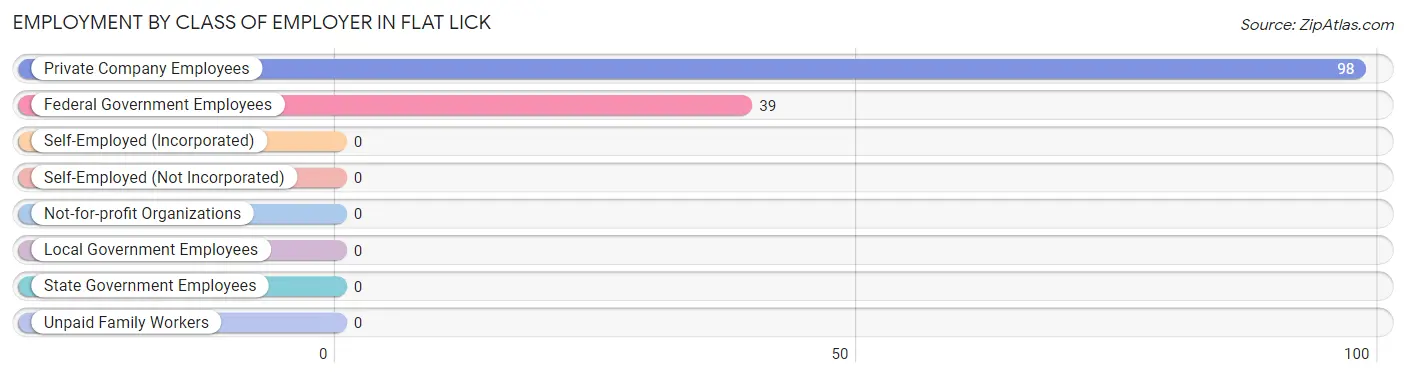
| Employer Class | # Employees | % Employees |
| Private Company Employees | 98 | 71.5% |
| Self-Employed (Incorporated) | 0 | 0.0% |
| Self-Employed (Not Incorporated) | 0 | 0.0% |
| Not-for-profit Organizations | 0 | 0.0% |
| Local Government Employees | 0 | 0.0% |
| State Government Employees | 0 | 0.0% |
| Federal Government Employees | 39 | 28.5% |
| Unpaid Family Workers | 0 | 0.0% |
| Total | 137 | 100.0% |
Employment Status by Age in Flat Lick
According to the labor force statistics for Flat Lick, out of the total population over 16 years of age (620), 26.5% or 164 individuals are in the labor force, with 16.5% or 27 of them unemployed. The age group with the highest labor force participation rate is 25 to 29 years, with 100.0% or 39 individuals in the labor force. Within the labor force, the 35 to 44 years age range has the highest percentage of unemployed individuals, with 39.1% or 27 of them being unemployed.
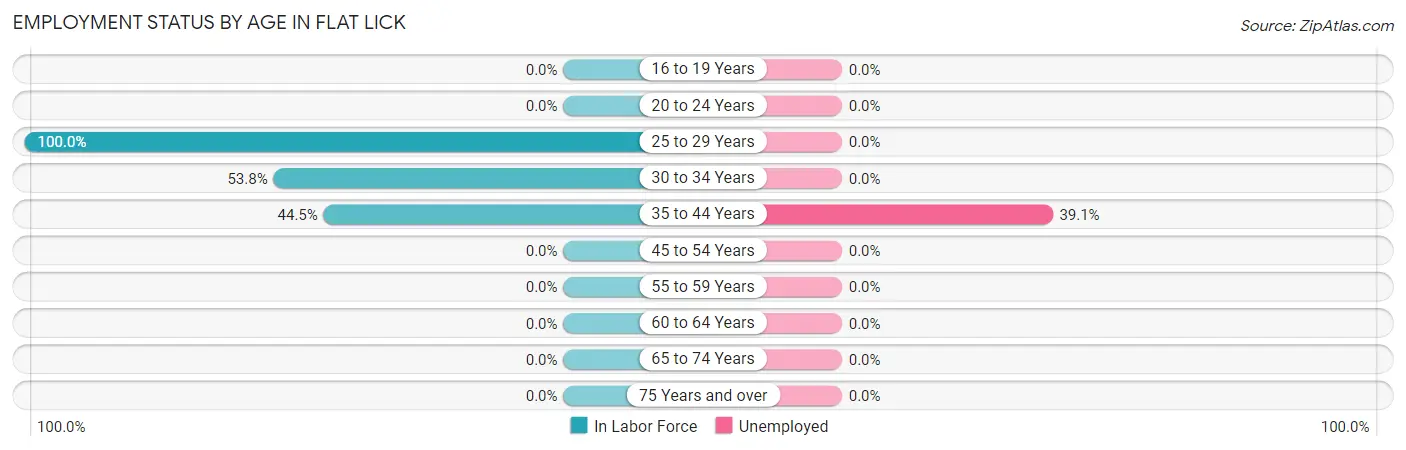
| Age Bracket | In Labor Force | Unemployed |
| 16 to 19 Years | 0 (0.0%) | 0 (0.0%) |
| 20 to 24 Years | 0 (0.0%) | 0 (0.0%) |
| 25 to 29 Years | 39 (100.0%) | 0 (0.0%) |
| 30 to 34 Years | 56 (53.8%) | 0 (0.0%) |
| 35 to 44 Years | 69 (44.5%) | 27 (39.1%) |
| 45 to 54 Years | 0 (0.0%) | 0 (0.0%) |
| 55 to 59 Years | 0 (0.0%) | 0 (0.0%) |
| 60 to 64 Years | 0 (0.0%) | 0 (0.0%) |
| 65 to 74 Years | 0 (0.0%) | 0 (0.0%) |
| 75 Years and over | 0 (0.0%) | 0 (0.0%) |
| Total | 164 (26.5%) | 27 (16.5%) |
Employment Status by Educational Attainment in Flat Lick
According to labor force statistics for Flat Lick, 29.8% of individuals (164) out of the total population between 25 and 64 years of age (550) are in the labor force, with 16.5% or 27 of them being unemployed. The group with the highest labor force participation rate are those with the educational attainment of high school diploma, with 64.3% or 81 individuals in the labor force. Within the labor force, individuals with less than high school education have the highest percentage of unemployment, with 32.5% or 27 of them being unemployed.
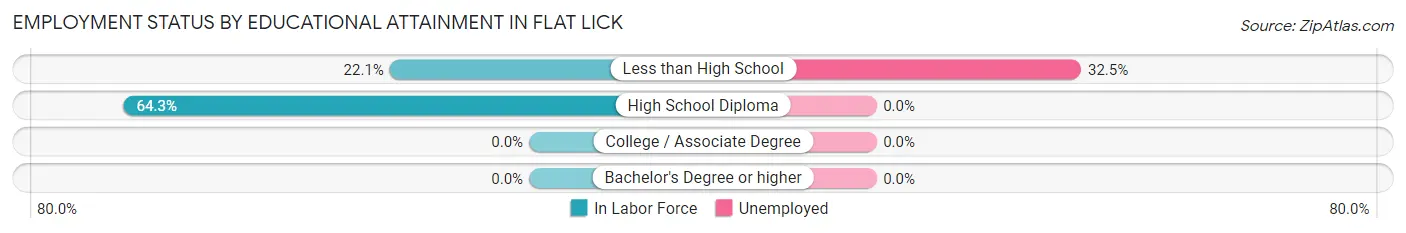
| Educational Attainment | In Labor Force | Unemployed |
| Less than High School | 83 (22.1%) | 122 (32.5%) |
| High School Diploma | 81 (64.3%) | 0 (0.0%) |
| College / Associate Degree | 0 (0.0%) | 0 (0.0%) |
| Bachelor's Degree or higher | 0 (0.0%) | 0 (0.0%) |
| Total | 164 (29.8%) | 91 (16.5%) |
Employment Occupations by Sex in Flat Lick
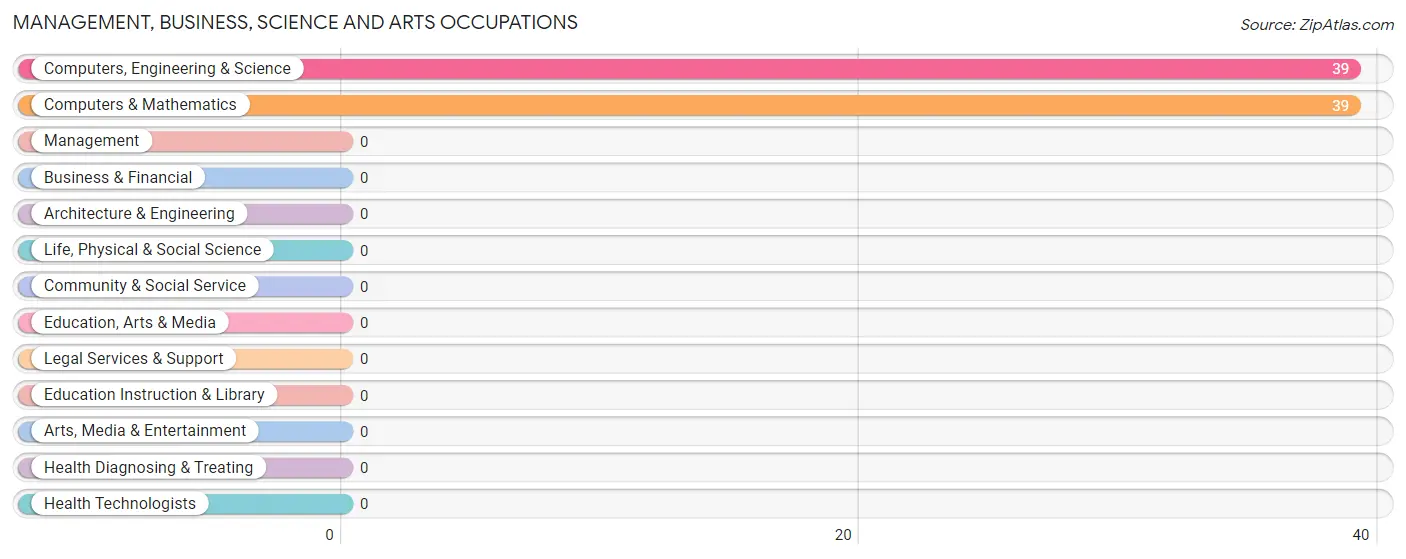
Management, Business, Science and Arts Occupations
The most common Management, Business, Science and Arts occupations in Flat Lick are Computers, Engineering & Science (39 | 28.5%), and Computers & Mathematics (39 | 28.5%).
Management, Business, Science and Arts Occupations by Sex
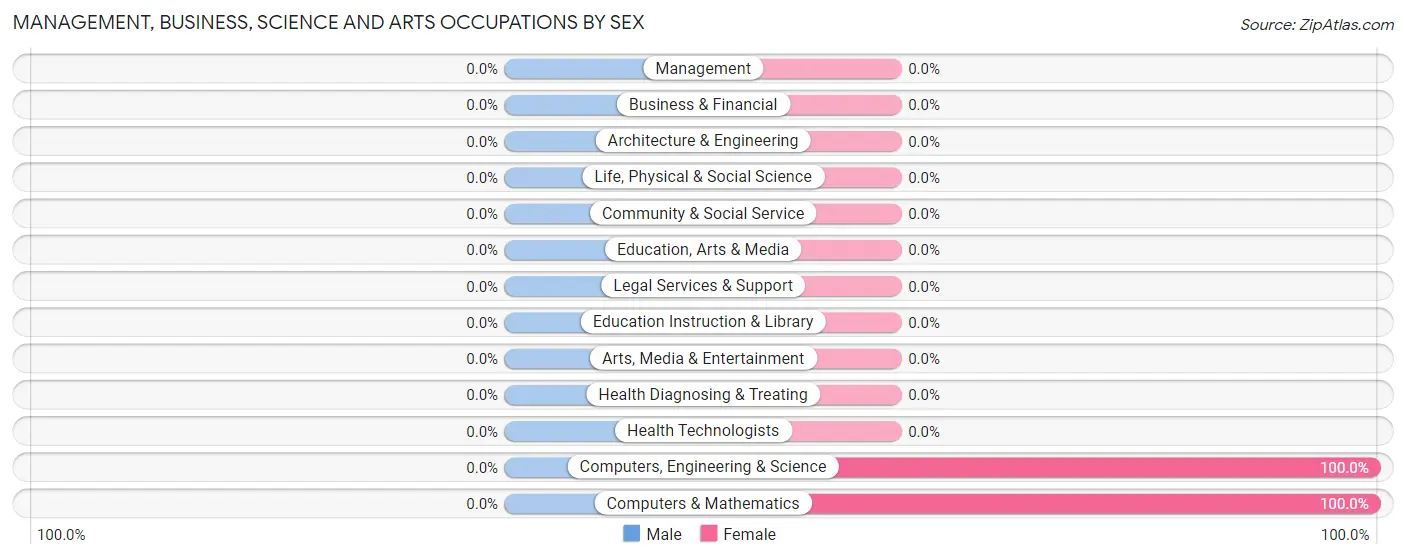
| Occupation | Male | Female |
| Management | 0 (0.0%) | 0 (0.0%) |
| Business & Financial | 0 (0.0%) | 0 (0.0%) |
| Computers, Engineering & Science | 0 (0.0%) | 39 (100.0%) |
| Computers & Mathematics | 0 (0.0%) | 39 (100.0%) |
| Architecture & Engineering | 0 (0.0%) | 0 (0.0%) |
| Life, Physical & Social Science | 0 (0.0%) | 0 (0.0%) |
| Community & Social Service | 0 (0.0%) | 0 (0.0%) |
| Education, Arts & Media | 0 (0.0%) | 0 (0.0%) |
| Legal Services & Support | 0 (0.0%) | 0 (0.0%) |
| Education Instruction & Library | 0 (0.0%) | 0 (0.0%) |
| Arts, Media & Entertainment | 0 (0.0%) | 0 (0.0%) |
| Health Diagnosing & Treating | 0 (0.0%) | 0 (0.0%) |
| Health Technologists | 0 (0.0%) | 0 (0.0%) |
| Total (Category) | 0 (0.0%) | 39 (100.0%) |
| Total (Overall) | 98 (71.5%) | 39 (28.5%) |
Services Occupations
The most common Services occupations in Flat Lick are , and Healthcare Support (56 | 40.9%).
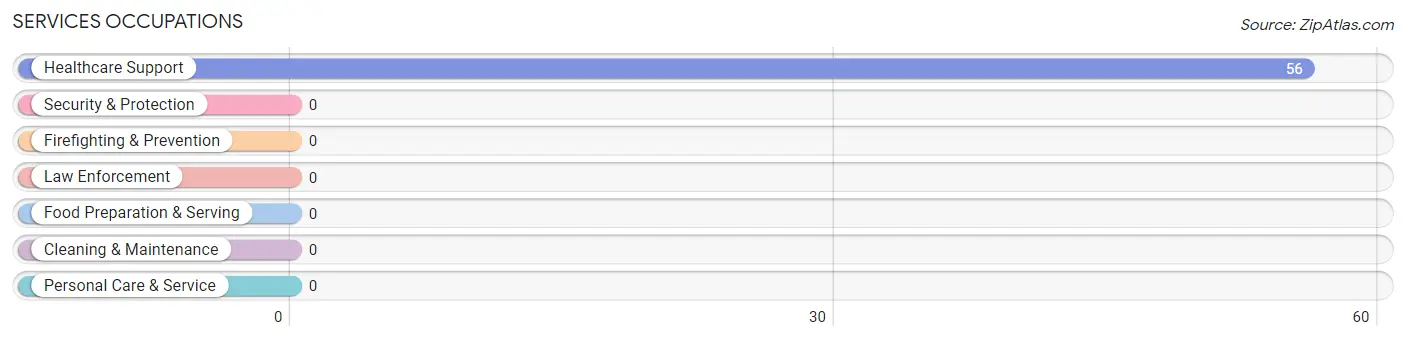
Services Occupations by Sex
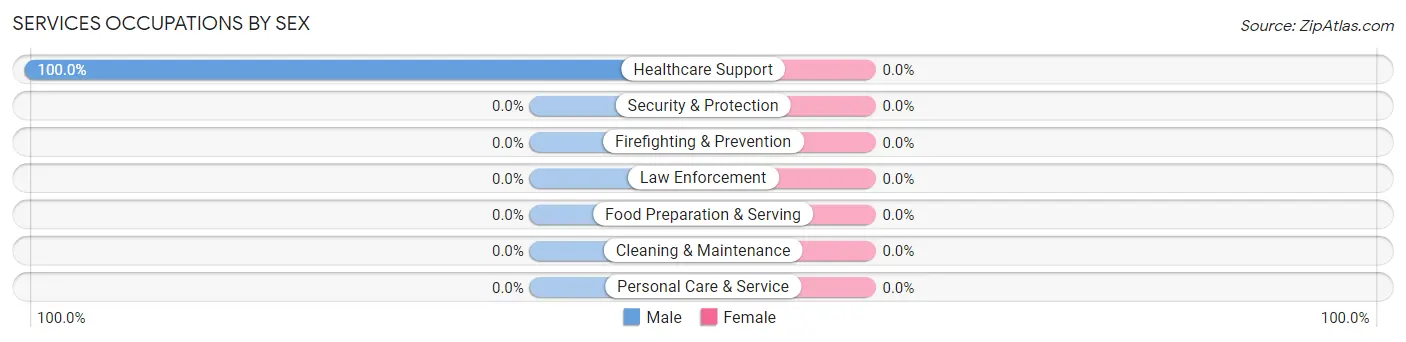
| Occupation | Male | Female |
| Healthcare Support | 56 (100.0%) | 0 (0.0%) |
| Security & Protection | 0 (0.0%) | 0 (0.0%) |
| Firefighting & Prevention | 0 (0.0%) | 0 (0.0%) |
| Law Enforcement | 0 (0.0%) | 0 (0.0%) |
| Food Preparation & Serving | 0 (0.0%) | 0 (0.0%) |
| Cleaning & Maintenance | 0 (0.0%) | 0 (0.0%) |
| Personal Care & Service | 0 (0.0%) | 0 (0.0%) |
| Total (Category) | 56 (100.0%) | 0 (0.0%) |
| Total (Overall) | 98 (71.5%) | 39 (28.5%) |
Sales and Office Occupations
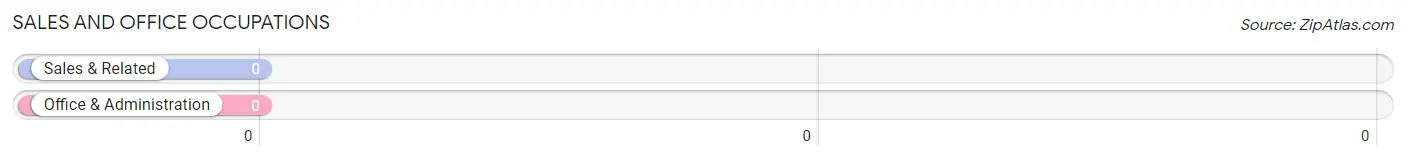
Sales and Office Occupations by Sex
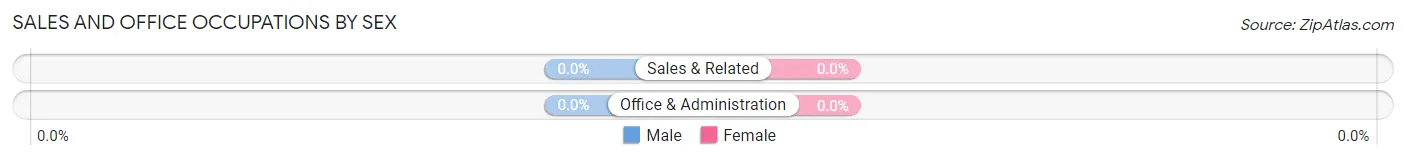
| Occupation | Male | Female |
| Sales & Related | 0 (0.0%) | 0 (0.0%) |
| Office & Administration | 0 (0.0%) | 0 (0.0%) |
| Total (Category) | 0 (0.0%) | 0 (0.0%) |
| Total (Overall) | 98 (71.5%) | 39 (28.5%) |
Natural Resources, Construction and Maintenance Occupations
The most common Natural Resources, Construction and Maintenance occupations in Flat Lick are , and Construction & Extraction (42 | 30.7%).
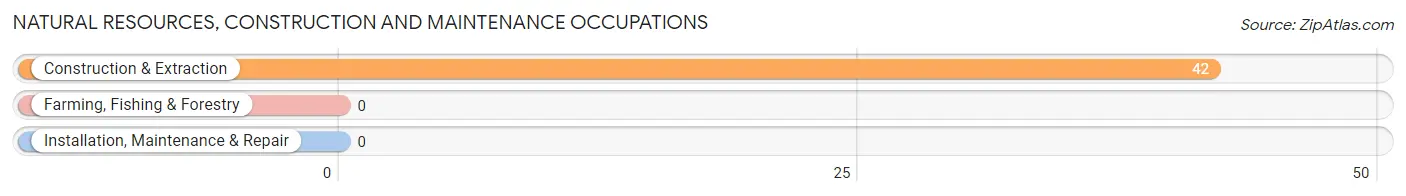
Natural Resources, Construction and Maintenance Occupations by Sex
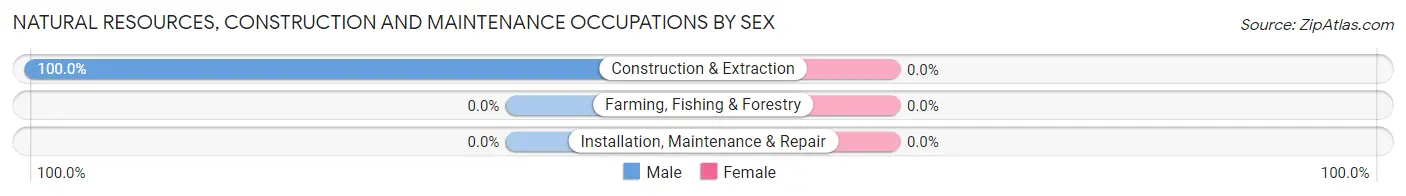
| Occupation | Male | Female |
| Farming, Fishing & Forestry | 0 (0.0%) | 0 (0.0%) |
| Construction & Extraction | 42 (100.0%) | 0 (0.0%) |
| Installation, Maintenance & Repair | 0 (0.0%) | 0 (0.0%) |
| Total (Category) | 42 (100.0%) | 0 (0.0%) |
| Total (Overall) | 98 (71.5%) | 39 (28.5%) |
Production, Transportation and Moving Occupations
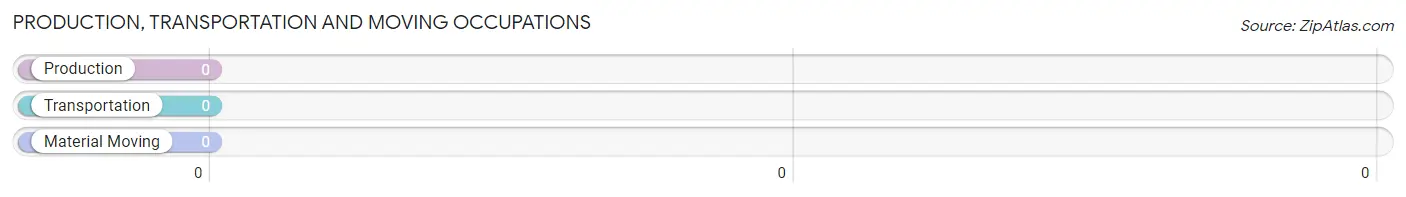
Production, Transportation and Moving Occupations by Sex
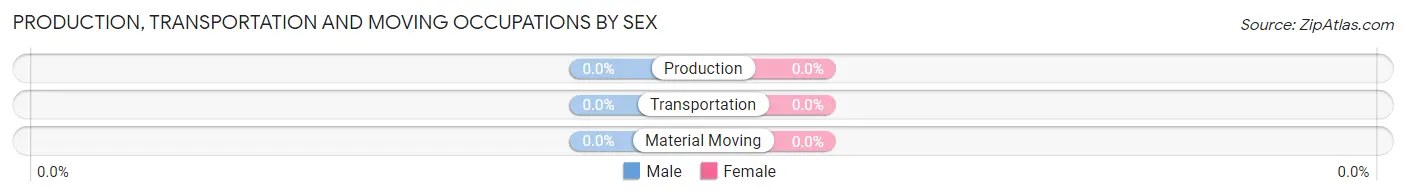
| Occupation | Male | Female |
| Production | 0 (0.0%) | 0 (0.0%) |
| Transportation | 0 (0.0%) | 0 (0.0%) |
| Material Moving | 0 (0.0%) | 0 (0.0%) |
| Total (Category) | 0 (0.0%) | 0 (0.0%) |
| Total (Overall) | 98 (71.5%) | 39 (28.5%) |
Employment Industries by Sex in Flat Lick
Employment Industries in Flat Lick
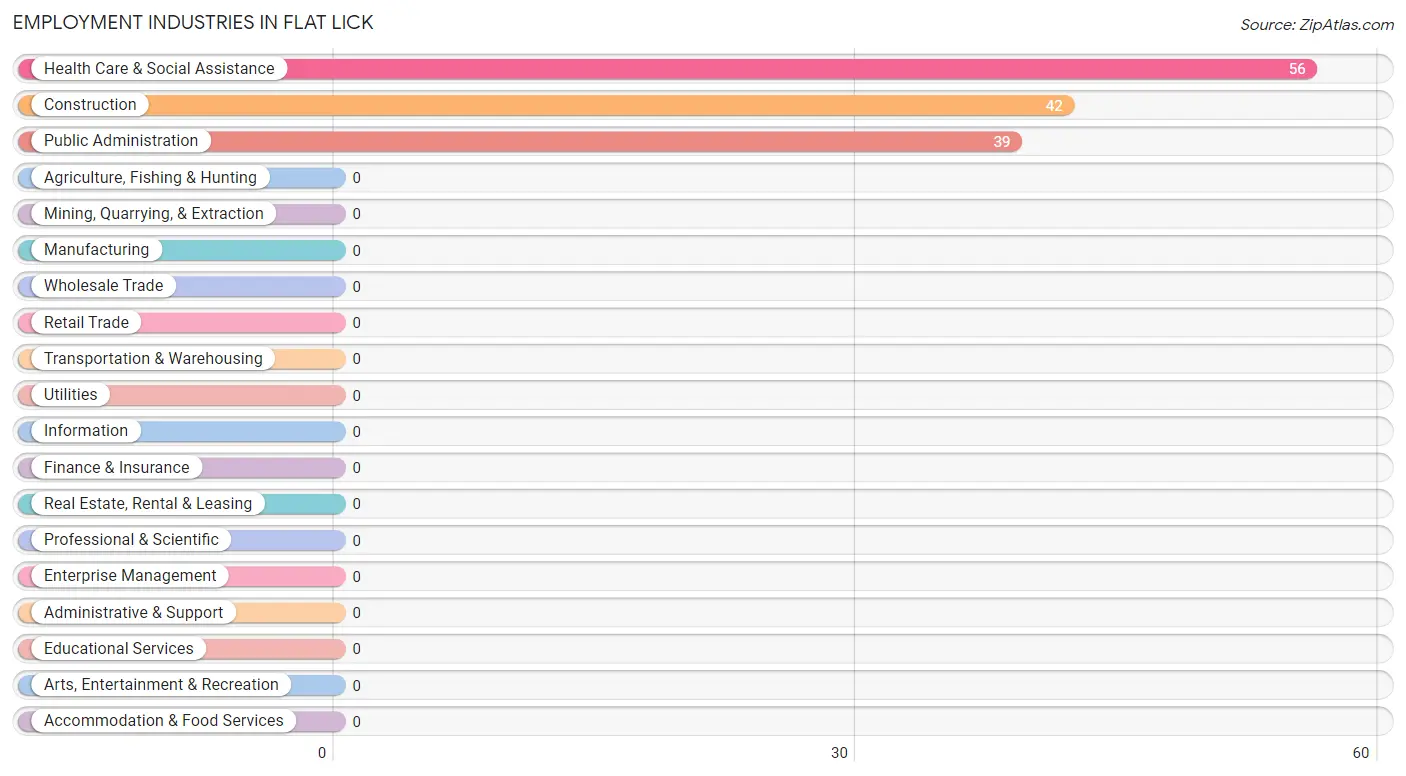
The major employment industries in Flat Lick include Health Care & Social Assistance (56 | 40.9%), Construction (42 | 30.7%), and Public Administration (39 | 28.5%).
Employment Industries by Sex in Flat Lick
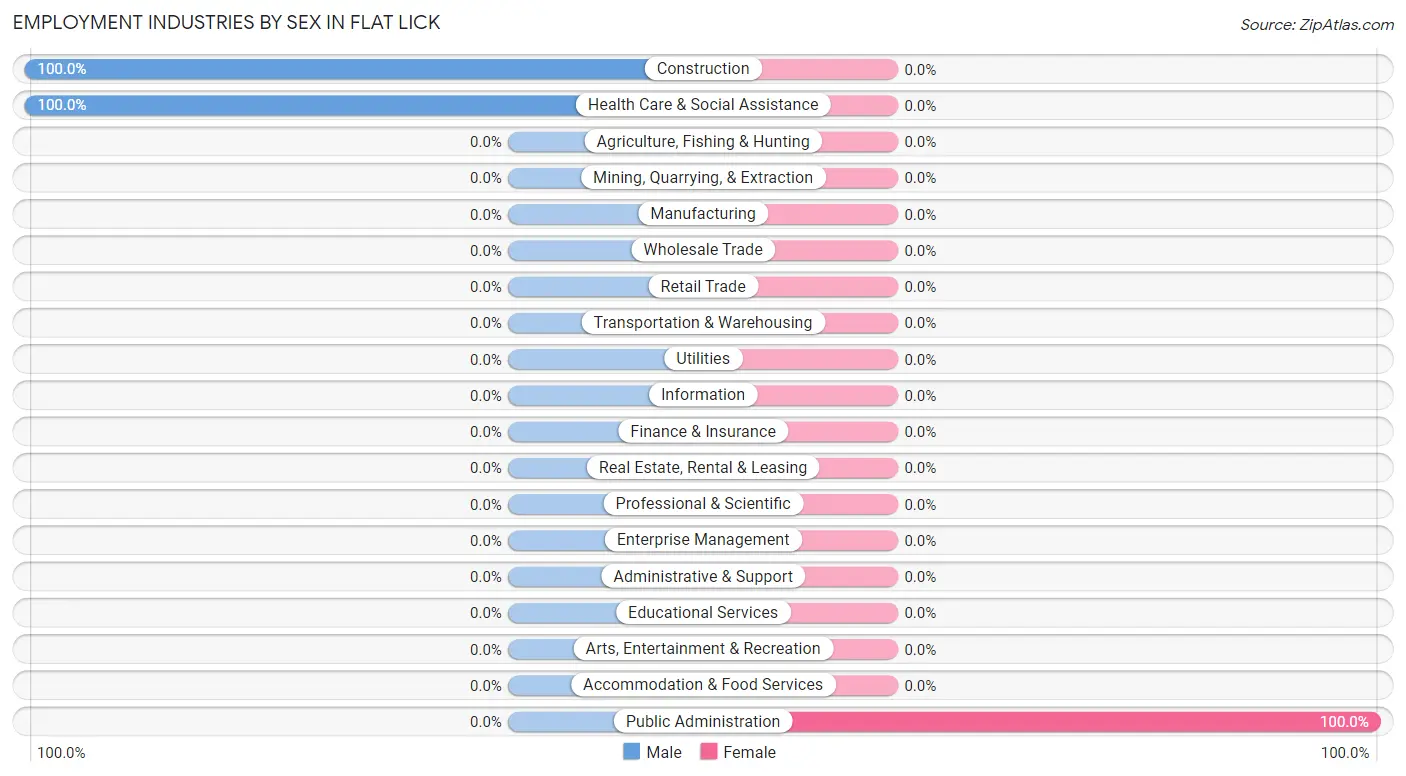
| Industry | Male | Female |
| Agriculture, Fishing & Hunting | 0 (0.0%) | 0 (0.0%) |
| Mining, Quarrying, & Extraction | 0 (0.0%) | 0 (0.0%) |
| Construction | 42 (100.0%) | 0 (0.0%) |
| Manufacturing | 0 (0.0%) | 0 (0.0%) |
| Wholesale Trade | 0 (0.0%) | 0 (0.0%) |
| Retail Trade | 0 (0.0%) | 0 (0.0%) |
| Transportation & Warehousing | 0 (0.0%) | 0 (0.0%) |
| Utilities | 0 (0.0%) | 0 (0.0%) |
| Information | 0 (0.0%) | 0 (0.0%) |
| Finance & Insurance | 0 (0.0%) | 0 (0.0%) |
| Real Estate, Rental & Leasing | 0 (0.0%) | 0 (0.0%) |
| Professional & Scientific | 0 (0.0%) | 0 (0.0%) |
| Enterprise Management | 0 (0.0%) | 0 (0.0%) |
| Administrative & Support | 0 (0.0%) | 0 (0.0%) |
| Educational Services | 0 (0.0%) | 0 (0.0%) |
| Health Care & Social Assistance | 56 (100.0%) | 0 (0.0%) |
| Arts, Entertainment & Recreation | 0 (0.0%) | 0 (0.0%) |
| Accommodation & Food Services | 0 (0.0%) | 0 (0.0%) |
| Public Administration | 0 (0.0%) | 39 (100.0%) |
| Total | 98 (71.5%) | 39 (28.5%) |
Education in Flat Lick
School Enrollment in Flat Lick
The most common levels of schooling among the 102 students in Flat Lick are nursery / preschool (52 | 51.0%), elementary school (41 | 40.2%), and middle school (9 | 8.8%).
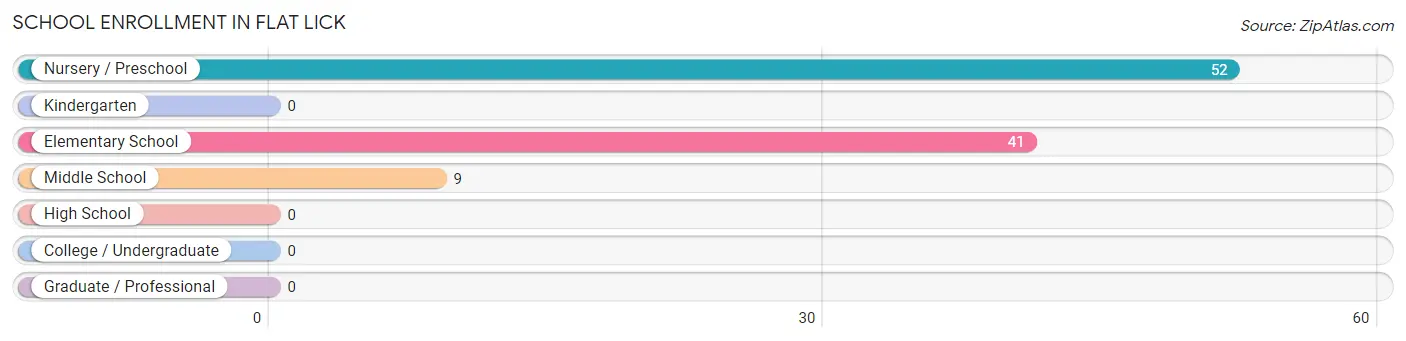
| School Level | # Students | % Students |
| Nursery / Preschool | 52 | 51.0% |
| Kindergarten | 0 | 0.0% |
| Elementary School | 41 | 40.2% |
| Middle School | 9 | 8.8% |
| High School | 0 | 0.0% |
| College / Undergraduate | 0 | 0.0% |
| Graduate / Professional | 0 | 0.0% |
| Total | 102 | 100.0% |
School Enrollment by Age by Funding Source in Flat Lick
Out of a total of 102 students who are enrolled in schools in Flat Lick, 9 (8.8%) attend a private institution, while the remaining 93 (91.2%) are enrolled in public schools. The age group of 10 to 14 year olds has the highest likelihood of being enrolled in private schools, with 9 (100.0% in the age bracket) enrolled. Conversely, the age group of 5 to 9 year old has the lowest likelihood of being enrolled in a private school, with 93 (100.0% in the age bracket) attending a public institution.
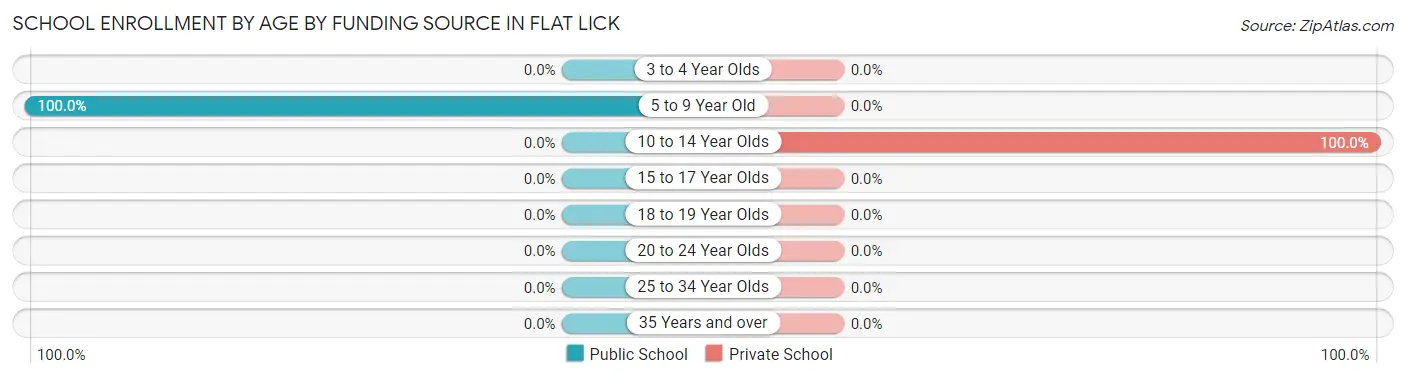
| Age Bracket | Public School | Private School |
| 3 to 4 Year Olds | 0 (0.0%) | 0 (0.0%) |
| 5 to 9 Year Old | 93 (100.0%) | 0 (0.0%) |
| 10 to 14 Year Olds | 0 (0.0%) | 9 (100.0%) |
| 15 to 17 Year Olds | 0 (0.0%) | 0 (0.0%) |
| 18 to 19 Year Olds | 0 (0.0%) | 0 (0.0%) |
| 20 to 24 Year Olds | 0 (0.0%) | 0 (0.0%) |
| 25 to 34 Year Olds | 0 (0.0%) | 0 (0.0%) |
| 35 Years and over | 0 (0.0%) | 0 (0.0%) |
| Total | 93 (91.2%) | 9 (8.8%) |
Educational Attainment by Field of Study in Flat Lick
| Field of Study | # Graduates | % Graduates |
| Computers & Mathematics | 0 | 0.0% |
| Bio, Nature & Agricultural | 0 | 0.0% |
| Physical & Health Sciences | 0 | 0.0% |
| Psychology | 0 | 0.0% |
| Social Sciences | 0 | 0.0% |
| Engineering | 0 | 0.0% |
| Multidisciplinary Studies | 0 | 0.0% |
| Science & Technology | 0 | 0.0% |
| Business | 0 | 0.0% |
| Education | 0 | 0.0% |
| Literature & Languages | 0 | 0.0% |
| Liberal Arts & History | 0 | 0.0% |
| Visual & Performing Arts | 0 | 0.0% |
| Communications | 0 | 0.0% |
| Arts & Humanities | 0 | 0.0% |
| Total | 0 | 0.0% |
Transportation & Commute in Flat Lick
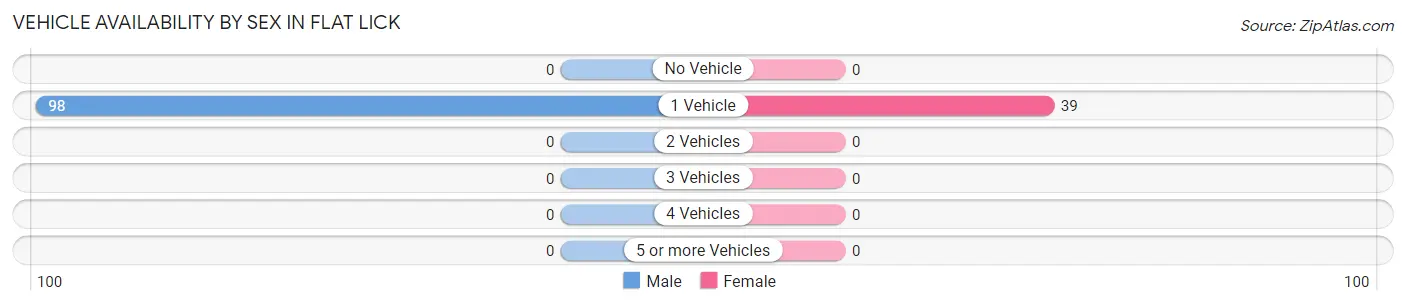
Vehicle Availability by Sex in Flat Lick
The most prevalent vehicle ownership categories in Flat Lick are males with 1 vehicle (98, accounting for 100.0%) and females with 1 vehicle (39, making up 251.3%).
| Vehicles Available | Male | Female |
| No Vehicle | 0 (0.0%) | 0 (0.0%) |
| 1 Vehicle | 98 (100.0%) | 39 (100.0%) |
| 2 Vehicles | 0 (0.0%) | 0 (0.0%) |
| 3 Vehicles | 0 (0.0%) | 0 (0.0%) |
| 4 Vehicles | 0 (0.0%) | 0 (0.0%) |
| 5 or more Vehicles | 0 (0.0%) | 0 (0.0%) |
| Total | 98 (100.0%) | 39 (100.0%) |
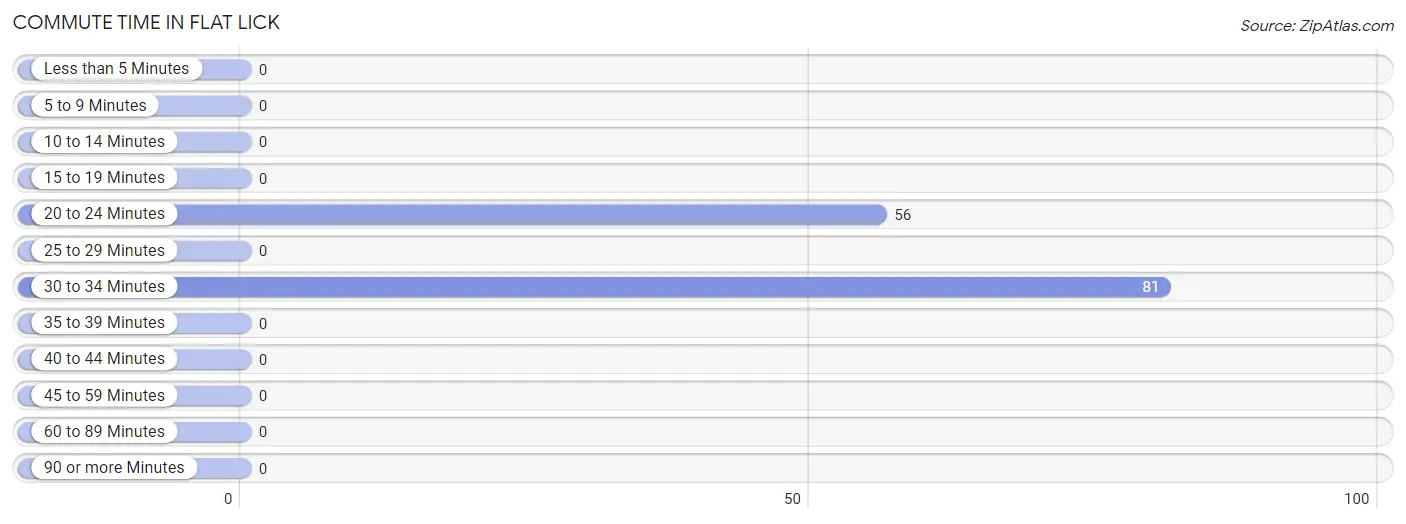
Commute Time in Flat Lick
The most frequently occuring commute durations in Flat Lick are 30 to 34 minutes (81 commuters, 59.1%), 20 to 24 minutes (56 commuters, 40.9%), and less than 5 minutes (0 commuters, 0.0%).
| Commute Time | # Commuters | % Commuters |
| Less than 5 Minutes | 0 | 0.0% |
| 5 to 9 Minutes | 0 | 0.0% |
| 10 to 14 Minutes | 0 | 0.0% |
| 15 to 19 Minutes | 0 | 0.0% |
| 20 to 24 Minutes | 56 | 40.9% |
| 25 to 29 Minutes | 0 | 0.0% |
| 30 to 34 Minutes | 81 | 59.1% |
| 35 to 39 Minutes | 0 | 0.0% |
| 40 to 44 Minutes | 0 | 0.0% |
| 45 to 59 Minutes | 0 | 0.0% |
| 60 to 89 Minutes | 0 | 0.0% |
| 90 or more Minutes | 0 | 0.0% |
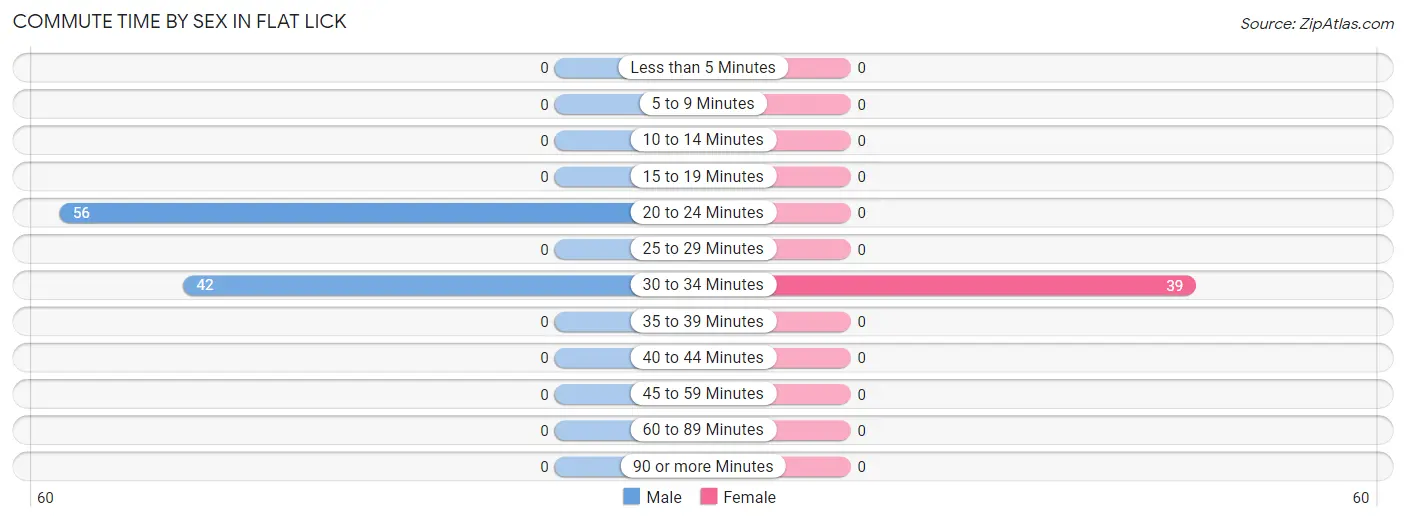
Commute Time by Sex in Flat Lick
The most common commute times in Flat Lick are 20 to 24 minutes (56 commuters, 57.1%) for males and 30 to 34 minutes (39 commuters, 100.0%) for females.
| Commute Time | Male | Female |
| Less than 5 Minutes | 0 (0.0%) | 0 (0.0%) |
| 5 to 9 Minutes | 0 (0.0%) | 0 (0.0%) |
| 10 to 14 Minutes | 0 (0.0%) | 0 (0.0%) |
| 15 to 19 Minutes | 0 (0.0%) | 0 (0.0%) |
| 20 to 24 Minutes | 56 (57.1%) | 0 (0.0%) |
| 25 to 29 Minutes | 0 (0.0%) | 0 (0.0%) |
| 30 to 34 Minutes | 42 (42.9%) | 39 (100.0%) |
| 35 to 39 Minutes | 0 (0.0%) | 0 (0.0%) |
| 40 to 44 Minutes | 0 (0.0%) | 0 (0.0%) |
| 45 to 59 Minutes | 0 (0.0%) | 0 (0.0%) |
| 60 to 89 Minutes | 0 (0.0%) | 0 (0.0%) |
| 90 or more Minutes | 0 (0.0%) | 0 (0.0%) |
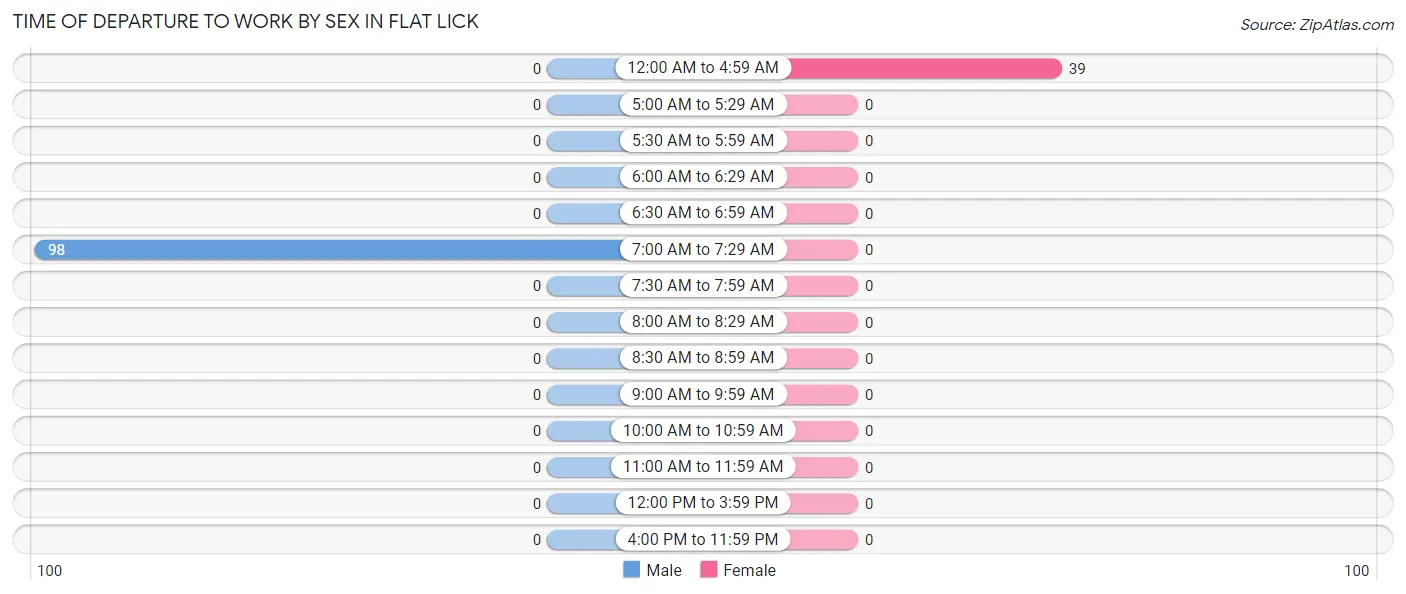
Time of Departure to Work by Sex in Flat Lick
The most frequent times of departure to work in Flat Lick are 7:00 AM to 7:29 AM (98, 100.0%) for males and 12:00 AM to 4:59 AM (39, 100.0%) for females.
| Time of Departure | Male | Female |
| 12:00 AM to 4:59 AM | 0 (0.0%) | 39 (100.0%) |
| 5:00 AM to 5:29 AM | 0 (0.0%) | 0 (0.0%) |
| 5:30 AM to 5:59 AM | 0 (0.0%) | 0 (0.0%) |
| 6:00 AM to 6:29 AM | 0 (0.0%) | 0 (0.0%) |
| 6:30 AM to 6:59 AM | 0 (0.0%) | 0 (0.0%) |
| 7:00 AM to 7:29 AM | 98 (100.0%) | 0 (0.0%) |
| 7:30 AM to 7:59 AM | 0 (0.0%) | 0 (0.0%) |
| 8:00 AM to 8:29 AM | 0 (0.0%) | 0 (0.0%) |
| 8:30 AM to 8:59 AM | 0 (0.0%) | 0 (0.0%) |
| 9:00 AM to 9:59 AM | 0 (0.0%) | 0 (0.0%) |
| 10:00 AM to 10:59 AM | 0 (0.0%) | 0 (0.0%) |
| 11:00 AM to 11:59 AM | 0 (0.0%) | 0 (0.0%) |
| 12:00 PM to 3:59 PM | 0 (0.0%) | 0 (0.0%) |
| 4:00 PM to 11:59 PM | 0 (0.0%) | 0 (0.0%) |
| Total | 98 (100.0%) | 39 (100.0%) |
Housing Occupancy in Flat Lick
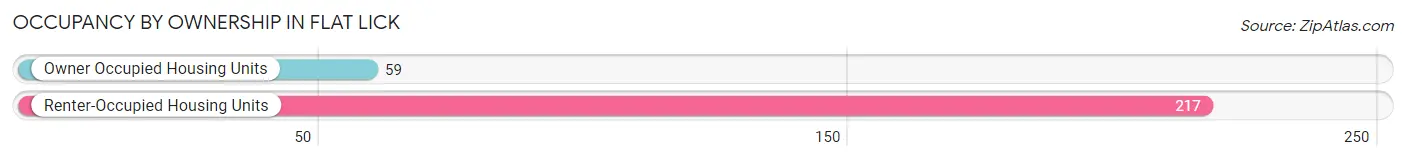
Occupancy by Ownership in Flat Lick
Of the total 276 dwellings in Flat Lick, owner-occupied units account for 59 (21.4%), while renter-occupied units make up 217 (78.6%).
| Occupancy | # Housing Units | % Housing Units |
| Owner Occupied Housing Units | 59 | 21.4% |
| Renter-Occupied Housing Units | 217 | 78.6% |
| Total Occupied Housing Units | 276 | 100.0% |
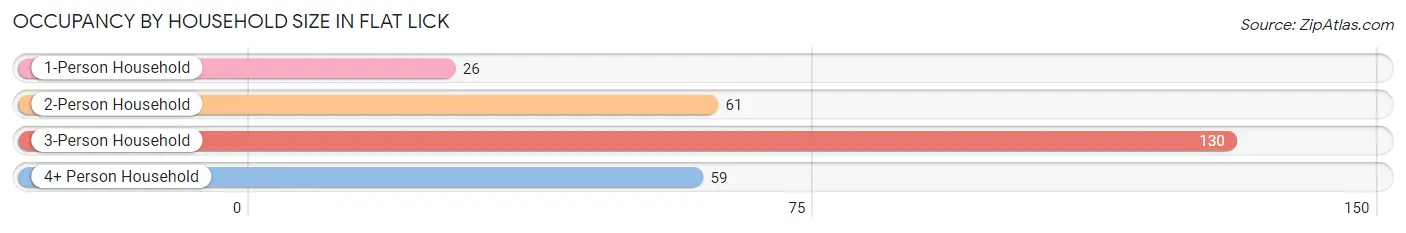
Occupancy by Household Size in Flat Lick
| Household Size | # Housing Units | % Housing Units |
| 1-Person Household | 26 | 9.4% |
| 2-Person Household | 61 | 22.1% |
| 3-Person Household | 130 | 47.1% |
| 4+ Person Household | 59 | 21.4% |
| Total Housing Units | 276 | 100.0% |
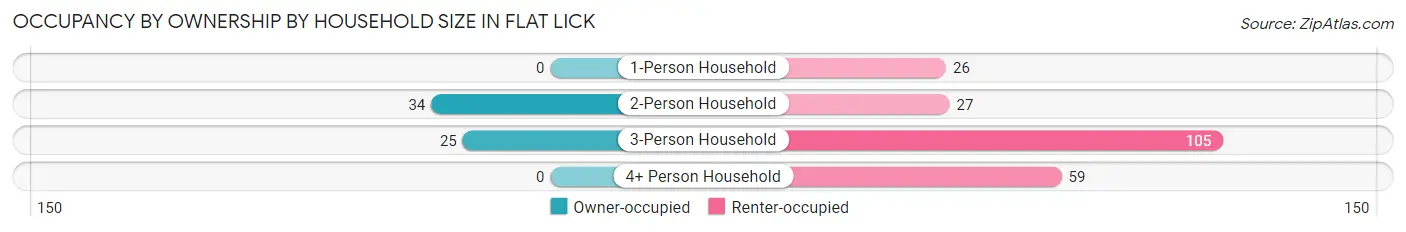
Occupancy by Ownership by Household Size in Flat Lick
| Household Size | Owner-occupied | Renter-occupied |
| 1-Person Household | 0 (0.0%) | 26 (100.0%) |
| 2-Person Household | 34 (55.7%) | 27 (44.3%) |
| 3-Person Household | 25 (19.2%) | 105 (80.8%) |
| 4+ Person Household | 0 (0.0%) | 59 (100.0%) |
| Total Housing Units | 59 (21.4%) | 217 (78.6%) |
Occupancy by Educational Attainment in Flat Lick
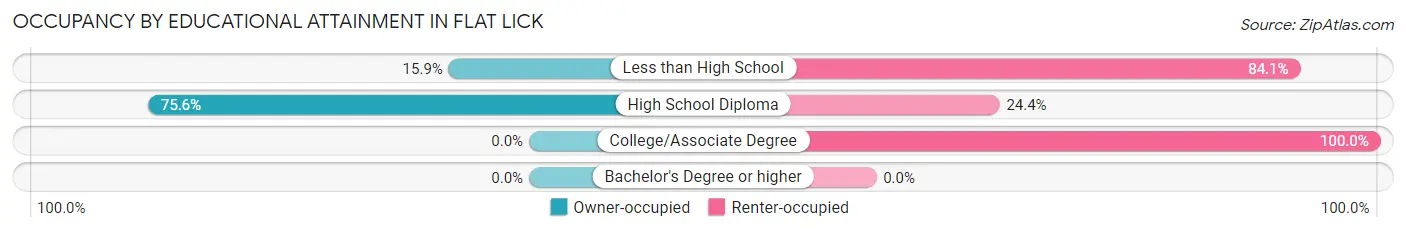
| Household Size | Owner-occupied | Renter-occupied |
| Less than High School | 25 (15.9%) | 132 (84.1%) |
| High School Diploma | 34 (75.6%) | 11 (24.4%) |
| College/Associate Degree | 0 (0.0%) | 74 (100.0%) |
| Bachelor's Degree or higher | 0 (0.0%) | 0 (0.0%) |
Occupancy by Age of Householder in Flat Lick
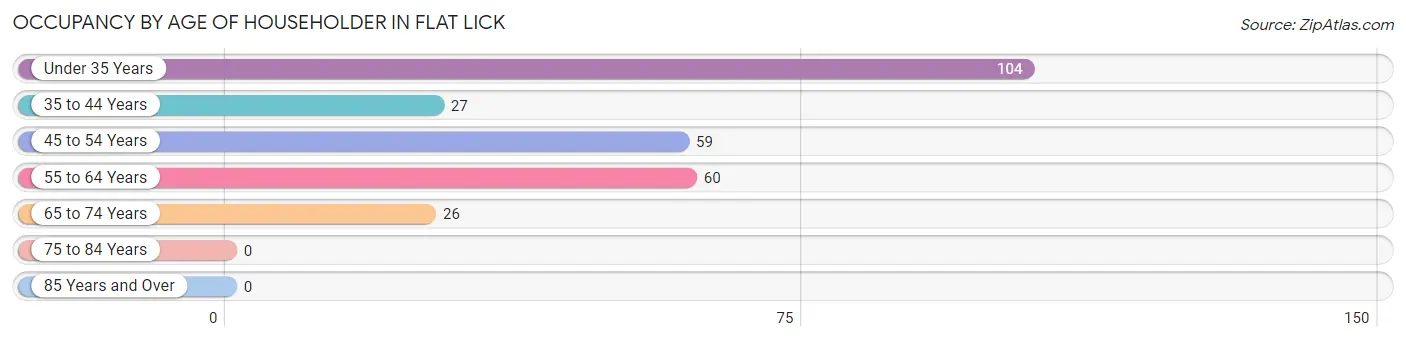
| Age Bracket | # Households | % Households |
| Under 35 Years | 104 | 37.7% |
| 35 to 44 Years | 27 | 9.8% |
| 45 to 54 Years | 59 | 21.4% |
| 55 to 64 Years | 60 | 21.7% |
| 65 to 74 Years | 26 | 9.4% |
| 75 to 84 Years | 0 | 0.0% |
| 85 Years and Over | 0 | 0.0% |
| Total | 276 | 100.0% |
Housing Finances in Flat Lick
Median Income by Occupancy in Flat Lick
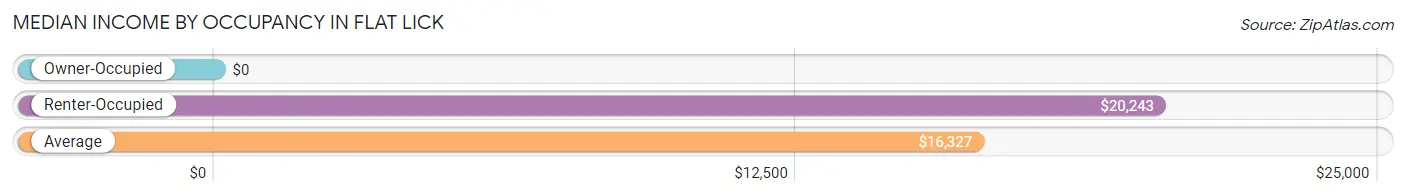
| Occupancy Type | # Households | Median Income |
| Owner-Occupied | 59 (21.4%) | $0 |
| Renter-Occupied | 217 (78.6%) | $20,243 |
| Average | 276 (100.0%) | $16,327 |
Occupancy by Householder Income Bracket in Flat Lick
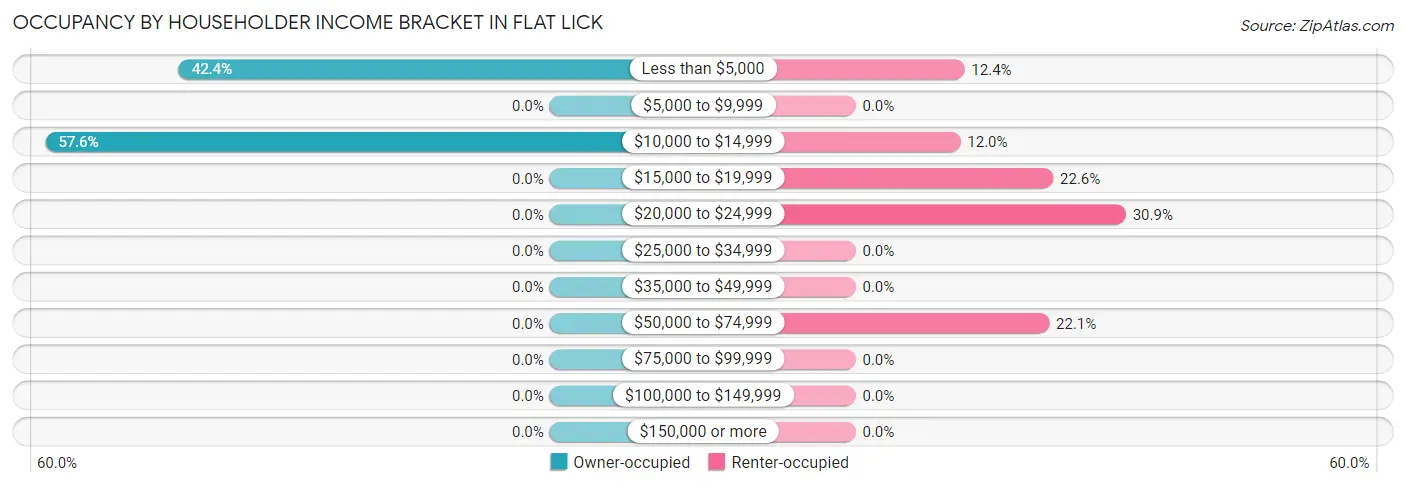
| Income Bracket | Owner-occupied | Renter-occupied |
| Less than $5,000 | 25 (42.4%) | 27 (12.4%) |
| $5,000 to $9,999 | 0 (0.0%) | 0 (0.0%) |
| $10,000 to $14,999 | 34 (57.6%) | 26 (12.0%) |
| $15,000 to $19,999 | 0 (0.0%) | 49 (22.6%) |
| $20,000 to $24,999 | 0 (0.0%) | 67 (30.9%) |
| $25,000 to $34,999 | 0 (0.0%) | 0 (0.0%) |
| $35,000 to $49,999 | 0 (0.0%) | 0 (0.0%) |
| $50,000 to $74,999 | 0 (0.0%) | 48 (22.1%) |
| $75,000 to $99,999 | 0 (0.0%) | 0 (0.0%) |
| $100,000 to $149,999 | 0 (0.0%) | 0 (0.0%) |
| $150,000 or more | 0 (0.0%) | 0 (0.0%) |
| Total | 59 (100.0%) | 217 (100.0%) |
Monthly Housing Cost Tiers in Flat Lick
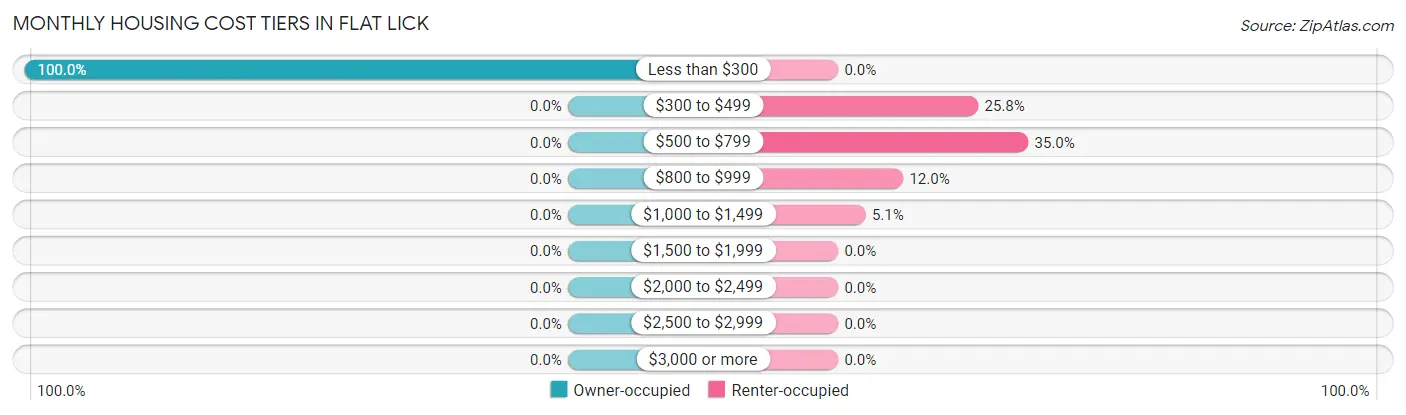
| Monthly Cost | Owner-occupied | Renter-occupied |
| Less than $300 | 59 (100.0%) | 0 (0.0%) |
| $300 to $499 | 0 (0.0%) | 56 (25.8%) |
| $500 to $799 | 0 (0.0%) | 76 (35.0%) |
| $800 to $999 | 0 (0.0%) | 26 (12.0%) |
| $1,000 to $1,499 | 0 (0.0%) | 11 (5.1%) |
| $1,500 to $1,999 | 0 (0.0%) | 0 (0.0%) |
| $2,000 to $2,499 | 0 (0.0%) | 0 (0.0%) |
| $2,500 to $2,999 | 0 (0.0%) | 0 (0.0%) |
| $3,000 or more | 0 (0.0%) | 0 (0.0%) |
| Total | 59 (100.0%) | 217 (100.0%) |
Physical Housing Characteristics in Flat Lick
Housing Structures in Flat Lick
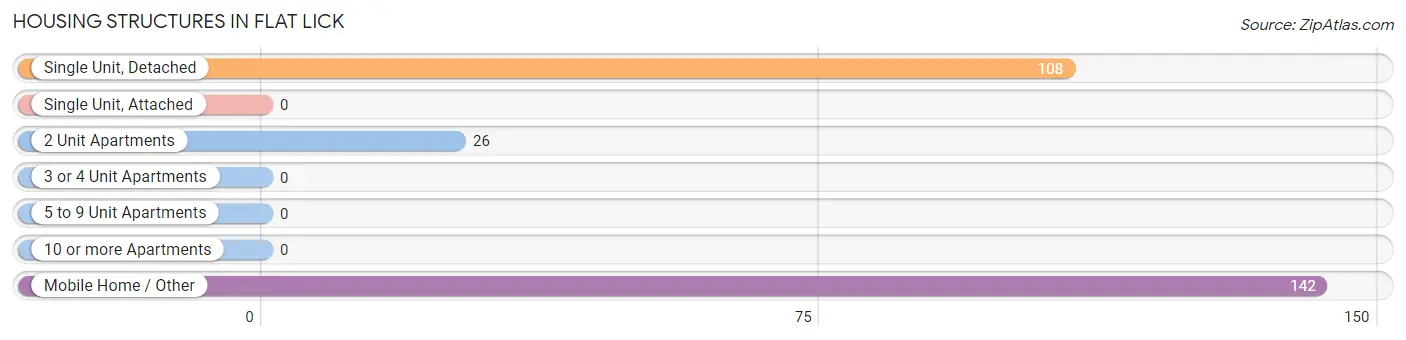
| Structure Type | # Housing Units | % Housing Units |
| Single Unit, Detached | 108 | 39.1% |
| Single Unit, Attached | 0 | 0.0% |
| 2 Unit Apartments | 26 | 9.4% |
| 3 or 4 Unit Apartments | 0 | 0.0% |
| 5 to 9 Unit Apartments | 0 | 0.0% |
| 10 or more Apartments | 0 | 0.0% |
| Mobile Home / Other | 142 | 51.4% |
| Total | 276 | 100.0% |
Housing Structures by Occupancy in Flat Lick
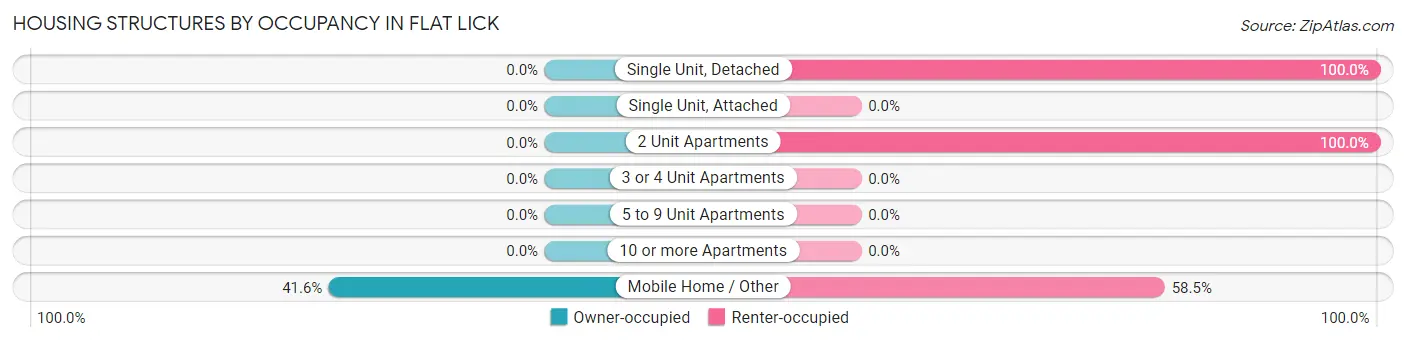
| Structure Type | Owner-occupied | Renter-occupied |
| Single Unit, Detached | 0 (0.0%) | 108 (100.0%) |
| Single Unit, Attached | 0 (0.0%) | 0 (0.0%) |
| 2 Unit Apartments | 0 (0.0%) | 26 (100.0%) |
| 3 or 4 Unit Apartments | 0 (0.0%) | 0 (0.0%) |
| 5 to 9 Unit Apartments | 0 (0.0%) | 0 (0.0%) |
| 10 or more Apartments | 0 (0.0%) | 0 (0.0%) |
| Mobile Home / Other | 59 (41.5%) | 83 (58.5%) |
| Total | 59 (21.4%) | 217 (78.6%) |
Housing Structures by Number of Rooms in Flat Lick
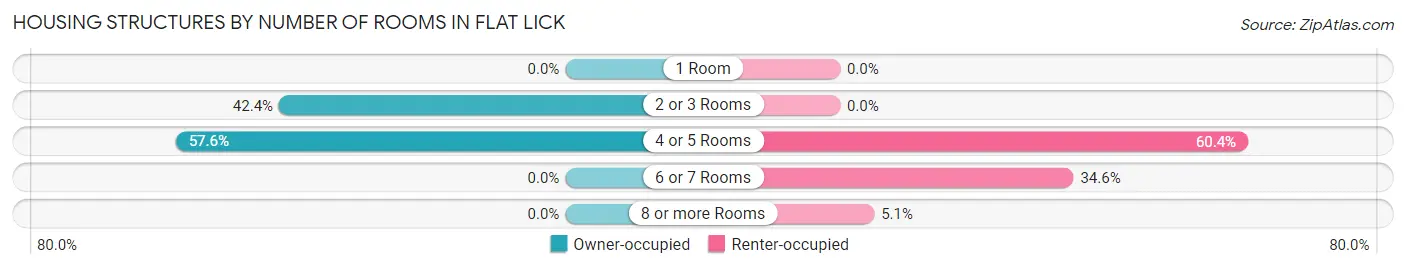
| Number of Rooms | Owner-occupied | Renter-occupied |
| 1 Room | 0 (0.0%) | 0 (0.0%) |
| 2 or 3 Rooms | 25 (42.4%) | 0 (0.0%) |
| 4 or 5 Rooms | 34 (57.6%) | 131 (60.4%) |
| 6 or 7 Rooms | 0 (0.0%) | 75 (34.6%) |
| 8 or more Rooms | 0 (0.0%) | 11 (5.1%) |
| Total | 59 (100.0%) | 217 (100.0%) |
Housing Structure by Heating Type in Flat Lick
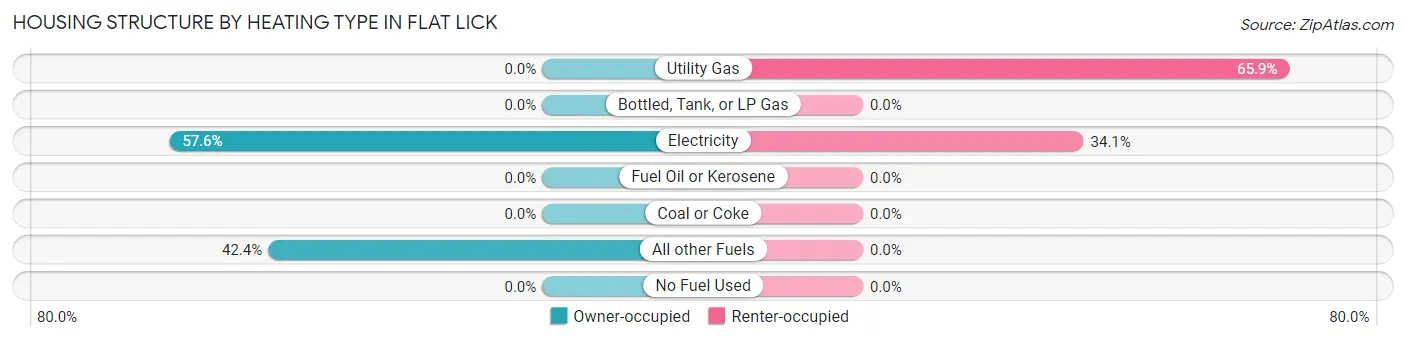
| Heating Type | Owner-occupied | Renter-occupied |
| Utility Gas | 0 (0.0%) | 143 (65.9%) |
| Bottled, Tank, or LP Gas | 0 (0.0%) | 0 (0.0%) |
| Electricity | 34 (57.6%) | 74 (34.1%) |
| Fuel Oil or Kerosene | 0 (0.0%) | 0 (0.0%) |
| Coal or Coke | 0 (0.0%) | 0 (0.0%) |
| All other Fuels | 25 (42.4%) | 0 (0.0%) |
| No Fuel Used | 0 (0.0%) | 0 (0.0%) |
| Total | 59 (100.0%) | 217 (100.0%) |
Household Vehicle Usage in Flat Lick
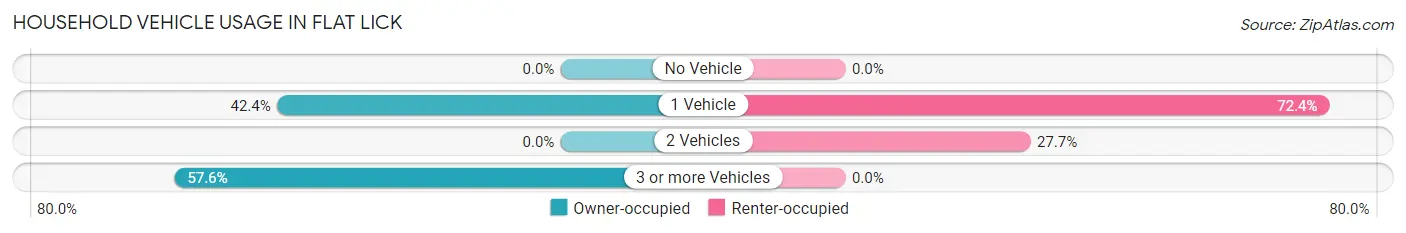
| Vehicles per Household | Owner-occupied | Renter-occupied |
| No Vehicle | 0 (0.0%) | 0 (0.0%) |
| 1 Vehicle | 25 (42.4%) | 157 (72.4%) |
| 2 Vehicles | 0 (0.0%) | 60 (27.7%) |
| 3 or more Vehicles | 34 (57.6%) | 0 (0.0%) |
| Total | 59 (100.0%) | 217 (100.0%) |
Real Estate & Mortgages in Flat Lick
Real Estate and Mortgage Overview in Flat Lick
| Characteristic | Without Mortgage | With Mortgage |
| Housing Units | 59 | 0 |
| Median Property Value | - | - |
| Median Household Income | - | - |
| Monthly Housing Costs | - | - |
| Real Estate Taxes | - | - |
Property Value by Mortgage Status in Flat Lick
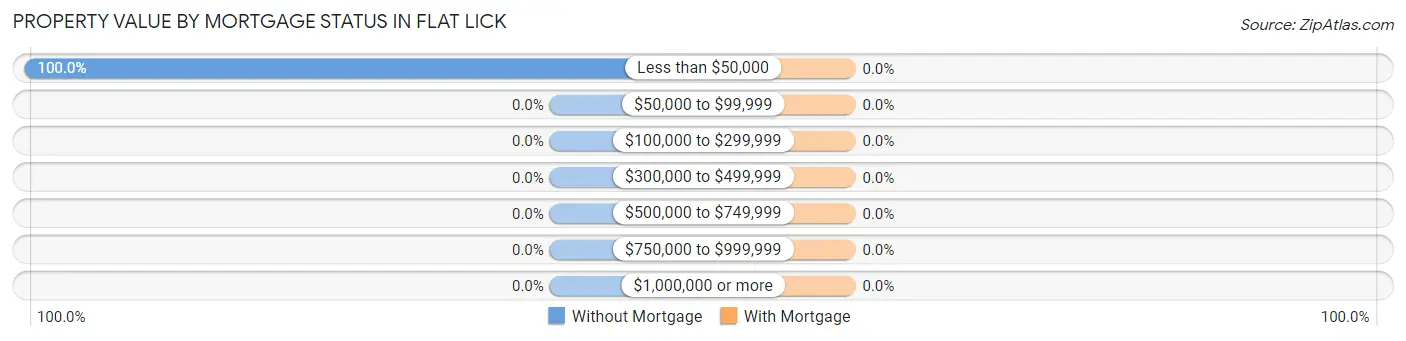
| Property Value | Without Mortgage | With Mortgage |
| Less than $50,000 | 59 (100.0%) | 0 (0.0%) |
| $50,000 to $99,999 | 0 (0.0%) | 0 (0.0%) |
| $100,000 to $299,999 | 0 (0.0%) | 0 (0.0%) |
| $300,000 to $499,999 | 0 (0.0%) | 0 (0.0%) |
| $500,000 to $749,999 | 0 (0.0%) | 0 (0.0%) |
| $750,000 to $999,999 | 0 (0.0%) | 0 (0.0%) |
| $1,000,000 or more | 0 (0.0%) | 0 (0.0%) |
| Total | 59 (100.0%) | 0 (0.0%) |
Household Income by Mortgage Status in Flat Lick
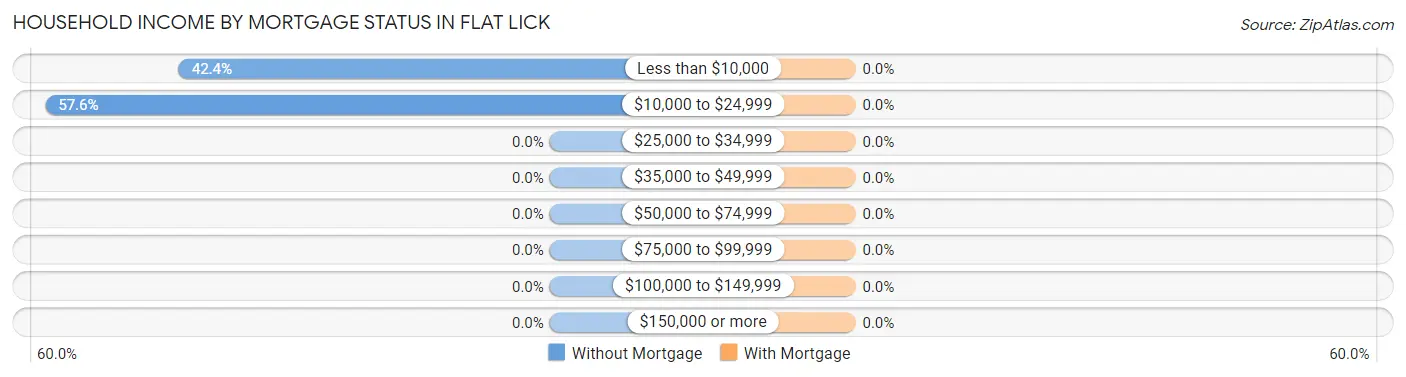
| Household Income | Without Mortgage | With Mortgage |
| Less than $10,000 | 25 (42.4%) | 0 (0.0%) |
| $10,000 to $24,999 | 34 (57.6%) | 0 (0.0%) |
| $25,000 to $34,999 | 0 (0.0%) | 0 (0.0%) |
| $35,000 to $49,999 | 0 (0.0%) | 0 (0.0%) |
| $50,000 to $74,999 | 0 (0.0%) | 0 (0.0%) |
| $75,000 to $99,999 | 0 (0.0%) | 0 (0.0%) |
| $100,000 to $149,999 | 0 (0.0%) | 0 (0.0%) |
| $150,000 or more | 0 (0.0%) | 0 (0.0%) |
| Total | 59 (100.0%) | 0 (0.0%) |
Property Value to Household Income Ratio in Flat Lick
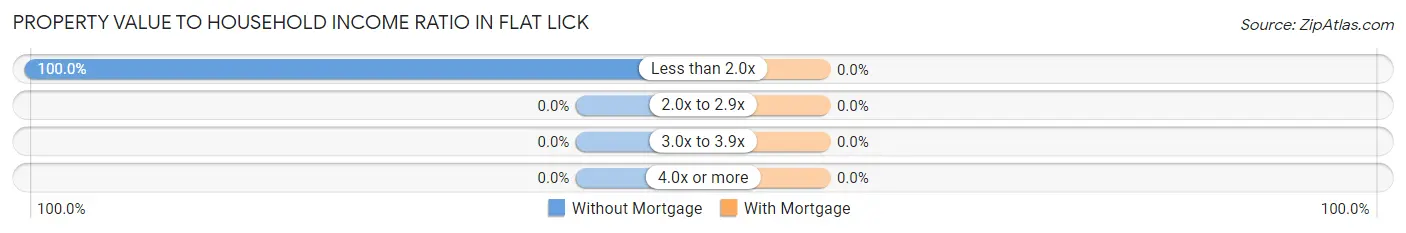
| Value-to-Income Ratio | Without Mortgage | With Mortgage |
| Less than 2.0x | 59 (100.0%) | 0 (0.0%) |
| 2.0x to 2.9x | 0 (0.0%) | 0 (0.0%) |
| 3.0x to 3.9x | 0 (0.0%) | 0 (0.0%) |
| 4.0x or more | 0 (0.0%) | 0 (0.0%) |
| Total | 59 (100.0%) | 0 (0.0%) |
Real Estate Taxes by Mortgage Status in Flat Lick
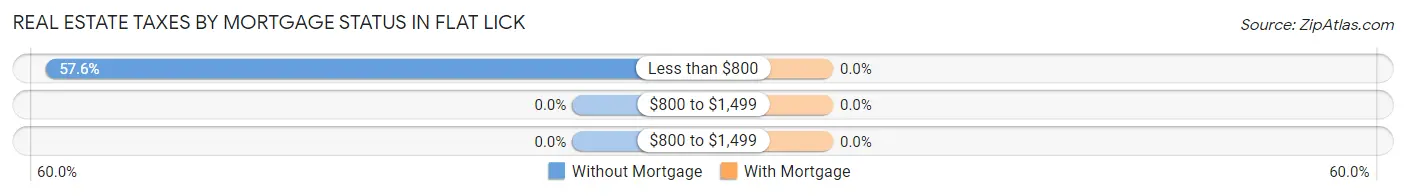
| Property Taxes | Without Mortgage | With Mortgage |
| Less than $800 | 34 (57.6%) | 0 (0.0%) |
| $800 to $1,499 | 0 (0.0%) | 0 (0.0%) |
| $800 to $1,499 | 0 (0.0%) | 0 (0.0%) |
| Total | 59 (100.0%) | 0 (0.0%) |
Health & Disability in Flat Lick
Health Insurance Coverage by Age in Flat Lick
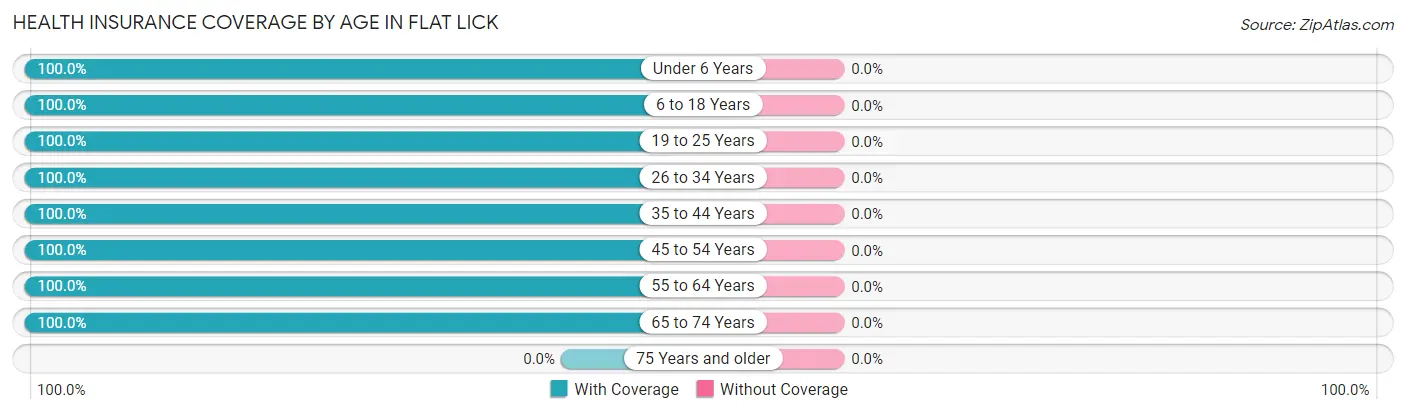
| Age Bracket | With Coverage | Without Coverage |
| Under 6 Years | 164 (100.0%) | 0 (0.0%) |
| 6 to 18 Years | 99 (100.0%) | 0 (0.0%) |
| 19 to 25 Years | 44 (100.0%) | 0 (0.0%) |
| 26 to 34 Years | 143 (100.0%) | 0 (0.0%) |
| 35 to 44 Years | 155 (100.0%) | 0 (0.0%) |
| 45 to 54 Years | 128 (100.0%) | 0 (0.0%) |
| 55 to 64 Years | 124 (100.0%) | 0 (0.0%) |
| 65 to 74 Years | 26 (100.0%) | 0 (0.0%) |
| 75 Years and older | 0 (0.0%) | 0 (0.0%) |
| Total | 883 (100.0%) | 0 (0.0%) |
Health Insurance Coverage by Citizenship Status in Flat Lick
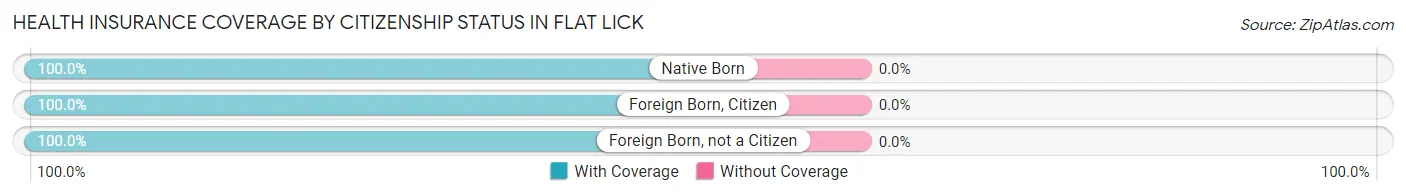
| Citizenship Status | With Coverage | Without Coverage |
| Native Born | 164 (100.0%) | 0 (0.0%) |
| Foreign Born, Citizen | 99 (100.0%) | 0 (0.0%) |
| Foreign Born, not a Citizen | 44 (100.0%) | 0 (0.0%) |
Health Insurance Coverage by Household Income in Flat Lick
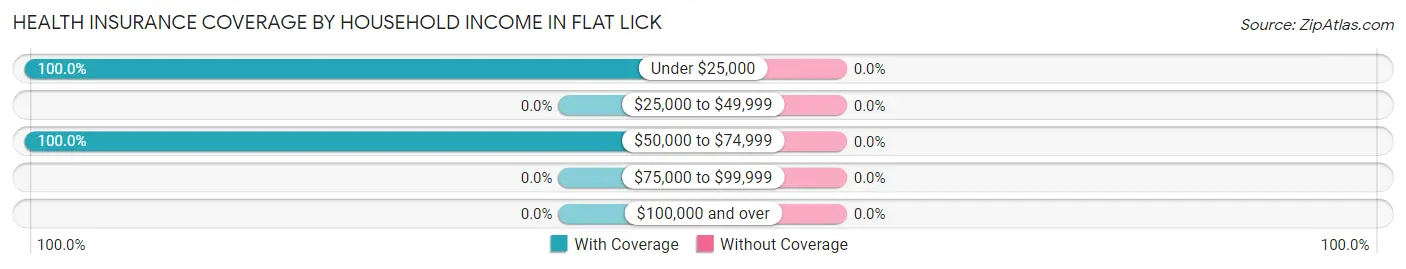
| Household Income | With Coverage | Without Coverage |
| Under $25,000 | 650 (100.0%) | 0 (0.0%) |
| $25,000 to $49,999 | 0 (0.0%) | 0 (0.0%) |
| $50,000 to $74,999 | 233 (100.0%) | 0 (0.0%) |
| $75,000 to $99,999 | 0 (0.0%) | 0 (0.0%) |
| $100,000 and over | 0 (0.0%) | 0 (0.0%) |
Public vs Private Health Insurance Coverage by Age in Flat Lick
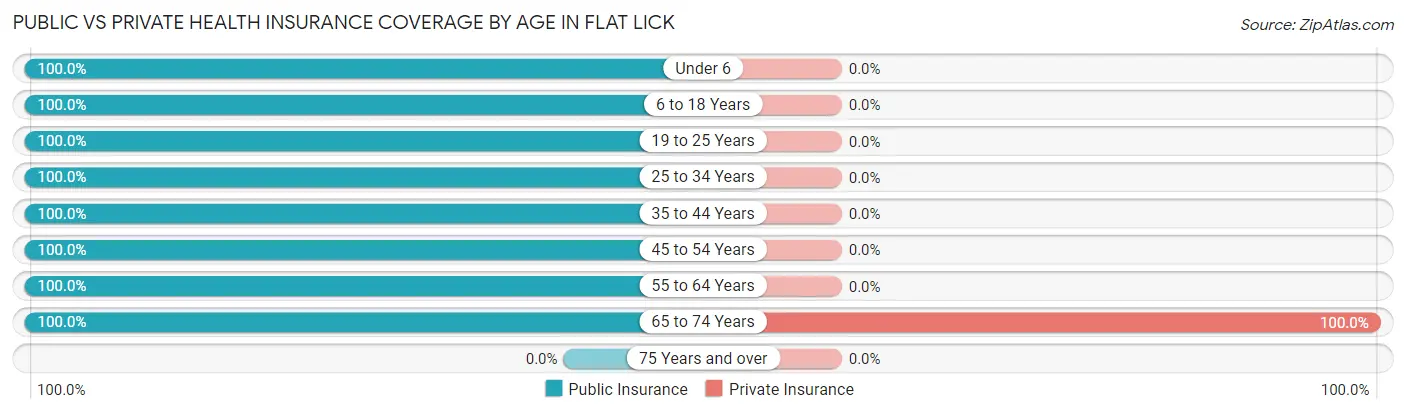
| Age Bracket | Public Insurance | Private Insurance |
| Under 6 | 164 (100.0%) | 0 (0.0%) |
| 6 to 18 Years | 99 (100.0%) | 0 (0.0%) |
| 19 to 25 Years | 44 (100.0%) | 0 (0.0%) |
| 25 to 34 Years | 143 (100.0%) | 0 (0.0%) |
| 35 to 44 Years | 155 (100.0%) | 0 (0.0%) |
| 45 to 54 Years | 128 (100.0%) | 0 (0.0%) |
| 55 to 64 Years | 124 (100.0%) | 0 (0.0%) |
| 65 to 74 Years | 26 (100.0%) | 26 (100.0%) |
| 75 Years and over | 0 (0.0%) | 0 (0.0%) |
| Total | 883 (100.0%) | 26 (2.9%) |
Disability Status by Sex by Age in Flat Lick
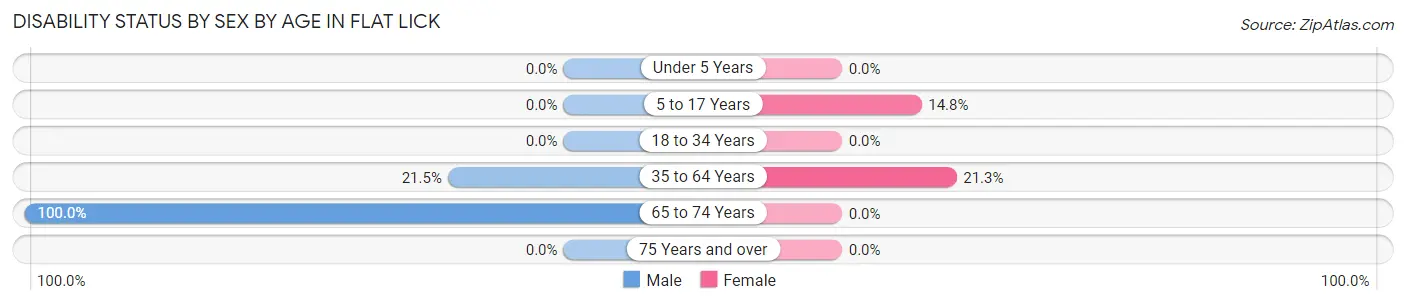
| Age Bracket | Male | Female |
| Under 5 Years | 0 (0.0%) | 0 (0.0%) |
| 5 to 17 Years | 0 (0.0%) | 9 (14.7%) |
| 18 to 34 Years | 0 (0.0%) | 0 (0.0%) |
| 35 to 64 Years | 53 (21.5%) | 34 (21.2%) |
| 65 to 74 Years | 26 (100.0%) | 0 (0.0%) |
| 75 Years and over | 0 (0.0%) | 0 (0.0%) |
Disability Class by Sex by Age in Flat Lick
Disability Class: Hearing Difficulty
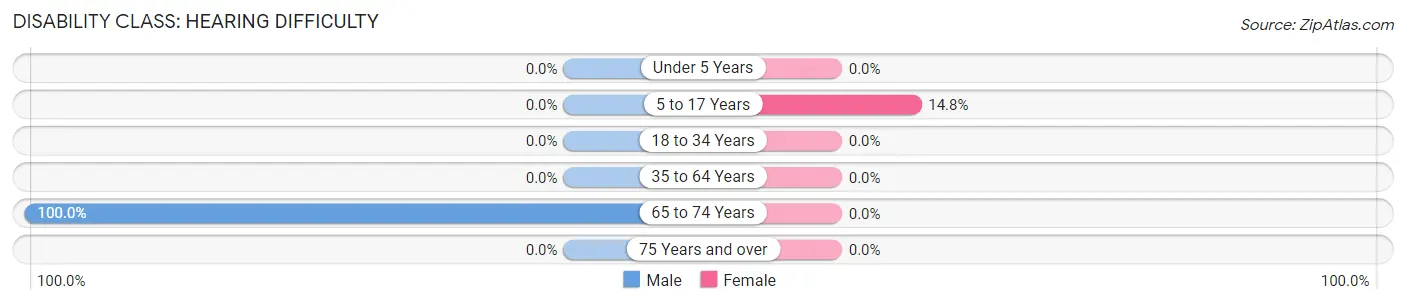
| Age Bracket | Male | Female |
| Under 5 Years | 0 (0.0%) | 0 (0.0%) |
| 5 to 17 Years | 0 (0.0%) | 9 (14.7%) |
| 18 to 34 Years | 0 (0.0%) | 0 (0.0%) |
| 35 to 64 Years | 0 (0.0%) | 0 (0.0%) |
| 65 to 74 Years | 26 (100.0%) | 0 (0.0%) |
| 75 Years and over | 0 (0.0%) | 0 (0.0%) |
Disability Class: Vision Difficulty
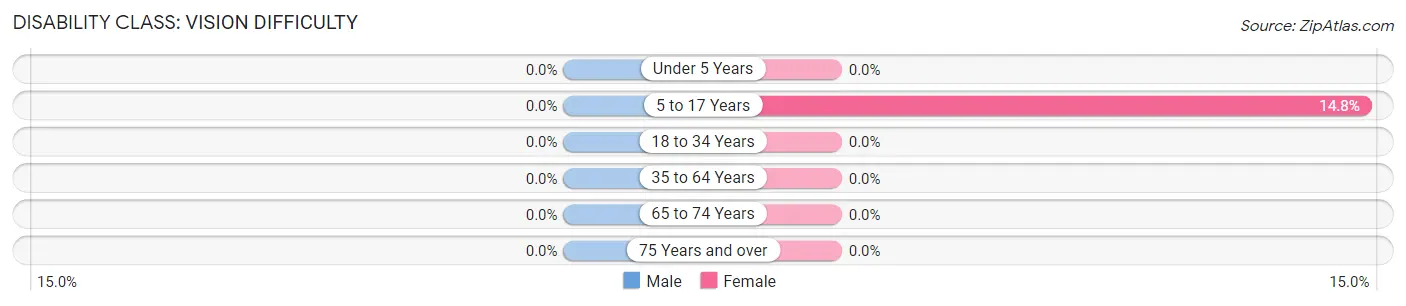
| Age Bracket | Male | Female |
| Under 5 Years | 0 (0.0%) | 0 (0.0%) |
| 5 to 17 Years | 0 (0.0%) | 9 (14.7%) |
| 18 to 34 Years | 0 (0.0%) | 0 (0.0%) |
| 35 to 64 Years | 0 (0.0%) | 0 (0.0%) |
| 65 to 74 Years | 0 (0.0%) | 0 (0.0%) |
| 75 Years and over | 0 (0.0%) | 0 (0.0%) |
Disability Class: Cognitive Difficulty
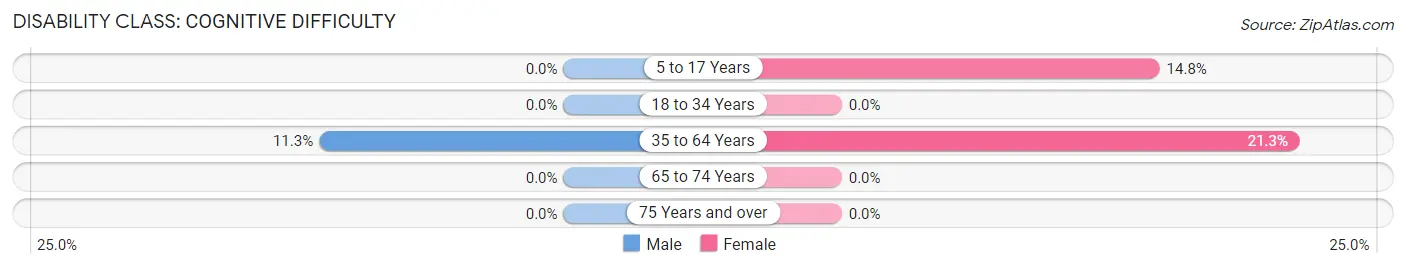
| Age Bracket | Male | Female |
| 5 to 17 Years | 0 (0.0%) | 9 (14.7%) |
| 18 to 34 Years | 0 (0.0%) | 0 (0.0%) |
| 35 to 64 Years | 28 (11.3%) | 34 (21.2%) |
| 65 to 74 Years | 0 (0.0%) | 0 (0.0%) |
| 75 Years and over | 0 (0.0%) | 0 (0.0%) |
Disability Class: Ambulatory Difficulty

| Age Bracket | Male | Female |
| 5 to 17 Years | 0 (0.0%) | 0 (0.0%) |
| 18 to 34 Years | 0 (0.0%) | 0 (0.0%) |
| 35 to 64 Years | 53 (21.5%) | 34 (21.2%) |
| 65 to 74 Years | 0 (0.0%) | 0 (0.0%) |
| 75 Years and over | 0 (0.0%) | 0 (0.0%) |
Disability Class: Self-Care Difficulty
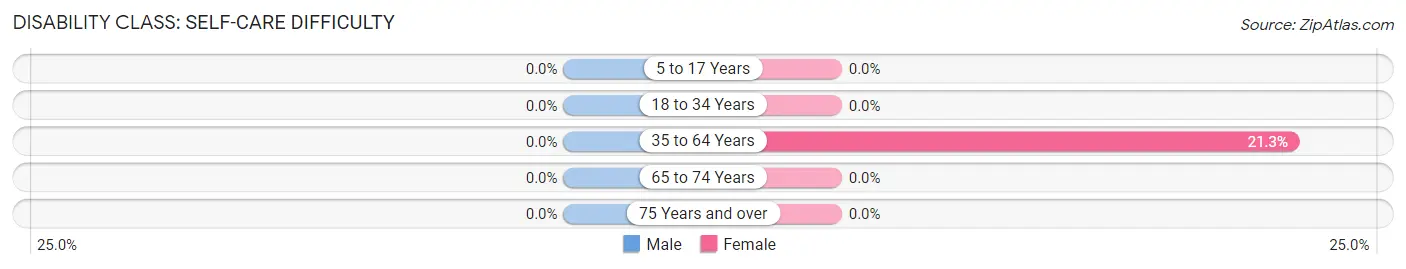
| Age Bracket | Male | Female |
| 5 to 17 Years | 0 (0.0%) | 0 (0.0%) |
| 18 to 34 Years | 0 (0.0%) | 0 (0.0%) |
| 35 to 64 Years | 0 (0.0%) | 34 (21.2%) |
| 65 to 74 Years | 0 (0.0%) | 0 (0.0%) |
| 75 Years and over | 0 (0.0%) | 0 (0.0%) |
Technology Access in Flat Lick
Computing Device Access in Flat Lick
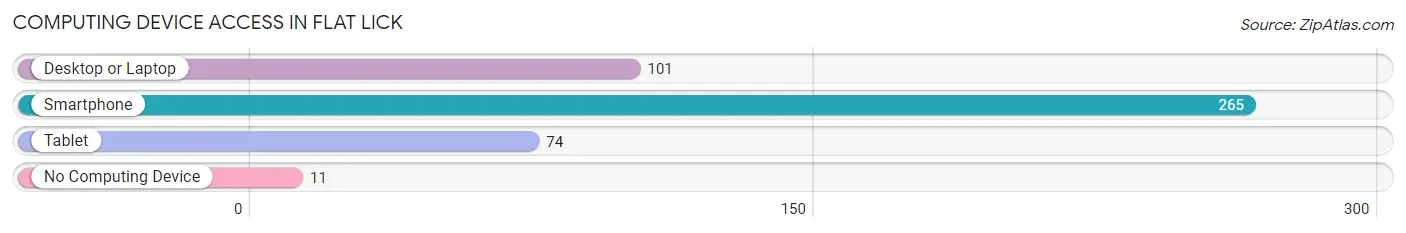
| Device Type | # Households | % Households |
| Desktop or Laptop | 101 | 36.6% |
| Smartphone | 265 | 96.0% |
| Tablet | 74 | 26.8% |
| No Computing Device | 11 | 4.0% |
| Total | 276 | 100.0% |
Internet Access in Flat Lick
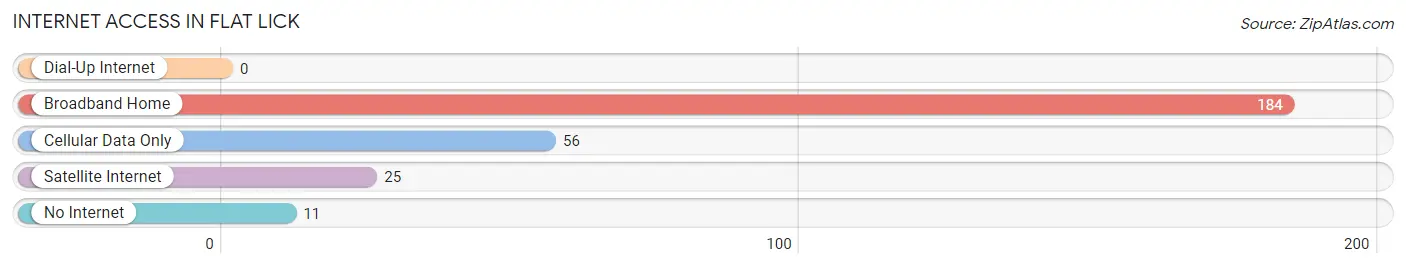
| Internet Type | # Households | % Households |
| Dial-Up Internet | 0 | 0.0% |
| Broadband Home | 184 | 66.7% |
| Cellular Data Only | 56 | 20.3% |
| Satellite Internet | 25 | 9.1% |
| No Internet | 11 | 4.0% |
| Total | 276 | 100.0% |
Flat Lick Summary
Flat Lick is a small unincorporated community located in Knox County, Kentucky. It is situated in the foothills of the Appalachian Mountains, approximately 20 miles south of Barbourville. The population of Flat Lick was estimated to be around 500 in 2000.
History
Flat Lick was first settled in the late 1700s by a group of settlers from North Carolina. The town was named after a nearby salt lick, which was used by animals to obtain salt. The town was officially established in 1818 and was incorporated in 1820.
The town was an important stop on the Wilderness Road, which was the main route used by settlers to travel from the east coast to the west. The town was also an important stop on the Cumberland Gap Railroad, which was built in the late 1800s.
Flat Lick was an important center for the timber industry in the late 1800s and early 1900s. The town was also home to several coal mines, which provided employment for many of the town’s residents.
Geography
Flat Lick is located in the foothills of the Appalachian Mountains, approximately 20 miles south of Barbourville. The town is situated in a valley between two mountains, which are known as Flat Lick Mountain and Big Lick Mountain. The town is surrounded by forests and is home to several creeks and streams.
The climate in Flat Lick is humid and subtropical, with hot summers and mild winters. The average annual temperature is around 60 degrees Fahrenheit.
Economy
The economy of Flat Lick is largely based on agriculture and forestry. The town is home to several farms, which produce a variety of crops, including corn, soybeans, and tobacco. The town is also home to several sawmills, which produce lumber for the local market.
The town is also home to several small businesses, including a grocery store, a hardware store, and a gas station.
Demographics
The population of Flat Lick was estimated to be around 500 in 2000. The town is predominantly white, with a small African American population. The median household income in Flat Lick is around $30,000. The town has a high rate of poverty, with around 25% of the population living below the poverty line.
Conclusion
Flat Lick is a small unincorporated community located in Knox County, Kentucky. It is situated in the foothills of the Appalachian Mountains, approximately 20 miles south of Barbourville. The population of Flat Lick was estimated to be around 500 in 2000. The town is predominantly white, with a small African American population. The economy of Flat Lick is largely based on agriculture and forestry. The town is home to several small businesses, including a grocery store, a hardware store, and a gas station. The median household income in Flat Lick is around $30,000. The town has a high rate of poverty, with around 25% of the population living below the poverty line.
Common Questions
What is Per Capita Income in Flat Lick?
Per Capita income in Flat Lick is $6,485.
What is the Median Family Income in Flat Lick?
Median Family Income in Flat Lick is $16,990.
What is the Median Household income in Flat Lick?
Median Household Income in Flat Lick is $16,327.
What is Inequality or Gini Index in Flat Lick?
Inequality or Gini Index in Flat Lick is 0.39.
What is the Total Population of Flat Lick?
Total Population of Flat Lick is 883.
What is the Total Male Population of Flat Lick?
Total Male Population of Flat Lick is 469.
What is the Total Female Population of Flat Lick?
Total Female Population of Flat Lick is 414.
What is the Ratio of Males per 100 Females in Flat Lick?
There are 113.29 Males per 100 Females in Flat Lick.
What is the Ratio of Females per 100 Males in Flat Lick?
There are 88.27 Females per 100 Males in Flat Lick.
What is the Median Population Age in Flat Lick?
Median Population Age in Flat Lick is 33.8 Years.
What is the Average Family Size in Flat Lick
Average Family Size in Flat Lick is 3.4 People.
What is the Average Household Size in Flat Lick
Average Household Size in Flat Lick is 3.2 People.
How Large is the Labor Force in Flat Lick?
There are 164 People in the Labor Forcein in Flat Lick.
What is the Percentage of People in the Labor Force in Flat Lick?
26.5% of People are in the Labor Force in Flat Lick.
What is the Unemployment Rate in Flat Lick?
Unemployment Rate in Flat Lick is 16.5%.