Eden, SD Map & Demographics
Eden Map
Eden Overview
$161,264
PER CAPITA INCOME
$250,001
AVG FAMILY INCOME
$250,001
AVG HOUSEHOLD INCOME
73.9%
WAGE / INCOME GAP [ % ]
26.1¢/ $1
WAGE / INCOME GAP [ $ ]
0.37
INEQUALITY / GINI INDEX
173
TOTAL POPULATION
76
MALE POPULATION
97
FEMALE POPULATION
78.35
MALES / 100 FEMALES
127.63
FEMALES / 100 MALES
59.7
MEDIAN AGE
2.3
AVG FAMILY SIZE
2.1
AVG HOUSEHOLD SIZE
123
LABOR FORCE [ PEOPLE ]
87.2%
PERCENT IN LABOR FORCE
Eden Zip Codes
Eden Area Codes
Income in Eden
Income Overview in Eden
Per Capita Income in Eden is $161,264, while median incomes of families and households are $250,001 and $250,001 respectively.
| Characteristic | Number | Measure |
| Per Capita Income | 173 | $161,264 |
| Median Family Income | 65 | $250,001 |
| Mean Family Income | 65 | $423,935 |
| Median Household Income | 83 | $250,001 |
| Mean Household Income | 83 | $343,761 |
| Income Deficit | 65 | $0 |
| Wage / Income Gap (%) | 173 | 73.89% |
| Wage / Income Gap ($) | 173 | 26.11¢ per $1 |
| Gini / Inequality Index | 173 | 0.37 |
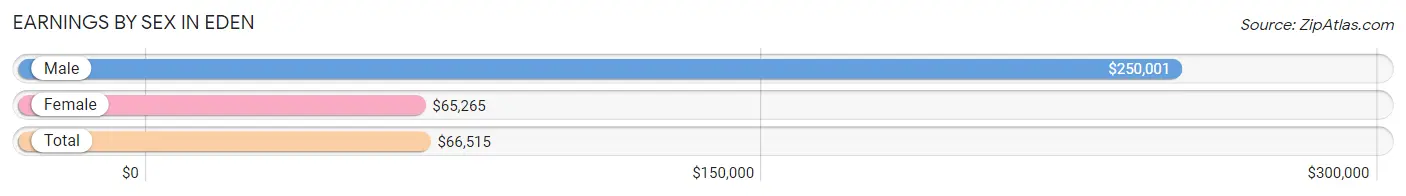
Earnings by Sex in Eden
Average Earnings in Eden are $66,515, $250,001 for men and $65,265 for women, a difference of 73.9%.
| Sex | Number | Average Earnings |
| Male | 69 (53.1%) | $250,001 |
| Female | 61 (46.9%) | $65,265 |
| Total | 130 (100.0%) | $66,515 |
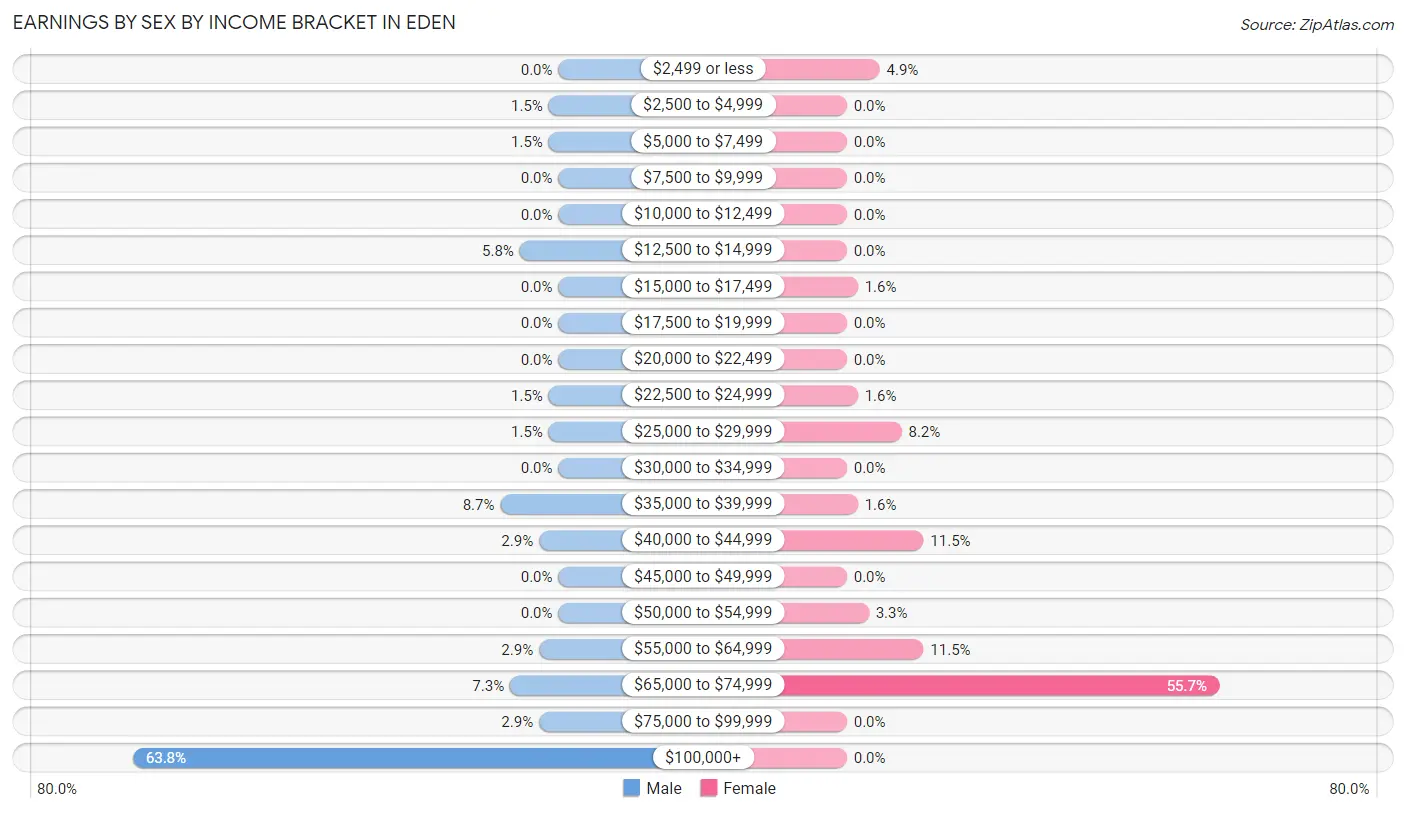
Earnings by Sex by Income Bracket in Eden
The most common earnings brackets in Eden are $100,000+ for men (44 | 63.8%) and $65,000 to $74,999 for women (34 | 55.7%).
| Income | Male | Female |
| $2,499 or less | 0 (0.0%) | 3 (4.9%) |
| $2,500 to $4,999 | 1 (1.5%) | 0 (0.0%) |
| $5,000 to $7,499 | 1 (1.5%) | 0 (0.0%) |
| $7,500 to $9,999 | 0 (0.0%) | 0 (0.0%) |
| $10,000 to $12,499 | 0 (0.0%) | 0 (0.0%) |
| $12,500 to $14,999 | 4 (5.8%) | 0 (0.0%) |
| $15,000 to $17,499 | 0 (0.0%) | 1 (1.6%) |
| $17,500 to $19,999 | 0 (0.0%) | 0 (0.0%) |
| $20,000 to $22,499 | 0 (0.0%) | 0 (0.0%) |
| $22,500 to $24,999 | 1 (1.5%) | 1 (1.6%) |
| $25,000 to $29,999 | 1 (1.5%) | 5 (8.2%) |
| $30,000 to $34,999 | 0 (0.0%) | 0 (0.0%) |
| $35,000 to $39,999 | 6 (8.7%) | 1 (1.6%) |
| $40,000 to $44,999 | 2 (2.9%) | 7 (11.5%) |
| $45,000 to $49,999 | 0 (0.0%) | 0 (0.0%) |
| $50,000 to $54,999 | 0 (0.0%) | 2 (3.3%) |
| $55,000 to $64,999 | 2 (2.9%) | 7 (11.5%) |
| $65,000 to $74,999 | 5 (7.2%) | 34 (55.7%) |
| $75,000 to $99,999 | 2 (2.9%) | 0 (0.0%) |
| $100,000+ | 44 (63.8%) | 0 (0.0%) |
| Total | 69 (100.0%) | 61 (100.0%) |
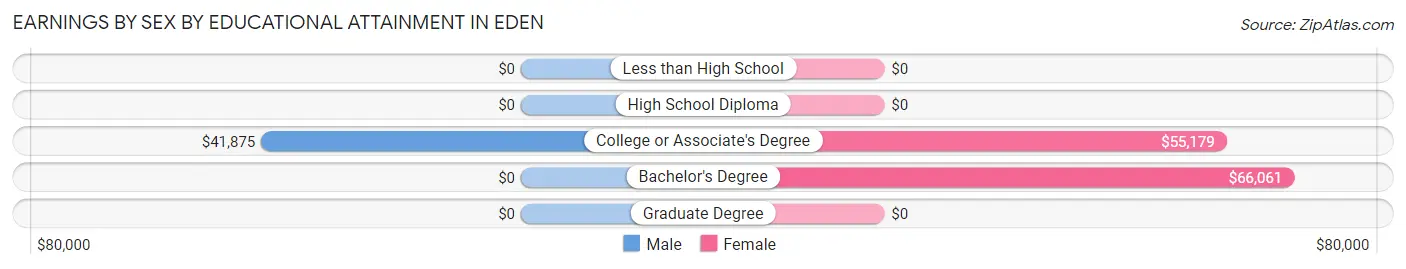
Earnings by Sex by Educational Attainment in Eden
Average earnings in Eden are $250,001 for men and $65,227 for women, a difference of 73.9%. Men with an educational attainment of college or associate's degree enjoy the highest average annual earnings of $41,875, while those with college or associate's degree education earn the least with $41,875. Women with an educational attainment of bachelor's degree earn the most with the average annual earnings of $66,061, while those with college or associate's degree education have the smallest earnings of $55,179.
| Educational Attainment | Male Income | Female Income |
| Less than High School | - | - |
| High School Diploma | - | - |
| College or Associate's Degree | $41,875 | $55,179 |
| Bachelor's Degree | - | - |
| Graduate Degree | - | - |
| Total | $250,001 | $65,227 |
Family Income in Eden
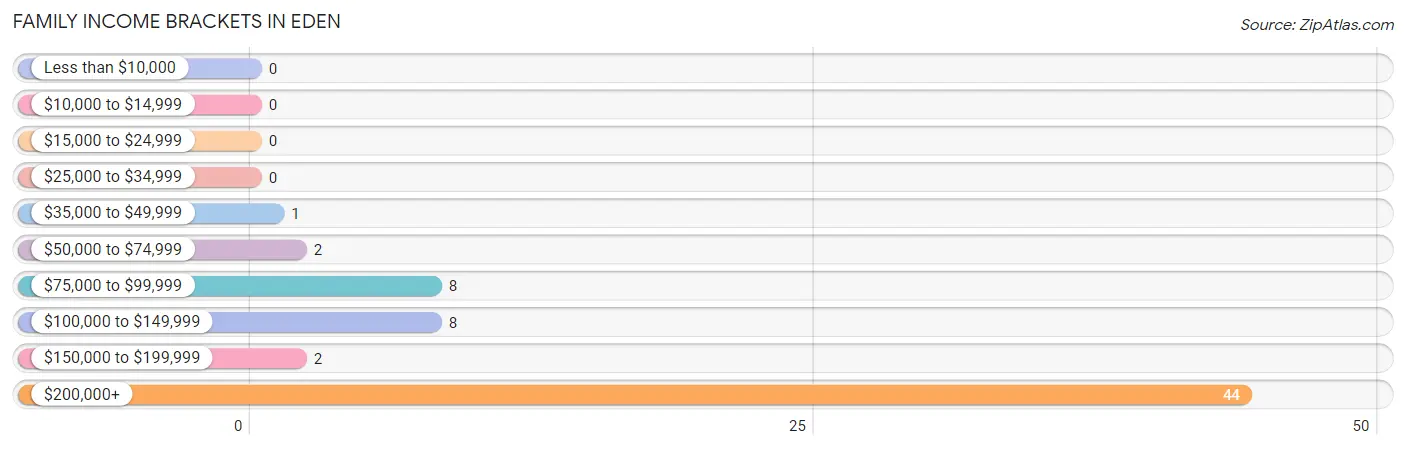
Family Income Brackets in Eden
According to the Eden family income data, there are 44 families falling into the $200,000+ income range, which is the most common income bracket and makes up 67.7% of all families.
| Income Bracket | # Families | % Families |
| Less than $10,000 | 0 | 0.0% |
| $10,000 to $14,999 | 0 | 0.0% |
| $15,000 to $24,999 | 0 | 0.0% |
| $25,000 to $34,999 | 0 | 0.0% |
| $35,000 to $49,999 | 1 | 1.5% |
| $50,000 to $74,999 | 2 | 3.1% |
| $75,000 to $99,999 | 8 | 12.3% |
| $100,000 to $149,999 | 8 | 12.3% |
| $150,000 to $199,999 | 2 | 3.1% |
| $200,000+ | 44 | 67.7% |
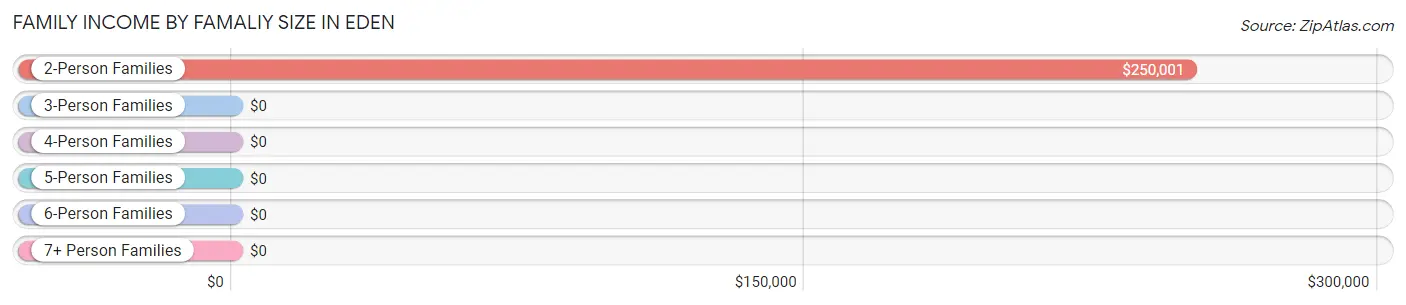
Family Income by Famaliy Size in Eden
2-person families (55 | 84.6%) account for the highest median family income in Eden with $250,001 per family, while 2-person families (55 | 84.6%) have the highest median income of $125,000 per family member.
| Income Bracket | # Families | Median Income |
| 2-Person Families | 55 (84.6%) | $250,001 |
| 3-Person Families | 0 (0.0%) | $0 |
| 4-Person Families | 2 (3.1%) | $0 |
| 5-Person Families | 8 (12.3%) | $0 |
| 6-Person Families | 0 (0.0%) | $0 |
| 7+ Person Families | 0 (0.0%) | $0 |
| Total | 65 (100.0%) | $250,001 |
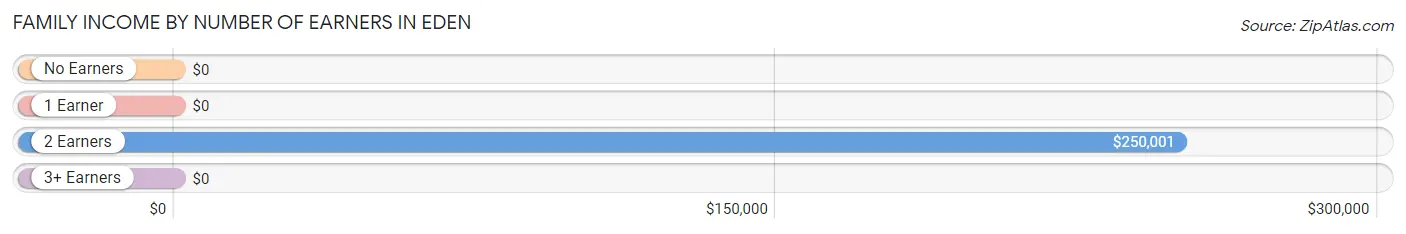
Family Income by Number of Earners in Eden
| Number of Earners | # Families | Median Income |
| No Earners | 1 (1.5%) | $0 |
| 1 Earner | 6 (9.2%) | $0 |
| 2 Earners | 58 (89.2%) | $250,001 |
| 3+ Earners | 0 (0.0%) | $0 |
| Total | 65 (100.0%) | $250,001 |
Household Income in Eden
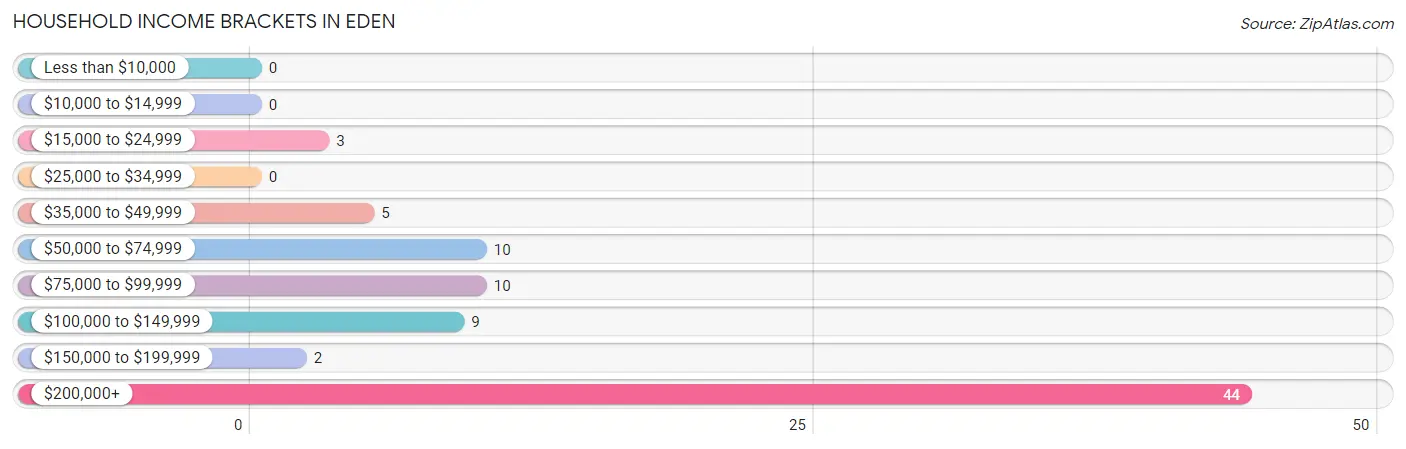
Household Income Brackets in Eden
With 44 households falling in the category, the $200,000+ income range is the most frequent in Eden, accounting for 53.0% of all households.
| Income Bracket | # Households | % Households |
| Less than $10,000 | 0 | 0.0% |
| $10,000 to $14,999 | 0 | 0.0% |
| $15,000 to $24,999 | 3 | 3.6% |
| $25,000 to $34,999 | 0 | 0.0% |
| $35,000 to $49,999 | 5 | 6.0% |
| $50,000 to $74,999 | 10 | 12.0% |
| $75,000 to $99,999 | 10 | 12.0% |
| $100,000 to $149,999 | 9 | 10.8% |
| $150,000 to $199,999 | 2 | 2.4% |
| $200,000+ | 44 | 53.0% |
Household Income by Householder Age in Eden
The median household income in Eden is $250,001, with the highest median household income of $250,001 found in the 45 to 64 years age bracket for the primary householder. A total of 46 households (55.4%) fall into this category. Meanwhile, the 15 to 24 years age bracket for the primary householder has the lowest median household income of $0, with 1 households (1.2%) in this group.
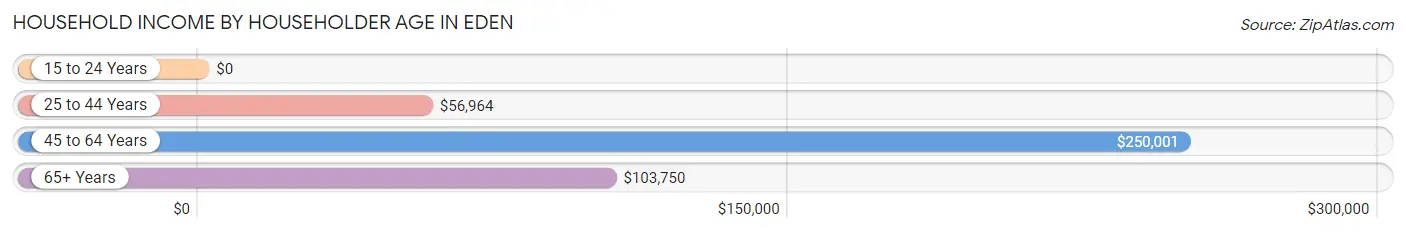
| Income Bracket | # Households | Median Income |
| 15 to 24 Years | 1 (1.2%) | $0 |
| 25 to 44 Years | 19 (22.9%) | $56,964 |
| 45 to 64 Years | 46 (55.4%) | $250,001 |
| 65+ Years | 17 (20.5%) | $103,750 |
| Total | 83 (100.0%) | $250,001 |
Poverty in Eden
Income Below Poverty by Sex and Age in Eden
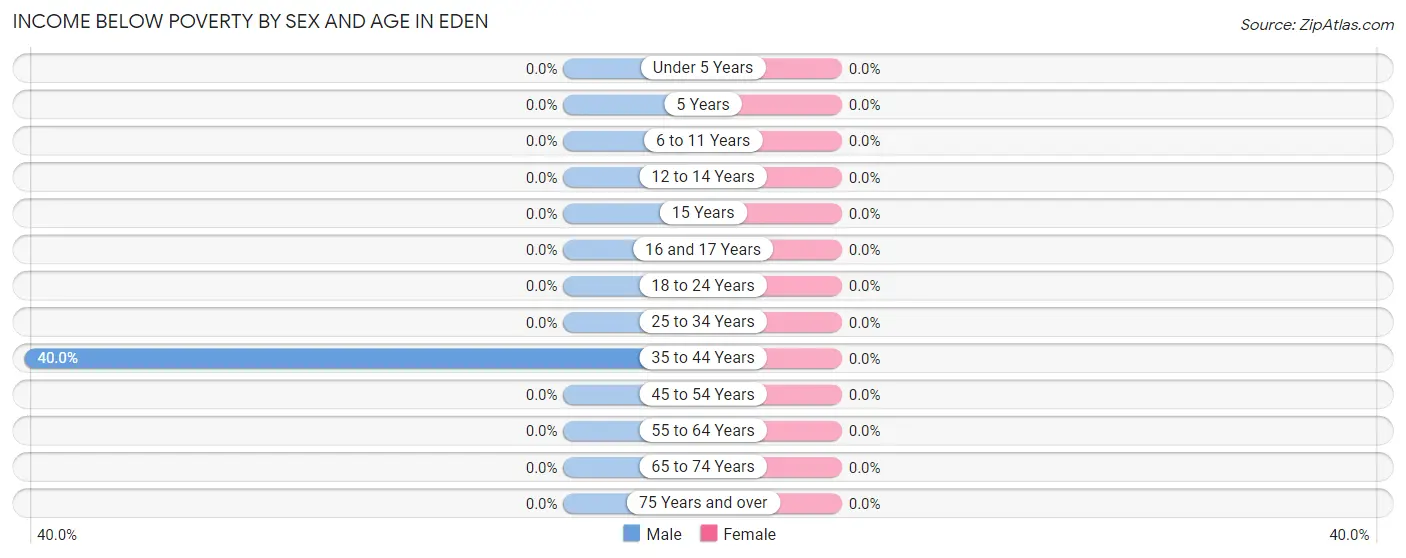
| Age Bracket | Male | Female |
| Under 5 Years | 0 (0.0%) | 0 (0.0%) |
| 5 Years | 0 (0.0%) | 0 (0.0%) |
| 6 to 11 Years | 0 (0.0%) | 0 (0.0%) |
| 12 to 14 Years | 0 (0.0%) | 0 (0.0%) |
| 15 Years | 0 (0.0%) | 0 (0.0%) |
| 16 and 17 Years | 0 (0.0%) | 0 (0.0%) |
| 18 to 24 Years | 0 (0.0%) | 0 (0.0%) |
| 25 to 34 Years | 0 (0.0%) | 0 (0.0%) |
| 35 to 44 Years | 4 (40.0%) | 0 (0.0%) |
| 45 to 54 Years | 0 (0.0%) | 0 (0.0%) |
| 55 to 64 Years | 0 (0.0%) | 0 (0.0%) |
| 65 to 74 Years | 0 (0.0%) | 0 (0.0%) |
| 75 Years and over | 0 (0.0%) | 0 (0.0%) |
| Total | 4 (5.3%) | 0 (0.0%) |
Income Above Poverty by Sex and Age in Eden
According to the poverty statistics in Eden, males aged under 5 years and females aged under 5 years are the age groups that are most secure financially, with 100.0% of males and 100.0% of females in these age groups living above the poverty line.
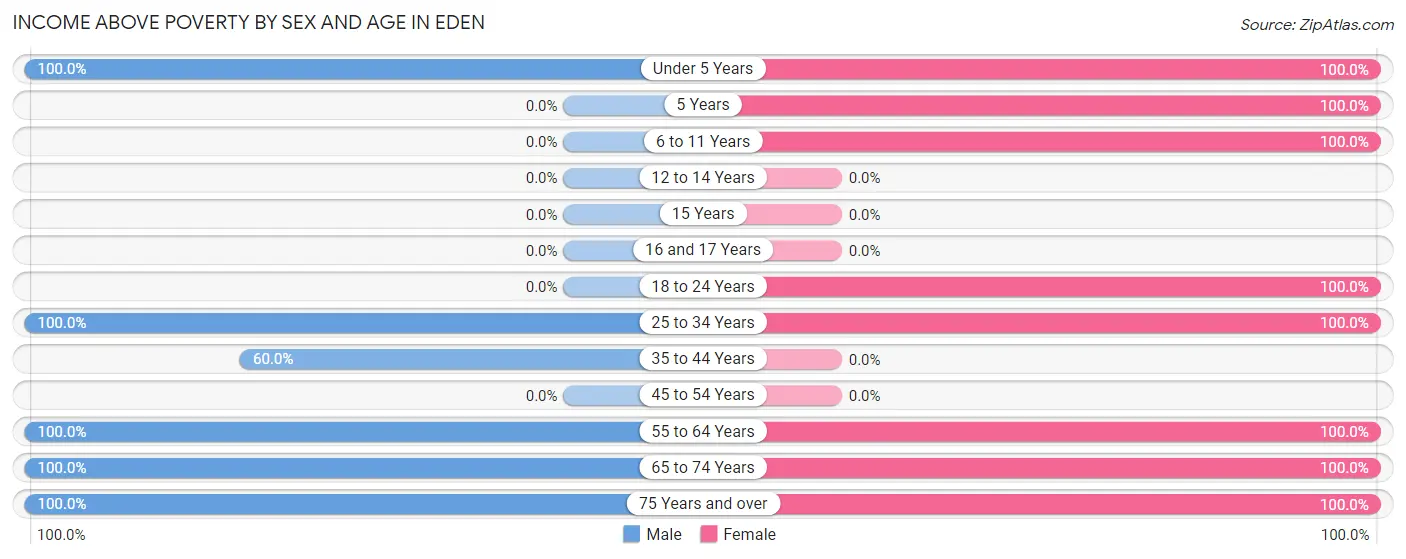
| Age Bracket | Male | Female |
| Under 5 Years | 4 (100.0%) | 18 (100.0%) |
| 5 Years | 0 (0.0%) | 2 (100.0%) |
| 6 to 11 Years | 0 (0.0%) | 8 (100.0%) |
| 12 to 14 Years | 0 (0.0%) | 0 (0.0%) |
| 15 Years | 0 (0.0%) | 0 (0.0%) |
| 16 and 17 Years | 0 (0.0%) | 0 (0.0%) |
| 18 to 24 Years | 0 (0.0%) | 1 (100.0%) |
| 25 to 34 Years | 3 (100.0%) | 18 (100.0%) |
| 35 to 44 Years | 6 (60.0%) | 0 (0.0%) |
| 45 to 54 Years | 0 (0.0%) | 0 (0.0%) |
| 55 to 64 Years | 44 (100.0%) | 38 (100.0%) |
| 65 to 74 Years | 10 (100.0%) | 9 (100.0%) |
| 75 Years and over | 5 (100.0%) | 3 (100.0%) |
| Total | 72 (94.7%) | 97 (100.0%) |
Income Below Poverty Among Married-Couple Families in Eden
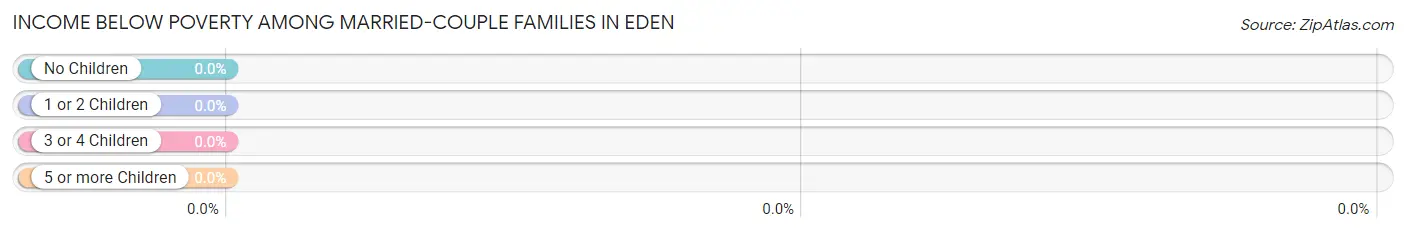
| Children | Above Poverty | Below Poverty |
| No Children | 55 (100.0%) | 0 (0.0%) |
| 1 or 2 Children | 2 (100.0%) | 0 (0.0%) |
| 3 or 4 Children | 8 (100.0%) | 0 (0.0%) |
| 5 or more Children | 0 (0.0%) | 0 (0.0%) |
| Total | 65 (100.0%) | 0 (0.0%) |
Income Below Poverty Among Single-Parent Households in Eden
| Children | Single Father | Single Mother |
| No Children | 0 (0.0%) | 0 (0.0%) |
| 1 or 2 Children | 0 (0.0%) | 0 (0.0%) |
| 3 or 4 Children | 0 (0.0%) | 0 (0.0%) |
| 5 or more Children | 0 (0.0%) | 0 (0.0%) |
| Total | 0 (0.0%) | 0 (0.0%) |
Income Below Poverty Among Married-Couple vs Single-Parent Households in Eden
| Children | Married-Couple Families | Single-Parent Households |
| No Children | 0 (0.0%) | 0 (0.0%) |
| 1 or 2 Children | 0 (0.0%) | 0 (0.0%) |
| 3 or 4 Children | 0 (0.0%) | 0 (0.0%) |
| 5 or more Children | 0 (0.0%) | 0 (0.0%) |
| Total | 0 (0.0%) | 0 (0.0%) |
Race in Eden
The most populous races in Eden are , and White / Caucasian (173 | 100.0%).
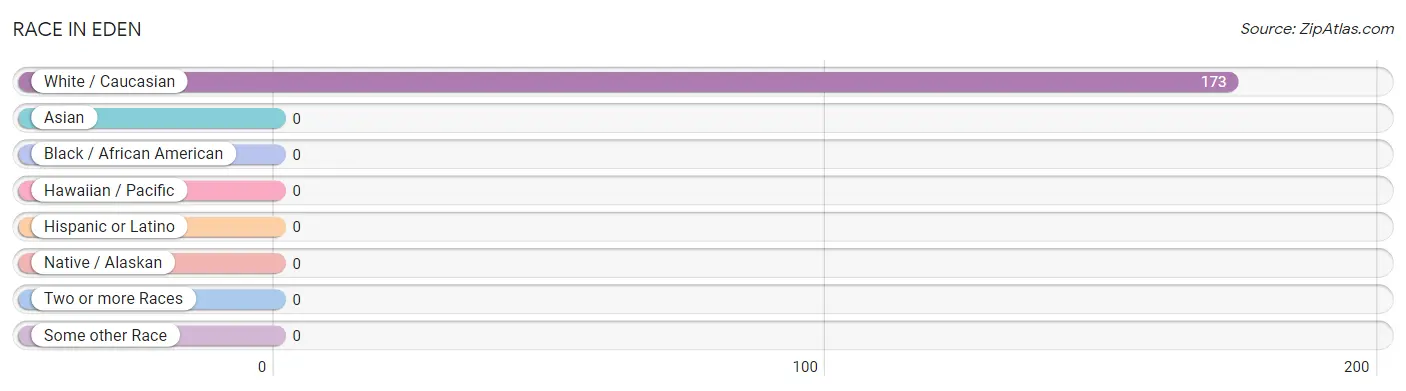
| Race | # Population | % Population |
| Asian | 0 | 0.0% |
| Black / African American | 0 | 0.0% |
| Hawaiian / Pacific | 0 | 0.0% |
| Hispanic or Latino | 0 | 0.0% |
| Native / Alaskan | 0 | 0.0% |
| White / Caucasian | 173 | 100.0% |
| Two or more Races | 0 | 0.0% |
| Some other Race | 0 | 0.0% |
| Total | 173 | 100.0% |
Ancestry in Eden
The most populous ancestries reported in Eden are German (73 | 42.2%), Irish (10 | 5.8%), Scandinavian (9 | 5.2%), Austrian (6 | 3.5%), and Finnish (6 | 3.5%), together accounting for 60.1% of all Eden residents.
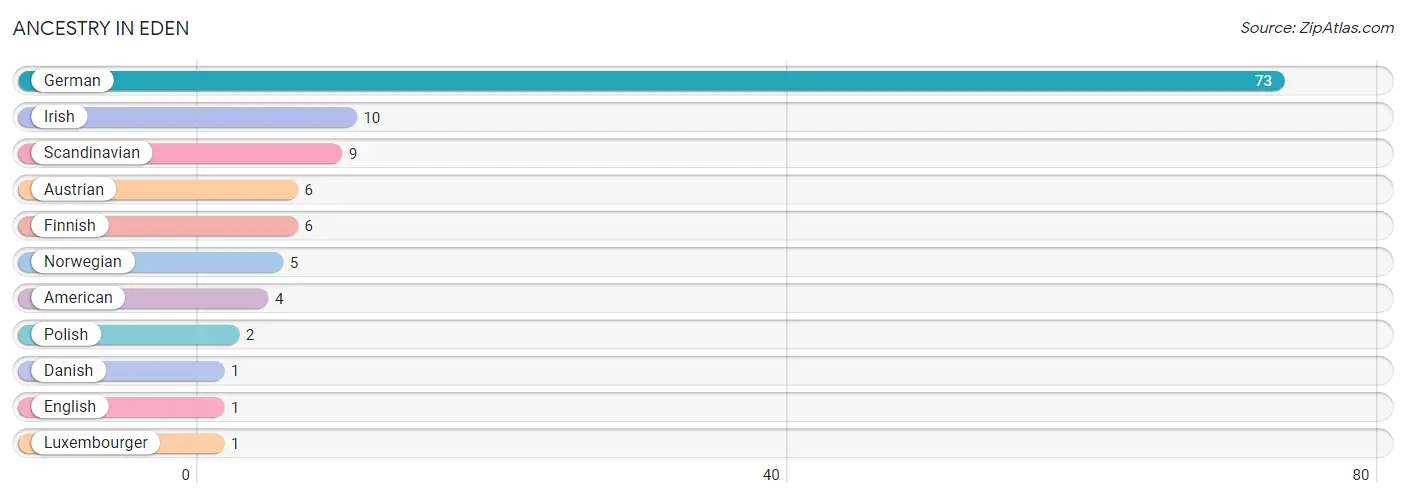
| Ancestry | # Population | % Population |
| American | 4 | 2.3% |
| Austrian | 6 | 3.5% |
| Danish | 1 | 0.6% |
| English | 1 | 0.6% |
| Finnish | 6 | 3.5% |
| German | 73 | 42.2% |
| Irish | 10 | 5.8% |
| Luxembourger | 1 | 0.6% |
| Norwegian | 5 | 2.9% |
| Polish | 2 | 1.2% |
| Scandinavian | 9 | 5.2% | View All 11 Rows |
Immigrants in Eden

| Immigration Origin | # Population | % Population | View All 0 Rows |
Sex and Age in Eden
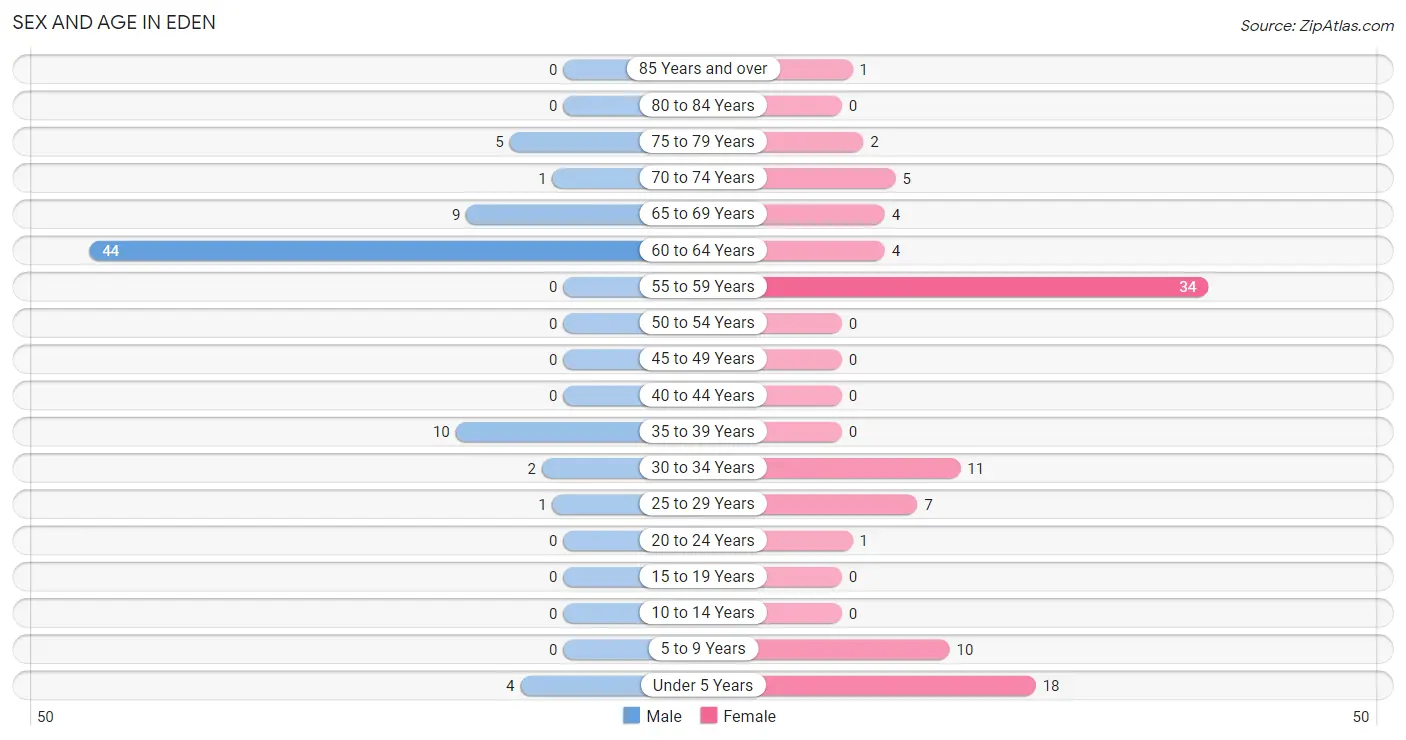
Sex and Age in Eden
The most populous age groups in Eden are 60 to 64 Years (44 | 57.9%) for men and 55 to 59 Years (34 | 35.0%) for women.
| Age Bracket | Male | Female |
| Under 5 Years | 4 (5.3%) | 18 (18.6%) |
| 5 to 9 Years | 0 (0.0%) | 10 (10.3%) |
| 10 to 14 Years | 0 (0.0%) | 0 (0.0%) |
| 15 to 19 Years | 0 (0.0%) | 0 (0.0%) |
| 20 to 24 Years | 0 (0.0%) | 1 (1.0%) |
| 25 to 29 Years | 1 (1.3%) | 7 (7.2%) |
| 30 to 34 Years | 2 (2.6%) | 11 (11.3%) |
| 35 to 39 Years | 10 (13.2%) | 0 (0.0%) |
| 40 to 44 Years | 0 (0.0%) | 0 (0.0%) |
| 45 to 49 Years | 0 (0.0%) | 0 (0.0%) |
| 50 to 54 Years | 0 (0.0%) | 0 (0.0%) |
| 55 to 59 Years | 0 (0.0%) | 34 (35.0%) |
| 60 to 64 Years | 44 (57.9%) | 4 (4.1%) |
| 65 to 69 Years | 9 (11.8%) | 4 (4.1%) |
| 70 to 74 Years | 1 (1.3%) | 5 (5.1%) |
| 75 to 79 Years | 5 (6.6%) | 2 (2.1%) |
| 80 to 84 Years | 0 (0.0%) | 0 (0.0%) |
| 85 Years and over | 0 (0.0%) | 1 (1.0%) |
| Total | 76 (100.0%) | 97 (100.0%) |
Families and Households in Eden
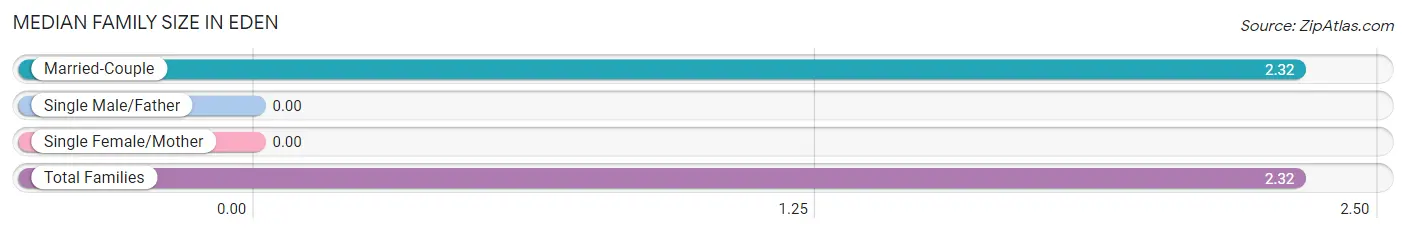
Median Family Size in Eden
| Family Type | # Families | Family Size |
| Married-Couple | 65 (100.0%) | 2.32 |
| Single Male/Father | 0 (0.0%) | - |
| Single Female/Mother | 0 (0.0%) | - |
| Total Families | 65 (100.0%) | 2.32 |
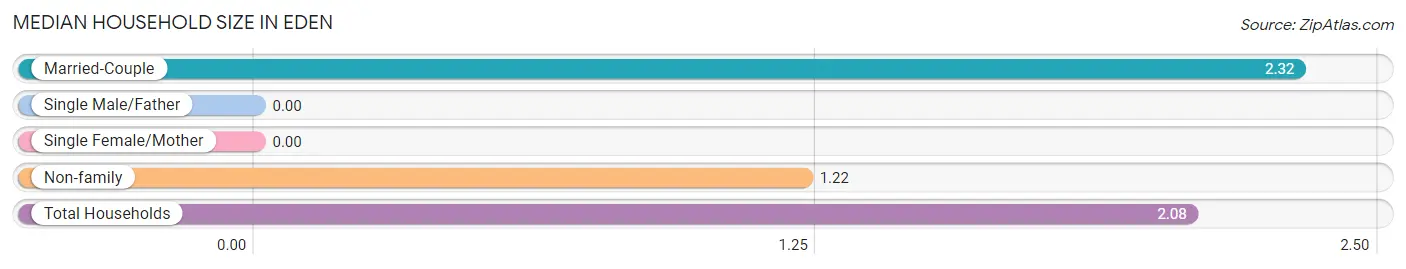
Median Household Size in Eden
| Household Type | # Households | Household Size |
| Married-Couple | 65 (78.3%) | 2.32 |
| Single Male/Father | 0 (0.0%) | - |
| Single Female/Mother | 0 (0.0%) | - |
| Non-family | 18 (21.7%) | 1.22 |
| Total Households | 83 (100.0%) | 2.08 |
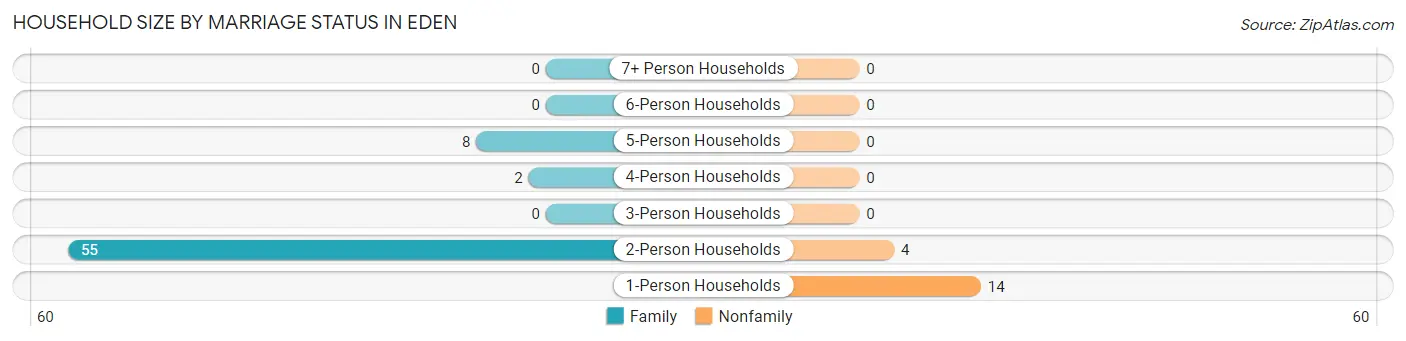
Household Size by Marriage Status in Eden
Out of a total of 83 households in Eden, 65 (78.3%) are family households, while 18 (21.7%) are nonfamily households. The most numerous type of family households are 2-person households, comprising 55, and the most common type of nonfamily households are 1-person households, comprising 14.
| Household Size | Family Households | Nonfamily Households |
| 1-Person Households | - | 14 (16.9%) |
| 2-Person Households | 55 (66.3%) | 4 (4.8%) |
| 3-Person Households | 0 (0.0%) | 0 (0.0%) |
| 4-Person Households | 2 (2.4%) | 0 (0.0%) |
| 5-Person Households | 8 (9.6%) | 0 (0.0%) |
| 6-Person Households | 0 (0.0%) | 0 (0.0%) |
| 7+ Person Households | 0 (0.0%) | 0 (0.0%) |
| Total | 65 (78.3%) | 18 (21.7%) |
Female Fertility in Eden
Fertility by Age in Eden
| Age Bracket | Women with Births | Births / 1,000 Women |
| 15 to 19 years | 0 (0.0%) | 0.0 |
| 20 to 34 years | 0 (0.0%) | 0.0 |
| 35 to 50 years | 0 (0.0%) | 0.0 |
| Total | 0 (0.0%) | 0.0 |
Fertility by Age by Marriage Status in Eden
| Age Bracket | Married | Unmarried |
| 15 to 19 years | 0 (0.0%) | 0 (0.0%) |
| 20 to 34 years | 0 (0.0%) | 0 (0.0%) |
| 35 to 50 years | 0 (0.0%) | 0 (0.0%) |
| Total | 0 (0.0%) | 0 (0.0%) |
Fertility by Education in Eden
| Educational Attainment | Women with Births | Births / 1,000 Women |
| Less than High School | 0 (0.0%) | 0.0 |
| High School Diploma | 0 (0.0%) | 0.0 |
| College or Associate's Degree | 0 (0.0%) | 0.0 |
| Bachelor's Degree | 0 (0.0%) | 0.0 |
| Graduate Degree | 0 (0.0%) | 0.0 |
| Total | 0 (0.0%) | 0.0 |
Fertility by Education by Marriage Status in Eden
| Educational Attainment | Married | Unmarried |
| Less than High School | 0 (0.0%) | 0 (0.0%) |
| High School Diploma | 0 (0.0%) | 0 (0.0%) |
| College or Associate's Degree | 0 (0.0%) | 0 (0.0%) |
| Bachelor's Degree | 0 (0.0%) | 0 (0.0%) |
| Graduate Degree | 0 (0.0%) | 0 (0.0%) |
| Total | 0 (0.0%) | 0 (0.0%) |
Employment Characteristics in Eden
Employment by Class of Employer in Eden
Among the 123 employed individuals in Eden, private company employees (72 | 58.5%), federal government employees (33 | 26.8%), and self-employed (not incorporated) (7 | 5.7%) make up the most common classes of employment.
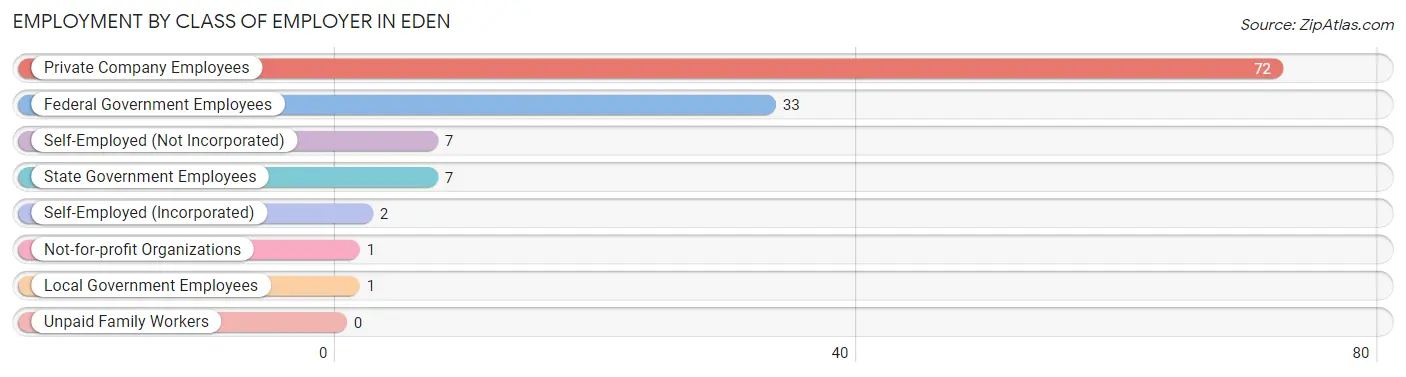
| Employer Class | # Employees | % Employees |
| Private Company Employees | 72 | 58.5% |
| Self-Employed (Incorporated) | 2 | 1.6% |
| Self-Employed (Not Incorporated) | 7 | 5.7% |
| Not-for-profit Organizations | 1 | 0.8% |
| Local Government Employees | 1 | 0.8% |
| State Government Employees | 7 | 5.7% |
| Federal Government Employees | 33 | 26.8% |
| Unpaid Family Workers | 0 | 0.0% |
| Total | 123 | 100.0% |
Employment Status by Age in Eden
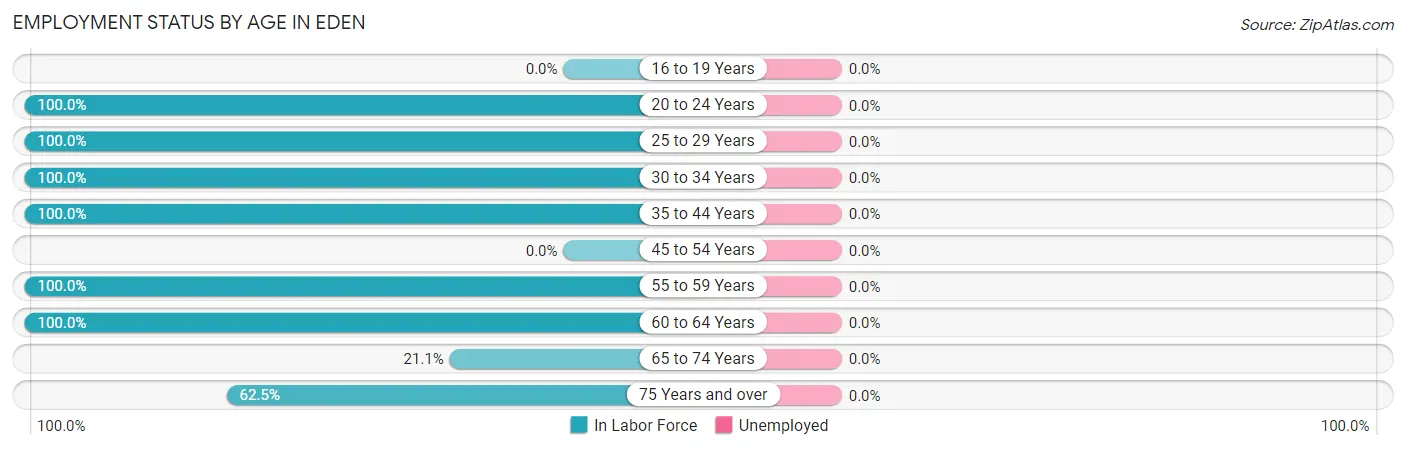
| Age Bracket | In Labor Force | Unemployed |
| 16 to 19 Years | 0 (0.0%) | 0 (0.0%) |
| 20 to 24 Years | 1 (100.0%) | 0 (0.0%) |
| 25 to 29 Years | 8 (100.0%) | 0 (0.0%) |
| 30 to 34 Years | 13 (100.0%) | 0 (0.0%) |
| 35 to 44 Years | 10 (100.0%) | 0 (0.0%) |
| 45 to 54 Years | 0 (0.0%) | 0 (0.0%) |
| 55 to 59 Years | 34 (100.0%) | 0 (0.0%) |
| 60 to 64 Years | 48 (100.0%) | 0 (0.0%) |
| 65 to 74 Years | 4 (21.1%) | 0 (0.0%) |
| 75 Years and over | 5 (62.5%) | 0 (0.0%) |
| Total | 123 (87.2%) | 0 (0.0%) |
Employment Status by Educational Attainment in Eden
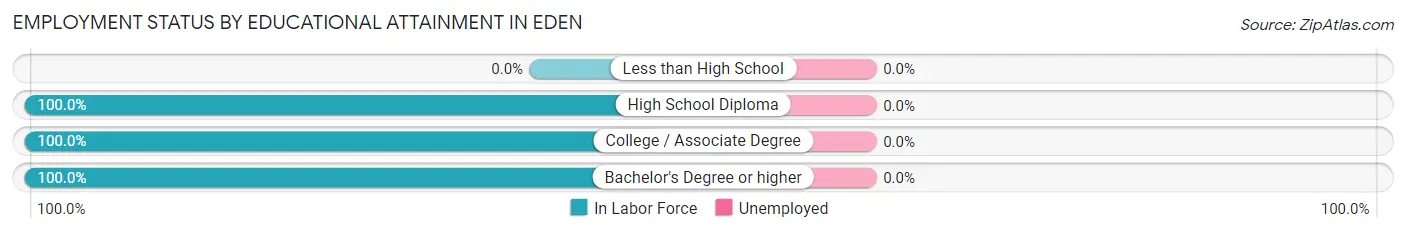
| Educational Attainment | In Labor Force | Unemployed |
| Less than High School | 0 (0.0%) | 0 (0.0%) |
| High School Diploma | 45 (100.0%) | 0 (0.0%) |
| College / Associate Degree | 16 (100.0%) | 0 (0.0%) |
| Bachelor's Degree or higher | 52 (100.0%) | 0 (0.0%) |
| Total | 113 (100.0%) | 0 (0.0%) |
Employment Occupations by Sex in Eden
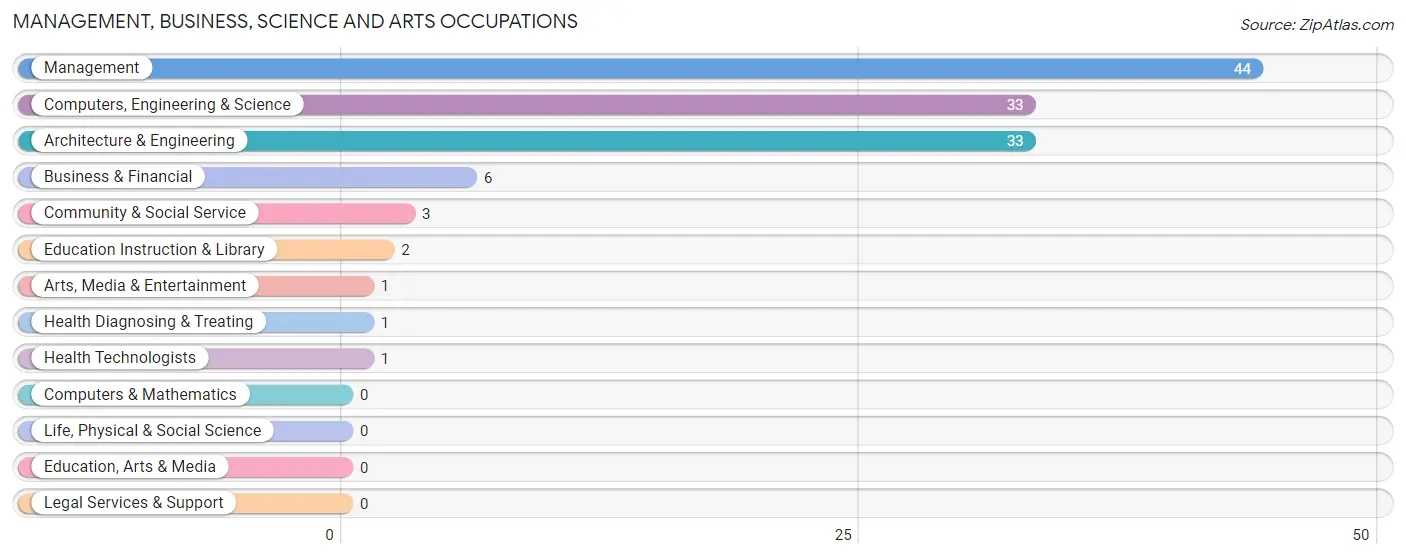
Management, Business, Science and Arts Occupations
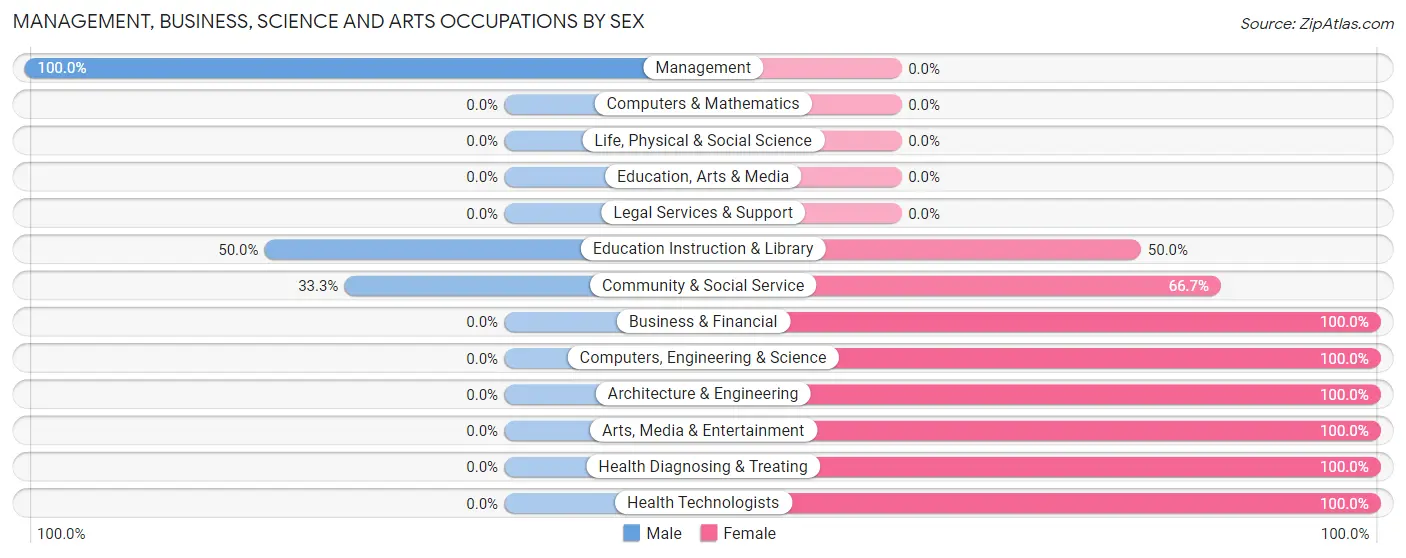
The most common Management, Business, Science and Arts occupations in Eden are Management (44 | 35.8%), Computers, Engineering & Science (33 | 26.8%), Architecture & Engineering (33 | 26.8%), Business & Financial (6 | 4.9%), and Community & Social Service (3 | 2.4%).
Management, Business, Science and Arts Occupations by Sex
Within the Management, Business, Science and Arts occupations in Eden, the most male-oriented occupations are Management (100.0%), Education Instruction & Library (50.0%), and Community & Social Service (33.3%), while the most female-oriented occupations are Business & Financial (100.0%), Computers, Engineering & Science (100.0%), and Architecture & Engineering (100.0%).
| Occupation | Male | Female |
| Management | 44 (100.0%) | 0 (0.0%) |
| Business & Financial | 0 (0.0%) | 6 (100.0%) |
| Computers, Engineering & Science | 0 (0.0%) | 33 (100.0%) |
| Computers & Mathematics | 0 (0.0%) | 0 (0.0%) |
| Architecture & Engineering | 0 (0.0%) | 33 (100.0%) |
| Life, Physical & Social Science | 0 (0.0%) | 0 (0.0%) |
| Community & Social Service | 1 (33.3%) | 2 (66.7%) |
| Education, Arts & Media | 0 (0.0%) | 0 (0.0%) |
| Legal Services & Support | 0 (0.0%) | 0 (0.0%) |
| Education Instruction & Library | 1 (50.0%) | 1 (50.0%) |
| Arts, Media & Entertainment | 0 (0.0%) | 1 (100.0%) |
| Health Diagnosing & Treating | 0 (0.0%) | 1 (100.0%) |
| Health Technologists | 0 (0.0%) | 1 (100.0%) |
| Total (Category) | 45 (51.7%) | 42 (48.3%) |
| Total (Overall) | 66 (53.7%) | 57 (46.3%) |
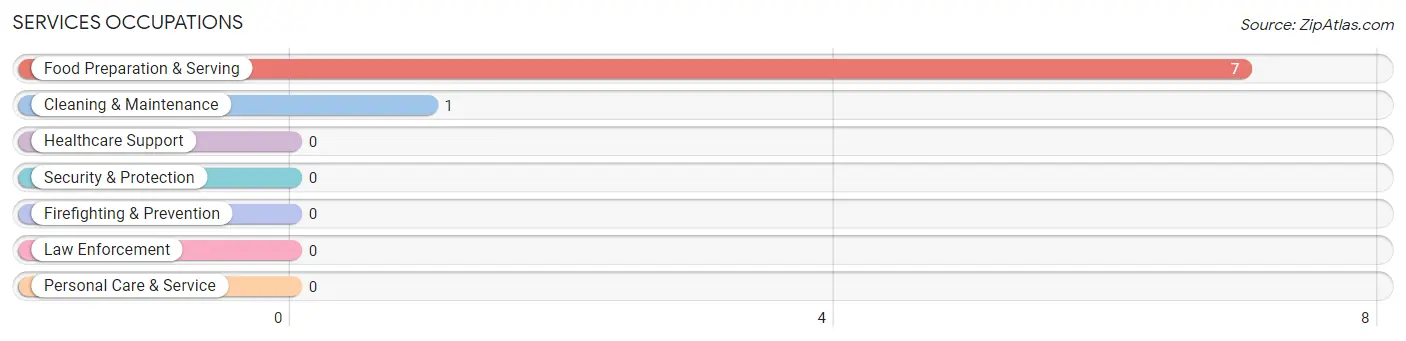
Services Occupations
The most common Services occupations in Eden are Food Preparation & Serving (7 | 5.7%), and Cleaning & Maintenance (1 | 0.8%).
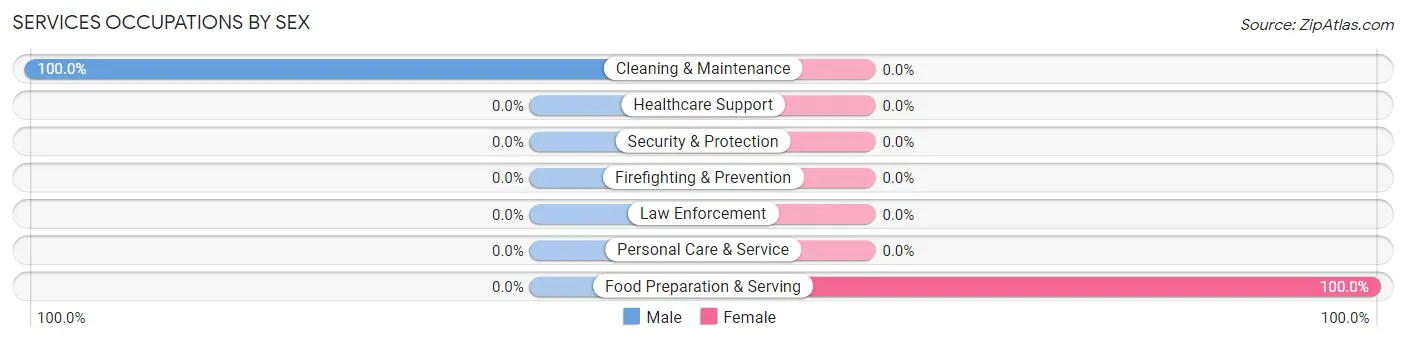
Services Occupations by Sex
| Occupation | Male | Female |
| Healthcare Support | 0 (0.0%) | 0 (0.0%) |
| Security & Protection | 0 (0.0%) | 0 (0.0%) |
| Firefighting & Prevention | 0 (0.0%) | 0 (0.0%) |
| Law Enforcement | 0 (0.0%) | 0 (0.0%) |
| Food Preparation & Serving | 0 (0.0%) | 7 (100.0%) |
| Cleaning & Maintenance | 1 (100.0%) | 0 (0.0%) |
| Personal Care & Service | 0 (0.0%) | 0 (0.0%) |
| Total (Category) | 1 (12.5%) | 7 (87.5%) |
| Total (Overall) | 66 (53.7%) | 57 (46.3%) |
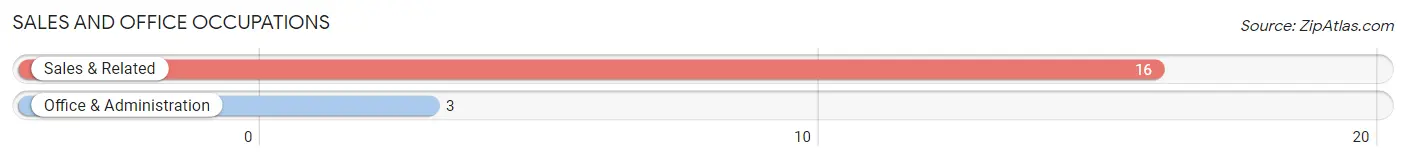
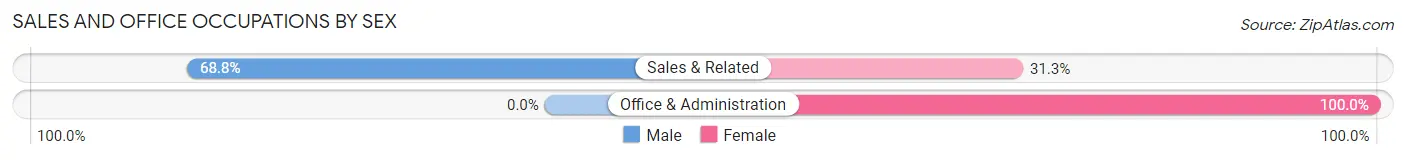
Sales and Office Occupations
The most common Sales and Office occupations in Eden are Sales & Related (16 | 13.0%), and Office & Administration (3 | 2.4%).
Sales and Office Occupations by Sex
| Occupation | Male | Female |
| Sales & Related | 11 (68.8%) | 5 (31.2%) |
| Office & Administration | 0 (0.0%) | 3 (100.0%) |
| Total (Category) | 11 (57.9%) | 8 (42.1%) |
| Total (Overall) | 66 (53.7%) | 57 (46.3%) |
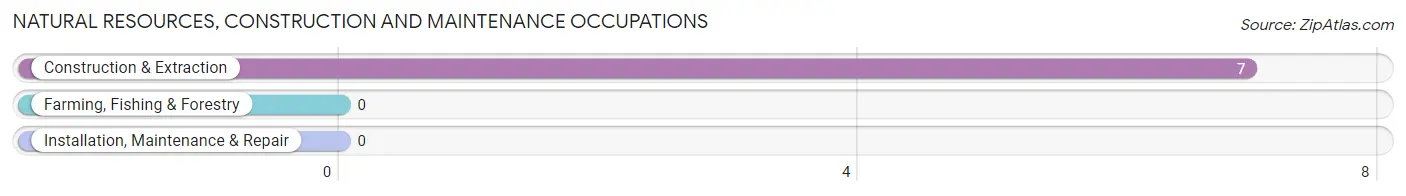
Natural Resources, Construction and Maintenance Occupations
The most common Natural Resources, Construction and Maintenance occupations in Eden are , and Construction & Extraction (7 | 5.7%).
Natural Resources, Construction and Maintenance Occupations by Sex
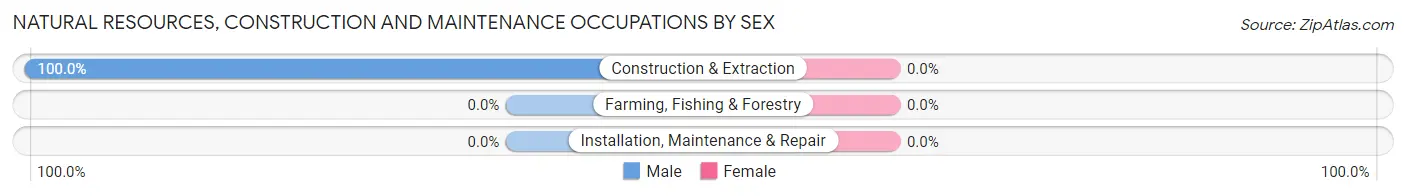
| Occupation | Male | Female |
| Farming, Fishing & Forestry | 0 (0.0%) | 0 (0.0%) |
| Construction & Extraction | 7 (100.0%) | 0 (0.0%) |
| Installation, Maintenance & Repair | 0 (0.0%) | 0 (0.0%) |
| Total (Category) | 7 (100.0%) | 0 (0.0%) |
| Total (Overall) | 66 (53.7%) | 57 (46.3%) |
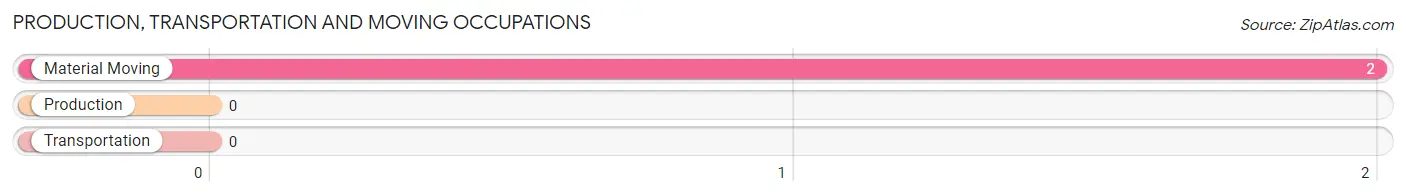
Production, Transportation and Moving Occupations
The most common Production, Transportation and Moving occupations in Eden are , and Material Moving (2 | 1.6%).
Production, Transportation and Moving Occupations by Sex
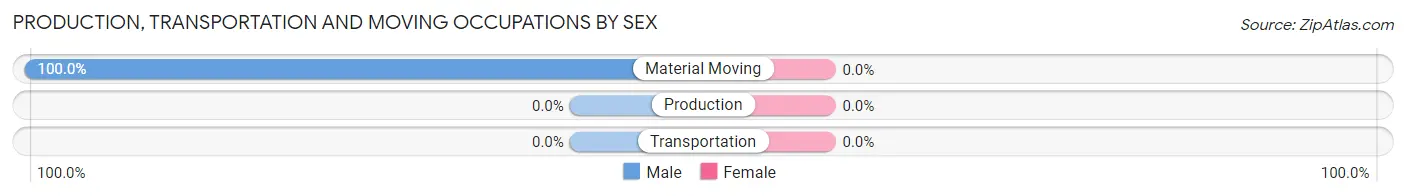
| Occupation | Male | Female |
| Production | 0 (0.0%) | 0 (0.0%) |
| Transportation | 0 (0.0%) | 0 (0.0%) |
| Material Moving | 2 (100.0%) | 0 (0.0%) |
| Total (Category) | 2 (100.0%) | 0 (0.0%) |
| Total (Overall) | 66 (53.7%) | 57 (46.3%) |
Employment Industries by Sex in Eden
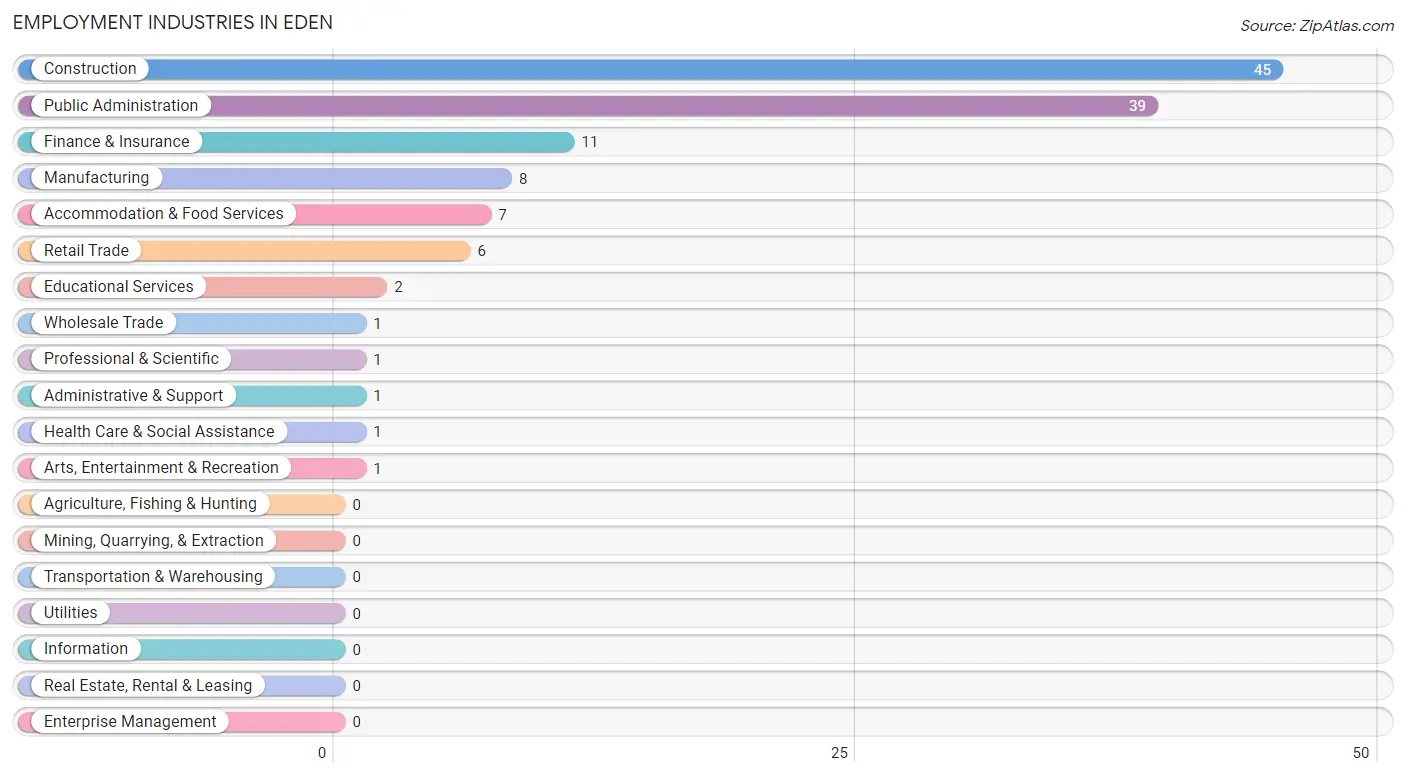
Employment Industries in Eden
The major employment industries in Eden include Construction (45 | 36.6%), Public Administration (39 | 31.7%), Finance & Insurance (11 | 8.9%), Manufacturing (8 | 6.5%), and Accommodation & Food Services (7 | 5.7%).
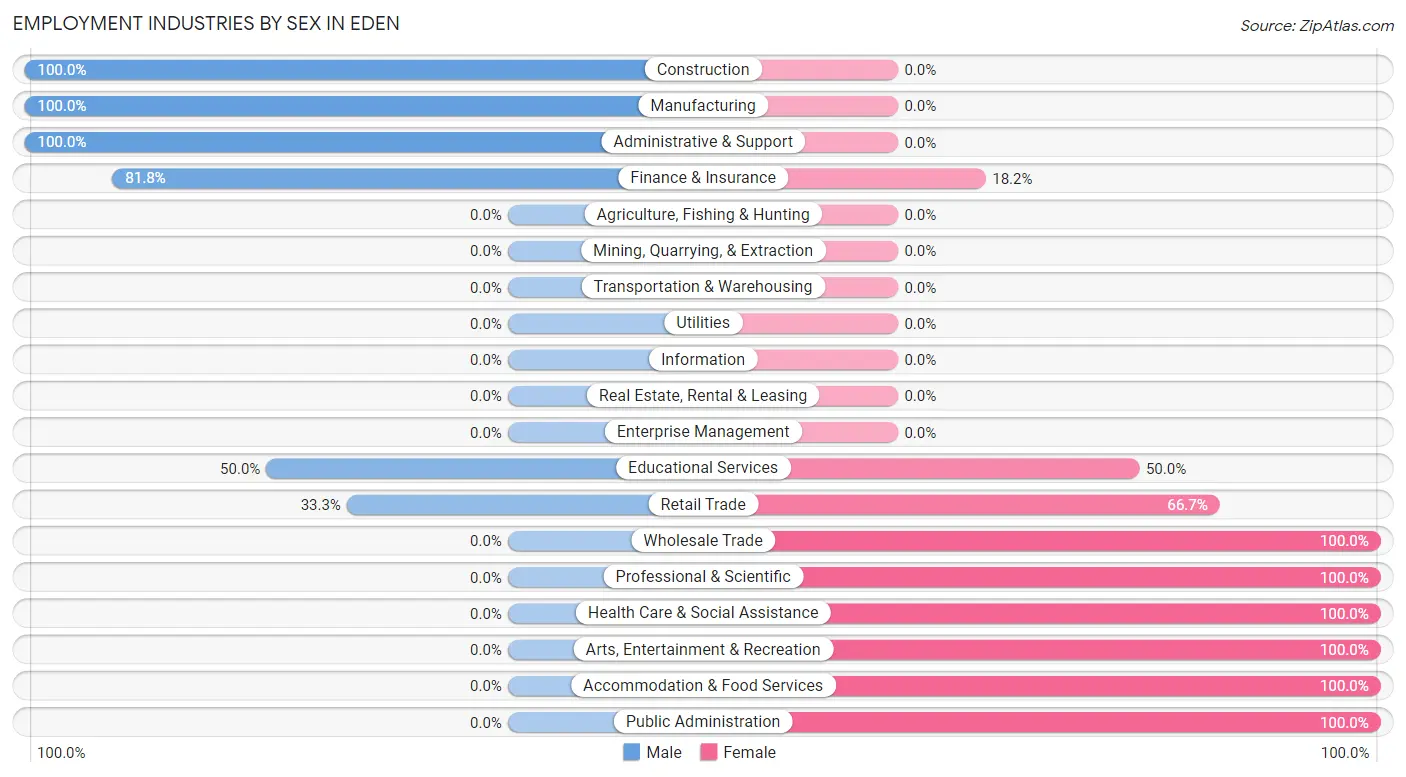
Employment Industries by Sex in Eden
The Eden industries that see more men than women are Construction (100.0%), Manufacturing (100.0%), and Administrative & Support (100.0%), whereas the industries that tend to have a higher number of women are Wholesale Trade (100.0%), Professional & Scientific (100.0%), and Health Care & Social Assistance (100.0%).
| Industry | Male | Female |
| Agriculture, Fishing & Hunting | 0 (0.0%) | 0 (0.0%) |
| Mining, Quarrying, & Extraction | 0 (0.0%) | 0 (0.0%) |
| Construction | 45 (100.0%) | 0 (0.0%) |
| Manufacturing | 8 (100.0%) | 0 (0.0%) |
| Wholesale Trade | 0 (0.0%) | 1 (100.0%) |
| Retail Trade | 2 (33.3%) | 4 (66.7%) |
| Transportation & Warehousing | 0 (0.0%) | 0 (0.0%) |
| Utilities | 0 (0.0%) | 0 (0.0%) |
| Information | 0 (0.0%) | 0 (0.0%) |
| Finance & Insurance | 9 (81.8%) | 2 (18.2%) |
| Real Estate, Rental & Leasing | 0 (0.0%) | 0 (0.0%) |
| Professional & Scientific | 0 (0.0%) | 1 (100.0%) |
| Enterprise Management | 0 (0.0%) | 0 (0.0%) |
| Administrative & Support | 1 (100.0%) | 0 (0.0%) |
| Educational Services | 1 (50.0%) | 1 (50.0%) |
| Health Care & Social Assistance | 0 (0.0%) | 1 (100.0%) |
| Arts, Entertainment & Recreation | 0 (0.0%) | 1 (100.0%) |
| Accommodation & Food Services | 0 (0.0%) | 7 (100.0%) |
| Public Administration | 0 (0.0%) | 39 (100.0%) |
| Total | 66 (53.7%) | 57 (46.3%) |
Education in Eden
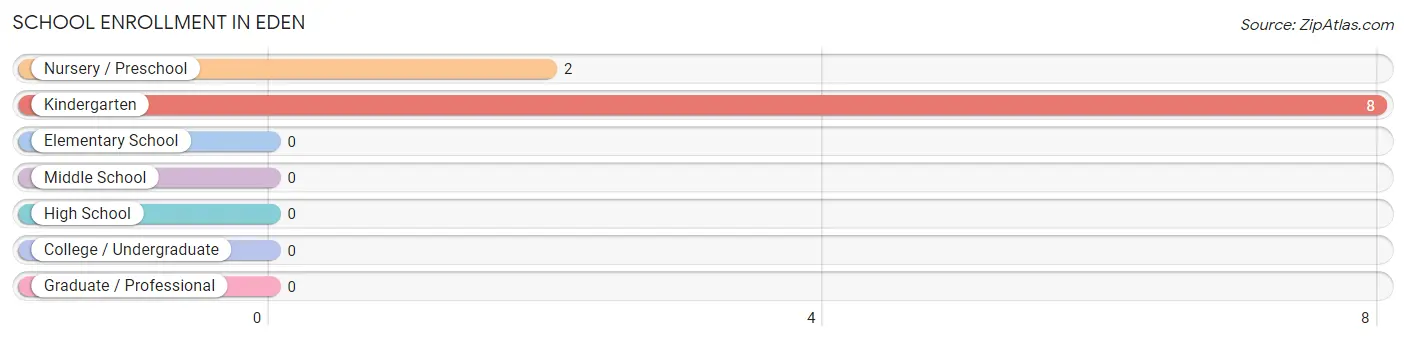
School Enrollment in Eden
The most common levels of schooling among the 10 students in Eden are kindergarten (8 | 80.0%), and nursery / preschool (2 | 20.0%).
| School Level | # Students | % Students |
| Nursery / Preschool | 2 | 20.0% |
| Kindergarten | 8 | 80.0% |
| Elementary School | 0 | 0.0% |
| Middle School | 0 | 0.0% |
| High School | 0 | 0.0% |
| College / Undergraduate | 0 | 0.0% |
| Graduate / Professional | 0 | 0.0% |
| Total | 10 | 100.0% |
School Enrollment by Age by Funding Source in Eden
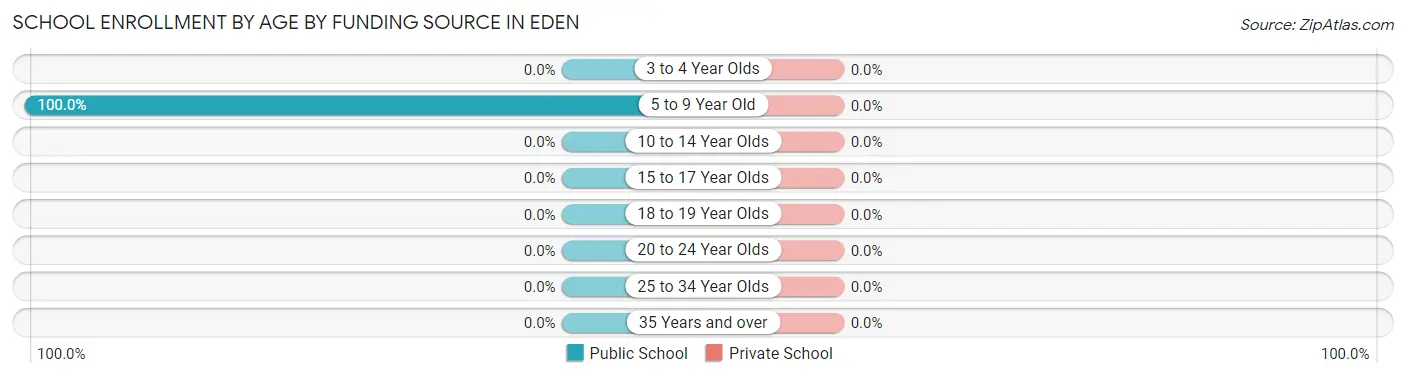
| Age Bracket | Public School | Private School |
| 3 to 4 Year Olds | 0 (0.0%) | 0 (0.0%) |
| 5 to 9 Year Old | 10 (100.0%) | 0 (0.0%) |
| 10 to 14 Year Olds | 0 (0.0%) | 0 (0.0%) |
| 15 to 17 Year Olds | 0 (0.0%) | 0 (0.0%) |
| 18 to 19 Year Olds | 0 (0.0%) | 0 (0.0%) |
| 20 to 24 Year Olds | 0 (0.0%) | 0 (0.0%) |
| 25 to 34 Year Olds | 0 (0.0%) | 0 (0.0%) |
| 35 Years and over | 0 (0.0%) | 0 (0.0%) |
| Total | 10 (100.0%) | 0 (0.0%) |
Educational Attainment by Field of Study in Eden
Social sciences (46 | 82.1%), bio, nature & agricultural (4 | 7.1%), education (3 | 5.4%), business (2 | 3.6%), and psychology (1 | 1.8%) are the most common fields of study among 56 individuals in Eden who have obtained a bachelor's degree or higher.
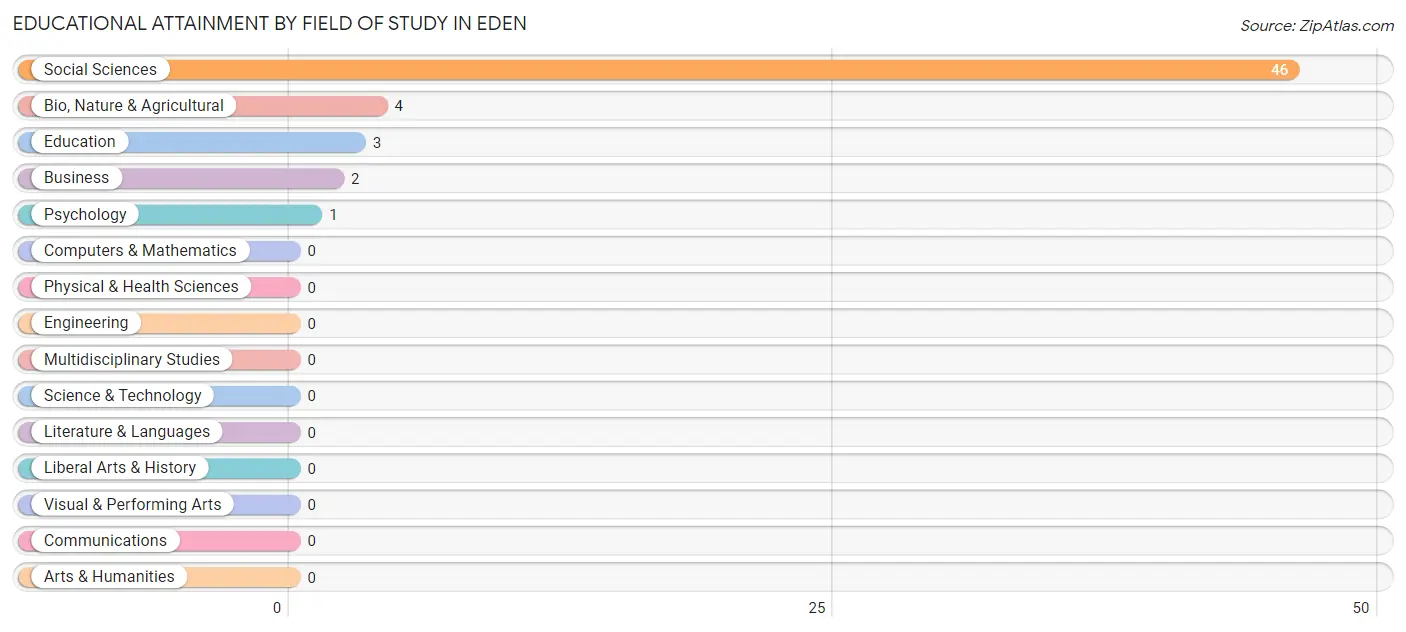
| Field of Study | # Graduates | % Graduates |
| Computers & Mathematics | 0 | 0.0% |
| Bio, Nature & Agricultural | 4 | 7.1% |
| Physical & Health Sciences | 0 | 0.0% |
| Psychology | 1 | 1.8% |
| Social Sciences | 46 | 82.1% |
| Engineering | 0 | 0.0% |
| Multidisciplinary Studies | 0 | 0.0% |
| Science & Technology | 0 | 0.0% |
| Business | 2 | 3.6% |
| Education | 3 | 5.4% |
| Literature & Languages | 0 | 0.0% |
| Liberal Arts & History | 0 | 0.0% |
| Visual & Performing Arts | 0 | 0.0% |
| Communications | 0 | 0.0% |
| Arts & Humanities | 0 | 0.0% |
| Total | 56 | 100.0% |
Transportation & Commute in Eden
Vehicle Availability by Sex in Eden
The most prevalent vehicle ownership categories in Eden are males with 2 vehicles (47, accounting for 71.2%) and females with 2 vehicles (34, making up 82.5%).
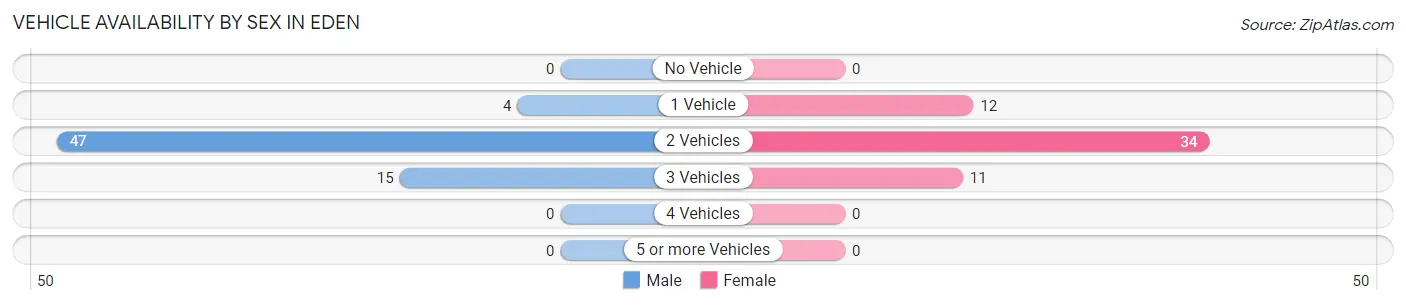
| Vehicles Available | Male | Female |
| No Vehicle | 0 (0.0%) | 0 (0.0%) |
| 1 Vehicle | 4 (6.1%) | 12 (21.0%) |
| 2 Vehicles | 47 (71.2%) | 34 (59.7%) |
| 3 Vehicles | 15 (22.7%) | 11 (19.3%) |
| 4 Vehicles | 0 (0.0%) | 0 (0.0%) |
| 5 or more Vehicles | 0 (0.0%) | 0 (0.0%) |
| Total | 66 (100.0%) | 57 (100.0%) |
Commute Time in Eden
The most frequently occuring commute durations in Eden are less than 5 minutes (87 commuters, 71.9%), 30 to 34 minutes (14 commuters, 11.6%), and 25 to 29 minutes (8 commuters, 6.6%).
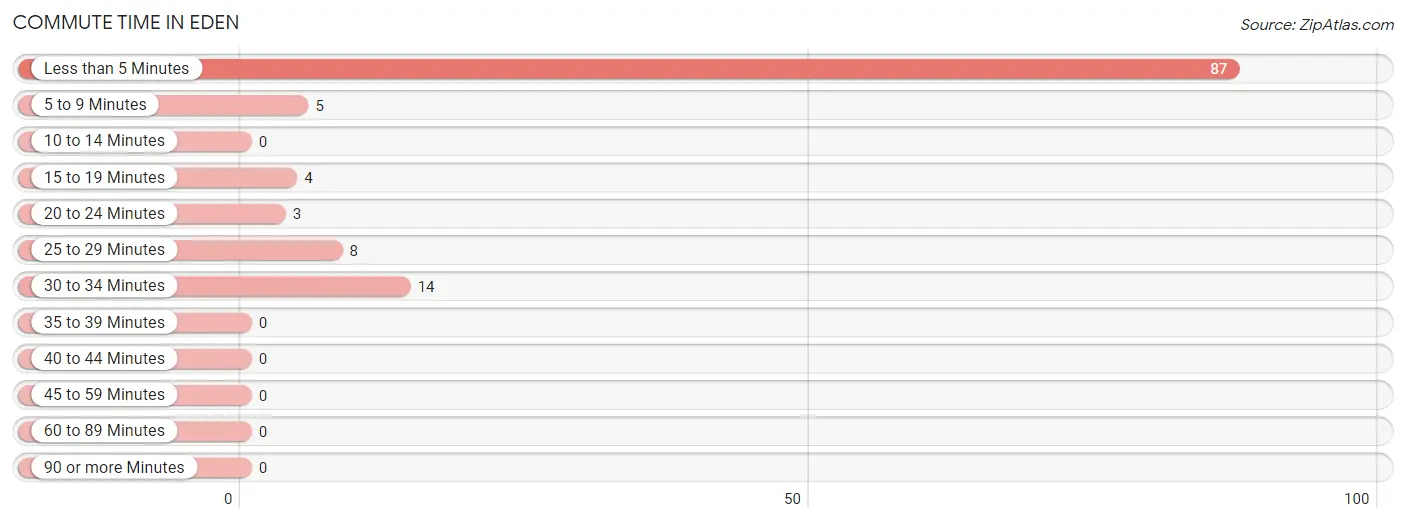
| Commute Time | # Commuters | % Commuters |
| Less than 5 Minutes | 87 | 71.9% |
| 5 to 9 Minutes | 5 | 4.1% |
| 10 to 14 Minutes | 0 | 0.0% |
| 15 to 19 Minutes | 4 | 3.3% |
| 20 to 24 Minutes | 3 | 2.5% |
| 25 to 29 Minutes | 8 | 6.6% |
| 30 to 34 Minutes | 14 | 11.6% |
| 35 to 39 Minutes | 0 | 0.0% |
| 40 to 44 Minutes | 0 | 0.0% |
| 45 to 59 Minutes | 0 | 0.0% |
| 60 to 89 Minutes | 0 | 0.0% |
| 90 or more Minutes | 0 | 0.0% |
Commute Time by Sex in Eden
The most common commute times in Eden are less than 5 minutes (47 commuters, 71.2%) for males and less than 5 minutes (40 commuters, 72.7%) for females.
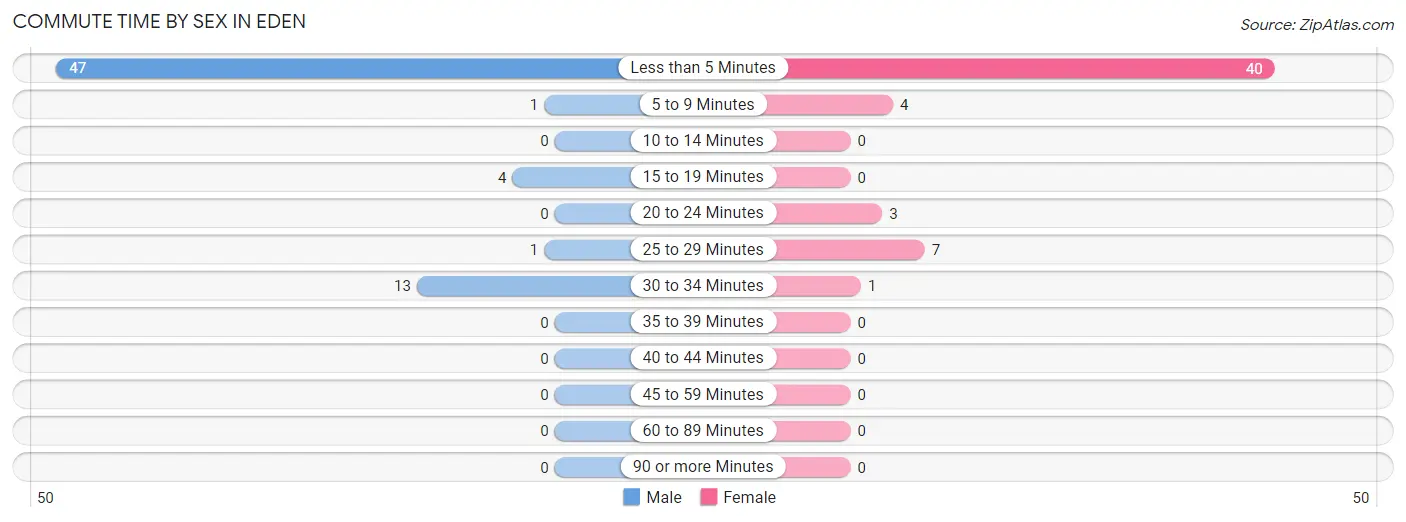
| Commute Time | Male | Female |
| Less than 5 Minutes | 47 (71.2%) | 40 (72.7%) |
| 5 to 9 Minutes | 1 (1.5%) | 4 (7.3%) |
| 10 to 14 Minutes | 0 (0.0%) | 0 (0.0%) |
| 15 to 19 Minutes | 4 (6.1%) | 0 (0.0%) |
| 20 to 24 Minutes | 0 (0.0%) | 3 (5.4%) |
| 25 to 29 Minutes | 1 (1.5%) | 7 (12.7%) |
| 30 to 34 Minutes | 13 (19.7%) | 1 (1.8%) |
| 35 to 39 Minutes | 0 (0.0%) | 0 (0.0%) |
| 40 to 44 Minutes | 0 (0.0%) | 0 (0.0%) |
| 45 to 59 Minutes | 0 (0.0%) | 0 (0.0%) |
| 60 to 89 Minutes | 0 (0.0%) | 0 (0.0%) |
| 90 or more Minutes | 0 (0.0%) | 0 (0.0%) |
Time of Departure to Work by Sex in Eden
The most frequent times of departure to work in Eden are 7:30 AM to 7:59 AM (46, 69.7%) for males and 8:00 AM to 8:29 AM (38, 69.1%) for females.
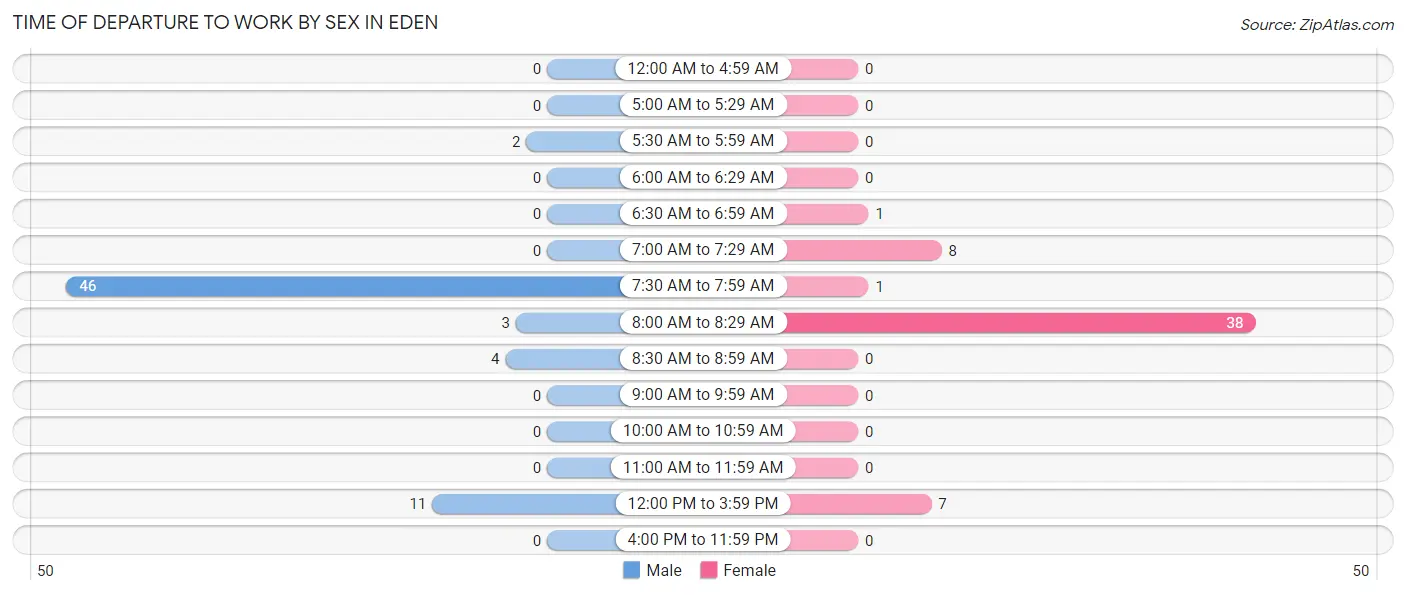
| Time of Departure | Male | Female |
| 12:00 AM to 4:59 AM | 0 (0.0%) | 0 (0.0%) |
| 5:00 AM to 5:29 AM | 0 (0.0%) | 0 (0.0%) |
| 5:30 AM to 5:59 AM | 2 (3.0%) | 0 (0.0%) |
| 6:00 AM to 6:29 AM | 0 (0.0%) | 0 (0.0%) |
| 6:30 AM to 6:59 AM | 0 (0.0%) | 1 (1.8%) |
| 7:00 AM to 7:29 AM | 0 (0.0%) | 8 (14.5%) |
| 7:30 AM to 7:59 AM | 46 (69.7%) | 1 (1.8%) |
| 8:00 AM to 8:29 AM | 3 (4.5%) | 38 (69.1%) |
| 8:30 AM to 8:59 AM | 4 (6.1%) | 0 (0.0%) |
| 9:00 AM to 9:59 AM | 0 (0.0%) | 0 (0.0%) |
| 10:00 AM to 10:59 AM | 0 (0.0%) | 0 (0.0%) |
| 11:00 AM to 11:59 AM | 0 (0.0%) | 0 (0.0%) |
| 12:00 PM to 3:59 PM | 11 (16.7%) | 7 (12.7%) |
| 4:00 PM to 11:59 PM | 0 (0.0%) | 0 (0.0%) |
| Total | 66 (100.0%) | 55 (100.0%) |
Housing Occupancy in Eden
Occupancy by Ownership in Eden
Of the total 83 dwellings in Eden, owner-occupied units account for 66 (79.5%), while renter-occupied units make up 17 (20.5%).
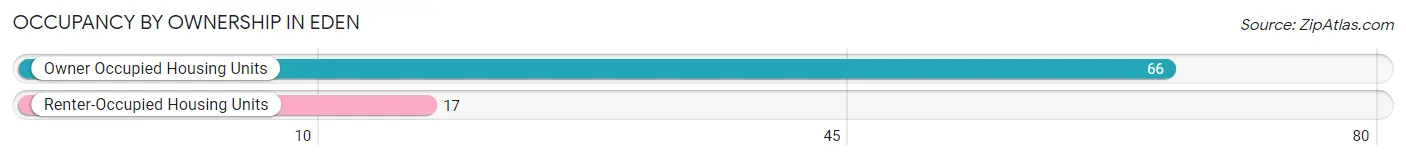
| Occupancy | # Housing Units | % Housing Units |
| Owner Occupied Housing Units | 66 | 79.5% |
| Renter-Occupied Housing Units | 17 | 20.5% |
| Total Occupied Housing Units | 83 | 100.0% |
Occupancy by Household Size in Eden
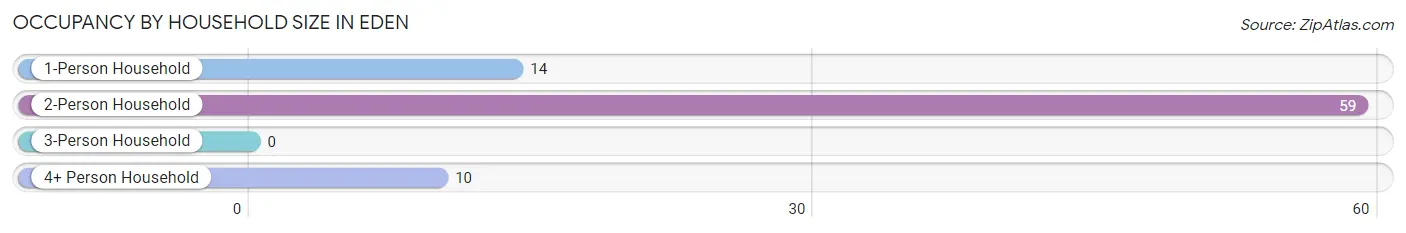
| Household Size | # Housing Units | % Housing Units |
| 1-Person Household | 14 | 16.9% |
| 2-Person Household | 59 | 71.1% |
| 3-Person Household | 0 | 0.0% |
| 4+ Person Household | 10 | 12.0% |
| Total Housing Units | 83 | 100.0% |
Occupancy by Ownership by Household Size in Eden
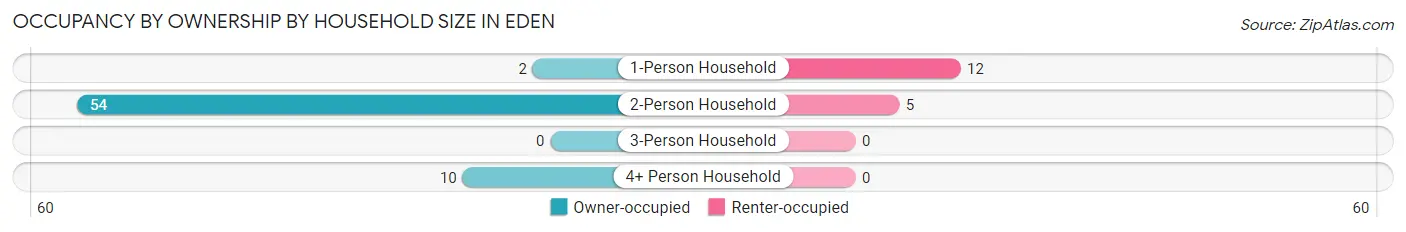
| Household Size | Owner-occupied | Renter-occupied |
| 1-Person Household | 2 (14.3%) | 12 (85.7%) |
| 2-Person Household | 54 (91.5%) | 5 (8.5%) |
| 3-Person Household | 0 (0.0%) | 0 (0.0%) |
| 4+ Person Household | 10 (100.0%) | 0 (0.0%) |
| Total Housing Units | 66 (79.5%) | 17 (20.5%) |
Occupancy by Educational Attainment in Eden
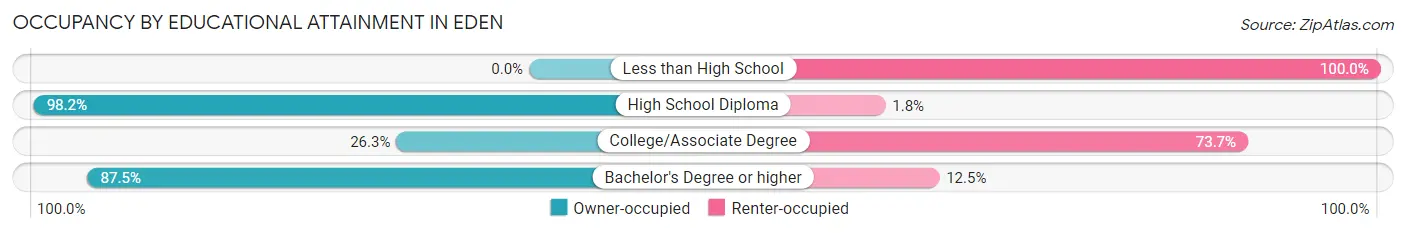
| Household Size | Owner-occupied | Renter-occupied |
| Less than High School | 0 (0.0%) | 1 (100.0%) |
| High School Diploma | 54 (98.2%) | 1 (1.8%) |
| College/Associate Degree | 5 (26.3%) | 14 (73.7%) |
| Bachelor's Degree or higher | 7 (87.5%) | 1 (12.5%) |
Occupancy by Age of Householder in Eden
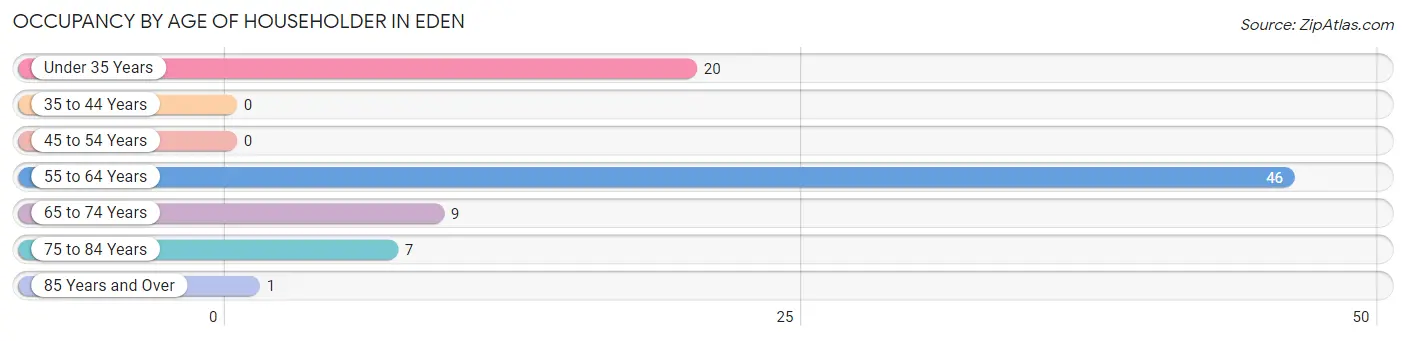
| Age Bracket | # Households | % Households |
| Under 35 Years | 20 | 24.1% |
| 35 to 44 Years | 0 | 0.0% |
| 45 to 54 Years | 0 | 0.0% |
| 55 to 64 Years | 46 | 55.4% |
| 65 to 74 Years | 9 | 10.8% |
| 75 to 84 Years | 7 | 8.4% |
| 85 Years and Over | 1 | 1.2% |
| Total | 83 | 100.0% |
Housing Finances in Eden
Median Income by Occupancy in Eden
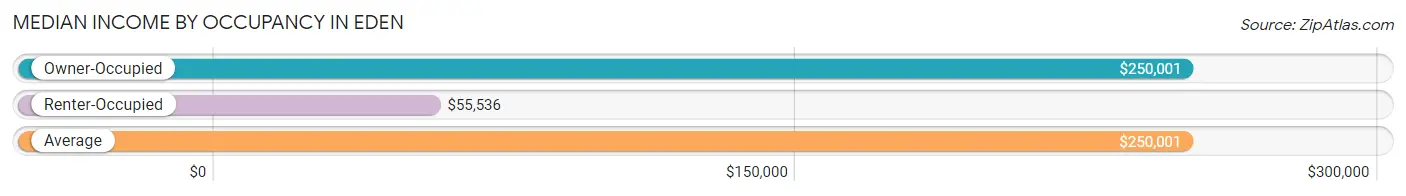
| Occupancy Type | # Households | Median Income |
| Owner-Occupied | 66 (79.5%) | $250,001 |
| Renter-Occupied | 17 (20.5%) | $55,536 |
| Average | 83 (100.0%) | $250,001 |
Occupancy by Householder Income Bracket in Eden
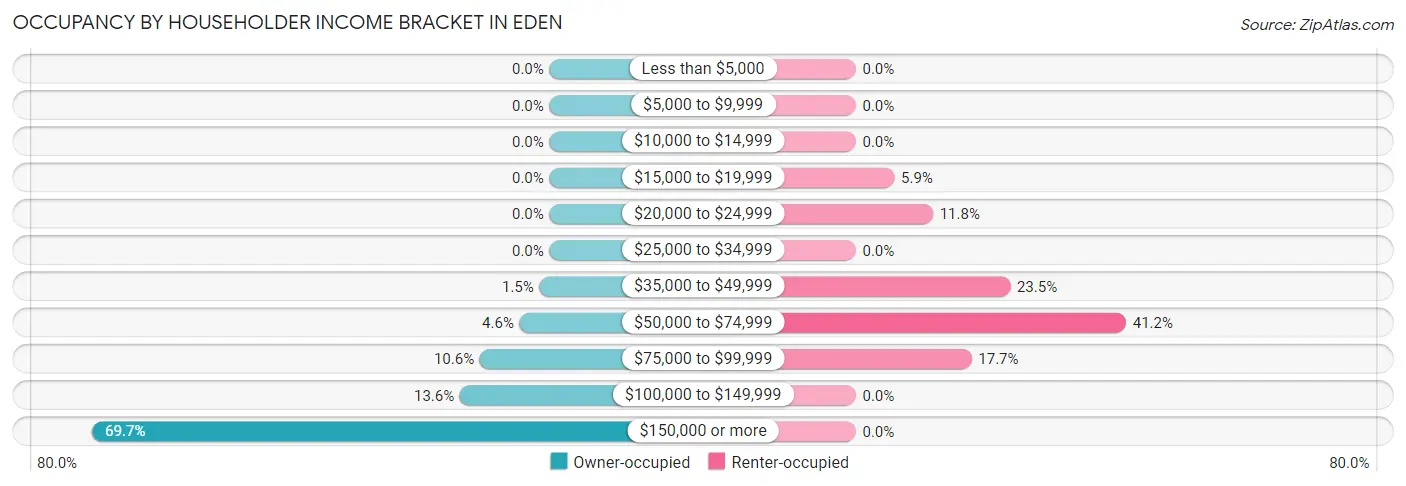
| Income Bracket | Owner-occupied | Renter-occupied |
| Less than $5,000 | 0 (0.0%) | 0 (0.0%) |
| $5,000 to $9,999 | 0 (0.0%) | 0 (0.0%) |
| $10,000 to $14,999 | 0 (0.0%) | 0 (0.0%) |
| $15,000 to $19,999 | 0 (0.0%) | 1 (5.9%) |
| $20,000 to $24,999 | 0 (0.0%) | 2 (11.8%) |
| $25,000 to $34,999 | 0 (0.0%) | 0 (0.0%) |
| $35,000 to $49,999 | 1 (1.5%) | 4 (23.5%) |
| $50,000 to $74,999 | 3 (4.5%) | 7 (41.2%) |
| $75,000 to $99,999 | 7 (10.6%) | 3 (17.6%) |
| $100,000 to $149,999 | 9 (13.6%) | 0 (0.0%) |
| $150,000 or more | 46 (69.7%) | 0 (0.0%) |
| Total | 66 (100.0%) | 17 (100.0%) |
Monthly Housing Cost Tiers in Eden
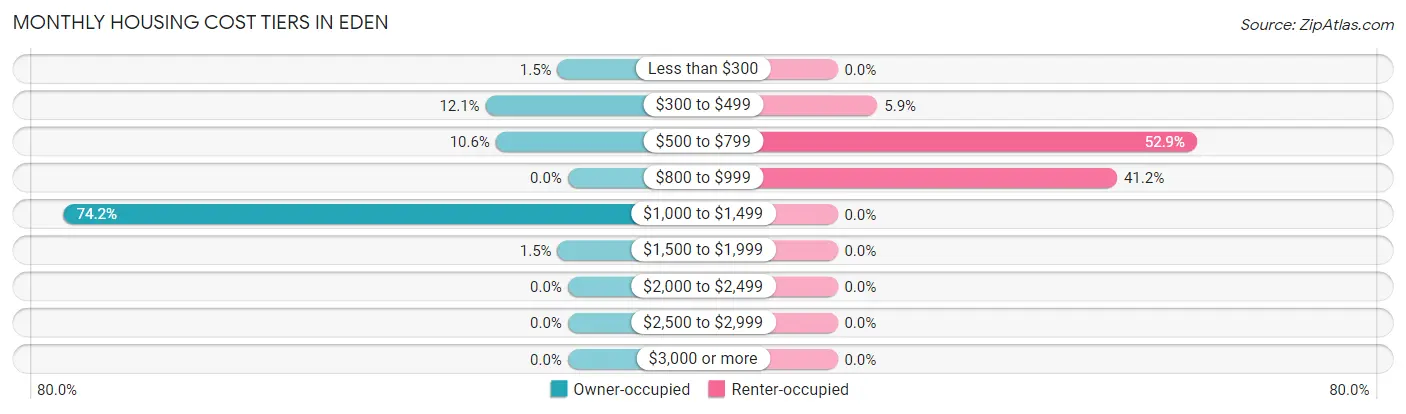
| Monthly Cost | Owner-occupied | Renter-occupied |
| Less than $300 | 1 (1.5%) | 0 (0.0%) |
| $300 to $499 | 8 (12.1%) | 1 (5.9%) |
| $500 to $799 | 7 (10.6%) | 9 (52.9%) |
| $800 to $999 | 0 (0.0%) | 7 (41.2%) |
| $1,000 to $1,499 | 49 (74.2%) | 0 (0.0%) |
| $1,500 to $1,999 | 1 (1.5%) | 0 (0.0%) |
| $2,000 to $2,499 | 0 (0.0%) | 0 (0.0%) |
| $2,500 to $2,999 | 0 (0.0%) | 0 (0.0%) |
| $3,000 or more | 0 (0.0%) | 0 (0.0%) |
| Total | 66 (100.0%) | 17 (100.0%) |
Physical Housing Characteristics in Eden
Housing Structures in Eden
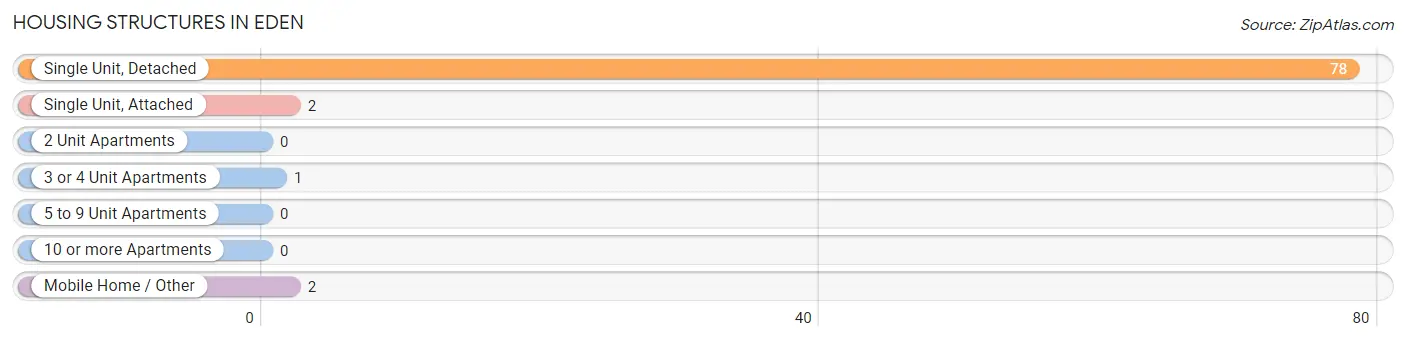
| Structure Type | # Housing Units | % Housing Units |
| Single Unit, Detached | 78 | 94.0% |
| Single Unit, Attached | 2 | 2.4% |
| 2 Unit Apartments | 0 | 0.0% |
| 3 or 4 Unit Apartments | 1 | 1.2% |
| 5 to 9 Unit Apartments | 0 | 0.0% |
| 10 or more Apartments | 0 | 0.0% |
| Mobile Home / Other | 2 | 2.4% |
| Total | 83 | 100.0% |
Housing Structures by Occupancy in Eden
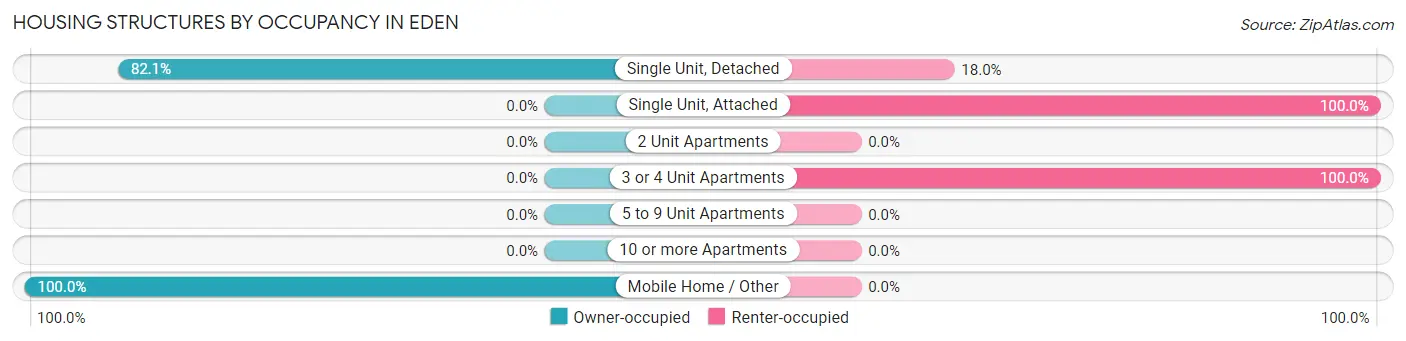
| Structure Type | Owner-occupied | Renter-occupied |
| Single Unit, Detached | 64 (82.1%) | 14 (17.9%) |
| Single Unit, Attached | 0 (0.0%) | 2 (100.0%) |
| 2 Unit Apartments | 0 (0.0%) | 0 (0.0%) |
| 3 or 4 Unit Apartments | 0 (0.0%) | 1 (100.0%) |
| 5 to 9 Unit Apartments | 0 (0.0%) | 0 (0.0%) |
| 10 or more Apartments | 0 (0.0%) | 0 (0.0%) |
| Mobile Home / Other | 2 (100.0%) | 0 (0.0%) |
| Total | 66 (79.5%) | 17 (20.5%) |
Housing Structures by Number of Rooms in Eden
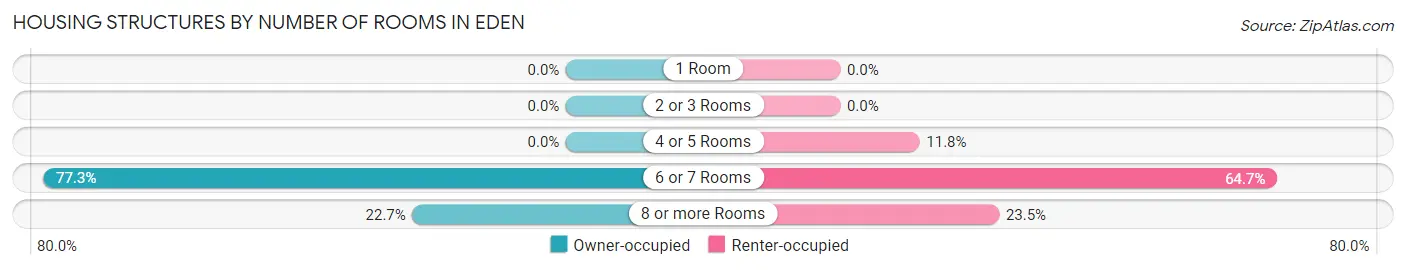
| Number of Rooms | Owner-occupied | Renter-occupied |
| 1 Room | 0 (0.0%) | 0 (0.0%) |
| 2 or 3 Rooms | 0 (0.0%) | 0 (0.0%) |
| 4 or 5 Rooms | 0 (0.0%) | 2 (11.8%) |
| 6 or 7 Rooms | 51 (77.3%) | 11 (64.7%) |
| 8 or more Rooms | 15 (22.7%) | 4 (23.5%) |
| Total | 66 (100.0%) | 17 (100.0%) |
Housing Structure by Heating Type in Eden
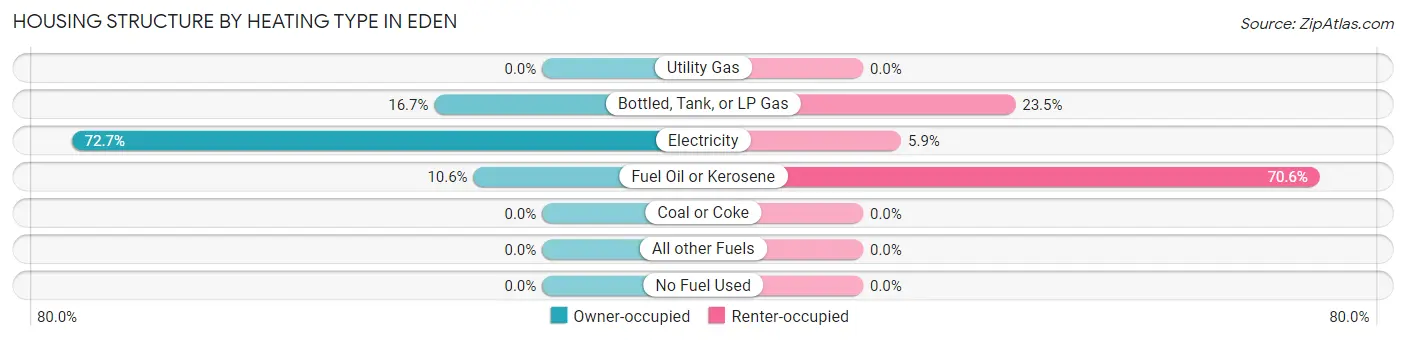
| Heating Type | Owner-occupied | Renter-occupied |
| Utility Gas | 0 (0.0%) | 0 (0.0%) |
| Bottled, Tank, or LP Gas | 11 (16.7%) | 4 (23.5%) |
| Electricity | 48 (72.7%) | 1 (5.9%) |
| Fuel Oil or Kerosene | 7 (10.6%) | 12 (70.6%) |
| Coal or Coke | 0 (0.0%) | 0 (0.0%) |
| All other Fuels | 0 (0.0%) | 0 (0.0%) |
| No Fuel Used | 0 (0.0%) | 0 (0.0%) |
| Total | 66 (100.0%) | 17 (100.0%) |
Household Vehicle Usage in Eden
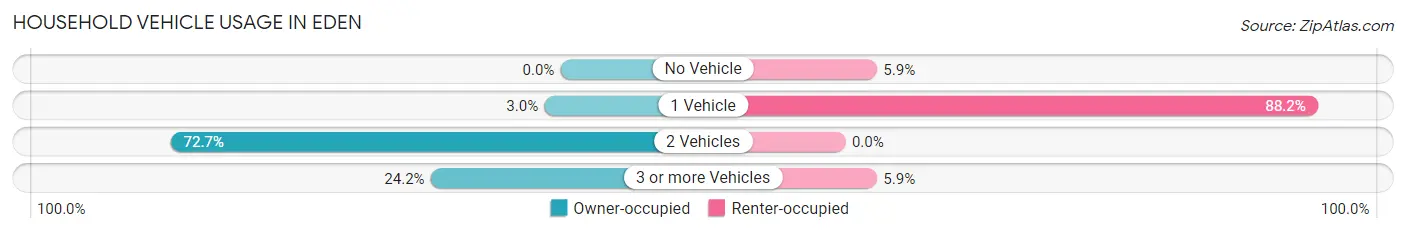
| Vehicles per Household | Owner-occupied | Renter-occupied |
| No Vehicle | 0 (0.0%) | 1 (5.9%) |
| 1 Vehicle | 2 (3.0%) | 15 (88.2%) |
| 2 Vehicles | 48 (72.7%) | 0 (0.0%) |
| 3 or more Vehicles | 16 (24.2%) | 1 (5.9%) |
| Total | 66 (100.0%) | 17 (100.0%) |
Real Estate & Mortgages in Eden
Real Estate and Mortgage Overview in Eden
| Characteristic | Without Mortgage | With Mortgage |
| Housing Units | 13 | 53 |
| Median Property Value | $450,000 | $1,599,400 |
| Median Household Income | $83,542 | $46 |
| Monthly Housing Costs | $464 | $0 |
| Real Estate Taxes | - | - |
Property Value by Mortgage Status in Eden
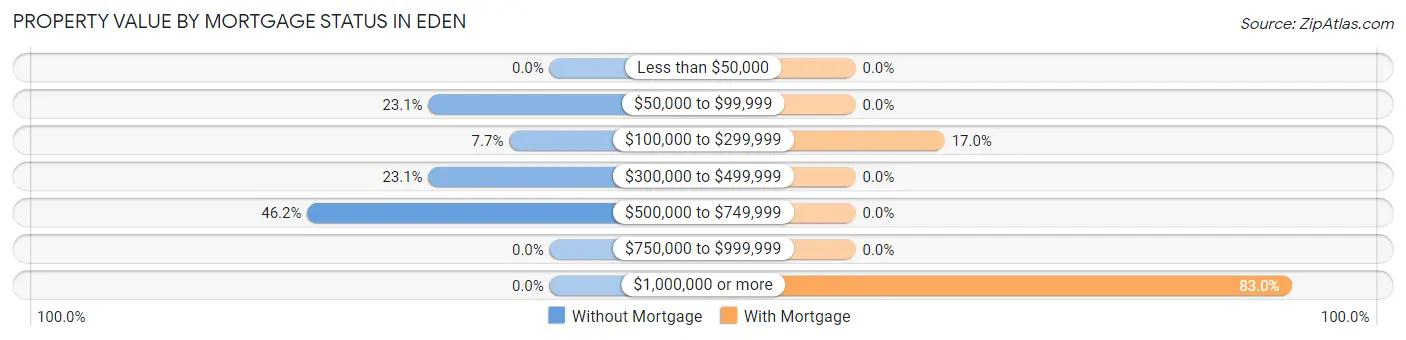
| Property Value | Without Mortgage | With Mortgage |
| Less than $50,000 | 0 (0.0%) | 0 (0.0%) |
| $50,000 to $99,999 | 3 (23.1%) | 0 (0.0%) |
| $100,000 to $299,999 | 1 (7.7%) | 9 (17.0%) |
| $300,000 to $499,999 | 3 (23.1%) | 0 (0.0%) |
| $500,000 to $749,999 | 6 (46.2%) | 0 (0.0%) |
| $750,000 to $999,999 | 0 (0.0%) | 0 (0.0%) |
| $1,000,000 or more | 0 (0.0%) | 44 (83.0%) |
| Total | 13 (100.0%) | 53 (100.0%) |
Household Income by Mortgage Status in Eden
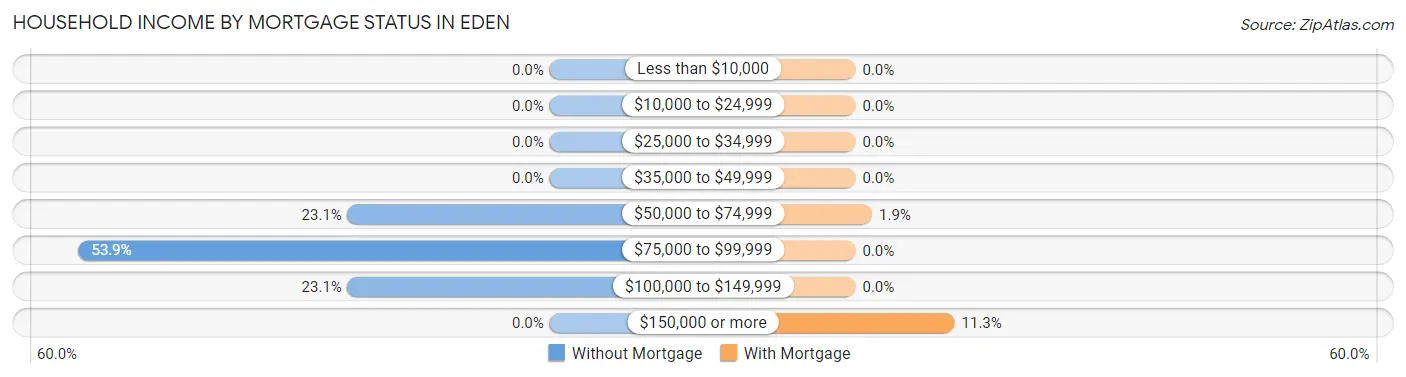
| Household Income | Without Mortgage | With Mortgage |
| Less than $10,000 | 0 (0.0%) | 0 (0.0%) |
| $10,000 to $24,999 | 0 (0.0%) | 0 (0.0%) |
| $25,000 to $34,999 | 0 (0.0%) | 0 (0.0%) |
| $35,000 to $49,999 | 0 (0.0%) | 0 (0.0%) |
| $50,000 to $74,999 | 3 (23.1%) | 1 (1.9%) |
| $75,000 to $99,999 | 7 (53.8%) | 0 (0.0%) |
| $100,000 to $149,999 | 3 (23.1%) | 0 (0.0%) |
| $150,000 or more | 0 (0.0%) | 6 (11.3%) |
| Total | 13 (100.0%) | 53 (100.0%) |
Property Value to Household Income Ratio in Eden
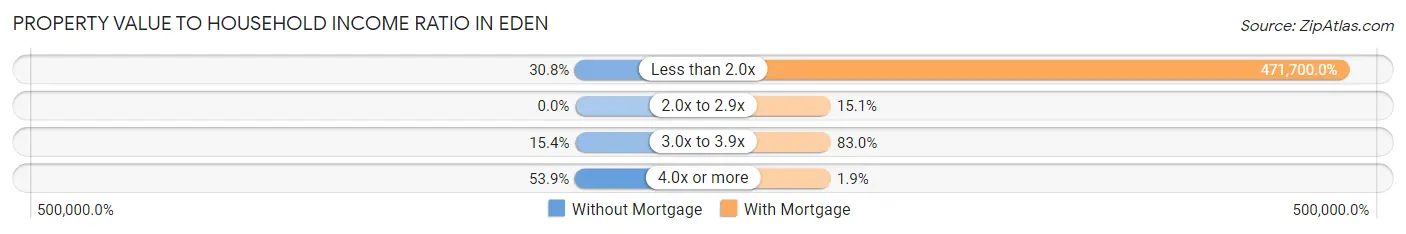
| Value-to-Income Ratio | Without Mortgage | With Mortgage |
| Less than 2.0x | 4 (30.8%) | 250,001 (471,700.0%) |
| 2.0x to 2.9x | 0 (0.0%) | 8 (15.1%) |
| 3.0x to 3.9x | 2 (15.4%) | 44 (83.0%) |
| 4.0x or more | 7 (53.8%) | 1 (1.9%) |
| Total | 13 (100.0%) | 53 (100.0%) |
Real Estate Taxes by Mortgage Status in Eden
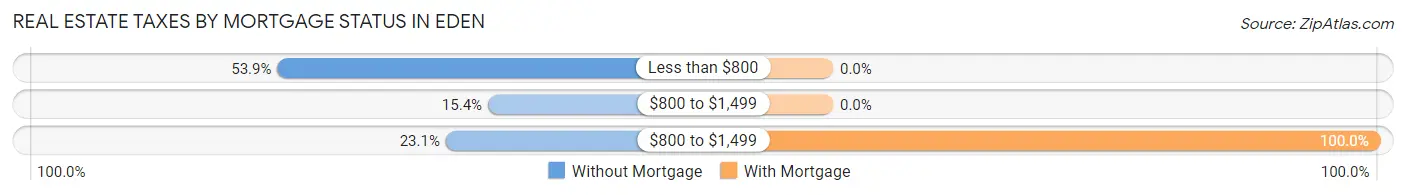
| Property Taxes | Without Mortgage | With Mortgage |
| Less than $800 | 7 (53.8%) | 0 (0.0%) |
| $800 to $1,499 | 2 (15.4%) | 0 (0.0%) |
| $800 to $1,499 | 3 (23.1%) | 53 (100.0%) |
| Total | 13 (100.0%) | 53 (100.0%) |
Health & Disability in Eden
Health Insurance Coverage by Age in Eden
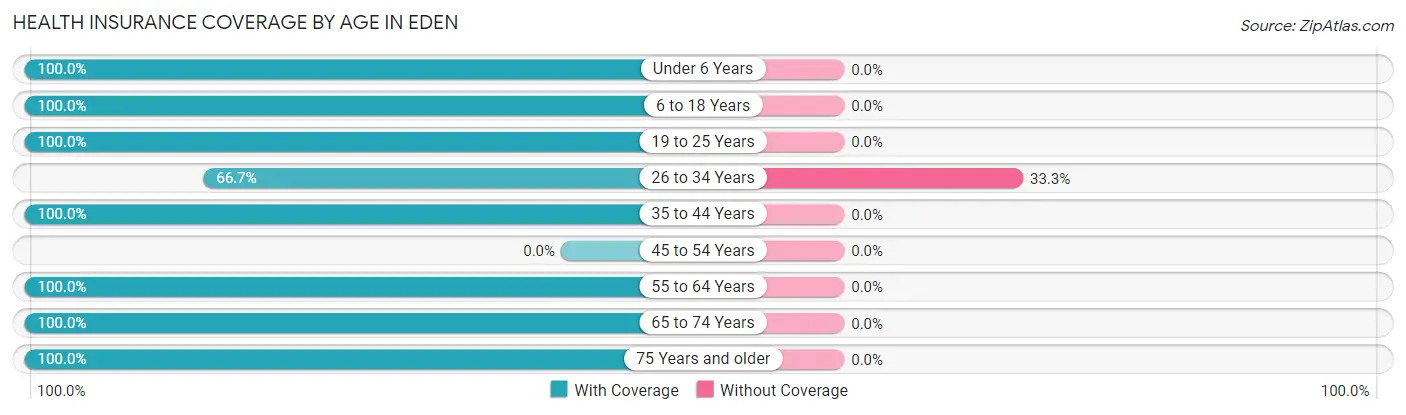
| Age Bracket | With Coverage | Without Coverage |
| Under 6 Years | 24 (100.0%) | 0 (0.0%) |
| 6 to 18 Years | 8 (100.0%) | 0 (0.0%) |
| 19 to 25 Years | 1 (100.0%) | 0 (0.0%) |
| 26 to 34 Years | 14 (66.7%) | 7 (33.3%) |
| 35 to 44 Years | 10 (100.0%) | 0 (0.0%) |
| 45 to 54 Years | 0 (0.0%) | 0 (0.0%) |
| 55 to 64 Years | 82 (100.0%) | 0 (0.0%) |
| 65 to 74 Years | 19 (100.0%) | 0 (0.0%) |
| 75 Years and older | 8 (100.0%) | 0 (0.0%) |
| Total | 166 (96.0%) | 7 (4.1%) |
Health Insurance Coverage by Citizenship Status in Eden
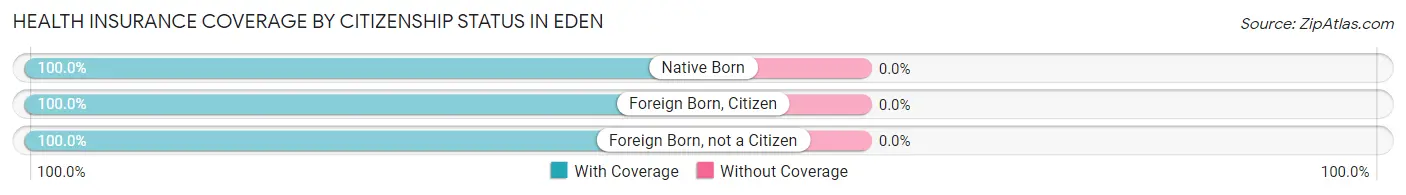
| Citizenship Status | With Coverage | Without Coverage |
| Native Born | 24 (100.0%) | 0 (0.0%) |
| Foreign Born, Citizen | 8 (100.0%) | 0 (0.0%) |
| Foreign Born, not a Citizen | 1 (100.0%) | 0 (0.0%) |
Health Insurance Coverage by Household Income in Eden
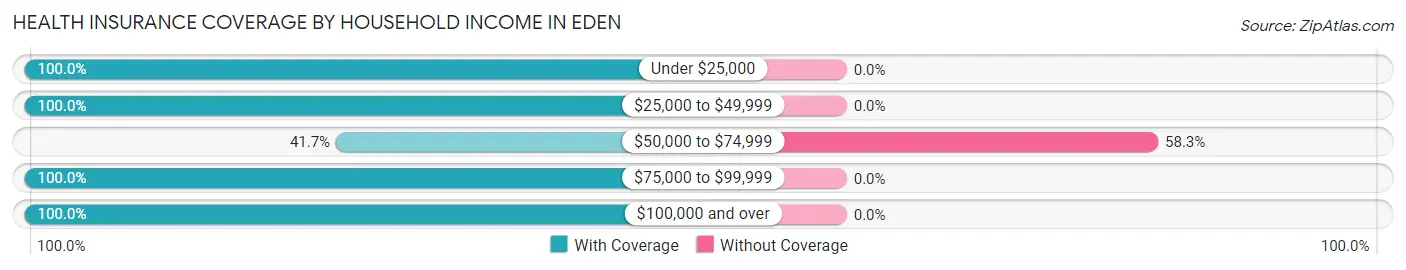
| Household Income | With Coverage | Without Coverage |
| Under $25,000 | 3 (100.0%) | 0 (0.0%) |
| $25,000 to $49,999 | 11 (100.0%) | 0 (0.0%) |
| $50,000 to $74,999 | 5 (41.7%) | 7 (58.3%) |
| $75,000 to $99,999 | 41 (100.0%) | 0 (0.0%) |
| $100,000 and over | 106 (100.0%) | 0 (0.0%) |
Public vs Private Health Insurance Coverage by Age in Eden
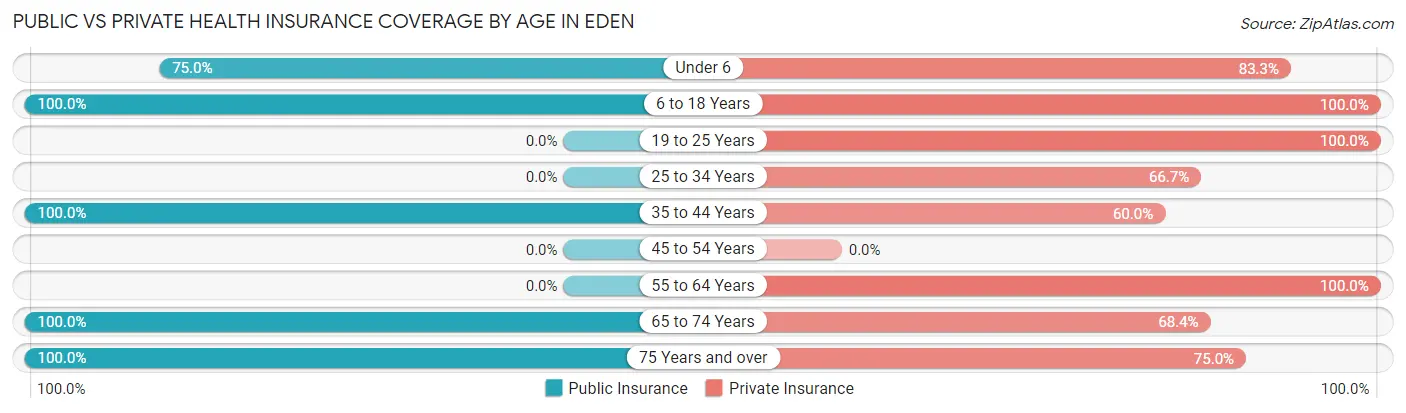
| Age Bracket | Public Insurance | Private Insurance |
| Under 6 | 18 (75.0%) | 20 (83.3%) |
| 6 to 18 Years | 8 (100.0%) | 8 (100.0%) |
| 19 to 25 Years | 0 (0.0%) | 1 (100.0%) |
| 25 to 34 Years | 0 (0.0%) | 14 (66.7%) |
| 35 to 44 Years | 10 (100.0%) | 6 (60.0%) |
| 45 to 54 Years | 0 (0.0%) | 0 (0.0%) |
| 55 to 64 Years | 0 (0.0%) | 82 (100.0%) |
| 65 to 74 Years | 19 (100.0%) | 13 (68.4%) |
| 75 Years and over | 8 (100.0%) | 6 (75.0%) |
| Total | 63 (36.4%) | 150 (86.7%) |
Disability Status by Sex by Age in Eden
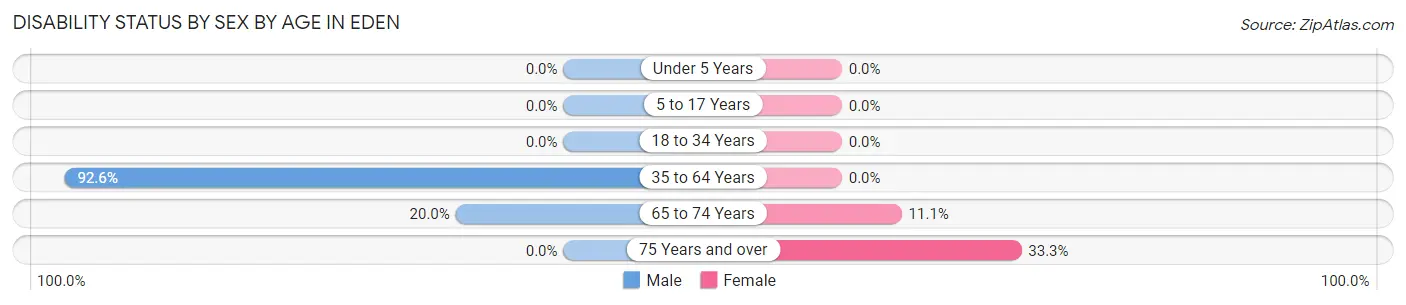
| Age Bracket | Male | Female |
| Under 5 Years | 0 (0.0%) | 0 (0.0%) |
| 5 to 17 Years | 0 (0.0%) | 0 (0.0%) |
| 18 to 34 Years | 0 (0.0%) | 0 (0.0%) |
| 35 to 64 Years | 50 (92.6%) | 0 (0.0%) |
| 65 to 74 Years | 2 (20.0%) | 1 (11.1%) |
| 75 Years and over | 0 (0.0%) | 1 (33.3%) |
Disability Class by Sex by Age in Eden
Disability Class: Hearing Difficulty
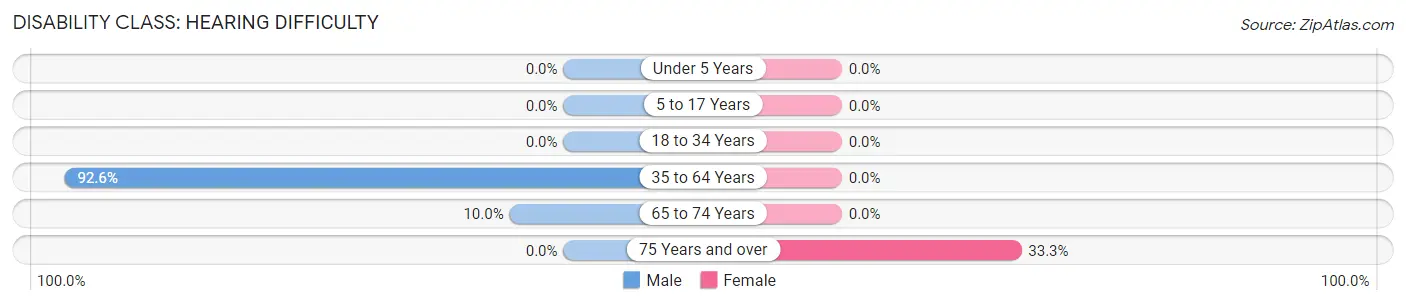
| Age Bracket | Male | Female |
| Under 5 Years | 0 (0.0%) | 0 (0.0%) |
| 5 to 17 Years | 0 (0.0%) | 0 (0.0%) |
| 18 to 34 Years | 0 (0.0%) | 0 (0.0%) |
| 35 to 64 Years | 50 (92.6%) | 0 (0.0%) |
| 65 to 74 Years | 1 (10.0%) | 0 (0.0%) |
| 75 Years and over | 0 (0.0%) | 1 (33.3%) |
Disability Class: Vision Difficulty
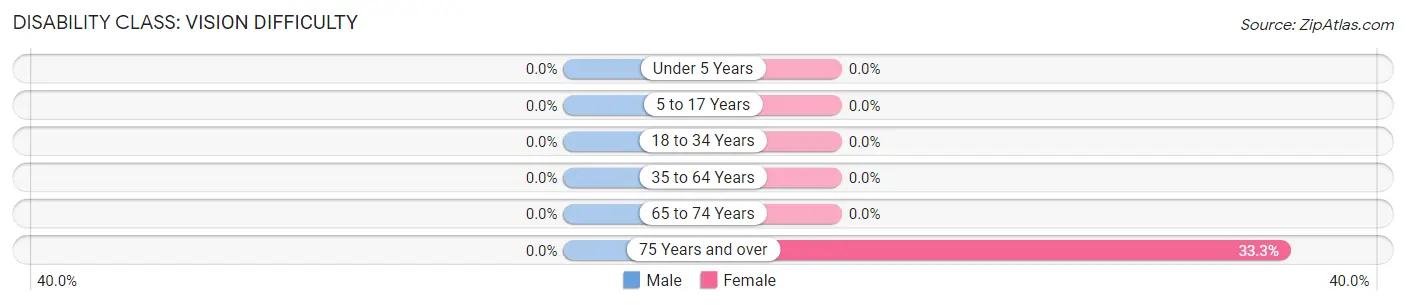
| Age Bracket | Male | Female |
| Under 5 Years | 0 (0.0%) | 0 (0.0%) |
| 5 to 17 Years | 0 (0.0%) | 0 (0.0%) |
| 18 to 34 Years | 0 (0.0%) | 0 (0.0%) |
| 35 to 64 Years | 0 (0.0%) | 0 (0.0%) |
| 65 to 74 Years | 0 (0.0%) | 0 (0.0%) |
| 75 Years and over | 0 (0.0%) | 1 (33.3%) |
Disability Class: Cognitive Difficulty
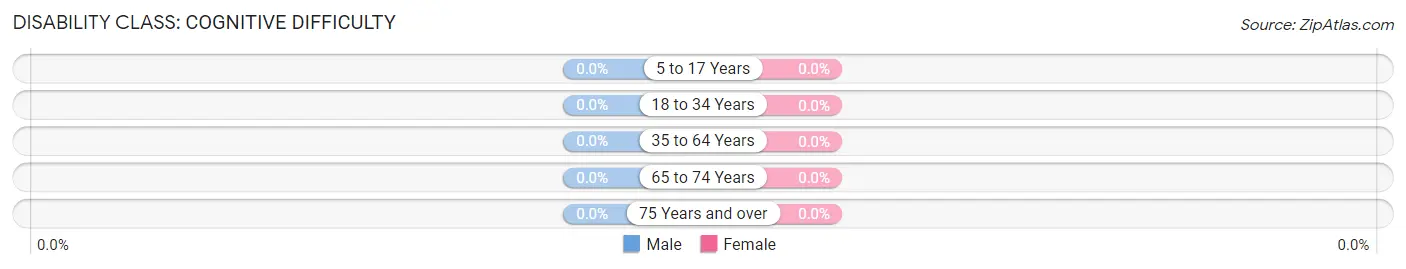
| Age Bracket | Male | Female |
| 5 to 17 Years | 0 (0.0%) | 0 (0.0%) |
| 18 to 34 Years | 0 (0.0%) | 0 (0.0%) |
| 35 to 64 Years | 0 (0.0%) | 0 (0.0%) |
| 65 to 74 Years | 0 (0.0%) | 0 (0.0%) |
| 75 Years and over | 0 (0.0%) | 0 (0.0%) |
Disability Class: Ambulatory Difficulty
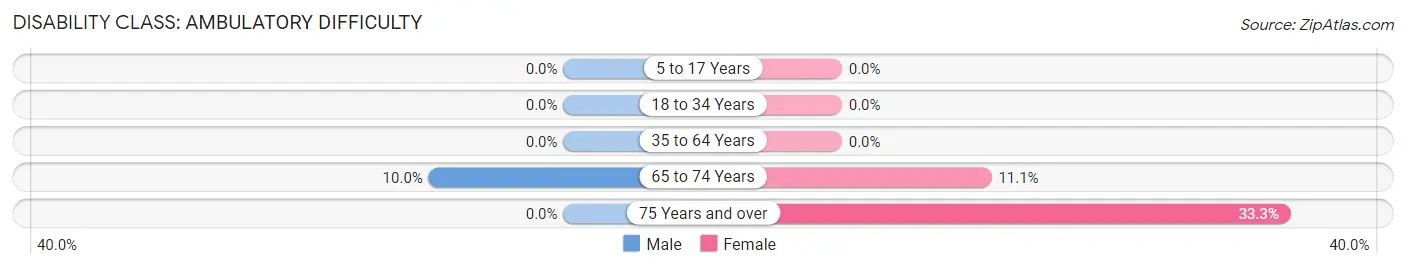
| Age Bracket | Male | Female |
| 5 to 17 Years | 0 (0.0%) | 0 (0.0%) |
| 18 to 34 Years | 0 (0.0%) | 0 (0.0%) |
| 35 to 64 Years | 0 (0.0%) | 0 (0.0%) |
| 65 to 74 Years | 1 (10.0%) | 1 (11.1%) |
| 75 Years and over | 0 (0.0%) | 1 (33.3%) |
Disability Class: Self-Care Difficulty
| Age Bracket | Male | Female |
| 5 to 17 Years | 0 (0.0%) | 0 (0.0%) |
| 18 to 34 Years | 0 (0.0%) | 0 (0.0%) |
| 35 to 64 Years | 0 (0.0%) | 0 (0.0%) |
| 65 to 74 Years | 0 (0.0%) | 0 (0.0%) |
| 75 Years and over | 0 (0.0%) | 0 (0.0%) |
Technology Access in Eden
Computing Device Access in Eden
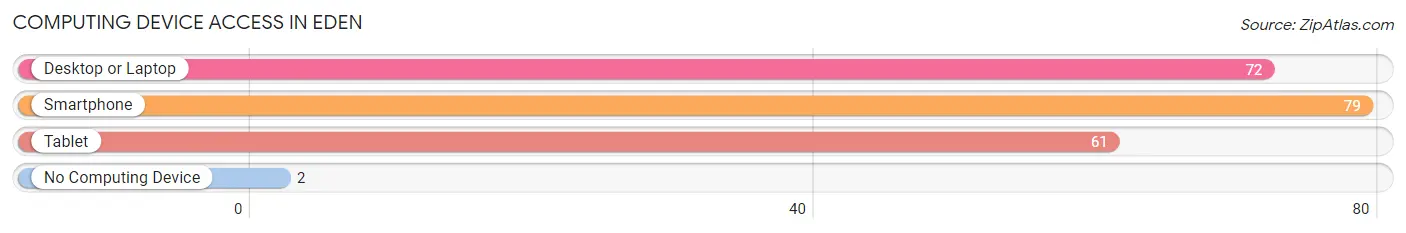
| Device Type | # Households | % Households |
| Desktop or Laptop | 72 | 86.8% |
| Smartphone | 79 | 95.2% |
| Tablet | 61 | 73.5% |
| No Computing Device | 2 | 2.4% |
| Total | 83 | 100.0% |
Internet Access in Eden
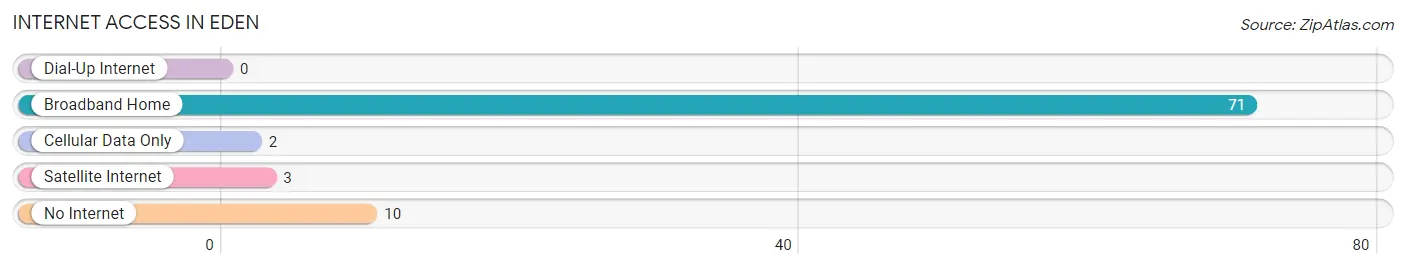
| Internet Type | # Households | % Households |
| Dial-Up Internet | 0 | 0.0% |
| Broadband Home | 71 | 85.5% |
| Cellular Data Only | 2 | 2.4% |
| Satellite Internet | 3 | 3.6% |
| No Internet | 10 | 12.0% |
| Total | 83 | 100.0% |
Eden Summary
Eden, South Dakota is a small town located in the southeastern corner of the state. It is situated in the rolling hills of the Missouri River Valley, and is surrounded by the scenic beauty of the Black Hills. The town was founded in 1883 and has a population of approximately 500 people.
Geography
Eden is located in the southeastern corner of South Dakota, in the Missouri River Valley. It is situated in the rolling hills of the Black Hills, and is surrounded by the scenic beauty of the area. The town is located at an elevation of 3,000 feet, and is approximately 25 miles from Rapid City. The town is located in the Central Time Zone, and is in the Mountain Standard Time Zone during the summer months.
The town is located in the Black Hills National Forest, and is surrounded by the Black Hills National Forest. The area is known for its abundance of wildlife, including deer, elk, bighorn sheep, and mountain lions. The area is also home to a variety of birds, including bald eagles, hawks, and owls.
Economy
Eden’s economy is largely based on tourism. The town is home to several tourist attractions, including the Black Hills National Forest, the Badlands National Park, and the Crazy Horse Memorial. The town is also home to several small businesses, including restaurants, retail stores, and lodging.
The town is also home to several small manufacturing companies, including a furniture factory, a woodworking shop, and a metal fabrication shop. The town is also home to several small farms, which produce a variety of crops, including corn, wheat, and hay.
Demographics
As of the 2010 census, the population of Eden was 498 people. The median age of the population was 44.7 years, and the median household income was $37,500. The town is predominantly white, with a small percentage of African Americans, Native Americans, and Hispanics.
The town is served by the Eden-Waverly School District, which consists of two elementary schools, one middle school, and one high school. The town is also home to a small library, a post office, and a volunteer fire department.
Conclusion
Eden, South Dakota is a small town located in the southeastern corner of the state. It is situated in the rolling hills of the Missouri River Valley, and is surrounded by the scenic beauty of the Black Hills. The town was founded in 1883 and has a population of approximately 500 people. The town’s economy is largely based on tourism, and it is home to several small businesses, manufacturing companies, and farms. The town is predominantly white, with a small percentage of African Americans, Native Americans, and Hispanics. The town is served by the Eden-Waverly School District, and is home to a small library, a post office, and a volunteer fire department.
Common Questions
What is Per Capita Income in Eden?
Per Capita income in Eden is $161,264.
What is the Median Family Income in Eden?
Median Family Income in Eden is $250,001.
What is the Median Household income in Eden?
Median Household Income in Eden is $250,001.
What is Income or Wage Gap in Eden?
Income or Wage Gap in Eden is 73.9%.
Women in Eden earn 26.1 cents for every dollar earned by a man.
What is Inequality or Gini Index in Eden?
Inequality or Gini Index in Eden is 0.37.
What is the Total Population of Eden?
Total Population of Eden is 173.
What is the Total Male Population of Eden?
Total Male Population of Eden is 76.
What is the Total Female Population of Eden?
Total Female Population of Eden is 97.
What is the Ratio of Males per 100 Females in Eden?
There are 78.35 Males per 100 Females in Eden.
What is the Ratio of Females per 100 Males in Eden?
There are 127.63 Females per 100 Males in Eden.
What is the Median Population Age in Eden?
Median Population Age in Eden is 59.7 Years.
What is the Average Family Size in Eden
Average Family Size in Eden is 2.3 People.
What is the Average Household Size in Eden
Average Household Size in Eden is 2.1 People.
How Large is the Labor Force in Eden?
There are 123 People in the Labor Forcein in Eden.
What is the Percentage of People in the Labor Force in Eden?
87.2% of People are in the Labor Force in Eden.