Glenbrook, NV Map & Demographics
Glenbrook Map
Glenbrook Overview
$168,572
PER CAPITA INCOME
0.59
INEQUALITY / GINI INDEX
214
TOTAL POPULATION
106
MALE POPULATION
108
FEMALE POPULATION
98.15
MALES / 100 FEMALES
101.89
FEMALES / 100 MALES
63.9
MEDIAN AGE
2.3
AVG FAMILY SIZE
2.3
AVG HOUSEHOLD SIZE
75
LABOR FORCE [ PEOPLE ]
40.3%
PERCENT IN LABOR FORCE
Glenbrook Zip Codes
Glenbrook Area Codes
Income in Glenbrook
Income Overview in Glenbrook
| Characteristic | Number | Measure |
| Per Capita Income | 214 | $168,572 |
| Median Family Income | 93 | $0 |
| Mean Family Income | 93 | $387,782 |
| Median Household Income | 93 | $0 |
| Mean Household Income | 93 | $387,782 |
| Income Deficit | 93 | $0 |
| Wage / Income Gap (%) | 214 | 0.00% |
| Wage / Income Gap ($) | 214 | 100.00¢ per $1 |
| Gini / Inequality Index | 214 | 0.59 |
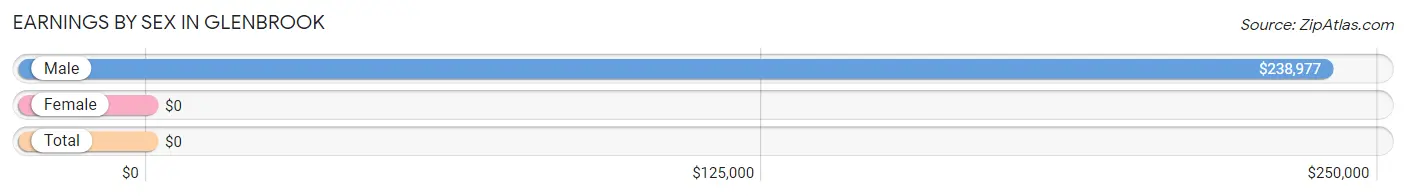
Earnings by Sex in Glenbrook
| Sex | Number | Average Earnings |
| Male | 39 (52.0%) | $238,977 |
| Female | 36 (48.0%) | $0 |
| Total | 75 (100.0%) | $0 |
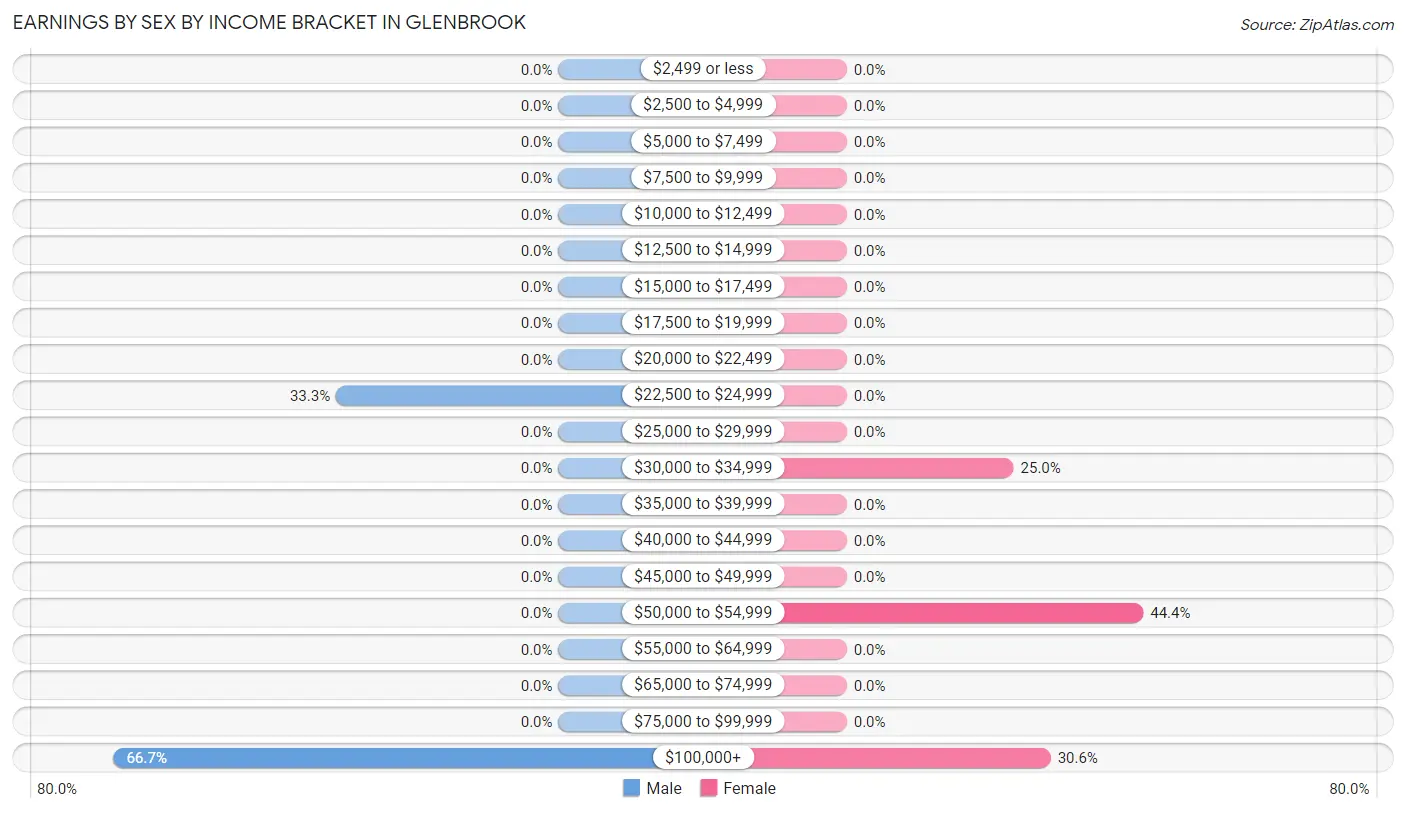
Earnings by Sex by Income Bracket in Glenbrook
The most common earnings brackets in Glenbrook are $100,000+ for men (26 | 66.7%) and $50,000 to $54,999 for women (16 | 44.4%).
| Income | Male | Female |
| $2,499 or less | 0 (0.0%) | 0 (0.0%) |
| $2,500 to $4,999 | 0 (0.0%) | 0 (0.0%) |
| $5,000 to $7,499 | 0 (0.0%) | 0 (0.0%) |
| $7,500 to $9,999 | 0 (0.0%) | 0 (0.0%) |
| $10,000 to $12,499 | 0 (0.0%) | 0 (0.0%) |
| $12,500 to $14,999 | 0 (0.0%) | 0 (0.0%) |
| $15,000 to $17,499 | 0 (0.0%) | 0 (0.0%) |
| $17,500 to $19,999 | 0 (0.0%) | 0 (0.0%) |
| $20,000 to $22,499 | 0 (0.0%) | 0 (0.0%) |
| $22,500 to $24,999 | 13 (33.3%) | 0 (0.0%) |
| $25,000 to $29,999 | 0 (0.0%) | 0 (0.0%) |
| $30,000 to $34,999 | 0 (0.0%) | 9 (25.0%) |
| $35,000 to $39,999 | 0 (0.0%) | 0 (0.0%) |
| $40,000 to $44,999 | 0 (0.0%) | 0 (0.0%) |
| $45,000 to $49,999 | 0 (0.0%) | 0 (0.0%) |
| $50,000 to $54,999 | 0 (0.0%) | 16 (44.4%) |
| $55,000 to $64,999 | 0 (0.0%) | 0 (0.0%) |
| $65,000 to $74,999 | 0 (0.0%) | 0 (0.0%) |
| $75,000 to $99,999 | 0 (0.0%) | 0 (0.0%) |
| $100,000+ | 26 (66.7%) | 11 (30.6%) |
| Total | 39 (100.0%) | 36 (100.0%) |
Earnings by Sex by Educational Attainment in Glenbrook
| Educational Attainment | Male Income | Female Income |
| Less than High School | - | - |
| High School Diploma | - | - |
| College or Associate's Degree | - | - |
| Bachelor's Degree | - | - |
| Graduate Degree | - | - |
| Total | $238,977 | $0 |
Family Income in Glenbrook
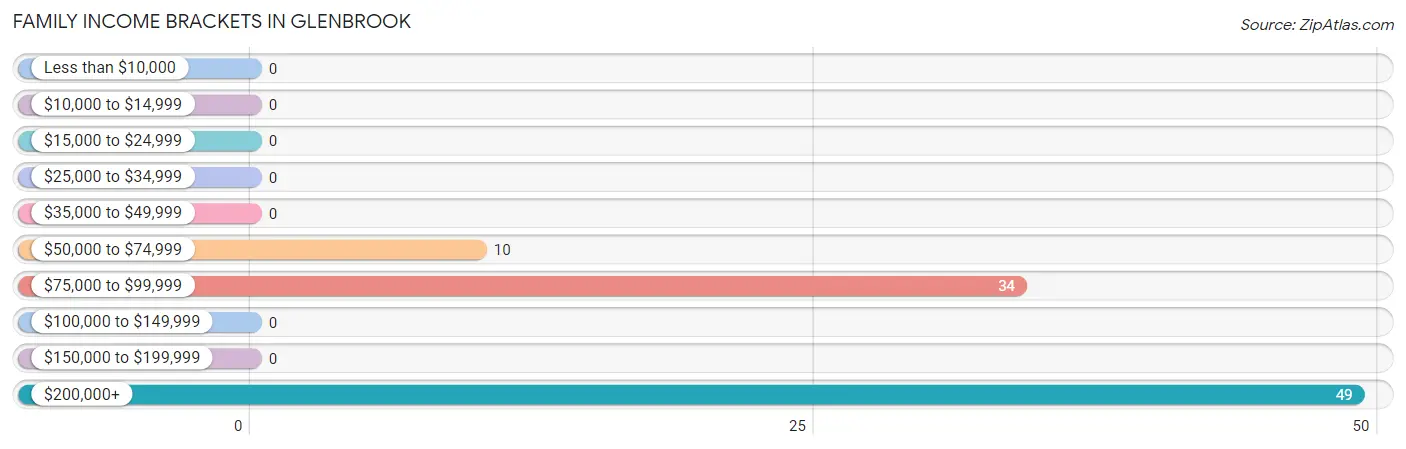
Family Income Brackets in Glenbrook
According to the Glenbrook family income data, there are 49 families falling into the $200,000+ income range, which is the most common income bracket and makes up 52.7% of all families.
| Income Bracket | # Families | % Families |
| Less than $10,000 | 0 | 0.0% |
| $10,000 to $14,999 | 0 | 0.0% |
| $15,000 to $24,999 | 0 | 0.0% |
| $25,000 to $34,999 | 0 | 0.0% |
| $35,000 to $49,999 | 0 | 0.0% |
| $50,000 to $74,999 | 10 | 10.8% |
| $75,000 to $99,999 | 34 | 36.6% |
| $100,000 to $149,999 | 0 | 0.0% |
| $150,000 to $199,999 | 0 | 0.0% |
| $200,000+ | 49 | 52.7% |
Family Income by Famaliy Size in Glenbrook
| Income Bracket | # Families | Median Income |
| 2-Person Families | 78 (83.9%) | $0 |
| 3-Person Families | 0 (0.0%) | $0 |
| 4-Person Families | 15 (16.1%) | $0 |
| 5-Person Families | 0 (0.0%) | $0 |
| 6-Person Families | 0 (0.0%) | $0 |
| 7+ Person Families | 0 (0.0%) | $0 |
| Total | 93 (100.0%) | $0 |
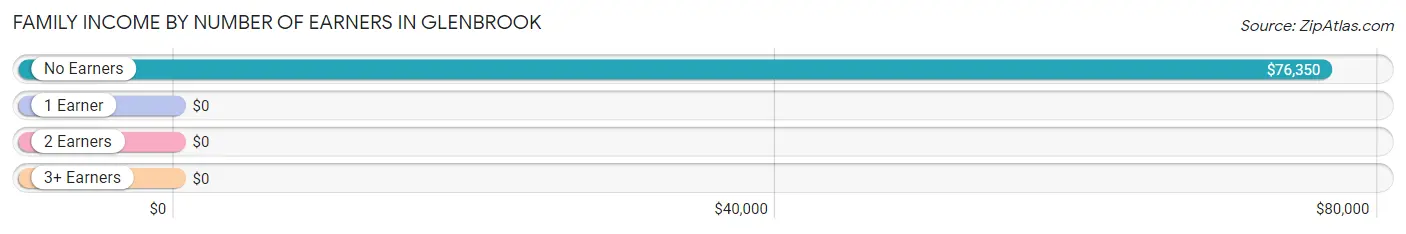
Family Income by Number of Earners in Glenbrook
| Number of Earners | # Families | Median Income |
| No Earners | 47 (50.5%) | $76,350 |
| 1 Earner | 20 (21.5%) | $0 |
| 2 Earners | 26 (28.0%) | $0 |
| 3+ Earners | 0 (0.0%) | $0 |
| Total | 93 (100.0%) | $0 |
Household Income in Glenbrook
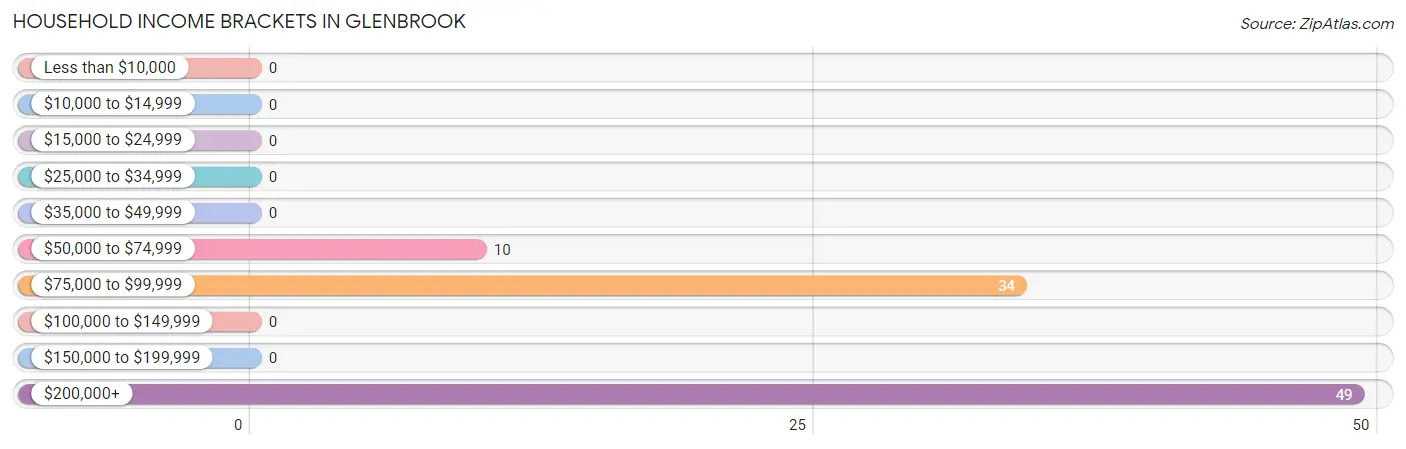
Household Income Brackets in Glenbrook
With 49 households falling in the category, the $200,000+ income range is the most frequent in Glenbrook, accounting for 52.7% of all households.
| Income Bracket | # Households | % Households |
| Less than $10,000 | 0 | 0.0% |
| $10,000 to $14,999 | 0 | 0.0% |
| $15,000 to $24,999 | 0 | 0.0% |
| $25,000 to $34,999 | 0 | 0.0% |
| $35,000 to $49,999 | 0 | 0.0% |
| $50,000 to $74,999 | 10 | 10.8% |
| $75,000 to $99,999 | 34 | 36.6% |
| $100,000 to $149,999 | 0 | 0.0% |
| $150,000 to $199,999 | 0 | 0.0% |
| $200,000+ | 49 | 52.7% |
Household Income by Householder Age in Glenbrook
The median household income in Glenbrook is $0, with the highest median household income of $250,001 found in the 45 to 64 years age bracket for the primary householder. A total of 46 households (49.5%) fall into this category.
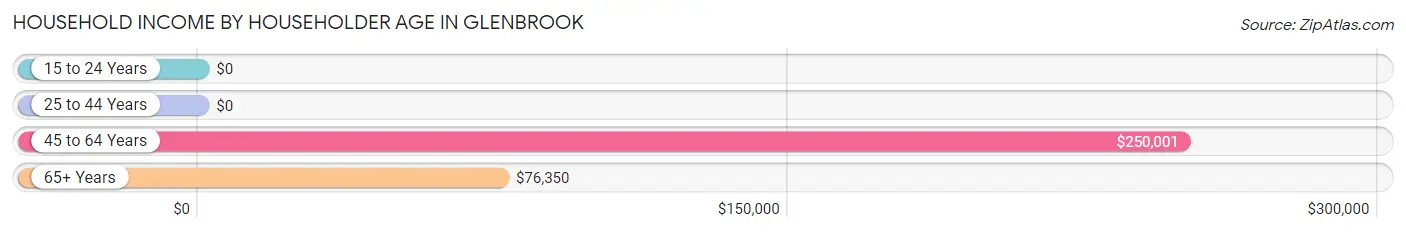
| Income Bracket | # Households | Median Income |
| 15 to 24 Years | 0 (0.0%) | $0 |
| 25 to 44 Years | 0 (0.0%) | $0 |
| 45 to 64 Years | 46 (49.5%) | $250,001 |
| 65+ Years | 47 (50.5%) | $76,350 |
| Total | 93 (100.0%) | $0 |
Poverty in Glenbrook
Income Below Poverty by Sex and Age in Glenbrook
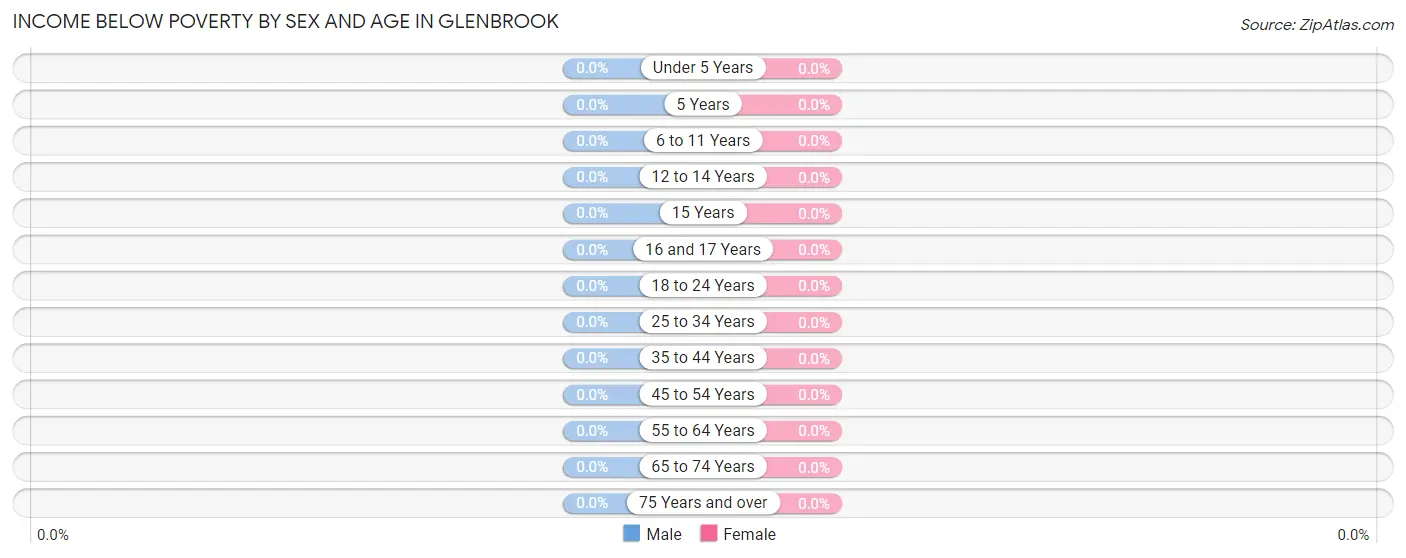
| Age Bracket | Male | Female |
| Under 5 Years | 0 (0.0%) | 0 (0.0%) |
| 5 Years | 0 (0.0%) | 0 (0.0%) |
| 6 to 11 Years | 0 (0.0%) | 0 (0.0%) |
| 12 to 14 Years | 0 (0.0%) | 0 (0.0%) |
| 15 Years | 0 (0.0%) | 0 (0.0%) |
| 16 and 17 Years | 0 (0.0%) | 0 (0.0%) |
| 18 to 24 Years | 0 (0.0%) | 0 (0.0%) |
| 25 to 34 Years | 0 (0.0%) | 0 (0.0%) |
| 35 to 44 Years | 0 (0.0%) | 0 (0.0%) |
| 45 to 54 Years | 0 (0.0%) | 0 (0.0%) |
| 55 to 64 Years | 0 (0.0%) | 0 (0.0%) |
| 65 to 74 Years | 0 (0.0%) | 0 (0.0%) |
| 75 Years and over | 0 (0.0%) | 0 (0.0%) |
| Total | 0 (0.0%) | 0 (0.0%) |
Income Above Poverty by Sex and Age in Glenbrook
According to the poverty statistics in Glenbrook, males aged 12 to 14 years and females aged 6 to 11 years are the age groups that are most secure financially, with 100.0% of males and 100.0% of females in these age groups living above the poverty line.
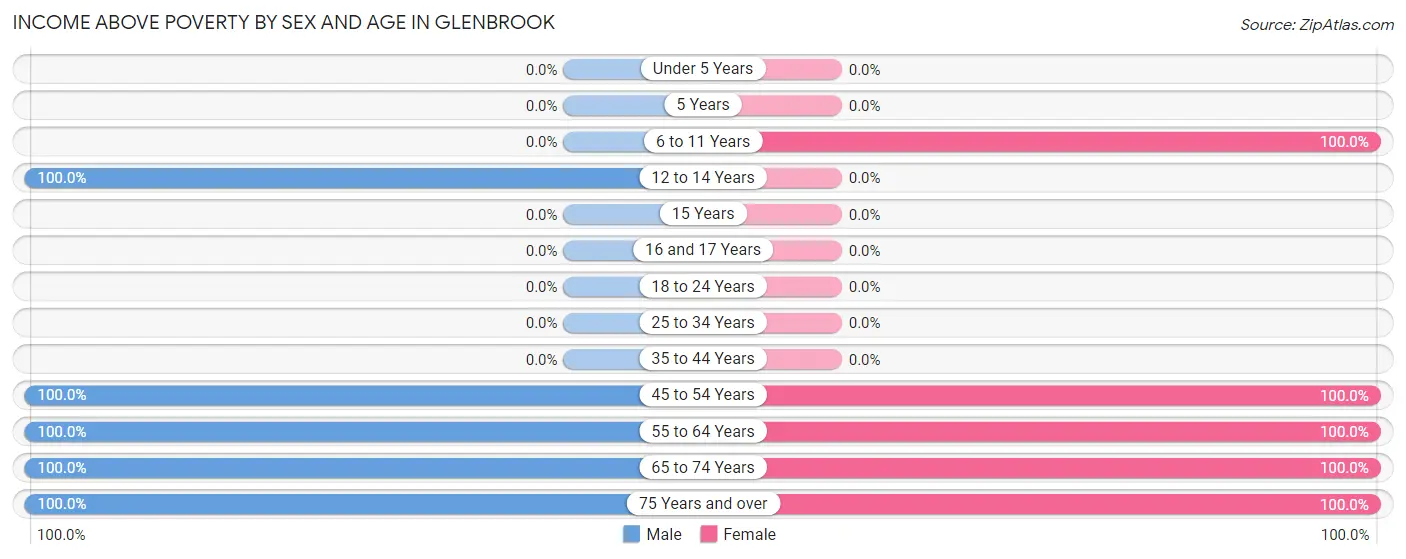
| Age Bracket | Male | Female |
| Under 5 Years | 0 (0.0%) | 0 (0.0%) |
| 5 Years | 0 (0.0%) | 0 (0.0%) |
| 6 to 11 Years | 0 (0.0%) | 15 (100.0%) |
| 12 to 14 Years | 13 (100.0%) | 0 (0.0%) |
| 15 Years | 0 (0.0%) | 0 (0.0%) |
| 16 and 17 Years | 0 (0.0%) | 0 (0.0%) |
| 18 to 24 Years | 0 (0.0%) | 0 (0.0%) |
| 25 to 34 Years | 0 (0.0%) | 0 (0.0%) |
| 35 to 44 Years | 0 (0.0%) | 0 (0.0%) |
| 45 to 54 Years | 15 (100.0%) | 16 (100.0%) |
| 55 to 64 Years | 21 (100.0%) | 30 (100.0%) |
| 65 to 74 Years | 36 (100.0%) | 32 (100.0%) |
| 75 Years and over | 21 (100.0%) | 15 (100.0%) |
| Total | 106 (100.0%) | 108 (100.0%) |
Income Below Poverty Among Married-Couple Families in Glenbrook
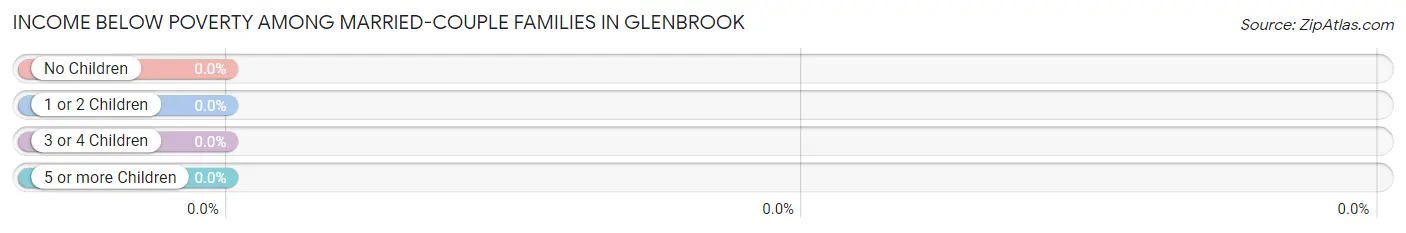
| Children | Above Poverty | Below Poverty |
| No Children | 78 (100.0%) | 0 (0.0%) |
| 1 or 2 Children | 15 (100.0%) | 0 (0.0%) |
| 3 or 4 Children | 0 (0.0%) | 0 (0.0%) |
| 5 or more Children | 0 (0.0%) | 0 (0.0%) |
| Total | 93 (100.0%) | 0 (0.0%) |
Income Below Poverty Among Single-Parent Households in Glenbrook
| Children | Single Father | Single Mother |
| No Children | 0 (0.0%) | 0 (0.0%) |
| 1 or 2 Children | 0 (0.0%) | 0 (0.0%) |
| 3 or 4 Children | 0 (0.0%) | 0 (0.0%) |
| 5 or more Children | 0 (0.0%) | 0 (0.0%) |
| Total | 0 (0.0%) | 0 (0.0%) |
Income Below Poverty Among Married-Couple vs Single-Parent Households in Glenbrook
| Children | Married-Couple Families | Single-Parent Households |
| No Children | 0 (0.0%) | 0 (0.0%) |
| 1 or 2 Children | 0 (0.0%) | 0 (0.0%) |
| 3 or 4 Children | 0 (0.0%) | 0 (0.0%) |
| 5 or more Children | 0 (0.0%) | 0 (0.0%) |
| Total | 0 (0.0%) | 0 (0.0%) |
Race in Glenbrook
The most populous races in Glenbrook are , and White / Caucasian (214 | 100.0%).
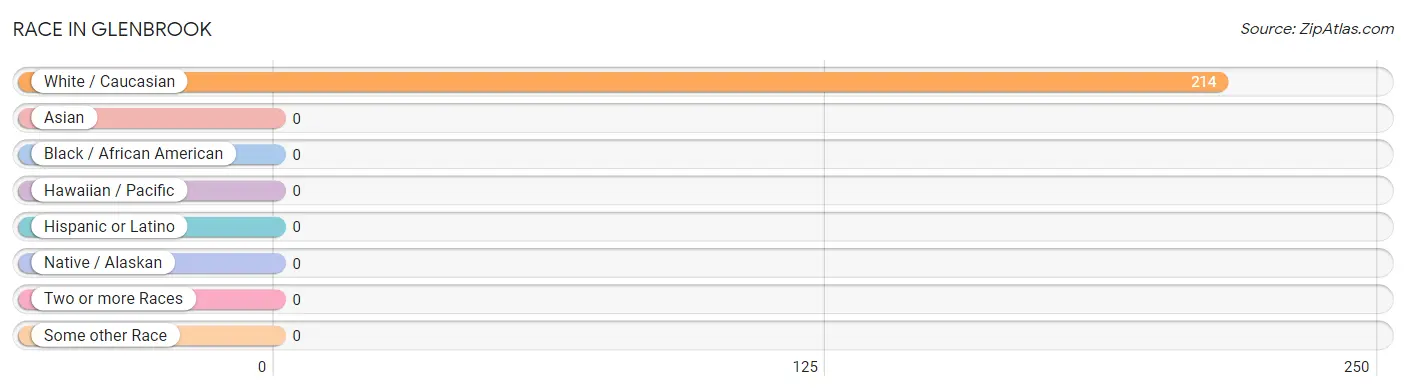
| Race | # Population | % Population |
| Asian | 0 | 0.0% |
| Black / African American | 0 | 0.0% |
| Hawaiian / Pacific | 0 | 0.0% |
| Hispanic or Latino | 0 | 0.0% |
| Native / Alaskan | 0 | 0.0% |
| White / Caucasian | 214 | 100.0% |
| Two or more Races | 0 | 0.0% |
| Some other Race | 0 | 0.0% |
| Total | 214 | 100.0% |
Ancestry in Glenbrook
The most populous ancestries reported in Glenbrook are German (96 | 44.9%), English (69 | 32.2%), Norwegian (25 | 11.7%), European (21 | 9.8%), and Irish (20 | 9.3%), together accounting for 107.9% of all Glenbrook residents.
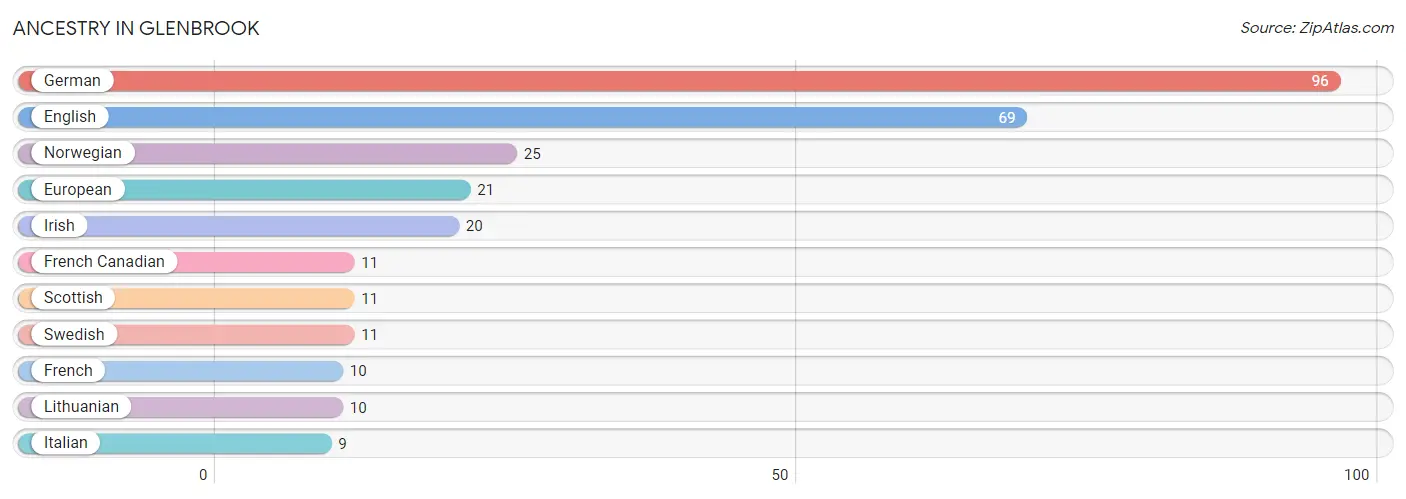
| Ancestry | # Population | % Population |
| English | 69 | 32.2% |
| European | 21 | 9.8% |
| French | 10 | 4.7% |
| French Canadian | 11 | 5.1% |
| German | 96 | 44.9% |
| Irish | 20 | 9.3% |
| Italian | 9 | 4.2% |
| Lithuanian | 10 | 4.7% |
| Norwegian | 25 | 11.7% |
| Scottish | 11 | 5.1% |
| Swedish | 11 | 5.1% | View All 11 Rows |
Immigrants in Glenbrook

| Immigration Origin | # Population | % Population | View All 0 Rows |
Sex and Age in Glenbrook
Sex and Age in Glenbrook
The most populous age groups in Glenbrook are 65 to 69 Years (24 | 22.6%) for men and 70 to 74 Years (22 | 20.4%) for women.
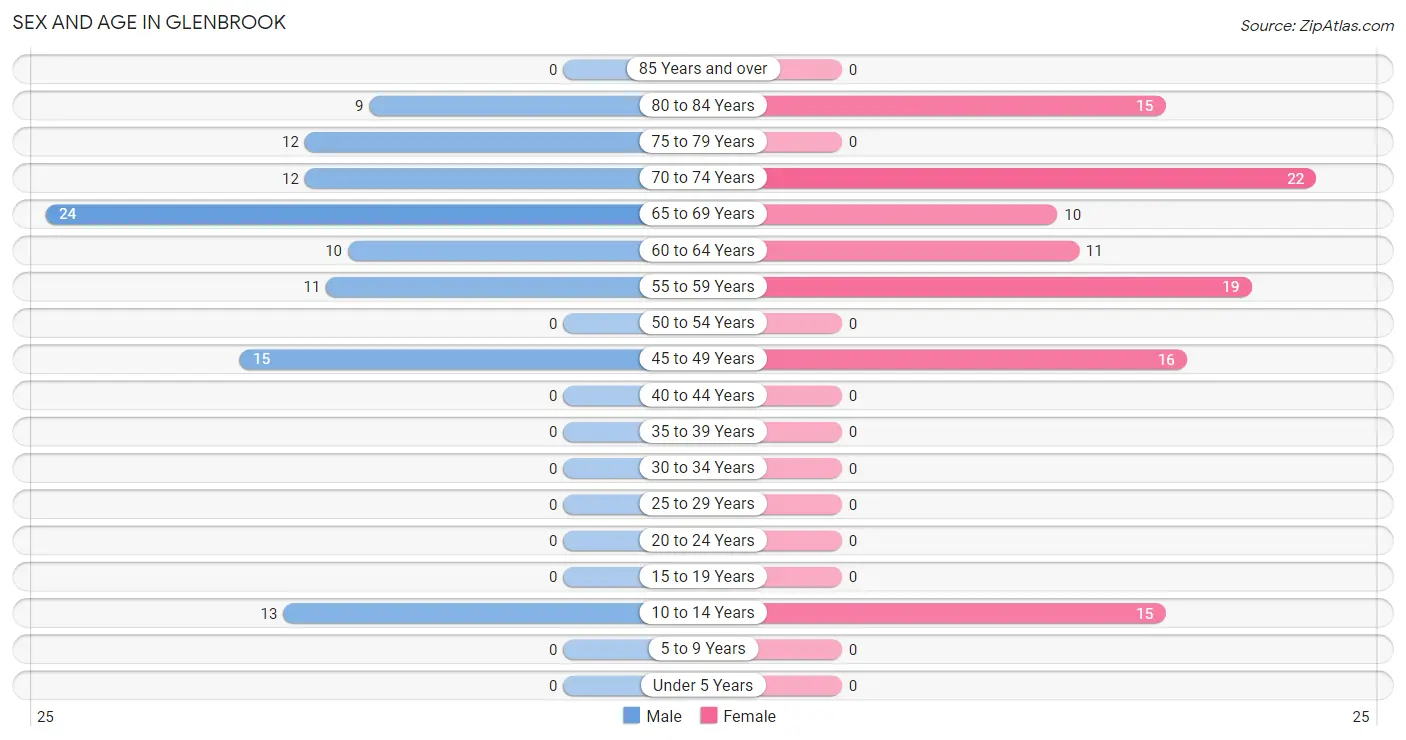
| Age Bracket | Male | Female |
| Under 5 Years | 0 (0.0%) | 0 (0.0%) |
| 5 to 9 Years | 0 (0.0%) | 0 (0.0%) |
| 10 to 14 Years | 13 (12.3%) | 15 (13.9%) |
| 15 to 19 Years | 0 (0.0%) | 0 (0.0%) |
| 20 to 24 Years | 0 (0.0%) | 0 (0.0%) |
| 25 to 29 Years | 0 (0.0%) | 0 (0.0%) |
| 30 to 34 Years | 0 (0.0%) | 0 (0.0%) |
| 35 to 39 Years | 0 (0.0%) | 0 (0.0%) |
| 40 to 44 Years | 0 (0.0%) | 0 (0.0%) |
| 45 to 49 Years | 15 (14.1%) | 16 (14.8%) |
| 50 to 54 Years | 0 (0.0%) | 0 (0.0%) |
| 55 to 59 Years | 11 (10.4%) | 19 (17.6%) |
| 60 to 64 Years | 10 (9.4%) | 11 (10.2%) |
| 65 to 69 Years | 24 (22.6%) | 10 (9.3%) |
| 70 to 74 Years | 12 (11.3%) | 22 (20.4%) |
| 75 to 79 Years | 12 (11.3%) | 0 (0.0%) |
| 80 to 84 Years | 9 (8.5%) | 15 (13.9%) |
| 85 Years and over | 0 (0.0%) | 0 (0.0%) |
| Total | 106 (100.0%) | 108 (100.0%) |
Families and Households in Glenbrook
Median Family Size in Glenbrook
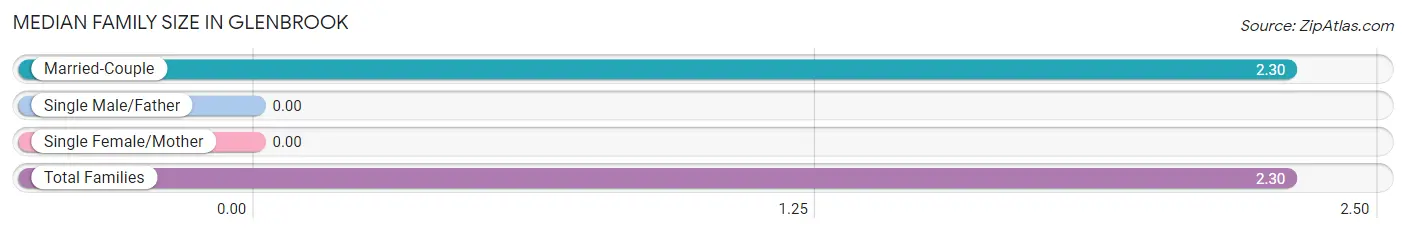
| Family Type | # Families | Family Size |
| Married-Couple | 93 (100.0%) | 2.30 |
| Single Male/Father | 0 (0.0%) | - |
| Single Female/Mother | 0 (0.0%) | - |
| Total Families | 93 (100.0%) | 2.30 |
Median Household Size in Glenbrook
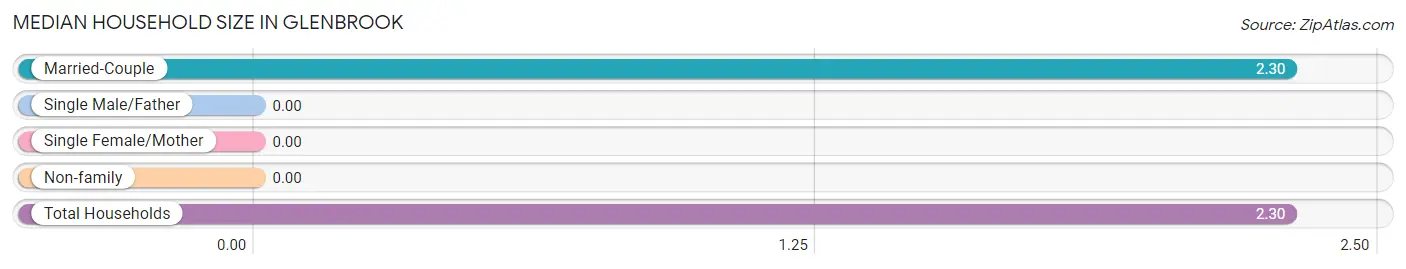
| Household Type | # Households | Household Size |
| Married-Couple | 93 (100.0%) | 2.30 |
| Single Male/Father | 0 (0.0%) | - |
| Single Female/Mother | 0 (0.0%) | - |
| Non-family | 0 (0.0%) | - |
| Total Households | 93 (100.0%) | 2.30 |
Household Size by Marriage Status in Glenbrook
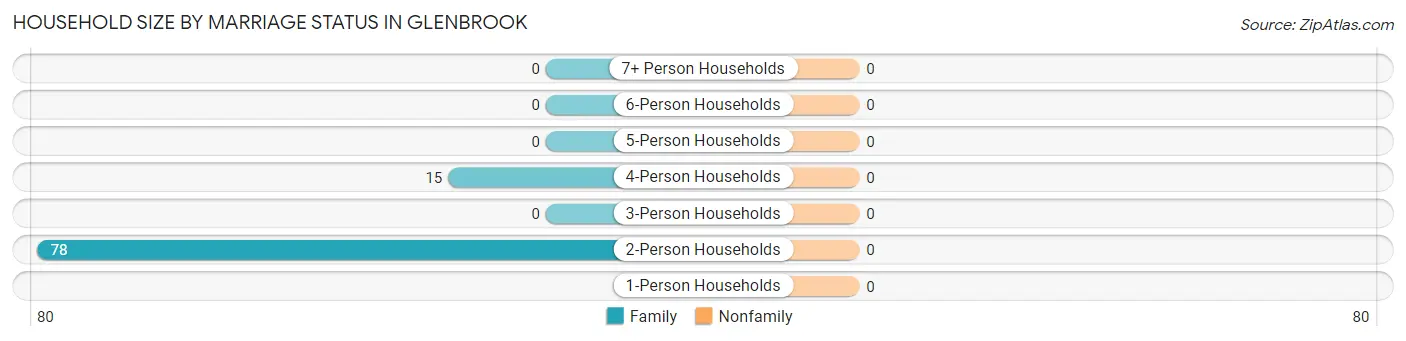
| Household Size | Family Households | Nonfamily Households |
| 1-Person Households | - | 0 (0.0%) |
| 2-Person Households | 78 (83.9%) | 0 (0.0%) |
| 3-Person Households | 0 (0.0%) | 0 (0.0%) |
| 4-Person Households | 15 (16.1%) | 0 (0.0%) |
| 5-Person Households | 0 (0.0%) | 0 (0.0%) |
| 6-Person Households | 0 (0.0%) | 0 (0.0%) |
| 7+ Person Households | 0 (0.0%) | 0 (0.0%) |
| Total | 93 (100.0%) | 0 (0.0%) |
Female Fertility in Glenbrook
Fertility by Age in Glenbrook
| Age Bracket | Women with Births | Births / 1,000 Women |
| 15 to 19 years | 0 (0.0%) | 0.0 |
| 20 to 34 years | 0 (0.0%) | 0.0 |
| 35 to 50 years | 0 (0.0%) | 0.0 |
| Total | 0 (0.0%) | 0.0 |
Fertility by Age by Marriage Status in Glenbrook
| Age Bracket | Married | Unmarried |
| 15 to 19 years | 0 (0.0%) | 0 (0.0%) |
| 20 to 34 years | 0 (0.0%) | 0 (0.0%) |
| 35 to 50 years | 0 (0.0%) | 0 (0.0%) |
| Total | 0 (0.0%) | 0 (0.0%) |
Fertility by Education in Glenbrook
| Educational Attainment | Women with Births | Births / 1,000 Women |
| Less than High School | 0 (0.0%) | 0.0 |
| High School Diploma | 0 (0.0%) | 0.0 |
| College or Associate's Degree | 0 (0.0%) | 0.0 |
| Bachelor's Degree | 0 (0.0%) | 0.0 |
| Graduate Degree | 0 (0.0%) | 0.0 |
| Total | 0 (0.0%) | 0.0 |
Fertility by Education by Marriage Status in Glenbrook
| Educational Attainment | Married | Unmarried |
| Less than High School | 0 (0.0%) | 0 (0.0%) |
| High School Diploma | 0 (0.0%) | 0 (0.0%) |
| College or Associate's Degree | 0 (0.0%) | 0 (0.0%) |
| Bachelor's Degree | 0 (0.0%) | 0 (0.0%) |
| Graduate Degree | 0 (0.0%) | 0 (0.0%) |
| Total | 0 (0.0%) | 0 (0.0%) |
Employment Characteristics in Glenbrook
Employment by Class of Employer in Glenbrook
Among the 75 employed individuals in Glenbrook, self-employed (not incorporated) (36 | 48.0%), private company employees (26 | 34.7%), and state government employees (13 | 17.3%) make up the most common classes of employment.
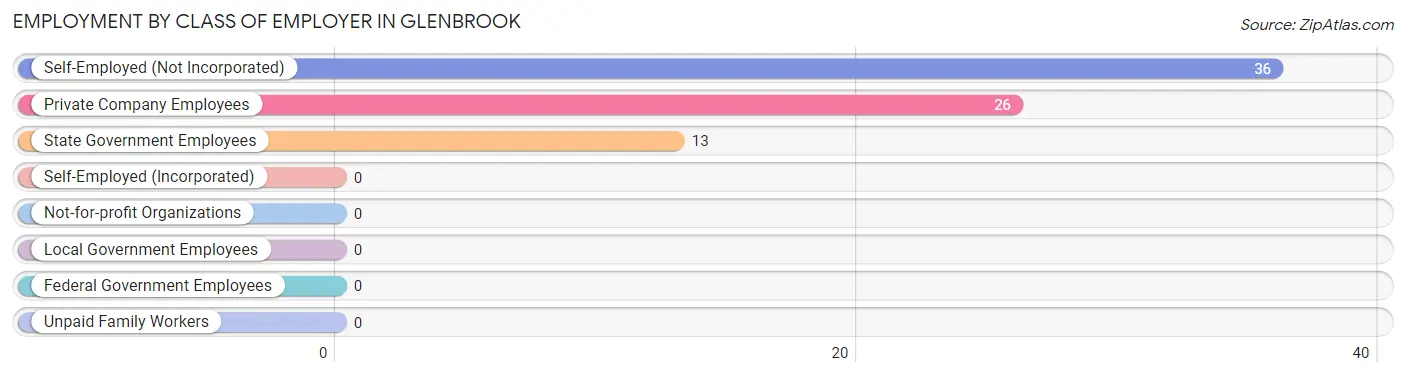
| Employer Class | # Employees | % Employees |
| Private Company Employees | 26 | 34.7% |
| Self-Employed (Incorporated) | 0 | 0.0% |
| Self-Employed (Not Incorporated) | 36 | 48.0% |
| Not-for-profit Organizations | 0 | 0.0% |
| Local Government Employees | 0 | 0.0% |
| State Government Employees | 13 | 17.3% |
| Federal Government Employees | 0 | 0.0% |
| Unpaid Family Workers | 0 | 0.0% |
| Total | 75 | 100.0% |
Employment Status by Age in Glenbrook
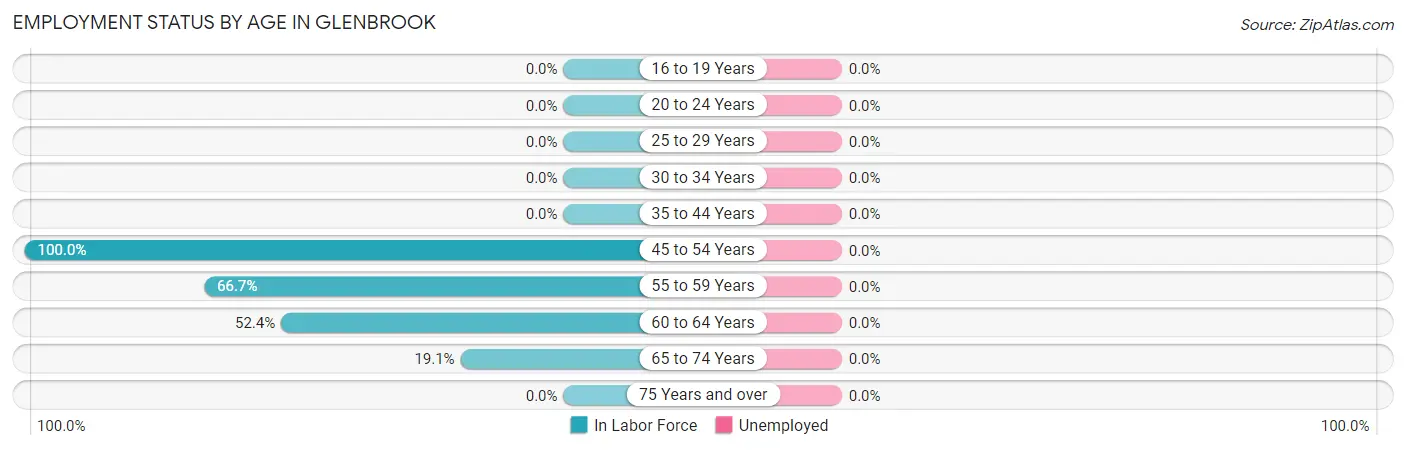
| Age Bracket | In Labor Force | Unemployed |
| 16 to 19 Years | 0 (0.0%) | 0 (0.0%) |
| 20 to 24 Years | 0 (0.0%) | 0 (0.0%) |
| 25 to 29 Years | 0 (0.0%) | 0 (0.0%) |
| 30 to 34 Years | 0 (0.0%) | 0 (0.0%) |
| 35 to 44 Years | 0 (0.0%) | 0 (0.0%) |
| 45 to 54 Years | 31 (100.0%) | 0 (0.0%) |
| 55 to 59 Years | 20 (66.7%) | 0 (0.0%) |
| 60 to 64 Years | 11 (52.4%) | 0 (0.0%) |
| 65 to 74 Years | 13 (19.1%) | 0 (0.0%) |
| 75 Years and over | 0 (0.0%) | 0 (0.0%) |
| Total | 75 (40.3%) | 0 (0.0%) |
Employment Status by Educational Attainment in Glenbrook
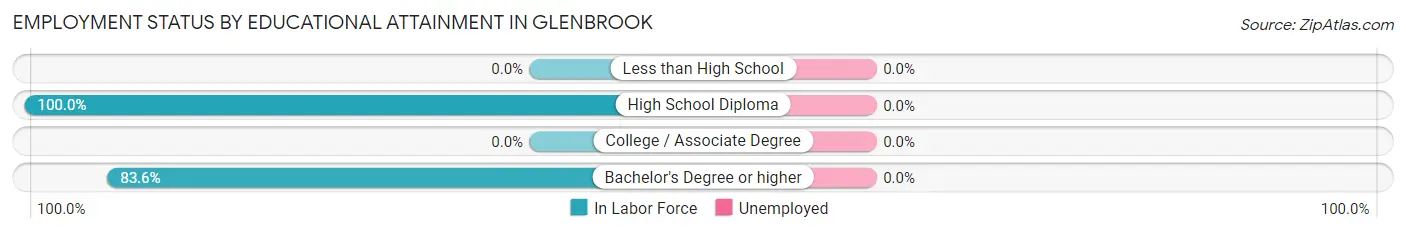
| Educational Attainment | In Labor Force | Unemployed |
| Less than High School | 0 (0.0%) | 0 (0.0%) |
| High School Diploma | 11 (100.0%) | 0 (0.0%) |
| College / Associate Degree | 0 (0.0%) | 0 (0.0%) |
| Bachelor's Degree or higher | 51 (83.6%) | 0 (0.0%) |
| Total | 62 (75.6%) | 0 (0.0%) |
Employment Occupations by Sex in Glenbrook
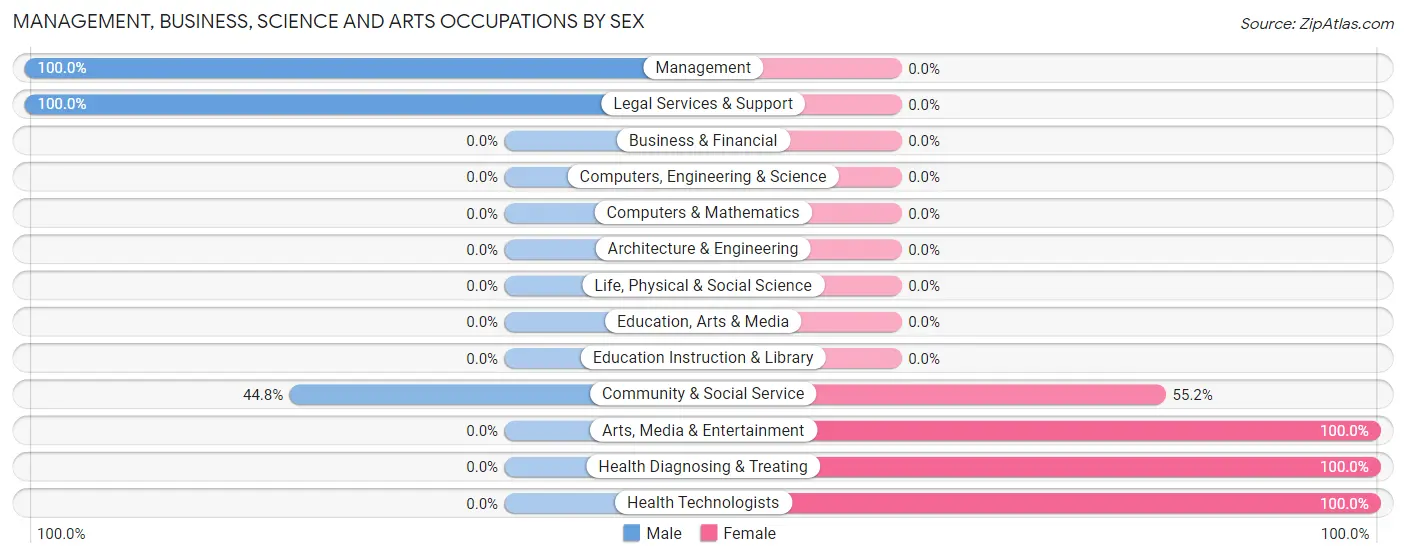
Management, Business, Science and Arts Occupations
The most common Management, Business, Science and Arts occupations in Glenbrook are Community & Social Service (29 | 38.7%), Management (26 | 34.7%), Arts, Media & Entertainment (16 | 21.3%), Legal Services & Support (13 | 17.3%), and Health Diagnosing & Treating (11 | 14.7%).
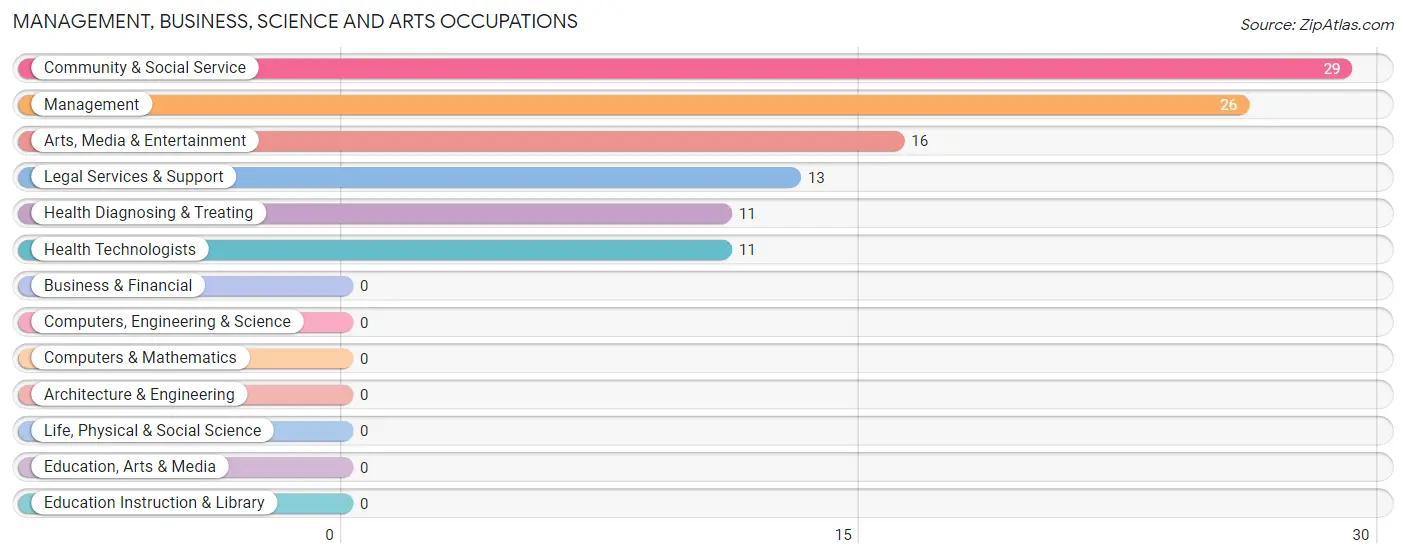
Management, Business, Science and Arts Occupations by Sex
Within the Management, Business, Science and Arts occupations in Glenbrook, the most male-oriented occupations are Management (100.0%), Legal Services & Support (100.0%), and Community & Social Service (44.8%), while the most female-oriented occupations are Arts, Media & Entertainment (100.0%), Health Diagnosing & Treating (100.0%), and Health Technologists (100.0%).
| Occupation | Male | Female |
| Management | 26 (100.0%) | 0 (0.0%) |
| Business & Financial | 0 (0.0%) | 0 (0.0%) |
| Computers, Engineering & Science | 0 (0.0%) | 0 (0.0%) |
| Computers & Mathematics | 0 (0.0%) | 0 (0.0%) |
| Architecture & Engineering | 0 (0.0%) | 0 (0.0%) |
| Life, Physical & Social Science | 0 (0.0%) | 0 (0.0%) |
| Community & Social Service | 13 (44.8%) | 16 (55.2%) |
| Education, Arts & Media | 0 (0.0%) | 0 (0.0%) |
| Legal Services & Support | 13 (100.0%) | 0 (0.0%) |
| Education Instruction & Library | 0 (0.0%) | 0 (0.0%) |
| Arts, Media & Entertainment | 0 (0.0%) | 16 (100.0%) |
| Health Diagnosing & Treating | 0 (0.0%) | 11 (100.0%) |
| Health Technologists | 0 (0.0%) | 11 (100.0%) |
| Total (Category) | 39 (59.1%) | 27 (40.9%) |
| Total (Overall) | 39 (52.0%) | 36 (48.0%) |
Services Occupations
Services Occupations by Sex
| Occupation | Male | Female |
| Healthcare Support | 0 (0.0%) | 0 (0.0%) |
| Security & Protection | 0 (0.0%) | 0 (0.0%) |
| Firefighting & Prevention | 0 (0.0%) | 0 (0.0%) |
| Law Enforcement | 0 (0.0%) | 0 (0.0%) |
| Food Preparation & Serving | 0 (0.0%) | 0 (0.0%) |
| Cleaning & Maintenance | 0 (0.0%) | 0 (0.0%) |
| Personal Care & Service | 0 (0.0%) | 0 (0.0%) |
| Total (Category) | 0 (0.0%) | 0 (0.0%) |
| Total (Overall) | 39 (52.0%) | 36 (48.0%) |
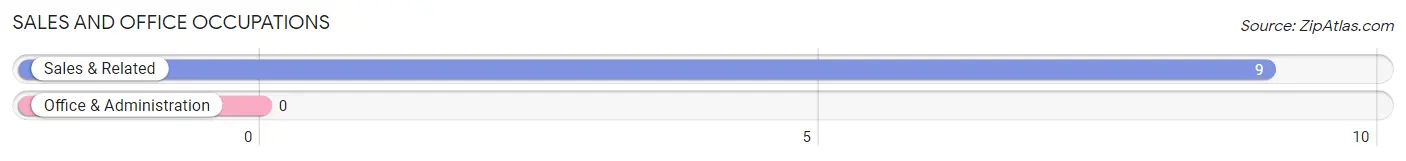
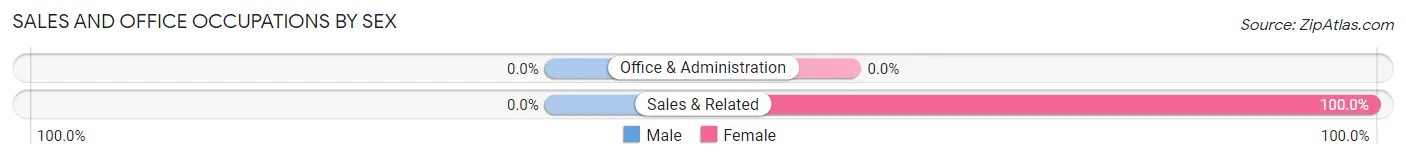
Sales and Office Occupations
The most common Sales and Office occupations in Glenbrook are , and Sales & Related (9 | 12.0%).
Sales and Office Occupations by Sex
| Occupation | Male | Female |
| Sales & Related | 0 (0.0%) | 9 (100.0%) |
| Office & Administration | 0 (0.0%) | 0 (0.0%) |
| Total (Category) | 0 (0.0%) | 9 (100.0%) |
| Total (Overall) | 39 (52.0%) | 36 (48.0%) |
Natural Resources, Construction and Maintenance Occupations
Natural Resources, Construction and Maintenance Occupations by Sex
| Occupation | Male | Female |
| Farming, Fishing & Forestry | 0 (0.0%) | 0 (0.0%) |
| Construction & Extraction | 0 (0.0%) | 0 (0.0%) |
| Installation, Maintenance & Repair | 0 (0.0%) | 0 (0.0%) |
| Total (Category) | 0 (0.0%) | 0 (0.0%) |
| Total (Overall) | 39 (52.0%) | 36 (48.0%) |
Production, Transportation and Moving Occupations
Production, Transportation and Moving Occupations by Sex
| Occupation | Male | Female |
| Production | 0 (0.0%) | 0 (0.0%) |
| Transportation | 0 (0.0%) | 0 (0.0%) |
| Material Moving | 0 (0.0%) | 0 (0.0%) |
| Total (Category) | 0 (0.0%) | 0 (0.0%) |
| Total (Overall) | 39 (52.0%) | 36 (48.0%) |
Employment Industries by Sex in Glenbrook
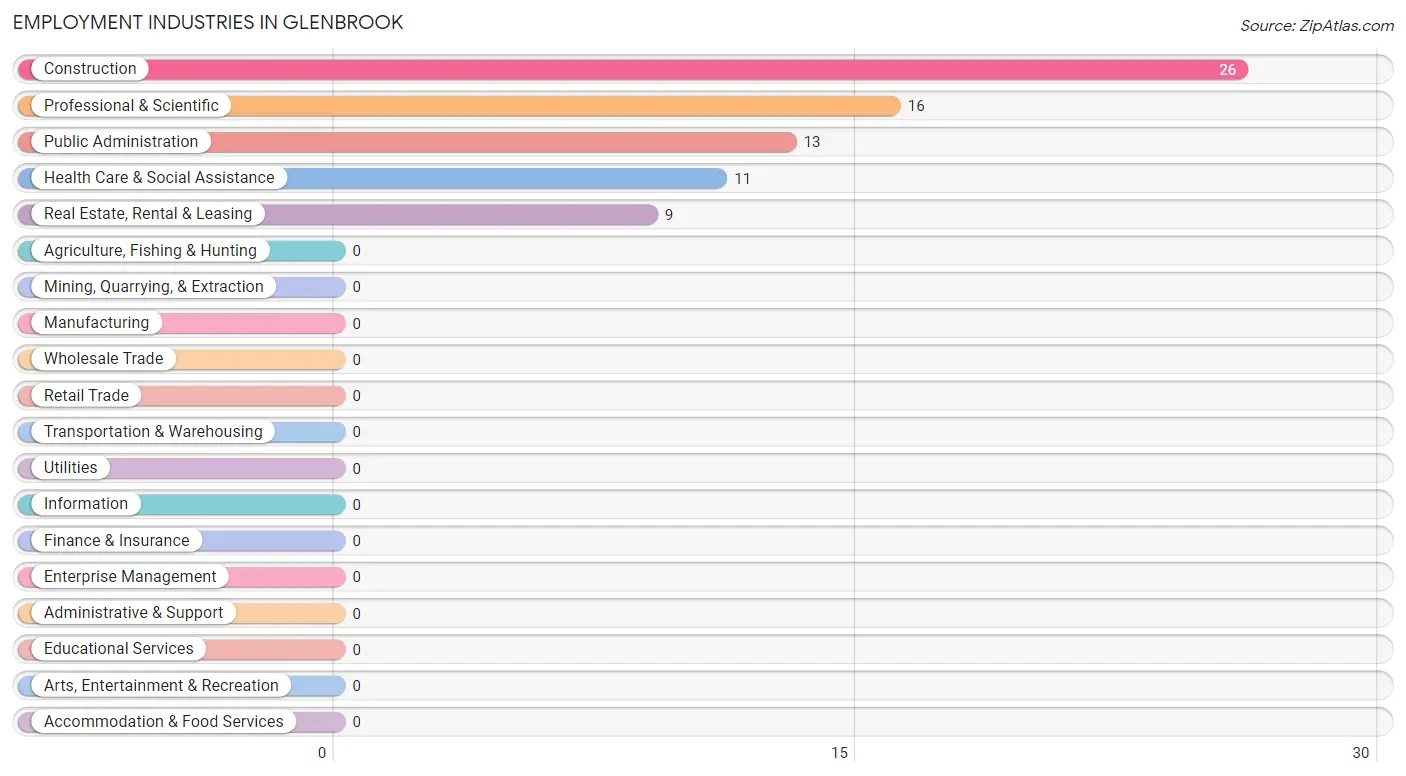
Employment Industries in Glenbrook
The major employment industries in Glenbrook include Construction (26 | 34.7%), Professional & Scientific (16 | 21.3%), Public Administration (13 | 17.3%), Health Care & Social Assistance (11 | 14.7%), and Real Estate, Rental & Leasing (9 | 12.0%).
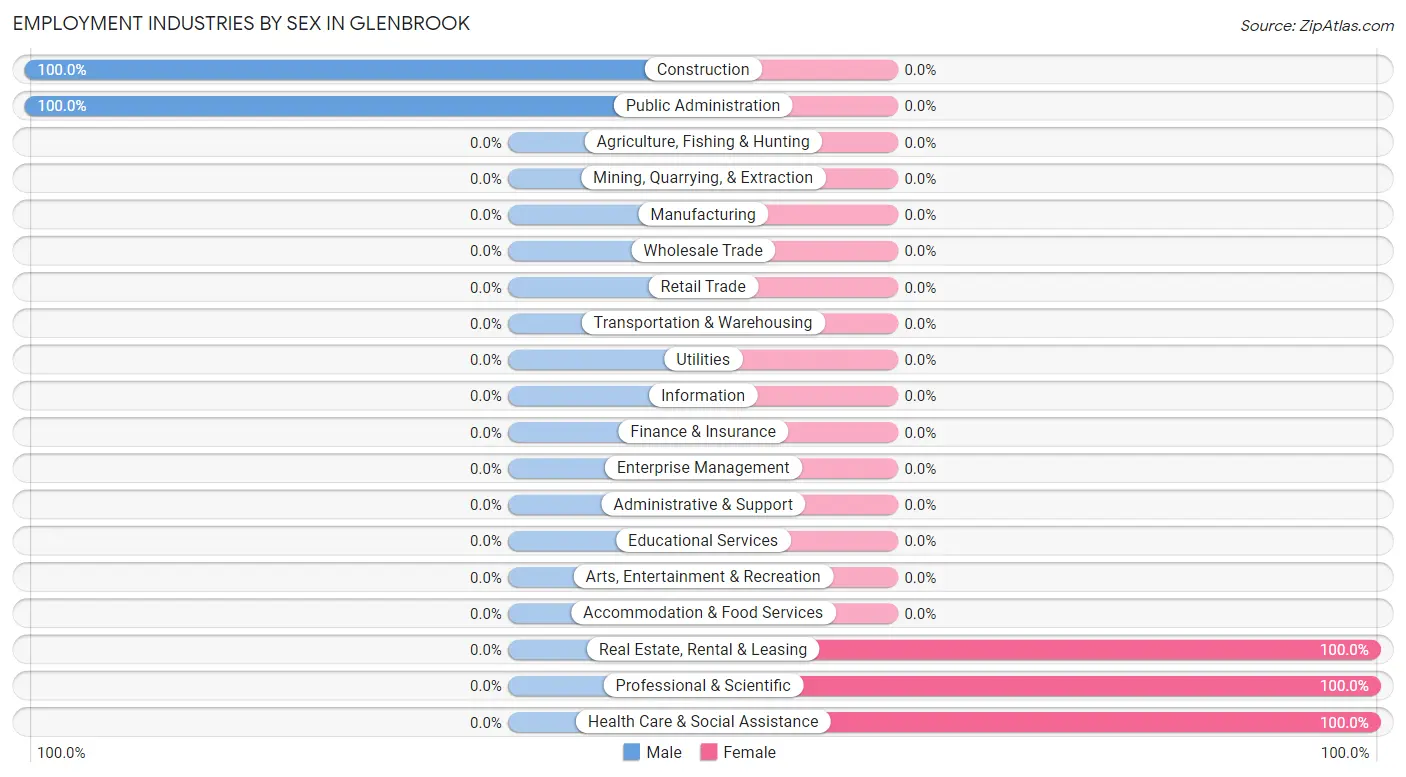
Employment Industries by Sex in Glenbrook
The Glenbrook industries that see more men than women are Construction (100.0%), and Public Administration (100.0%), whereas the industries that tend to have a higher number of women are Real Estate, Rental & Leasing (100.0%), Professional & Scientific (100.0%), and Health Care & Social Assistance (100.0%).
| Industry | Male | Female |
| Agriculture, Fishing & Hunting | 0 (0.0%) | 0 (0.0%) |
| Mining, Quarrying, & Extraction | 0 (0.0%) | 0 (0.0%) |
| Construction | 26 (100.0%) | 0 (0.0%) |
| Manufacturing | 0 (0.0%) | 0 (0.0%) |
| Wholesale Trade | 0 (0.0%) | 0 (0.0%) |
| Retail Trade | 0 (0.0%) | 0 (0.0%) |
| Transportation & Warehousing | 0 (0.0%) | 0 (0.0%) |
| Utilities | 0 (0.0%) | 0 (0.0%) |
| Information | 0 (0.0%) | 0 (0.0%) |
| Finance & Insurance | 0 (0.0%) | 0 (0.0%) |
| Real Estate, Rental & Leasing | 0 (0.0%) | 9 (100.0%) |
| Professional & Scientific | 0 (0.0%) | 16 (100.0%) |
| Enterprise Management | 0 (0.0%) | 0 (0.0%) |
| Administrative & Support | 0 (0.0%) | 0 (0.0%) |
| Educational Services | 0 (0.0%) | 0 (0.0%) |
| Health Care & Social Assistance | 0 (0.0%) | 11 (100.0%) |
| Arts, Entertainment & Recreation | 0 (0.0%) | 0 (0.0%) |
| Accommodation & Food Services | 0 (0.0%) | 0 (0.0%) |
| Public Administration | 13 (100.0%) | 0 (0.0%) |
| Total | 39 (52.0%) | 36 (48.0%) |
Education in Glenbrook
School Enrollment in Glenbrook
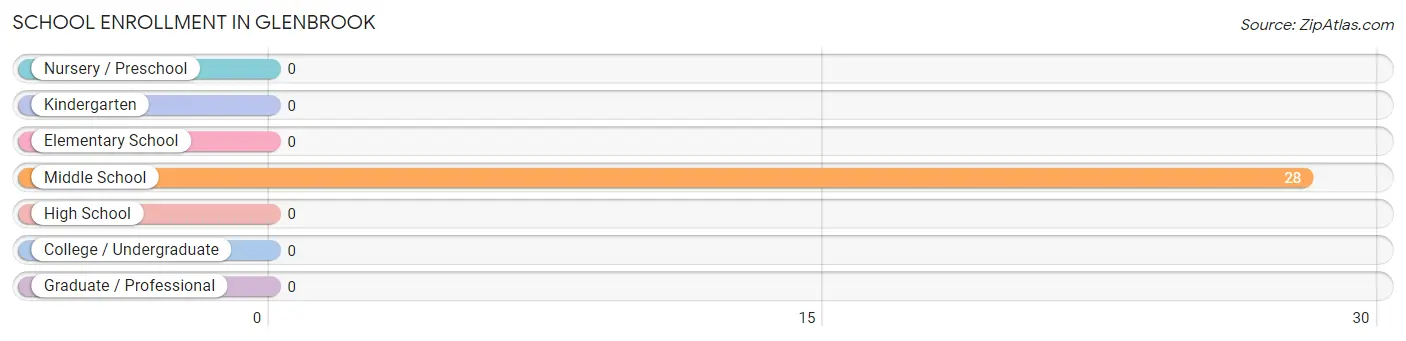
| School Level | # Students | % Students |
| Nursery / Preschool | 0 | 0.0% |
| Kindergarten | 0 | 0.0% |
| Elementary School | 0 | 0.0% |
| Middle School | 28 | 100.0% |
| High School | 0 | 0.0% |
| College / Undergraduate | 0 | 0.0% |
| Graduate / Professional | 0 | 0.0% |
| Total | 28 | 100.0% |
School Enrollment by Age by Funding Source in Glenbrook
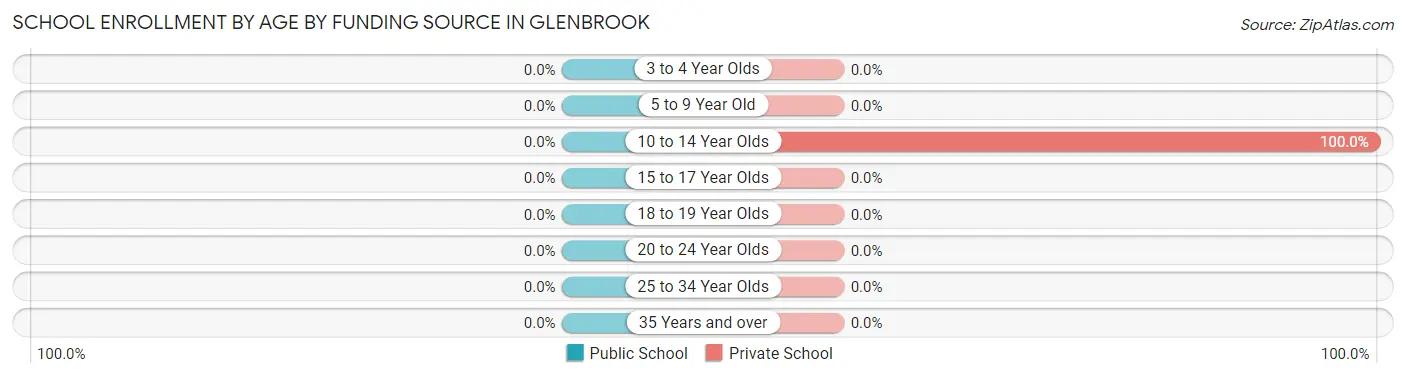
| Age Bracket | Public School | Private School |
| 3 to 4 Year Olds | 0 (0.0%) | 0 (0.0%) |
| 5 to 9 Year Old | 0 (0.0%) | 0 (0.0%) |
| 10 to 14 Year Olds | 0 (0.0%) | 28 (100.0%) |
| 15 to 17 Year Olds | 0 (0.0%) | 0 (0.0%) |
| 18 to 19 Year Olds | 0 (0.0%) | 0 (0.0%) |
| 20 to 24 Year Olds | 0 (0.0%) | 0 (0.0%) |
| 25 to 34 Year Olds | 0 (0.0%) | 0 (0.0%) |
| 35 Years and over | 0 (0.0%) | 0 (0.0%) |
| Total | 0 (0.0%) | 28 (100.0%) |
Educational Attainment by Field of Study in Glenbrook
Business (70 | 51.1%), social sciences (16 | 11.7%), engineering (12 | 8.8%), science & technology (11 | 8.0%), and arts & humanities (10 | 7.3%) are the most common fields of study among 137 individuals in Glenbrook who have obtained a bachelor's degree or higher.
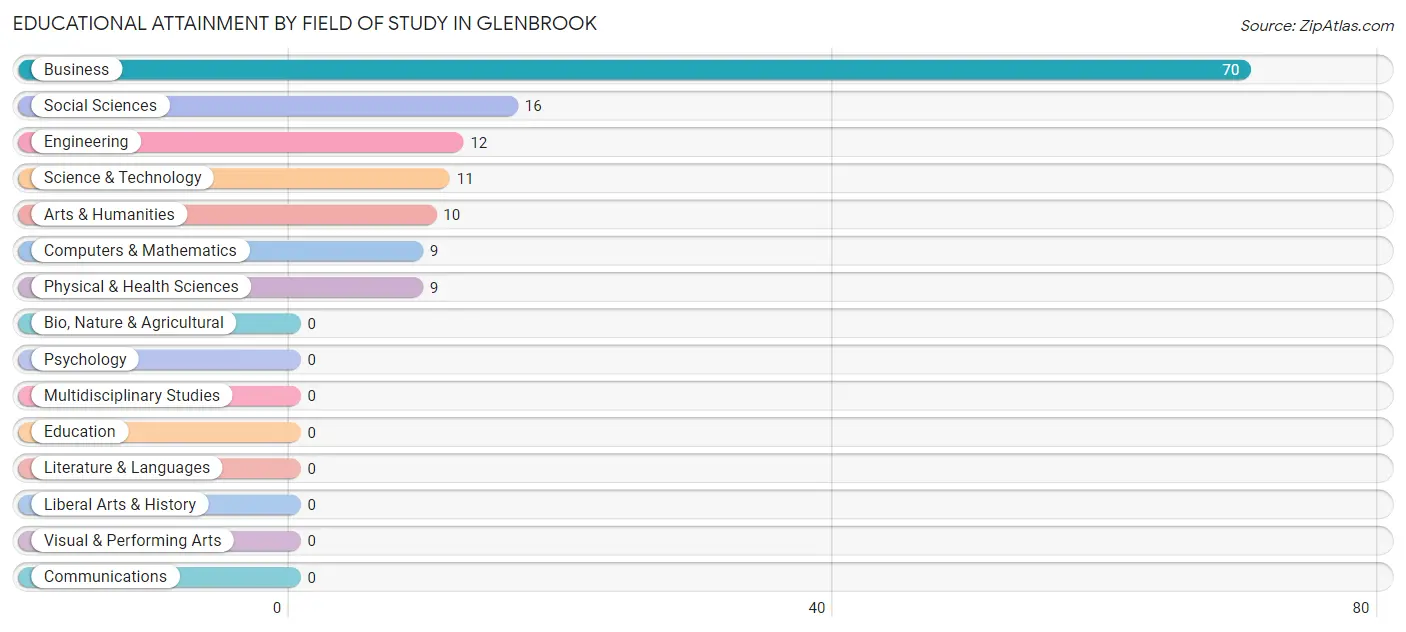
| Field of Study | # Graduates | % Graduates |
| Computers & Mathematics | 9 | 6.6% |
| Bio, Nature & Agricultural | 0 | 0.0% |
| Physical & Health Sciences | 9 | 6.6% |
| Psychology | 0 | 0.0% |
| Social Sciences | 16 | 11.7% |
| Engineering | 12 | 8.8% |
| Multidisciplinary Studies | 0 | 0.0% |
| Science & Technology | 11 | 8.0% |
| Business | 70 | 51.1% |
| Education | 0 | 0.0% |
| Literature & Languages | 0 | 0.0% |
| Liberal Arts & History | 0 | 0.0% |
| Visual & Performing Arts | 0 | 0.0% |
| Communications | 0 | 0.0% |
| Arts & Humanities | 10 | 7.3% |
| Total | 137 | 100.0% |
Transportation & Commute in Glenbrook
Vehicle Availability by Sex in Glenbrook
The most prevalent vehicle ownership categories in Glenbrook are males with 2 vehicles (26, accounting for 66.7%) and females with 2 vehicles (25, making up 72.2%).
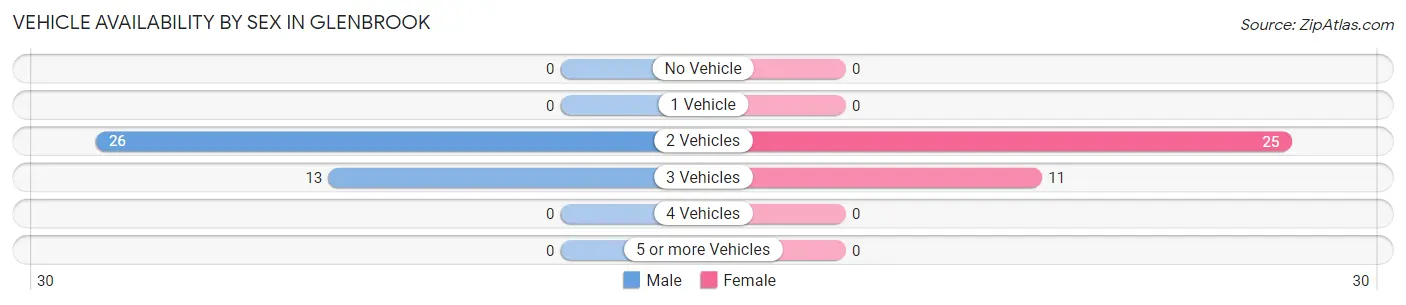
| Vehicles Available | Male | Female |
| No Vehicle | 0 (0.0%) | 0 (0.0%) |
| 1 Vehicle | 0 (0.0%) | 0 (0.0%) |
| 2 Vehicles | 26 (66.7%) | 25 (69.4%) |
| 3 Vehicles | 13 (33.3%) | 11 (30.6%) |
| 4 Vehicles | 0 (0.0%) | 0 (0.0%) |
| 5 or more Vehicles | 0 (0.0%) | 0 (0.0%) |
| Total | 39 (100.0%) | 36 (100.0%) |
Commute Time in Glenbrook
The most frequently occuring commute durations in Glenbrook are 90 or more minutes (15 commuters, 32.6%), 5 to 9 minutes (11 commuters, 23.9%), and 30 to 34 minutes (11 commuters, 23.9%).
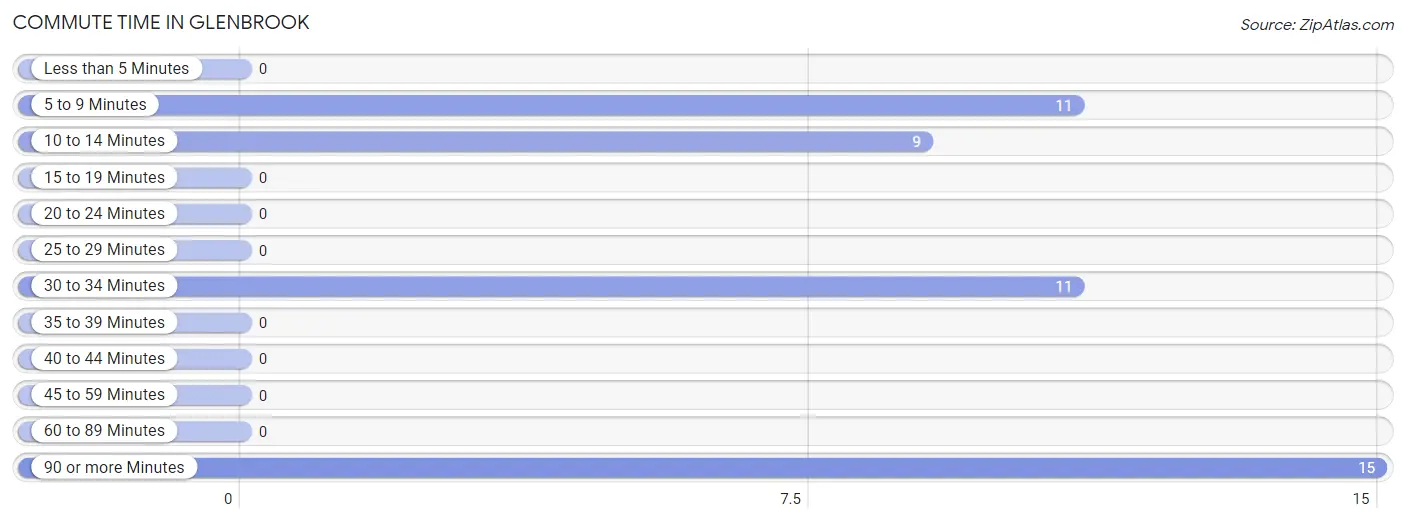
| Commute Time | # Commuters | % Commuters |
| Less than 5 Minutes | 0 | 0.0% |
| 5 to 9 Minutes | 11 | 23.9% |
| 10 to 14 Minutes | 9 | 19.6% |
| 15 to 19 Minutes | 0 | 0.0% |
| 20 to 24 Minutes | 0 | 0.0% |
| 25 to 29 Minutes | 0 | 0.0% |
| 30 to 34 Minutes | 11 | 23.9% |
| 35 to 39 Minutes | 0 | 0.0% |
| 40 to 44 Minutes | 0 | 0.0% |
| 45 to 59 Minutes | 0 | 0.0% |
| 60 to 89 Minutes | 0 | 0.0% |
| 90 or more Minutes | 15 | 32.6% |
Commute Time by Sex in Glenbrook
The most common commute times in Glenbrook are 90 or more minutes (15 commuters, 57.7%) for males and 30 to 34 minutes (11 commuters, 55.0%) for females.
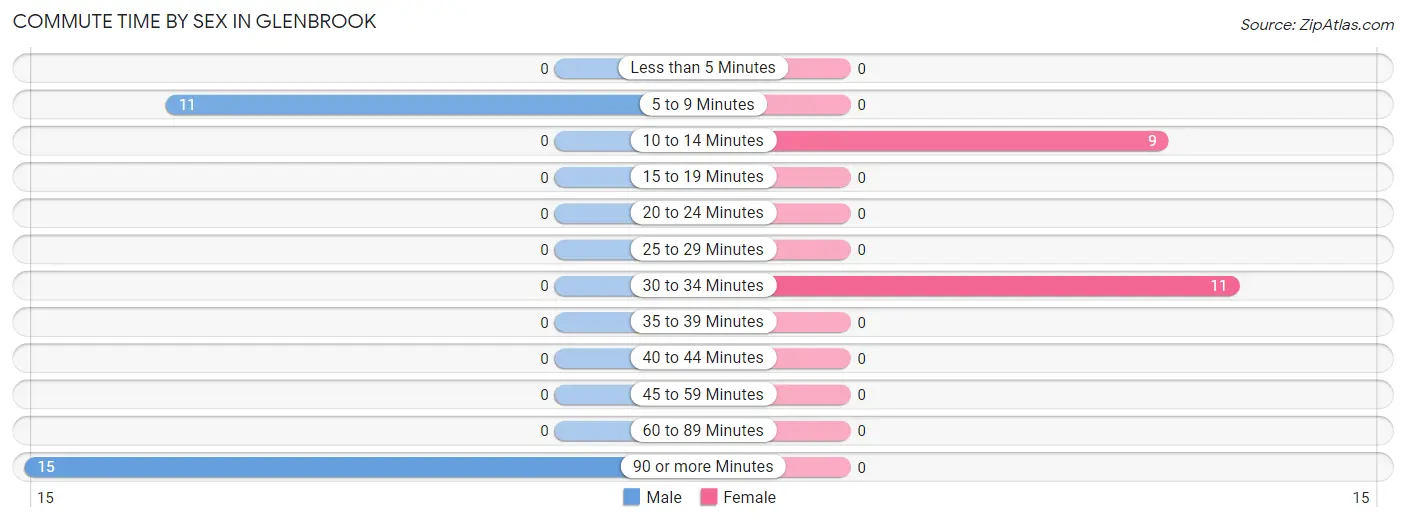
| Commute Time | Male | Female |
| Less than 5 Minutes | 0 (0.0%) | 0 (0.0%) |
| 5 to 9 Minutes | 11 (42.3%) | 0 (0.0%) |
| 10 to 14 Minutes | 0 (0.0%) | 9 (45.0%) |
| 15 to 19 Minutes | 0 (0.0%) | 0 (0.0%) |
| 20 to 24 Minutes | 0 (0.0%) | 0 (0.0%) |
| 25 to 29 Minutes | 0 (0.0%) | 0 (0.0%) |
| 30 to 34 Minutes | 0 (0.0%) | 11 (55.0%) |
| 35 to 39 Minutes | 0 (0.0%) | 0 (0.0%) |
| 40 to 44 Minutes | 0 (0.0%) | 0 (0.0%) |
| 45 to 59 Minutes | 0 (0.0%) | 0 (0.0%) |
| 60 to 89 Minutes | 0 (0.0%) | 0 (0.0%) |
| 90 or more Minutes | 15 (57.7%) | 0 (0.0%) |
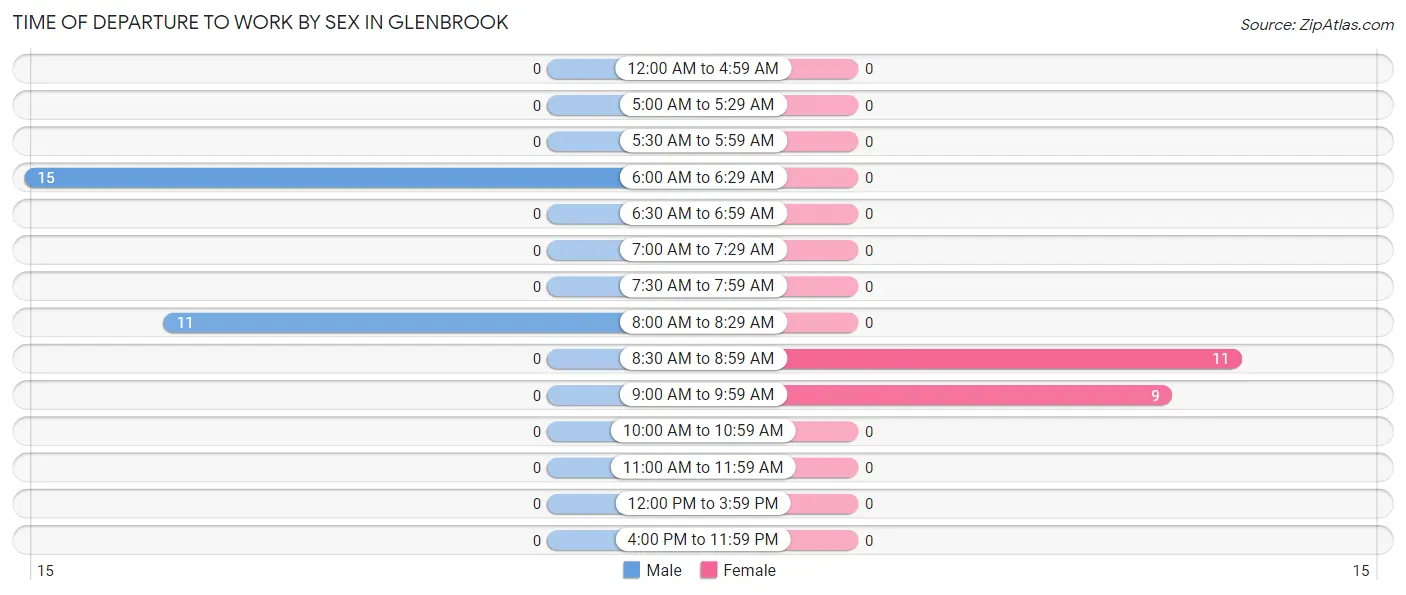
Time of Departure to Work by Sex in Glenbrook
The most frequent times of departure to work in Glenbrook are 6:00 AM to 6:29 AM (15, 57.7%) for males and 8:30 AM to 8:59 AM (11, 55.0%) for females.
| Time of Departure | Male | Female |
| 12:00 AM to 4:59 AM | 0 (0.0%) | 0 (0.0%) |
| 5:00 AM to 5:29 AM | 0 (0.0%) | 0 (0.0%) |
| 5:30 AM to 5:59 AM | 0 (0.0%) | 0 (0.0%) |
| 6:00 AM to 6:29 AM | 15 (57.7%) | 0 (0.0%) |
| 6:30 AM to 6:59 AM | 0 (0.0%) | 0 (0.0%) |
| 7:00 AM to 7:29 AM | 0 (0.0%) | 0 (0.0%) |
| 7:30 AM to 7:59 AM | 0 (0.0%) | 0 (0.0%) |
| 8:00 AM to 8:29 AM | 11 (42.3%) | 0 (0.0%) |
| 8:30 AM to 8:59 AM | 0 (0.0%) | 11 (55.0%) |
| 9:00 AM to 9:59 AM | 0 (0.0%) | 9 (45.0%) |
| 10:00 AM to 10:59 AM | 0 (0.0%) | 0 (0.0%) |
| 11:00 AM to 11:59 AM | 0 (0.0%) | 0 (0.0%) |
| 12:00 PM to 3:59 PM | 0 (0.0%) | 0 (0.0%) |
| 4:00 PM to 11:59 PM | 0 (0.0%) | 0 (0.0%) |
| Total | 26 (100.0%) | 20 (100.0%) |
Housing Occupancy in Glenbrook
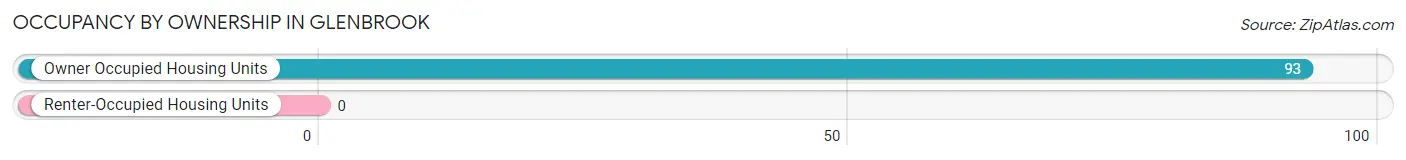
Occupancy by Ownership in Glenbrook
Of the total 93 dwellings in Glenbrook, owner-occupied units account for 93 (100.0%), while renter-occupied units make up 0 (0.0%).
| Occupancy | # Housing Units | % Housing Units |
| Owner Occupied Housing Units | 93 | 100.0% |
| Renter-Occupied Housing Units | 0 | 0.0% |
| Total Occupied Housing Units | 93 | 100.0% |
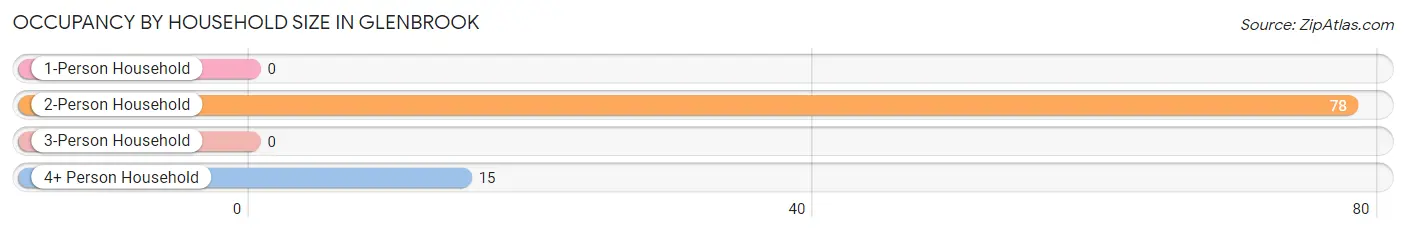
Occupancy by Household Size in Glenbrook
| Household Size | # Housing Units | % Housing Units |
| 1-Person Household | 0 | 0.0% |
| 2-Person Household | 78 | 83.9% |
| 3-Person Household | 0 | 0.0% |
| 4+ Person Household | 15 | 16.1% |
| Total Housing Units | 93 | 100.0% |
Occupancy by Ownership by Household Size in Glenbrook
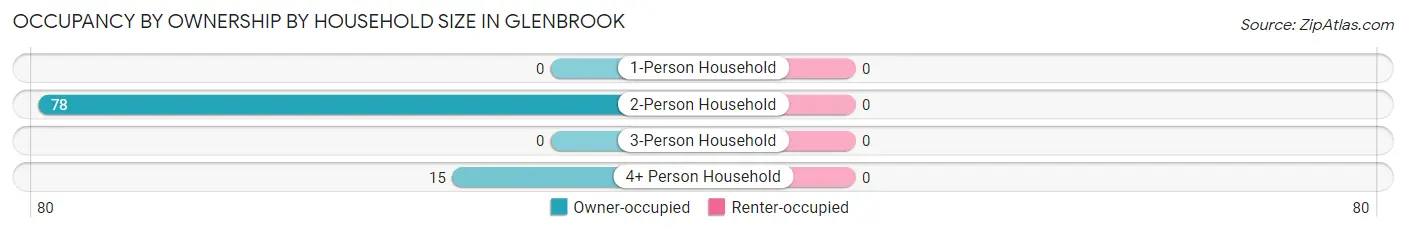
| Household Size | Owner-occupied | Renter-occupied |
| 1-Person Household | 0 (0.0%) | 0 (0.0%) |
| 2-Person Household | 78 (100.0%) | 0 (0.0%) |
| 3-Person Household | 0 (0.0%) | 0 (0.0%) |
| 4+ Person Household | 15 (100.0%) | 0 (0.0%) |
| Total Housing Units | 93 (100.0%) | 0 (0.0%) |
Occupancy by Educational Attainment in Glenbrook
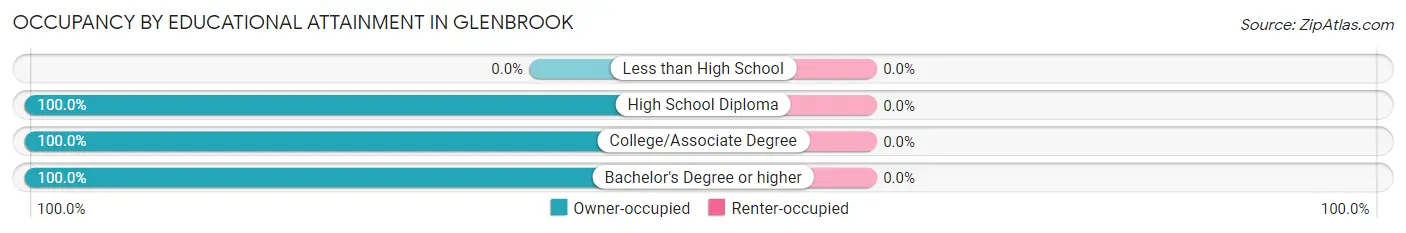
| Household Size | Owner-occupied | Renter-occupied |
| Less than High School | 0 (0.0%) | 0 (0.0%) |
| High School Diploma | 26 (100.0%) | 0 (0.0%) |
| College/Associate Degree | 10 (100.0%) | 0 (0.0%) |
| Bachelor's Degree or higher | 57 (100.0%) | 0 (0.0%) |
Occupancy by Age of Householder in Glenbrook
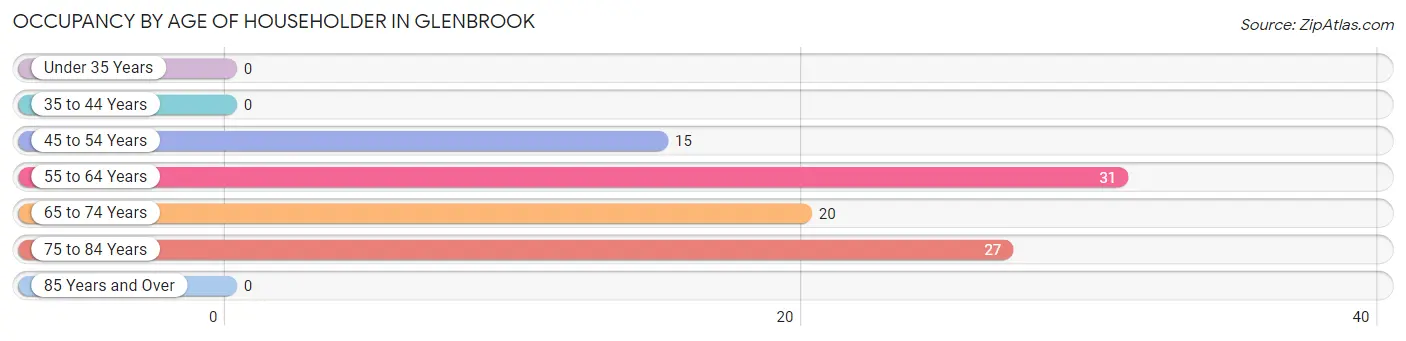
| Age Bracket | # Households | % Households |
| Under 35 Years | 0 | 0.0% |
| 35 to 44 Years | 0 | 0.0% |
| 45 to 54 Years | 15 | 16.1% |
| 55 to 64 Years | 31 | 33.3% |
| 65 to 74 Years | 20 | 21.5% |
| 75 to 84 Years | 27 | 29.0% |
| 85 Years and Over | 0 | 0.0% |
| Total | 93 | 100.0% |
Housing Finances in Glenbrook
Median Income by Occupancy in Glenbrook
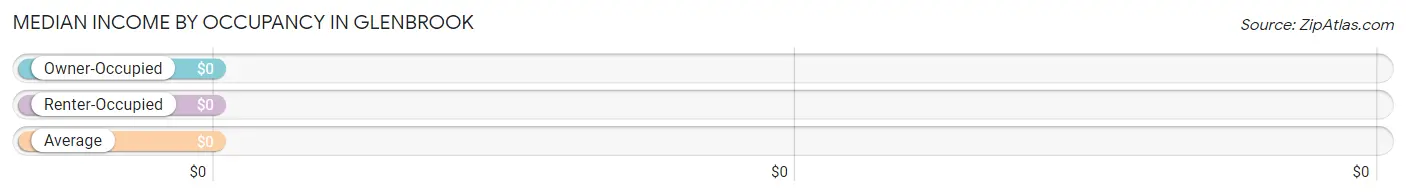
| Occupancy Type | # Households | Median Income |
| Owner-Occupied | 93 (100.0%) | $0 |
| Renter-Occupied | 0 (0.0%) | $0 |
| Average | 93 (100.0%) | $0 |
Occupancy by Householder Income Bracket in Glenbrook
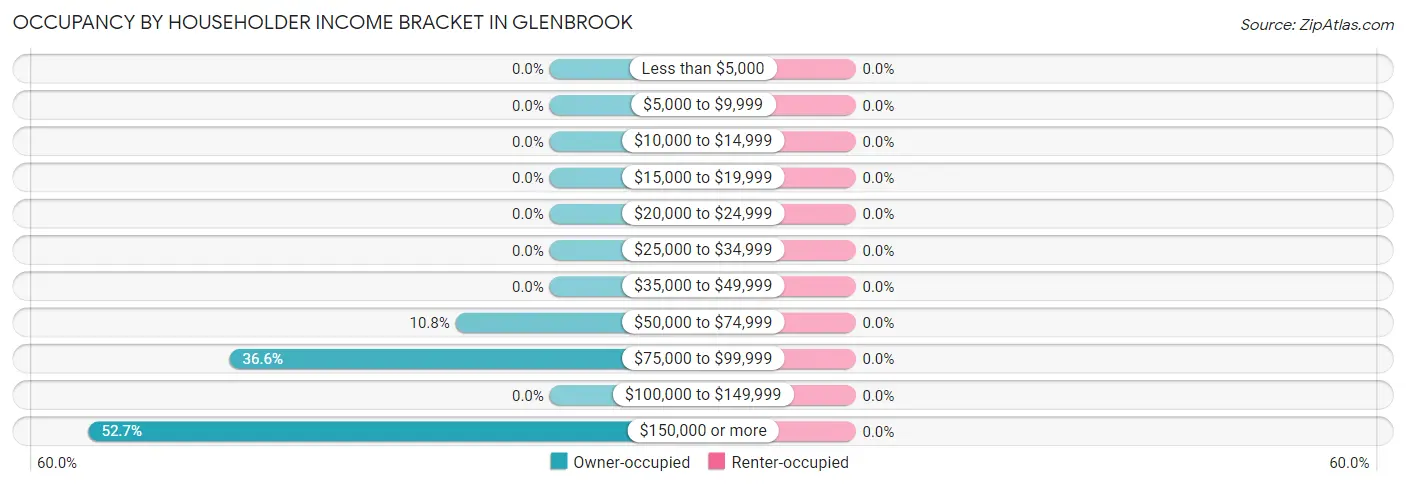
| Income Bracket | Owner-occupied | Renter-occupied |
| Less than $5,000 | 0 (0.0%) | 0 (0.0%) |
| $5,000 to $9,999 | 0 (0.0%) | 0 (0.0%) |
| $10,000 to $14,999 | 0 (0.0%) | 0 (0.0%) |
| $15,000 to $19,999 | 0 (0.0%) | 0 (0.0%) |
| $20,000 to $24,999 | 0 (0.0%) | 0 (0.0%) |
| $25,000 to $34,999 | 0 (0.0%) | 0 (0.0%) |
| $35,000 to $49,999 | 0 (0.0%) | 0 (0.0%) |
| $50,000 to $74,999 | 10 (10.7%) | 0 (0.0%) |
| $75,000 to $99,999 | 34 (36.6%) | 0 (0.0%) |
| $100,000 to $149,999 | 0 (0.0%) | 0 (0.0%) |
| $150,000 or more | 49 (52.7%) | 0 (0.0%) |
| Total | 93 (100.0%) | 0 (0.0%) |
Monthly Housing Cost Tiers in Glenbrook
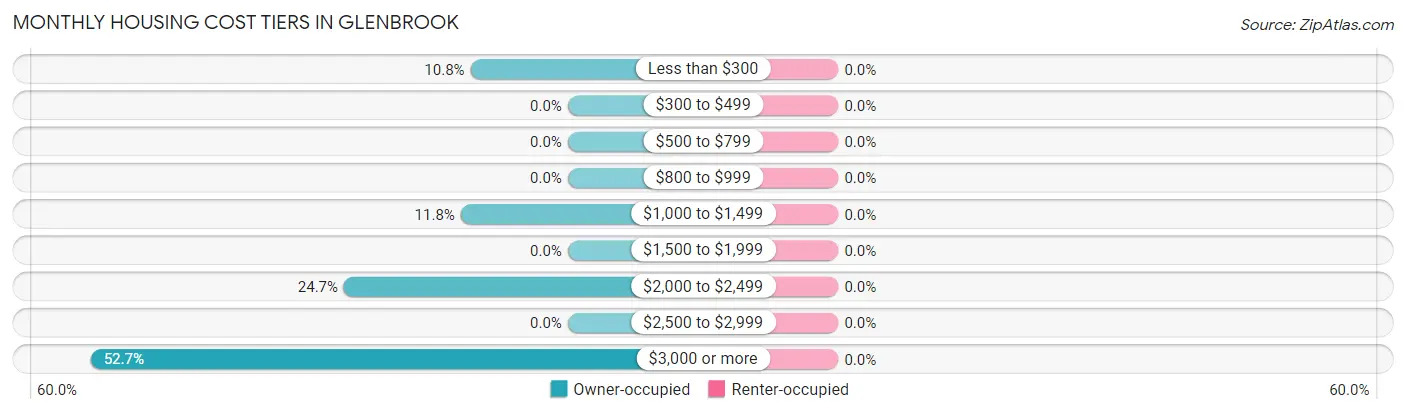
| Monthly Cost | Owner-occupied | Renter-occupied |
| Less than $300 | 10 (10.7%) | 0 (0.0%) |
| $300 to $499 | 0 (0.0%) | 0 (0.0%) |
| $500 to $799 | 0 (0.0%) | 0 (0.0%) |
| $800 to $999 | 0 (0.0%) | 0 (0.0%) |
| $1,000 to $1,499 | 11 (11.8%) | 0 (0.0%) |
| $1,500 to $1,999 | 0 (0.0%) | 0 (0.0%) |
| $2,000 to $2,499 | 23 (24.7%) | 0 (0.0%) |
| $2,500 to $2,999 | 0 (0.0%) | 0 (0.0%) |
| $3,000 or more | 49 (52.7%) | 0 (0.0%) |
| Total | 93 (100.0%) | 0 (0.0%) |
Physical Housing Characteristics in Glenbrook
Housing Structures in Glenbrook
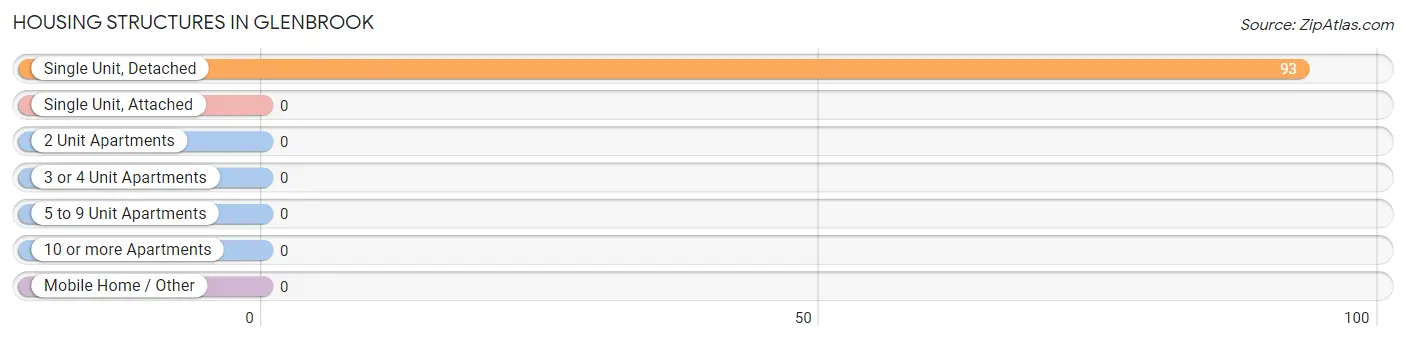
| Structure Type | # Housing Units | % Housing Units |
| Single Unit, Detached | 93 | 100.0% |
| Single Unit, Attached | 0 | 0.0% |
| 2 Unit Apartments | 0 | 0.0% |
| 3 or 4 Unit Apartments | 0 | 0.0% |
| 5 to 9 Unit Apartments | 0 | 0.0% |
| 10 or more Apartments | 0 | 0.0% |
| Mobile Home / Other | 0 | 0.0% |
| Total | 93 | 100.0% |
Housing Structures by Occupancy in Glenbrook
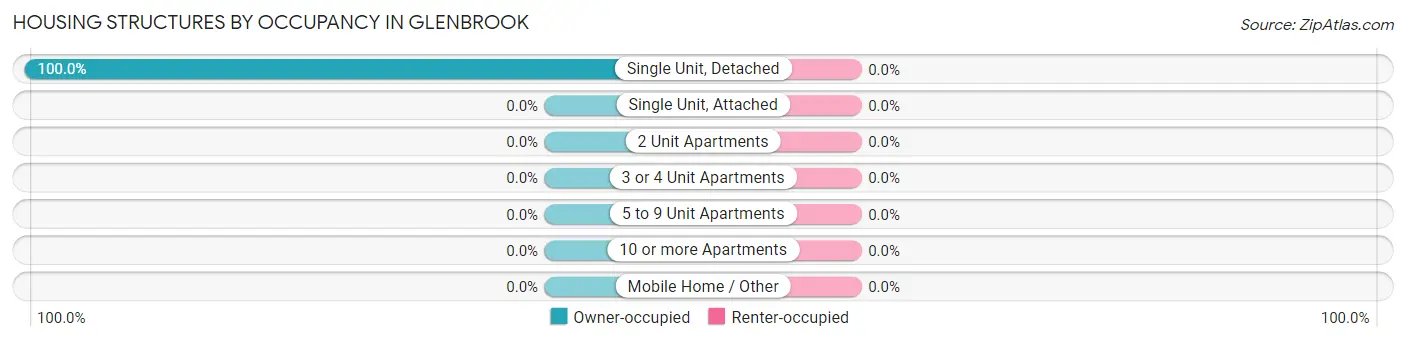
| Structure Type | Owner-occupied | Renter-occupied |
| Single Unit, Detached | 93 (100.0%) | 0 (0.0%) |
| Single Unit, Attached | 0 (0.0%) | 0 (0.0%) |
| 2 Unit Apartments | 0 (0.0%) | 0 (0.0%) |
| 3 or 4 Unit Apartments | 0 (0.0%) | 0 (0.0%) |
| 5 to 9 Unit Apartments | 0 (0.0%) | 0 (0.0%) |
| 10 or more Apartments | 0 (0.0%) | 0 (0.0%) |
| Mobile Home / Other | 0 (0.0%) | 0 (0.0%) |
| Total | 93 (100.0%) | 0 (0.0%) |
Housing Structures by Number of Rooms in Glenbrook
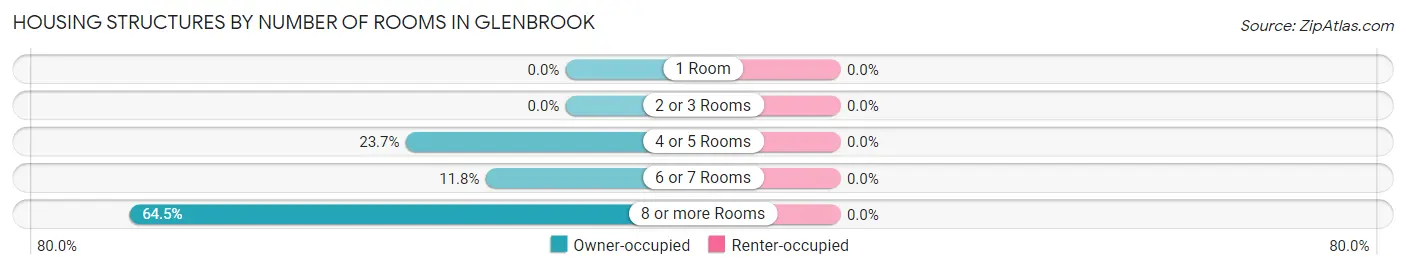
| Number of Rooms | Owner-occupied | Renter-occupied |
| 1 Room | 0 (0.0%) | 0 (0.0%) |
| 2 or 3 Rooms | 0 (0.0%) | 0 (0.0%) |
| 4 or 5 Rooms | 22 (23.7%) | 0 (0.0%) |
| 6 or 7 Rooms | 11 (11.8%) | 0 (0.0%) |
| 8 or more Rooms | 60 (64.5%) | 0 (0.0%) |
| Total | 93 (100.0%) | 0 (0.0%) |
Housing Structure by Heating Type in Glenbrook
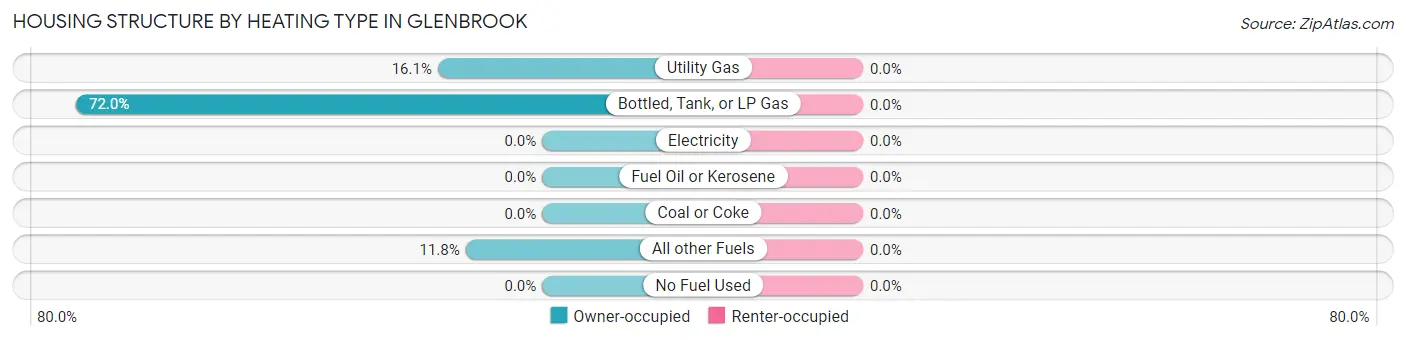
| Heating Type | Owner-occupied | Renter-occupied |
| Utility Gas | 15 (16.1%) | 0 (0.0%) |
| Bottled, Tank, or LP Gas | 67 (72.0%) | 0 (0.0%) |
| Electricity | 0 (0.0%) | 0 (0.0%) |
| Fuel Oil or Kerosene | 0 (0.0%) | 0 (0.0%) |
| Coal or Coke | 0 (0.0%) | 0 (0.0%) |
| All other Fuels | 11 (11.8%) | 0 (0.0%) |
| No Fuel Used | 0 (0.0%) | 0 (0.0%) |
| Total | 93 (100.0%) | 0 (0.0%) |
Household Vehicle Usage in Glenbrook
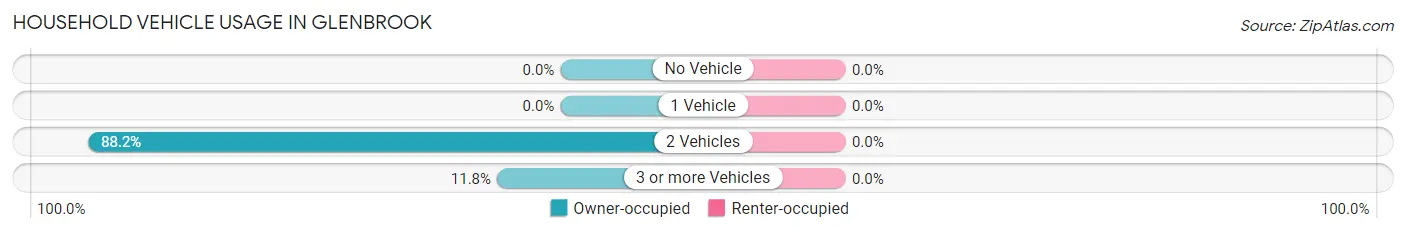
| Vehicles per Household | Owner-occupied | Renter-occupied |
| No Vehicle | 0 (0.0%) | 0 (0.0%) |
| 1 Vehicle | 0 (0.0%) | 0 (0.0%) |
| 2 Vehicles | 82 (88.2%) | 0 (0.0%) |
| 3 or more Vehicles | 11 (11.8%) | 0 (0.0%) |
| Total | 93 (100.0%) | 0 (0.0%) |
Real Estate & Mortgages in Glenbrook
Real Estate and Mortgage Overview in Glenbrook
| Characteristic | Without Mortgage | With Mortgage |
| Housing Units | 68 | 25 |
| Median Property Value | $2,000,001 | $0 |
| Median Household Income | - | - |
| Monthly Housing Costs | $1,501 | $25 |
| Real Estate Taxes | $10,001 | $0 |
Property Value by Mortgage Status in Glenbrook
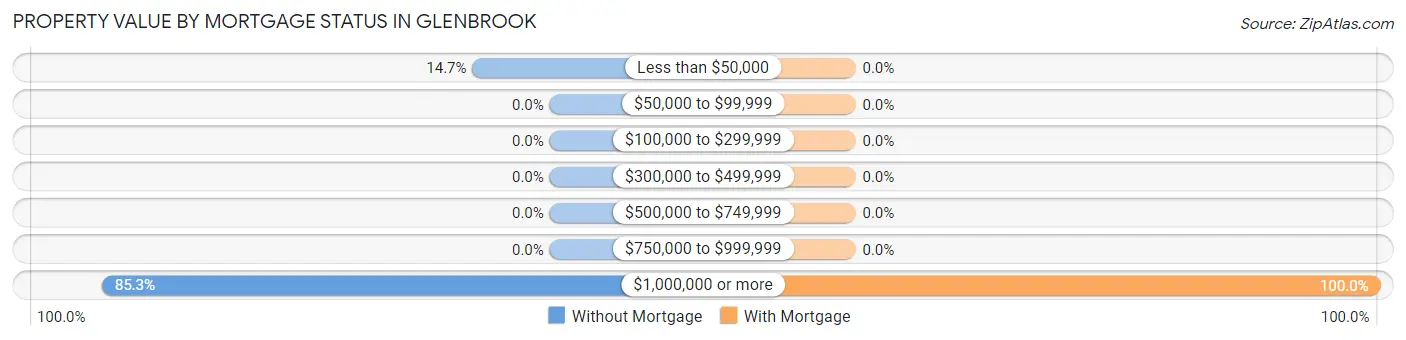
| Property Value | Without Mortgage | With Mortgage |
| Less than $50,000 | 10 (14.7%) | 0 (0.0%) |
| $50,000 to $99,999 | 0 (0.0%) | 0 (0.0%) |
| $100,000 to $299,999 | 0 (0.0%) | 0 (0.0%) |
| $300,000 to $499,999 | 0 (0.0%) | 0 (0.0%) |
| $500,000 to $749,999 | 0 (0.0%) | 0 (0.0%) |
| $750,000 to $999,999 | 0 (0.0%) | 0 (0.0%) |
| $1,000,000 or more | 58 (85.3%) | 25 (100.0%) |
| Total | 68 (100.0%) | 25 (100.0%) |
Household Income by Mortgage Status in Glenbrook
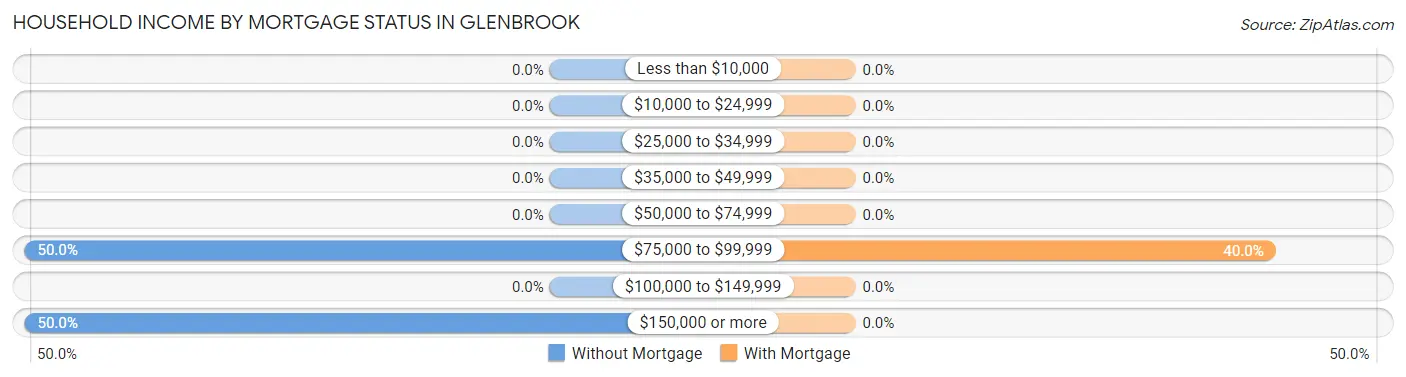
| Household Income | Without Mortgage | With Mortgage |
| Less than $10,000 | 0 (0.0%) | 0 (0.0%) |
| $10,000 to $24,999 | 0 (0.0%) | 0 (0.0%) |
| $25,000 to $34,999 | 0 (0.0%) | 0 (0.0%) |
| $35,000 to $49,999 | 0 (0.0%) | 0 (0.0%) |
| $50,000 to $74,999 | 0 (0.0%) | 0 (0.0%) |
| $75,000 to $99,999 | 34 (50.0%) | 10 (40.0%) |
| $100,000 to $149,999 | 0 (0.0%) | 0 (0.0%) |
| $150,000 or more | 34 (50.0%) | 0 (0.0%) |
| Total | 68 (100.0%) | 25 (100.0%) |
Property Value to Household Income Ratio in Glenbrook
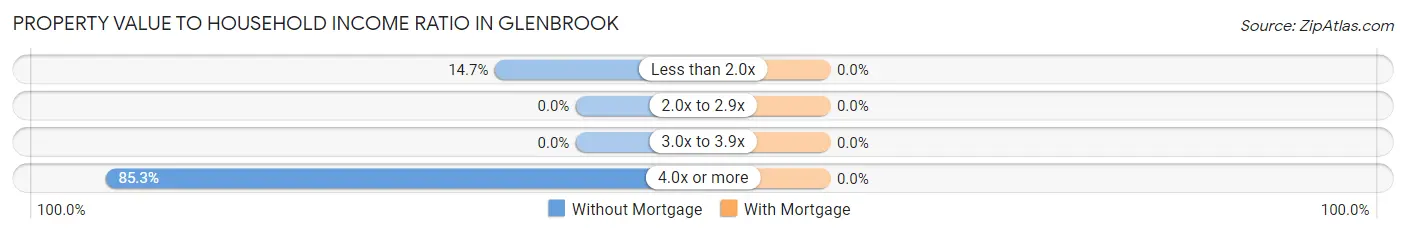
| Value-to-Income Ratio | Without Mortgage | With Mortgage |
| Less than 2.0x | 10 (14.7%) | 0 (0.0%) |
| 2.0x to 2.9x | 0 (0.0%) | 0 (0.0%) |
| 3.0x to 3.9x | 0 (0.0%) | 0 (0.0%) |
| 4.0x or more | 58 (85.3%) | 0 (0.0%) |
| Total | 68 (100.0%) | 25 (100.0%) |
Real Estate Taxes by Mortgage Status in Glenbrook
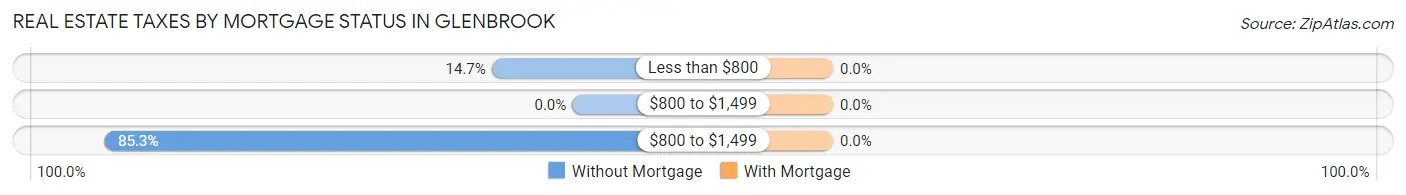
| Property Taxes | Without Mortgage | With Mortgage |
| Less than $800 | 10 (14.7%) | 0 (0.0%) |
| $800 to $1,499 | 0 (0.0%) | 0 (0.0%) |
| $800 to $1,499 | 58 (85.3%) | 0 (0.0%) |
| Total | 68 (100.0%) | 25 (100.0%) |
Health & Disability in Glenbrook
Health Insurance Coverage by Age in Glenbrook
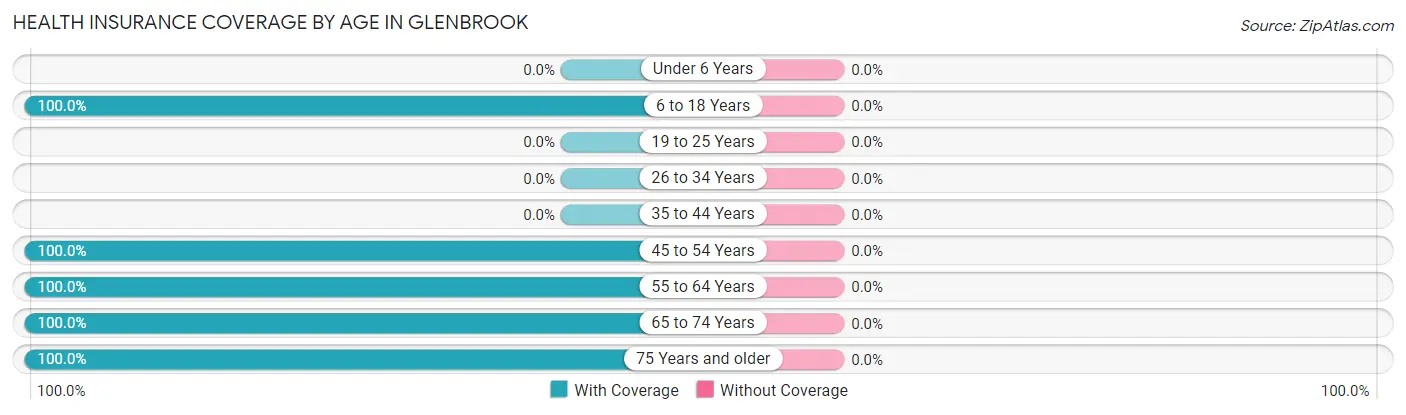
| Age Bracket | With Coverage | Without Coverage |
| Under 6 Years | 0 (0.0%) | 0 (0.0%) |
| 6 to 18 Years | 28 (100.0%) | 0 (0.0%) |
| 19 to 25 Years | 0 (0.0%) | 0 (0.0%) |
| 26 to 34 Years | 0 (0.0%) | 0 (0.0%) |
| 35 to 44 Years | 0 (0.0%) | 0 (0.0%) |
| 45 to 54 Years | 31 (100.0%) | 0 (0.0%) |
| 55 to 64 Years | 51 (100.0%) | 0 (0.0%) |
| 65 to 74 Years | 68 (100.0%) | 0 (0.0%) |
| 75 Years and older | 36 (100.0%) | 0 (0.0%) |
| Total | 214 (100.0%) | 0 (0.0%) |
Health Insurance Coverage by Citizenship Status in Glenbrook
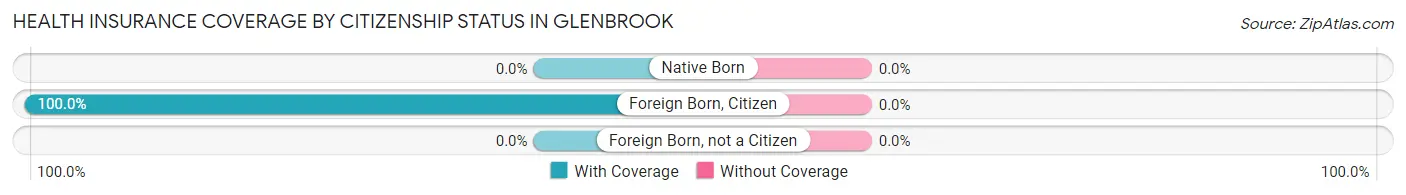
| Citizenship Status | With Coverage | Without Coverage |
| Native Born | 0 (0.0%) | 0 (0.0%) |
| Foreign Born, Citizen | 28 (100.0%) | 0 (0.0%) |
| Foreign Born, not a Citizen | 0 (0.0%) | 0 (0.0%) |
Health Insurance Coverage by Household Income in Glenbrook
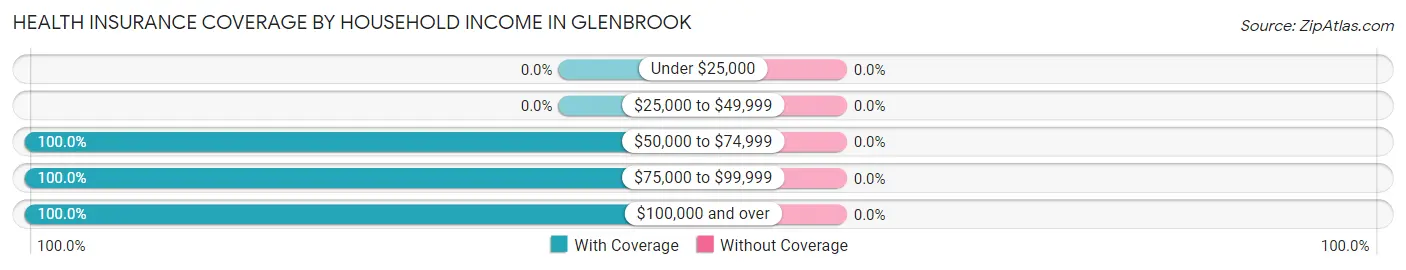
| Household Income | With Coverage | Without Coverage |
| Under $25,000 | 0 (0.0%) | 0 (0.0%) |
| $25,000 to $49,999 | 0 (0.0%) | 0 (0.0%) |
| $50,000 to $74,999 | 22 (100.0%) | 0 (0.0%) |
| $75,000 to $99,999 | 64 (100.0%) | 0 (0.0%) |
| $100,000 and over | 128 (100.0%) | 0 (0.0%) |
Public vs Private Health Insurance Coverage by Age in Glenbrook
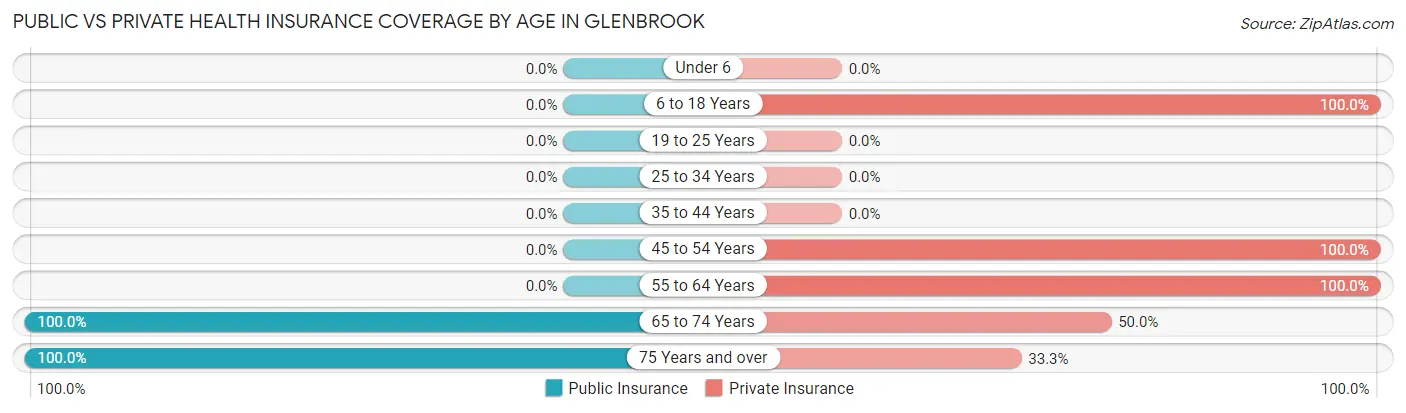
| Age Bracket | Public Insurance | Private Insurance |
| Under 6 | 0 (0.0%) | 0 (0.0%) |
| 6 to 18 Years | 0 (0.0%) | 28 (100.0%) |
| 19 to 25 Years | 0 (0.0%) | 0 (0.0%) |
| 25 to 34 Years | 0 (0.0%) | 0 (0.0%) |
| 35 to 44 Years | 0 (0.0%) | 0 (0.0%) |
| 45 to 54 Years | 0 (0.0%) | 31 (100.0%) |
| 55 to 64 Years | 0 (0.0%) | 51 (100.0%) |
| 65 to 74 Years | 68 (100.0%) | 34 (50.0%) |
| 75 Years and over | 36 (100.0%) | 12 (33.3%) |
| Total | 104 (48.6%) | 156 (72.9%) |
Disability Status by Sex by Age in Glenbrook
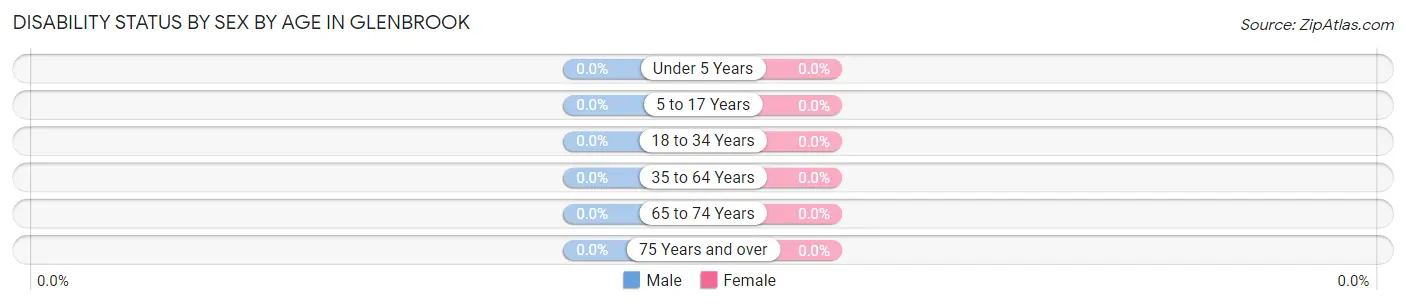
| Age Bracket | Male | Female |
| Under 5 Years | 0 (0.0%) | 0 (0.0%) |
| 5 to 17 Years | 0 (0.0%) | 0 (0.0%) |
| 18 to 34 Years | 0 (0.0%) | 0 (0.0%) |
| 35 to 64 Years | 0 (0.0%) | 0 (0.0%) |
| 65 to 74 Years | 0 (0.0%) | 0 (0.0%) |
| 75 Years and over | 0 (0.0%) | 0 (0.0%) |
Disability Class by Sex by Age in Glenbrook
Disability Class: Hearing Difficulty
| Age Bracket | Male | Female |
| Under 5 Years | 0 (0.0%) | 0 (0.0%) |
| 5 to 17 Years | 0 (0.0%) | 0 (0.0%) |
| 18 to 34 Years | 0 (0.0%) | 0 (0.0%) |
| 35 to 64 Years | 0 (0.0%) | 0 (0.0%) |
| 65 to 74 Years | 0 (0.0%) | 0 (0.0%) |
| 75 Years and over | 0 (0.0%) | 0 (0.0%) |
Disability Class: Vision Difficulty
| Age Bracket | Male | Female |
| Under 5 Years | 0 (0.0%) | 0 (0.0%) |
| 5 to 17 Years | 0 (0.0%) | 0 (0.0%) |
| 18 to 34 Years | 0 (0.0%) | 0 (0.0%) |
| 35 to 64 Years | 0 (0.0%) | 0 (0.0%) |
| 65 to 74 Years | 0 (0.0%) | 0 (0.0%) |
| 75 Years and over | 0 (0.0%) | 0 (0.0%) |
Disability Class: Cognitive Difficulty
| Age Bracket | Male | Female |
| 5 to 17 Years | 0 (0.0%) | 0 (0.0%) |
| 18 to 34 Years | 0 (0.0%) | 0 (0.0%) |
| 35 to 64 Years | 0 (0.0%) | 0 (0.0%) |
| 65 to 74 Years | 0 (0.0%) | 0 (0.0%) |
| 75 Years and over | 0 (0.0%) | 0 (0.0%) |
Disability Class: Ambulatory Difficulty
| Age Bracket | Male | Female |
| 5 to 17 Years | 0 (0.0%) | 0 (0.0%) |
| 18 to 34 Years | 0 (0.0%) | 0 (0.0%) |
| 35 to 64 Years | 0 (0.0%) | 0 (0.0%) |
| 65 to 74 Years | 0 (0.0%) | 0 (0.0%) |
| 75 Years and over | 0 (0.0%) | 0 (0.0%) |
Disability Class: Self-Care Difficulty
| Age Bracket | Male | Female |
| 5 to 17 Years | 0 (0.0%) | 0 (0.0%) |
| 18 to 34 Years | 0 (0.0%) | 0 (0.0%) |
| 35 to 64 Years | 0 (0.0%) | 0 (0.0%) |
| 65 to 74 Years | 0 (0.0%) | 0 (0.0%) |
| 75 Years and over | 0 (0.0%) | 0 (0.0%) |
Technology Access in Glenbrook
Computing Device Access in Glenbrook
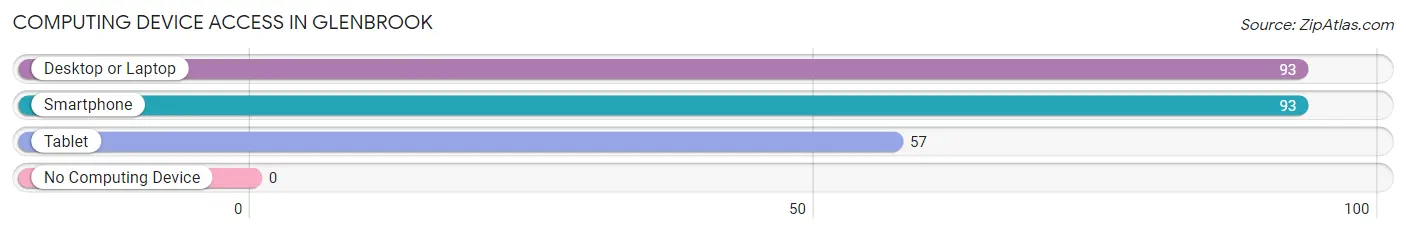
| Device Type | # Households | % Households |
| Desktop or Laptop | 93 | 100.0% |
| Smartphone | 93 | 100.0% |
| Tablet | 57 | 61.3% |
| No Computing Device | 0 | 0.0% |
| Total | 93 | 100.0% |
Internet Access in Glenbrook
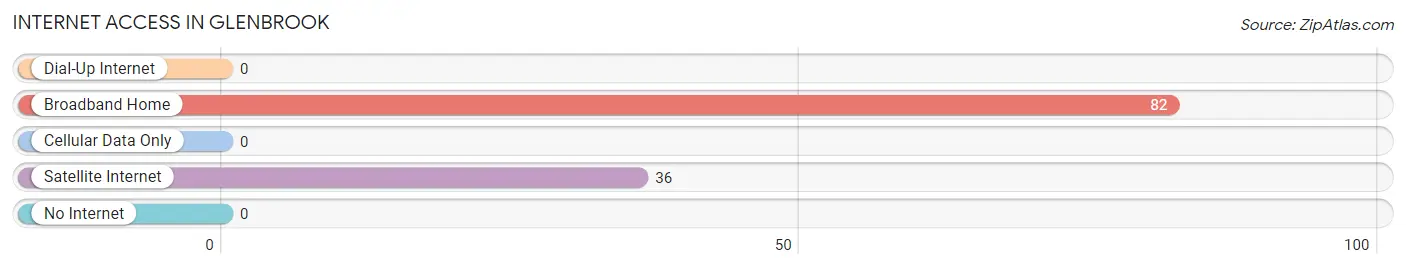
| Internet Type | # Households | % Households |
| Dial-Up Internet | 0 | 0.0% |
| Broadband Home | 82 | 88.2% |
| Cellular Data Only | 0 | 0.0% |
| Satellite Internet | 36 | 38.7% |
| No Internet | 0 | 0.0% |
| Total | 93 | 100.0% |
Glenbrook Summary
Glenbrook, Nevada is a small, unincorporated community located in Douglas County, Nevada. It is situated on the eastern shore of Lake Tahoe, approximately 8 miles south of the Nevada-California border. The community is home to approximately 500 people and is a popular tourist destination due to its proximity to the lake and its many recreational activities.
History
Glenbrook was originally settled in the late 1800s by a group of miners who were looking for gold in the area. The miners named the area after the nearby Glenbrook Creek, which was named after the nearby Glenbrook Valley. The miners were unsuccessful in their search for gold, but the area became a popular destination for tourists and vacationers.
In the early 1900s, the area was developed as a resort community. The first hotel was built in 1906 and the area quickly became a popular destination for tourists and vacationers. The area was also home to a number of summer camps, which attracted many visitors from the surrounding areas.
In the 1950s, the area began to experience a decline in tourism due to the increasing popularity of other nearby destinations. However, the area has since experienced a resurgence in popularity due to its proximity to Lake Tahoe and its many recreational activities.
Geography
Glenbrook is located in Douglas County, Nevada, approximately 8 miles south of the Nevada-California border. The community is situated on the eastern shore of Lake Tahoe, which is the largest alpine lake in North America. The area is surrounded by the Sierra Nevada mountain range and is home to a number of popular ski resorts.
The area is also home to a number of popular hiking trails, including the Tahoe Rim Trail, which is a 165-mile loop around the lake. The area is also home to a number of popular beaches, including Sand Harbor Beach, which is a popular destination for swimming and sunbathing.
Economy
The economy of Glenbrook is largely driven by tourism. The area is home to a number of popular resorts, hotels, and restaurants, which attract visitors from all over the world. The area is also home to a number of popular outdoor activities, including skiing, hiking, and boating.
The area is also home to a number of businesses, including a number of retail stores, restaurants, and other services. The area is also home to a number of small businesses, including a number of art galleries, antique stores, and other specialty shops.
Demographics
As of the 2010 census, the population of Glenbrook was 498. The racial makeup of the community was 94.2% White, 0.2% African American, 0.4% Native American, 0.8% Asian, 0.2% Pacific Islander, and 4.2% from other races. The median household income was $50,000 and the median age was 44.
Conclusion
Glenbrook, Nevada is a small, unincorporated community located in Douglas County, Nevada. It is situated on the eastern shore of Lake Tahoe, approximately 8 miles south of the Nevada-California border. The community is home to approximately 500 people and is a popular tourist destination due to its proximity to the lake and its many recreational activities. The economy of Glenbrook is largely driven by tourism and the area is home to a number of popular resorts, hotels, and restaurants. The area is also home to a number of small businesses, including a number of art galleries, antique stores, and other specialty shops. As of the 2010 census, the population of Glenbrook was 498 and the median household income was $50,000.
Common Questions
What is Per Capita Income in Glenbrook?
Per Capita income in Glenbrook is $168,572.
What is Inequality or Gini Index in Glenbrook?
Inequality or Gini Index in Glenbrook is 0.59.
What is the Total Population of Glenbrook?
Total Population of Glenbrook is 214.
What is the Total Male Population of Glenbrook?
Total Male Population of Glenbrook is 106.
What is the Total Female Population of Glenbrook?
Total Female Population of Glenbrook is 108.
What is the Ratio of Males per 100 Females in Glenbrook?
There are 98.15 Males per 100 Females in Glenbrook.
What is the Ratio of Females per 100 Males in Glenbrook?
There are 101.89 Females per 100 Males in Glenbrook.
What is the Median Population Age in Glenbrook?
Median Population Age in Glenbrook is 63.9 Years.
What is the Average Family Size in Glenbrook
Average Family Size in Glenbrook is 2.3 People.
What is the Average Household Size in Glenbrook
Average Household Size in Glenbrook is 2.3 People.
How Large is the Labor Force in Glenbrook?
There are 75 People in the Labor Forcein in Glenbrook.
What is the Percentage of People in the Labor Force in Glenbrook?
40.3% of People are in the Labor Force in Glenbrook.