Cherry Hills Village, CO Map & Demographics
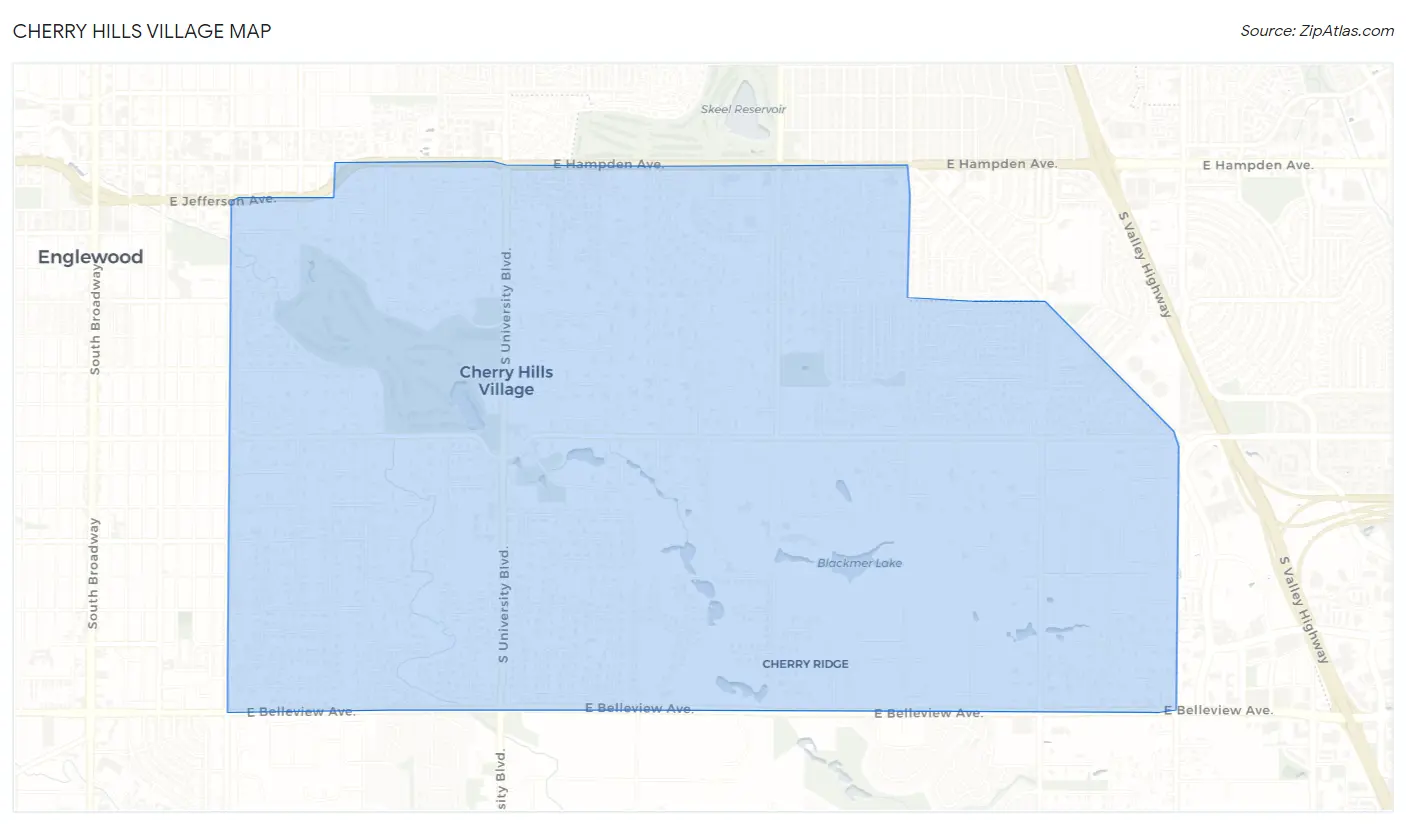
Cherry Hills Village Map
Cherry Hills Village Overview
$171,655
PER CAPITA INCOME
$250,001
AVG FAMILY INCOME
$250,001
AVG HOUSEHOLD INCOME
63.8%
WAGE / INCOME GAP [ % ]
36.2¢/ $1
WAGE / INCOME GAP [ $ ]
0.49
INEQUALITY / GINI INDEX
6,405
TOTAL POPULATION
3,271
MALE POPULATION
3,134
FEMALE POPULATION
104.37
MALES / 100 FEMALES
95.81
FEMALES / 100 MALES
47.3
MEDIAN AGE
3.0
AVG FAMILY SIZE
2.9
AVG HOUSEHOLD SIZE
2,645
LABOR FORCE [ PEOPLE ]
53.7%
PERCENT IN LABOR FORCE
2.8%
UNEMPLOYMENT RATE
Cherry Hills Village Area Codes
Income in Cherry Hills Village
Income Overview in Cherry Hills Village
Per Capita Income in Cherry Hills Village is $171,655, while median incomes of families and households are $250,001 and $250,001 respectively.
| Characteristic | Number | Measure |
| Per Capita Income | 6,405 | $171,655 |
| Median Family Income | 1,982 | $250,001 |
| Mean Family Income | 1,982 | $502,482 |
| Median Household Income | 2,242 | $250,001 |
| Mean Household Income | 2,242 | $486,405 |
| Income Deficit | 1,982 | $0 |
| Wage / Income Gap (%) | 6,405 | 63.79% |
| Wage / Income Gap ($) | 6,405 | 36.21¢ per $1 |
| Gini / Inequality Index | 6,405 | 0.49 |
Earnings by Sex in Cherry Hills Village
Average Earnings in Cherry Hills Village are $143,684, $196,250 for men and $71,058 for women, a difference of 63.8%.
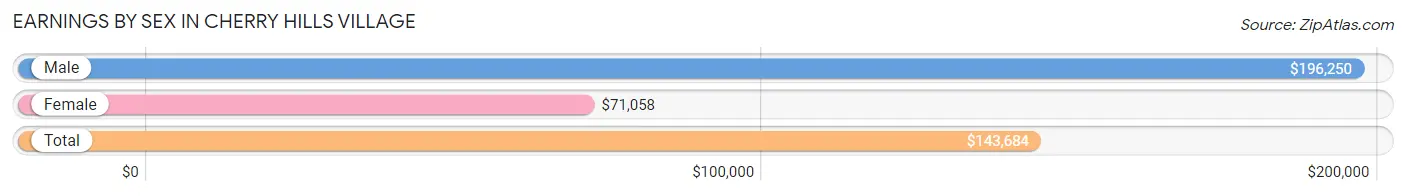
| Sex | Number | Average Earnings |
| Male | 1,824 (63.1%) | $196,250 |
| Female | 1,066 (36.9%) | $71,058 |
| Total | 2,890 (100.0%) | $143,684 |
Earnings by Sex by Income Bracket in Cherry Hills Village
The most common earnings brackets in Cherry Hills Village are $100,000+ for men (1,279 | 70.1%) and $100,000+ for women (425 | 39.9%).
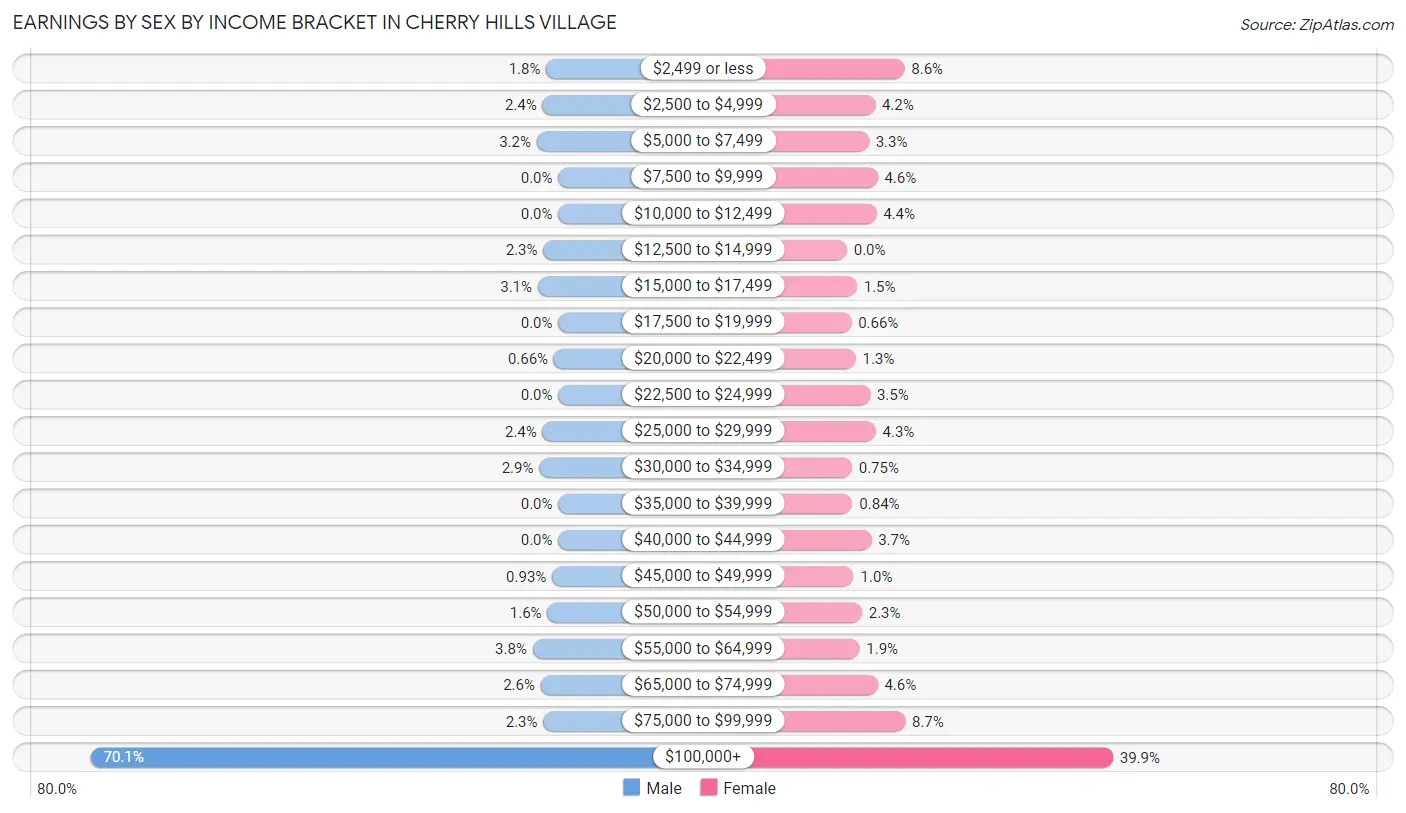
| Income | Male | Female |
| $2,499 or less | 33 (1.8%) | 92 (8.6%) |
| $2,500 to $4,999 | 43 (2.4%) | 45 (4.2%) |
| $5,000 to $7,499 | 59 (3.2%) | 35 (3.3%) |
| $7,500 to $9,999 | 0 (0.0%) | 49 (4.6%) |
| $10,000 to $12,499 | 0 (0.0%) | 47 (4.4%) |
| $12,500 to $14,999 | 41 (2.2%) | 0 (0.0%) |
| $15,000 to $17,499 | 56 (3.1%) | 16 (1.5%) |
| $17,500 to $19,999 | 0 (0.0%) | 7 (0.7%) |
| $20,000 to $22,499 | 12 (0.7%) | 14 (1.3%) |
| $22,500 to $24,999 | 0 (0.0%) | 37 (3.5%) |
| $25,000 to $29,999 | 43 (2.4%) | 46 (4.3%) |
| $30,000 to $34,999 | 52 (2.9%) | 8 (0.7%) |
| $35,000 to $39,999 | 0 (0.0%) | 9 (0.8%) |
| $40,000 to $44,999 | 0 (0.0%) | 39 (3.7%) |
| $45,000 to $49,999 | 17 (0.9%) | 11 (1.0%) |
| $50,000 to $54,999 | 30 (1.6%) | 24 (2.2%) |
| $55,000 to $64,999 | 70 (3.8%) | 20 (1.9%) |
| $65,000 to $74,999 | 48 (2.6%) | 49 (4.6%) |
| $75,000 to $99,999 | 41 (2.2%) | 93 (8.7%) |
| $100,000+ | 1,279 (70.1%) | 425 (39.9%) |
| Total | 1,824 (100.0%) | 1,066 (100.0%) |
Earnings by Sex by Educational Attainment in Cherry Hills Village
Average earnings in Cherry Hills Village are $223,625 for men and $93,258 for women, a difference of 58.3%. Men with an educational attainment of graduate degree enjoy the highest average annual earnings of $250,001, while those with bachelor's degree education earn the least with $189,917. Women with an educational attainment of graduate degree earn the most with the average annual earnings of $103,625, while those with college or associate's degree education have the smallest earnings of $51,615.
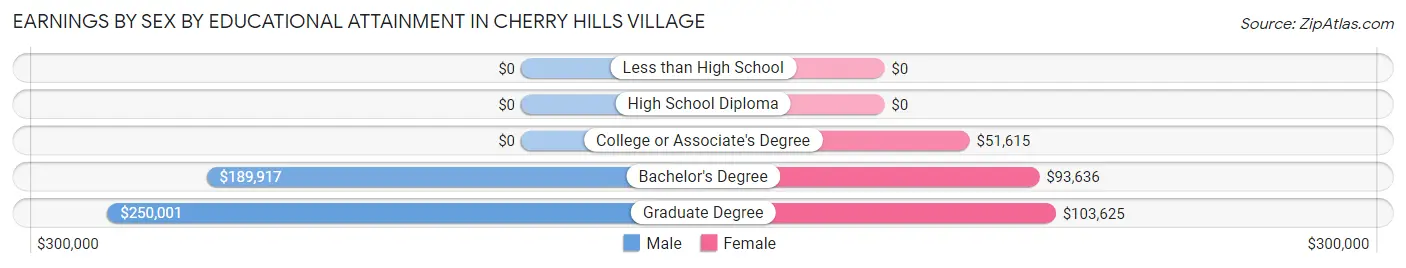
| Educational Attainment | Male Income | Female Income |
| Less than High School | - | - |
| High School Diploma | - | - |
| College or Associate's Degree | - | - |
| Bachelor's Degree | $189,917 | $93,636 |
| Graduate Degree | $250,001 | $103,625 |
| Total | $223,625 | $93,258 |
Family Income in Cherry Hills Village
Family Income Brackets in Cherry Hills Village
According to the Cherry Hills Village family income data, there are 1,348 families falling into the $200,000+ income range, which is the most common income bracket and makes up 68.0% of all families.
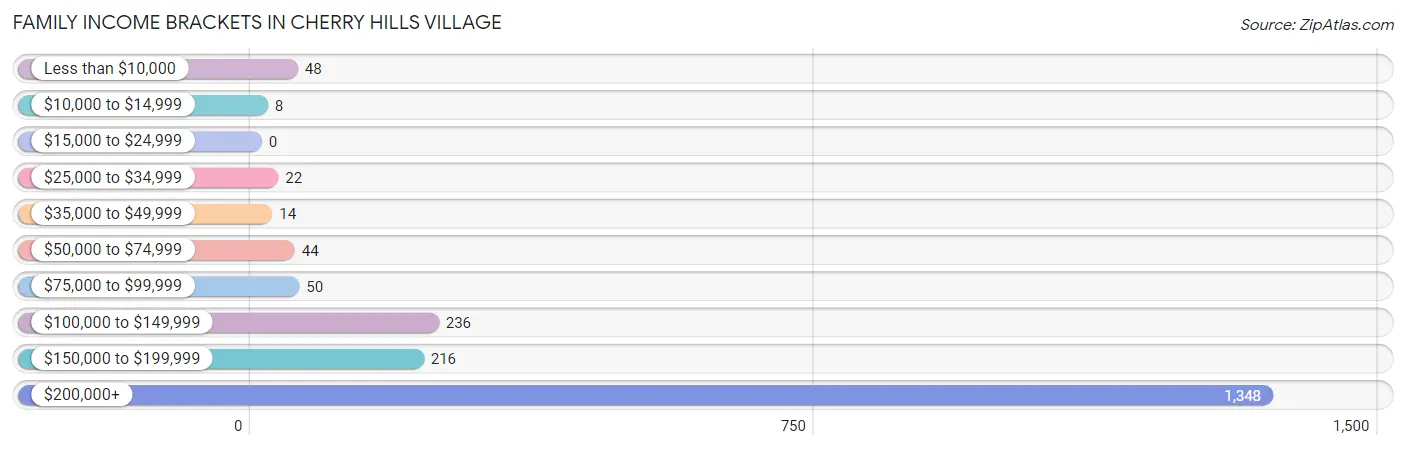
| Income Bracket | # Families | % Families |
| Less than $10,000 | 48 | 2.4% |
| $10,000 to $14,999 | 8 | 0.4% |
| $15,000 to $24,999 | 0 | 0.0% |
| $25,000 to $34,999 | 22 | 1.1% |
| $35,000 to $49,999 | 14 | 0.7% |
| $50,000 to $74,999 | 44 | 2.2% |
| $75,000 to $99,999 | 50 | 2.5% |
| $100,000 to $149,999 | 236 | 11.9% |
| $150,000 to $199,999 | 216 | 10.9% |
| $200,000+ | 1,348 | 68.0% |
Family Income by Famaliy Size in Cherry Hills Village
3-person families (257 | 13.0%) account for the highest median family income in Cherry Hills Village with $250,001 per family, while 2-person families (971 | 49.0%) have the highest median income of $120,846 per family member.
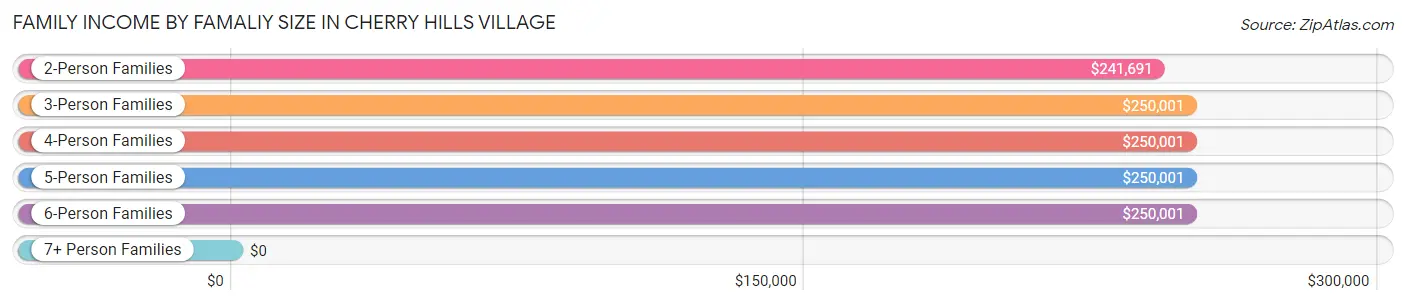
| Income Bracket | # Families | Median Income |
| 2-Person Families | 971 (49.0%) | $241,691 |
| 3-Person Families | 257 (13.0%) | $250,001 |
| 4-Person Families | 541 (27.3%) | $250,001 |
| 5-Person Families | 171 (8.6%) | $250,001 |
| 6-Person Families | 39 (2.0%) | $250,001 |
| 7+ Person Families | 3 (0.2%) | $0 |
| Total | 1,982 (100.0%) | $250,001 |
Family Income by Number of Earners in Cherry Hills Village
The median family income in Cherry Hills Village is $250,001, with families comprising 1 earner (756) having the highest median family income of $250,001, while families with no earners (355) have the lowest median family income of $131,125, accounting for 38.1% and 17.9% of families, respectively.
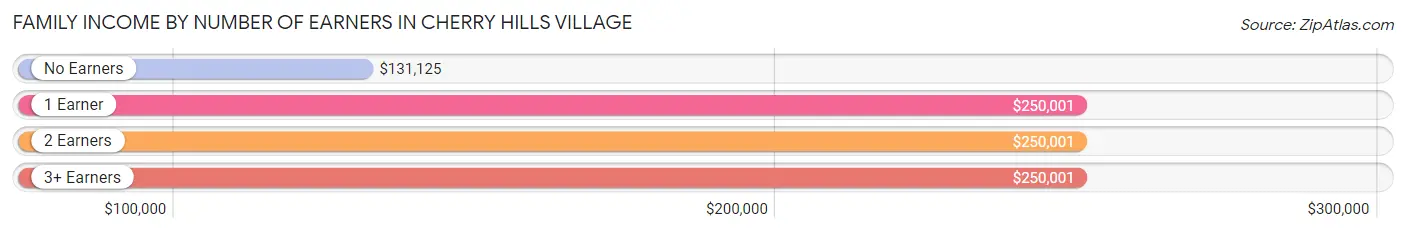
| Number of Earners | # Families | Median Income |
| No Earners | 355 (17.9%) | $131,125 |
| 1 Earner | 756 (38.1%) | $250,001 |
| 2 Earners | 764 (38.6%) | $250,001 |
| 3+ Earners | 107 (5.4%) | $250,001 |
| Total | 1,982 (100.0%) | $250,001 |
Household Income in Cherry Hills Village
Household Income Brackets in Cherry Hills Village
With 1,500 households falling in the category, the $200,000+ income range is the most frequent in Cherry Hills Village, accounting for 66.9% of all households. In contrast, only 7 households (0.3%) fall into the $10,000 to $14,999 income bracket, making it the least populous group.
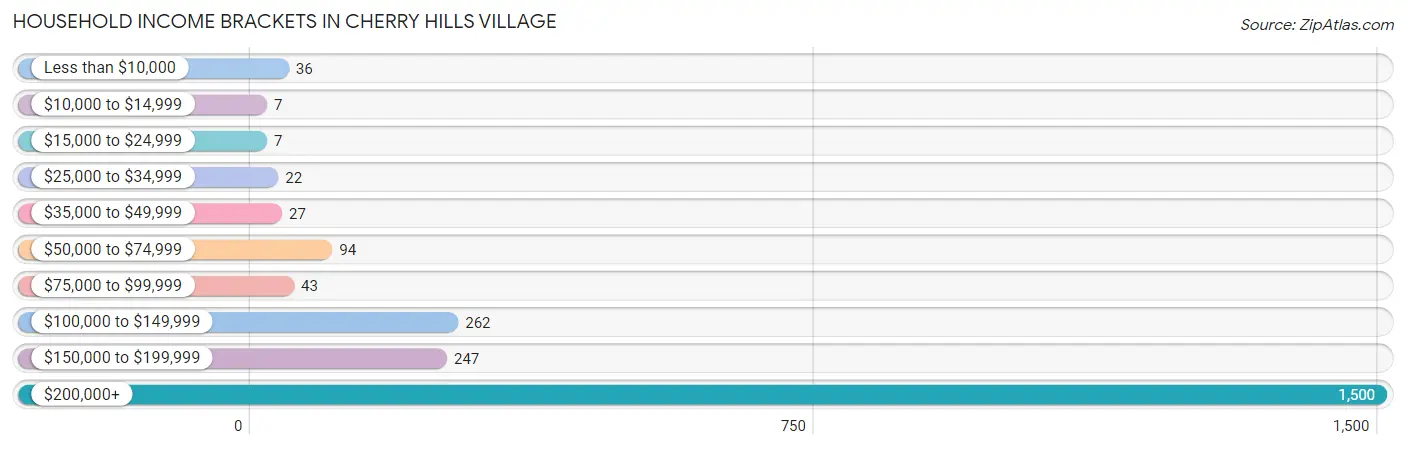
| Income Bracket | # Households | % Households |
| Less than $10,000 | 36 | 1.6% |
| $10,000 to $14,999 | 7 | 0.3% |
| $15,000 to $24,999 | 7 | 0.3% |
| $25,000 to $34,999 | 22 | 1.0% |
| $35,000 to $49,999 | 27 | 1.2% |
| $50,000 to $74,999 | 94 | 4.2% |
| $75,000 to $99,999 | 43 | 1.9% |
| $100,000 to $149,999 | 262 | 11.7% |
| $150,000 to $199,999 | 247 | 11.0% |
| $200,000+ | 1,500 | 66.9% |
Household Income by Householder Age in Cherry Hills Village
The median household income in Cherry Hills Village is $250,001, with the highest median household income of $250,001 found in the 25 to 44 years age bracket for the primary householder. A total of 410 households (18.3%) fall into this category.
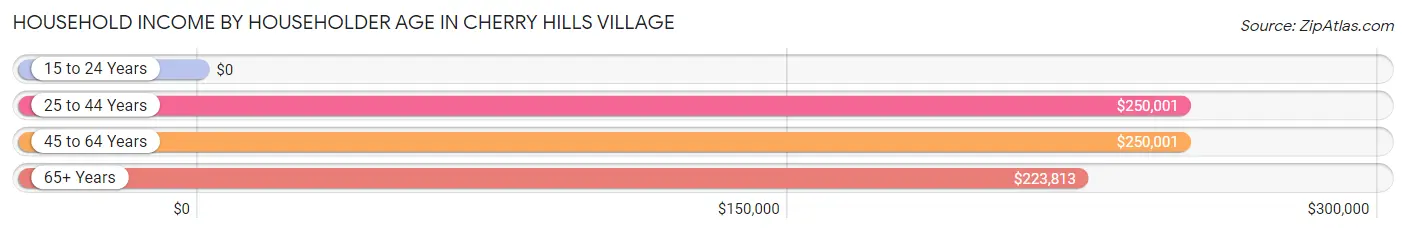
| Income Bracket | # Households | Median Income |
| 15 to 24 Years | 0 (0.0%) | $0 |
| 25 to 44 Years | 410 (18.3%) | $250,001 |
| 45 to 64 Years | 1,033 (46.1%) | $250,001 |
| 65+ Years | 799 (35.6%) | $223,813 |
| Total | 2,242 (100.0%) | $250,001 |
Poverty in Cherry Hills Village
Income Below Poverty by Sex and Age in Cherry Hills Village
With 2.2% poverty level for males and 3.1% for females among the residents of Cherry Hills Village, under 5 year old males and 25 to 34 year old females are the most vulnerable to poverty, with 17 males (13.6%) and 20 females (13.3%) in their respective age groups living below the poverty level.
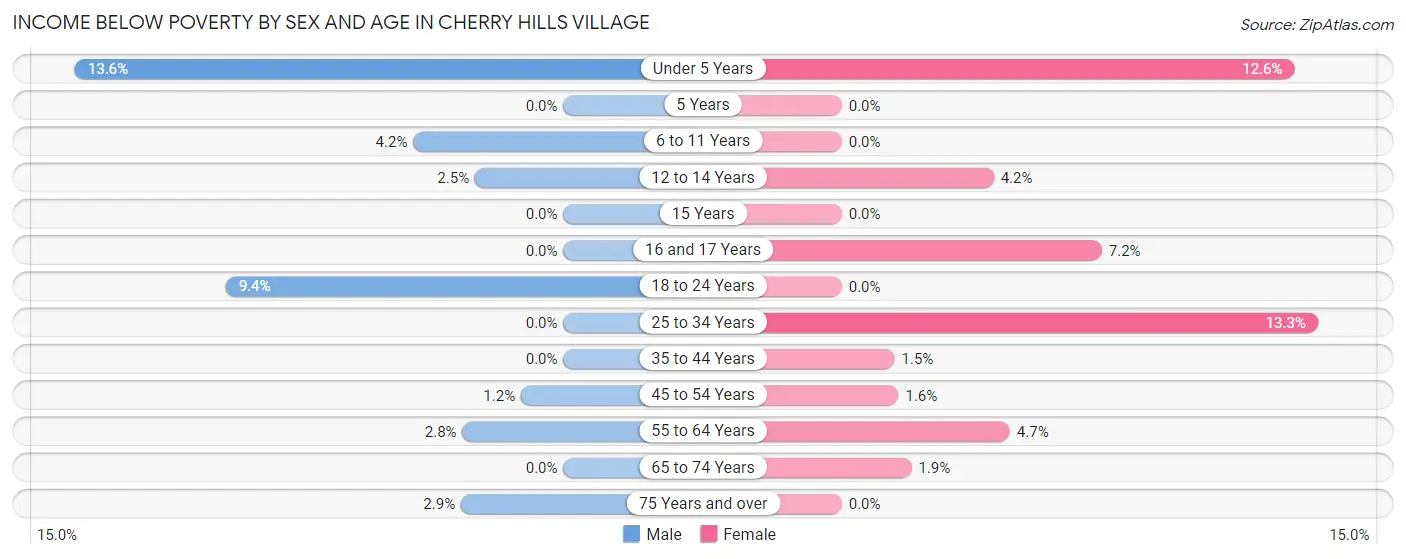
| Age Bracket | Male | Female |
| Under 5 Years | 17 (13.6%) | 16 (12.6%) |
| 5 Years | 0 (0.0%) | 0 (0.0%) |
| 6 to 11 Years | 12 (4.2%) | 0 (0.0%) |
| 12 to 14 Years | 7 (2.5%) | 8 (4.2%) |
| 15 Years | 0 (0.0%) | 0 (0.0%) |
| 16 and 17 Years | 0 (0.0%) | 11 (7.2%) |
| 18 to 24 Years | 11 (9.4%) | 0 (0.0%) |
| 25 to 34 Years | 0 (0.0%) | 20 (13.3%) |
| 35 to 44 Years | 0 (0.0%) | 6 (1.5%) |
| 45 to 54 Years | 6 (1.2%) | 8 (1.6%) |
| 55 to 64 Years | 13 (2.8%) | 21 (4.7%) |
| 65 to 74 Years | 0 (0.0%) | 8 (1.9%) |
| 75 Years and over | 7 (2.9%) | 0 (0.0%) |
| Total | 73 (2.2%) | 98 (3.1%) |
Income Above Poverty by Sex and Age in Cherry Hills Village
According to the poverty statistics in Cherry Hills Village, males aged 5 years and females aged 5 years are the age groups that are most secure financially, with 100.0% of males and 100.0% of females in these age groups living above the poverty line.
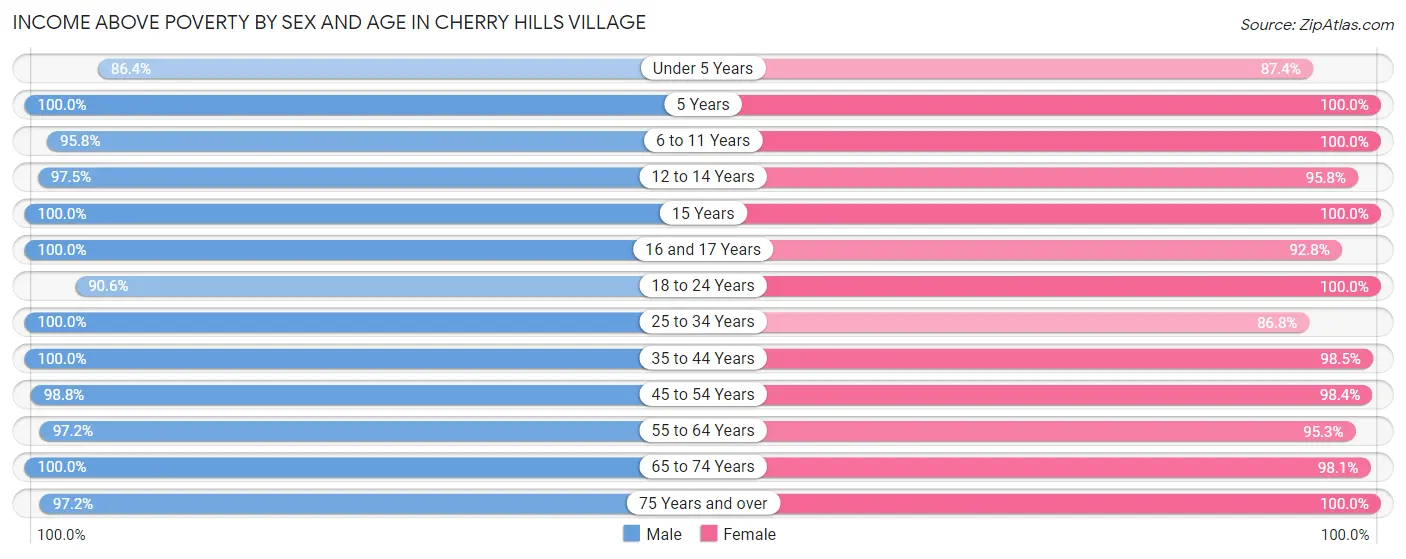
| Age Bracket | Male | Female |
| Under 5 Years | 108 (86.4%) | 111 (87.4%) |
| 5 Years | 13 (100.0%) | 12 (100.0%) |
| 6 to 11 Years | 275 (95.8%) | 273 (100.0%) |
| 12 to 14 Years | 277 (97.5%) | 181 (95.8%) |
| 15 Years | 71 (100.0%) | 99 (100.0%) |
| 16 and 17 Years | 103 (100.0%) | 141 (92.8%) |
| 18 to 24 Years | 106 (90.6%) | 87 (100.0%) |
| 25 to 34 Years | 203 (100.0%) | 131 (86.8%) |
| 35 to 44 Years | 319 (100.0%) | 403 (98.5%) |
| 45 to 54 Years | 503 (98.8%) | 499 (98.4%) |
| 55 to 64 Years | 449 (97.2%) | 428 (95.3%) |
| 65 to 74 Years | 532 (100.0%) | 405 (98.1%) |
| 75 Years and over | 239 (97.2%) | 266 (100.0%) |
| Total | 3,198 (97.8%) | 3,036 (96.9%) |
Income Below Poverty Among Married-Couple Families in Cherry Hills Village
The poverty statistics for married-couple families in Cherry Hills Village show that 1.4% or 26 of the total 1,864 families live below the poverty line. Families with no children have the highest poverty rate of 1.9%, comprising of 20 families. On the other hand, families with 3 or 4 children have the lowest poverty rate of 0.0%, which includes 0 families.
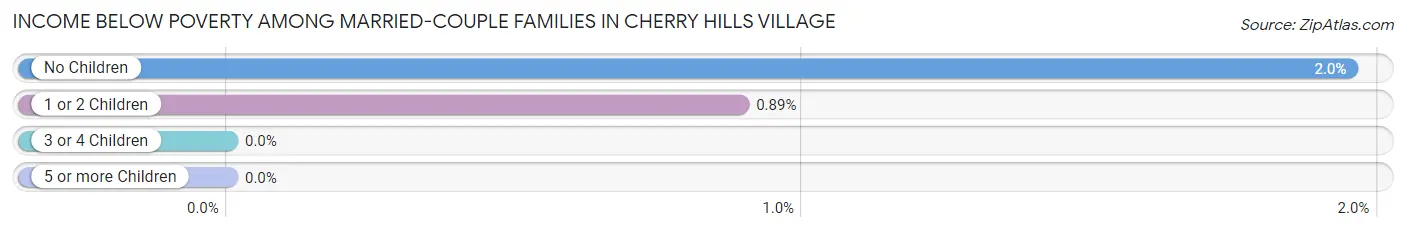
| Children | Above Poverty | Below Poverty |
| No Children | 1,008 (98.1%) | 20 (1.9%) |
| 1 or 2 Children | 667 (99.1%) | 6 (0.9%) |
| 3 or 4 Children | 160 (100.0%) | 0 (0.0%) |
| 5 or more Children | 3 (100.0%) | 0 (0.0%) |
| Total | 1,838 (98.6%) | 26 (1.4%) |
Income Below Poverty Among Single-Parent Households in Cherry Hills Village
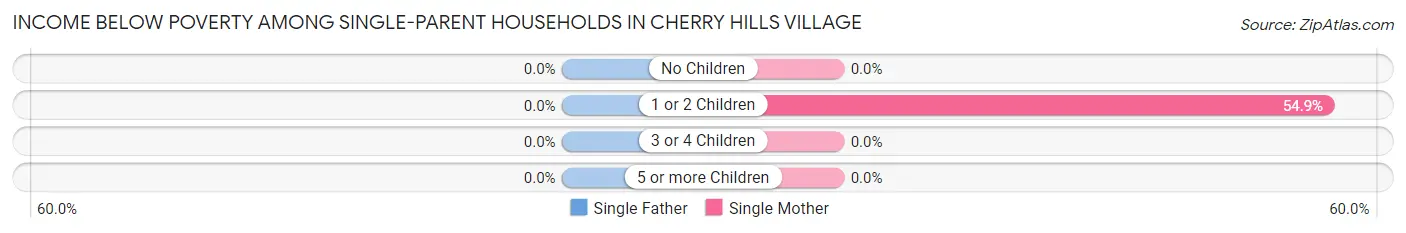
| Children | Single Father | Single Mother |
| No Children | 0 (0.0%) | 0 (0.0%) |
| 1 or 2 Children | 0 (0.0%) | 28 (54.9%) |
| 3 or 4 Children | 0 (0.0%) | 0 (0.0%) |
| 5 or more Children | 0 (0.0%) | 0 (0.0%) |
| Total | 0 (0.0%) | 28 (35.0%) |
Income Below Poverty Among Married-Couple vs Single-Parent Households in Cherry Hills Village
The poverty data for Cherry Hills Village shows that 26 of the married-couple family households (1.4%) and 28 of the single-parent households (23.7%) are living below the poverty level. Within the married-couple family households, those with no children have the highest poverty rate, with 20 households (1.9%) falling below the poverty line. Among the single-parent households, those with 1 or 2 children have the highest poverty rate, with 28 household (54.9%) living below poverty.
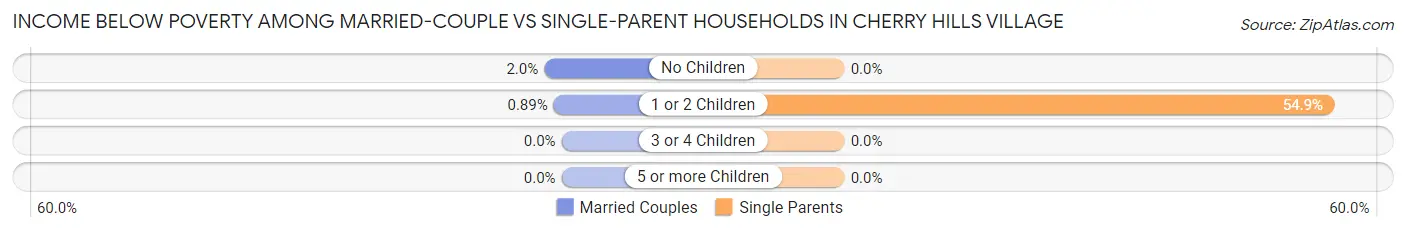
| Children | Married-Couple Families | Single-Parent Households |
| No Children | 20 (1.9%) | 0 (0.0%) |
| 1 or 2 Children | 6 (0.9%) | 28 (54.9%) |
| 3 or 4 Children | 0 (0.0%) | 0 (0.0%) |
| 5 or more Children | 0 (0.0%) | 0 (0.0%) |
| Total | 26 (1.4%) | 28 (23.7%) |
Race in Cherry Hills Village
The most populous races in Cherry Hills Village are White / Caucasian (5,778 | 90.2%), Two or more Races (481 | 7.5%), and Hispanic or Latino (375 | 5.9%).
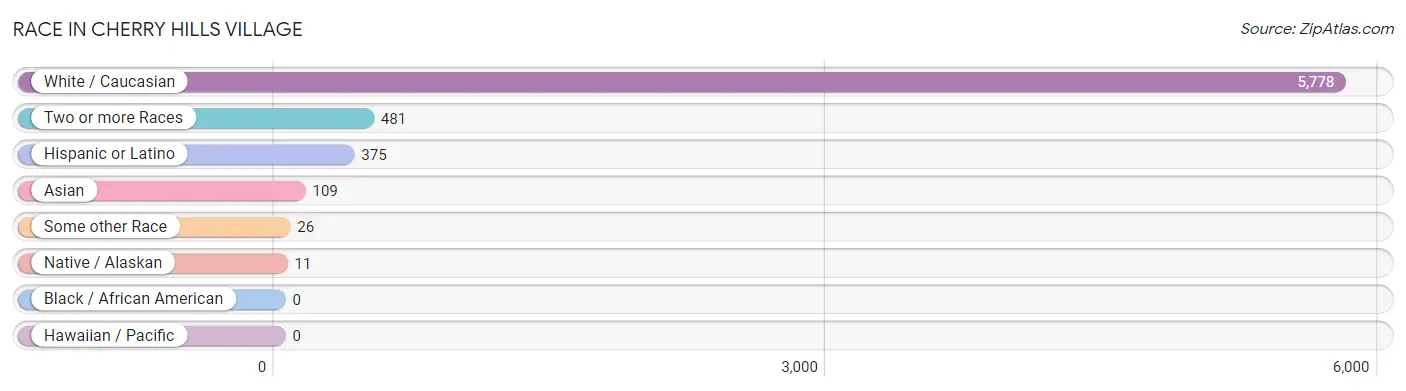
| Race | # Population | % Population |
| Asian | 109 | 1.7% |
| Black / African American | 0 | 0.0% |
| Hawaiian / Pacific | 0 | 0.0% |
| Hispanic or Latino | 375 | 5.9% |
| Native / Alaskan | 11 | 0.2% |
| White / Caucasian | 5,778 | 90.2% |
| Two or more Races | 481 | 7.5% |
| Some other Race | 26 | 0.4% |
| Total | 6,405 | 100.0% |
Ancestry in Cherry Hills Village
The most populous ancestries reported in Cherry Hills Village are English (1,331 | 20.8%), German (1,105 | 17.2%), Irish (947 | 14.8%), American (443 | 6.9%), and European (319 | 5.0%), together accounting for 64.7% of all Cherry Hills Village residents.
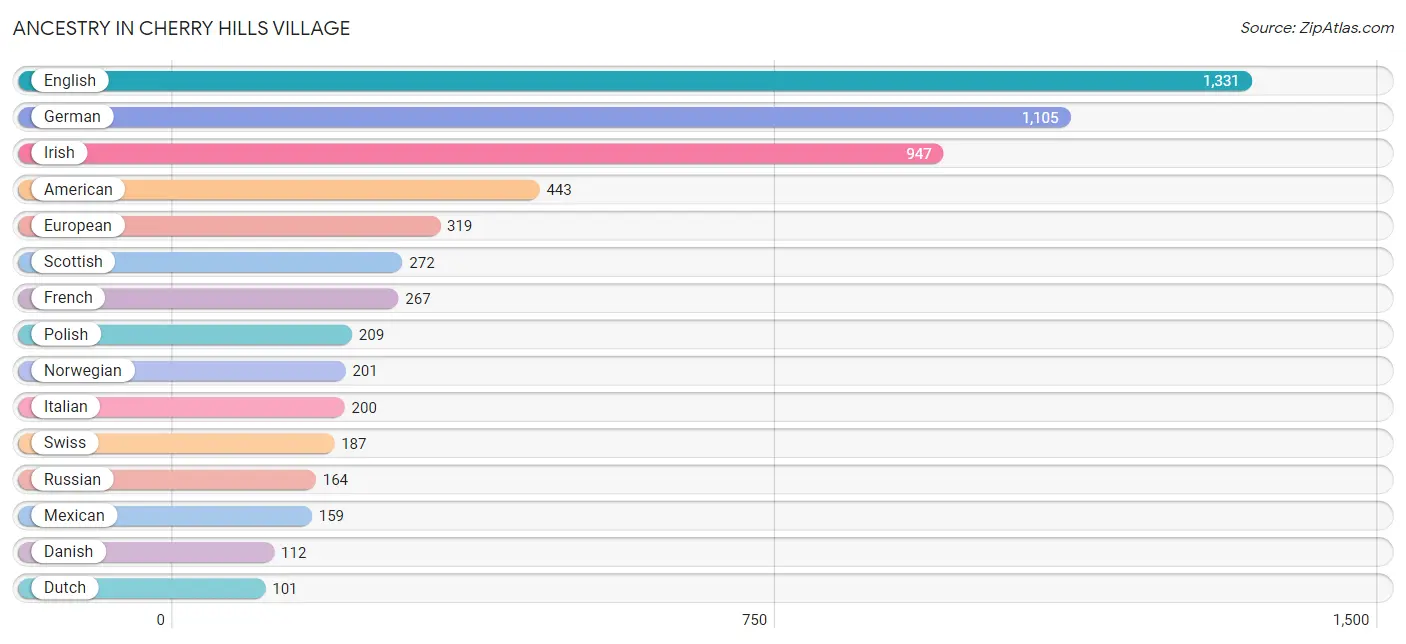
| Ancestry | # Population | % Population |
| American | 443 | 6.9% |
| Arab | 26 | 0.4% |
| Austrian | 11 | 0.2% |
| Belgian | 7 | 0.1% |
| Bhutanese | 27 | 0.4% |
| Blackfeet | 11 | 0.2% |
| British | 79 | 1.2% |
| Burmese | 45 | 0.7% |
| Canadian | 58 | 0.9% |
| Celtic | 28 | 0.4% |
| Czech | 58 | 0.9% |
| Danish | 112 | 1.8% |
| Dutch | 101 | 1.6% |
| Eastern European | 24 | 0.4% |
| Egyptian | 11 | 0.2% |
| English | 1,331 | 20.8% |
| European | 319 | 5.0% |
| Finnish | 7 | 0.1% |
| French | 267 | 4.2% |
| French Canadian | 22 | 0.3% |
| German | 1,105 | 17.2% |
| Greek | 25 | 0.4% |
| Hungarian | 44 | 0.7% |
| Indian (Asian) | 30 | 0.5% |
| Iranian | 61 | 0.9% |
| Irish | 947 | 14.8% |
| Israeli | 27 | 0.4% |
| Italian | 200 | 3.1% |
| Lebanese | 15 | 0.2% |
| Lithuanian | 34 | 0.5% |
| Mexican | 159 | 2.5% |
| Mexican American Indian | 11 | 0.2% |
| Northern European | 85 | 1.3% |
| Norwegian | 201 | 3.1% |
| Polish | 209 | 3.3% |
| Puerto Rican | 20 | 0.3% |
| Romanian | 12 | 0.2% |
| Russian | 164 | 2.6% |
| Scandinavian | 48 | 0.7% |
| Scotch-Irish | 31 | 0.5% |
| Scottish | 272 | 4.3% |
| Slavic | 4 | 0.1% |
| Slovak | 8 | 0.1% |
| Slovene | 7 | 0.1% |
| Spanish | 50 | 0.8% |
| Swedish | 87 | 1.4% |
| Swiss | 187 | 2.9% |
| Thai | 50 | 0.8% |
| Turkish | 4 | 0.1% |
| Ukrainian | 12 | 0.2% |
| Welsh | 26 | 0.4% |
| Yugoslavian | 4 | 0.1% | View All 52 Rows |
Immigrants in Cherry Hills Village
The most numerous immigrant groups reported in Cherry Hills Village came from Asia (121 | 1.9%), Europe (94 | 1.5%), South Central Asia (84 | 1.3%), Northern Europe (69 | 1.1%), and Canada (68 | 1.1%), together accounting for 6.8% of all Cherry Hills Village residents.
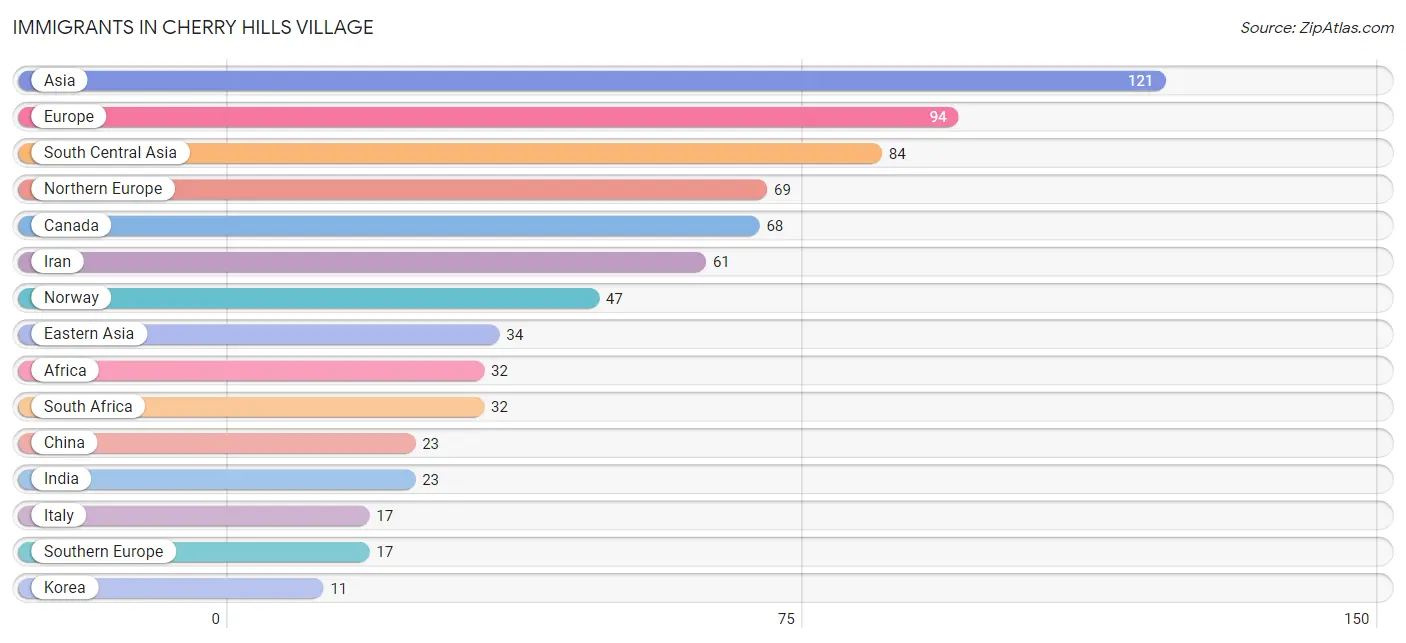
| Immigration Origin | # Population | % Population |
| Africa | 32 | 0.5% |
| Asia | 121 | 1.9% |
| Canada | 68 | 1.1% |
| Central America | 9 | 0.1% |
| China | 23 | 0.4% |
| Eastern Asia | 34 | 0.5% |
| England | 3 | 0.1% |
| Europe | 94 | 1.5% |
| India | 23 | 0.4% |
| Iran | 61 | 0.9% |
| Italy | 17 | 0.3% |
| Korea | 11 | 0.2% |
| Latin America | 9 | 0.1% |
| Mexico | 9 | 0.1% |
| Netherlands | 8 | 0.1% |
| Northern Europe | 69 | 1.1% |
| Norway | 47 | 0.7% |
| Oceania | 6 | 0.1% |
| South Africa | 32 | 0.5% |
| South Central Asia | 84 | 1.3% |
| South Eastern Asia | 3 | 0.1% |
| Southern Europe | 17 | 0.3% |
| Western Europe | 8 | 0.1% | View All 23 Rows |
Sex and Age in Cherry Hills Village
Sex and Age in Cherry Hills Village
The most populous age groups in Cherry Hills Village are 10 to 14 Years (424 | 13.0%) for men and 15 to 19 Years (315 | 10.1%) for women.
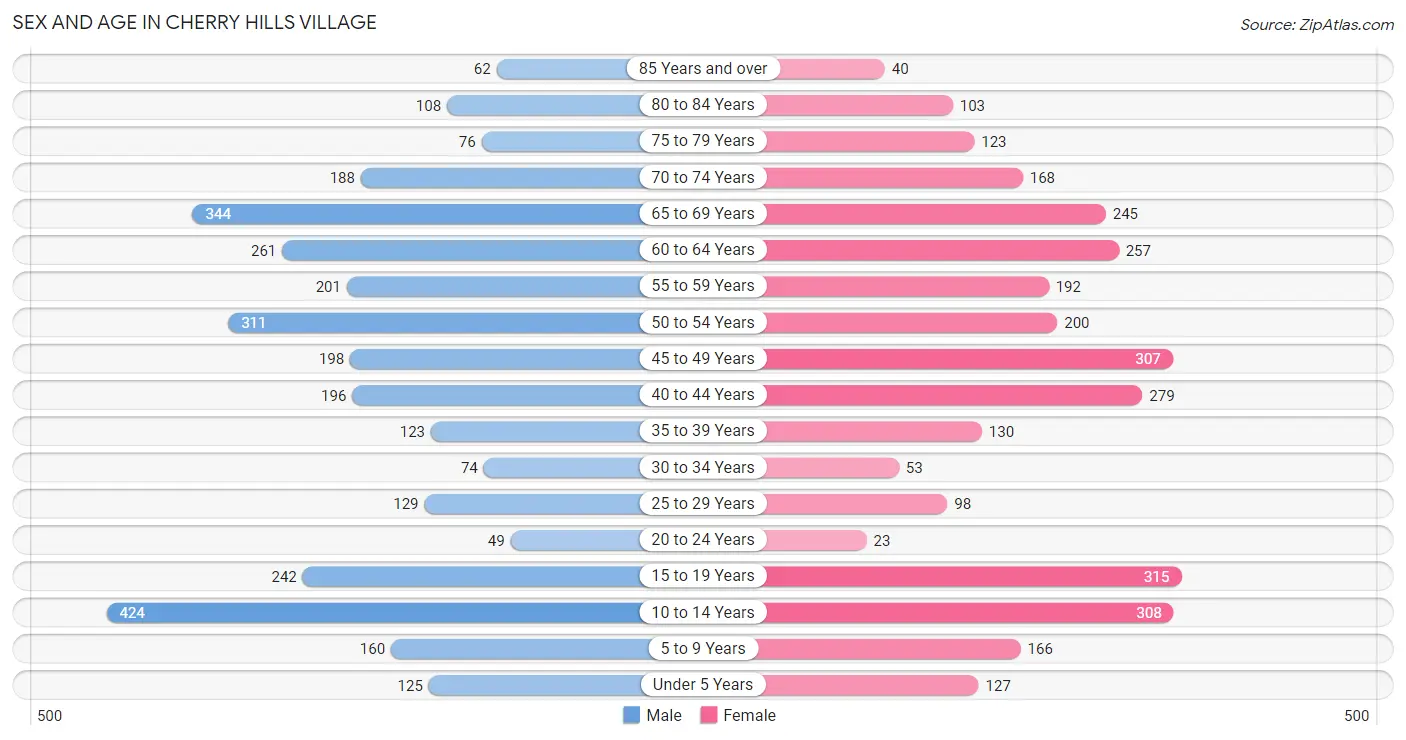
| Age Bracket | Male | Female |
| Under 5 Years | 125 (3.8%) | 127 (4.1%) |
| 5 to 9 Years | 160 (4.9%) | 166 (5.3%) |
| 10 to 14 Years | 424 (13.0%) | 308 (9.8%) |
| 15 to 19 Years | 242 (7.4%) | 315 (10.1%) |
| 20 to 24 Years | 49 (1.5%) | 23 (0.7%) |
| 25 to 29 Years | 129 (3.9%) | 98 (3.1%) |
| 30 to 34 Years | 74 (2.3%) | 53 (1.7%) |
| 35 to 39 Years | 123 (3.8%) | 130 (4.2%) |
| 40 to 44 Years | 196 (6.0%) | 279 (8.9%) |
| 45 to 49 Years | 198 (6.0%) | 307 (9.8%) |
| 50 to 54 Years | 311 (9.5%) | 200 (6.4%) |
| 55 to 59 Years | 201 (6.1%) | 192 (6.1%) |
| 60 to 64 Years | 261 (8.0%) | 257 (8.2%) |
| 65 to 69 Years | 344 (10.5%) | 245 (7.8%) |
| 70 to 74 Years | 188 (5.8%) | 168 (5.4%) |
| 75 to 79 Years | 76 (2.3%) | 123 (3.9%) |
| 80 to 84 Years | 108 (3.3%) | 103 (3.3%) |
| 85 Years and over | 62 (1.9%) | 40 (1.3%) |
| Total | 3,271 (100.0%) | 3,134 (100.0%) |
Families and Households in Cherry Hills Village
Median Family Size in Cherry Hills Village
The median family size in Cherry Hills Village is 3.03 persons per family, with married-couple families (1,864 | 94.1%) accounting for the largest median family size of 3.08 persons per family. On the other hand, single male/father families (38 | 1.9%) represent the smallest median family size with 2.21 persons per family.
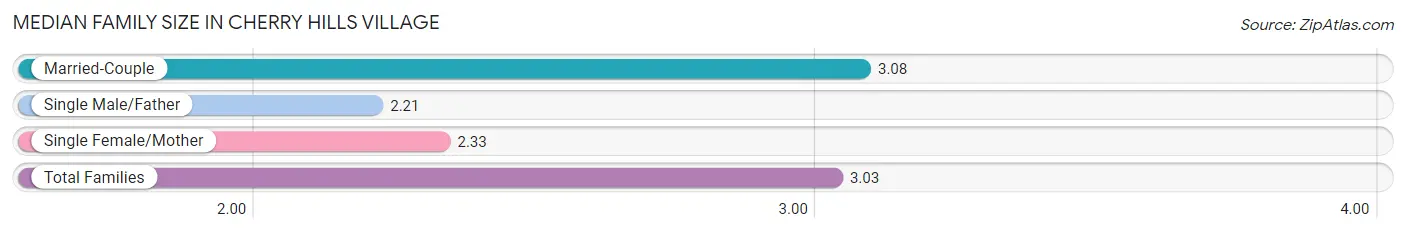
| Family Type | # Families | Family Size |
| Married-Couple | 1,864 (94.1%) | 3.08 |
| Single Male/Father | 38 (1.9%) | 2.21 |
| Single Female/Mother | 80 (4.0%) | 2.33 |
| Total Families | 1,982 (100.0%) | 3.03 |
Median Household Size in Cherry Hills Village
The median household size in Cherry Hills Village is 2.86 persons per household, with married-couple households (1,864 | 83.1%) accounting for the largest median household size of 3.08 persons per household. non-family households (260 | 11.6%) represent the smallest median household size with 1.32 persons per household.
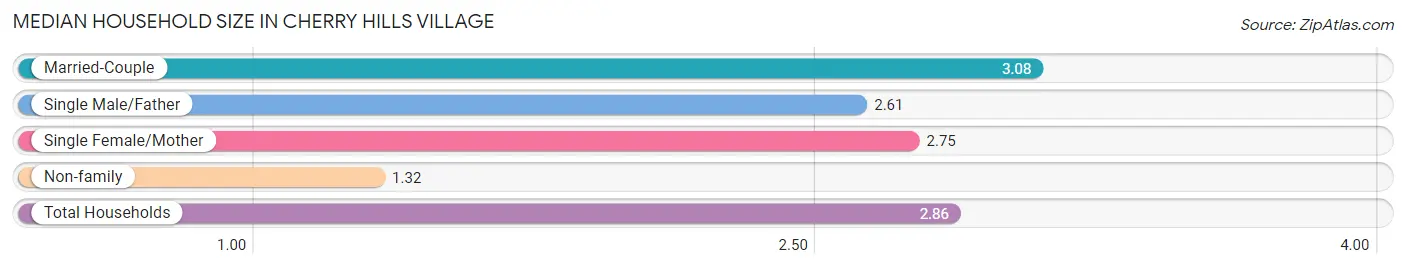
| Household Type | # Households | Household Size |
| Married-Couple | 1,864 (83.1%) | 3.08 |
| Single Male/Father | 38 (1.7%) | 2.61 |
| Single Female/Mother | 80 (3.6%) | 2.75 |
| Non-family | 260 (11.6%) | 1.32 |
| Total Households | 2,242 (100.0%) | 2.86 |
Household Size by Marriage Status in Cherry Hills Village
Out of a total of 2,242 households in Cherry Hills Village, 1,982 (88.4%) are family households, while 260 (11.6%) are nonfamily households. The most numerous type of family households are 2-person households, comprising 952, and the most common type of nonfamily households are 1-person households, comprising 228.

| Household Size | Family Households | Nonfamily Households |
| 1-Person Households | - | 228 (10.2%) |
| 2-Person Households | 952 (42.5%) | 11 (0.5%) |
| 3-Person Households | 256 (11.4%) | 0 (0.0%) |
| 4-Person Households | 561 (25.0%) | 21 (0.9%) |
| 5-Person Households | 171 (7.6%) | 0 (0.0%) |
| 6-Person Households | 39 (1.7%) | 0 (0.0%) |
| 7+ Person Households | 3 (0.1%) | 0 (0.0%) |
| Total | 1,982 (88.4%) | 260 (11.6%) |
Female Fertility in Cherry Hills Village
Fertility by Age in Cherry Hills Village
Average fertility rate in Cherry Hills Village is 12.0 births per 1,000 women. Women in the age bracket of 35 to 50 years have the highest fertility rate with 20.0 births per 1,000 women. Women in the age bracket of 35 to 50 years acount for 100.0% of all women with births.
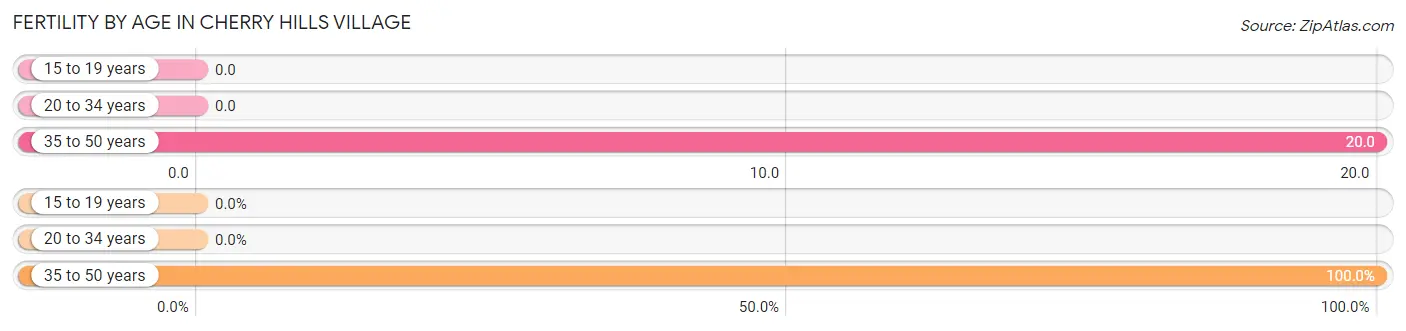
| Age Bracket | Women with Births | Births / 1,000 Women |
| 15 to 19 years | 0 (0.0%) | 0.0 |
| 20 to 34 years | 0 (0.0%) | 0.0 |
| 35 to 50 years | 15 (100.0%) | 20.0 |
| Total | 15 (100.0%) | 12.0 |
Fertility by Age by Marriage Status in Cherry Hills Village
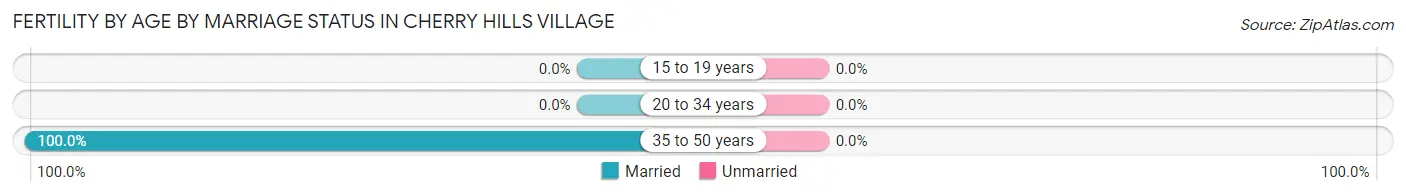
| Age Bracket | Married | Unmarried |
| 15 to 19 years | 0 (0.0%) | 0 (0.0%) |
| 20 to 34 years | 0 (0.0%) | 0 (0.0%) |
| 35 to 50 years | 15 (100.0%) | 0 (0.0%) |
| Total | 15 (100.0%) | 0 (0.0%) |
Fertility by Education in Cherry Hills Village
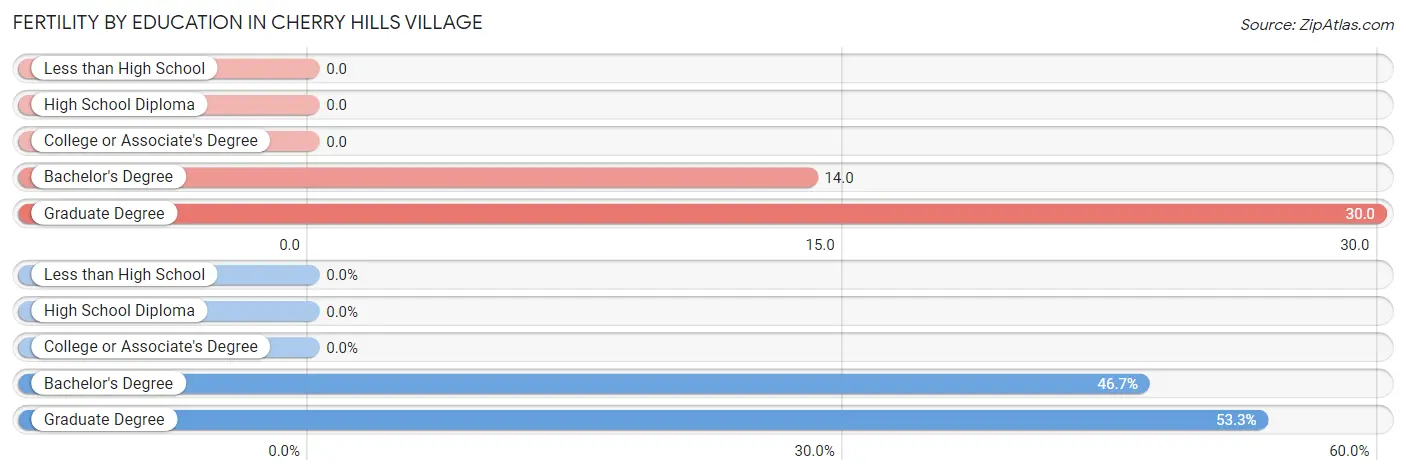
| Educational Attainment | Women with Births | Births / 1,000 Women |
| Less than High School | 0 (0.0%) | 0.0 |
| High School Diploma | 0 (0.0%) | 0.0 |
| College or Associate's Degree | 0 (0.0%) | 0.0 |
| Bachelor's Degree | 7 (46.7%) | 14.0 |
| Graduate Degree | 8 (53.3%) | 30.0 |
| Total | 15 (100.0%) | 12.0 |
Fertility by Education by Marriage Status in Cherry Hills Village
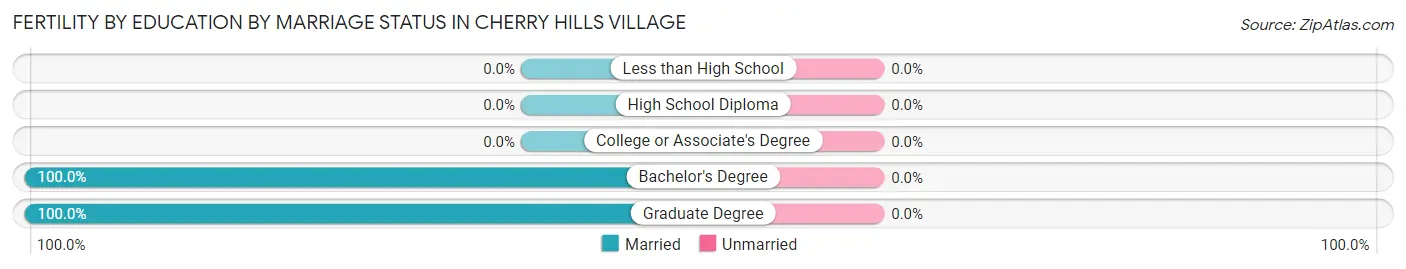
| Educational Attainment | Married | Unmarried |
| Less than High School | 0 (0.0%) | 0 (0.0%) |
| High School Diploma | 0 (0.0%) | 0 (0.0%) |
| College or Associate's Degree | 0 (0.0%) | 0 (0.0%) |
| Bachelor's Degree | 7 (100.0%) | 0 (0.0%) |
| Graduate Degree | 8 (100.0%) | 0 (0.0%) |
| Total | 15 (100.0%) | 0 (0.0%) |
Employment Characteristics in Cherry Hills Village
Employment by Class of Employer in Cherry Hills Village
Among the 2,551 employed individuals in Cherry Hills Village, private company employees (1,510 | 59.2%), self-employed (incorporated) (598 | 23.4%), and self-employed (not incorporated) (201 | 7.9%) make up the most common classes of employment.
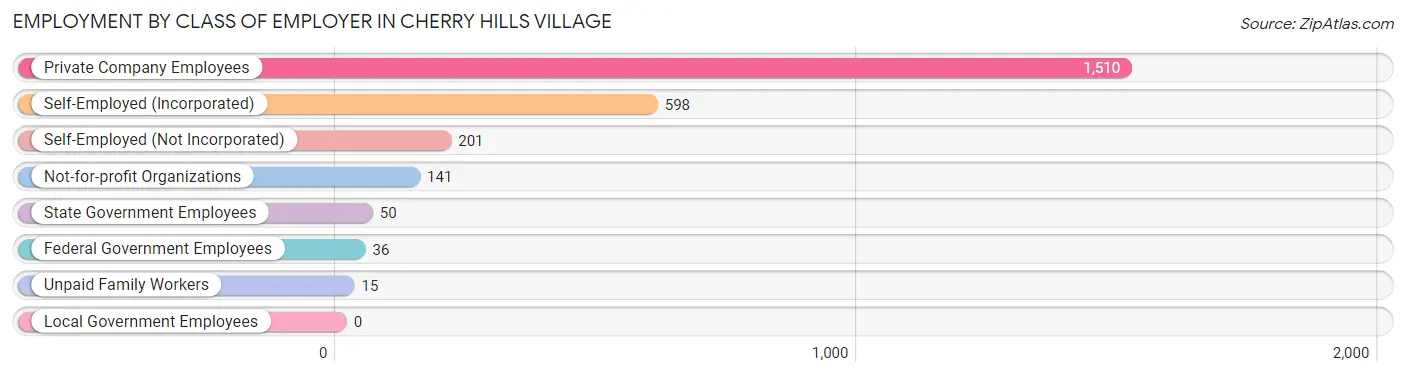
| Employer Class | # Employees | % Employees |
| Private Company Employees | 1,510 | 59.2% |
| Self-Employed (Incorporated) | 598 | 23.4% |
| Self-Employed (Not Incorporated) | 201 | 7.9% |
| Not-for-profit Organizations | 141 | 5.5% |
| Local Government Employees | 0 | 0.0% |
| State Government Employees | 50 | 2.0% |
| Federal Government Employees | 36 | 1.4% |
| Unpaid Family Workers | 15 | 0.6% |
| Total | 2,551 | 100.0% |
Employment Status by Age in Cherry Hills Village
According to the labor force statistics for Cherry Hills Village, out of the total population over 16 years of age (4,925), 53.7% or 2,645 individuals are in the labor force, with 2.8% or 74 of them unemployed. The age group with the highest labor force participation rate is 55 to 59 years, with 82.2% or 323 individuals in the labor force. Within the labor force, the 25 to 29 years age range has the highest percentage of unemployed individuals, with 24.2% or 31 of them being unemployed.
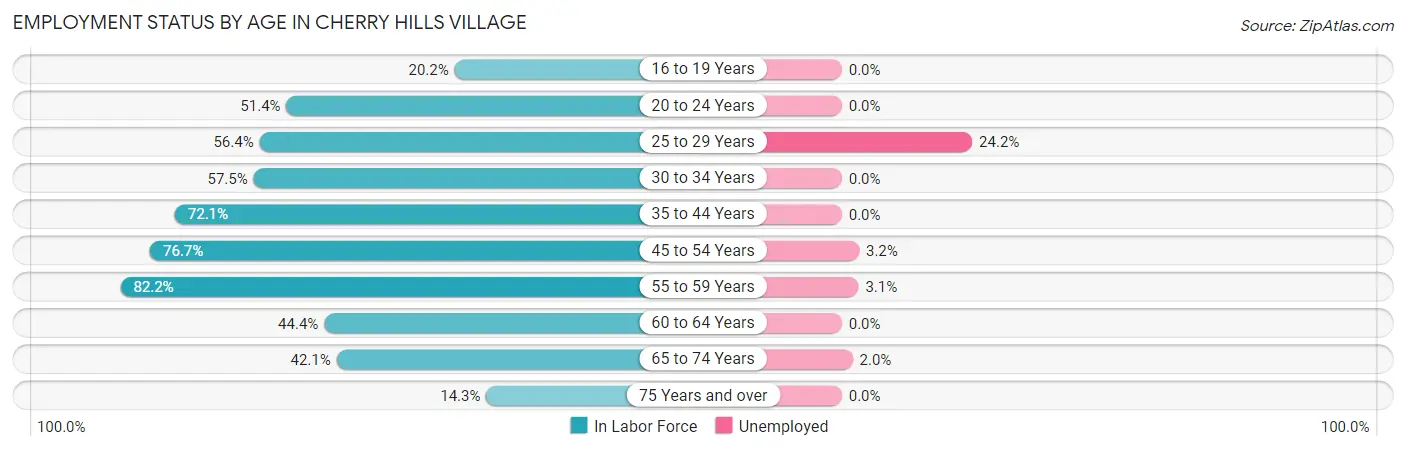
| Age Bracket | In Labor Force | Unemployed |
| 16 to 19 Years | 78 (20.2%) | 0 (0.0%) |
| 20 to 24 Years | 37 (51.4%) | 0 (0.0%) |
| 25 to 29 Years | 128 (56.4%) | 31 (24.2%) |
| 30 to 34 Years | 73 (57.5%) | 0 (0.0%) |
| 35 to 44 Years | 525 (72.1%) | 0 (0.0%) |
| 45 to 54 Years | 779 (76.7%) | 25 (3.2%) |
| 55 to 59 Years | 323 (82.2%) | 10 (3.1%) |
| 60 to 64 Years | 230 (44.4%) | 0 (0.0%) |
| 65 to 74 Years | 398 (42.1%) | 8 (2.0%) |
| 75 Years and over | 73 (14.3%) | 0 (0.0%) |
| Total | 2,645 (53.7%) | 74 (2.8%) |
Employment Status by Educational Attainment in Cherry Hills Village
According to labor force statistics for Cherry Hills Village, 68.4% of individuals (2,058) out of the total population between 25 and 64 years of age (3,009) are in the labor force, with 3.2% or 66 of them being unemployed. The group with the highest labor force participation rate are those with the educational attainment of bachelor's degree or higher, with 70.6% or 1,839 individuals in the labor force. Within the labor force, individuals with bachelor's degree or higher education have the highest percentage of unemployment, with 3.6% or 66 of them being unemployed.
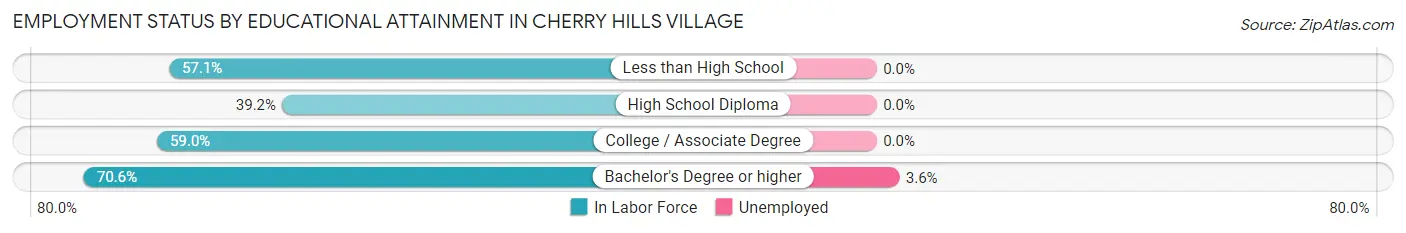
| Educational Attainment | In Labor Force | Unemployed |
| Less than High School | 8 (57.1%) | 0 (0.0%) |
| High School Diploma | 38 (39.2%) | 0 (0.0%) |
| College / Associate Degree | 173 (59.0%) | 0 (0.0%) |
| Bachelor's Degree or higher | 1,839 (70.6%) | 94 (3.6%) |
| Total | 2,058 (68.4%) | 96 (3.2%) |
Employment Occupations by Sex in Cherry Hills Village
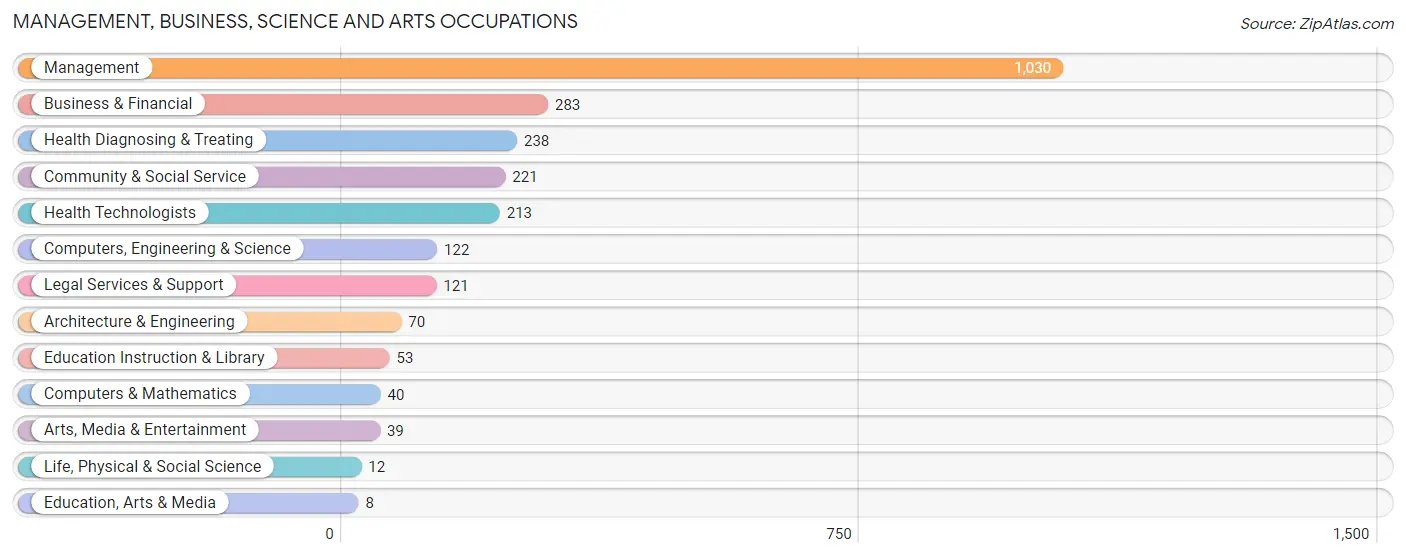
Management, Business, Science and Arts Occupations
The most common Management, Business, Science and Arts occupations in Cherry Hills Village are Management (1,030 | 40.2%), Business & Financial (283 | 11.0%), Health Diagnosing & Treating (238 | 9.3%), Community & Social Service (221 | 8.6%), and Health Technologists (213 | 8.3%).
Management, Business, Science and Arts Occupations by Sex
Within the Management, Business, Science and Arts occupations in Cherry Hills Village, the most male-oriented occupations are Computers & Mathematics (100.0%), Life, Physical & Social Science (100.0%), and Computers, Engineering & Science (95.1%), while the most female-oriented occupations are Education, Arts & Media (100.0%), Education Instruction & Library (77.4%), and Arts, Media & Entertainment (76.9%).
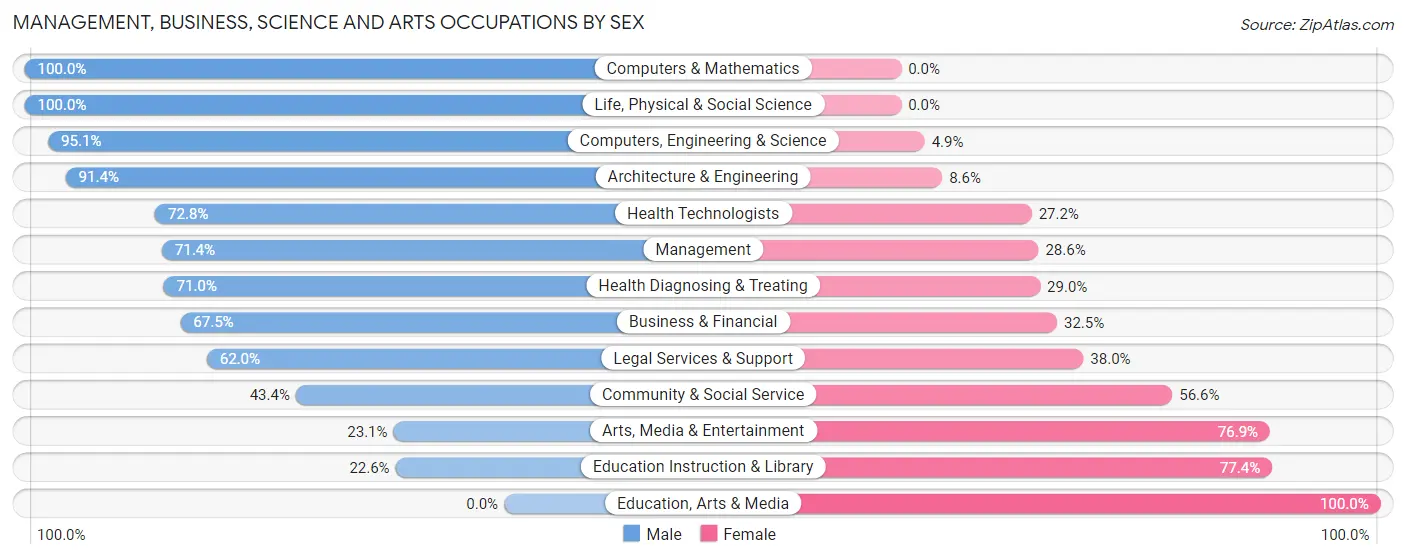
| Occupation | Male | Female |
| Management | 735 (71.4%) | 295 (28.6%) |
| Business & Financial | 191 (67.5%) | 92 (32.5%) |
| Computers, Engineering & Science | 116 (95.1%) | 6 (4.9%) |
| Computers & Mathematics | 40 (100.0%) | 0 (0.0%) |
| Architecture & Engineering | 64 (91.4%) | 6 (8.6%) |
| Life, Physical & Social Science | 12 (100.0%) | 0 (0.0%) |
| Community & Social Service | 96 (43.4%) | 125 (56.6%) |
| Education, Arts & Media | 0 (0.0%) | 8 (100.0%) |
| Legal Services & Support | 75 (62.0%) | 46 (38.0%) |
| Education Instruction & Library | 12 (22.6%) | 41 (77.4%) |
| Arts, Media & Entertainment | 9 (23.1%) | 30 (76.9%) |
| Health Diagnosing & Treating | 169 (71.0%) | 69 (29.0%) |
| Health Technologists | 155 (72.8%) | 58 (27.2%) |
| Total (Category) | 1,307 (69.0%) | 587 (31.0%) |
| Total (Overall) | 1,660 (64.7%) | 905 (35.3%) |
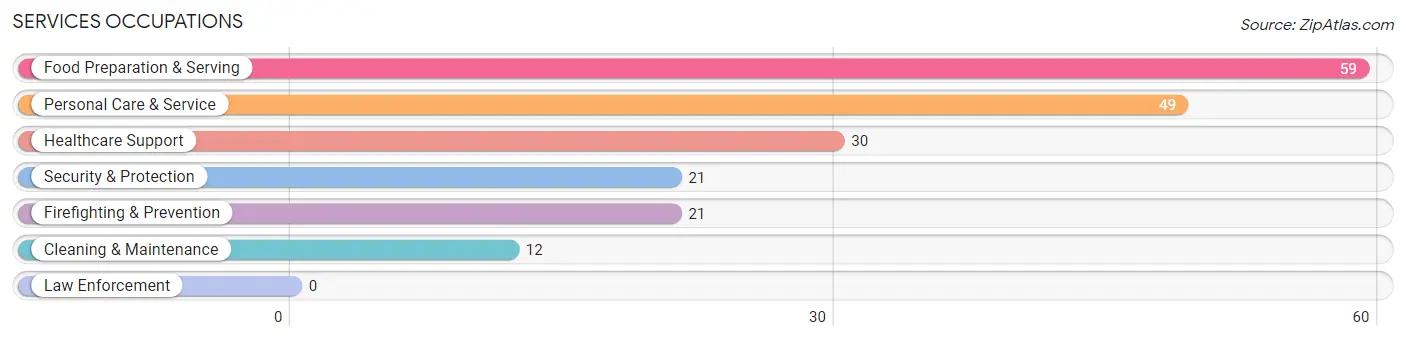
Services Occupations
The most common Services occupations in Cherry Hills Village are Food Preparation & Serving (59 | 2.3%), Personal Care & Service (49 | 1.9%), Healthcare Support (30 | 1.2%), Security & Protection (21 | 0.8%), and Firefighting & Prevention (21 | 0.8%).
Services Occupations by Sex
Within the Services occupations in Cherry Hills Village, the most male-oriented occupations are Cleaning & Maintenance (100.0%), Healthcare Support (56.7%), and Food Preparation & Serving (18.6%), while the most female-oriented occupations are Security & Protection (100.0%), Firefighting & Prevention (100.0%), and Personal Care & Service (100.0%).
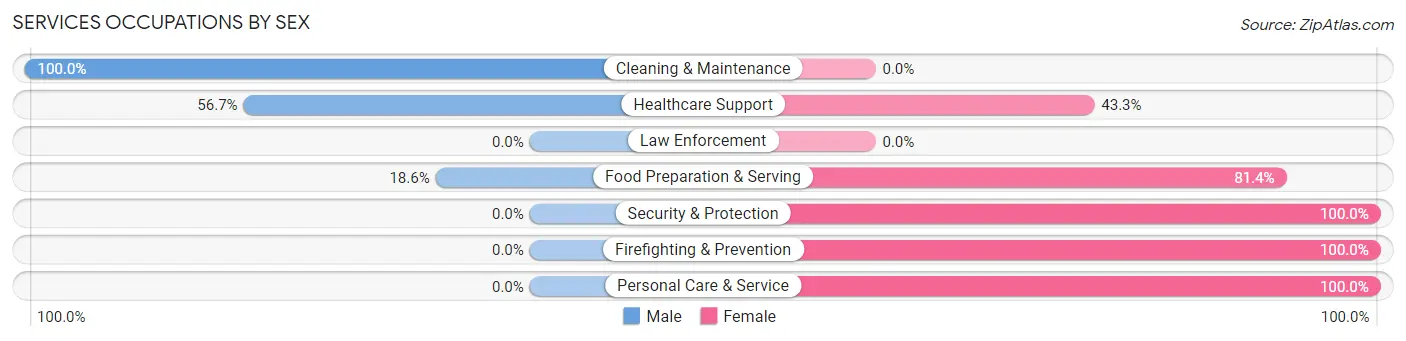
| Occupation | Male | Female |
| Healthcare Support | 17 (56.7%) | 13 (43.3%) |
| Security & Protection | 0 (0.0%) | 21 (100.0%) |
| Firefighting & Prevention | 0 (0.0%) | 21 (100.0%) |
| Law Enforcement | 0 (0.0%) | 0 (0.0%) |
| Food Preparation & Serving | 11 (18.6%) | 48 (81.4%) |
| Cleaning & Maintenance | 12 (100.0%) | 0 (0.0%) |
| Personal Care & Service | 0 (0.0%) | 49 (100.0%) |
| Total (Category) | 40 (23.4%) | 131 (76.6%) |
| Total (Overall) | 1,660 (64.7%) | 905 (35.3%) |
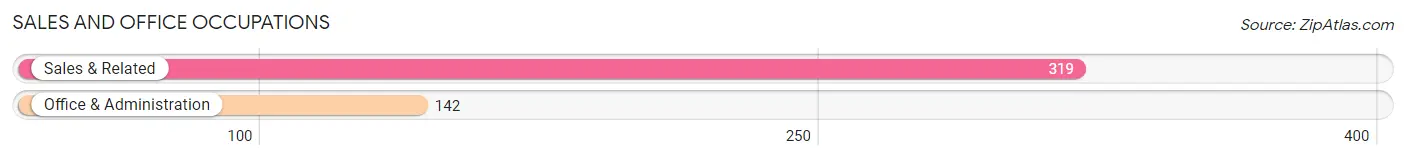
Sales and Office Occupations
The most common Sales and Office occupations in Cherry Hills Village are Sales & Related (319 | 12.4%), and Office & Administration (142 | 5.5%).
Sales and Office Occupations by Sex
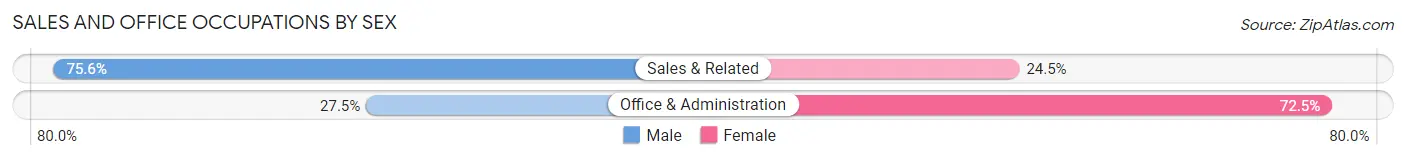
| Occupation | Male | Female |
| Sales & Related | 241 (75.5%) | 78 (24.4%) |
| Office & Administration | 39 (27.5%) | 103 (72.5%) |
| Total (Category) | 280 (60.7%) | 181 (39.3%) |
| Total (Overall) | 1,660 (64.7%) | 905 (35.3%) |
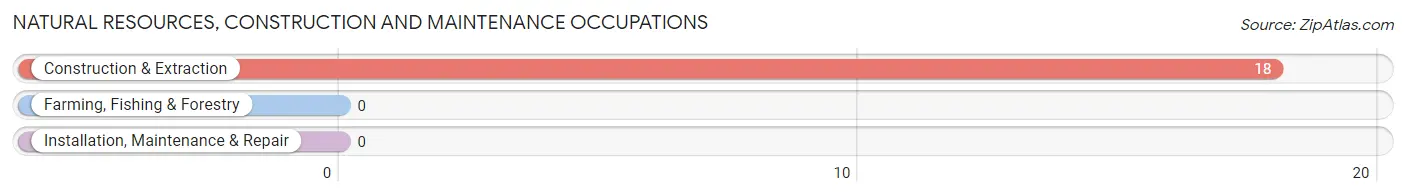
Natural Resources, Construction and Maintenance Occupations
The most common Natural Resources, Construction and Maintenance occupations in Cherry Hills Village are , and Construction & Extraction (18 | 0.7%).
Natural Resources, Construction and Maintenance Occupations by Sex
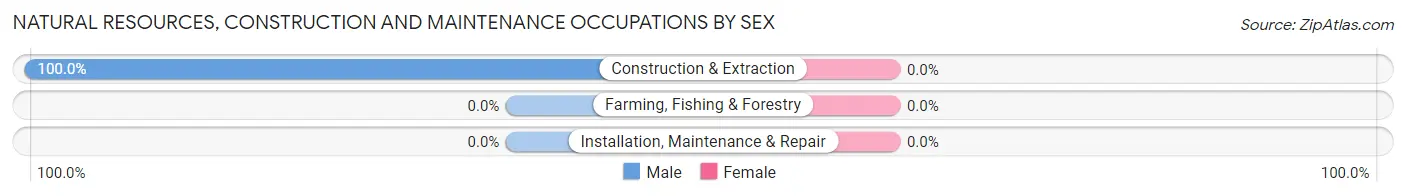
| Occupation | Male | Female |
| Farming, Fishing & Forestry | 0 (0.0%) | 0 (0.0%) |
| Construction & Extraction | 18 (100.0%) | 0 (0.0%) |
| Installation, Maintenance & Repair | 0 (0.0%) | 0 (0.0%) |
| Total (Category) | 18 (100.0%) | 0 (0.0%) |
| Total (Overall) | 1,660 (64.7%) | 905 (35.3%) |
Production, Transportation and Moving Occupations
The most common Production, Transportation and Moving occupations in Cherry Hills Village are Transportation (14 | 0.5%), and Production (7 | 0.3%).
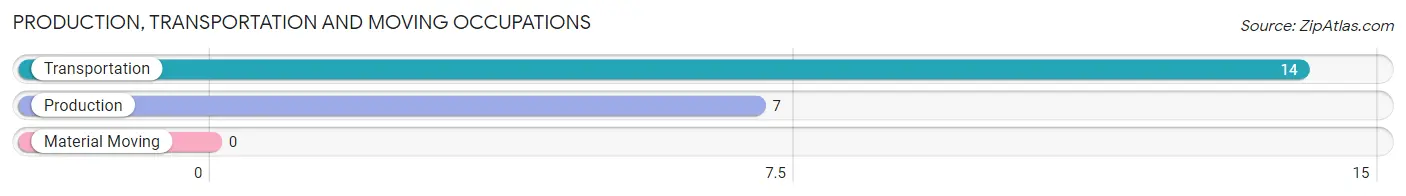
Production, Transportation and Moving Occupations by Sex
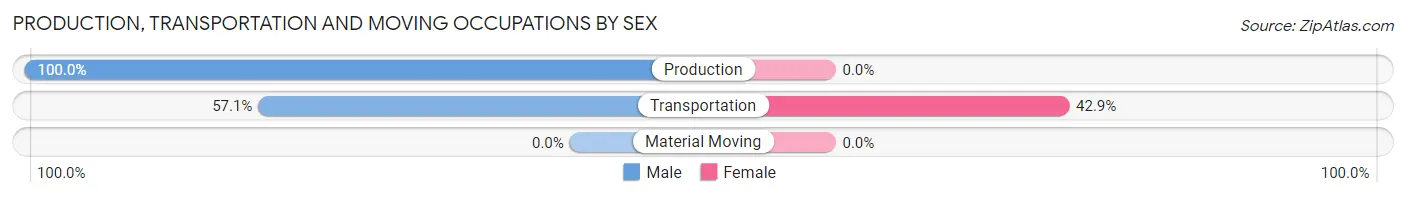
| Occupation | Male | Female |
| Production | 7 (100.0%) | 0 (0.0%) |
| Transportation | 8 (57.1%) | 6 (42.9%) |
| Material Moving | 0 (0.0%) | 0 (0.0%) |
| Total (Category) | 15 (71.4%) | 6 (28.6%) |
| Total (Overall) | 1,660 (64.7%) | 905 (35.3%) |
Employment Industries by Sex in Cherry Hills Village
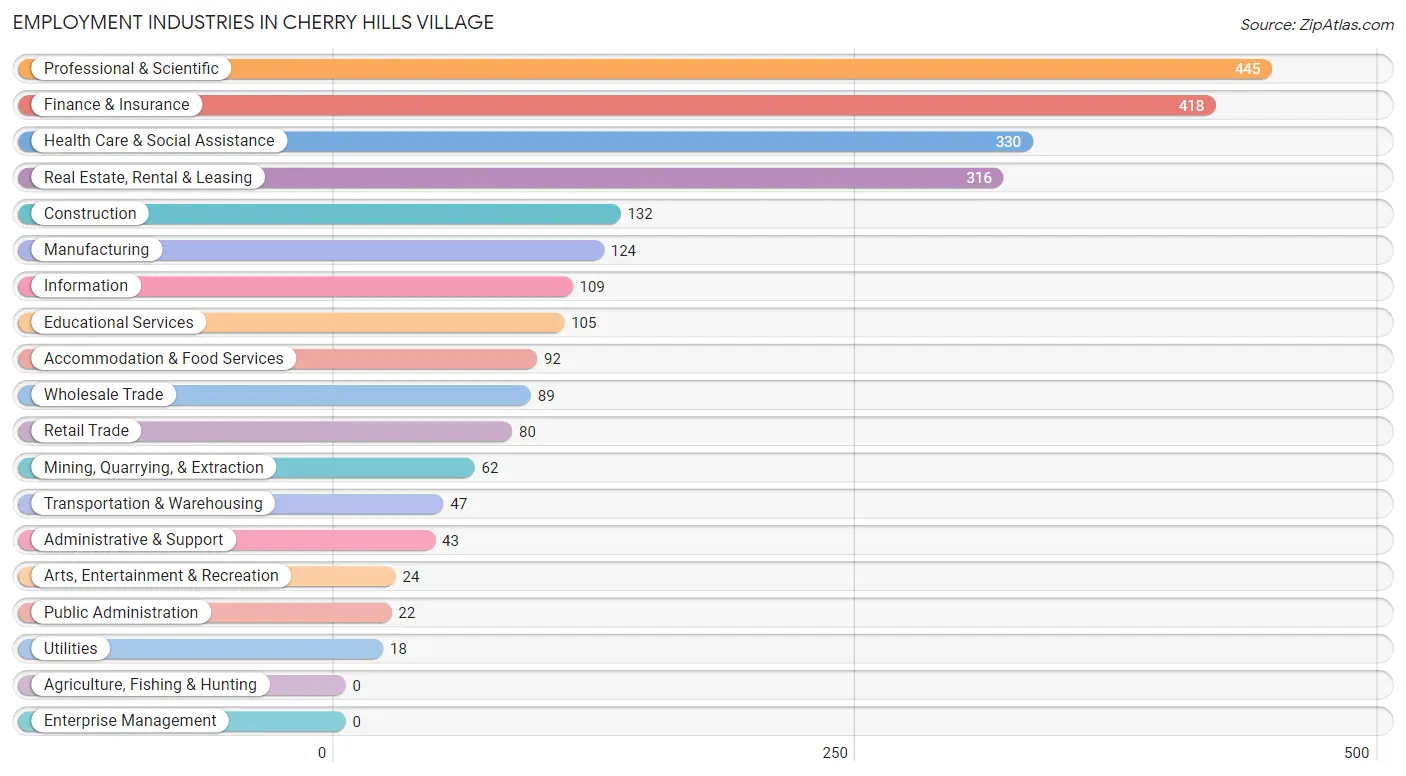
Employment Industries in Cherry Hills Village
The major employment industries in Cherry Hills Village include Professional & Scientific (445 | 17.3%), Finance & Insurance (418 | 16.3%), Health Care & Social Assistance (330 | 12.9%), Real Estate, Rental & Leasing (316 | 12.3%), and Construction (132 | 5.1%).
Employment Industries by Sex in Cherry Hills Village
The Cherry Hills Village industries that see more men than women are Mining, Quarrying, & Extraction (100.0%), Utilities (100.0%), and Construction (95.5%), whereas the industries that tend to have a higher number of women are Information (84.4%), Arts, Entertainment & Recreation (83.3%), and Accommodation & Food Services (78.3%).
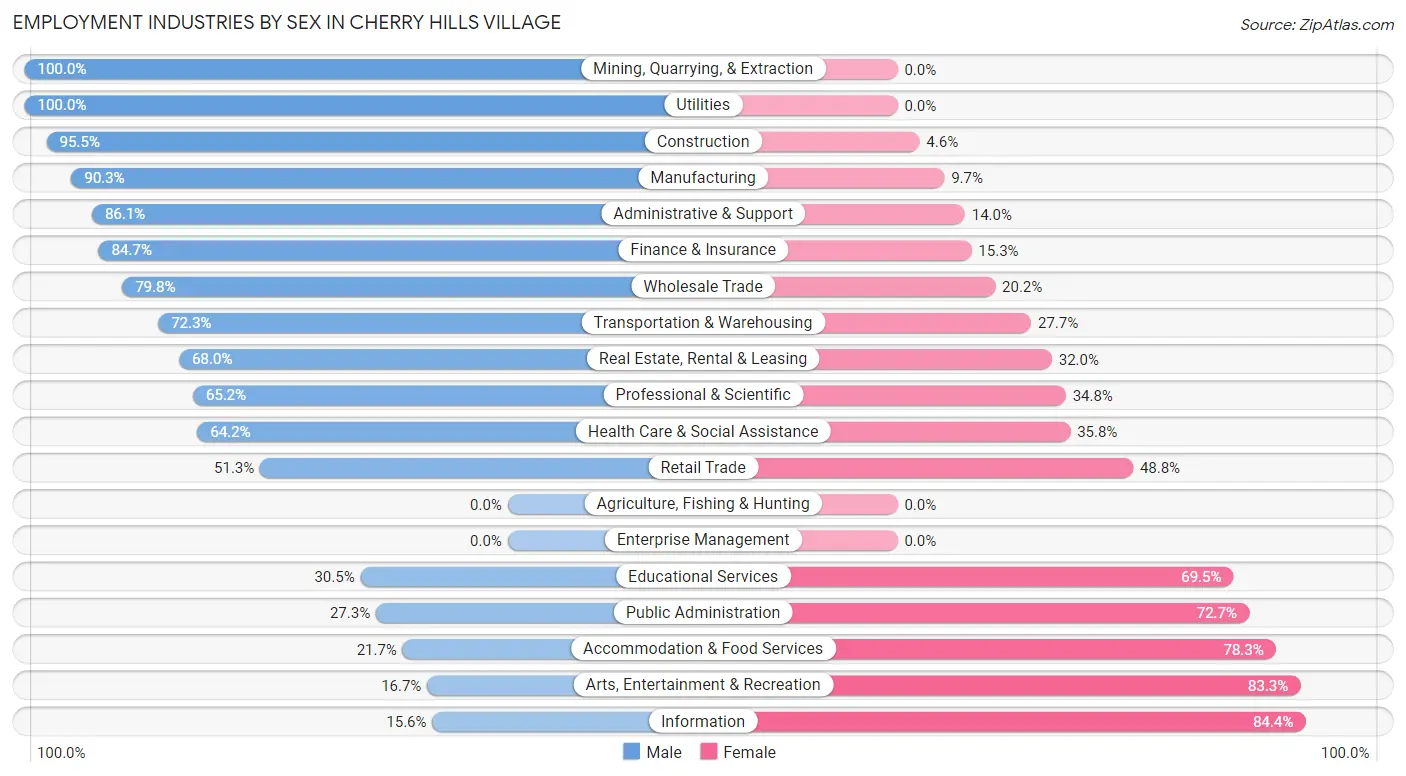
| Industry | Male | Female |
| Agriculture, Fishing & Hunting | 0 (0.0%) | 0 (0.0%) |
| Mining, Quarrying, & Extraction | 62 (100.0%) | 0 (0.0%) |
| Construction | 126 (95.5%) | 6 (4.5%) |
| Manufacturing | 112 (90.3%) | 12 (9.7%) |
| Wholesale Trade | 71 (79.8%) | 18 (20.2%) |
| Retail Trade | 41 (51.2%) | 39 (48.7%) |
| Transportation & Warehousing | 34 (72.3%) | 13 (27.7%) |
| Utilities | 18 (100.0%) | 0 (0.0%) |
| Information | 17 (15.6%) | 92 (84.4%) |
| Finance & Insurance | 354 (84.7%) | 64 (15.3%) |
| Real Estate, Rental & Leasing | 215 (68.0%) | 101 (32.0%) |
| Professional & Scientific | 290 (65.2%) | 155 (34.8%) |
| Enterprise Management | 0 (0.0%) | 0 (0.0%) |
| Administrative & Support | 37 (86.1%) | 6 (14.0%) |
| Educational Services | 32 (30.5%) | 73 (69.5%) |
| Health Care & Social Assistance | 212 (64.2%) | 118 (35.8%) |
| Arts, Entertainment & Recreation | 4 (16.7%) | 20 (83.3%) |
| Accommodation & Food Services | 20 (21.7%) | 72 (78.3%) |
| Public Administration | 6 (27.3%) | 16 (72.7%) |
| Total | 1,660 (64.7%) | 905 (35.3%) |
Education in Cherry Hills Village
School Enrollment in Cherry Hills Village
The most common levels of schooling among the 1,778 students in Cherry Hills Village are middle school (596 | 33.5%), high school (559 | 31.4%), and elementary school (274 | 15.4%).
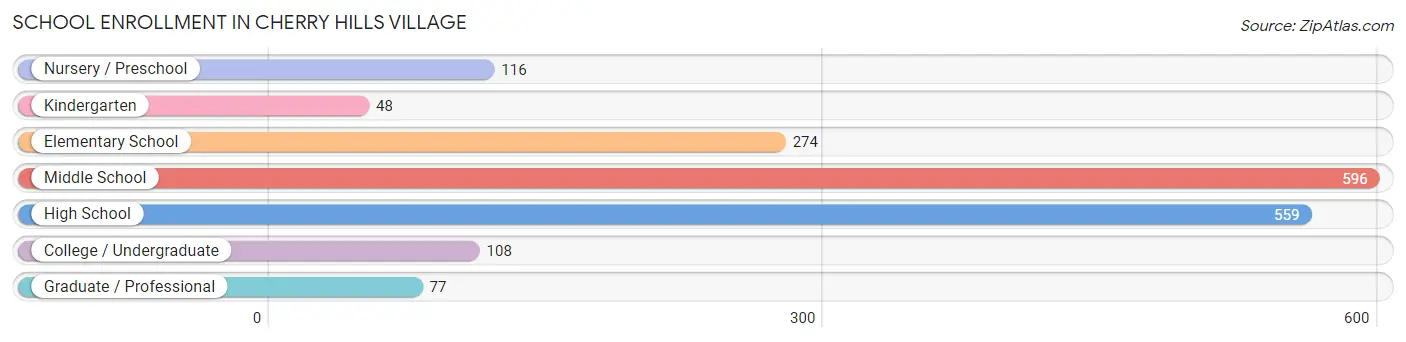
| School Level | # Students | % Students |
| Nursery / Preschool | 116 | 6.5% |
| Kindergarten | 48 | 2.7% |
| Elementary School | 274 | 15.4% |
| Middle School | 596 | 33.5% |
| High School | 559 | 31.4% |
| College / Undergraduate | 108 | 6.1% |
| Graduate / Professional | 77 | 4.3% |
| Total | 1,778 | 100.0% |
School Enrollment by Age by Funding Source in Cherry Hills Village
Out of a total of 1,778 students who are enrolled in schools in Cherry Hills Village, 628 (35.3%) attend a private institution, while the remaining 1,150 (64.7%) are enrolled in public schools. The age group of 20 to 24 year olds has the highest likelihood of being enrolled in private schools, with 24 (63.2% in the age bracket) enrolled. Conversely, the age group of 25 to 34 year olds has the lowest likelihood of being enrolled in a private school, with 67 (83.8% in the age bracket) attending a public institution.
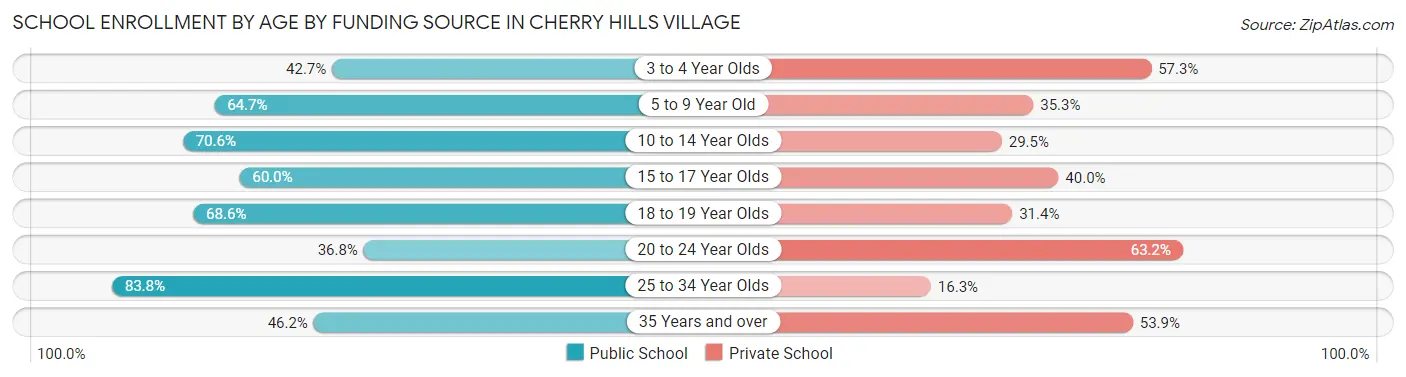
| Age Bracket | Public School | Private School |
| 3 to 4 Year Olds | 44 (42.7%) | 59 (57.3%) |
| 5 to 9 Year Old | 174 (64.7%) | 95 (35.3%) |
| 10 to 14 Year Olds | 496 (70.6%) | 207 (29.4%) |
| 15 to 17 Year Olds | 255 (60.0%) | 170 (40.0%) |
| 18 to 19 Year Olds | 83 (68.6%) | 38 (31.4%) |
| 20 to 24 Year Olds | 14 (36.8%) | 24 (63.2%) |
| 25 to 34 Year Olds | 67 (83.8%) | 13 (16.3%) |
| 35 Years and over | 18 (46.2%) | 21 (53.8%) |
| Total | 1,150 (64.7%) | 628 (35.3%) |
Educational Attainment by Field of Study in Cherry Hills Village
Business (1,125 | 26.6%), social sciences (636 | 15.0%), engineering (381 | 9.0%), liberal arts & history (269 | 6.4%), and science & technology (264 | 6.2%) are the most common fields of study among 4,231 individuals in Cherry Hills Village who have obtained a bachelor's degree or higher.
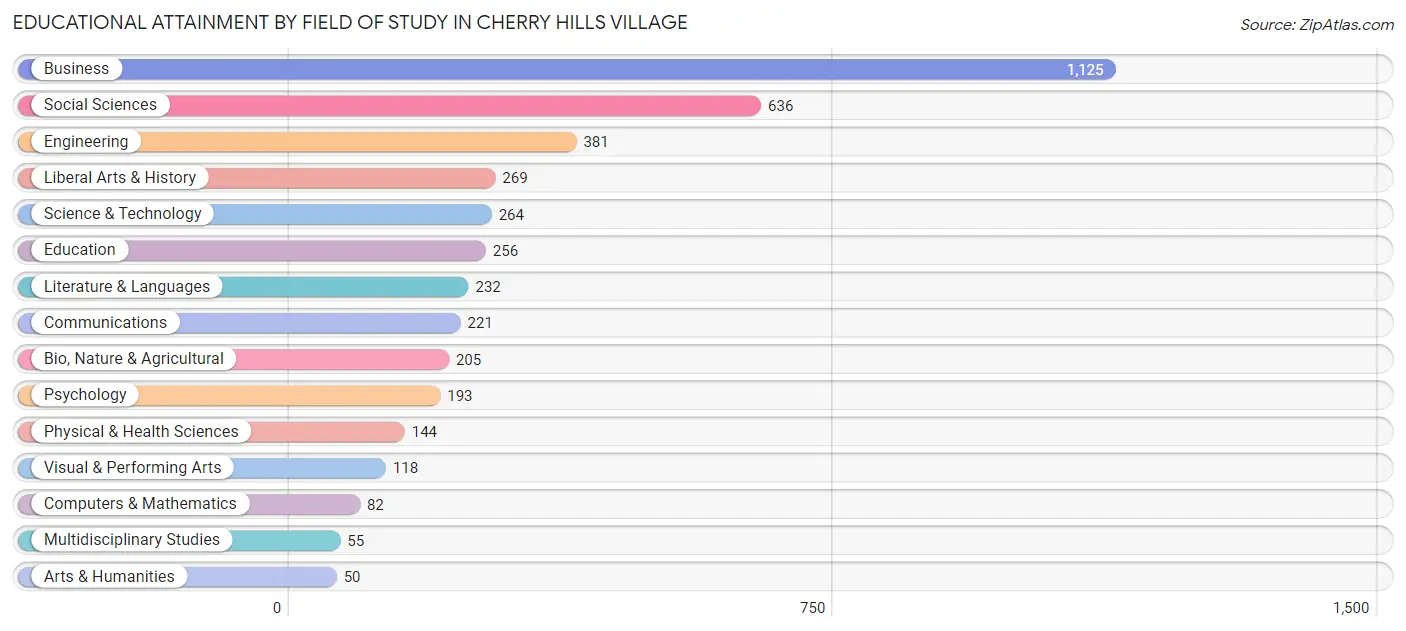
| Field of Study | # Graduates | % Graduates |
| Computers & Mathematics | 82 | 1.9% |
| Bio, Nature & Agricultural | 205 | 4.9% |
| Physical & Health Sciences | 144 | 3.4% |
| Psychology | 193 | 4.6% |
| Social Sciences | 636 | 15.0% |
| Engineering | 381 | 9.0% |
| Multidisciplinary Studies | 55 | 1.3% |
| Science & Technology | 264 | 6.2% |
| Business | 1,125 | 26.6% |
| Education | 256 | 6.0% |
| Literature & Languages | 232 | 5.5% |
| Liberal Arts & History | 269 | 6.4% |
| Visual & Performing Arts | 118 | 2.8% |
| Communications | 221 | 5.2% |
| Arts & Humanities | 50 | 1.2% |
| Total | 4,231 | 100.0% |
Transportation & Commute in Cherry Hills Village
Vehicle Availability by Sex in Cherry Hills Village
The most prevalent vehicle ownership categories in Cherry Hills Village are males with 2 vehicles (640, accounting for 38.6%) and females with 2 vehicles (368, making up 71.8%).
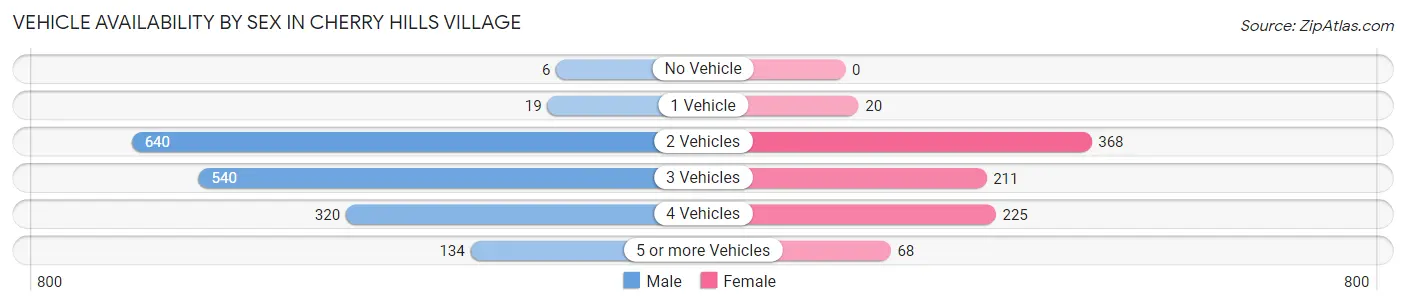
| Vehicles Available | Male | Female |
| No Vehicle | 6 (0.4%) | 0 (0.0%) |
| 1 Vehicle | 19 (1.1%) | 20 (2.2%) |
| 2 Vehicles | 640 (38.6%) | 368 (41.3%) |
| 3 Vehicles | 540 (32.6%) | 211 (23.6%) |
| 4 Vehicles | 320 (19.3%) | 225 (25.2%) |
| 5 or more Vehicles | 134 (8.1%) | 68 (7.6%) |
| Total | 1,659 (100.0%) | 892 (100.0%) |
Commute Time in Cherry Hills Village
The most frequently occuring commute durations in Cherry Hills Village are 20 to 24 minutes (407 commuters, 22.1%), 15 to 19 minutes (369 commuters, 20.1%), and 25 to 29 minutes (321 commuters, 17.4%).
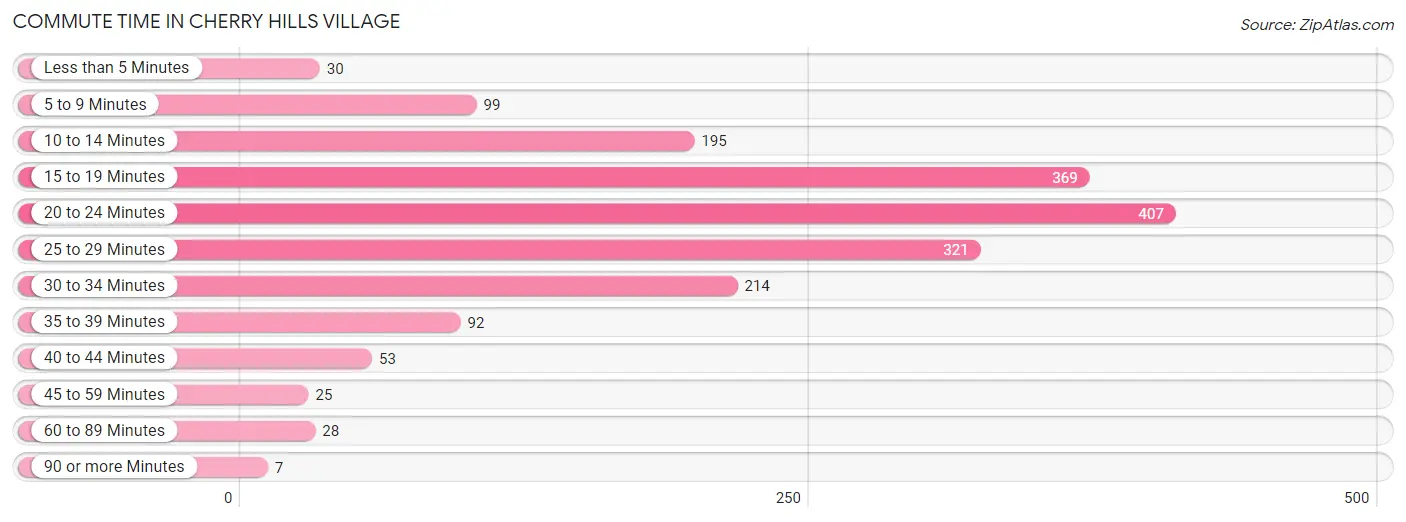
| Commute Time | # Commuters | % Commuters |
| Less than 5 Minutes | 30 | 1.6% |
| 5 to 9 Minutes | 99 | 5.4% |
| 10 to 14 Minutes | 195 | 10.6% |
| 15 to 19 Minutes | 369 | 20.1% |
| 20 to 24 Minutes | 407 | 22.1% |
| 25 to 29 Minutes | 321 | 17.4% |
| 30 to 34 Minutes | 214 | 11.6% |
| 35 to 39 Minutes | 92 | 5.0% |
| 40 to 44 Minutes | 53 | 2.9% |
| 45 to 59 Minutes | 25 | 1.4% |
| 60 to 89 Minutes | 28 | 1.5% |
| 90 or more Minutes | 7 | 0.4% |
Commute Time by Sex in Cherry Hills Village
The most common commute times in Cherry Hills Village are 15 to 19 minutes (323 commuters, 25.0%) for males and 20 to 24 minutes (165 commuters, 30.1%) for females.
| Commute Time | Male | Female |
| Less than 5 Minutes | 9 (0.7%) | 21 (3.8%) |
| 5 to 9 Minutes | 49 (3.8%) | 50 (9.1%) |
| 10 to 14 Minutes | 112 (8.7%) | 83 (15.1%) |
| 15 to 19 Minutes | 323 (25.0%) | 46 (8.4%) |
| 20 to 24 Minutes | 242 (18.7%) | 165 (30.1%) |
| 25 to 29 Minutes | 265 (20.5%) | 56 (10.2%) |
| 30 to 34 Minutes | 130 (10.1%) | 84 (15.3%) |
| 35 to 39 Minutes | 84 (6.5%) | 8 (1.5%) |
| 40 to 44 Minutes | 25 (1.9%) | 28 (5.1%) |
| 45 to 59 Minutes | 25 (1.9%) | 0 (0.0%) |
| 60 to 89 Minutes | 28 (2.2%) | 0 (0.0%) |
| 90 or more Minutes | 0 (0.0%) | 7 (1.3%) |
Time of Departure to Work by Sex in Cherry Hills Village
The most frequent times of departure to work in Cherry Hills Village are 8:00 AM to 8:29 AM (308, 23.8%) for males and 8:30 AM to 8:59 AM (96, 17.5%) for females.
| Time of Departure | Male | Female |
| 12:00 AM to 4:59 AM | 9 (0.7%) | 0 (0.0%) |
| 5:00 AM to 5:29 AM | 0 (0.0%) | 0 (0.0%) |
| 5:30 AM to 5:59 AM | 53 (4.1%) | 10 (1.8%) |
| 6:00 AM to 6:29 AM | 64 (5.0%) | 41 (7.5%) |
| 6:30 AM to 6:59 AM | 43 (3.3%) | 48 (8.8%) |
| 7:00 AM to 7:29 AM | 180 (13.9%) | 43 (7.9%) |
| 7:30 AM to 7:59 AM | 243 (18.8%) | 47 (8.6%) |
| 8:00 AM to 8:29 AM | 308 (23.8%) | 73 (13.3%) |
| 8:30 AM to 8:59 AM | 82 (6.4%) | 96 (17.5%) |
| 9:00 AM to 9:59 AM | 202 (15.6%) | 85 (15.5%) |
| 10:00 AM to 10:59 AM | 26 (2.0%) | 86 (15.7%) |
| 11:00 AM to 11:59 AM | 33 (2.5%) | 0 (0.0%) |
| 12:00 PM to 3:59 PM | 22 (1.7%) | 19 (3.5%) |
| 4:00 PM to 11:59 PM | 27 (2.1%) | 0 (0.0%) |
| Total | 1,292 (100.0%) | 548 (100.0%) |
Housing Occupancy in Cherry Hills Village
Occupancy by Ownership in Cherry Hills Village
Of the total 2,242 dwellings in Cherry Hills Village, owner-occupied units account for 2,185 (97.5%), while renter-occupied units make up 57 (2.5%).
| Occupancy | # Housing Units | % Housing Units |
| Owner Occupied Housing Units | 2,185 | 97.5% |
| Renter-Occupied Housing Units | 57 | 2.5% |
| Total Occupied Housing Units | 2,242 | 100.0% |
Occupancy by Household Size in Cherry Hills Village
| Household Size | # Housing Units | % Housing Units |
| 1-Person Household | 228 | 10.2% |
| 2-Person Household | 963 | 42.9% |
| 3-Person Household | 256 | 11.4% |
| 4+ Person Household | 795 | 35.5% |
| Total Housing Units | 2,242 | 100.0% |
Occupancy by Ownership by Household Size in Cherry Hills Village
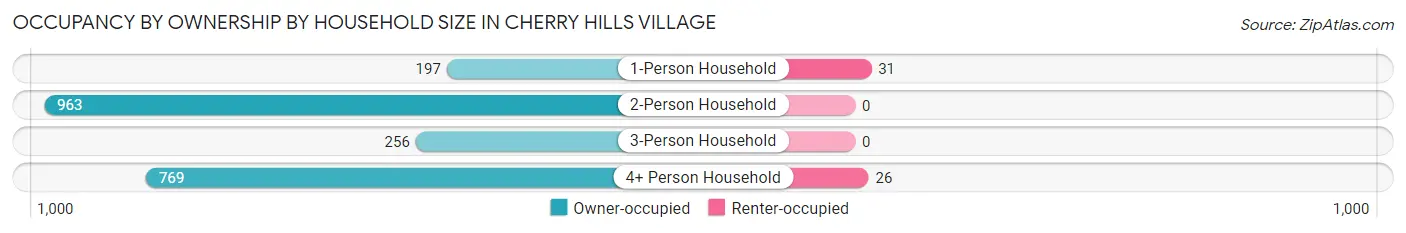
| Household Size | Owner-occupied | Renter-occupied |
| 1-Person Household | 197 (86.4%) | 31 (13.6%) |
| 2-Person Household | 963 (100.0%) | 0 (0.0%) |
| 3-Person Household | 256 (100.0%) | 0 (0.0%) |
| 4+ Person Household | 769 (96.7%) | 26 (3.3%) |
| Total Housing Units | 2,185 (97.5%) | 57 (2.5%) |
Occupancy by Educational Attainment in Cherry Hills Village
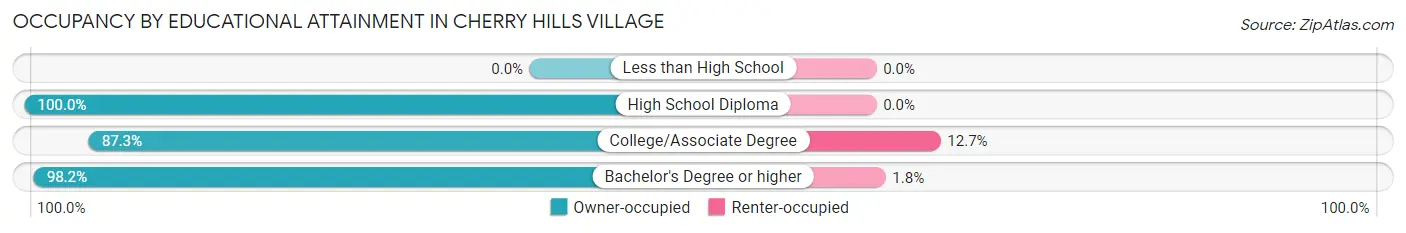
| Household Size | Owner-occupied | Renter-occupied |
| Less than High School | 0 (0.0%) | 0 (0.0%) |
| High School Diploma | 63 (100.0%) | 0 (0.0%) |
| College/Associate Degree | 137 (87.3%) | 20 (12.7%) |
| Bachelor's Degree or higher | 1,985 (98.2%) | 37 (1.8%) |
Occupancy by Age of Householder in Cherry Hills Village
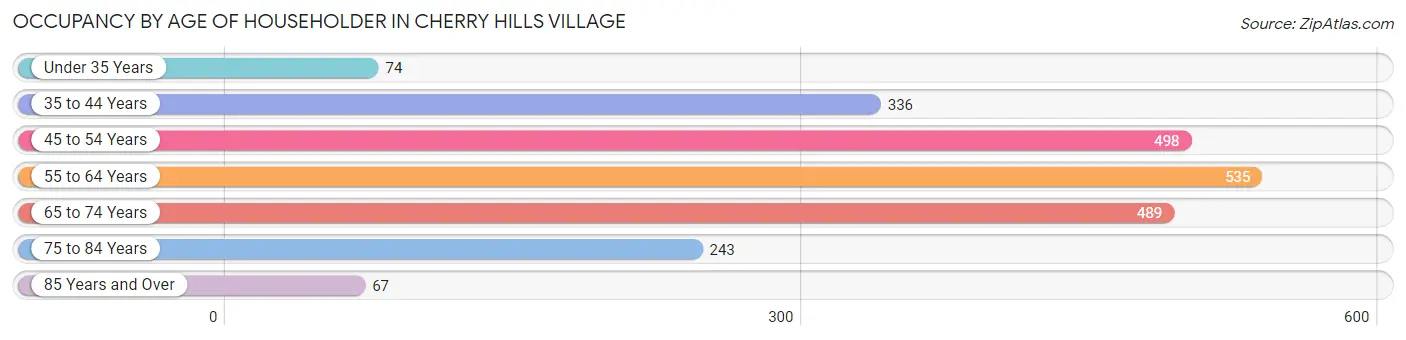
| Age Bracket | # Households | % Households |
| Under 35 Years | 74 | 3.3% |
| 35 to 44 Years | 336 | 15.0% |
| 45 to 54 Years | 498 | 22.2% |
| 55 to 64 Years | 535 | 23.9% |
| 65 to 74 Years | 489 | 21.8% |
| 75 to 84 Years | 243 | 10.8% |
| 85 Years and Over | 67 | 3.0% |
| Total | 2,242 | 100.0% |
Housing Finances in Cherry Hills Village
Median Income by Occupancy in Cherry Hills Village
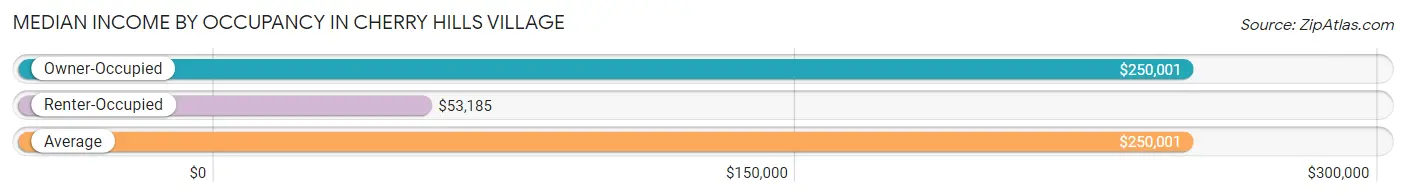
| Occupancy Type | # Households | Median Income |
| Owner-Occupied | 2,185 (97.5%) | $250,001 |
| Renter-Occupied | 57 (2.5%) | $53,185 |
| Average | 2,242 (100.0%) | $250,001 |
Occupancy by Householder Income Bracket in Cherry Hills Village
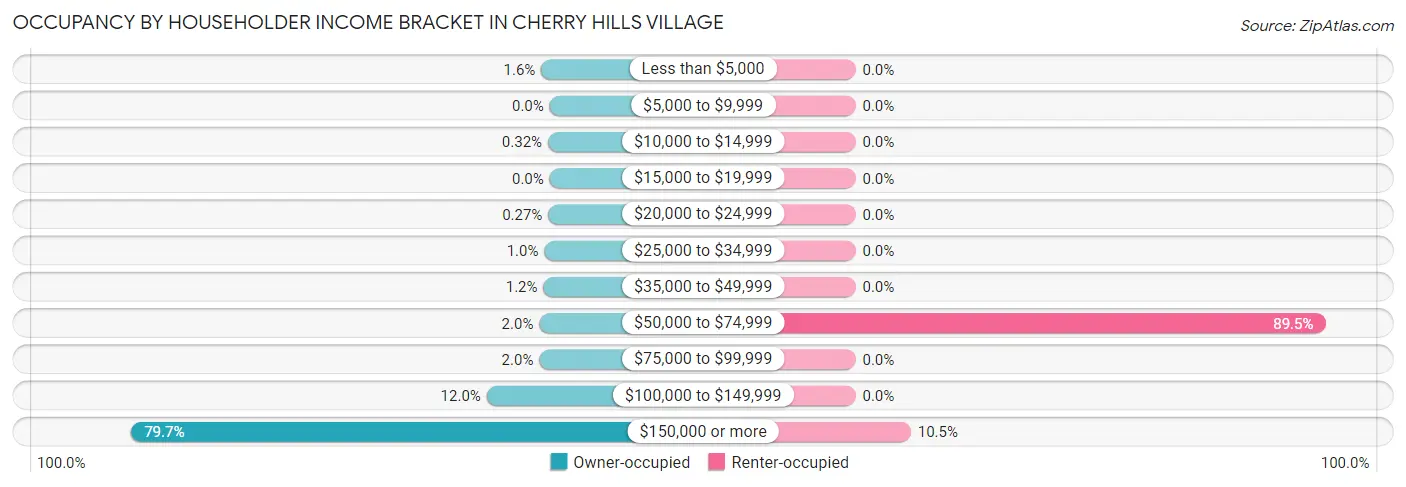
| Income Bracket | Owner-occupied | Renter-occupied |
| Less than $5,000 | 35 (1.6%) | 0 (0.0%) |
| $5,000 to $9,999 | 0 (0.0%) | 0 (0.0%) |
| $10,000 to $14,999 | 7 (0.3%) | 0 (0.0%) |
| $15,000 to $19,999 | 0 (0.0%) | 0 (0.0%) |
| $20,000 to $24,999 | 6 (0.3%) | 0 (0.0%) |
| $25,000 to $34,999 | 22 (1.0%) | 0 (0.0%) |
| $35,000 to $49,999 | 26 (1.2%) | 0 (0.0%) |
| $50,000 to $74,999 | 43 (2.0%) | 51 (89.5%) |
| $75,000 to $99,999 | 43 (2.0%) | 0 (0.0%) |
| $100,000 to $149,999 | 262 (12.0%) | 0 (0.0%) |
| $150,000 or more | 1,741 (79.7%) | 6 (10.5%) |
| Total | 2,185 (100.0%) | 57 (100.0%) |
Monthly Housing Cost Tiers in Cherry Hills Village
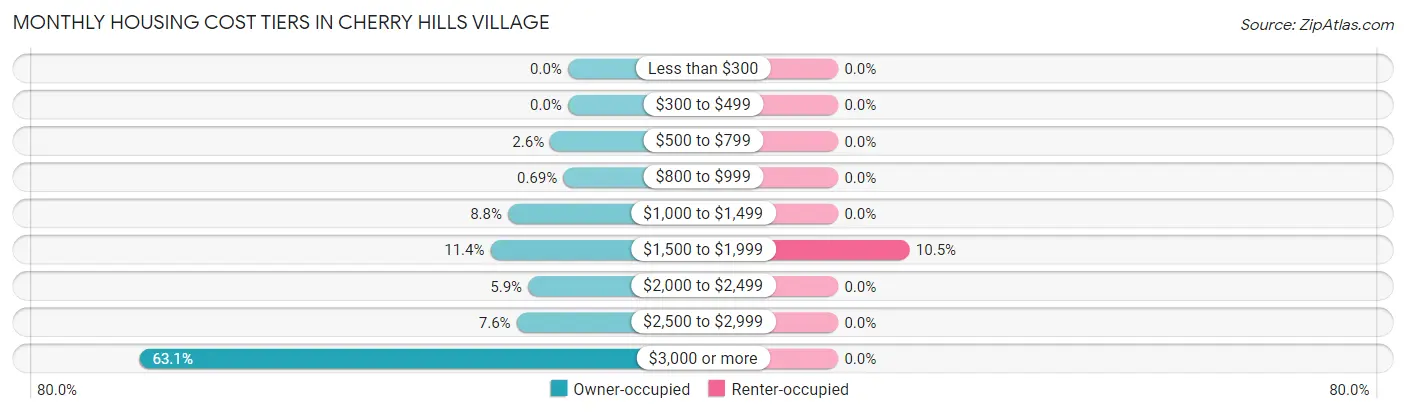
| Monthly Cost | Owner-occupied | Renter-occupied |
| Less than $300 | 0 (0.0%) | 0 (0.0%) |
| $300 to $499 | 0 (0.0%) | 0 (0.0%) |
| $500 to $799 | 57 (2.6%) | 0 (0.0%) |
| $800 to $999 | 15 (0.7%) | 0 (0.0%) |
| $1,000 to $1,499 | 193 (8.8%) | 0 (0.0%) |
| $1,500 to $1,999 | 249 (11.4%) | 6 (10.5%) |
| $2,000 to $2,499 | 128 (5.9%) | 0 (0.0%) |
| $2,500 to $2,999 | 165 (7.5%) | 0 (0.0%) |
| $3,000 or more | 1,378 (63.1%) | 0 (0.0%) |
| Total | 2,185 (100.0%) | 57 (100.0%) |
Physical Housing Characteristics in Cherry Hills Village
Housing Structures in Cherry Hills Village
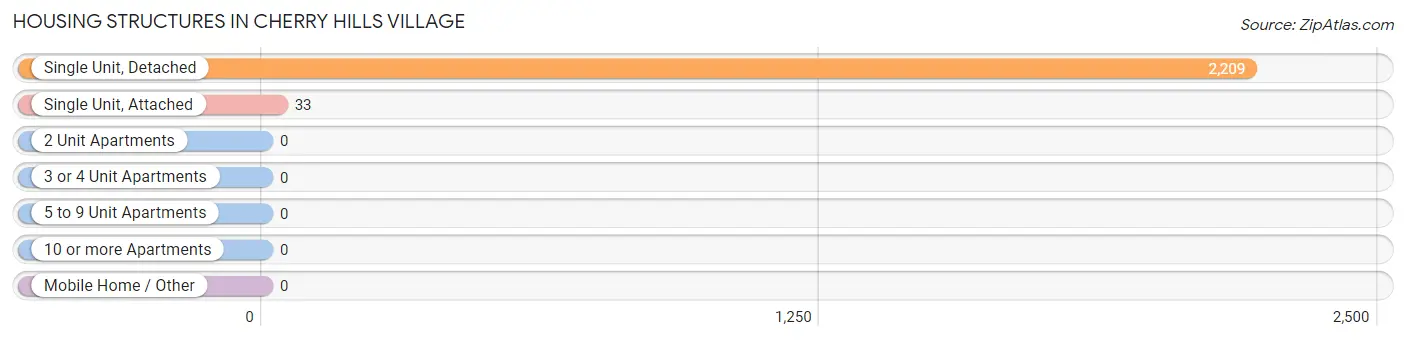
| Structure Type | # Housing Units | % Housing Units |
| Single Unit, Detached | 2,209 | 98.5% |
| Single Unit, Attached | 33 | 1.5% |
| 2 Unit Apartments | 0 | 0.0% |
| 3 or 4 Unit Apartments | 0 | 0.0% |
| 5 to 9 Unit Apartments | 0 | 0.0% |
| 10 or more Apartments | 0 | 0.0% |
| Mobile Home / Other | 0 | 0.0% |
| Total | 2,242 | 100.0% |
Housing Structures by Occupancy in Cherry Hills Village
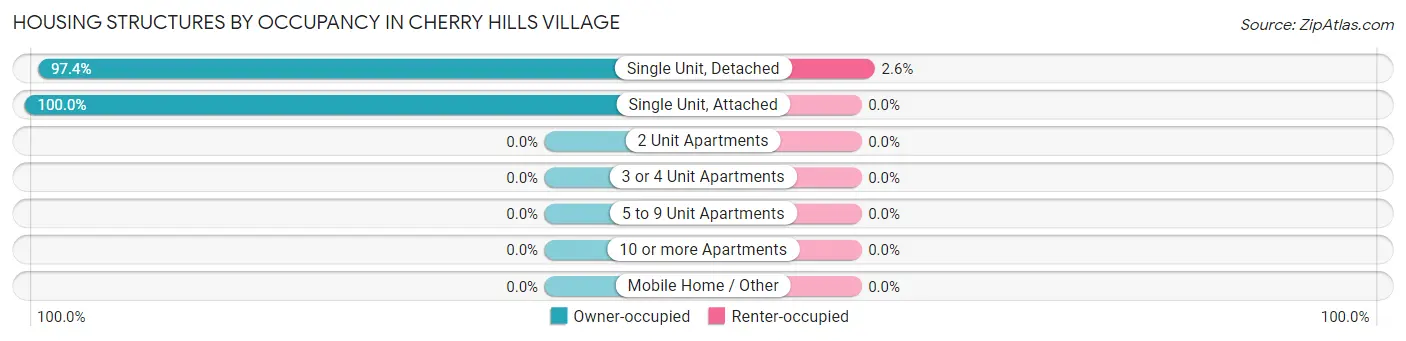
| Structure Type | Owner-occupied | Renter-occupied |
| Single Unit, Detached | 2,152 (97.4%) | 57 (2.6%) |
| Single Unit, Attached | 33 (100.0%) | 0 (0.0%) |
| 2 Unit Apartments | 0 (0.0%) | 0 (0.0%) |
| 3 or 4 Unit Apartments | 0 (0.0%) | 0 (0.0%) |
| 5 to 9 Unit Apartments | 0 (0.0%) | 0 (0.0%) |
| 10 or more Apartments | 0 (0.0%) | 0 (0.0%) |
| Mobile Home / Other | 0 (0.0%) | 0 (0.0%) |
| Total | 2,185 (97.5%) | 57 (2.5%) |
Housing Structures by Number of Rooms in Cherry Hills Village
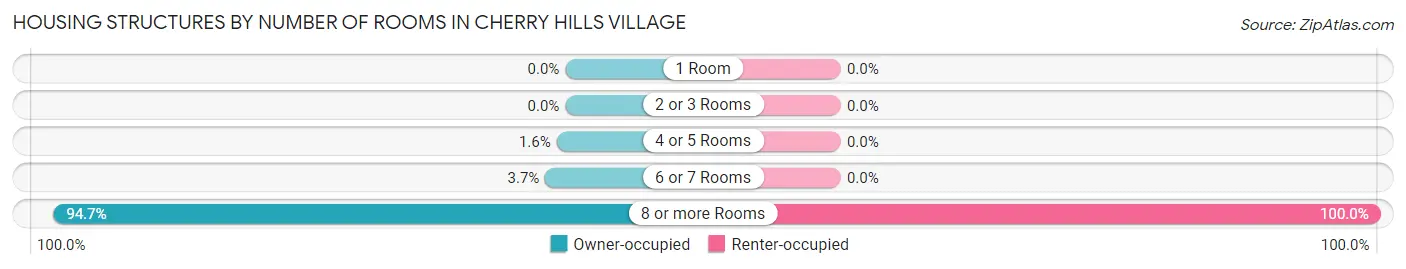
| Number of Rooms | Owner-occupied | Renter-occupied |
| 1 Room | 0 (0.0%) | 0 (0.0%) |
| 2 or 3 Rooms | 0 (0.0%) | 0 (0.0%) |
| 4 or 5 Rooms | 35 (1.6%) | 0 (0.0%) |
| 6 or 7 Rooms | 81 (3.7%) | 0 (0.0%) |
| 8 or more Rooms | 2,069 (94.7%) | 57 (100.0%) |
| Total | 2,185 (100.0%) | 57 (100.0%) |
Housing Structure by Heating Type in Cherry Hills Village
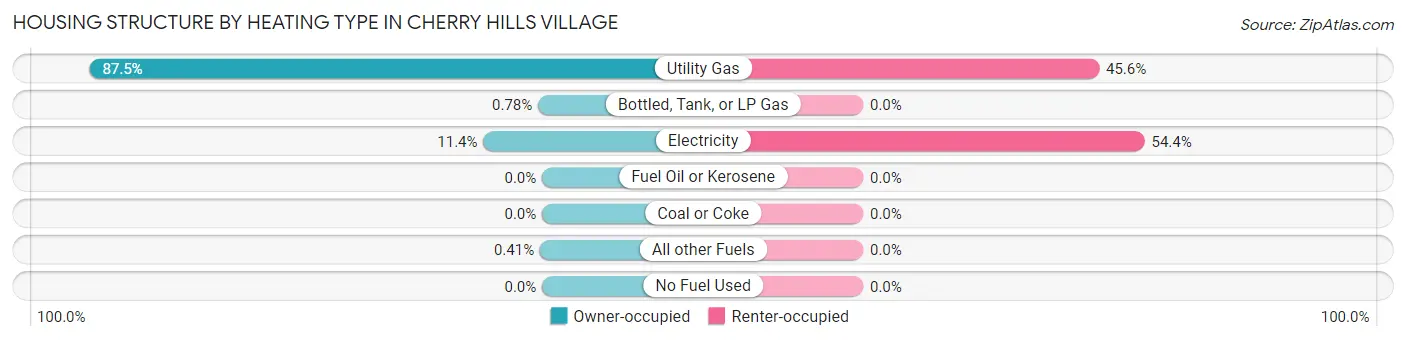
| Heating Type | Owner-occupied | Renter-occupied |
| Utility Gas | 1,911 (87.5%) | 26 (45.6%) |
| Bottled, Tank, or LP Gas | 17 (0.8%) | 0 (0.0%) |
| Electricity | 248 (11.4%) | 31 (54.4%) |
| Fuel Oil or Kerosene | 0 (0.0%) | 0 (0.0%) |
| Coal or Coke | 0 (0.0%) | 0 (0.0%) |
| All other Fuels | 9 (0.4%) | 0 (0.0%) |
| No Fuel Used | 0 (0.0%) | 0 (0.0%) |
| Total | 2,185 (100.0%) | 57 (100.0%) |
Household Vehicle Usage in Cherry Hills Village
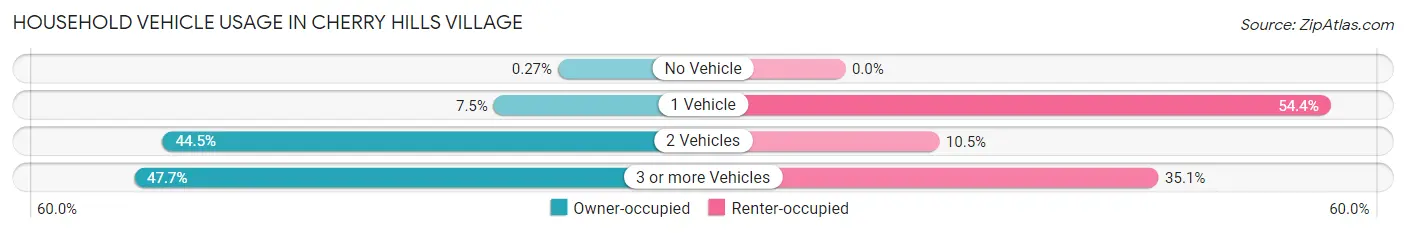
| Vehicles per Household | Owner-occupied | Renter-occupied |
| No Vehicle | 6 (0.3%) | 0 (0.0%) |
| 1 Vehicle | 163 (7.5%) | 31 (54.4%) |
| 2 Vehicles | 973 (44.5%) | 6 (10.5%) |
| 3 or more Vehicles | 1,043 (47.7%) | 20 (35.1%) |
| Total | 2,185 (100.0%) | 57 (100.0%) |
Real Estate & Mortgages in Cherry Hills Village
Real Estate and Mortgage Overview in Cherry Hills Village
| Characteristic | Without Mortgage | With Mortgage |
| Housing Units | 846 | 1,339 |
| Median Property Value | $2,000,001 | $2,000,001 |
| Median Household Income | $250,001 | $1,168 |
| Monthly Housing Costs | $1,501 | $1,169 |
| Real Estate Taxes | $10,001 | $33 |
Property Value by Mortgage Status in Cherry Hills Village
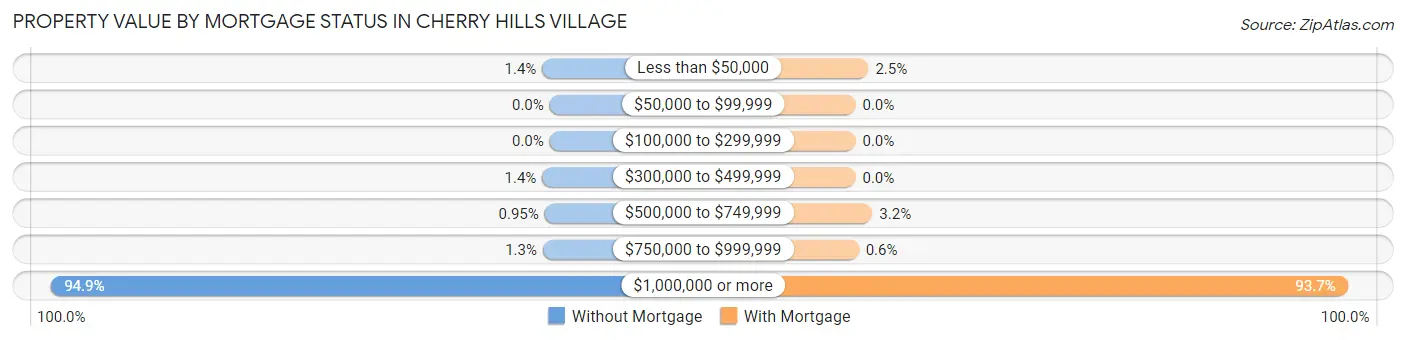
| Property Value | Without Mortgage | With Mortgage |
| Less than $50,000 | 12 (1.4%) | 33 (2.5%) |
| $50,000 to $99,999 | 0 (0.0%) | 0 (0.0%) |
| $100,000 to $299,999 | 0 (0.0%) | 0 (0.0%) |
| $300,000 to $499,999 | 12 (1.4%) | 0 (0.0%) |
| $500,000 to $749,999 | 8 (0.9%) | 43 (3.2%) |
| $750,000 to $999,999 | 11 (1.3%) | 8 (0.6%) |
| $1,000,000 or more | 803 (94.9%) | 1,255 (93.7%) |
| Total | 846 (100.0%) | 1,339 (100.0%) |
Household Income by Mortgage Status in Cherry Hills Village
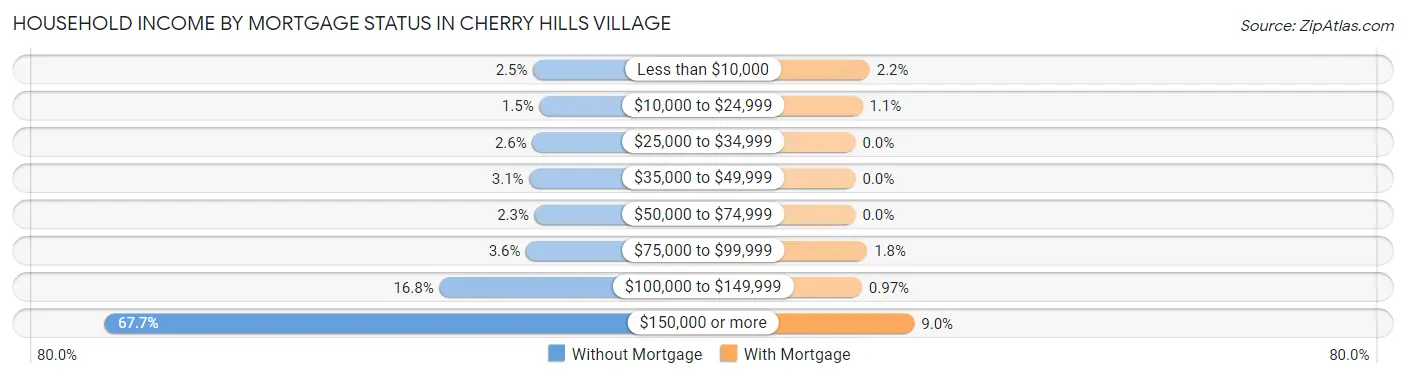
| Household Income | Without Mortgage | With Mortgage |
| Less than $10,000 | 21 (2.5%) | 29 (2.2%) |
| $10,000 to $24,999 | 13 (1.5%) | 14 (1.1%) |
| $25,000 to $34,999 | 22 (2.6%) | 0 (0.0%) |
| $35,000 to $49,999 | 26 (3.1%) | 0 (0.0%) |
| $50,000 to $74,999 | 19 (2.2%) | 0 (0.0%) |
| $75,000 to $99,999 | 30 (3.5%) | 24 (1.8%) |
| $100,000 to $149,999 | 142 (16.8%) | 13 (1.0%) |
| $150,000 or more | 573 (67.7%) | 120 (9.0%) |
| Total | 846 (100.0%) | 1,339 (100.0%) |
Property Value to Household Income Ratio in Cherry Hills Village
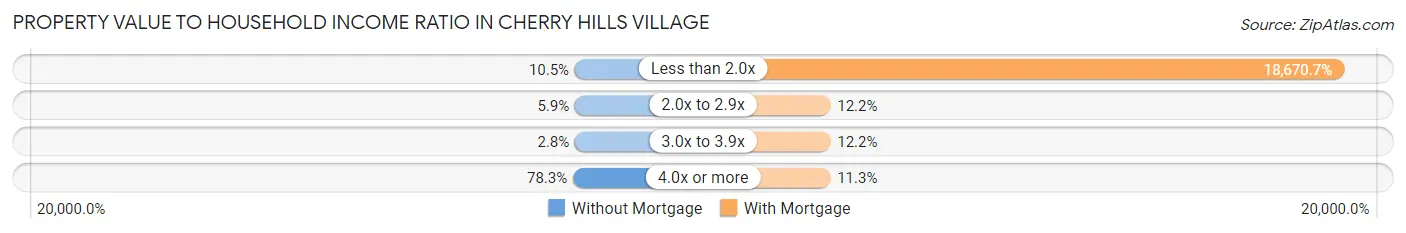
| Value-to-Income Ratio | Without Mortgage | With Mortgage |
| Less than 2.0x | 89 (10.5%) | 250,001 (18,670.7%) |
| 2.0x to 2.9x | 50 (5.9%) | 163 (12.2%) |
| 3.0x to 3.9x | 24 (2.8%) | 163 (12.2%) |
| 4.0x or more | 662 (78.2%) | 151 (11.3%) |
| Total | 846 (100.0%) | 1,339 (100.0%) |
Real Estate Taxes by Mortgage Status in Cherry Hills Village
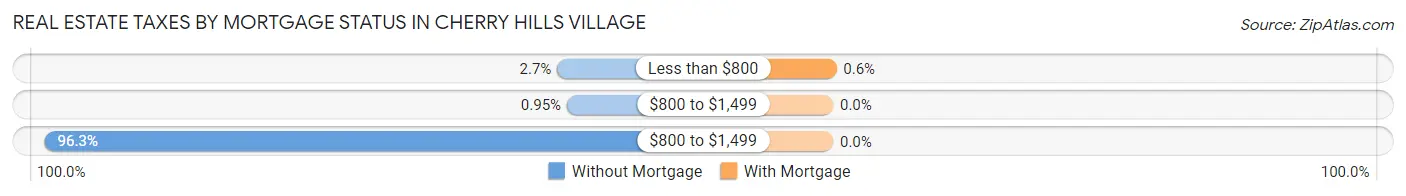
| Property Taxes | Without Mortgage | With Mortgage |
| Less than $800 | 23 (2.7%) | 8 (0.6%) |
| $800 to $1,499 | 8 (0.9%) | 0 (0.0%) |
| $800 to $1,499 | 815 (96.3%) | 0 (0.0%) |
| Total | 846 (100.0%) | 1,339 (100.0%) |
Health & Disability in Cherry Hills Village
Health Insurance Coverage by Age in Cherry Hills Village
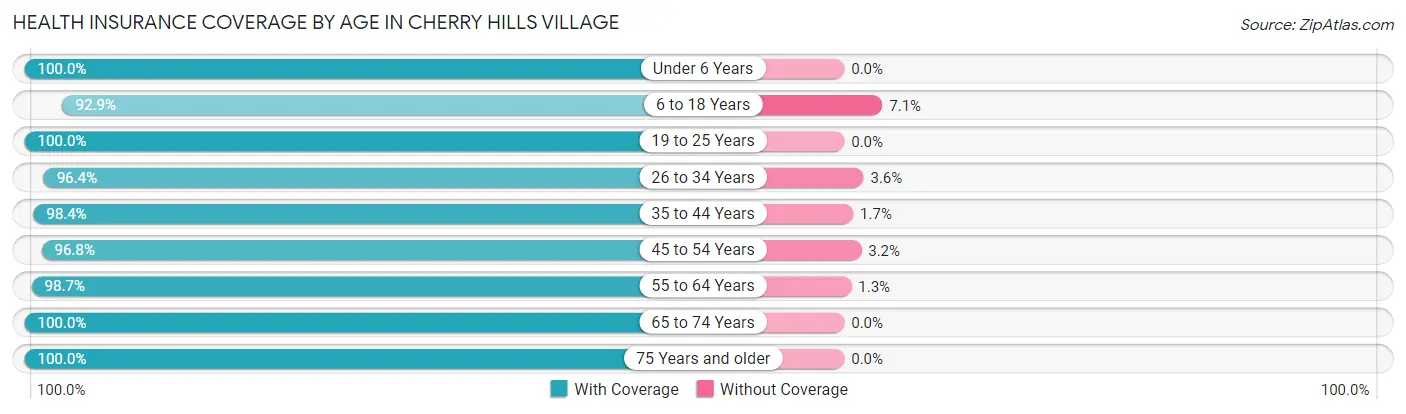
| Age Bracket | With Coverage | Without Coverage |
| Under 6 Years | 277 (100.0%) | 0 (0.0%) |
| 6 to 18 Years | 1,453 (92.9%) | 111 (7.1%) |
| 19 to 25 Years | 145 (100.0%) | 0 (0.0%) |
| 26 to 34 Years | 296 (96.4%) | 11 (3.6%) |
| 35 to 44 Years | 716 (98.4%) | 12 (1.7%) |
| 45 to 54 Years | 979 (96.8%) | 32 (3.2%) |
| 55 to 64 Years | 899 (98.7%) | 12 (1.3%) |
| 65 to 74 Years | 945 (100.0%) | 0 (0.0%) |
| 75 Years and older | 512 (100.0%) | 0 (0.0%) |
| Total | 6,222 (97.2%) | 178 (2.8%) |
Health Insurance Coverage by Citizenship Status in Cherry Hills Village
| Citizenship Status | With Coverage | Without Coverage |
| Native Born | 277 (100.0%) | 0 (0.0%) |
| Foreign Born, Citizen | 1,453 (92.9%) | 111 (7.1%) |
| Foreign Born, not a Citizen | 145 (100.0%) | 0 (0.0%) |
Health Insurance Coverage by Household Income in Cherry Hills Village
| Household Income | With Coverage | Without Coverage |
| Under $25,000 | 102 (100.0%) | 0 (0.0%) |
| $25,000 to $49,999 | 81 (92.0%) | 7 (8.0%) |
| $50,000 to $74,999 | 231 (100.0%) | 0 (0.0%) |
| $75,000 to $99,999 | 91 (87.5%) | 13 (12.5%) |
| $100,000 and over | 5,717 (97.3%) | 158 (2.7%) |
Public vs Private Health Insurance Coverage by Age in Cherry Hills Village
| Age Bracket | Public Insurance | Private Insurance |
| Under 6 | 8 (2.9%) | 269 (97.1%) |
| 6 to 18 Years | 59 (3.8%) | 1,444 (92.3%) |
| 19 to 25 Years | 15 (10.3%) | 145 (100.0%) |
| 25 to 34 Years | 0 (0.0%) | 296 (96.4%) |
| 35 to 44 Years | 12 (1.7%) | 716 (98.4%) |
| 45 to 54 Years | 19 (1.9%) | 973 (96.2%) |
| 55 to 64 Years | 0 (0.0%) | 899 (98.7%) |
| 65 to 74 Years | 901 (95.3%) | 617 (65.3%) |
| 75 Years and over | 512 (100.0%) | 370 (72.3%) |
| Total | 1,526 (23.8%) | 5,729 (89.5%) |
Disability Status by Sex by Age in Cherry Hills Village
| Age Bracket | Male | Female |
| Under 5 Years | 0 (0.0%) | 0 (0.0%) |
| 5 to 17 Years | 15 (2.0%) | 17 (2.3%) |
| 18 to 34 Years | 27 (8.4%) | 0 (0.0%) |
| 35 to 64 Years | 17 (1.3%) | 14 (1.0%) |
| 65 to 74 Years | 78 (14.7%) | 40 (9.7%) |
| 75 Years and over | 63 (25.6%) | 81 (30.4%) |
Disability Class by Sex by Age in Cherry Hills Village
Disability Class: Hearing Difficulty
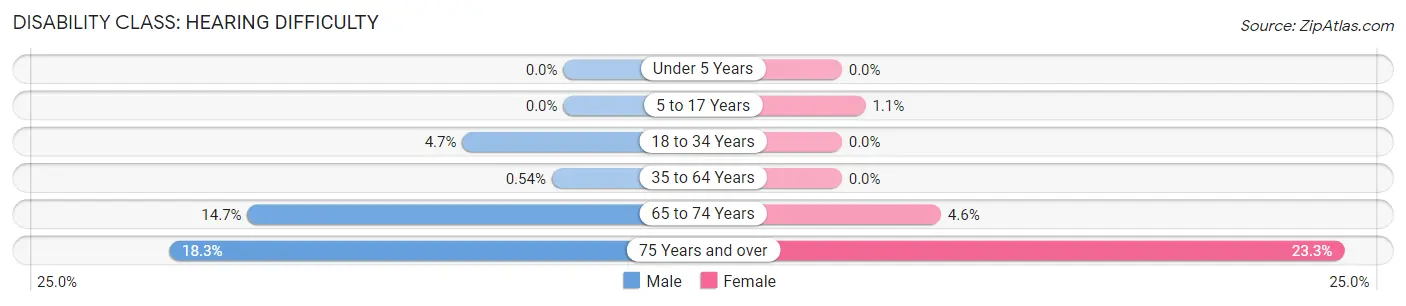
| Age Bracket | Male | Female |
| Under 5 Years | 0 (0.0%) | 0 (0.0%) |
| 5 to 17 Years | 0 (0.0%) | 8 (1.1%) |
| 18 to 34 Years | 15 (4.7%) | 0 (0.0%) |
| 35 to 64 Years | 7 (0.5%) | 0 (0.0%) |
| 65 to 74 Years | 78 (14.7%) | 19 (4.6%) |
| 75 Years and over | 45 (18.3%) | 62 (23.3%) |
Disability Class: Vision Difficulty
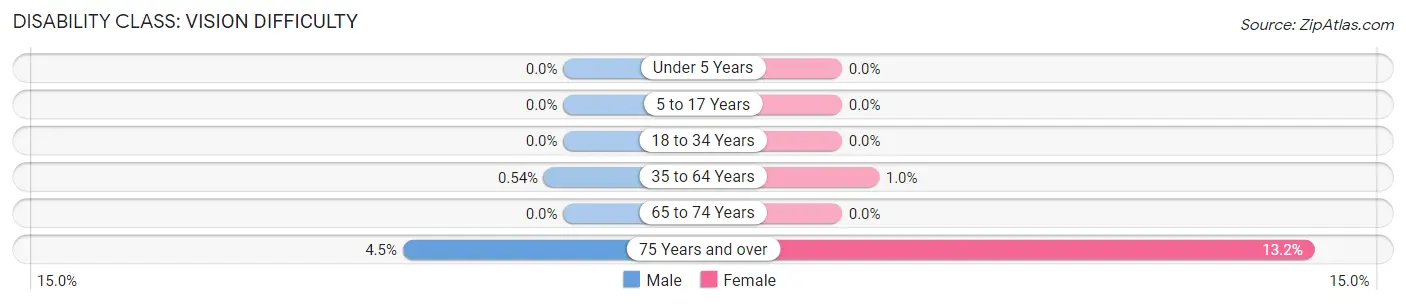
| Age Bracket | Male | Female |
| Under 5 Years | 0 (0.0%) | 0 (0.0%) |
| 5 to 17 Years | 0 (0.0%) | 0 (0.0%) |
| 18 to 34 Years | 0 (0.0%) | 0 (0.0%) |
| 35 to 64 Years | 7 (0.5%) | 14 (1.0%) |
| 65 to 74 Years | 0 (0.0%) | 0 (0.0%) |
| 75 Years and over | 11 (4.5%) | 35 (13.2%) |
Disability Class: Cognitive Difficulty
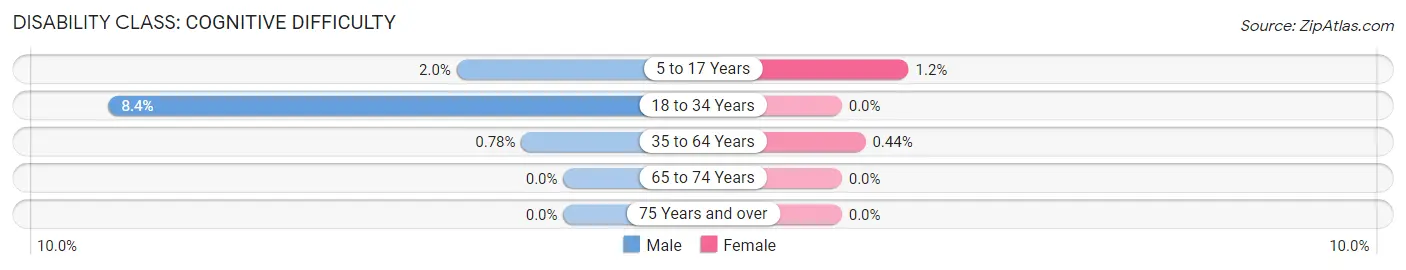
| Age Bracket | Male | Female |
| 5 to 17 Years | 15 (2.0%) | 9 (1.2%) |
| 18 to 34 Years | 27 (8.4%) | 0 (0.0%) |
| 35 to 64 Years | 10 (0.8%) | 6 (0.4%) |
| 65 to 74 Years | 0 (0.0%) | 0 (0.0%) |
| 75 Years and over | 0 (0.0%) | 0 (0.0%) |
Disability Class: Ambulatory Difficulty
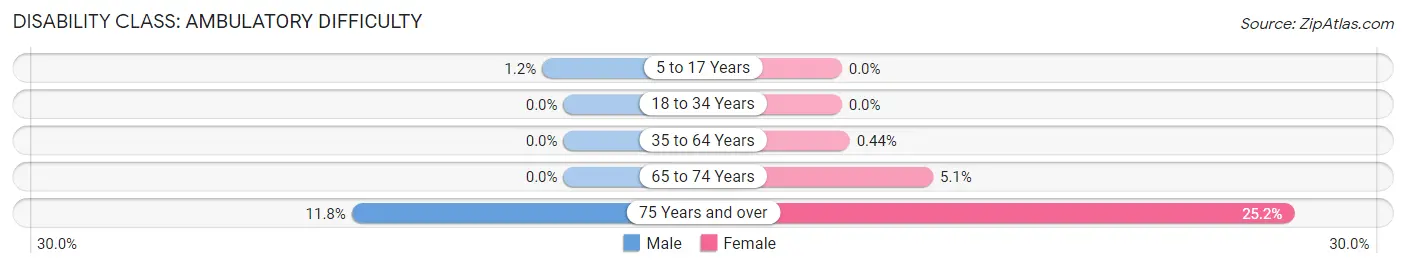
| Age Bracket | Male | Female |
| 5 to 17 Years | 9 (1.2%) | 0 (0.0%) |
| 18 to 34 Years | 0 (0.0%) | 0 (0.0%) |
| 35 to 64 Years | 0 (0.0%) | 6 (0.4%) |
| 65 to 74 Years | 0 (0.0%) | 21 (5.1%) |
| 75 Years and over | 29 (11.8%) | 67 (25.2%) |
Disability Class: Self-Care Difficulty
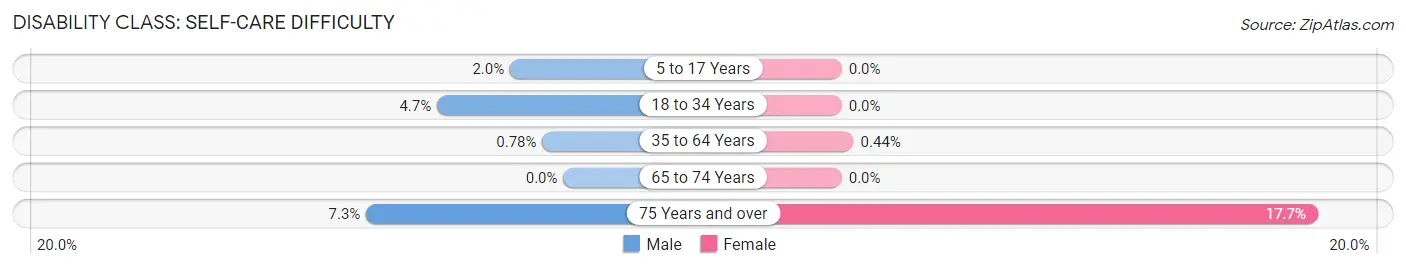
| Age Bracket | Male | Female |
| 5 to 17 Years | 15 (2.0%) | 0 (0.0%) |
| 18 to 34 Years | 15 (4.7%) | 0 (0.0%) |
| 35 to 64 Years | 10 (0.8%) | 6 (0.4%) |
| 65 to 74 Years | 0 (0.0%) | 0 (0.0%) |
| 75 Years and over | 18 (7.3%) | 47 (17.7%) |
Technology Access in Cherry Hills Village
Computing Device Access in Cherry Hills Village
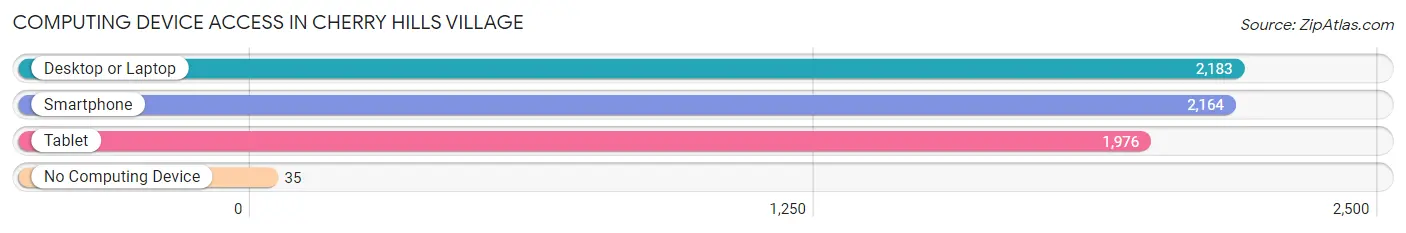
| Device Type | # Households | % Households |
| Desktop or Laptop | 2,183 | 97.4% |
| Smartphone | 2,164 | 96.5% |
| Tablet | 1,976 | 88.1% |
| No Computing Device | 35 | 1.6% |
| Total | 2,242 | 100.0% |
Internet Access in Cherry Hills Village
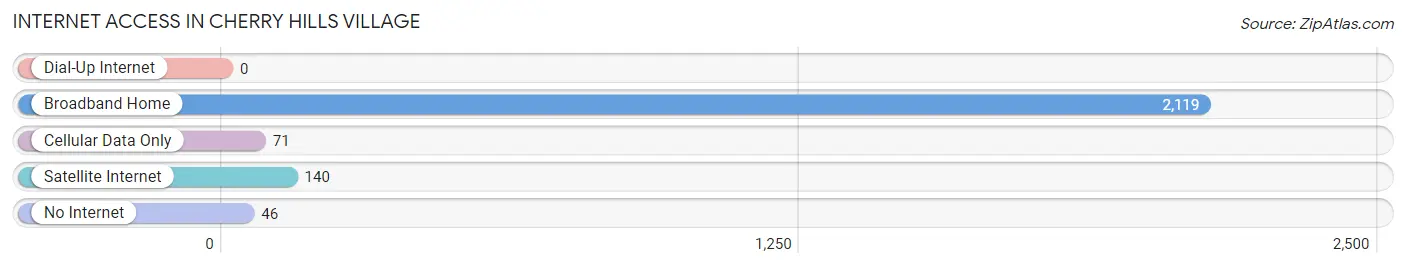
| Internet Type | # Households | % Households |
| Dial-Up Internet | 0 | 0.0% |
| Broadband Home | 2,119 | 94.5% |
| Cellular Data Only | 71 | 3.2% |
| Satellite Internet | 140 | 6.2% |
| No Internet | 46 | 2.1% |
| Total | 2,242 | 100.0% |
Cherry Hills Village Summary
Cherry Hills Village is a small, affluent suburb of Denver, Colorado located in Arapahoe County. It is situated in the foothills of the Rocky Mountains, just south of Denver. The city was incorporated in 1945 and has a population of 6,000 people.
Geography
Cherry Hills Village is located in the foothills of the Rocky Mountains, just south of Denver. It is bordered by the cities of Greenwood Village, Englewood, and Centennial. The city is situated at an elevation of 5,400 feet above sea level. The city covers an area of 4.2 square miles and is located in the Denver-Aurora-Lakewood Metropolitan Statistical Area.
The city is characterized by rolling hills, open space, and a variety of vegetation. The city is home to several parks, including Cherry Hills Park, which features a playground, picnic area, and walking trails. The city also has several golf courses, including the Cherry Hills Country Club, which is one of the oldest and most prestigious golf courses in the United States.
Economy
Cherry Hills Village is an affluent suburb of Denver and is home to many wealthy residents. The city has a strong economy, with a median household income of $150,000. The city is home to several large businesses, including the University of Denver, the Denver Broncos, and the Denver Nuggets. The city also has several small businesses, including restaurants, retail stores, and professional services.
Demographics
As of the 2010 census, the population of Cherry Hills Village was 6,000 people. The racial makeup of the city was 91.2% White, 2.2% African American, 0.3% Native American, 3.2% Asian, 0.1% Pacific Islander, 1.2% from other races, and 2.0% from two or more races. Hispanic or Latino of any race were 4.2% of the population.
The median age in the city was 45.2 years. About 24.2% of residents were under the age of 18, and 8.2% were 65 years of age or older. The gender makeup of the city was 48.2% male and 51.8% female.
Conclusion
Cherry Hills Village is a small, affluent suburb of Denver, Colorado located in Arapahoe County. It is situated in the foothills of the Rocky Mountains, just south of Denver. The city was incorporated in 1945 and has a population of 6,000 people. The city is characterized by rolling hills, open space, and a variety of vegetation. The city has a strong economy, with a median household income of $150,000. The racial makeup of the city is 91.2% White, 2.2% African American, 0.3% Native American, 3.2% Asian, 0.1% Pacific Islander, 1.2% from other races, and 2.0% from two or more races. The median age in the city was 45.2 years. Cherry Hills Village is an affluent suburb of Denver and is home to many wealthy residents.
Common Questions
What is Per Capita Income in Cherry Hills Village?
Per Capita income in Cherry Hills Village is $171,655.
What is the Median Family Income in Cherry Hills Village?
Median Family Income in Cherry Hills Village is $250,001.
What is the Median Household income in Cherry Hills Village?
Median Household Income in Cherry Hills Village is $250,001.
What is Income or Wage Gap in Cherry Hills Village?
Income or Wage Gap in Cherry Hills Village is 63.8%.
Women in Cherry Hills Village earn 36.2 cents for every dollar earned by a man.
What is Inequality or Gini Index in Cherry Hills Village?
Inequality or Gini Index in Cherry Hills Village is 0.49.
What is the Total Population of Cherry Hills Village?
Total Population of Cherry Hills Village is 6,405.
What is the Total Male Population of Cherry Hills Village?
Total Male Population of Cherry Hills Village is 3,271.
What is the Total Female Population of Cherry Hills Village?
Total Female Population of Cherry Hills Village is 3,134.
What is the Ratio of Males per 100 Females in Cherry Hills Village?
There are 104.37 Males per 100 Females in Cherry Hills Village.
What is the Ratio of Females per 100 Males in Cherry Hills Village?
There are 95.81 Females per 100 Males in Cherry Hills Village.
What is the Median Population Age in Cherry Hills Village?
Median Population Age in Cherry Hills Village is 47.3 Years.
What is the Average Family Size in Cherry Hills Village
Average Family Size in Cherry Hills Village is 3.0 People.
What is the Average Household Size in Cherry Hills Village
Average Household Size in Cherry Hills Village is 2.9 People.
How Large is the Labor Force in Cherry Hills Village?
There are 2,645 People in the Labor Forcein in Cherry Hills Village.
What is the Percentage of People in the Labor Force in Cherry Hills Village?
53.7% of People are in the Labor Force in Cherry Hills Village.
What is the Unemployment Rate in Cherry Hills Village?
Unemployment Rate in Cherry Hills Village is 2.8%.