Zip Codes with the Highest Percentage of Population Employed in Computer & Mathematics in Burlington, VT
RELATED REPORTS & OPTIONS
Computer & Mathematics
Burlington
Compare Zip Codes
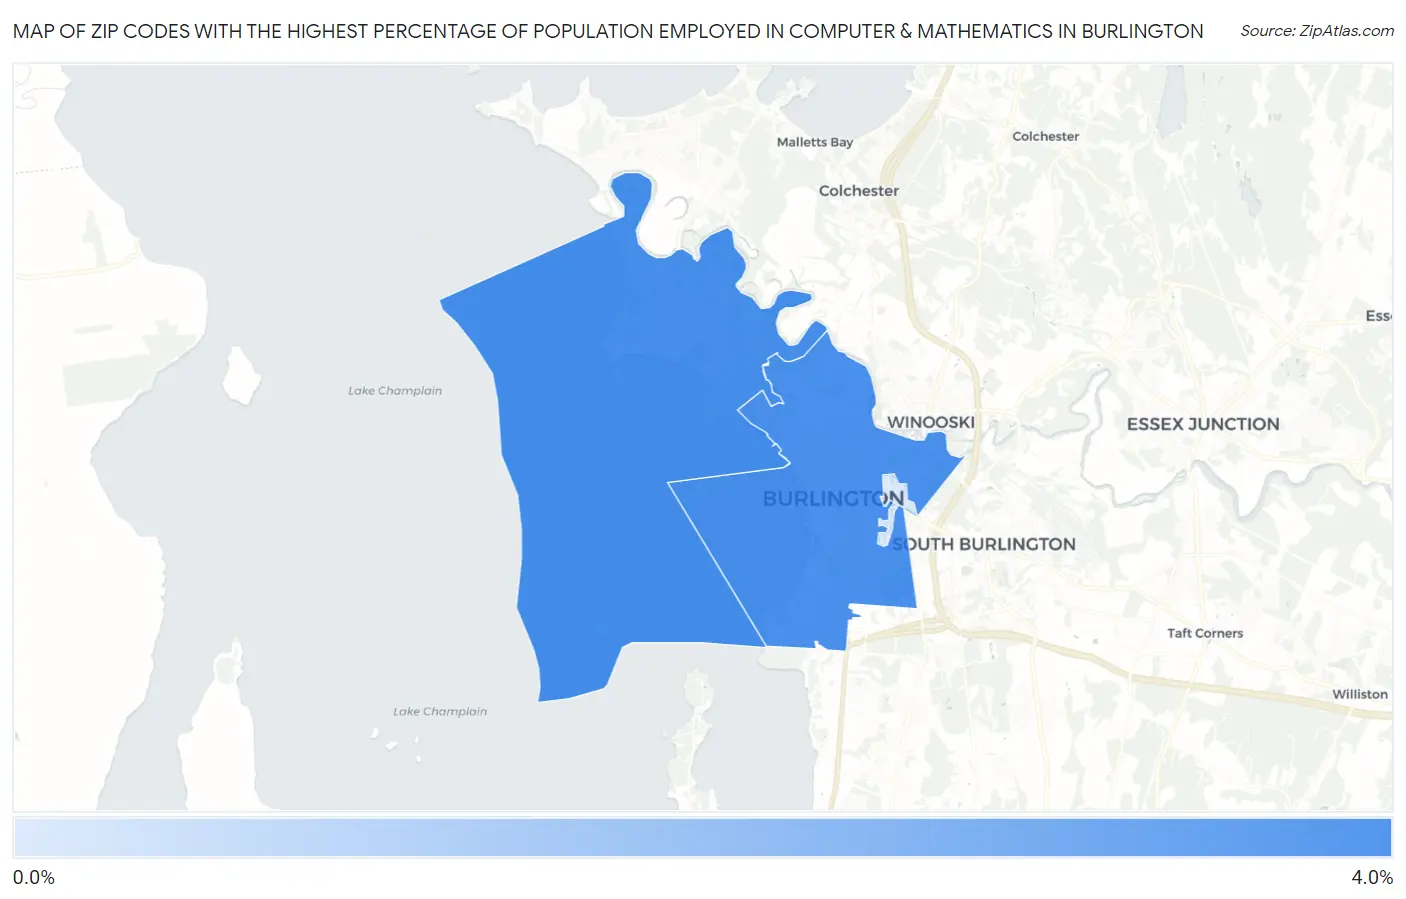
Map of Zip Codes with the Highest Percentage of Population Employed in Computer & Mathematics in Burlington
0.75%
3.5%
Zip Codes with the Highest Percentage of Population Employed in Computer & Mathematics in Burlington, VT
| Zip Code | % Employed | vs State | vs National | |
| 1. | 05408 | 3.5% | 2.8%(+0.682)#50 | 3.5%(-0.055)#6,279 |
| 2. | 05401 | 3.4% | 2.8%(+0.651)#51 | 3.5%(-0.086)#6,373 |
| 3. | 05405 | 0.75% | 2.8%(-2.04)#165 | 3.5%(-2.77)#18,934 |
1
Common Questions
What are the Top Zip Codes with the Highest Percentage of Population Employed in Computer & Mathematics in Burlington, VT?
Top Zip Codes with the Highest Percentage of Population Employed in Computer & Mathematics in Burlington, VT are:
What zip code has the Highest Percentage of Population Employed in Computer & Mathematics in Burlington, VT?
05408 has the Highest Percentage of Population Employed in Computer & Mathematics in Burlington, VT with 3.5%.
What is the Percentage of Population Employed in Computer & Mathematics in Burlington, VT?
Percentage of Population Employed in Computer & Mathematics in Burlington is 3.3%.
What is the Percentage of Population Employed in Computer & Mathematics in Vermont?
Percentage of Population Employed in Computer & Mathematics in Vermont is 2.8%.
What is the Percentage of Population Employed in Computer & Mathematics in the United States?
Percentage of Population Employed in Computer & Mathematics in the United States is 3.5%.