Zip Codes with the Highest Percentage of Population Employed in Computer & Mathematics in Vermont
RELATED REPORTS & OPTIONS
Computer & Mathematics
Vermont
Compare Zip Codes
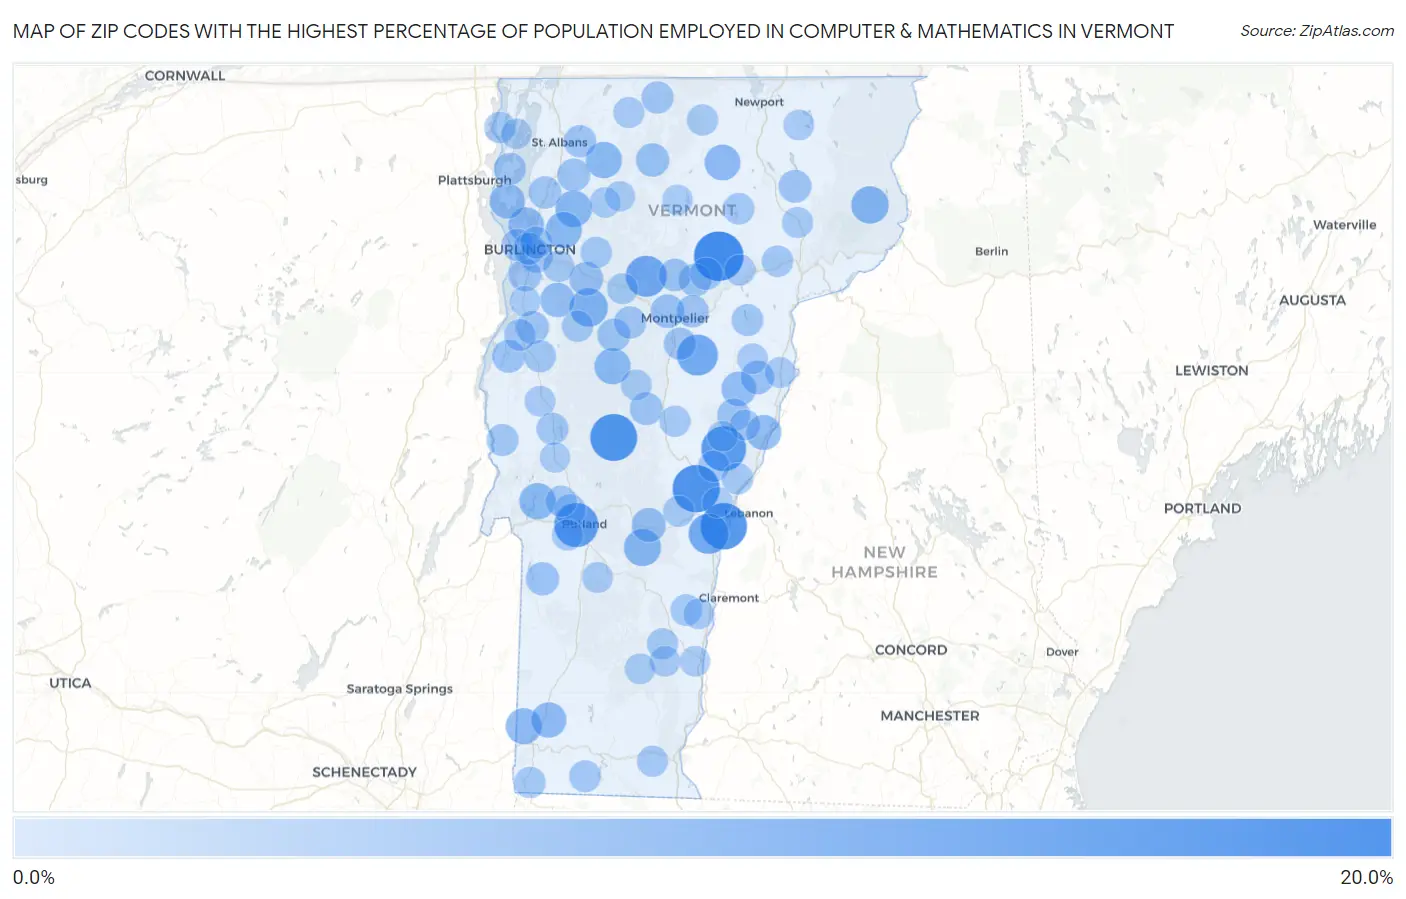
Map of Zip Codes with the Highest Percentage of Population Employed in Computer & Mathematics in Vermont
0.0%
20.0%
Zip Codes with the Highest Percentage of Population Employed in Computer & Mathematics in Vermont
| Zip Code | % Employed | vs State | vs National | |
| 1. | 05681 | 16.5% | 2.8%(+13.7)#1 | 3.5%(+12.9)#201 |
| 2. | 05053 | 14.7% | 2.8%(+11.9)#2 | 3.5%(+11.2)#268 |
| 3. | 05767 | 14.5% | 2.8%(+11.7)#3 | 3.5%(+11.0)#279 |
| 4. | 05052 | 14.1% | 2.8%(+11.3)#4 | 3.5%(+10.6)#301 |
| 5. | 05070 | 12.9% | 2.8%(+10.1)#5 | 3.5%(+9.35)#370 |
| 6. | 05736 | 12.4% | 2.8%(+9.60)#6 | 3.5%(+8.86)#405 |
| 7. | 05677 | 10.0% | 2.8%(+7.25)#7 | 3.5%(+6.52)#703 |
| 8. | 05654 | 10.0% | 2.8%(+7.16)#8 | 3.5%(+6.43)#717 |
| 9. | 05048 | 9.5% | 2.8%(+6.69)#9 | 3.5%(+5.96)#806 |
| 10. | 05462 | 7.9% | 2.8%(+5.12)#10 | 3.5%(+4.39)#1,232 |
| 11. | 05840 | 7.4% | 2.8%(+4.62)#11 | 3.5%(+3.88)#1,426 |
| 12. | 05056 | 7.1% | 2.8%(+4.32)#12 | 3.5%(+3.59)#1,564 |
| 13. | 05494 | 6.7% | 2.8%(+3.90)#13 | 3.5%(+3.16)#1,801 |
| 14. | 05732 | 6.5% | 2.8%(+3.72)#14 | 3.5%(+2.98)#1,923 |
| 15. | 05448 | 6.5% | 2.8%(+3.70)#15 | 3.5%(+2.97)#1,935 |
| 16. | 05452 | 6.5% | 2.8%(+3.70)#16 | 3.5%(+2.96)#1,941 |
| 17. | 05674 | 6.4% | 2.8%(+3.62)#17 | 3.5%(+2.88)#2,002 |
| 18. | 05257 | 6.3% | 2.8%(+3.49)#18 | 3.5%(+2.75)#2,098 |
| 19. | 05820 | 6.1% | 2.8%(+3.33)#19 | 3.5%(+2.60)#2,208 |
| 20. | 05446 | 5.9% | 2.8%(+3.11)#20 | 3.5%(+2.38)#2,407 |
| 21. | 05262 | 5.8% | 2.8%(+2.98)#21 | 3.5%(+2.24)#2,523 |
| 22. | 05045 | 5.6% | 2.8%(+2.79)#22 | 3.5%(+2.06)#2,699 |
| 23. | 05486 | 5.4% | 2.8%(+2.62)#23 | 3.5%(+1.88)#2,890 |
| 24. | 05039 | 5.3% | 2.8%(+2.49)#24 | 3.5%(+1.75)#3,037 |
| 25. | 05461 | 5.2% | 2.8%(+2.37)#25 | 3.5%(+1.63)#3,172 |
| 26. | 05035 | 5.0% | 2.8%(+2.19)#26 | 3.5%(+1.45)#3,384 |
| 27. | 05477 | 4.7% | 2.8%(+1.89)#27 | 3.5%(+1.15)#3,830 |
| 28. | 05040 | 4.5% | 2.8%(+1.72)#28 | 3.5%(+0.980)#4,070 |
| 29. | 05602 | 4.5% | 2.8%(+1.70)#29 | 3.5%(+0.967)#4,087 |
| 30. | 05442 | 4.4% | 2.8%(+1.62)#30 | 3.5%(+0.881)#4,261 |
| 31. | 05774 | 4.3% | 2.8%(+1.51)#31 | 3.5%(+0.776)#4,431 |
| 32. | 05491 | 4.0% | 2.8%(+1.25)#32 | 3.5%(+0.514)#4,949 |
| 33. | 05454 | 4.0% | 2.8%(+1.23)#33 | 3.5%(+0.491)#5,005 |
| 34. | 05473 | 4.0% | 2.8%(+1.22)#34 | 3.5%(+0.480)#5,027 |
| 35. | 05079 | 4.0% | 2.8%(+1.21)#35 | 3.5%(+0.475)#5,044 |
| 36. | 05403 | 4.0% | 2.8%(+1.20)#36 | 3.5%(+0.464)#5,072 |
| 37. | 05867 | 4.0% | 2.8%(+1.18)#37 | 3.5%(+0.447)#5,111 |
| 38. | 05673 | 4.0% | 2.8%(+1.17)#38 | 3.5%(+0.430)#5,142 |
| 39. | 05060 | 3.9% | 2.8%(+1.14)#39 | 3.5%(+0.407)#5,189 |
| 40. | 05648 | 3.8% | 2.8%(+1.03)#40 | 3.5%(+0.295)#5,429 |
| 41. | 05482 | 3.8% | 2.8%(+1.02)#41 | 3.5%(+0.284)#5,462 |
| 42. | 05682 | 3.8% | 2.8%(+1.02)#42 | 3.5%(+0.279)#5,471 |
| 43. | 05468 | 3.7% | 2.8%(+0.939)#43 | 3.5%(+0.202)#5,654 |
| 44. | 05455 | 3.6% | 2.8%(+0.839)#44 | 3.5%(+0.102)#5,901 |
| 45. | 05660 | 3.6% | 2.8%(+0.822)#45 | 3.5%(+0.085)#5,940 |
| 46. | 05651 | 3.6% | 2.8%(+0.805)#46 | 3.5%(+0.068)#5,967 |
| 47. | 05650 | 3.6% | 2.8%(+0.798)#47 | 3.5%(+0.061)#5,984 |
| 48. | 05641 | 3.6% | 2.8%(+0.770)#48 | 3.5%(+0.033)#6,050 |
| 49. | 05476 | 3.5% | 2.8%(+0.722)#49 | 3.5%(-0.015)#6,182 |
| 50. | 05408 | 3.5% | 2.8%(+0.682)#50 | 3.5%(-0.055)#6,279 |
| 51. | 05401 | 3.4% | 2.8%(+0.651)#51 | 3.5%(-0.086)#6,373 |
| 52. | 05472 | 3.4% | 2.8%(+0.620)#52 | 3.5%(-0.117)#6,467 |
| 53. | 05769 | 3.3% | 2.8%(+0.551)#53 | 3.5%(-0.186)#6,654 |
| 54. | 05458 | 3.3% | 2.8%(+0.531)#54 | 3.5%(-0.206)#6,722 |
| 55. | 05404 | 3.3% | 2.8%(+0.518)#55 | 3.5%(-0.219)#6,759 |
| 56. | 05770 | 3.3% | 2.8%(+0.514)#56 | 3.5%(-0.223)#6,772 |
| 57. | 05046 | 3.3% | 2.8%(+0.493)#57 | 3.5%(-0.244)#6,835 |
| 58. | 05456 | 3.3% | 2.8%(+0.491)#58 | 3.5%(-0.246)#6,844 |
| 59. | 05350 | 3.2% | 2.8%(+0.366)#59 | 3.5%(-0.371)#7,249 |
| 60. | 05150 | 3.1% | 2.8%(+0.295)#60 | 3.5%(-0.442)#7,457 |
| 61. | 05765 | 3.0% | 2.8%(+0.243)#61 | 3.5%(-0.494)#7,634 |
| 62. | 05841 | 3.0% | 2.8%(+0.206)#62 | 3.5%(-0.531)#7,767 |
| 63. | 05065 | 3.0% | 2.8%(+0.175)#63 | 3.5%(-0.562)#7,871 |
| 64. | 05055 | 3.0% | 2.8%(+0.172)#64 | 3.5%(-0.565)#7,889 |
| 65. | 05465 | 2.9% | 2.8%(+0.136)#65 | 3.5%(-0.601)#8,024 |
| 66. | 05487 | 2.9% | 2.8%(+0.111)#66 | 3.5%(-0.626)#8,108 |
| 67. | 05828 | 2.9% | 2.8%(+0.110)#67 | 3.5%(-0.627)#8,116 |
| 68. | 05495 | 2.9% | 2.8%(+0.094)#68 | 3.5%(-0.643)#8,163 |
| 69. | 05261 | 2.9% | 2.8%(+0.089)#69 | 3.5%(-0.648)#8,187 |
| 70. | 05463 | 2.8% | 2.8%(+0.059)#70 | 3.5%(-0.678)#8,287 |
| 71. | 05744 | 2.8% | 2.8%(+0.058)#71 | 3.5%(-0.679)#8,294 |
| 72. | 05874 | 2.8% | 2.8%(+0.016)#72 | 3.5%(-0.721)#8,432 |
| 73. | 05091 | 2.8% | 2.8%(-0.034)#73 | 3.5%(-0.771)#8,616 |
| 74. | 05301 | 2.7% | 2.8%(-0.040)#74 | 3.5%(-0.777)#8,639 |
| 75. | 05777 | 2.7% | 2.8%(-0.056)#75 | 3.5%(-0.793)#8,709 |
| 76. | 05061 | 2.7% | 2.8%(-0.079)#76 | 3.5%(-0.816)#8,788 |
| 77. | 05143 | 2.7% | 2.8%(-0.132)#77 | 3.5%(-0.869)#9,005 |
| 78. | 05850 | 2.6% | 2.8%(-0.156)#78 | 3.5%(-0.893)#9,106 |
| 79. | 05676 | 2.6% | 2.8%(-0.164)#79 | 3.5%(-0.901)#9,132 |
| 80. | 05647 | 2.6% | 2.8%(-0.201)#80 | 3.5%(-0.938)#9,265 |
| 81. | 05669 | 2.6% | 2.8%(-0.216)#81 | 3.5%(-0.953)#9,320 |
| 82. | 05450 | 2.6% | 2.8%(-0.233)#82 | 3.5%(-0.970)#9,408 |
| 83. | 05742 | 2.5% | 2.8%(-0.272)#83 | 3.5%(-1.01)#9,576 |
| 84. | 05753 | 2.5% | 2.8%(-0.329)#84 | 3.5%(-1.07)#9,808 |
| 85. | 05076 | 2.4% | 2.8%(-0.358)#85 | 3.5%(-1.10)#9,926 |
| 86. | 05083 | 2.4% | 2.8%(-0.368)#86 | 3.5%(-1.11)#9,960 |
| 87. | 05051 | 2.4% | 2.8%(-0.370)#87 | 3.5%(-1.11)#9,963 |
| 88. | 05156 | 2.4% | 2.8%(-0.397)#88 | 3.5%(-1.13)#10,072 |
| 89. | 05655 | 2.4% | 2.8%(-0.404)#89 | 3.5%(-1.14)#10,104 |
| 90. | 05146 | 2.4% | 2.8%(-0.407)#90 | 3.5%(-1.14)#10,116 |
| 91. | 05872 | 2.3% | 2.8%(-0.473)#91 | 3.5%(-1.21)#10,383 |
| 92. | 05359 | 2.3% | 2.8%(-0.477)#92 | 3.5%(-1.21)#10,400 |
| 93. | 05444 | 2.3% | 2.8%(-0.484)#93 | 3.5%(-1.22)#10,432 |
| 94. | 05072 | 2.3% | 2.8%(-0.502)#94 | 3.5%(-1.24)#10,528 |
| 95. | 05445 | 2.3% | 2.8%(-0.513)#95 | 3.5%(-1.25)#10,580 |
| 96. | 05474 | 2.3% | 2.8%(-0.515)#96 | 3.5%(-1.25)#10,589 |
| 97. | 05101 | 2.3% | 2.8%(-0.521)#97 | 3.5%(-1.26)#10,614 |
| 98. | 05001 | 2.3% | 2.8%(-0.521)#98 | 3.5%(-1.26)#10,616 |
| 99. | 05464 | 2.2% | 2.8%(-0.606)#99 | 3.5%(-1.34)#10,974 |
| 100. | 05733 | 2.2% | 2.8%(-0.617)#100 | 3.5%(-1.35)#11,028 |
Common Questions
What are the Top 10 Zip Codes with the Highest Percentage of Population Employed in Computer & Mathematics in Vermont?
Top 10 Zip Codes with the Highest Percentage of Population Employed in Computer & Mathematics in Vermont are:
What zip code has the Highest Percentage of Population Employed in Computer & Mathematics in Vermont?
05681 has the Highest Percentage of Population Employed in Computer & Mathematics in Vermont with 16.5%.
What is the Percentage of Population Employed in Computer & Mathematics in the State of Vermont?
Percentage of Population Employed in Computer & Mathematics in Vermont is 2.8%.
What is the Percentage of Population Employed in Computer & Mathematics in the United States?
Percentage of Population Employed in Computer & Mathematics in the United States is 3.5%.