Zip Codes with the Highest Percentage of Population with a Degree in Science and Engineering in Austin, TX
RELATED REPORTS & OPTIONS
Science and Engineering
Austin
Compare Zip Codes
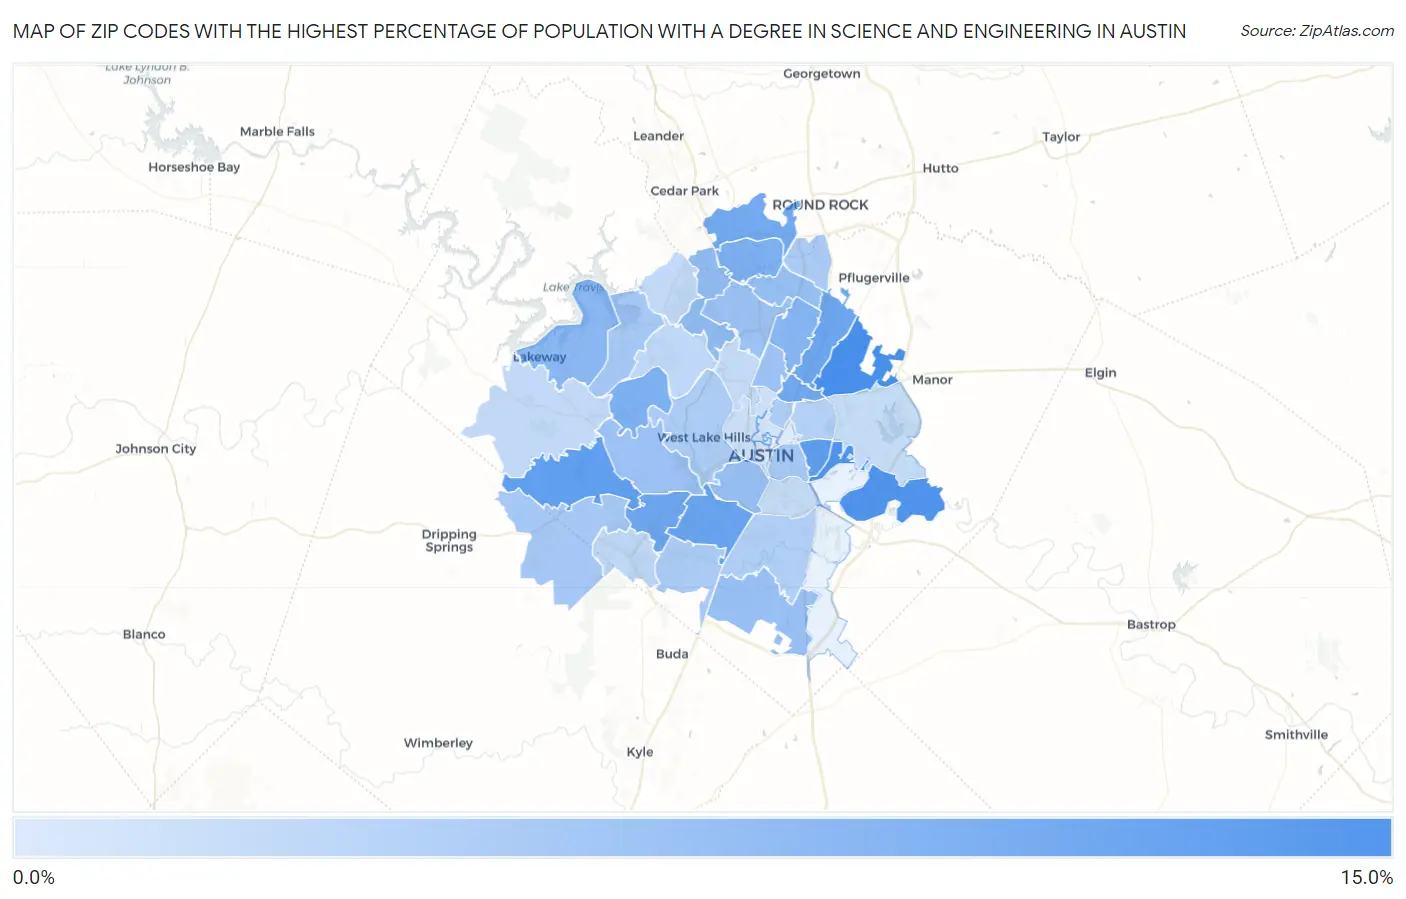
Map of Zip Codes with the Highest Percentage of Population with a Degree in Science and Engineering in Austin
3.9%
10.8%
Zip Codes with the Highest Percentage of Population with a Degree in Science and Engineering in Austin, TX
| Zip Code | % Graduates | vs State | vs National | |
| 1. | 78754 | 10.8% | 9.5%(+1.30)#617 | 9.8%(+1.04)#13,265 |
| 2. | 78725 | 10.4% | 9.5%(+0.875)#663 | 9.8%(+0.615)#14,197 |
| 3. | 78721 | 9.7% | 9.5%(+0.169)#756 | 9.8%(-0.090)#15,725 |
| 4. | 78736 | 9.6% | 9.5%(+0.035)#774 | 9.8%(-0.225)#16,023 |
| 5. | 78745 | 9.1% | 9.5%(-0.388)#847 | 9.8%(-0.647)#17,010 |
| 6. | 78749 | 9.0% | 9.5%(-0.527)#867 | 9.8%(-0.787)#17,367 |
| 7. | 78753 | 9.0% | 9.5%(-0.544)#869 | 9.8%(-0.804)#17,392 |
| 8. | 78752 | 8.8% | 9.5%(-0.712)#896 | 9.8%(-0.972)#17,774 |
| 9. | 78717 | 8.8% | 9.5%(-0.762)#903 | 9.8%(-1.02)#17,887 |
| 10. | 78733 | 8.3% | 9.5%(-1.19)#960 | 9.8%(-1.45)#18,846 |
| 11. | 78729 | 8.3% | 9.5%(-1.25)#968 | 9.8%(-1.51)#19,035 |
| 12. | 78758 | 7.9% | 9.5%(-1.59)#1,016 | 9.8%(-1.85)#19,794 |
| 13. | 78734 | 7.7% | 9.5%(-1.85)#1,062 | 9.8%(-2.11)#20,383 |
| 14. | 78750 | 7.3% | 9.5%(-2.21)#1,107 | 9.8%(-2.46)#21,106 |
| 15. | 78727 | 7.2% | 9.5%(-2.37)#1,120 | 9.8%(-2.63)#21,419 |
| 16. | 78747 | 7.1% | 9.5%(-2.45)#1,131 | 9.8%(-2.71)#21,593 |
| 17. | 78704 | 7.1% | 9.5%(-2.46)#1,134 | 9.8%(-2.72)#21,613 |
| 18. | 78735 | 7.0% | 9.5%(-2.56)#1,148 | 9.8%(-2.82)#21,785 |
| 19. | 78759 | 6.8% | 9.5%(-2.68)#1,162 | 9.8%(-2.94)#22,004 |
| 20. | 78757 | 6.8% | 9.5%(-2.73)#1,167 | 9.8%(-2.99)#22,091 |
| 21. | 78702 | 6.4% | 9.5%(-3.08)#1,209 | 9.8%(-3.34)#22,700 |
| 22. | 78737 | 6.4% | 9.5%(-3.12)#1,216 | 9.8%(-3.38)#22,754 |
| 23. | 78732 | 6.4% | 9.5%(-3.12)#1,217 | 9.8%(-3.38)#22,763 |
| 24. | 78748 | 6.2% | 9.5%(-3.30)#1,239 | 9.8%(-3.56)#23,078 |
| 25. | 78728 | 6.1% | 9.5%(-3.39)#1,253 | 9.8%(-3.65)#23,242 |
| 26. | 78746 | 6.1% | 9.5%(-3.43)#1,255 | 9.8%(-3.69)#23,297 |
| 27. | 78751 | 6.0% | 9.5%(-3.48)#1,266 | 9.8%(-3.74)#23,372 |
| 28. | 78744 | 5.8% | 9.5%(-3.69)#1,296 | 9.8%(-3.95)#23,707 |
| 29. | 78723 | 5.8% | 9.5%(-3.74)#1,301 | 9.8%(-4.00)#23,773 |
| 30. | 78730 | 5.2% | 9.5%(-4.27)#1,346 | 9.8%(-4.53)#24,433 |
| 31. | 78739 | 5.2% | 9.5%(-4.31)#1,349 | 9.8%(-4.57)#24,485 |
| 32. | 78738 | 5.2% | 9.5%(-4.35)#1,358 | 9.8%(-4.61)#24,541 |
| 33. | 78726 | 5.1% | 9.5%(-4.39)#1,362 | 9.8%(-4.65)#24,582 |
| 34. | 78731 | 5.0% | 9.5%(-4.54)#1,374 | 9.8%(-4.80)#24,764 |
| 35. | 78741 | 4.9% | 9.5%(-4.57)#1,377 | 9.8%(-4.83)#24,807 |
| 36. | 78724 | 4.9% | 9.5%(-4.58)#1,379 | 9.8%(-4.84)#24,817 |
| 37. | 78756 | 4.6% | 9.5%(-4.89)#1,408 | 9.8%(-5.15)#25,159 |
| 38. | 78703 | 4.6% | 9.5%(-4.95)#1,412 | 9.8%(-5.21)#25,218 |
| 39. | 78705 | 4.2% | 9.5%(-5.28)#1,433 | 9.8%(-5.54)#25,518 |
| 40. | 78701 | 4.2% | 9.5%(-5.32)#1,437 | 9.8%(-5.58)#25,564 |
| 41. | 78722 | 3.9% | 9.5%(-5.65)#1,456 | 9.8%(-5.91)#25,856 |
1
Common Questions
What are the Top 10 Zip Codes with the Highest Percentage of Population with a Degree in Science and Engineering in Austin, TX?
Top 10 Zip Codes with the Highest Percentage of Population with a Degree in Science and Engineering in Austin, TX are:
What zip code has the Highest Percentage of Population with a Degree in Science and Engineering in Austin, TX?
78754 has the Highest Percentage of Population with a Degree in Science and Engineering in Austin, TX with 10.8%.
What is the Percentage of Population with a Degree in Science and Engineering in Austin, TX?
Percentage of Population with a Degree in Science and Engineering in Austin is 6.9%.
What is the Percentage of Population with a Degree in Science and Engineering in Texas?
Percentage of Population with a Degree in Science and Engineering in Texas is 9.5%.
What is the Percentage of Population with a Degree in Science and Engineering in the United States?
Percentage of Population with a Degree in Science and Engineering in the United States is 9.8%.