Bellmead, TX Map & Demographics
Bellmead Map
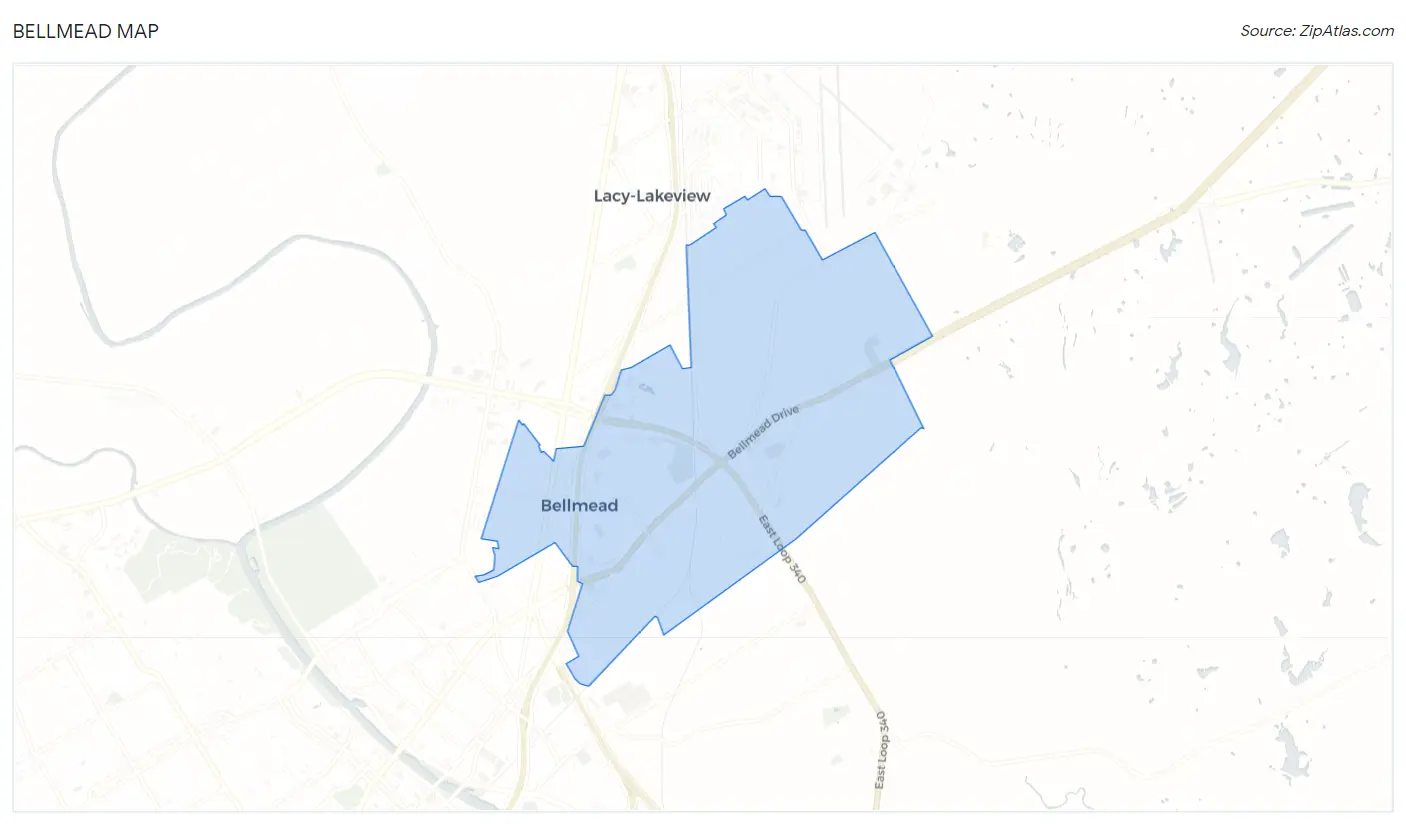
Bellmead Overview
$23,074
PER CAPITA INCOME
$52,282
AVG FAMILY INCOME
$51,474
AVG HOUSEHOLD INCOME
35.0%
WAGE / INCOME GAP [ % ]
65.0¢/ $1
WAGE / INCOME GAP [ $ ]
$12,403
FAMILY INCOME DEFICIT
0.44
INEQUALITY / GINI INDEX
10,480
TOTAL POPULATION
5,227
MALE POPULATION
5,253
FEMALE POPULATION
99.51
MALES / 100 FEMALES
100.50
FEMALES / 100 MALES
34.8
MEDIAN AGE
3.7
AVG FAMILY SIZE
2.9
AVG HOUSEHOLD SIZE
4,160
LABOR FORCE [ PEOPLE ]
53.9%
PERCENT IN LABOR FORCE
2.4%
UNEMPLOYMENT RATE
Bellmead Area Codes
Income in Bellmead
Income Overview in Bellmead
Per Capita Income in Bellmead is $23,074, while median incomes of families and households are $52,282 and $51,474 respectively.
| Characteristic | Number | Measure |
| Per Capita Income | 10,480 | $23,074 |
| Median Family Income | 2,372 | $52,282 |
| Mean Family Income | 2,372 | $74,653 |
| Median Household Income | 3,558 | $51,474 |
| Mean Household Income | 3,558 | $67,215 |
| Income Deficit | 2,372 | $12,403 |
| Wage / Income Gap (%) | 10,480 | 35.03% |
| Wage / Income Gap ($) | 10,480 | 64.97¢ per $1 |
| Gini / Inequality Index | 10,480 | 0.44 |
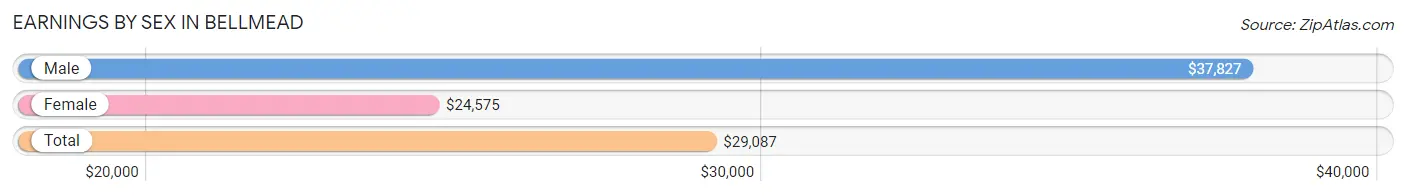
Earnings by Sex in Bellmead
Average Earnings in Bellmead are $29,087, $37,827 for men and $24,575 for women, a difference of 35.0%.
| Sex | Number | Average Earnings |
| Male | 2,163 (46.9%) | $37,827 |
| Female | 2,447 (53.1%) | $24,575 |
| Total | 4,610 (100.0%) | $29,087 |
Earnings by Sex by Income Bracket in Bellmead
The most common earnings brackets in Bellmead are $55,000 to $64,999 for men (261 | 12.1%) and $15,000 to $17,499 for women (342 | 14.0%).
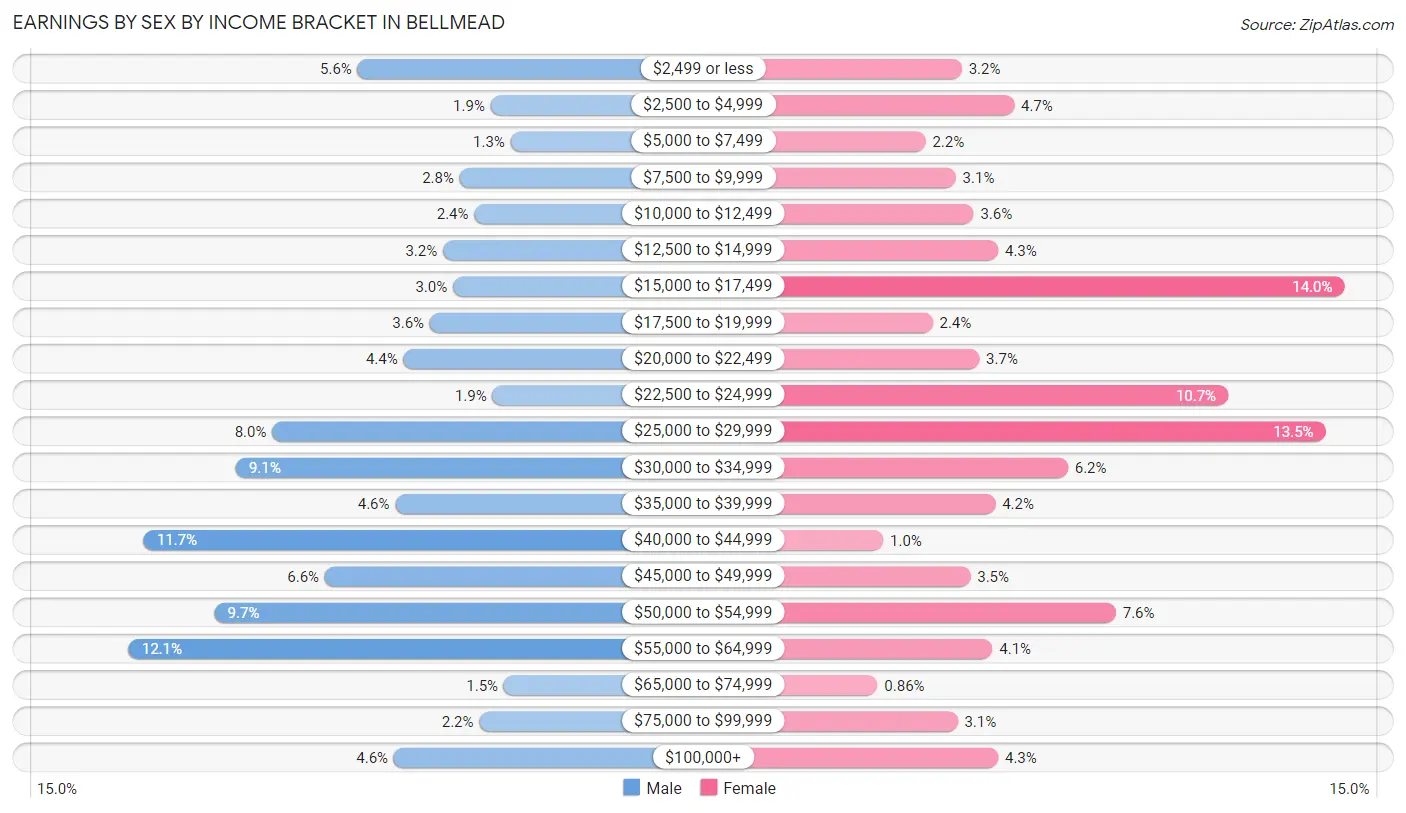
| Income | Male | Female |
| $2,499 or less | 122 (5.6%) | 79 (3.2%) |
| $2,500 to $4,999 | 41 (1.9%) | 115 (4.7%) |
| $5,000 to $7,499 | 29 (1.3%) | 54 (2.2%) |
| $7,500 to $9,999 | 60 (2.8%) | 75 (3.1%) |
| $10,000 to $12,499 | 51 (2.4%) | 87 (3.6%) |
| $12,500 to $14,999 | 70 (3.2%) | 104 (4.3%) |
| $15,000 to $17,499 | 64 (3.0%) | 342 (14.0%) |
| $17,500 to $19,999 | 78 (3.6%) | 59 (2.4%) |
| $20,000 to $22,499 | 94 (4.3%) | 91 (3.7%) |
| $22,500 to $24,999 | 40 (1.8%) | 262 (10.7%) |
| $25,000 to $29,999 | 174 (8.0%) | 329 (13.5%) |
| $30,000 to $34,999 | 196 (9.1%) | 152 (6.2%) |
| $35,000 to $39,999 | 99 (4.6%) | 102 (4.2%) |
| $40,000 to $44,999 | 252 (11.7%) | 25 (1.0%) |
| $45,000 to $49,999 | 142 (6.6%) | 85 (3.5%) |
| $50,000 to $54,999 | 209 (9.7%) | 185 (7.6%) |
| $55,000 to $64,999 | 261 (12.1%) | 100 (4.1%) |
| $65,000 to $74,999 | 33 (1.5%) | 21 (0.9%) |
| $75,000 to $99,999 | 48 (2.2%) | 76 (3.1%) |
| $100,000+ | 100 (4.6%) | 104 (4.3%) |
| Total | 2,163 (100.0%) | 2,447 (100.0%) |
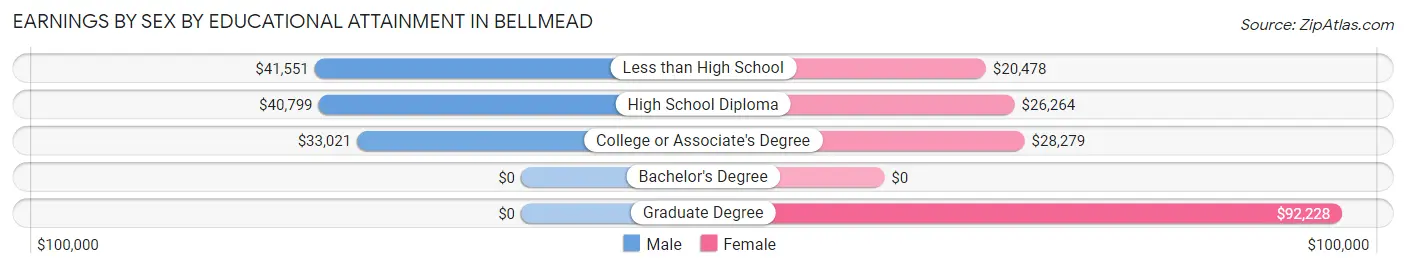
Earnings by Sex by Educational Attainment in Bellmead
Average earnings in Bellmead are $40,363 for men and $27,194 for women, a difference of 32.6%. Men with an educational attainment of less than high school enjoy the highest average annual earnings of $41,551, while those with college or associate's degree education earn the least with $33,021. Women with an educational attainment of graduate degree earn the most with the average annual earnings of $92,228, while those with less than high school education have the smallest earnings of $20,478.
| Educational Attainment | Male Income | Female Income |
| Less than High School | $41,551 | $20,478 |
| High School Diploma | $40,799 | $26,264 |
| College or Associate's Degree | $33,021 | $28,279 |
| Bachelor's Degree | - | - |
| Graduate Degree | - | - |
| Total | $40,363 | $27,194 |
Family Income in Bellmead
Family Income Brackets in Bellmead
According to the Bellmead family income data, there are 550 families falling into the $50,000 to $74,999 income range, which is the most common income bracket and makes up 23.2% of all families. Conversely, the $150,000 to $199,999 income bracket is the least frequent group with only 78 families (3.3%) belonging to this category.
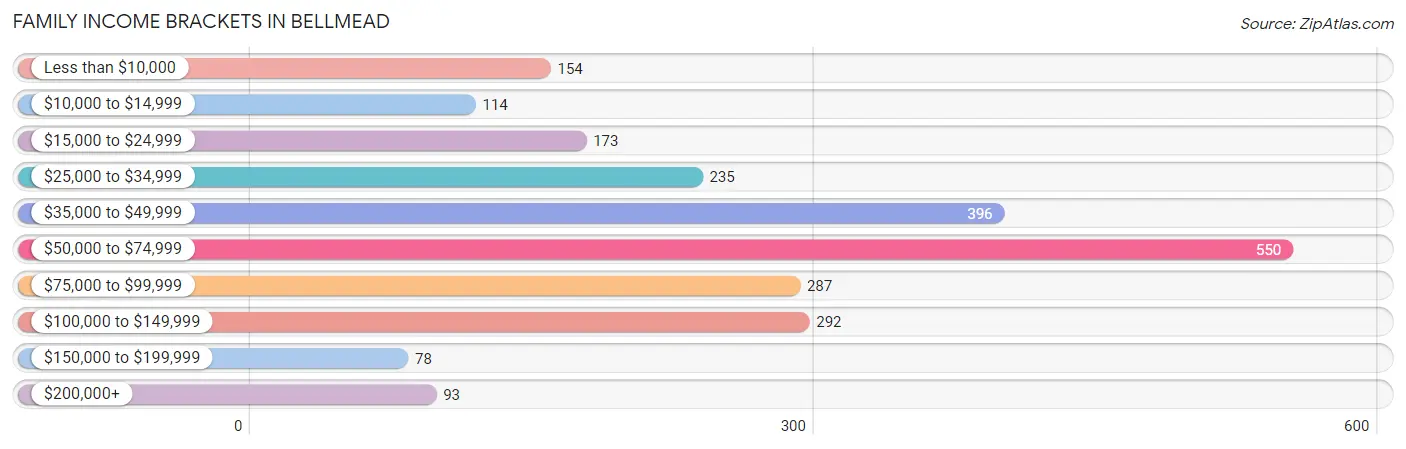
| Income Bracket | # Families | % Families |
| Less than $10,000 | 154 | 6.5% |
| $10,000 to $14,999 | 114 | 4.8% |
| $15,000 to $24,999 | 173 | 7.3% |
| $25,000 to $34,999 | 235 | 9.9% |
| $35,000 to $49,999 | 396 | 16.7% |
| $50,000 to $74,999 | 550 | 23.2% |
| $75,000 to $99,999 | 287 | 12.1% |
| $100,000 to $149,999 | 292 | 12.3% |
| $150,000 to $199,999 | 78 | 3.3% |
| $200,000+ | 93 | 3.9% |
Family Income by Famaliy Size in Bellmead
5-person families (381 | 16.1%) account for the highest median family income in Bellmead with $123,521 per family, while 2-person families (694 | 29.3%) have the highest median income of $33,269 per family member.
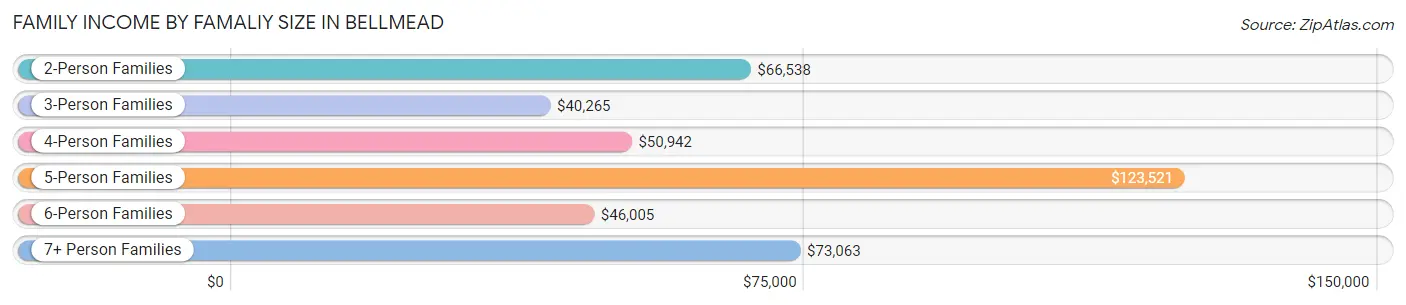
| Income Bracket | # Families | Median Income |
| 2-Person Families | 694 (29.3%) | $66,538 |
| 3-Person Families | 678 (28.6%) | $40,265 |
| 4-Person Families | 346 (14.6%) | $50,942 |
| 5-Person Families | 381 (16.1%) | $123,521 |
| 6-Person Families | 127 (5.3%) | $46,005 |
| 7+ Person Families | 146 (6.2%) | $73,063 |
| Total | 2,372 (100.0%) | $52,282 |
Family Income by Number of Earners in Bellmead
The median family income in Bellmead is $52,282, with families comprising 3+ earners (258) having the highest median family income of $119,783, while families with no earners (424) have the lowest median family income of $19,429, accounting for 10.9% and 17.9% of families, respectively.
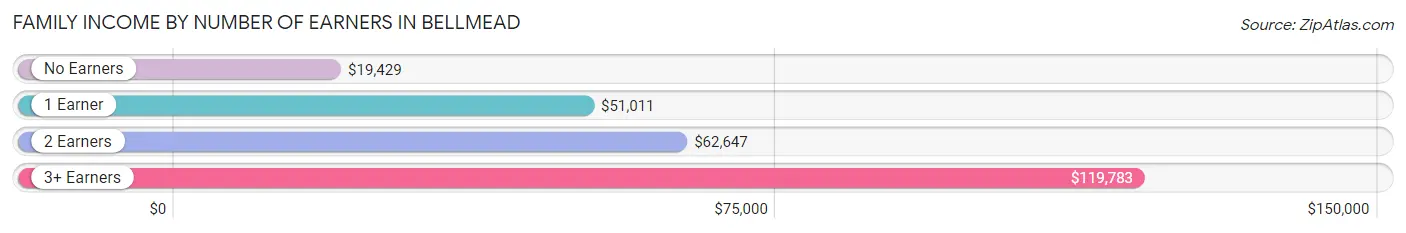
| Number of Earners | # Families | Median Income |
| No Earners | 424 (17.9%) | $19,429 |
| 1 Earner | 842 (35.5%) | $51,011 |
| 2 Earners | 848 (35.7%) | $62,647 |
| 3+ Earners | 258 (10.9%) | $119,783 |
| Total | 2,372 (100.0%) | $52,282 |
Household Income in Bellmead
Household Income Brackets in Bellmead
With 929 households falling in the category, the $50,000 to $74,999 income range is the most frequent in Bellmead, accounting for 26.1% of all households. In contrast, only 93 households (2.6%) fall into the $200,000+ income bracket, making it the least populous group.
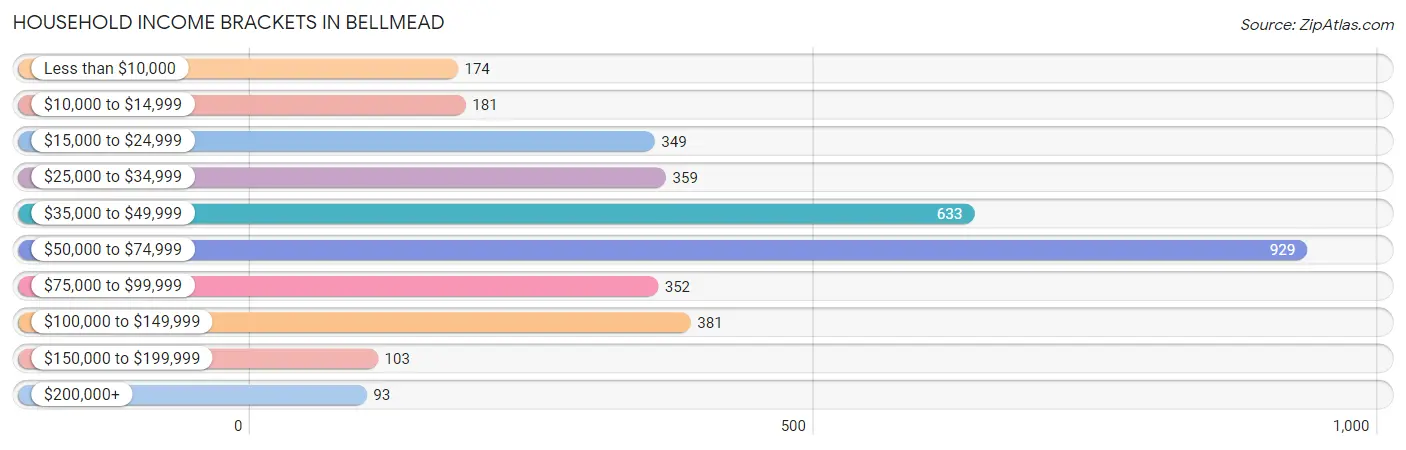
| Income Bracket | # Households | % Households |
| Less than $10,000 | 174 | 4.9% |
| $10,000 to $14,999 | 181 | 5.1% |
| $15,000 to $24,999 | 349 | 9.8% |
| $25,000 to $34,999 | 359 | 10.1% |
| $35,000 to $49,999 | 633 | 17.8% |
| $50,000 to $74,999 | 929 | 26.1% |
| $75,000 to $99,999 | 352 | 9.9% |
| $100,000 to $149,999 | 381 | 10.7% |
| $150,000 to $199,999 | 103 | 2.9% |
| $200,000+ | 93 | 2.6% |
Household Income by Householder Age in Bellmead
The median household income in Bellmead is $51,474, with the highest median household income of $81,098 found in the 15 to 24 years age bracket for the primary householder. A total of 117 households (3.3%) fall into this category. Meanwhile, the 45 to 64 years age bracket for the primary householder has the lowest median household income of $44,653, with 1,353 households (38.0%) in this group.
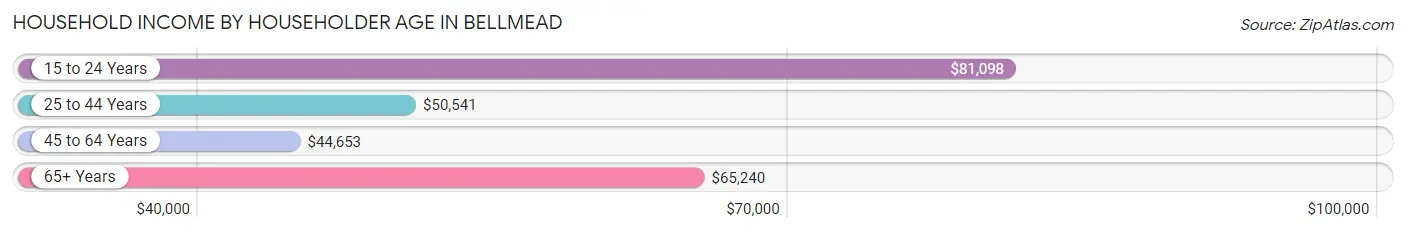
| Income Bracket | # Households | Median Income |
| 15 to 24 Years | 117 (3.3%) | $81,098 |
| 25 to 44 Years | 1,284 (36.1%) | $50,541 |
| 45 to 64 Years | 1,353 (38.0%) | $44,653 |
| 65+ Years | 804 (22.6%) | $65,240 |
| Total | 3,558 (100.0%) | $51,474 |
Poverty in Bellmead
Income Below Poverty by Sex and Age in Bellmead
With 23.6% poverty level for males and 20.3% for females among the residents of Bellmead, 15 year old males and 15 year old females are the most vulnerable to poverty, with 77 males (100.0%) and 67 females (59.3%) in their respective age groups living below the poverty level.
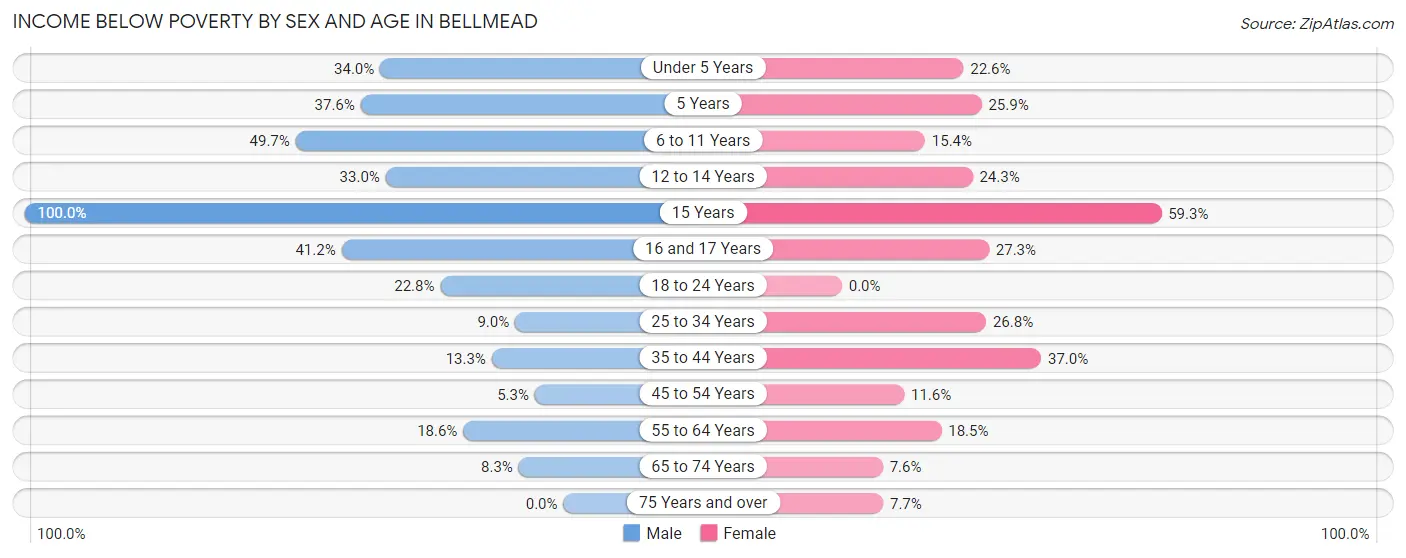
| Age Bracket | Male | Female |
| Under 5 Years | 101 (34.0%) | 46 (22.6%) |
| 5 Years | 35 (37.6%) | 14 (25.9%) |
| 6 to 11 Years | 410 (49.7%) | 70 (15.4%) |
| 12 to 14 Years | 125 (33.0%) | 57 (24.3%) |
| 15 Years | 77 (100.0%) | 67 (59.3%) |
| 16 and 17 Years | 98 (41.2%) | 83 (27.3%) |
| 18 to 24 Years | 74 (22.8%) | 0 (0.0%) |
| 25 to 34 Years | 52 (9.0%) | 171 (26.8%) |
| 35 to 44 Years | 98 (13.3%) | 324 (37.0%) |
| 45 to 54 Years | 30 (5.3%) | 57 (11.6%) |
| 55 to 64 Years | 87 (18.6%) | 116 (18.5%) |
| 65 to 74 Years | 32 (8.3%) | 43 (7.6%) |
| 75 Years and over | 0 (0.0%) | 19 (7.7%) |
| Total | 1,219 (23.6%) | 1,067 (20.3%) |
Income Above Poverty by Sex and Age in Bellmead
According to the poverty statistics in Bellmead, males aged 75 years and over and females aged 18 to 24 years are the age groups that are most secure financially, with 100.0% of males and 100.0% of females in these age groups living above the poverty line.
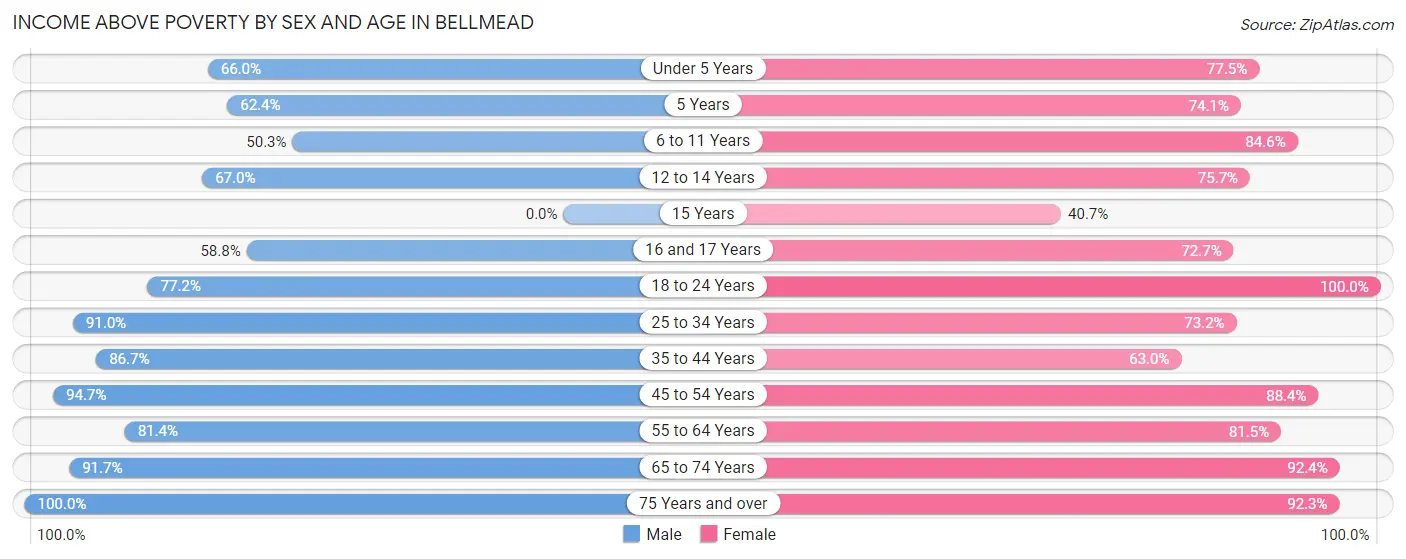
| Age Bracket | Male | Female |
| Under 5 Years | 196 (66.0%) | 158 (77.4%) |
| 5 Years | 58 (62.4%) | 40 (74.1%) |
| 6 to 11 Years | 415 (50.3%) | 384 (84.6%) |
| 12 to 14 Years | 254 (67.0%) | 178 (75.7%) |
| 15 Years | 0 (0.0%) | 46 (40.7%) |
| 16 and 17 Years | 140 (58.8%) | 221 (72.7%) |
| 18 to 24 Years | 250 (77.2%) | 439 (100.0%) |
| 25 to 34 Years | 528 (91.0%) | 468 (73.2%) |
| 35 to 44 Years | 639 (86.7%) | 552 (63.0%) |
| 45 to 54 Years | 536 (94.7%) | 436 (88.4%) |
| 55 to 64 Years | 381 (81.4%) | 512 (81.5%) |
| 65 to 74 Years | 354 (91.7%) | 523 (92.4%) |
| 75 Years and over | 204 (100.0%) | 229 (92.3%) |
| Total | 3,955 (76.4%) | 4,186 (79.7%) |
Income Below Poverty Among Married-Couple Families in Bellmead
The poverty statistics for married-couple families in Bellmead show that 14.0% or 212 of the total 1,516 families live below the poverty line. Families with 5 or more children have the highest poverty rate of 100.0%, comprising of 20 families. On the other hand, families with no children have the lowest poverty rate of 4.5%, which includes 24 families.
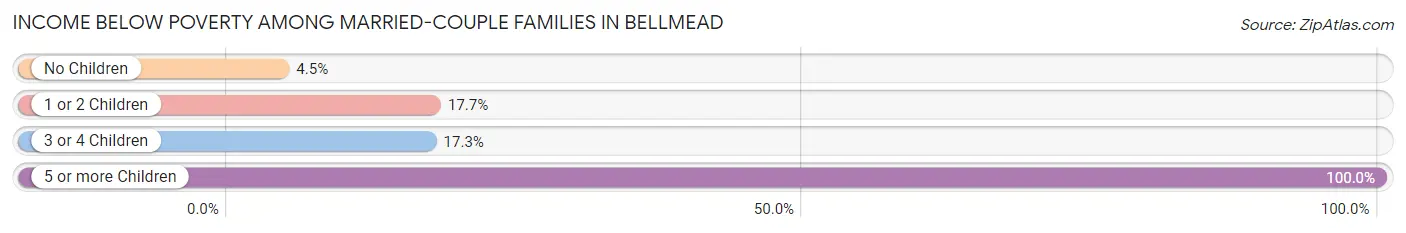
| Children | Above Poverty | Below Poverty |
| No Children | 513 (95.5%) | 24 (4.5%) |
| 1 or 2 Children | 480 (82.3%) | 103 (17.7%) |
| 3 or 4 Children | 311 (82.7%) | 65 (17.3%) |
| 5 or more Children | 0 (0.0%) | 20 (100.0%) |
| Total | 1,304 (86.0%) | 212 (14.0%) |
Income Below Poverty Among Single-Parent Households in Bellmead
| Children | Single Father | Single Mother |
| No Children | 0 (0.0%) | 45 (17.9%) |
| 1 or 2 Children | 0 (0.0%) | 160 (48.0%) |
| 3 or 4 Children | 0 (0.0%) | 65 (100.0%) |
| 5 or more Children | 0 (0.0%) | 0 (0.0%) |
| Total | 0 (0.0%) | 270 (41.5%) |
Income Below Poverty Among Married-Couple vs Single-Parent Households in Bellmead
The poverty data for Bellmead shows that 212 of the married-couple family households (14.0%) and 270 of the single-parent households (31.5%) are living below the poverty level. Within the married-couple family households, those with 5 or more children have the highest poverty rate, with 20 households (100.0%) falling below the poverty line. Among the single-parent households, those with 3 or 4 children have the highest poverty rate, with 65 household (100.0%) living below poverty.
| Children | Married-Couple Families | Single-Parent Households |
| No Children | 24 (4.5%) | 45 (10.7%) |
| 1 or 2 Children | 103 (17.7%) | 160 (43.1%) |
| 3 or 4 Children | 65 (17.3%) | 65 (100.0%) |
| 5 or more Children | 20 (100.0%) | 0 (0.0%) |
| Total | 212 (14.0%) | 270 (31.5%) |
Race in Bellmead
The most populous races in Bellmead are Hispanic or Latino (5,026 | 48.0%), White / Caucasian (4,863 | 46.4%), and Two or more Races (2,447 | 23.4%).
| Race | # Population | % Population |
| Asian | 207 | 2.0% |
| Black / African American | 1,928 | 18.4% |
| Hawaiian / Pacific | 92 | 0.9% |
| Hispanic or Latino | 5,026 | 48.0% |
| Native / Alaskan | 428 | 4.1% |
| White / Caucasian | 4,863 | 46.4% |
| Two or more Races | 2,447 | 23.4% |
| Some other Race | 515 | 4.9% |
| Total | 10,480 | 100.0% |
Ancestry in Bellmead
The most populous ancestries reported in Bellmead are Mexican (4,964 | 47.4%), German (700 | 6.7%), Irish (529 | 5.1%), Cherokee (464 | 4.4%), and English (429 | 4.1%), together accounting for 67.6% of all Bellmead residents.
| Ancestry | # Population | % Population |
| African | 204 | 1.9% |
| American | 168 | 1.6% |
| Australian | 104 | 1.0% |
| Blackfeet | 42 | 0.4% |
| British | 16 | 0.2% |
| Burmese | 64 | 0.6% |
| Central American | 62 | 0.6% |
| Cherokee | 464 | 4.4% |
| Chippewa | 4 | 0.0% |
| Czech | 22 | 0.2% |
| Dutch | 84 | 0.8% |
| English | 429 | 4.1% |
| Finnish | 13 | 0.1% |
| French | 34 | 0.3% |
| French Canadian | 10 | 0.1% |
| German | 700 | 6.7% |
| Irish | 529 | 5.1% |
| Italian | 35 | 0.3% |
| Mexican | 4,964 | 47.4% |
| Native Hawaiian | 82 | 0.8% |
| New Zealander | 27 | 0.3% |
| Nicaraguan | 62 | 0.6% |
| Polish | 55 | 0.5% |
| Pueblo | 10 | 0.1% |
| Romanian | 123 | 1.2% |
| Russian | 21 | 0.2% |
| Scotch-Irish | 61 | 0.6% |
| Scottish | 184 | 1.8% |
| Sri Lankan | 207 | 2.0% |
| Subsaharan African | 204 | 1.9% |
| Tongan | 10 | 0.1% |
| Welsh | 40 | 0.4% | View All 32 Rows |
Immigrants in Bellmead
The most numerous immigrant groups reported in Bellmead came from Central America (1,913 | 18.2%), Latin America (1,913 | 18.2%), Mexico (1,913 | 18.2%), Asia (207 | 2.0%), and South Eastern Asia (207 | 2.0%), together accounting for 58.7% of all Bellmead residents.
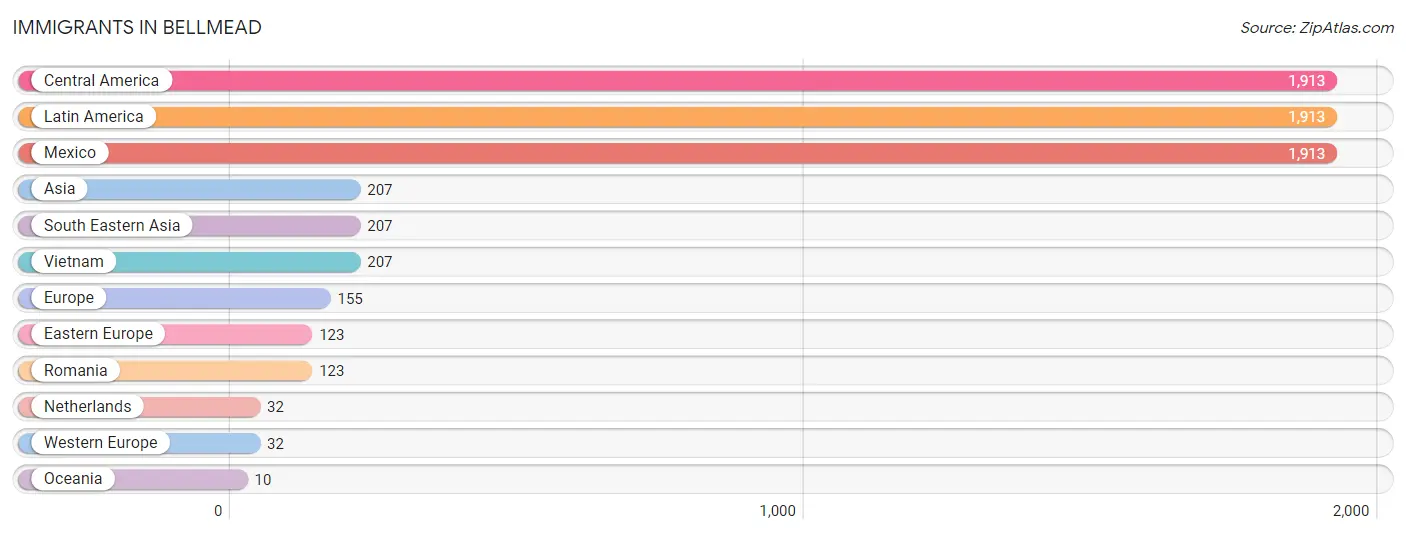
| Immigration Origin | # Population | % Population |
| Asia | 207 | 2.0% |
| Central America | 1,913 | 18.2% |
| Eastern Europe | 123 | 1.2% |
| Europe | 155 | 1.5% |
| Latin America | 1,913 | 18.2% |
| Mexico | 1,913 | 18.2% |
| Netherlands | 32 | 0.3% |
| Oceania | 10 | 0.1% |
| Romania | 123 | 1.2% |
| South Eastern Asia | 207 | 2.0% |
| Vietnam | 207 | 2.0% |
| Western Europe | 32 | 0.3% | View All 12 Rows |
Sex and Age in Bellmead
Sex and Age in Bellmead
The most populous age groups in Bellmead are 10 to 14 Years (666 | 12.7%) for men and 15 to 19 Years (565 | 10.8%) for women.
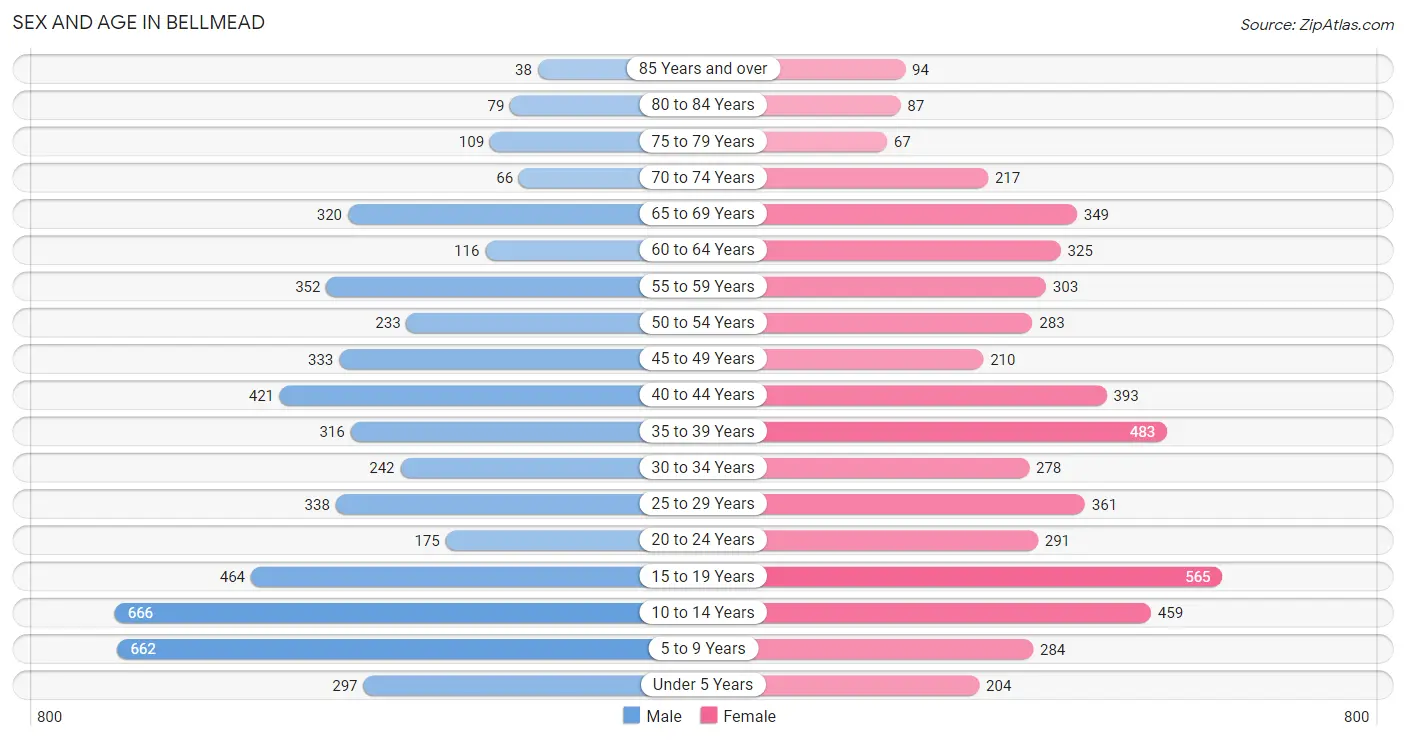
| Age Bracket | Male | Female |
| Under 5 Years | 297 (5.7%) | 204 (3.9%) |
| 5 to 9 Years | 662 (12.7%) | 284 (5.4%) |
| 10 to 14 Years | 666 (12.7%) | 459 (8.7%) |
| 15 to 19 Years | 464 (8.9%) | 565 (10.8%) |
| 20 to 24 Years | 175 (3.4%) | 291 (5.5%) |
| 25 to 29 Years | 338 (6.5%) | 361 (6.9%) |
| 30 to 34 Years | 242 (4.6%) | 278 (5.3%) |
| 35 to 39 Years | 316 (6.0%) | 483 (9.2%) |
| 40 to 44 Years | 421 (8.1%) | 393 (7.5%) |
| 45 to 49 Years | 333 (6.4%) | 210 (4.0%) |
| 50 to 54 Years | 233 (4.5%) | 283 (5.4%) |
| 55 to 59 Years | 352 (6.7%) | 303 (5.8%) |
| 60 to 64 Years | 116 (2.2%) | 325 (6.2%) |
| 65 to 69 Years | 320 (6.1%) | 349 (6.6%) |
| 70 to 74 Years | 66 (1.3%) | 217 (4.1%) |
| 75 to 79 Years | 109 (2.1%) | 67 (1.3%) |
| 80 to 84 Years | 79 (1.5%) | 87 (1.7%) |
| 85 Years and over | 38 (0.7%) | 94 (1.8%) |
| Total | 5,227 (100.0%) | 5,253 (100.0%) |
Families and Households in Bellmead
Median Family Size in Bellmead
The median family size in Bellmead is 3.68 persons per family, with married-couple families (1,516 | 63.9%) accounting for the largest median family size of 4.06 persons per family. On the other hand, single male/father families (206 | 8.7%) represent the smallest median family size with 2.54 persons per family.
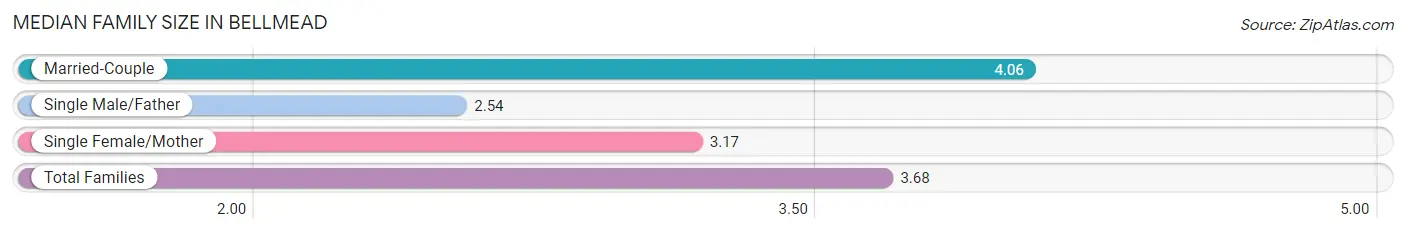
| Family Type | # Families | Family Size |
| Married-Couple | 1,516 (63.9%) | 4.06 |
| Single Male/Father | 206 (8.7%) | 2.54 |
| Single Female/Mother | 650 (27.4%) | 3.17 |
| Total Families | 2,372 (100.0%) | 3.68 |
Median Household Size in Bellmead
The median household size in Bellmead is 2.94 persons per household, with married-couple households (1,516 | 42.6%) accounting for the largest median household size of 4.06 persons per household. non-family households (1,186 | 33.3%) represent the smallest median household size with 1.33 persons per household.
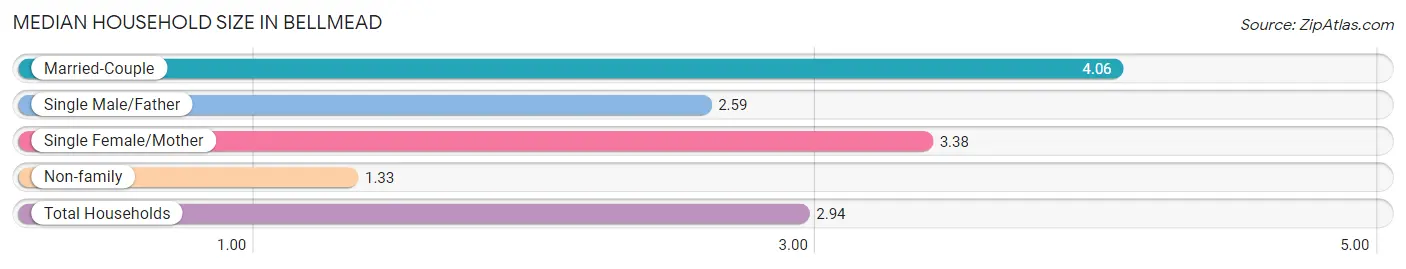
| Household Type | # Households | Household Size |
| Married-Couple | 1,516 (42.6%) | 4.06 |
| Single Male/Father | 206 (5.8%) | 2.59 |
| Single Female/Mother | 650 (18.3%) | 3.38 |
| Non-family | 1,186 (33.3%) | 1.33 |
| Total Households | 3,558 (100.0%) | 2.94 |
Household Size by Marriage Status in Bellmead
Out of a total of 3,558 households in Bellmead, 2,372 (66.7%) are family households, while 1,186 (33.3%) are nonfamily households. The most numerous type of family households are 2-person households, comprising 668, and the most common type of nonfamily households are 1-person households, comprising 808.
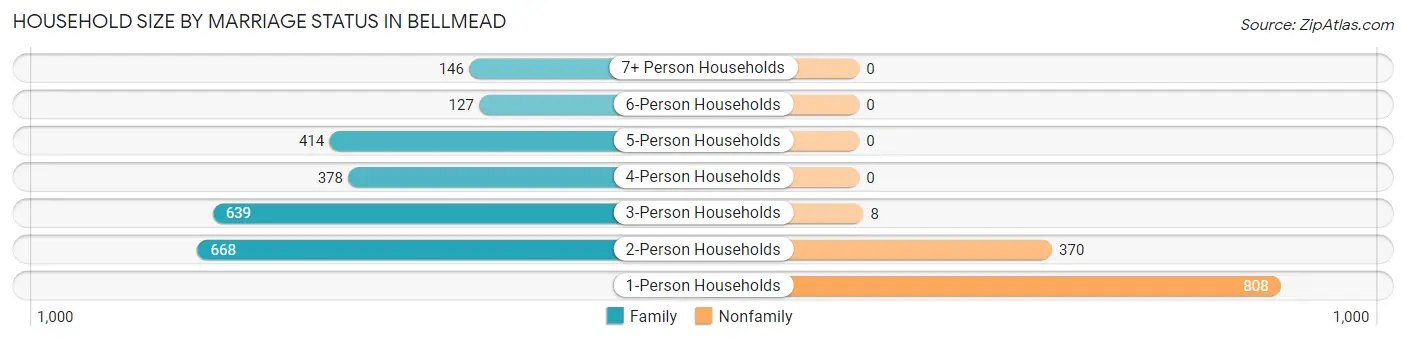
| Household Size | Family Households | Nonfamily Households |
| 1-Person Households | - | 808 (22.7%) |
| 2-Person Households | 668 (18.8%) | 370 (10.4%) |
| 3-Person Households | 639 (18.0%) | 8 (0.2%) |
| 4-Person Households | 378 (10.6%) | 0 (0.0%) |
| 5-Person Households | 414 (11.6%) | 0 (0.0%) |
| 6-Person Households | 127 (3.6%) | 0 (0.0%) |
| 7+ Person Households | 146 (4.1%) | 0 (0.0%) |
| Total | 2,372 (66.7%) | 1,186 (33.3%) |
Female Fertility in Bellmead
Fertility by Age in Bellmead
Average fertility rate in Bellmead is 57.0 births per 1,000 women. Women in the age bracket of 20 to 34 years have the highest fertility rate with 148.0 births per 1,000 women. Women in the age bracket of 20 to 34 years acount for 93.2% of all women with births.
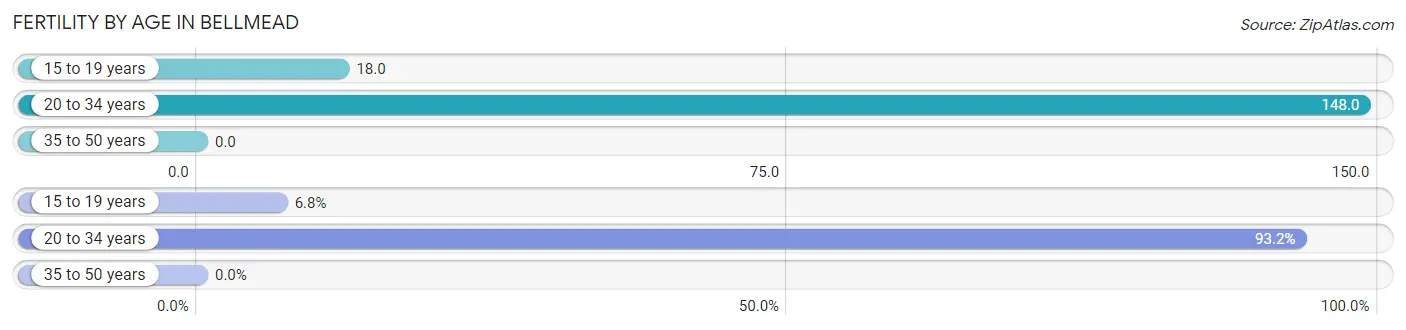
| Age Bracket | Women with Births | Births / 1,000 Women |
| 15 to 19 years | 10 (6.8%) | 18.0 |
| 20 to 34 years | 138 (93.2%) | 148.0 |
| 35 to 50 years | 0 (0.0%) | 0.0 |
| Total | 148 (100.0%) | 57.0 |
Fertility by Age by Marriage Status in Bellmead
27.7% of women with births (148) in Bellmead are married. The highest percentage of unmarried women with births falls into 15 to 19 years age bracket with 100.0% of them unmarried at the time of birth, while the lowest percentage of unmarried women with births belong to 20 to 34 years age bracket with 70.3% of them unmarried.
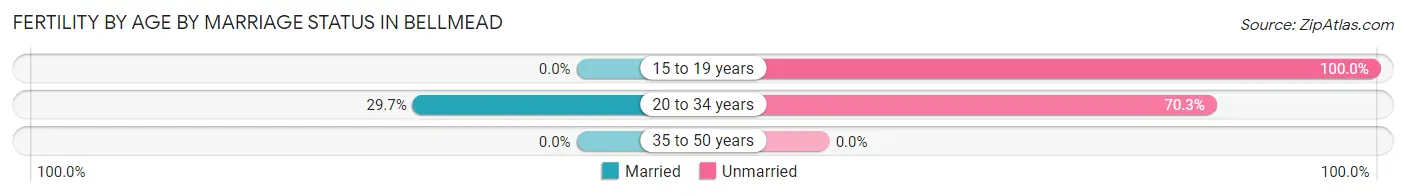
| Age Bracket | Married | Unmarried |
| 15 to 19 years | 0 (0.0%) | 10 (100.0%) |
| 20 to 34 years | 41 (29.7%) | 97 (70.3%) |
| 35 to 50 years | 0 (0.0%) | 0 (0.0%) |
| Total | 41 (27.7%) | 107 (72.3%) |
Fertility by Education in Bellmead
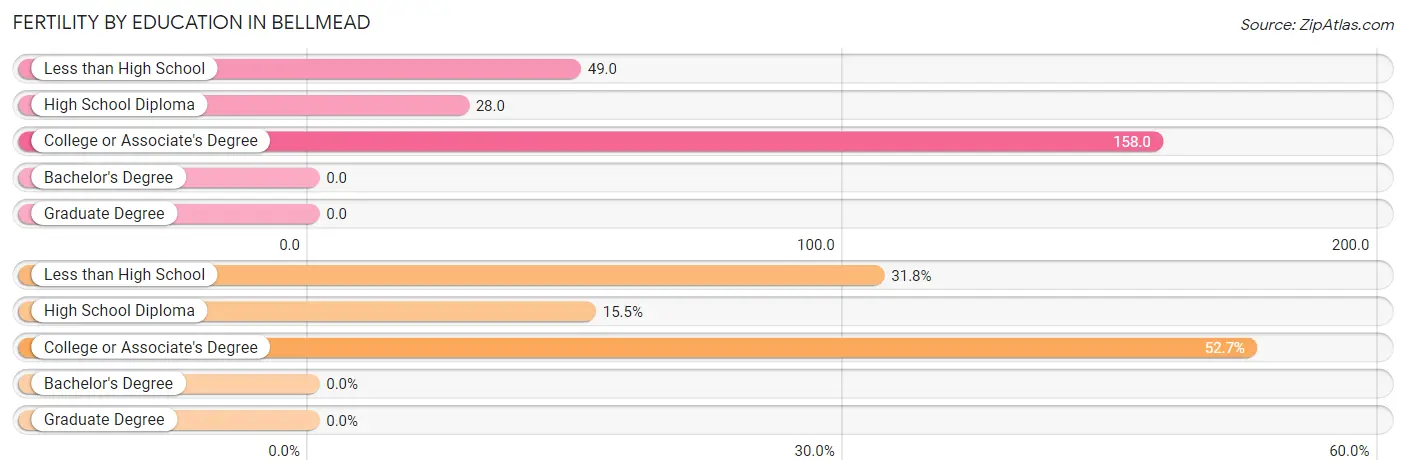
| Educational Attainment | Women with Births | Births / 1,000 Women |
| Less than High School | 47 (31.8%) | 49.0 |
| High School Diploma | 23 (15.5%) | 28.0 |
| College or Associate's Degree | 78 (52.7%) | 158.0 |
| Bachelor's Degree | 0 (0.0%) | 0.0 |
| Graduate Degree | 0 (0.0%) | 0.0 |
| Total | 148 (100.0%) | 57.0 |
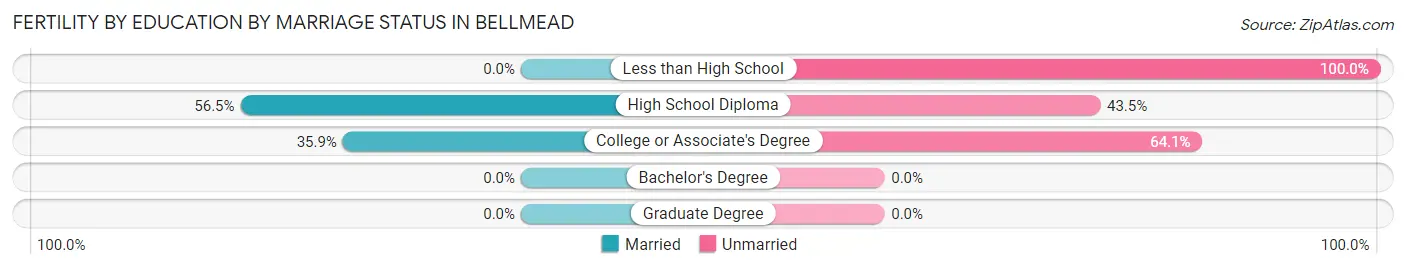
Fertility by Education by Marriage Status in Bellmead
72.3% of women with births in Bellmead are unmarried. Women with the educational attainment of high school diploma are most likely to be married with 56.5% of them married at childbirth, while women with the educational attainment of less than high school are least likely to be married with 100.0% of them unmarried at childbirth.
| Educational Attainment | Married | Unmarried |
| Less than High School | 0 (0.0%) | 47 (100.0%) |
| High School Diploma | 13 (56.5%) | 10 (43.5%) |
| College or Associate's Degree | 28 (35.9%) | 50 (64.1%) |
| Bachelor's Degree | 0 (0.0%) | 0 (0.0%) |
| Graduate Degree | 0 (0.0%) | 0 (0.0%) |
| Total | 41 (27.7%) | 107 (72.3%) |
Employment Characteristics in Bellmead
Employment by Class of Employer in Bellmead
Among the 4,062 employed individuals in Bellmead, private company employees (3,312 | 81.5%), not-for-profit organizations (222 | 5.5%), and state government employees (220 | 5.4%) make up the most common classes of employment.
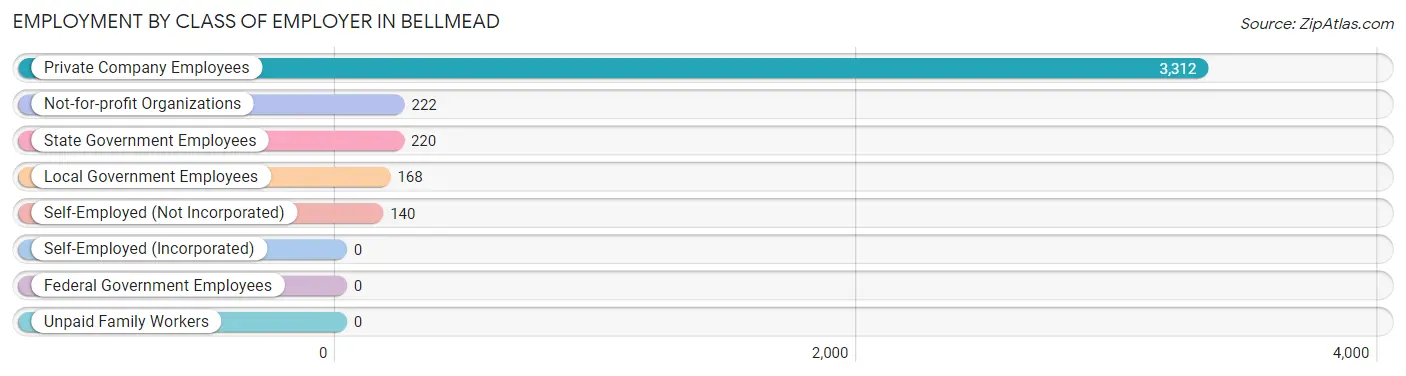
| Employer Class | # Employees | % Employees |
| Private Company Employees | 3,312 | 81.5% |
| Self-Employed (Incorporated) | 0 | 0.0% |
| Self-Employed (Not Incorporated) | 140 | 3.5% |
| Not-for-profit Organizations | 222 | 5.5% |
| Local Government Employees | 168 | 4.1% |
| State Government Employees | 220 | 5.4% |
| Federal Government Employees | 0 | 0.0% |
| Unpaid Family Workers | 0 | 0.0% |
| Total | 4,062 | 100.0% |
Employment Status by Age in Bellmead
According to the labor force statistics for Bellmead, out of the total population over 16 years of age (7,718), 53.9% or 4,160 individuals are in the labor force, with 2.4% or 100 of them unemployed. The age group with the highest labor force participation rate is 20 to 24 years, with 91.2% or 425 individuals in the labor force. Within the labor force, the 65 to 74 years age range has the highest percentage of unemployed individuals, with 28.1% or 25 of them being unemployed.
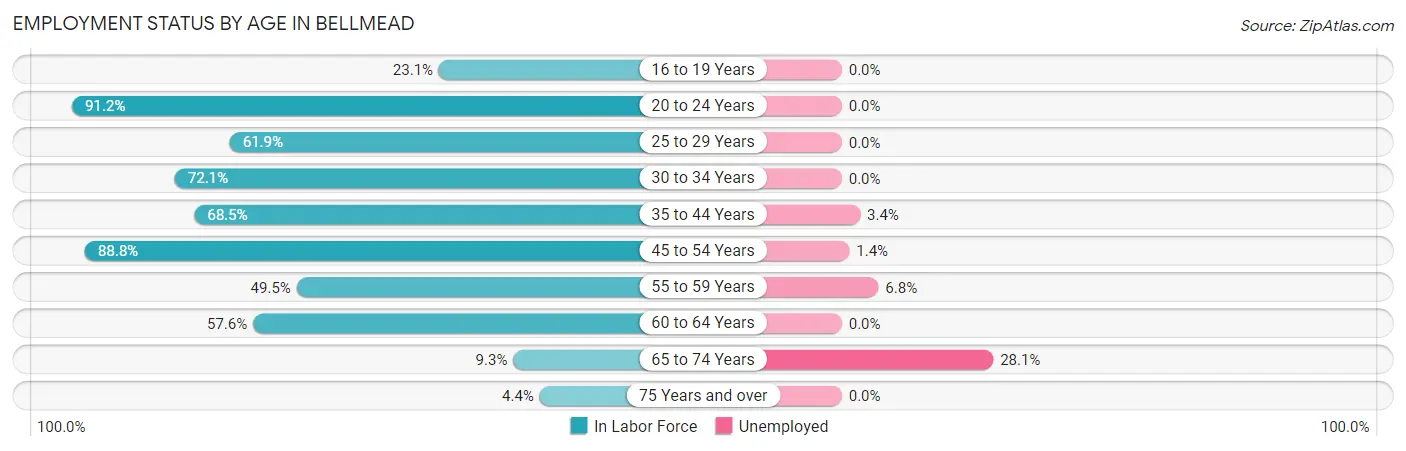
| Age Bracket | In Labor Force | Unemployed |
| 16 to 19 Years | 194 (23.1%) | 0 (0.0%) |
| 20 to 24 Years | 425 (91.2%) | 0 (0.0%) |
| 25 to 29 Years | 433 (61.9%) | 0 (0.0%) |
| 30 to 34 Years | 375 (72.1%) | 0 (0.0%) |
| 35 to 44 Years | 1,105 (68.5%) | 38 (3.4%) |
| 45 to 54 Years | 940 (88.8%) | 13 (1.4%) |
| 55 to 59 Years | 324 (49.5%) | 22 (6.8%) |
| 60 to 64 Years | 254 (57.6%) | 0 (0.0%) |
| 65 to 74 Years | 89 (9.3%) | 25 (28.1%) |
| 75 Years and over | 21 (4.4%) | 0 (0.0%) |
| Total | 4,160 (53.9%) | 100 (2.4%) |
Employment Status by Educational Attainment in Bellmead
According to labor force statistics for Bellmead, 68.8% of individuals (3,431) out of the total population between 25 and 64 years of age (4,987) are in the labor force, with 2.1% or 72 of them being unemployed. The group with the highest labor force participation rate are those with the educational attainment of bachelor's degree or higher, with 85.5% or 441 individuals in the labor force. Within the labor force, individuals with bachelor's degree or higher education have the highest percentage of unemployment, with 5.0% or 22 of them being unemployed.
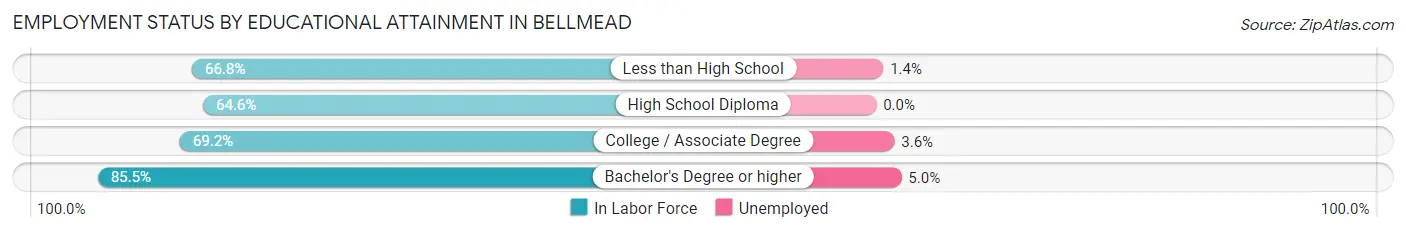
| Educational Attainment | In Labor Force | Unemployed |
| Less than High School | 933 (66.8%) | 20 (1.4%) |
| High School Diploma | 1,008 (64.6%) | 0 (0.0%) |
| College / Associate Degree | 1,048 (69.2%) | 55 (3.6%) |
| Bachelor's Degree or higher | 441 (85.5%) | 26 (5.0%) |
| Total | 3,431 (68.8%) | 105 (2.1%) |
Employment Occupations by Sex in Bellmead
Management, Business, Science and Arts Occupations
The most common Management, Business, Science and Arts occupations in Bellmead are Community & Social Service (275 | 6.8%), Education Instruction & Library (189 | 4.6%), Health Diagnosing & Treating (188 | 4.6%), Health Technologists (147 | 3.6%), and Management (143 | 3.5%).
Management, Business, Science and Arts Occupations by Sex
Within the Management, Business, Science and Arts occupations in Bellmead, the most male-oriented occupations are Management (77.6%), Architecture & Engineering (58.6%), and Business & Financial (39.5%), while the most female-oriented occupations are Computers & Mathematics (82.8%), Health Technologists (78.2%), and Education, Arts & Media (74.4%).
| Occupation | Male | Female |
| Management | 111 (77.6%) | 32 (22.4%) |
| Business & Financial | 15 (39.5%) | 23 (60.5%) |
| Computers, Engineering & Science | 27 (31.0%) | 60 (69.0%) |
| Computers & Mathematics | 10 (17.2%) | 48 (82.8%) |
| Architecture & Engineering | 17 (58.6%) | 12 (41.4%) |
| Life, Physical & Social Science | 0 (0.0%) | 0 (0.0%) |
| Community & Social Service | 82 (29.8%) | 193 (70.2%) |
| Education, Arts & Media | 22 (25.6%) | 64 (74.4%) |
| Legal Services & Support | 0 (0.0%) | 0 (0.0%) |
| Education Instruction & Library | 60 (31.8%) | 129 (68.2%) |
| Arts, Media & Entertainment | 0 (0.0%) | 0 (0.0%) |
| Health Diagnosing & Treating | 55 (29.3%) | 133 (70.7%) |
| Health Technologists | 32 (21.8%) | 115 (78.2%) |
| Total (Category) | 290 (39.7%) | 441 (60.3%) |
| Total (Overall) | 2,062 (50.8%) | 2,000 (49.2%) |
Services Occupations
The most common Services occupations in Bellmead are Cleaning & Maintenance (279 | 6.9%), Food Preparation & Serving (272 | 6.7%), Healthcare Support (228 | 5.6%), and Personal Care & Service (94 | 2.3%).
Services Occupations by Sex
Within the Services occupations in Bellmead, the most male-oriented occupations are Food Preparation & Serving (35.3%), Cleaning & Maintenance (30.8%), and Personal Care & Service (22.3%), while the most female-oriented occupations are Healthcare Support (82.5%), Personal Care & Service (77.7%), and Cleaning & Maintenance (69.2%).
| Occupation | Male | Female |
| Healthcare Support | 40 (17.5%) | 188 (82.5%) |
| Security & Protection | 0 (0.0%) | 0 (0.0%) |
| Firefighting & Prevention | 0 (0.0%) | 0 (0.0%) |
| Law Enforcement | 0 (0.0%) | 0 (0.0%) |
| Food Preparation & Serving | 96 (35.3%) | 176 (64.7%) |
| Cleaning & Maintenance | 86 (30.8%) | 193 (69.2%) |
| Personal Care & Service | 21 (22.3%) | 73 (77.7%) |
| Total (Category) | 243 (27.8%) | 630 (72.2%) |
| Total (Overall) | 2,062 (50.8%) | 2,000 (49.2%) |
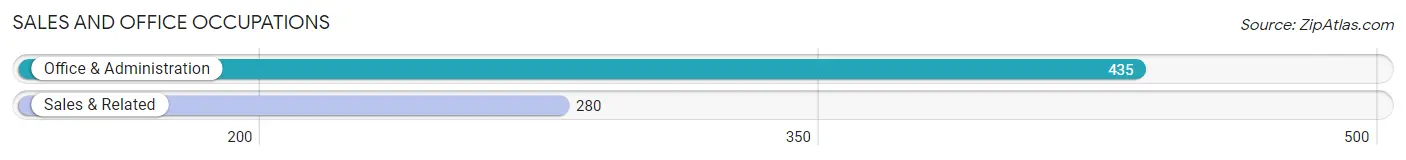
Sales and Office Occupations
The most common Sales and Office occupations in Bellmead are Office & Administration (435 | 10.7%), and Sales & Related (280 | 6.9%).
Sales and Office Occupations by Sex
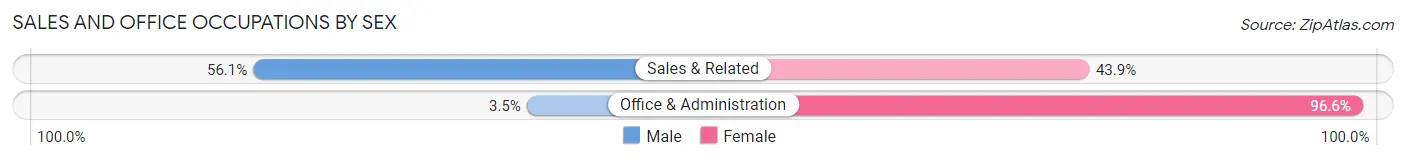
| Occupation | Male | Female |
| Sales & Related | 157 (56.1%) | 123 (43.9%) |
| Office & Administration | 15 (3.5%) | 420 (96.6%) |
| Total (Category) | 172 (24.1%) | 543 (75.9%) |
| Total (Overall) | 2,062 (50.8%) | 2,000 (49.2%) |
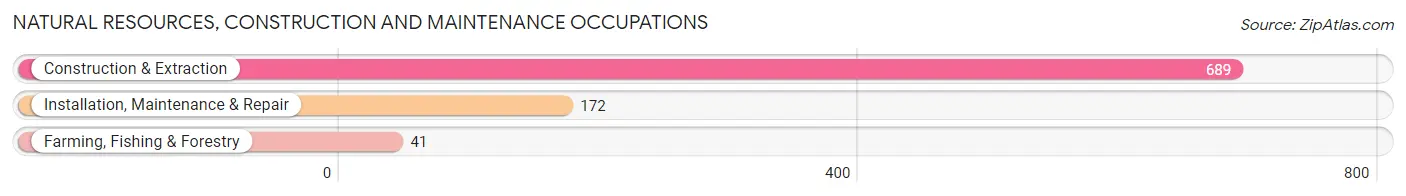
Natural Resources, Construction and Maintenance Occupations
The most common Natural Resources, Construction and Maintenance occupations in Bellmead are Construction & Extraction (689 | 17.0%), Installation, Maintenance & Repair (172 | 4.2%), and Farming, Fishing & Forestry (41 | 1.0%).
Natural Resources, Construction and Maintenance Occupations by Sex
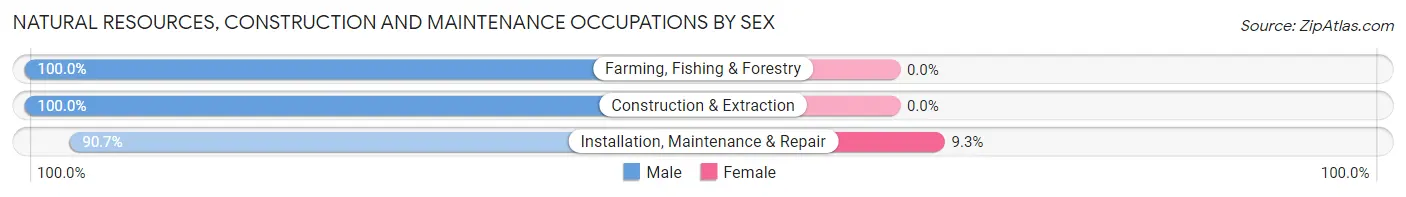
| Occupation | Male | Female |
| Farming, Fishing & Forestry | 41 (100.0%) | 0 (0.0%) |
| Construction & Extraction | 689 (100.0%) | 0 (0.0%) |
| Installation, Maintenance & Repair | 156 (90.7%) | 16 (9.3%) |
| Total (Category) | 886 (98.2%) | 16 (1.8%) |
| Total (Overall) | 2,062 (50.8%) | 2,000 (49.2%) |
Production, Transportation and Moving Occupations
The most common Production, Transportation and Moving occupations in Bellmead are Production (415 | 10.2%), Material Moving (244 | 6.0%), and Transportation (182 | 4.5%).
Production, Transportation and Moving Occupations by Sex
| Occupation | Male | Female |
| Production | 276 (66.5%) | 139 (33.5%) |
| Transportation | 95 (52.2%) | 87 (47.8%) |
| Material Moving | 100 (41.0%) | 144 (59.0%) |
| Total (Category) | 471 (56.0%) | 370 (44.0%) |
| Total (Overall) | 2,062 (50.8%) | 2,000 (49.2%) |
Employment Industries by Sex in Bellmead
Employment Industries in Bellmead
The major employment industries in Bellmead include Manufacturing (676 | 16.6%), Construction (647 | 15.9%), Health Care & Social Assistance (566 | 13.9%), Accommodation & Food Services (374 | 9.2%), and Educational Services (356 | 8.8%).
Employment Industries by Sex in Bellmead
The Bellmead industries that see more men than women are Agriculture, Fishing & Hunting (100.0%), Mining, Quarrying, & Extraction (100.0%), and Construction (97.5%), whereas the industries that tend to have a higher number of women are Utilities (100.0%), Real Estate, Rental & Leasing (100.0%), and Transportation & Warehousing (86.0%).
| Industry | Male | Female |
| Agriculture, Fishing & Hunting | 41 (100.0%) | 0 (0.0%) |
| Mining, Quarrying, & Extraction | 17 (100.0%) | 0 (0.0%) |
| Construction | 631 (97.5%) | 16 (2.5%) |
| Manufacturing | 502 (74.3%) | 174 (25.7%) |
| Wholesale Trade | 55 (88.7%) | 7 (11.3%) |
| Retail Trade | 183 (56.1%) | 143 (43.9%) |
| Transportation & Warehousing | 31 (14.0%) | 191 (86.0%) |
| Utilities | 0 (0.0%) | 29 (100.0%) |
| Information | 0 (0.0%) | 0 (0.0%) |
| Finance & Insurance | 16 (25.0%) | 48 (75.0%) |
| Real Estate, Rental & Leasing | 0 (0.0%) | 41 (100.0%) |
| Professional & Scientific | 15 (39.5%) | 23 (60.5%) |
| Enterprise Management | 0 (0.0%) | 0 (0.0%) |
| Administrative & Support | 115 (52.7%) | 103 (47.2%) |
| Educational Services | 60 (16.9%) | 296 (83.2%) |
| Health Care & Social Assistance | 109 (19.3%) | 457 (80.7%) |
| Arts, Entertainment & Recreation | 21 (75.0%) | 7 (25.0%) |
| Accommodation & Food Services | 139 (37.2%) | 235 (62.8%) |
| Public Administration | 72 (85.7%) | 12 (14.3%) |
| Total | 2,062 (50.8%) | 2,000 (49.2%) |
Education in Bellmead
School Enrollment in Bellmead
The most common levels of schooling among the 3,321 students in Bellmead are high school (1,103 | 33.2%), elementary school (823 | 24.8%), and middle school (756 | 22.8%).
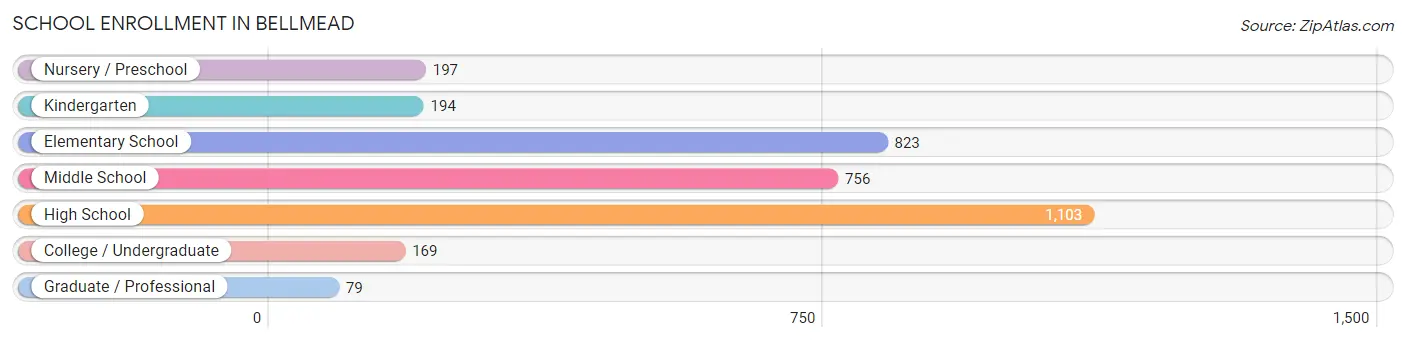
| School Level | # Students | % Students |
| Nursery / Preschool | 197 | 5.9% |
| Kindergarten | 194 | 5.8% |
| Elementary School | 823 | 24.8% |
| Middle School | 756 | 22.8% |
| High School | 1,103 | 33.2% |
| College / Undergraduate | 169 | 5.1% |
| Graduate / Professional | 79 | 2.4% |
| Total | 3,321 | 100.0% |
School Enrollment by Age by Funding Source in Bellmead
Out of a total of 3,321 students who are enrolled in schools in Bellmead, 27 (0.8%) attend a private institution, while the remaining 3,294 (99.2%) are enrolled in public schools. The age group of 20 to 24 year olds has the highest likelihood of being enrolled in private schools, with 26 (14.1% in the age bracket) enrolled. Conversely, the age group of 3 to 4 year olds has the lowest likelihood of being enrolled in a private school, with 163 (100.0% in the age bracket) attending a public institution.
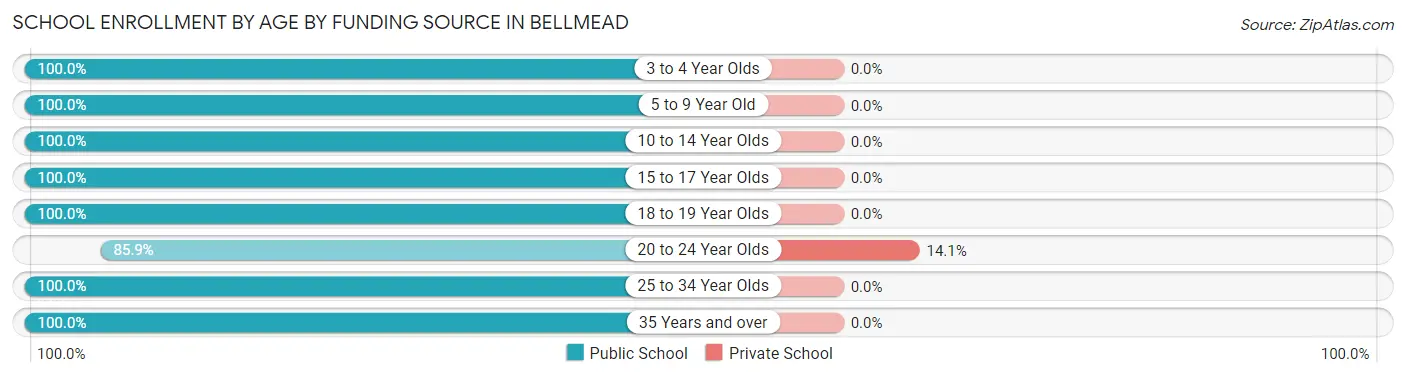
| Age Bracket | Public School | Private School |
| 3 to 4 Year Olds | 163 (100.0%) | 0 (0.0%) |
| 5 to 9 Year Old | 900 (100.0%) | 0 (0.0%) |
| 10 to 14 Year Olds | 1,012 (100.0%) | 0 (0.0%) |
| 15 to 17 Year Olds | 732 (100.0%) | 0 (0.0%) |
| 18 to 19 Year Olds | 206 (100.0%) | 0 (0.0%) |
| 20 to 24 Year Olds | 158 (85.9%) | 26 (14.1%) |
| 25 to 34 Year Olds | 45 (100.0%) | 0 (0.0%) |
| 35 Years and over | 79 (100.0%) | 0 (0.0%) |
| Total | 3,294 (99.2%) | 27 (0.8%) |
Educational Attainment by Field of Study in Bellmead
Science & technology (322 | 29.9%), education (179 | 16.7%), physical & health sciences (165 | 15.3%), liberal arts & history (117 | 10.9%), and business (82 | 7.6%) are the most common fields of study among 1,075 individuals in Bellmead who have obtained a bachelor's degree or higher.
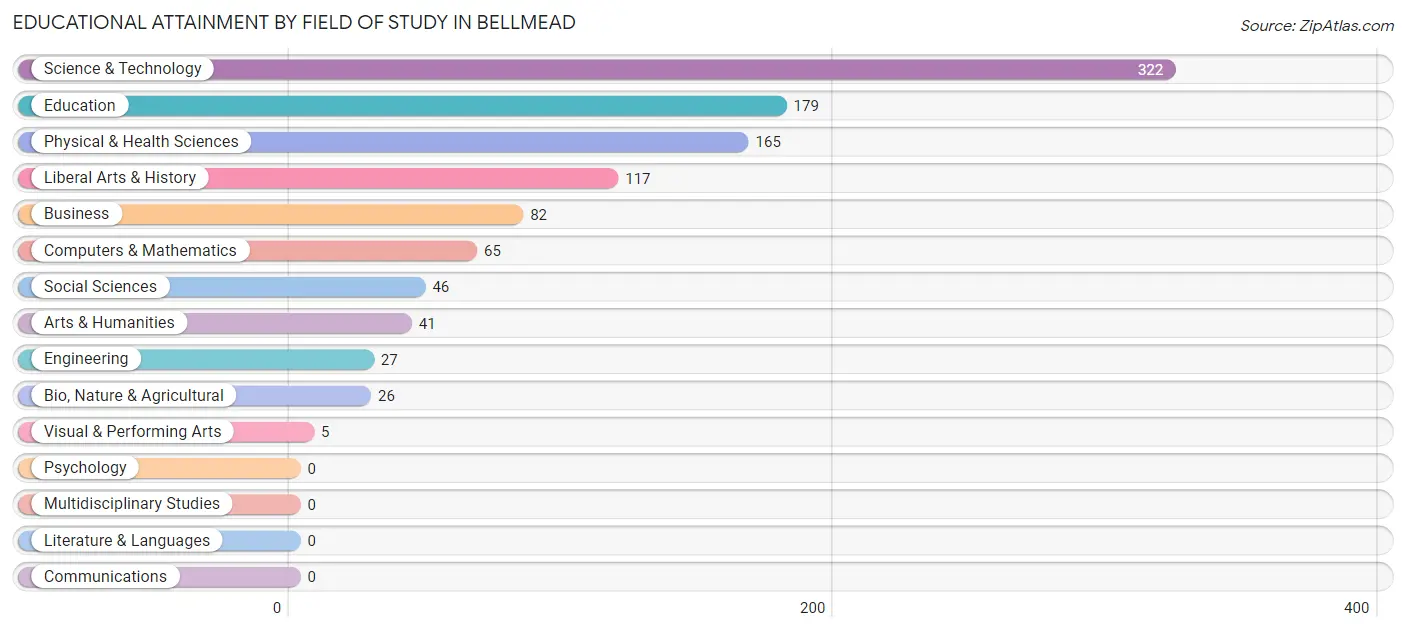
| Field of Study | # Graduates | % Graduates |
| Computers & Mathematics | 65 | 6.0% |
| Bio, Nature & Agricultural | 26 | 2.4% |
| Physical & Health Sciences | 165 | 15.3% |
| Psychology | 0 | 0.0% |
| Social Sciences | 46 | 4.3% |
| Engineering | 27 | 2.5% |
| Multidisciplinary Studies | 0 | 0.0% |
| Science & Technology | 322 | 29.9% |
| Business | 82 | 7.6% |
| Education | 179 | 16.7% |
| Literature & Languages | 0 | 0.0% |
| Liberal Arts & History | 117 | 10.9% |
| Visual & Performing Arts | 5 | 0.5% |
| Communications | 0 | 0.0% |
| Arts & Humanities | 41 | 3.8% |
| Total | 1,075 | 100.0% |
Transportation & Commute in Bellmead
Vehicle Availability by Sex in Bellmead
The most prevalent vehicle ownership categories in Bellmead are males with 3 vehicles (646, accounting for 31.3%) and females with 3 vehicles (656, making up 32.3%).
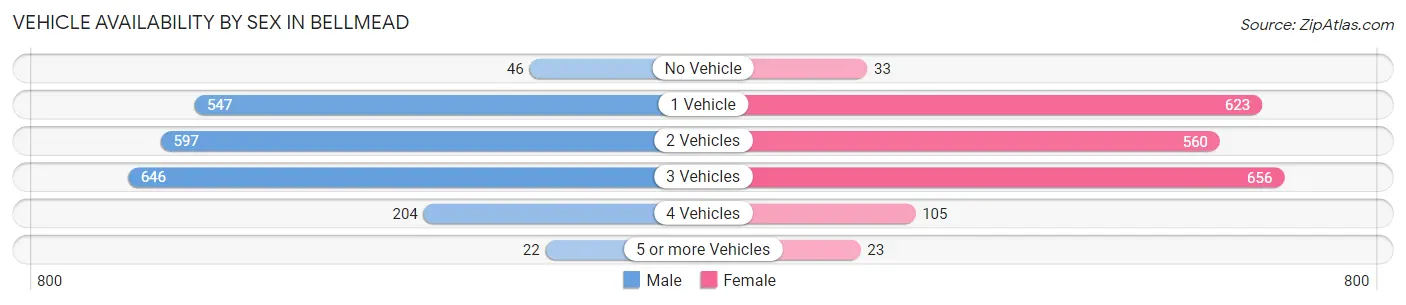
| Vehicles Available | Male | Female |
| No Vehicle | 46 (2.2%) | 33 (1.7%) |
| 1 Vehicle | 547 (26.5%) | 623 (31.1%) |
| 2 Vehicles | 597 (28.9%) | 560 (28.0%) |
| 3 Vehicles | 646 (31.3%) | 656 (32.8%) |
| 4 Vehicles | 204 (9.9%) | 105 (5.2%) |
| 5 or more Vehicles | 22 (1.1%) | 23 (1.1%) |
| Total | 2,062 (100.0%) | 2,000 (100.0%) |
Commute Time in Bellmead
The most frequently occuring commute durations in Bellmead are 20 to 24 minutes (676 commuters, 17.3%), 15 to 19 minutes (668 commuters, 17.1%), and 10 to 14 minutes (598 commuters, 15.3%).
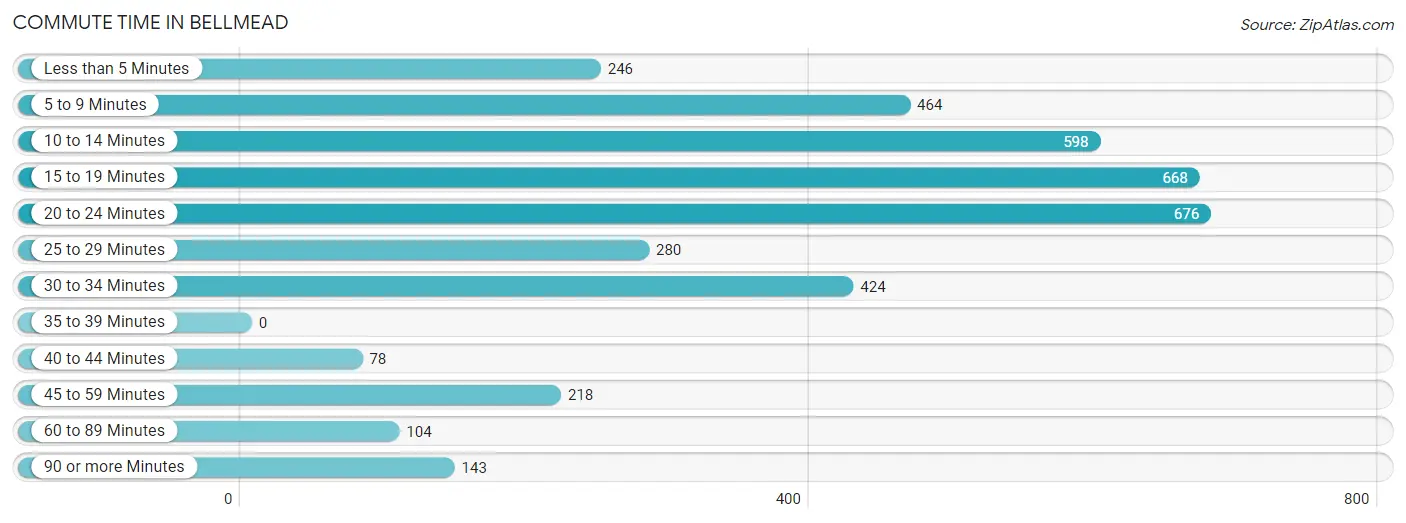
| Commute Time | # Commuters | % Commuters |
| Less than 5 Minutes | 246 | 6.3% |
| 5 to 9 Minutes | 464 | 11.9% |
| 10 to 14 Minutes | 598 | 15.3% |
| 15 to 19 Minutes | 668 | 17.1% |
| 20 to 24 Minutes | 676 | 17.3% |
| 25 to 29 Minutes | 280 | 7.2% |
| 30 to 34 Minutes | 424 | 10.9% |
| 35 to 39 Minutes | 0 | 0.0% |
| 40 to 44 Minutes | 78 | 2.0% |
| 45 to 59 Minutes | 218 | 5.6% |
| 60 to 89 Minutes | 104 | 2.7% |
| 90 or more Minutes | 143 | 3.7% |
Commute Time by Sex in Bellmead
The most common commute times in Bellmead are 20 to 24 minutes (368 commuters, 18.5%) for males and 15 to 19 minutes (377 commuters, 19.7%) for females.
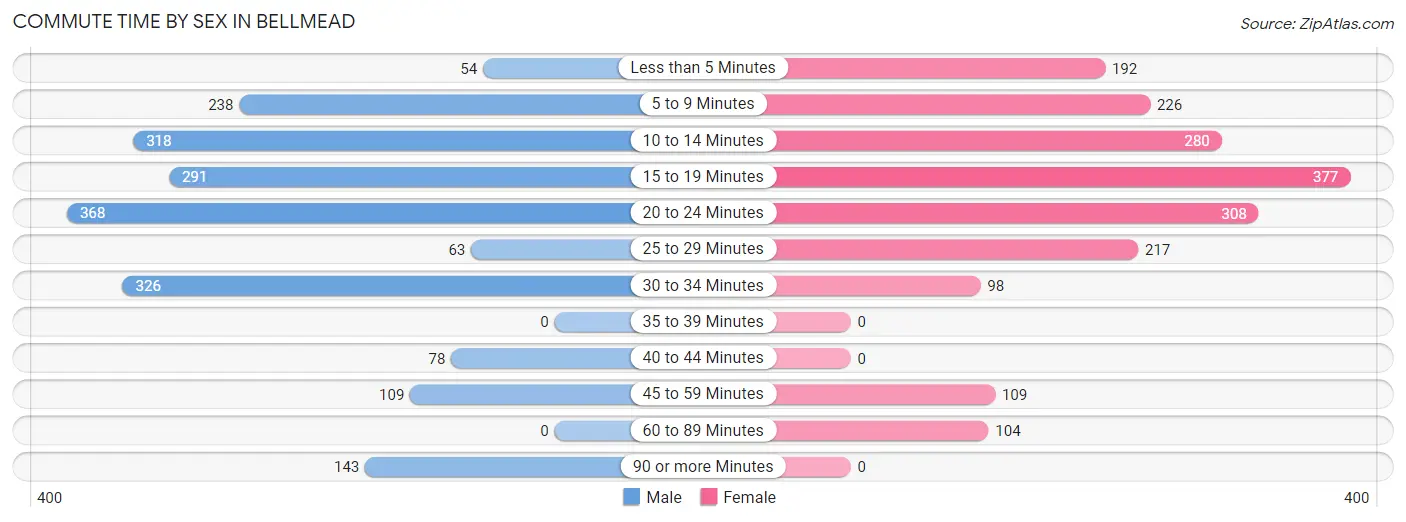
| Commute Time | Male | Female |
| Less than 5 Minutes | 54 (2.7%) | 192 (10.1%) |
| 5 to 9 Minutes | 238 (12.0%) | 226 (11.8%) |
| 10 to 14 Minutes | 318 (16.0%) | 280 (14.6%) |
| 15 to 19 Minutes | 291 (14.6%) | 377 (19.7%) |
| 20 to 24 Minutes | 368 (18.5%) | 308 (16.1%) |
| 25 to 29 Minutes | 63 (3.2%) | 217 (11.4%) |
| 30 to 34 Minutes | 326 (16.4%) | 98 (5.1%) |
| 35 to 39 Minutes | 0 (0.0%) | 0 (0.0%) |
| 40 to 44 Minutes | 78 (3.9%) | 0 (0.0%) |
| 45 to 59 Minutes | 109 (5.5%) | 109 (5.7%) |
| 60 to 89 Minutes | 0 (0.0%) | 104 (5.4%) |
| 90 or more Minutes | 143 (7.2%) | 0 (0.0%) |
Time of Departure to Work by Sex in Bellmead
The most frequent times of departure to work in Bellmead are 7:00 AM to 7:29 AM (322, 16.2%) for males and 7:30 AM to 7:59 AM (462, 24.2%) for females.
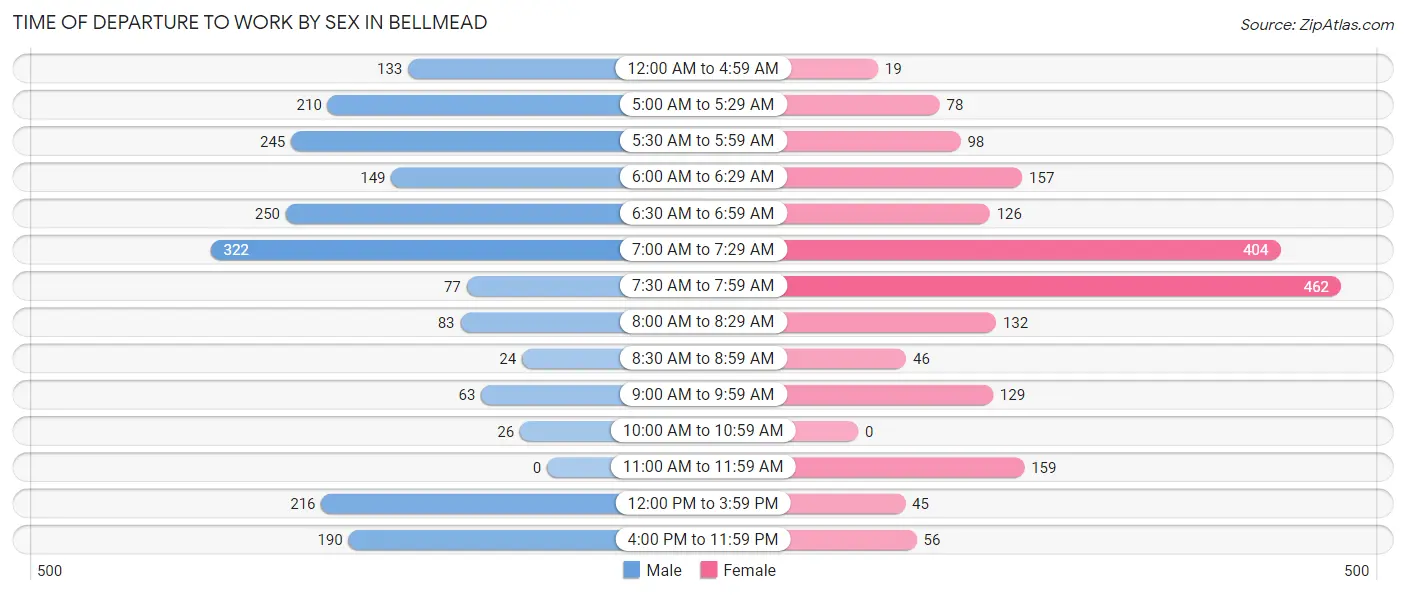
| Time of Departure | Male | Female |
| 12:00 AM to 4:59 AM | 133 (6.7%) | 19 (1.0%) |
| 5:00 AM to 5:29 AM | 210 (10.6%) | 78 (4.1%) |
| 5:30 AM to 5:59 AM | 245 (12.3%) | 98 (5.1%) |
| 6:00 AM to 6:29 AM | 149 (7.5%) | 157 (8.2%) |
| 6:30 AM to 6:59 AM | 250 (12.6%) | 126 (6.6%) |
| 7:00 AM to 7:29 AM | 322 (16.2%) | 404 (21.1%) |
| 7:30 AM to 7:59 AM | 77 (3.9%) | 462 (24.2%) |
| 8:00 AM to 8:29 AM | 83 (4.2%) | 132 (6.9%) |
| 8:30 AM to 8:59 AM | 24 (1.2%) | 46 (2.4%) |
| 9:00 AM to 9:59 AM | 63 (3.2%) | 129 (6.8%) |
| 10:00 AM to 10:59 AM | 26 (1.3%) | 0 (0.0%) |
| 11:00 AM to 11:59 AM | 0 (0.0%) | 159 (8.3%) |
| 12:00 PM to 3:59 PM | 216 (10.9%) | 45 (2.4%) |
| 4:00 PM to 11:59 PM | 190 (9.6%) | 56 (2.9%) |
| Total | 1,988 (100.0%) | 1,911 (100.0%) |
Housing Occupancy in Bellmead
Occupancy by Ownership in Bellmead
Of the total 3,558 dwellings in Bellmead, owner-occupied units account for 2,007 (56.4%), while renter-occupied units make up 1,551 (43.6%).
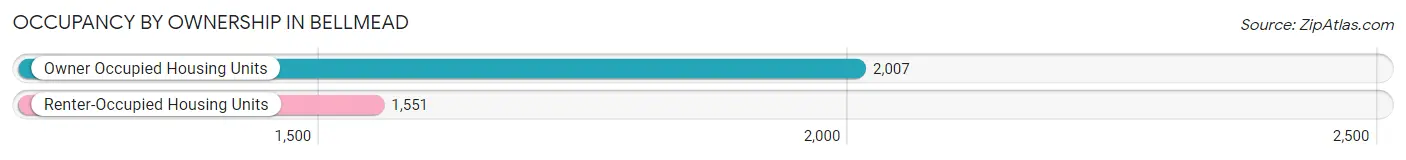
| Occupancy | # Housing Units | % Housing Units |
| Owner Occupied Housing Units | 2,007 | 56.4% |
| Renter-Occupied Housing Units | 1,551 | 43.6% |
| Total Occupied Housing Units | 3,558 | 100.0% |
Occupancy by Household Size in Bellmead
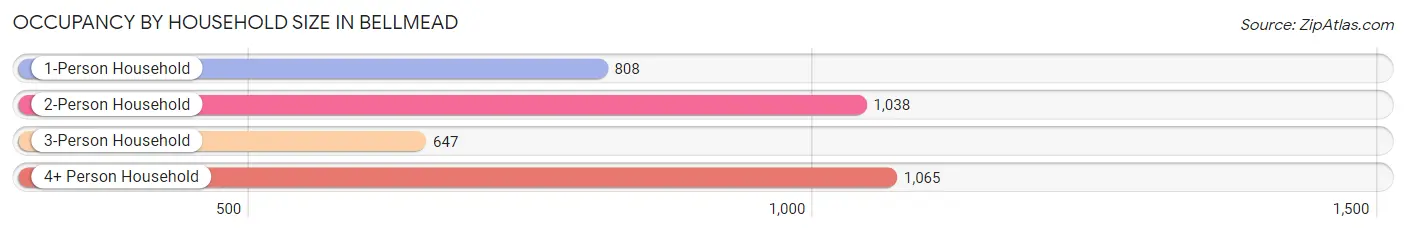
| Household Size | # Housing Units | % Housing Units |
| 1-Person Household | 808 | 22.7% |
| 2-Person Household | 1,038 | 29.2% |
| 3-Person Household | 647 | 18.2% |
| 4+ Person Household | 1,065 | 29.9% |
| Total Housing Units | 3,558 | 100.0% |
Occupancy by Ownership by Household Size in Bellmead
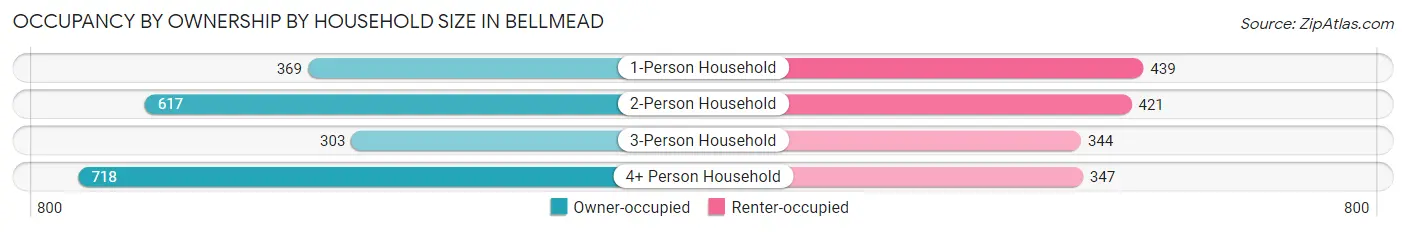
| Household Size | Owner-occupied | Renter-occupied |
| 1-Person Household | 369 (45.7%) | 439 (54.3%) |
| 2-Person Household | 617 (59.4%) | 421 (40.6%) |
| 3-Person Household | 303 (46.8%) | 344 (53.2%) |
| 4+ Person Household | 718 (67.4%) | 347 (32.6%) |
| Total Housing Units | 2,007 (56.4%) | 1,551 (43.6%) |
Occupancy by Educational Attainment in Bellmead
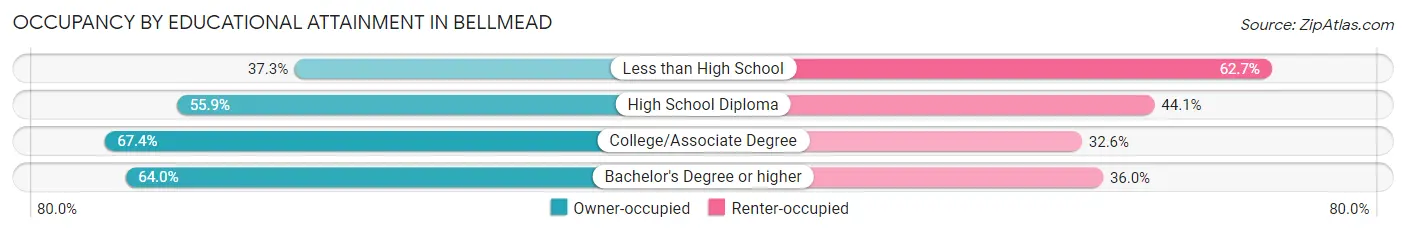
| Household Size | Owner-occupied | Renter-occupied |
| Less than High School | 319 (37.3%) | 537 (62.7%) |
| High School Diploma | 538 (55.9%) | 425 (44.1%) |
| College/Associate Degree | 737 (67.4%) | 357 (32.6%) |
| Bachelor's Degree or higher | 413 (64.0%) | 232 (36.0%) |
Occupancy by Age of Householder in Bellmead
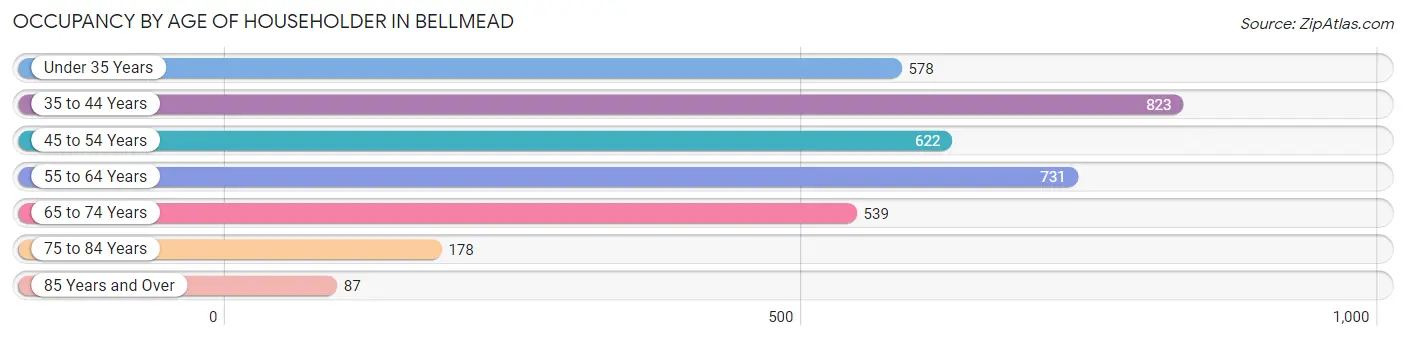
| Age Bracket | # Households | % Households |
| Under 35 Years | 578 | 16.3% |
| 35 to 44 Years | 823 | 23.1% |
| 45 to 54 Years | 622 | 17.5% |
| 55 to 64 Years | 731 | 20.5% |
| 65 to 74 Years | 539 | 15.1% |
| 75 to 84 Years | 178 | 5.0% |
| 85 Years and Over | 87 | 2.5% |
| Total | 3,558 | 100.0% |
Housing Finances in Bellmead
Median Income by Occupancy in Bellmead
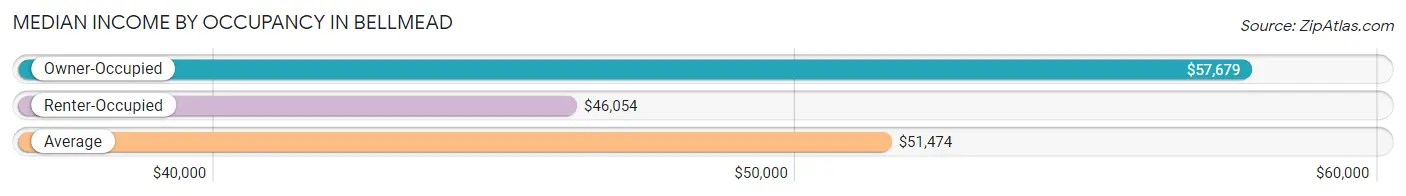
| Occupancy Type | # Households | Median Income |
| Owner-Occupied | 2,007 (56.4%) | $57,679 |
| Renter-Occupied | 1,551 (43.6%) | $46,054 |
| Average | 3,558 (100.0%) | $51,474 |
Occupancy by Householder Income Bracket in Bellmead
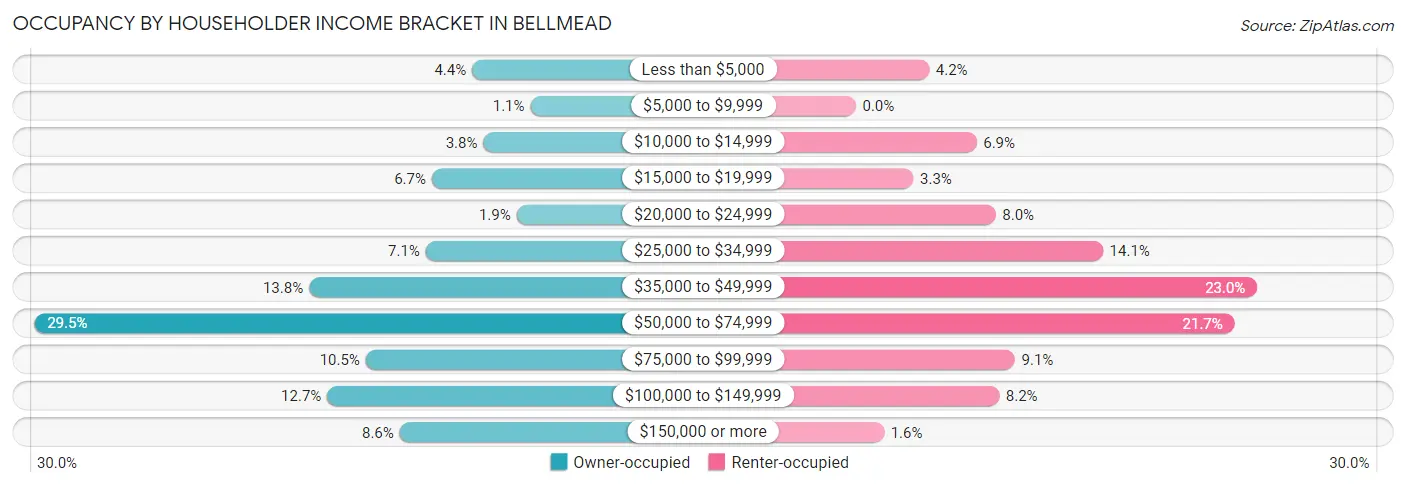
| Income Bracket | Owner-occupied | Renter-occupied |
| Less than $5,000 | 89 (4.4%) | 65 (4.2%) |
| $5,000 to $9,999 | 22 (1.1%) | 0 (0.0%) |
| $10,000 to $14,999 | 76 (3.8%) | 107 (6.9%) |
| $15,000 to $19,999 | 135 (6.7%) | 51 (3.3%) |
| $20,000 to $24,999 | 38 (1.9%) | 124 (8.0%) |
| $25,000 to $34,999 | 142 (7.1%) | 219 (14.1%) |
| $35,000 to $49,999 | 276 (13.8%) | 356 (23.0%) |
| $50,000 to $74,999 | 591 (29.4%) | 336 (21.7%) |
| $75,000 to $99,999 | 211 (10.5%) | 141 (9.1%) |
| $100,000 to $149,999 | 255 (12.7%) | 127 (8.2%) |
| $150,000 or more | 172 (8.6%) | 25 (1.6%) |
| Total | 2,007 (100.0%) | 1,551 (100.0%) |
Monthly Housing Cost Tiers in Bellmead
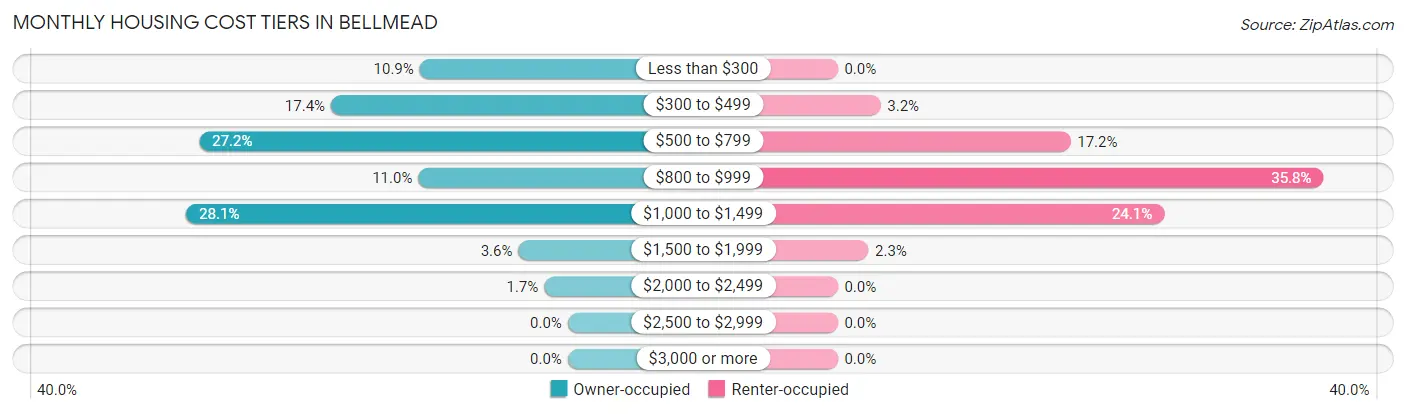
| Monthly Cost | Owner-occupied | Renter-occupied |
| Less than $300 | 219 (10.9%) | 0 (0.0%) |
| $300 to $499 | 350 (17.4%) | 49 (3.2%) |
| $500 to $799 | 545 (27.2%) | 266 (17.2%) |
| $800 to $999 | 221 (11.0%) | 555 (35.8%) |
| $1,000 to $1,499 | 564 (28.1%) | 373 (24.0%) |
| $1,500 to $1,999 | 73 (3.6%) | 35 (2.3%) |
| $2,000 to $2,499 | 35 (1.7%) | 0 (0.0%) |
| $2,500 to $2,999 | 0 (0.0%) | 0 (0.0%) |
| $3,000 or more | 0 (0.0%) | 0 (0.0%) |
| Total | 2,007 (100.0%) | 1,551 (100.0%) |
Physical Housing Characteristics in Bellmead
Housing Structures in Bellmead
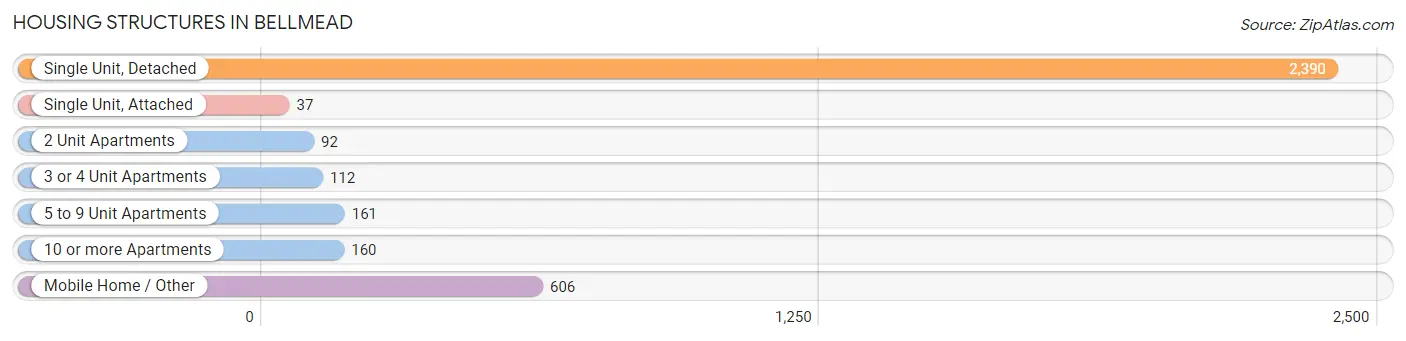
| Structure Type | # Housing Units | % Housing Units |
| Single Unit, Detached | 2,390 | 67.2% |
| Single Unit, Attached | 37 | 1.0% |
| 2 Unit Apartments | 92 | 2.6% |
| 3 or 4 Unit Apartments | 112 | 3.2% |
| 5 to 9 Unit Apartments | 161 | 4.5% |
| 10 or more Apartments | 160 | 4.5% |
| Mobile Home / Other | 606 | 17.0% |
| Total | 3,558 | 100.0% |
Housing Structures by Occupancy in Bellmead
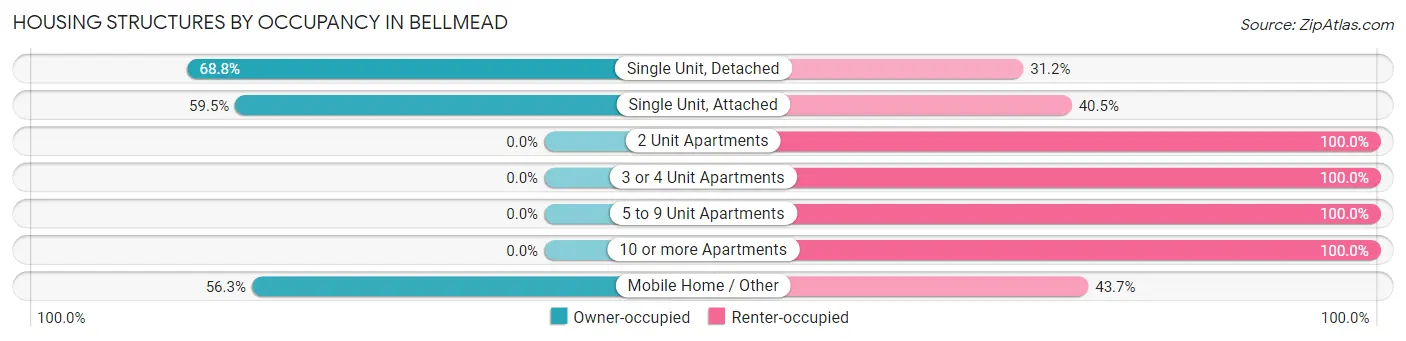
| Structure Type | Owner-occupied | Renter-occupied |
| Single Unit, Detached | 1,644 (68.8%) | 746 (31.2%) |
| Single Unit, Attached | 22 (59.5%) | 15 (40.5%) |
| 2 Unit Apartments | 0 (0.0%) | 92 (100.0%) |
| 3 or 4 Unit Apartments | 0 (0.0%) | 112 (100.0%) |
| 5 to 9 Unit Apartments | 0 (0.0%) | 161 (100.0%) |
| 10 or more Apartments | 0 (0.0%) | 160 (100.0%) |
| Mobile Home / Other | 341 (56.3%) | 265 (43.7%) |
| Total | 2,007 (56.4%) | 1,551 (43.6%) |
Housing Structures by Number of Rooms in Bellmead
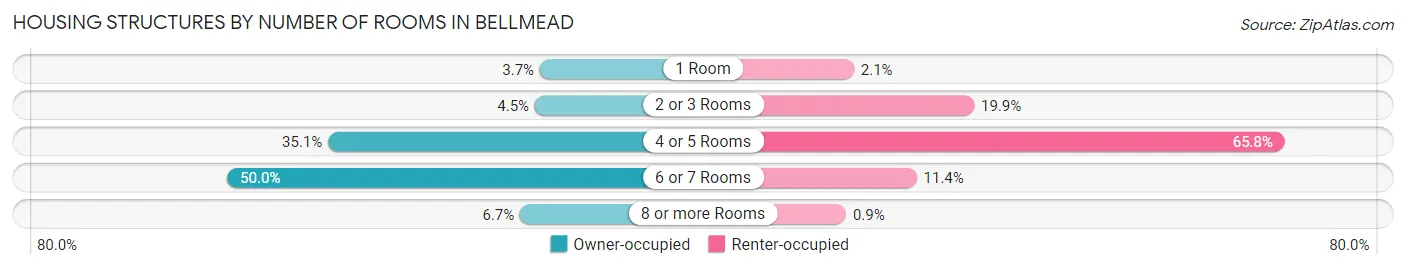
| Number of Rooms | Owner-occupied | Renter-occupied |
| 1 Room | 75 (3.7%) | 32 (2.1%) |
| 2 or 3 Rooms | 90 (4.5%) | 308 (19.9%) |
| 4 or 5 Rooms | 704 (35.1%) | 1,021 (65.8%) |
| 6 or 7 Rooms | 1,004 (50.0%) | 176 (11.4%) |
| 8 or more Rooms | 134 (6.7%) | 14 (0.9%) |
| Total | 2,007 (100.0%) | 1,551 (100.0%) |
Housing Structure by Heating Type in Bellmead
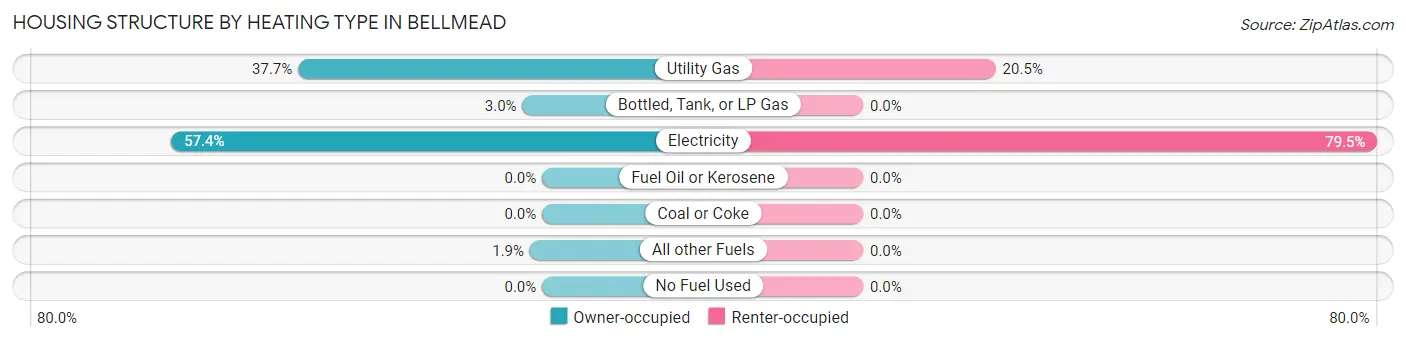
| Heating Type | Owner-occupied | Renter-occupied |
| Utility Gas | 757 (37.7%) | 318 (20.5%) |
| Bottled, Tank, or LP Gas | 61 (3.0%) | 0 (0.0%) |
| Electricity | 1,151 (57.4%) | 1,233 (79.5%) |
| Fuel Oil or Kerosene | 0 (0.0%) | 0 (0.0%) |
| Coal or Coke | 0 (0.0%) | 0 (0.0%) |
| All other Fuels | 38 (1.9%) | 0 (0.0%) |
| No Fuel Used | 0 (0.0%) | 0 (0.0%) |
| Total | 2,007 (100.0%) | 1,551 (100.0%) |
Household Vehicle Usage in Bellmead
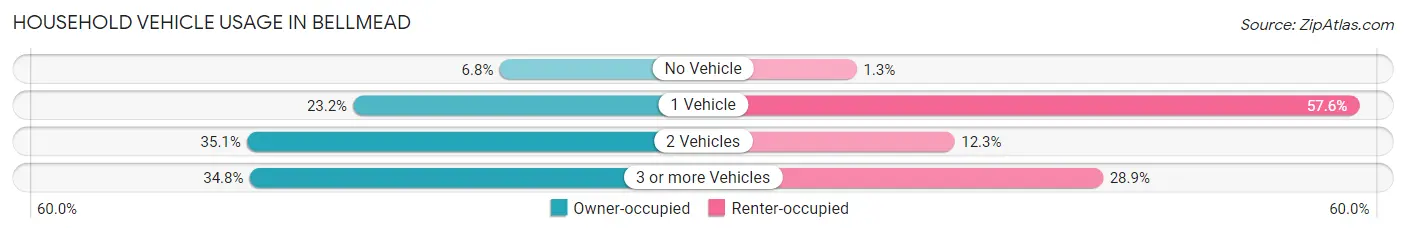
| Vehicles per Household | Owner-occupied | Renter-occupied |
| No Vehicle | 137 (6.8%) | 20 (1.3%) |
| 1 Vehicle | 466 (23.2%) | 893 (57.6%) |
| 2 Vehicles | 705 (35.1%) | 190 (12.2%) |
| 3 or more Vehicles | 699 (34.8%) | 448 (28.9%) |
| Total | 2,007 (100.0%) | 1,551 (100.0%) |
Real Estate & Mortgages in Bellmead
Real Estate and Mortgage Overview in Bellmead
| Characteristic | Without Mortgage | With Mortgage |
| Housing Units | 979 | 1,028 |
| Median Property Value | $85,800 | $123,500 |
| Median Household Income | $48,994 | $115 |
| Monthly Housing Costs | $471 | $0 |
| Real Estate Taxes | $1,351 | $206 |
Property Value by Mortgage Status in Bellmead
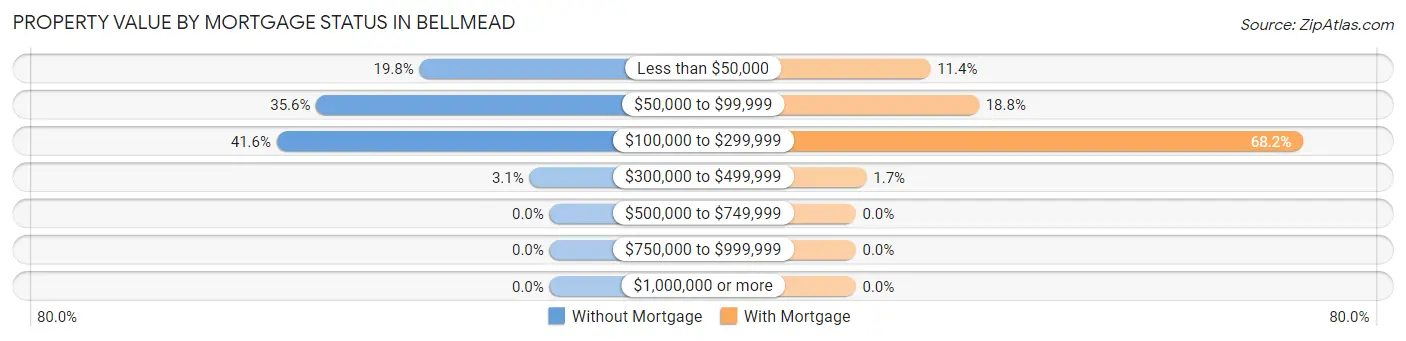
| Property Value | Without Mortgage | With Mortgage |
| Less than $50,000 | 194 (19.8%) | 117 (11.4%) |
| $50,000 to $99,999 | 348 (35.5%) | 193 (18.8%) |
| $100,000 to $299,999 | 407 (41.6%) | 701 (68.2%) |
| $300,000 to $499,999 | 30 (3.1%) | 17 (1.7%) |
| $500,000 to $749,999 | 0 (0.0%) | 0 (0.0%) |
| $750,000 to $999,999 | 0 (0.0%) | 0 (0.0%) |
| $1,000,000 or more | 0 (0.0%) | 0 (0.0%) |
| Total | 979 (100.0%) | 1,028 (100.0%) |
Household Income by Mortgage Status in Bellmead
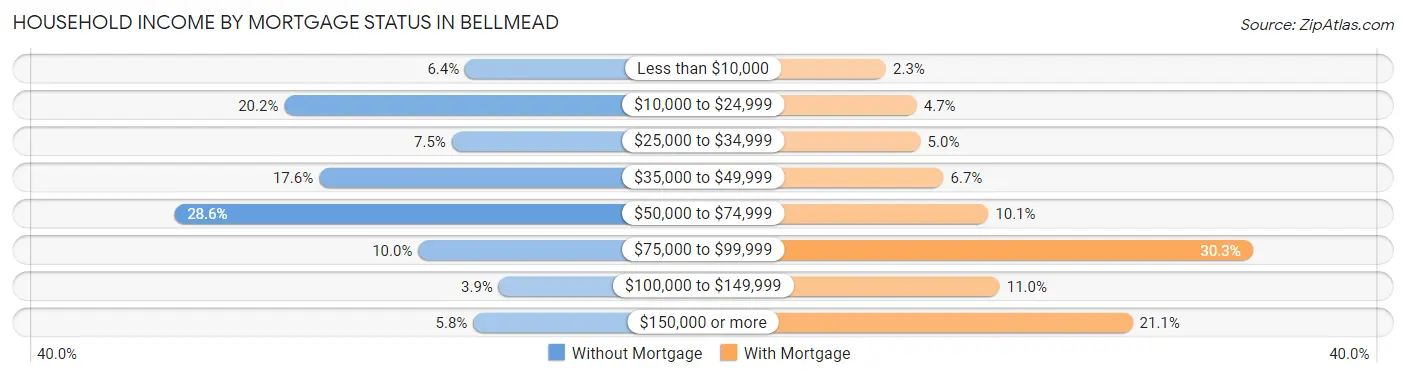
| Household Income | Without Mortgage | With Mortgage |
| Less than $10,000 | 63 (6.4%) | 24 (2.3%) |
| $10,000 to $24,999 | 198 (20.2%) | 48 (4.7%) |
| $25,000 to $34,999 | 73 (7.5%) | 51 (5.0%) |
| $35,000 to $49,999 | 172 (17.6%) | 69 (6.7%) |
| $50,000 to $74,999 | 280 (28.6%) | 104 (10.1%) |
| $75,000 to $99,999 | 98 (10.0%) | 311 (30.2%) |
| $100,000 to $149,999 | 38 (3.9%) | 113 (11.0%) |
| $150,000 or more | 57 (5.8%) | 217 (21.1%) |
| Total | 979 (100.0%) | 1,028 (100.0%) |
Property Value to Household Income Ratio in Bellmead
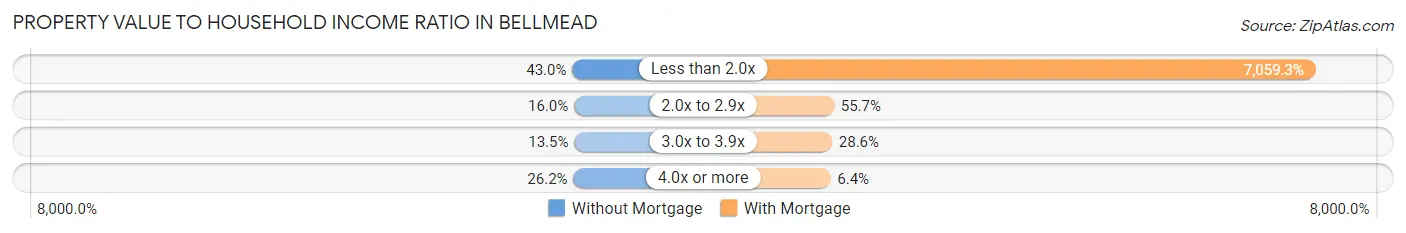
| Value-to-Income Ratio | Without Mortgage | With Mortgage |
| Less than 2.0x | 421 (43.0%) | 72,570 (7,059.3%) |
| 2.0x to 2.9x | 157 (16.0%) | 573 (55.7%) |
| 3.0x to 3.9x | 132 (13.5%) | 294 (28.6%) |
| 4.0x or more | 256 (26.2%) | 66 (6.4%) |
| Total | 979 (100.0%) | 1,028 (100.0%) |
Real Estate Taxes by Mortgage Status in Bellmead
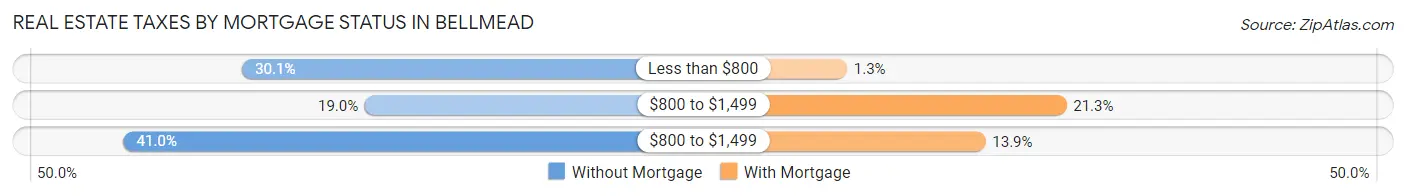
| Property Taxes | Without Mortgage | With Mortgage |
| Less than $800 | 295 (30.1%) | 13 (1.3%) |
| $800 to $1,499 | 186 (19.0%) | 219 (21.3%) |
| $800 to $1,499 | 401 (41.0%) | 143 (13.9%) |
| Total | 979 (100.0%) | 1,028 (100.0%) |
Health & Disability in Bellmead
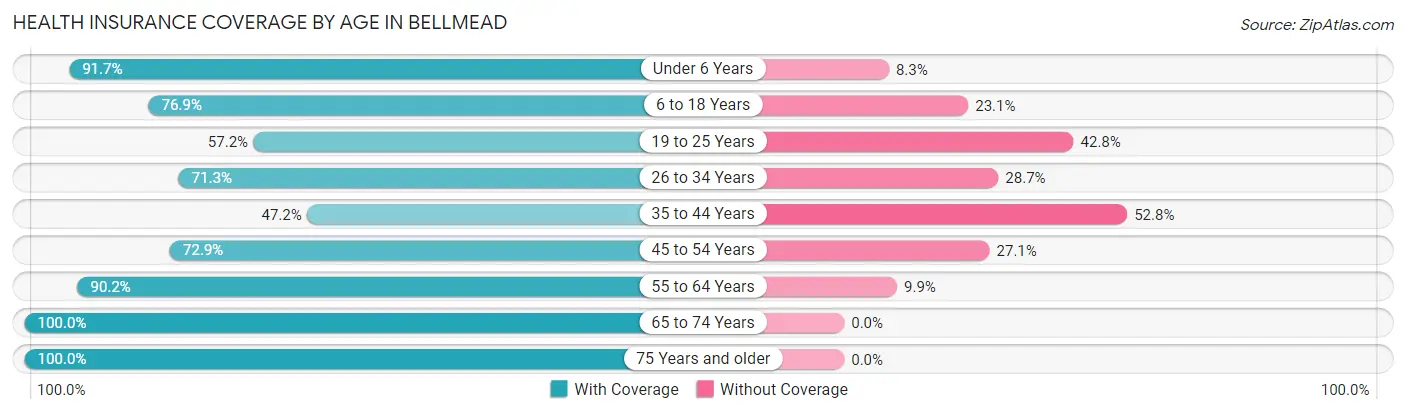
Health Insurance Coverage by Age in Bellmead
| Age Bracket | With Coverage | Without Coverage |
| Under 6 Years | 594 (91.7%) | 54 (8.3%) |
| 6 to 18 Years | 2,261 (76.9%) | 680 (23.1%) |
| 19 to 25 Years | 324 (57.2%) | 242 (42.8%) |
| 26 to 34 Years | 806 (71.3%) | 325 (28.7%) |
| 35 to 44 Years | 762 (47.2%) | 851 (52.8%) |
| 45 to 54 Years | 772 (72.9%) | 287 (27.1%) |
| 55 to 64 Years | 988 (90.1%) | 108 (9.9%) |
| 65 to 74 Years | 952 (100.0%) | 0 (0.0%) |
| 75 Years and older | 452 (100.0%) | 0 (0.0%) |
| Total | 7,911 (75.6%) | 2,547 (24.3%) |
Health Insurance Coverage by Citizenship Status in Bellmead
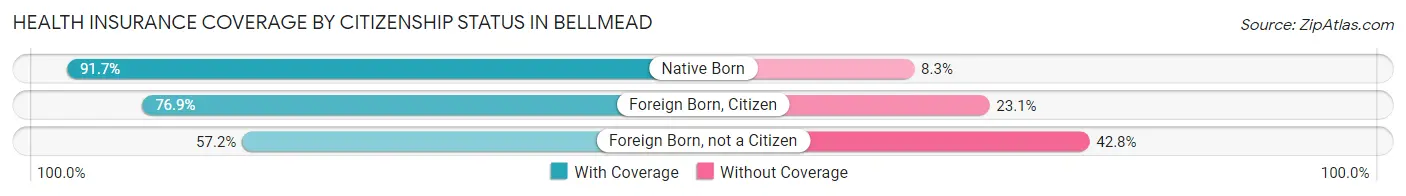
| Citizenship Status | With Coverage | Without Coverage |
| Native Born | 594 (91.7%) | 54 (8.3%) |
| Foreign Born, Citizen | 2,261 (76.9%) | 680 (23.1%) |
| Foreign Born, not a Citizen | 324 (57.2%) | 242 (42.8%) |
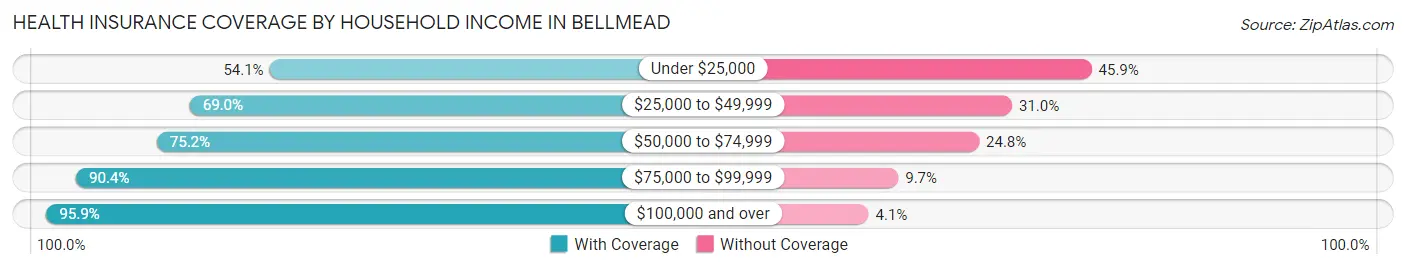
Health Insurance Coverage by Household Income in Bellmead
| Household Income | With Coverage | Without Coverage |
| Under $25,000 | 819 (54.1%) | 694 (45.9%) |
| $25,000 to $49,999 | 2,047 (69.0%) | 918 (31.0%) |
| $50,000 to $74,999 | 2,318 (75.2%) | 764 (24.8%) |
| $75,000 to $99,999 | 852 (90.3%) | 91 (9.7%) |
| $100,000 and over | 1,875 (95.9%) | 80 (4.1%) |
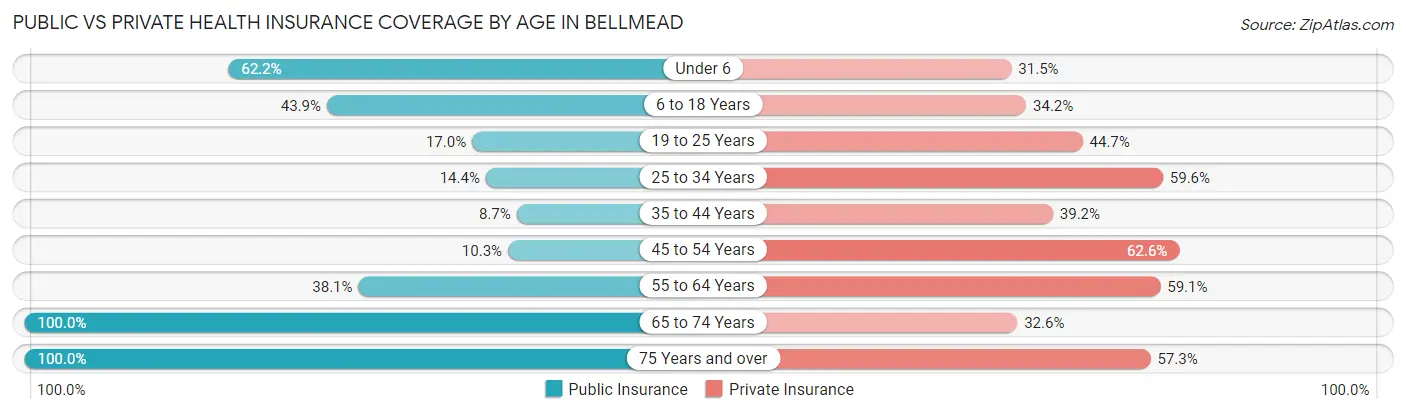
Public vs Private Health Insurance Coverage by Age in Bellmead
| Age Bracket | Public Insurance | Private Insurance |
| Under 6 | 403 (62.2%) | 204 (31.5%) |
| 6 to 18 Years | 1,291 (43.9%) | 1,006 (34.2%) |
| 19 to 25 Years | 96 (17.0%) | 253 (44.7%) |
| 25 to 34 Years | 163 (14.4%) | 674 (59.6%) |
| 35 to 44 Years | 140 (8.7%) | 632 (39.2%) |
| 45 to 54 Years | 109 (10.3%) | 663 (62.6%) |
| 55 to 64 Years | 417 (38.1%) | 648 (59.1%) |
| 65 to 74 Years | 952 (100.0%) | 310 (32.6%) |
| 75 Years and over | 452 (100.0%) | 259 (57.3%) |
| Total | 4,023 (38.5%) | 4,649 (44.5%) |
Disability Status by Sex by Age in Bellmead
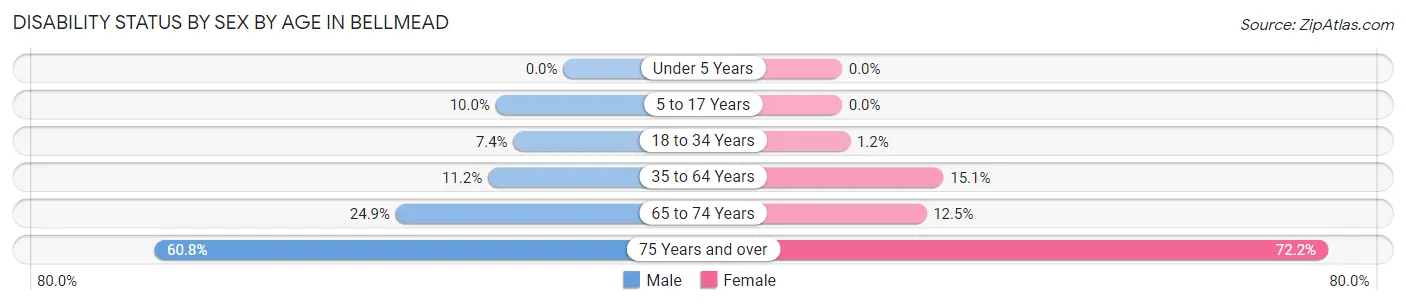
| Age Bracket | Male | Female |
| Under 5 Years | 0 (0.0%) | 0 (0.0%) |
| 5 to 17 Years | 165 (10.0%) | 0 (0.0%) |
| 18 to 34 Years | 67 (7.4%) | 13 (1.2%) |
| 35 to 64 Years | 198 (11.2%) | 301 (15.1%) |
| 65 to 74 Years | 96 (24.9%) | 71 (12.5%) |
| 75 Years and over | 124 (60.8%) | 179 (72.2%) |
Disability Class by Sex by Age in Bellmead
Disability Class: Hearing Difficulty
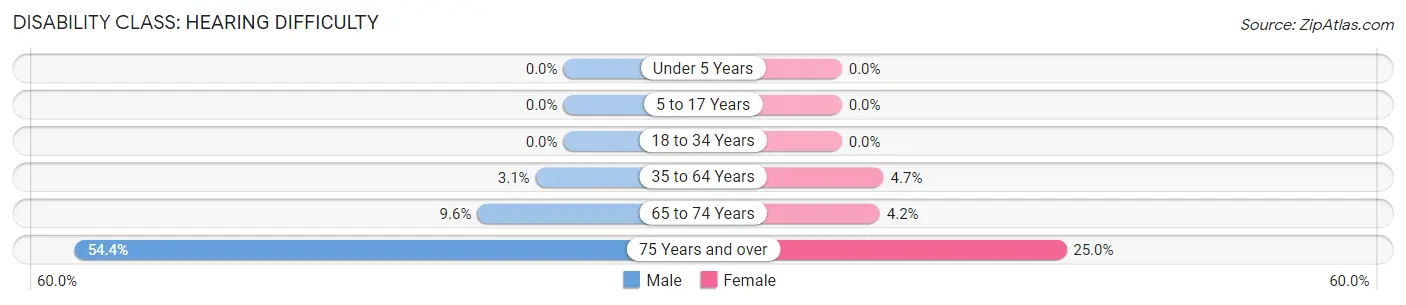
| Age Bracket | Male | Female |
| Under 5 Years | 0 (0.0%) | 0 (0.0%) |
| 5 to 17 Years | 0 (0.0%) | 0 (0.0%) |
| 18 to 34 Years | 0 (0.0%) | 0 (0.0%) |
| 35 to 64 Years | 55 (3.1%) | 93 (4.7%) |
| 65 to 74 Years | 37 (9.6%) | 24 (4.2%) |
| 75 Years and over | 111 (54.4%) | 62 (25.0%) |
Disability Class: Vision Difficulty
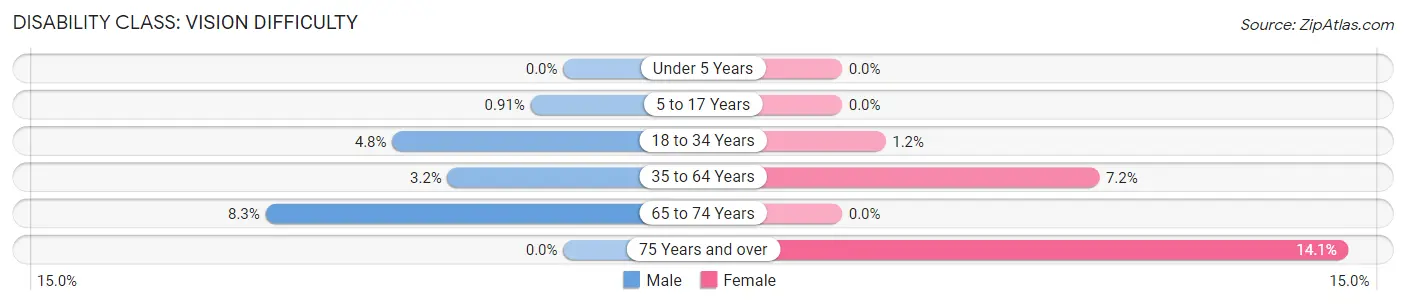
| Age Bracket | Male | Female |
| Under 5 Years | 0 (0.0%) | 0 (0.0%) |
| 5 to 17 Years | 15 (0.9%) | 0 (0.0%) |
| 18 to 34 Years | 43 (4.8%) | 13 (1.2%) |
| 35 to 64 Years | 57 (3.2%) | 143 (7.2%) |
| 65 to 74 Years | 32 (8.3%) | 0 (0.0%) |
| 75 Years and over | 0 (0.0%) | 35 (14.1%) |
Disability Class: Cognitive Difficulty
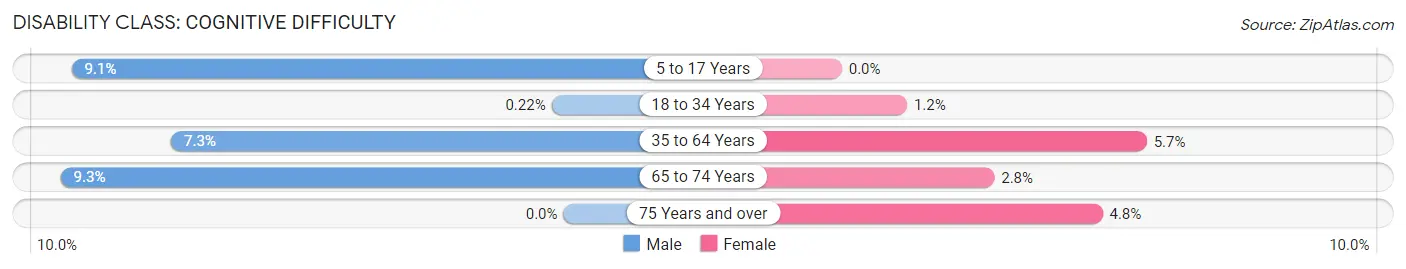
| Age Bracket | Male | Female |
| 5 to 17 Years | 150 (9.1%) | 0 (0.0%) |
| 18 to 34 Years | 2 (0.2%) | 13 (1.2%) |
| 35 to 64 Years | 129 (7.3%) | 113 (5.7%) |
| 65 to 74 Years | 36 (9.3%) | 16 (2.8%) |
| 75 Years and over | 0 (0.0%) | 12 (4.8%) |
Disability Class: Ambulatory Difficulty
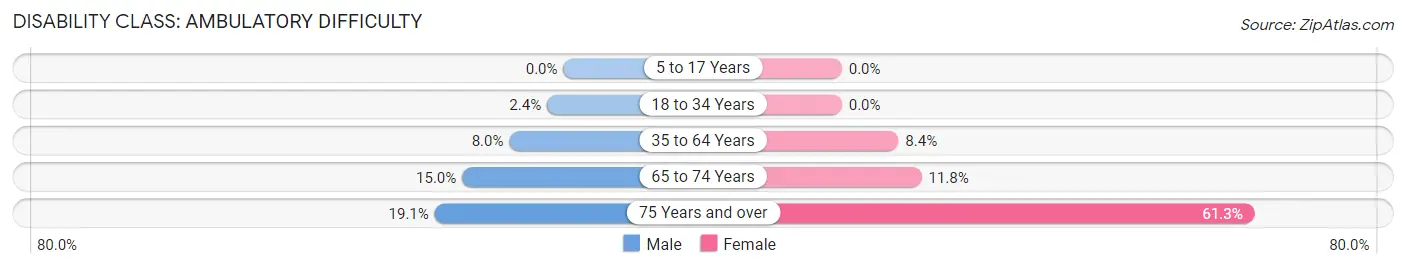
| Age Bracket | Male | Female |
| 5 to 17 Years | 0 (0.0%) | 0 (0.0%) |
| 18 to 34 Years | 22 (2.4%) | 0 (0.0%) |
| 35 to 64 Years | 142 (8.0%) | 168 (8.4%) |
| 65 to 74 Years | 58 (15.0%) | 67 (11.8%) |
| 75 Years and over | 39 (19.1%) | 152 (61.3%) |
Disability Class: Self-Care Difficulty
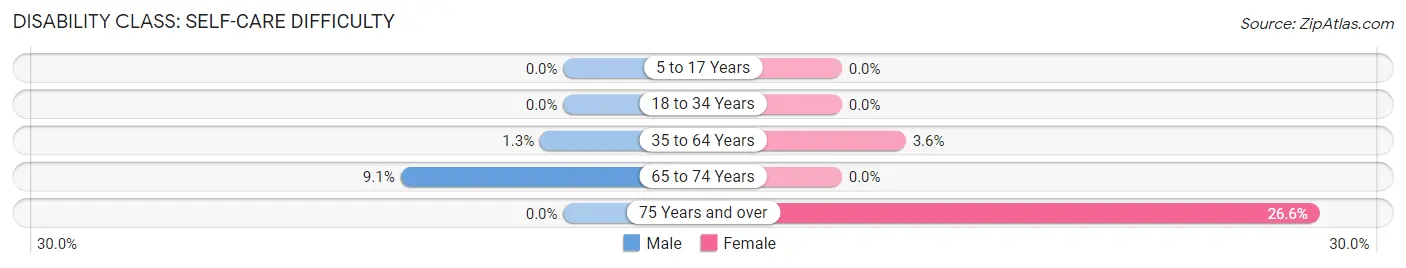
| Age Bracket | Male | Female |
| 5 to 17 Years | 0 (0.0%) | 0 (0.0%) |
| 18 to 34 Years | 0 (0.0%) | 0 (0.0%) |
| 35 to 64 Years | 23 (1.3%) | 71 (3.6%) |
| 65 to 74 Years | 35 (9.1%) | 0 (0.0%) |
| 75 Years and over | 0 (0.0%) | 66 (26.6%) |
Technology Access in Bellmead
Computing Device Access in Bellmead
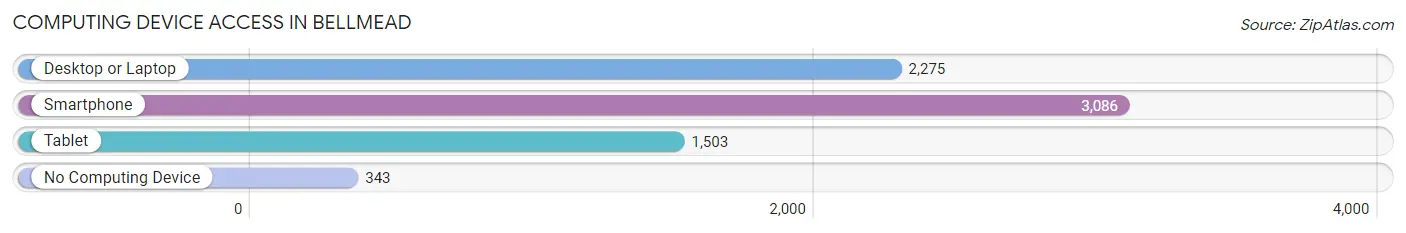
| Device Type | # Households | % Households |
| Desktop or Laptop | 2,275 | 63.9% |
| Smartphone | 3,086 | 86.7% |
| Tablet | 1,503 | 42.2% |
| No Computing Device | 343 | 9.6% |
| Total | 3,558 | 100.0% |
Internet Access in Bellmead
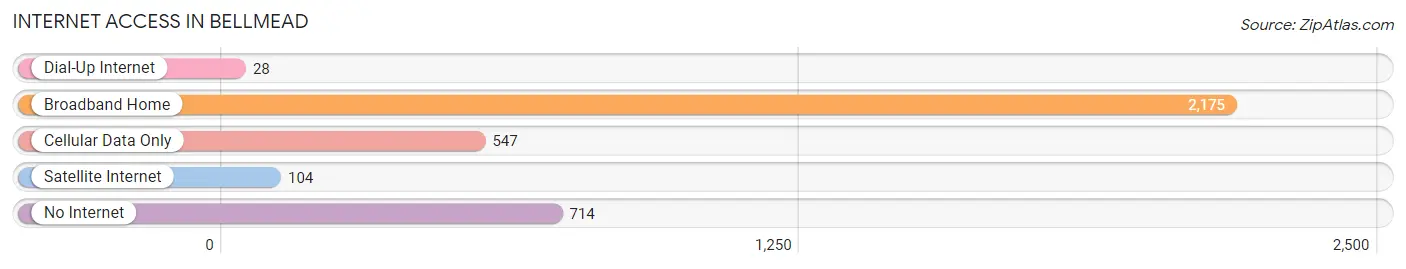
| Internet Type | # Households | % Households |
| Dial-Up Internet | 28 | 0.8% |
| Broadband Home | 2,175 | 61.1% |
| Cellular Data Only | 547 | 15.4% |
| Satellite Internet | 104 | 2.9% |
| No Internet | 714 | 20.1% |
| Total | 3,558 | 100.0% |
Bellmead Summary
Measured by population, Bellmead, Texas is a small city located in McLennan County, Texas. It is part of the Waco Metropolitan Statistical Area and is located just north of Waco. The city was founded in 1881 and has a population of approximately 8,000 people.
History
Bellmead, Texas was founded in 1881 by a group of settlers from Bell County, Texas. The city was named after the Bell family, who were among the first settlers in the area. The city was originally a farming community, but it soon developed into a small industrial center. The city was incorporated in 1891 and was home to several businesses, including a cotton gin, a grist mill, and a blacksmith shop.
In the early 1900s, the city began to grow rapidly. The population increased from just over 500 in 1900 to over 1,000 by 1910. The city was home to several businesses, including a cotton gin, a grist mill, and a blacksmith shop. The city also had a school, a post office, and a bank.
In the 1920s, the city experienced a period of growth and development. The population increased to over 2,000 by 1930. The city was home to several businesses, including a cotton gin, a grist mill, and a blacksmith shop. The city also had a school, a post office, and a bank.
In the 1940s, the city experienced a period of decline. The population decreased to just over 1,000 by 1950. The city was home to several businesses, including a cotton gin, a grist mill, and a blacksmith shop. The city also had a school, a post office, and a bank.
In the 1950s, the city experienced a period of growth and development. The population increased to over 2,000 by 1960. The city was home to several businesses, including a cotton gin, a grist mill, and a blacksmith shop. The city also had a school, a post office, and a bank.
In the 1960s, the city experienced a period of decline. The population decreased to just over 1,000 by 1970. The city was home to several businesses, including a cotton gin, a grist mill, and a blacksmith shop. The city also had a school, a post office, and a bank.
In the 1970s, the city experienced a period of growth and development. The population increased to over 2,000 by 1980. The city was home to several businesses, including a cotton gin, a grist mill, and a blacksmith shop. The city also had a school, a post office, and a bank.
In the 1980s, the city experienced a period of decline. The population decreased to just over 1,000 by 1990. The city was home to several businesses, including a cotton gin, a grist mill, and a blacksmith shop. The city also had a school, a post office, and a bank.
In the 1990s, the city experienced a period of growth and development. The population increased to over 8,000 by 2000. The city was home to several businesses, including a cotton gin, a grist mill, and a blacksmith shop. The city also had a school, a post office, and a bank.
Geography
Bellmead is located in McLennan County, Texas, just north of Waco. The city is situated on the Brazos River and is surrounded by rolling hills and wooded areas. The city has a total area of 4.2 square miles, all of which is land. The city has a humid subtropical climate, with hot summers and mild winters.
Economy
The economy of Bellmead is largely based on agriculture and manufacturing. The city is home to several businesses, including a cotton gin, a grist mill, and a blacksmith shop. The city also has a school, a post office, and a bank.
The city is also home to several manufacturing companies, including a plastics manufacturer, a metal fabricator, and a food processing plant. The city is also home to several retail stores, including a grocery store, a hardware store, and a clothing store.
Demographics
As of the 2010 census, the population of Bellmead was 8,098. The racial makeup of the city was 73.3% White, 17.2% African American, 0.5% Native American, 0.7% Asian, 0.1% Pacific Islander, 6.2% from other races, and 2.1% from two or more races. Hispanic or Latino of any race were 15.3% of the population.
The median income for a household in the city was $35,938, and the median income for a family was $41,944. The per capita income for the city was $17,845. About 17.2% of families and 20.3% of the population were below the poverty line, including 28.3% of those under age 18 and 11.2% of those age 65 or over.
Common Questions
What is Per Capita Income in Bellmead?
Per Capita income in Bellmead is $23,074.
What is the Median Family Income in Bellmead?
Median Family Income in Bellmead is $52,282.
What is the Median Household income in Bellmead?
Median Household Income in Bellmead is $51,474.
What is Income or Wage Gap in Bellmead?
Income or Wage Gap in Bellmead is 35.0%.
Women in Bellmead earn 65.0 cents for every dollar earned by a man.
What is Family Income Deficit in Bellmead?
Family Income Deficit in Bellmead is $12,403.
Families that are below poverty line in Bellmead earn $12,403 less on average than the poverty threshold level.
What is Inequality or Gini Index in Bellmead?
Inequality or Gini Index in Bellmead is 0.44.
What is the Total Population of Bellmead?
Total Population of Bellmead is 10,480.
What is the Total Male Population of Bellmead?
Total Male Population of Bellmead is 5,227.
What is the Total Female Population of Bellmead?
Total Female Population of Bellmead is 5,253.
What is the Ratio of Males per 100 Females in Bellmead?
There are 99.51 Males per 100 Females in Bellmead.
What is the Ratio of Females per 100 Males in Bellmead?
There are 100.50 Females per 100 Males in Bellmead.
What is the Median Population Age in Bellmead?
Median Population Age in Bellmead is 34.8 Years.
What is the Average Family Size in Bellmead
Average Family Size in Bellmead is 3.7 People.
What is the Average Household Size in Bellmead
Average Household Size in Bellmead is 2.9 People.
How Large is the Labor Force in Bellmead?
There are 4,160 People in the Labor Forcein in Bellmead.
What is the Percentage of People in the Labor Force in Bellmead?
53.9% of People are in the Labor Force in Bellmead.
What is the Unemployment Rate in Bellmead?
Unemployment Rate in Bellmead is 2.4%.