Zip Codes with the Highest Percentage of Population with a Degree in Science and Engineering in Brownsville, TX
RELATED REPORTS & OPTIONS
Science and Engineering
Brownsville
Compare Zip Codes
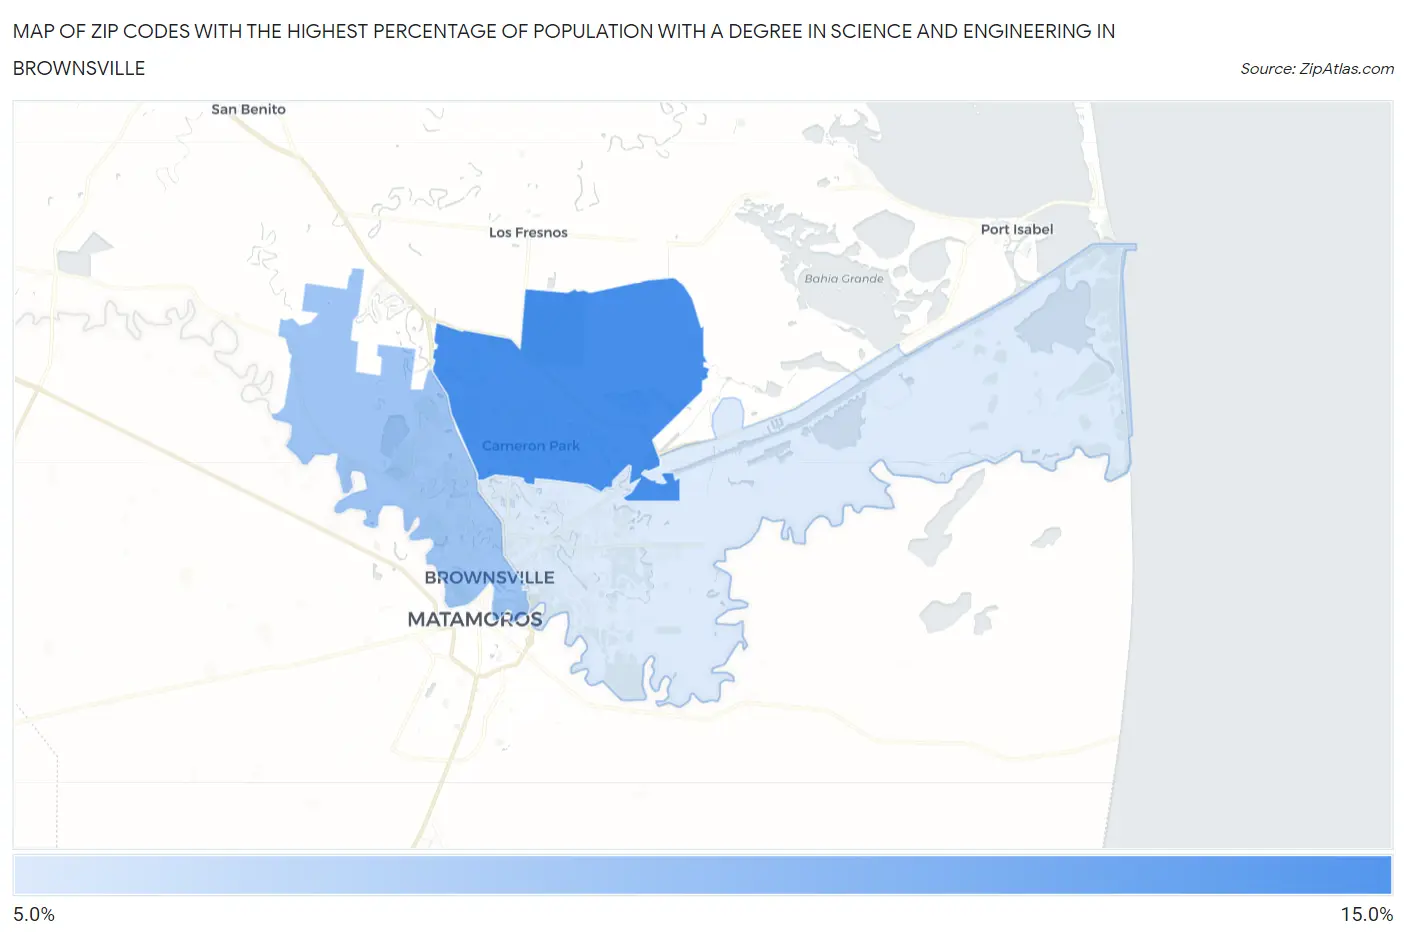
Map of Zip Codes with the Highest Percentage of Population with a Degree in Science and Engineering in Brownsville
7.6%
13.3%
Zip Codes with the Highest Percentage of Population with a Degree in Science and Engineering in Brownsville, TX
| Zip Code | % Graduates | vs State | vs National | |
| 1. | 78526 | 13.3% | 9.5%(+3.75)#371 | 9.8%(+3.49)#8,826 |
| 2. | 78520 | 9.9% | 9.5%(+0.404)#723 | 9.8%(+0.144)#15,185 |
| 3. | 78521 | 7.6% | 9.5%(-1.89)#1,065 | 9.8%(-2.15)#20,456 |
1
Common Questions
What are the Top Zip Codes with the Highest Percentage of Population with a Degree in Science and Engineering in Brownsville, TX?
Top Zip Codes with the Highest Percentage of Population with a Degree in Science and Engineering in Brownsville, TX are:
What zip code has the Highest Percentage of Population with a Degree in Science and Engineering in Brownsville, TX?
78526 has the Highest Percentage of Population with a Degree in Science and Engineering in Brownsville, TX with 13.3%.
What is the Percentage of Population with a Degree in Science and Engineering in Brownsville, TX?
Percentage of Population with a Degree in Science and Engineering in Brownsville is 11.1%.
What is the Percentage of Population with a Degree in Science and Engineering in Texas?
Percentage of Population with a Degree in Science and Engineering in Texas is 9.5%.
What is the Percentage of Population with a Degree in Science and Engineering in the United States?
Percentage of Population with a Degree in Science and Engineering in the United States is 9.8%.