Elmo, TX Map & Demographics
Elmo Map
Elmo Overview
$35,466
PER CAPITA INCOME
$111,827
AVG FAMILY INCOME
0.43
INEQUALITY / GINI INDEX
1,002
TOTAL POPULATION
399
MALE POPULATION
603
FEMALE POPULATION
66.17
MALES / 100 FEMALES
151.13
FEMALES / 100 MALES
50.1
MEDIAN AGE
3.4
AVG FAMILY SIZE
2.1
AVG HOUSEHOLD SIZE
663
LABOR FORCE [ PEOPLE ]
68.2%
PERCENT IN LABOR FORCE
15.2%
UNEMPLOYMENT RATE
Income in Elmo
Income Overview in Elmo
| Characteristic | Number | Measure |
| Per Capita Income | 1,002 | $35,466 |
| Median Family Income | 217 | $111,827 |
| Mean Family Income | 217 | $103,524 |
| Median Household Income | 486 | $0 |
| Mean Household Income | 486 | $61,533 |
| Income Deficit | 217 | $0 |
| Wage / Income Gap (%) | 1,002 | 0.00% |
| Wage / Income Gap ($) | 1,002 | 100.00¢ per $1 |
| Gini / Inequality Index | 1,002 | 0.43 |
Earnings by Sex in Elmo
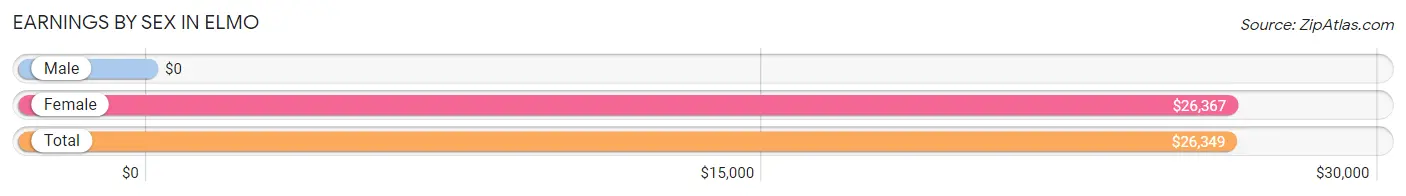
| Sex | Number | Average Earnings |
| Male | 329 (52.2%) | $0 |
| Female | 301 (47.8%) | $26,367 |
| Total | 630 (100.0%) | $26,349 |
Earnings by Sex by Income Bracket in Elmo
The most common earnings brackets in Elmo are $25,000 to $29,999 for men (83 | 25.2%) and $25,000 to $29,999 for women (182 | 60.5%).
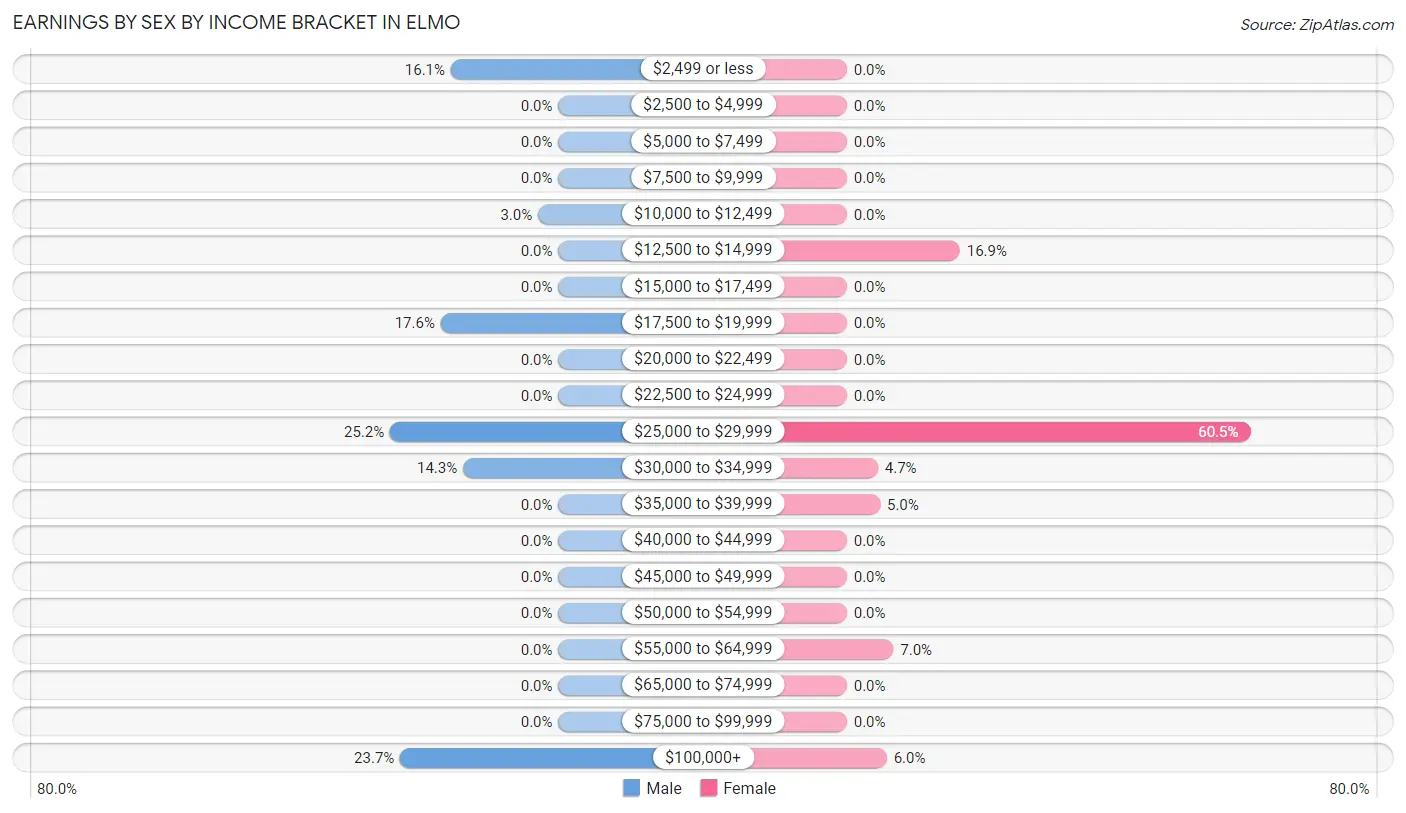
| Income | Male | Female |
| $2,499 or less | 53 (16.1%) | 0 (0.0%) |
| $2,500 to $4,999 | 0 (0.0%) | 0 (0.0%) |
| $5,000 to $7,499 | 0 (0.0%) | 0 (0.0%) |
| $7,500 to $9,999 | 0 (0.0%) | 0 (0.0%) |
| $10,000 to $12,499 | 10 (3.0%) | 0 (0.0%) |
| $12,500 to $14,999 | 0 (0.0%) | 51 (16.9%) |
| $15,000 to $17,499 | 0 (0.0%) | 0 (0.0%) |
| $17,500 to $19,999 | 58 (17.6%) | 0 (0.0%) |
| $20,000 to $22,499 | 0 (0.0%) | 0 (0.0%) |
| $22,500 to $24,999 | 0 (0.0%) | 0 (0.0%) |
| $25,000 to $29,999 | 83 (25.2%) | 182 (60.5%) |
| $30,000 to $34,999 | 47 (14.3%) | 14 (4.6%) |
| $35,000 to $39,999 | 0 (0.0%) | 15 (5.0%) |
| $40,000 to $44,999 | 0 (0.0%) | 0 (0.0%) |
| $45,000 to $49,999 | 0 (0.0%) | 0 (0.0%) |
| $50,000 to $54,999 | 0 (0.0%) | 0 (0.0%) |
| $55,000 to $64,999 | 0 (0.0%) | 21 (7.0%) |
| $65,000 to $74,999 | 0 (0.0%) | 0 (0.0%) |
| $75,000 to $99,999 | 0 (0.0%) | 0 (0.0%) |
| $100,000+ | 78 (23.7%) | 18 (6.0%) |
| Total | 329 (100.0%) | 301 (100.0%) |
Earnings by Sex by Educational Attainment in Elmo
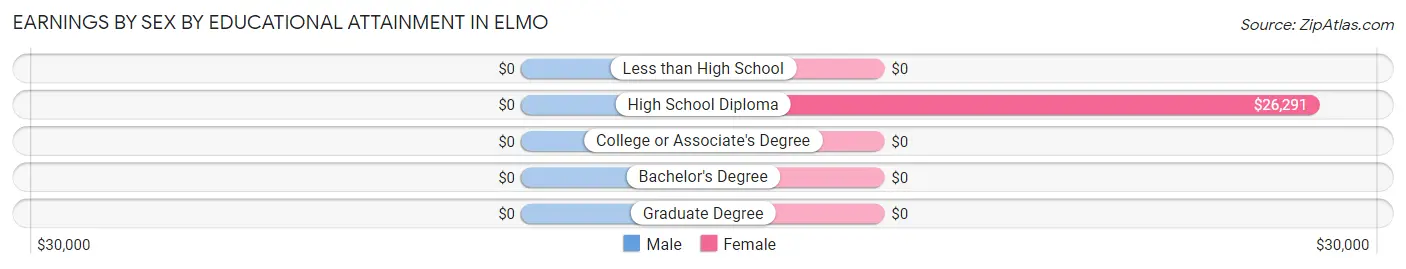
| Educational Attainment | Male Income | Female Income |
| Less than High School | - | - |
| High School Diploma | - | - |
| College or Associate's Degree | - | - |
| Bachelor's Degree | - | - |
| Graduate Degree | - | - |
| Total | - | - |
Family Income in Elmo
Family Income Brackets in Elmo
According to the Elmo family income data, there are 53 families falling into the $150,000 to $199,999 income range, which is the most common income bracket and makes up 24.4% of all families.
| Income Bracket | # Families | % Families |
| Less than $10,000 | 0 | 0.0% |
| $10,000 to $14,999 | 0 | 0.0% |
| $15,000 to $24,999 | 0 | 0.0% |
| $25,000 to $34,999 | 32 | 14.7% |
| $35,000 to $49,999 | 9 | 4.1% |
| $50,000 to $74,999 | 47 | 21.7% |
| $75,000 to $99,999 | 11 | 5.1% |
| $100,000 to $149,999 | 44 | 20.3% |
| $150,000 to $199,999 | 53 | 24.4% |
| $200,000+ | 21 | 9.7% |
Family Income by Famaliy Size in Elmo
2-person families (108 | 49.8%) account for the highest median family income in Elmo with $112,115 per family, while 2-person families (108 | 49.8%) have the highest median income of $56,058 per family member.
| Income Bracket | # Families | Median Income |
| 2-Person Families | 108 (49.8%) | $112,115 |
| 3-Person Families | 9 (4.2%) | $0 |
| 4-Person Families | 100 (46.1%) | $0 |
| 5-Person Families | 0 (0.0%) | $0 |
| 6-Person Families | 0 (0.0%) | $0 |
| 7+ Person Families | 0 (0.0%) | $0 |
| Total | 217 (100.0%) | $111,827 |
Family Income by Number of Earners in Elmo
| Number of Earners | # Families | Median Income |
| No Earners | 32 (14.7%) | $0 |
| 1 Earner | 80 (36.9%) | $53,564 |
| 2 Earners | 52 (24.0%) | $0 |
| 3+ Earners | 53 (24.4%) | $0 |
| Total | 217 (100.0%) | $111,827 |
Household Income in Elmo
Household Income Brackets in Elmo
With 237 households falling in the category, the $25,000 to $34,999 income range is the most frequent in Elmo, accounting for 48.8% of all households.
| Income Bracket | # Households | % Households |
| Less than $10,000 | 9 | 1.9% |
| $10,000 to $14,999 | 0 | 0.0% |
| $15,000 to $24,999 | 35 | 7.2% |
| $25,000 to $34,999 | 237 | 48.8% |
| $35,000 to $49,999 | 24 | 4.9% |
| $50,000 to $74,999 | 47 | 9.7% |
| $75,000 to $99,999 | 11 | 2.3% |
| $100,000 to $149,999 | 49 | 10.1% |
| $150,000 to $199,999 | 53 | 10.9% |
| $200,000+ | 21 | 4.3% |
Household Income by Householder Age in Elmo
The median household income in Elmo is $0, with the highest median household income of $142,500 found in the 65+ years age bracket for the primary householder. A total of 106 households (21.8%) fall into this category.
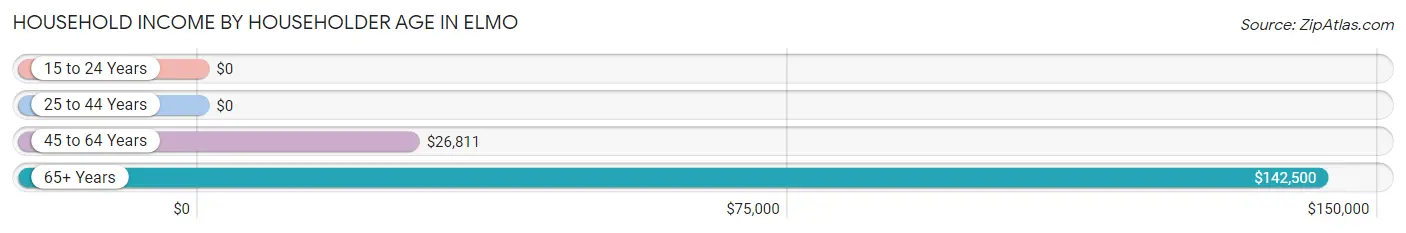
| Income Bracket | # Households | Median Income |
| 15 to 24 Years | 0 (0.0%) | $0 |
| 25 to 44 Years | 13 (2.7%) | $0 |
| 45 to 64 Years | 367 (75.5%) | $26,811 |
| 65+ Years | 106 (21.8%) | $142,500 |
| Total | 486 (100.0%) | $0 |
Poverty in Elmo
Income Below Poverty by Sex and Age in Elmo
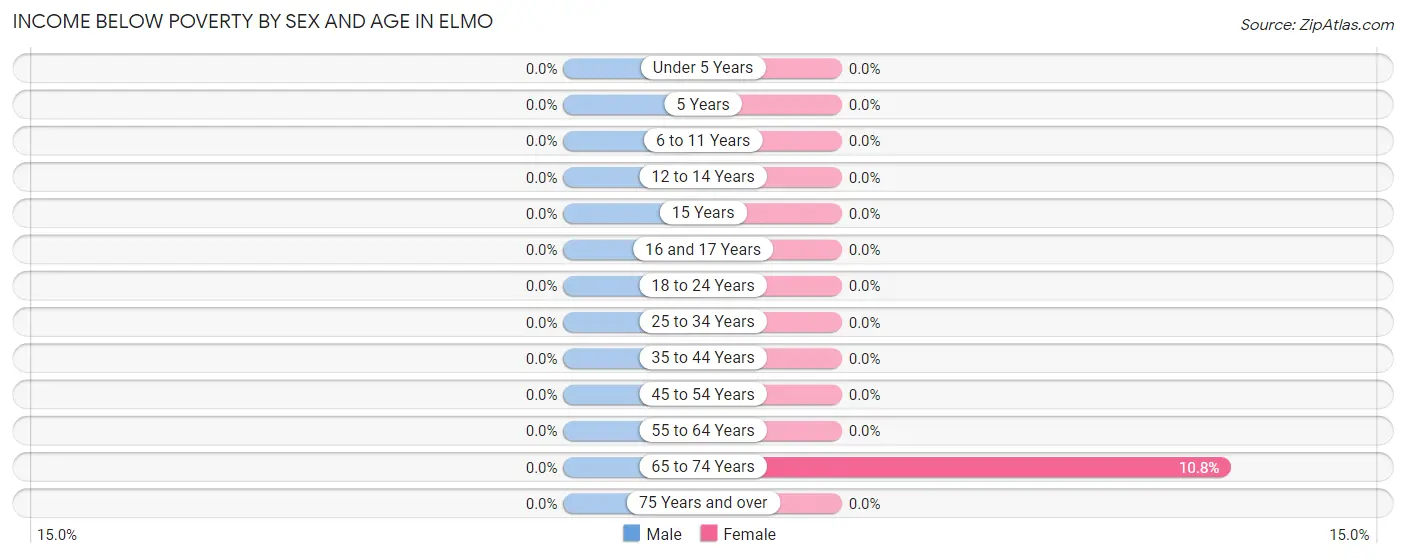
| Age Bracket | Male | Female |
| Under 5 Years | 0 (0.0%) | 0 (0.0%) |
| 5 Years | 0 (0.0%) | 0 (0.0%) |
| 6 to 11 Years | 0 (0.0%) | 0 (0.0%) |
| 12 to 14 Years | 0 (0.0%) | 0 (0.0%) |
| 15 Years | 0 (0.0%) | 0 (0.0%) |
| 16 and 17 Years | 0 (0.0%) | 0 (0.0%) |
| 18 to 24 Years | 0 (0.0%) | 0 (0.0%) |
| 25 to 34 Years | 0 (0.0%) | 0 (0.0%) |
| 35 to 44 Years | 0 (0.0%) | 0 (0.0%) |
| 45 to 54 Years | 0 (0.0%) | 0 (0.0%) |
| 55 to 64 Years | 0 (0.0%) | 0 (0.0%) |
| 65 to 74 Years | 0 (0.0%) | 9 (10.8%) |
| 75 Years and over | 0 (0.0%) | 0 (0.0%) |
| Total | 0 (0.0%) | 9 (1.5%) |
Income Above Poverty by Sex and Age in Elmo
According to the poverty statistics in Elmo, males aged 18 to 24 years and females aged under 5 years are the age groups that are most secure financially, with 100.0% of males and 100.0% of females in these age groups living above the poverty line.
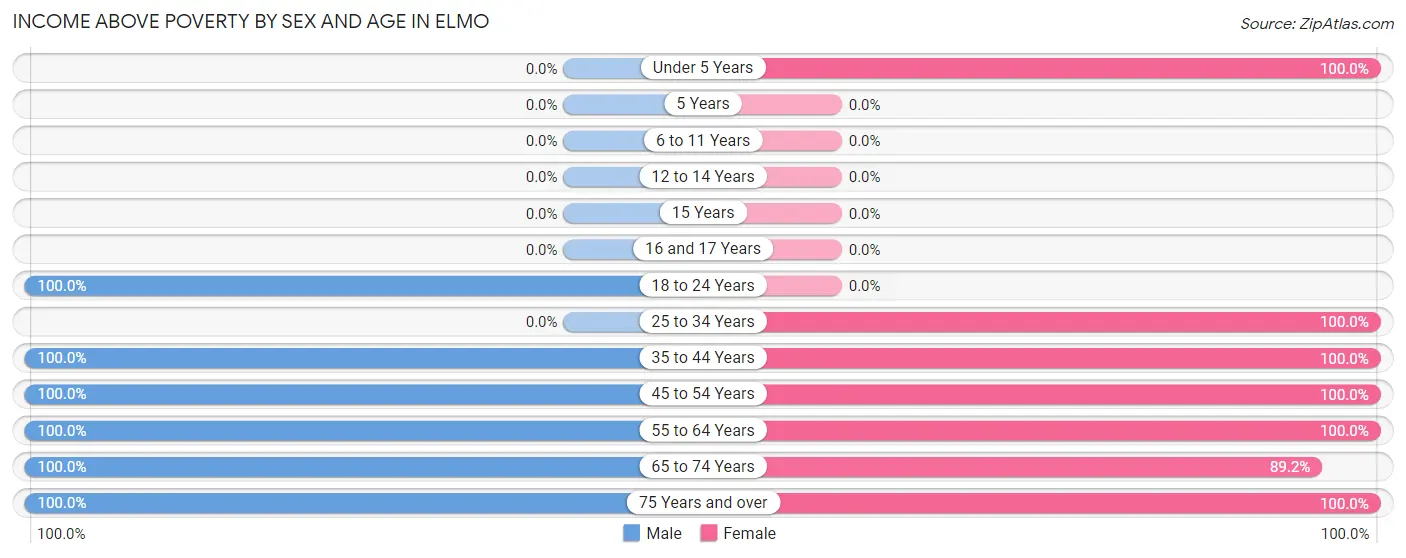
| Age Bracket | Male | Female |
| Under 5 Years | 0 (0.0%) | 30 (100.0%) |
| 5 Years | 0 (0.0%) | 0 (0.0%) |
| 6 to 11 Years | 0 (0.0%) | 0 (0.0%) |
| 12 to 14 Years | 0 (0.0%) | 0 (0.0%) |
| 15 Years | 0 (0.0%) | 0 (0.0%) |
| 16 and 17 Years | 0 (0.0%) | 0 (0.0%) |
| 18 to 24 Years | 58 (100.0%) | 0 (0.0%) |
| 25 to 34 Years | 0 (0.0%) | 63 (100.0%) |
| 35 to 44 Years | 83 (100.0%) | 13 (100.0%) |
| 45 to 54 Years | 92 (100.0%) | 284 (100.0%) |
| 55 to 64 Years | 75 (100.0%) | 99 (100.0%) |
| 65 to 74 Years | 64 (100.0%) | 74 (89.2%) |
| 75 Years and over | 27 (100.0%) | 31 (100.0%) |
| Total | 399 (100.0%) | 594 (98.5%) |
Income Below Poverty Among Married-Couple Families in Elmo
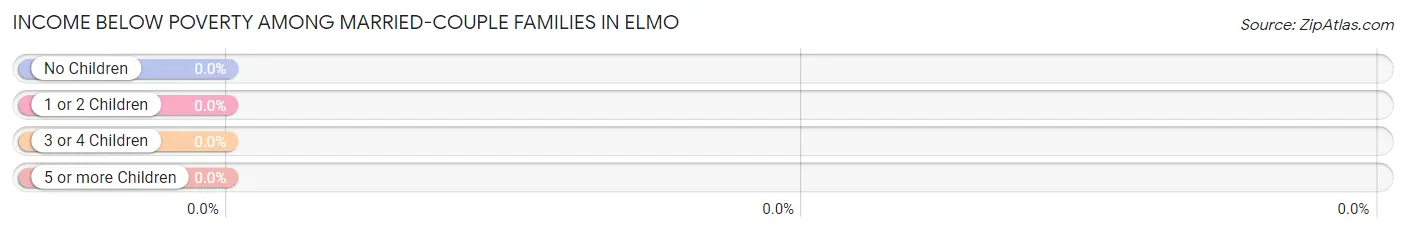
| Children | Above Poverty | Below Poverty |
| No Children | 138 (100.0%) | 0 (0.0%) |
| 1 or 2 Children | 47 (100.0%) | 0 (0.0%) |
| 3 or 4 Children | 0 (0.0%) | 0 (0.0%) |
| 5 or more Children | 0 (0.0%) | 0 (0.0%) |
| Total | 185 (100.0%) | 0 (0.0%) |
Income Below Poverty Among Single-Parent Households in Elmo
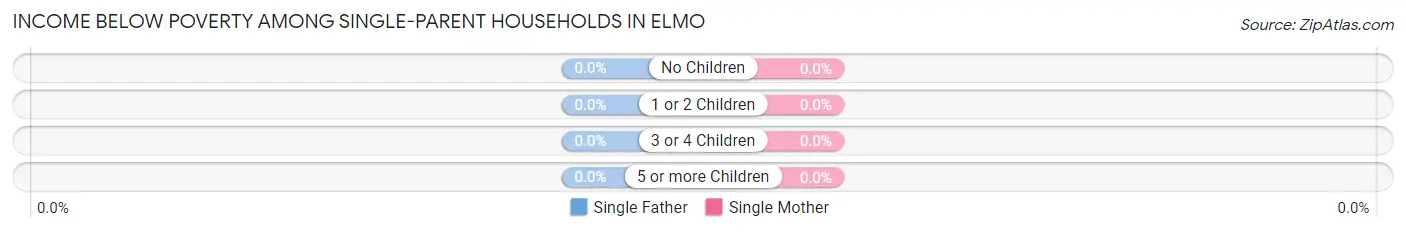
| Children | Single Father | Single Mother |
| No Children | 0 (0.0%) | 0 (0.0%) |
| 1 or 2 Children | 0 (0.0%) | 0 (0.0%) |
| 3 or 4 Children | 0 (0.0%) | 0 (0.0%) |
| 5 or more Children | 0 (0.0%) | 0 (0.0%) |
| Total | 0 (0.0%) | 0 (0.0%) |
Income Below Poverty Among Married-Couple vs Single-Parent Households in Elmo
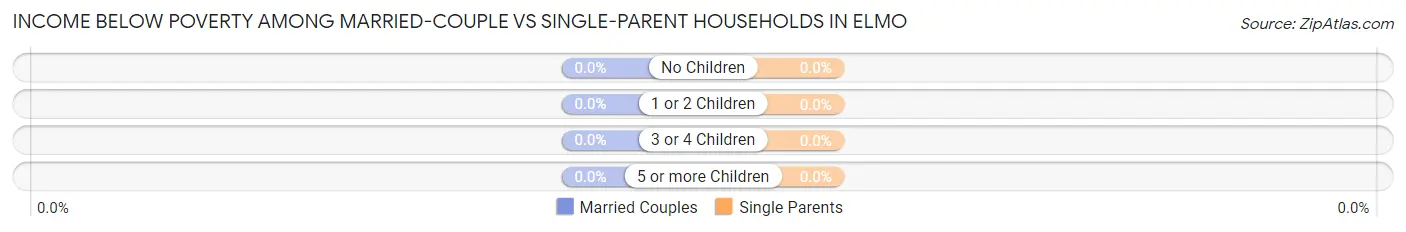
| Children | Married-Couple Families | Single-Parent Households |
| No Children | 0 (0.0%) | 0 (0.0%) |
| 1 or 2 Children | 0 (0.0%) | 0 (0.0%) |
| 3 or 4 Children | 0 (0.0%) | 0 (0.0%) |
| 5 or more Children | 0 (0.0%) | 0 (0.0%) |
| Total | 0 (0.0%) | 0 (0.0%) |
Race in Elmo
The most populous races in Elmo are White / Caucasian (967 | 96.5%), and Black / African American (35 | 3.5%).
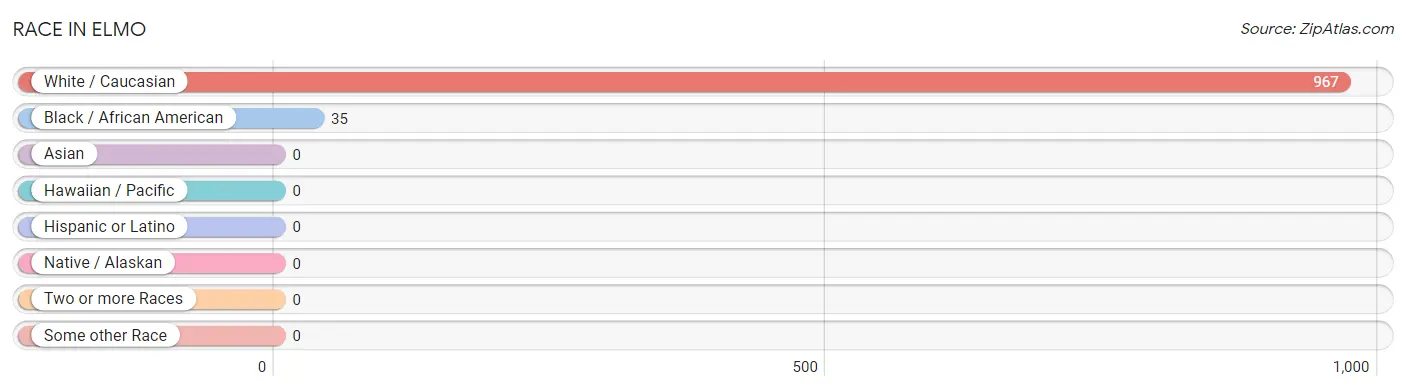
| Race | # Population | % Population |
| Asian | 0 | 0.0% |
| Black / African American | 35 | 3.5% |
| Hawaiian / Pacific | 0 | 0.0% |
| Hispanic or Latino | 0 | 0.0% |
| Native / Alaskan | 0 | 0.0% |
| White / Caucasian | 967 | 96.5% |
| Two or more Races | 0 | 0.0% |
| Some other Race | 0 | 0.0% |
| Total | 1,002 | 100.0% |
Ancestry in Elmo
The most populous ancestries reported in Elmo are English (263 | 26.3%), German (230 | 23.0%), American (55 | 5.5%), Scottish (14 | 1.4%), and Irish (13 | 1.3%), together accounting for 57.4% of all Elmo residents.
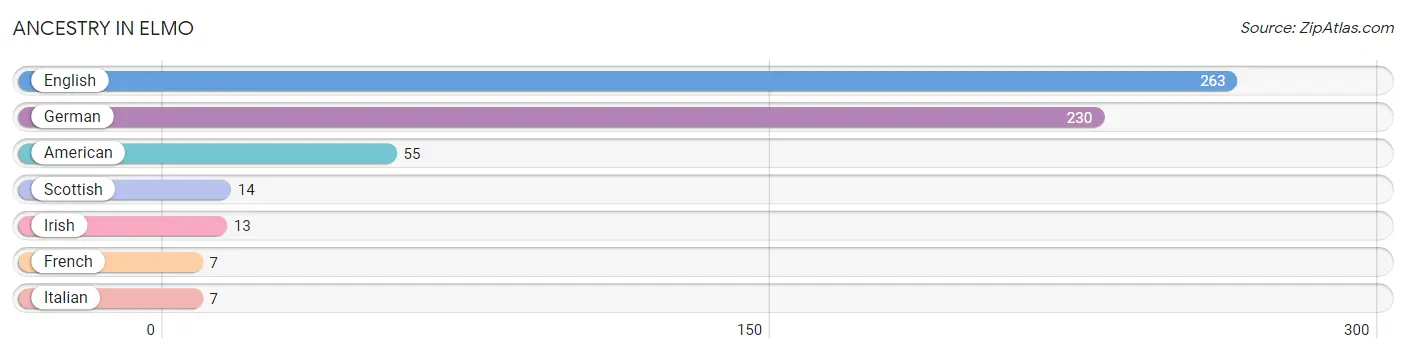
| Ancestry | # Population | % Population |
| American | 55 | 5.5% |
| English | 263 | 26.3% |
| French | 7 | 0.7% |
| German | 230 | 23.0% |
| Irish | 13 | 1.3% |
| Italian | 7 | 0.7% |
| Scottish | 14 | 1.4% | View All 7 Rows |
Immigrants in Elmo

| Immigration Origin | # Population | % Population | View All 0 Rows |
Sex and Age in Elmo
Sex and Age in Elmo
The most populous age groups in Elmo are 35 to 39 Years (83 | 20.8%) for men and 45 to 49 Years (203 | 33.7%) for women.
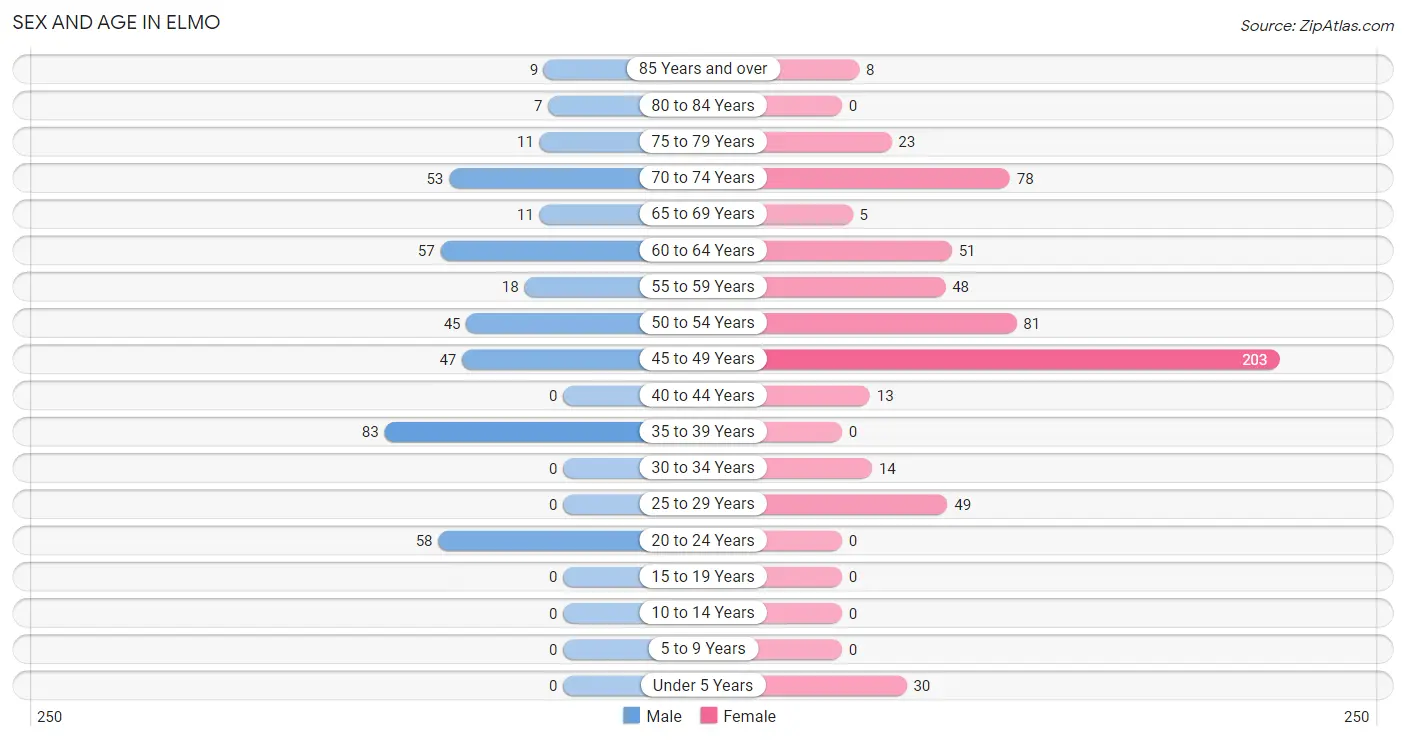
| Age Bracket | Male | Female |
| Under 5 Years | 0 (0.0%) | 30 (5.0%) |
| 5 to 9 Years | 0 (0.0%) | 0 (0.0%) |
| 10 to 14 Years | 0 (0.0%) | 0 (0.0%) |
| 15 to 19 Years | 0 (0.0%) | 0 (0.0%) |
| 20 to 24 Years | 58 (14.5%) | 0 (0.0%) |
| 25 to 29 Years | 0 (0.0%) | 49 (8.1%) |
| 30 to 34 Years | 0 (0.0%) | 14 (2.3%) |
| 35 to 39 Years | 83 (20.8%) | 0 (0.0%) |
| 40 to 44 Years | 0 (0.0%) | 13 (2.2%) |
| 45 to 49 Years | 47 (11.8%) | 203 (33.7%) |
| 50 to 54 Years | 45 (11.3%) | 81 (13.4%) |
| 55 to 59 Years | 18 (4.5%) | 48 (8.0%) |
| 60 to 64 Years | 57 (14.3%) | 51 (8.5%) |
| 65 to 69 Years | 11 (2.8%) | 5 (0.8%) |
| 70 to 74 Years | 53 (13.3%) | 78 (12.9%) |
| 75 to 79 Years | 11 (2.8%) | 23 (3.8%) |
| 80 to 84 Years | 7 (1.8%) | 0 (0.0%) |
| 85 Years and over | 9 (2.3%) | 8 (1.3%) |
| Total | 399 (100.0%) | 603 (100.0%) |
Families and Households in Elmo
Median Family Size in Elmo
The median family size in Elmo is 3.38 persons per family, with married-couple families (185 | 85.3%) accounting for the largest median family size of 3.56 persons per family. On the other hand, single female/mother families (25 | 11.5%) represent the smallest median family size with 2.28 persons per family.
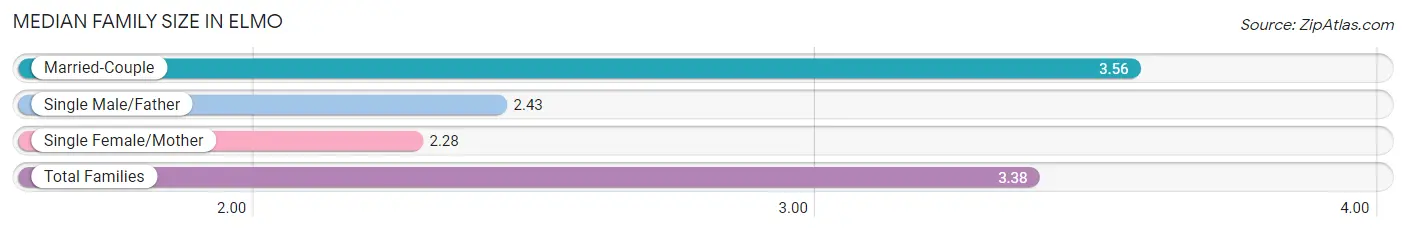
| Family Type | # Families | Family Size |
| Married-Couple | 185 (85.3%) | 3.56 |
| Single Male/Father | 7 (3.2%) | 2.43 |
| Single Female/Mother | 25 (11.5%) | 2.28 |
| Total Families | 217 (100.0%) | 3.38 |
Median Household Size in Elmo
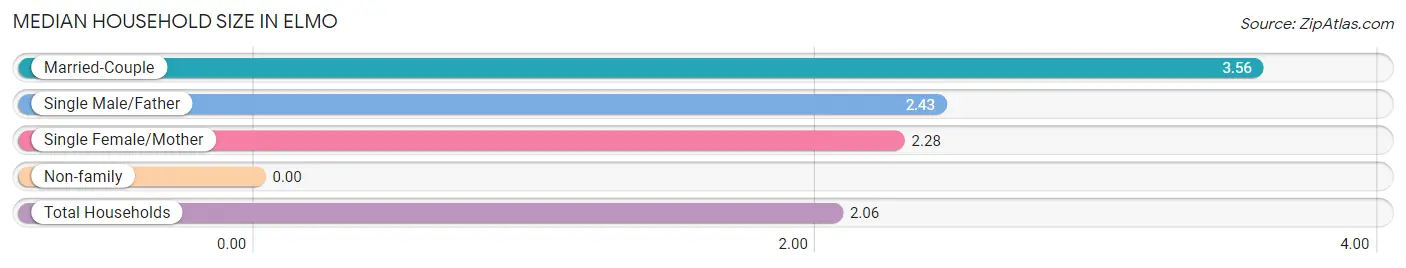
| Household Type | # Households | Household Size |
| Married-Couple | 185 (38.1%) | 3.56 |
| Single Male/Father | 7 (1.4%) | 2.43 |
| Single Female/Mother | 25 (5.1%) | 2.28 |
| Non-family | 269 (55.3%) | - |
| Total Households | 486 (100.0%) | 2.06 |
Household Size by Marriage Status in Elmo
Out of a total of 486 households in Elmo, 217 (44.7%) are family households, while 269 (55.3%) are nonfamily households. The most numerous type of family households are 2-person households, comprising 108, and the most common type of nonfamily households are 1-person households, comprising 269.
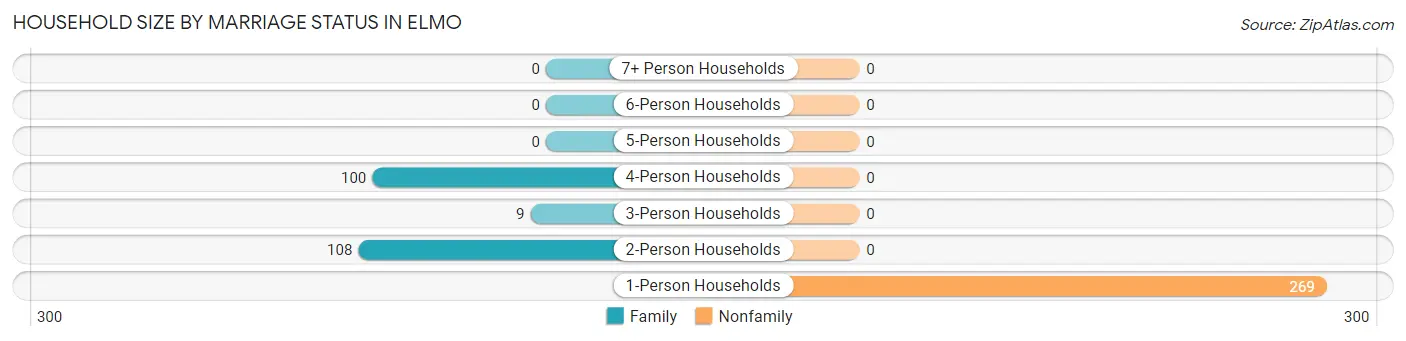
| Household Size | Family Households | Nonfamily Households |
| 1-Person Households | - | 269 (55.3%) |
| 2-Person Households | 108 (22.2%) | 0 (0.0%) |
| 3-Person Households | 9 (1.8%) | 0 (0.0%) |
| 4-Person Households | 100 (20.6%) | 0 (0.0%) |
| 5-Person Households | 0 (0.0%) | 0 (0.0%) |
| 6-Person Households | 0 (0.0%) | 0 (0.0%) |
| 7+ Person Households | 0 (0.0%) | 0 (0.0%) |
| Total | 217 (44.7%) | 269 (55.3%) |
Female Fertility in Elmo
Fertility by Age in Elmo
| Age Bracket | Women with Births | Births / 1,000 Women |
| 15 to 19 years | 0 (0.0%) | 0.0 |
| 20 to 34 years | 0 (0.0%) | 0.0 |
| 35 to 50 years | 0 (0.0%) | 0.0 |
| Total | 0 (0.0%) | 0.0 |
Fertility by Age by Marriage Status in Elmo
| Age Bracket | Married | Unmarried |
| 15 to 19 years | 0 (0.0%) | 0 (0.0%) |
| 20 to 34 years | 0 (0.0%) | 0 (0.0%) |
| 35 to 50 years | 0 (0.0%) | 0 (0.0%) |
| Total | 0 (0.0%) | 0 (0.0%) |
Fertility by Education in Elmo
| Educational Attainment | Women with Births | Births / 1,000 Women |
| Less than High School | 0 (0.0%) | 0.0 |
| High School Diploma | 0 (0.0%) | 0.0 |
| College or Associate's Degree | 0 (0.0%) | 0.0 |
| Bachelor's Degree | 0 (0.0%) | 0.0 |
| Graduate Degree | 0 (0.0%) | 0.0 |
| Total | 0 (0.0%) | 0.0 |
Fertility by Education by Marriage Status in Elmo
| Educational Attainment | Married | Unmarried |
| Less than High School | 0 (0.0%) | 0 (0.0%) |
| High School Diploma | 0 (0.0%) | 0 (0.0%) |
| College or Associate's Degree | 0 (0.0%) | 0 (0.0%) |
| Bachelor's Degree | 0 (0.0%) | 0 (0.0%) |
| Graduate Degree | 0 (0.0%) | 0 (0.0%) |
| Total | 0 (0.0%) | 0 (0.0%) |
Employment Characteristics in Elmo
Employment by Class of Employer in Elmo
Among the 562 employed individuals in Elmo, private company employees (456 | 81.1%), and state government employees (106 | 18.9%) make up the most common classes of employment.
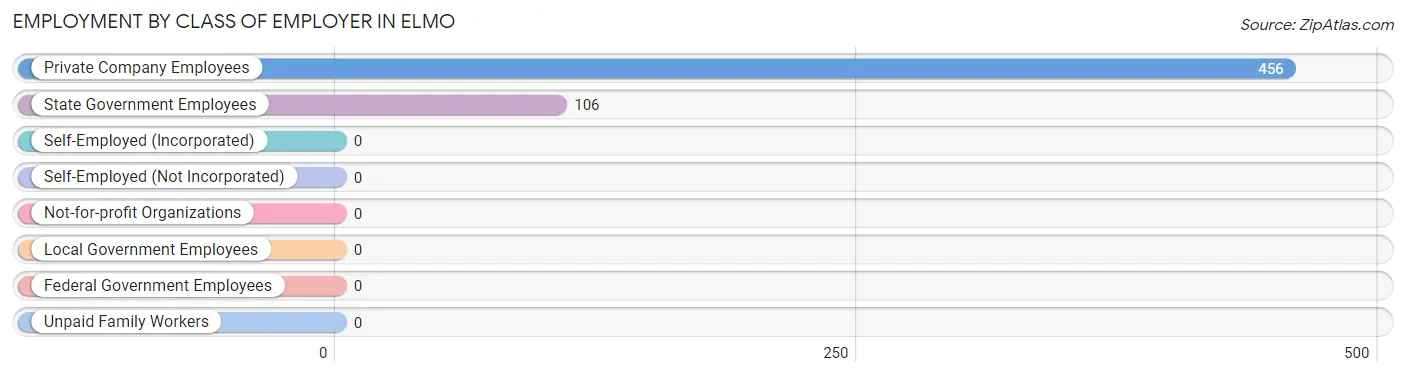
| Employer Class | # Employees | % Employees |
| Private Company Employees | 456 | 81.1% |
| Self-Employed (Incorporated) | 0 | 0.0% |
| Self-Employed (Not Incorporated) | 0 | 0.0% |
| Not-for-profit Organizations | 0 | 0.0% |
| Local Government Employees | 0 | 0.0% |
| State Government Employees | 106 | 18.9% |
| Federal Government Employees | 0 | 0.0% |
| Unpaid Family Workers | 0 | 0.0% |
| Total | 562 | 100.0% |
Employment Status by Age in Elmo
According to the labor force statistics for Elmo, out of the total population over 16 years of age (972), 68.2% or 663 individuals are in the labor force, with 15.2% or 101 of them unemployed. The age group with the highest labor force participation rate is 20 to 24 years, with 100.0% or 58 individuals in the labor force. Within the labor force, the 55 to 59 years age range has the highest percentage of unemployed individuals, with 100.0% or 35 of them being unemployed.
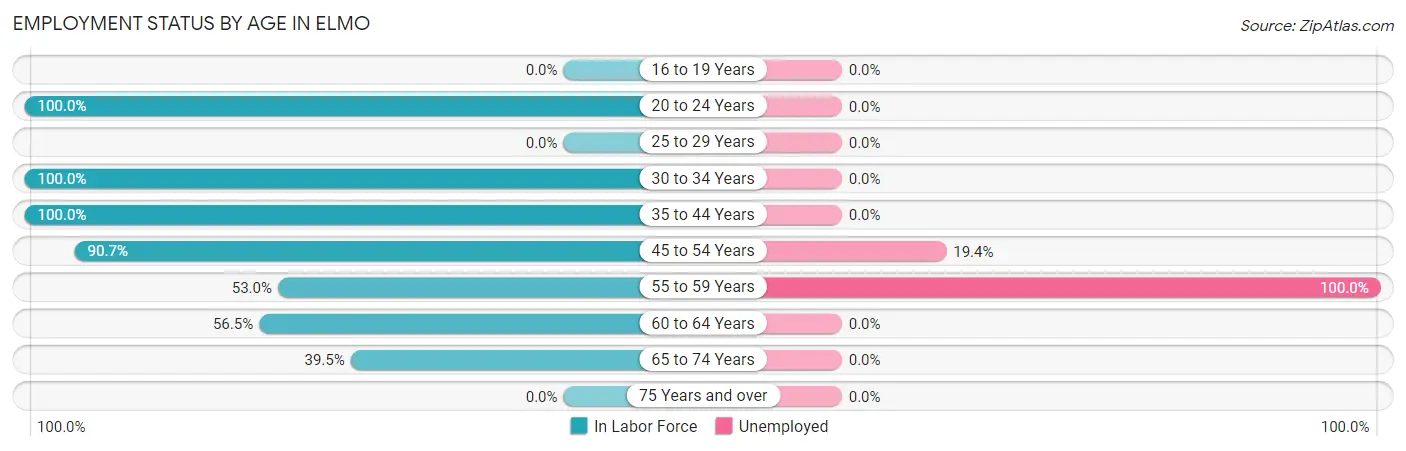
| Age Bracket | In Labor Force | Unemployed |
| 16 to 19 Years | 0 (0.0%) | 0 (0.0%) |
| 20 to 24 Years | 58 (100.0%) | 0 (0.0%) |
| 25 to 29 Years | 0 (0.0%) | 0 (0.0%) |
| 30 to 34 Years | 14 (100.0%) | 0 (0.0%) |
| 35 to 44 Years | 96 (100.0%) | 0 (0.0%) |
| 45 to 54 Years | 341 (90.7%) | 66 (19.4%) |
| 55 to 59 Years | 35 (53.0%) | 35 (100.0%) |
| 60 to 64 Years | 61 (56.5%) | 0 (0.0%) |
| 65 to 74 Years | 58 (39.5%) | 0 (0.0%) |
| 75 Years and over | 0 (0.0%) | 0 (0.0%) |
| Total | 663 (68.2%) | 101 (15.2%) |
Employment Status by Educational Attainment in Elmo
According to labor force statistics for Elmo, 77.2% of individuals (547) out of the total population between 25 and 64 years of age (709) are in the labor force, with 18.5% or 101 of them being unemployed. The group with the highest labor force participation rate are those with the educational attainment of high school diploma, with 86.4% or 424 individuals in the labor force. Within the labor force, individuals with college / associate degree education have the highest percentage of unemployment, with 100.0% or 35 of them being unemployed.
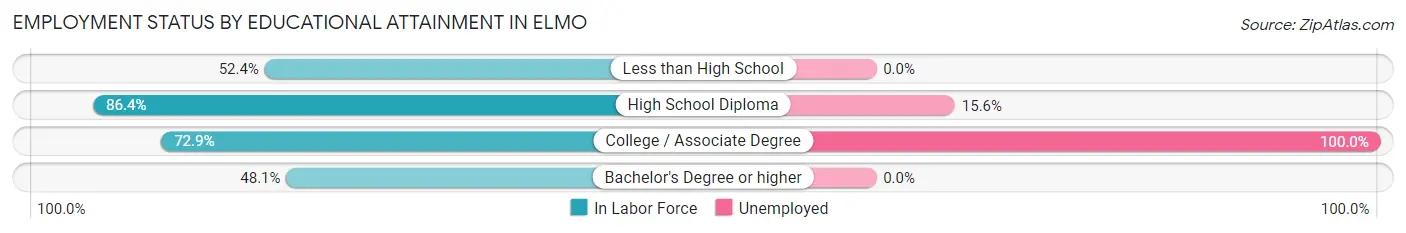
| Educational Attainment | In Labor Force | Unemployed |
| Less than High School | 75 (52.4%) | 0 (0.0%) |
| High School Diploma | 424 (86.4%) | 77 (15.6%) |
| College / Associate Degree | 35 (72.9%) | 48 (100.0%) |
| Bachelor's Degree or higher | 13 (48.1%) | 0 (0.0%) |
| Total | 547 (77.2%) | 131 (18.5%) |
Employment Occupations by Sex in Elmo
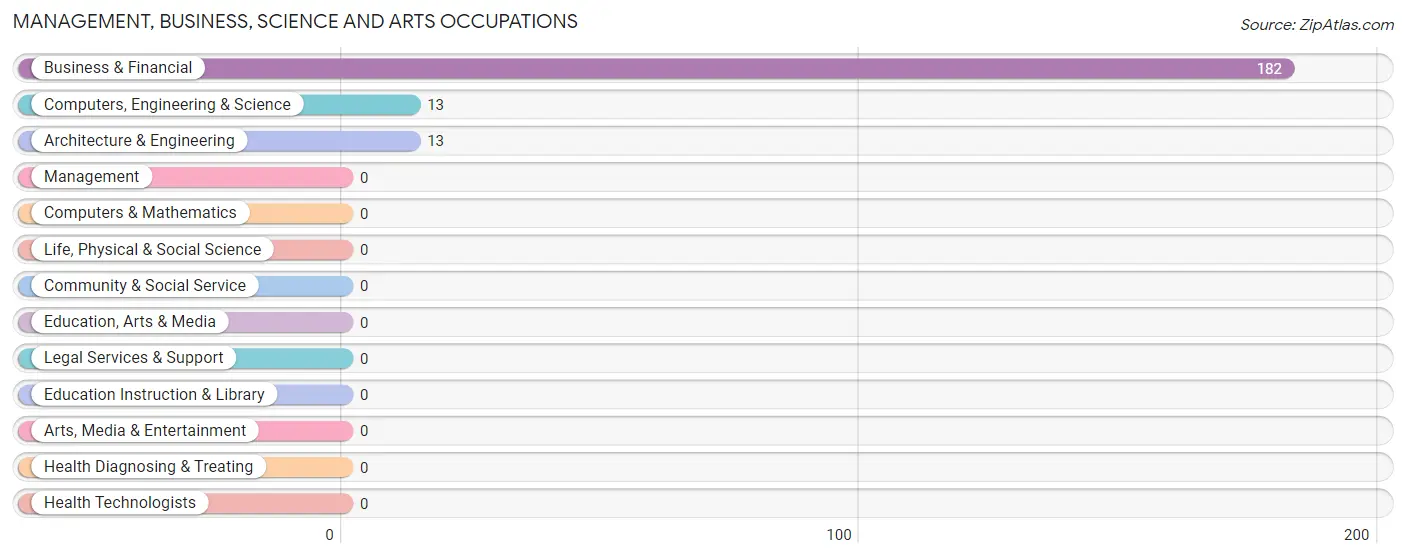
Management, Business, Science and Arts Occupations
The most common Management, Business, Science and Arts occupations in Elmo are Business & Financial (182 | 32.4%), Computers, Engineering & Science (13 | 2.3%), and Architecture & Engineering (13 | 2.3%).
Management, Business, Science and Arts Occupations by Sex
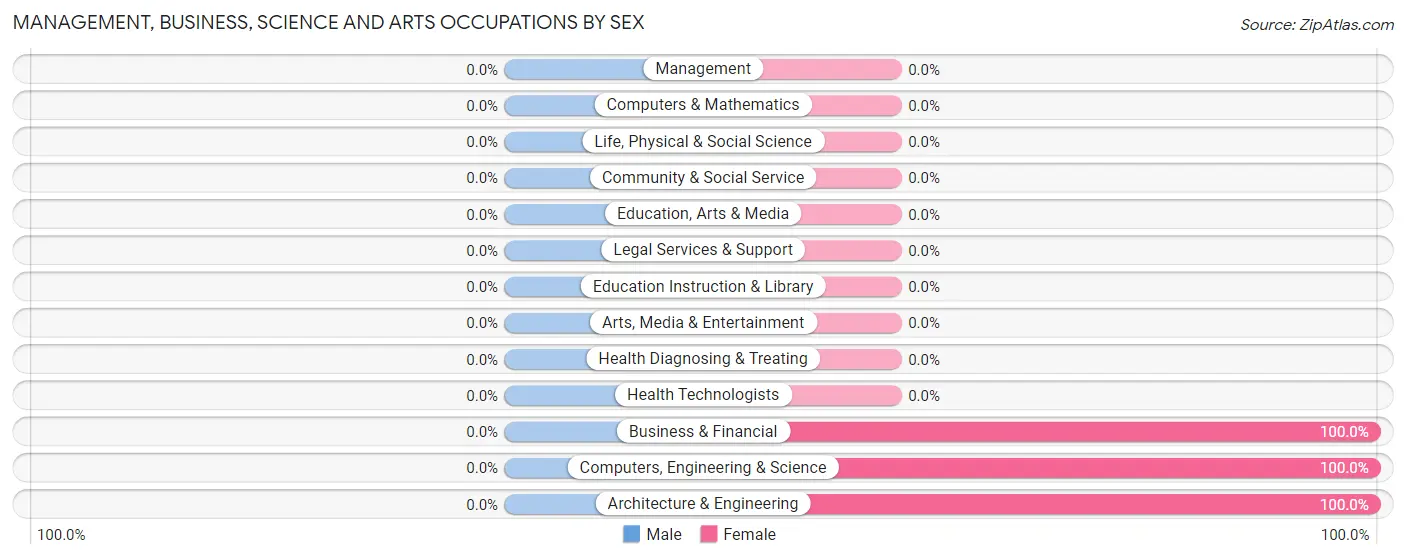
| Occupation | Male | Female |
| Management | 0 (0.0%) | 0 (0.0%) |
| Business & Financial | 0 (0.0%) | 182 (100.0%) |
| Computers, Engineering & Science | 0 (0.0%) | 13 (100.0%) |
| Computers & Mathematics | 0 (0.0%) | 0 (0.0%) |
| Architecture & Engineering | 0 (0.0%) | 13 (100.0%) |
| Life, Physical & Social Science | 0 (0.0%) | 0 (0.0%) |
| Community & Social Service | 0 (0.0%) | 0 (0.0%) |
| Education, Arts & Media | 0 (0.0%) | 0 (0.0%) |
| Legal Services & Support | 0 (0.0%) | 0 (0.0%) |
| Education Instruction & Library | 0 (0.0%) | 0 (0.0%) |
| Arts, Media & Entertainment | 0 (0.0%) | 0 (0.0%) |
| Health Diagnosing & Treating | 0 (0.0%) | 0 (0.0%) |
| Health Technologists | 0 (0.0%) | 0 (0.0%) |
| Total (Category) | 0 (0.0%) | 195 (100.0%) |
| Total (Overall) | 282 (50.2%) | 280 (49.8%) |
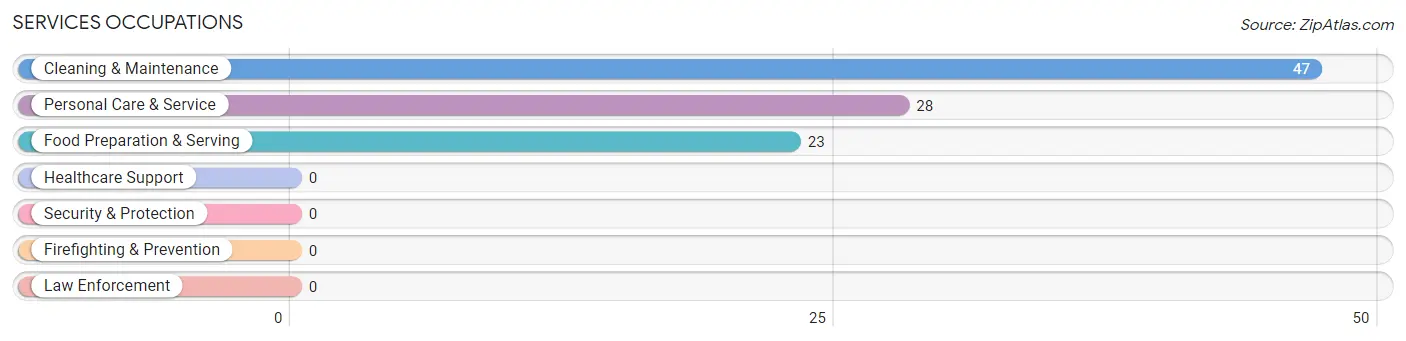
Services Occupations
The most common Services occupations in Elmo are Cleaning & Maintenance (47 | 8.4%), Personal Care & Service (28 | 5.0%), and Food Preparation & Serving (23 | 4.1%).
Services Occupations by Sex
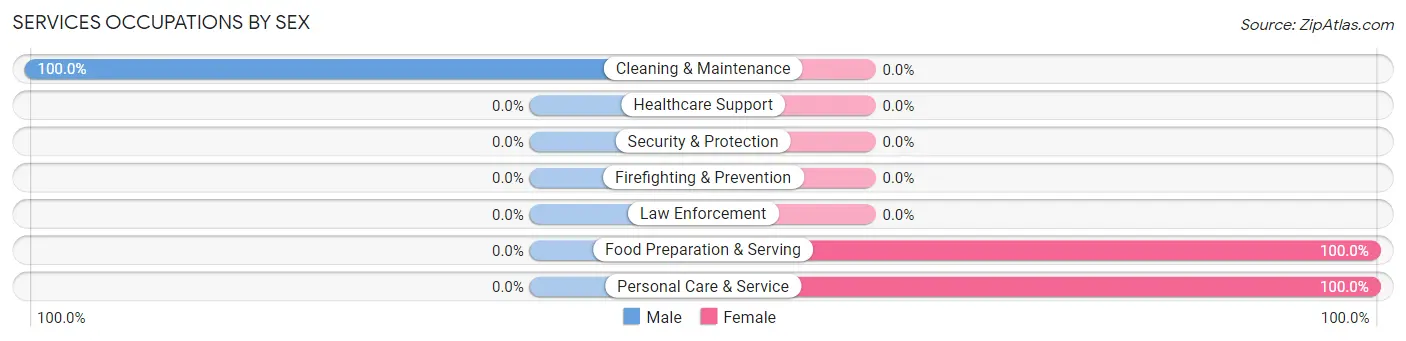
| Occupation | Male | Female |
| Healthcare Support | 0 (0.0%) | 0 (0.0%) |
| Security & Protection | 0 (0.0%) | 0 (0.0%) |
| Firefighting & Prevention | 0 (0.0%) | 0 (0.0%) |
| Law Enforcement | 0 (0.0%) | 0 (0.0%) |
| Food Preparation & Serving | 0 (0.0%) | 23 (100.0%) |
| Cleaning & Maintenance | 47 (100.0%) | 0 (0.0%) |
| Personal Care & Service | 0 (0.0%) | 28 (100.0%) |
| Total (Category) | 47 (48.0%) | 51 (52.0%) |
| Total (Overall) | 282 (50.2%) | 280 (49.8%) |
Sales and Office Occupations
The most common Sales and Office occupations in Elmo are Office & Administration (14 | 2.5%), and Sales & Related (5 | 0.9%).

Sales and Office Occupations by Sex

| Occupation | Male | Female |
| Sales & Related | 0 (0.0%) | 5 (100.0%) |
| Office & Administration | 0 (0.0%) | 14 (100.0%) |
| Total (Category) | 0 (0.0%) | 19 (100.0%) |
| Total (Overall) | 282 (50.2%) | 280 (49.8%) |
Natural Resources, Construction and Maintenance Occupations
The most common Natural Resources, Construction and Maintenance occupations in Elmo are Construction & Extraction (114 | 20.3%), and Installation, Maintenance & Repair (10 | 1.8%).
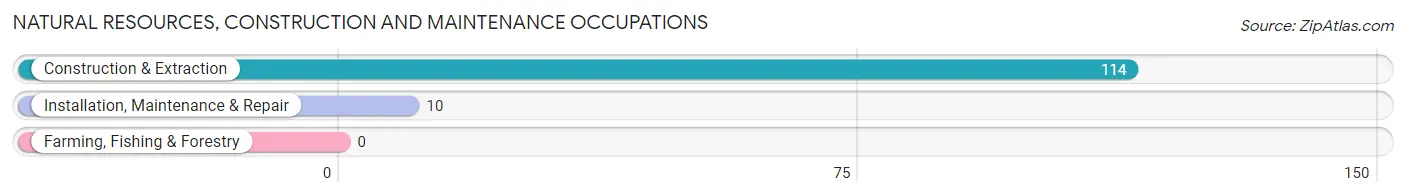
Natural Resources, Construction and Maintenance Occupations by Sex
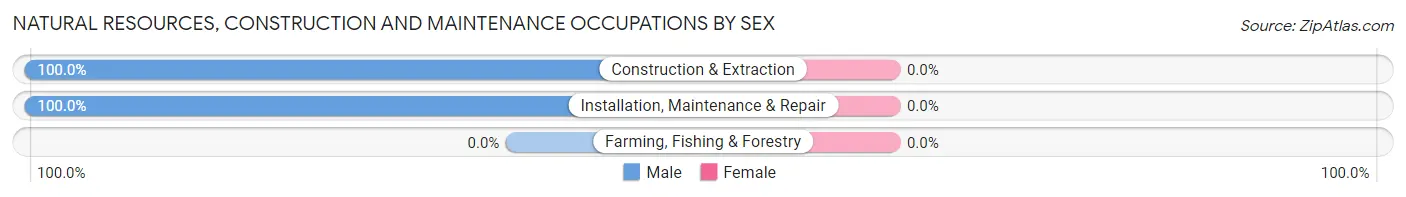
| Occupation | Male | Female |
| Farming, Fishing & Forestry | 0 (0.0%) | 0 (0.0%) |
| Construction & Extraction | 114 (100.0%) | 0 (0.0%) |
| Installation, Maintenance & Repair | 10 (100.0%) | 0 (0.0%) |
| Total (Category) | 124 (100.0%) | 0 (0.0%) |
| Total (Overall) | 282 (50.2%) | 280 (49.8%) |
Production, Transportation and Moving Occupations
The most common Production, Transportation and Moving occupations in Elmo are , and Production (126 | 22.4%).
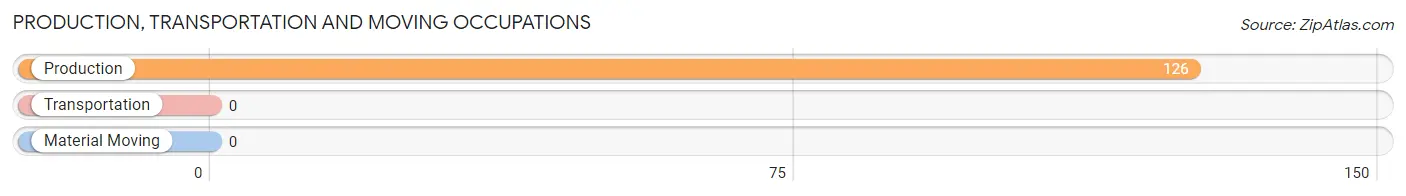
Production, Transportation and Moving Occupations by Sex
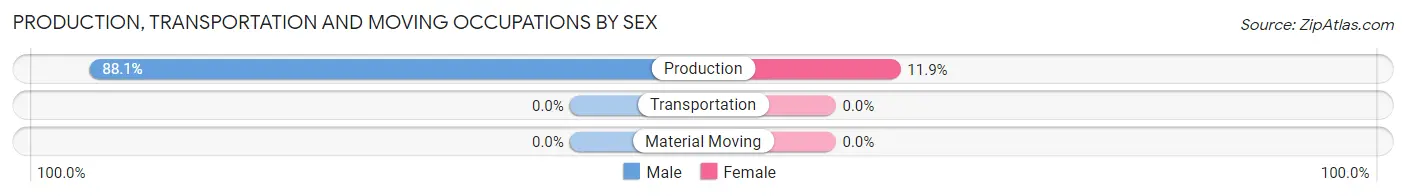
| Occupation | Male | Female |
| Production | 111 (88.1%) | 15 (11.9%) |
| Transportation | 0 (0.0%) | 0 (0.0%) |
| Material Moving | 0 (0.0%) | 0 (0.0%) |
| Total (Category) | 111 (88.1%) | 15 (11.9%) |
| Total (Overall) | 282 (50.2%) | 280 (49.8%) |
Employment Industries by Sex in Elmo
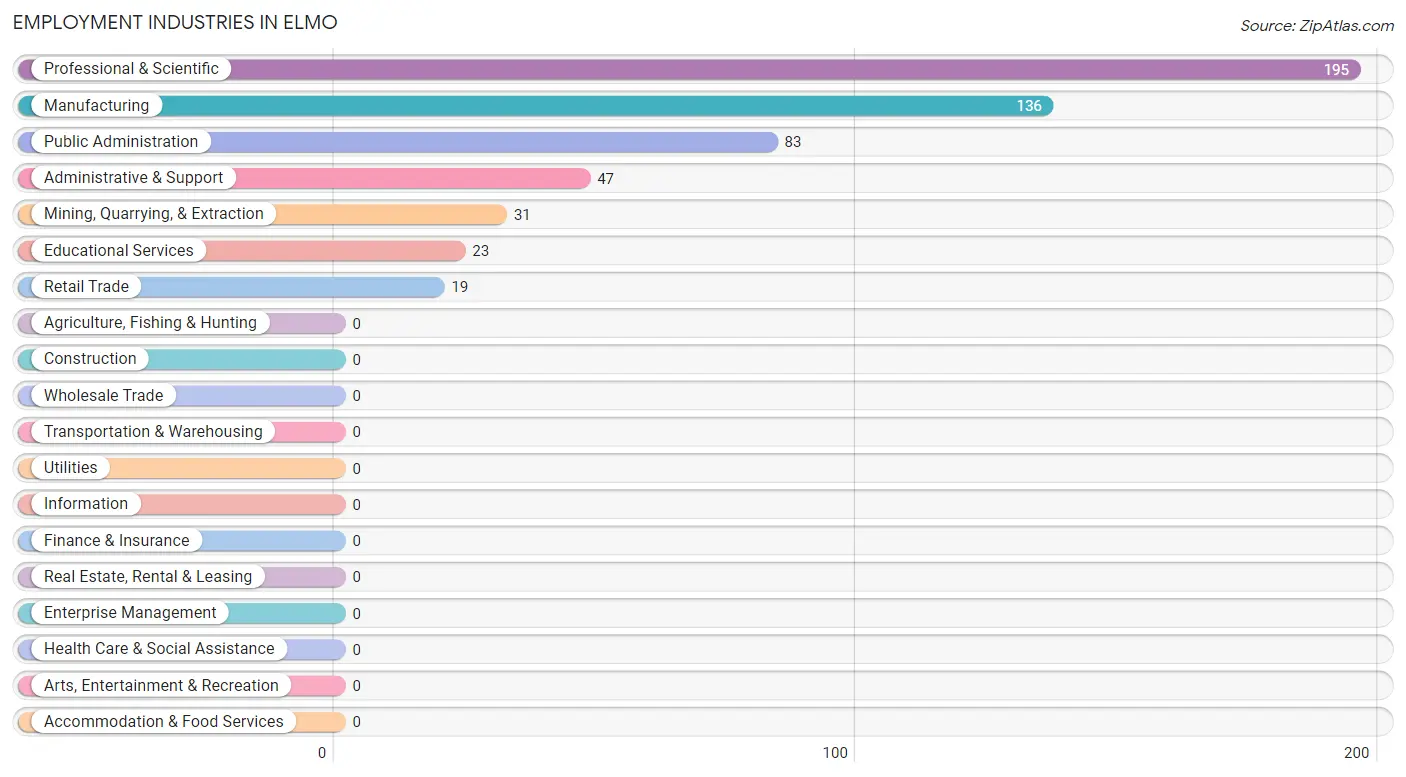
Employment Industries in Elmo
The major employment industries in Elmo include Professional & Scientific (195 | 34.7%), Manufacturing (136 | 24.2%), Public Administration (83 | 14.8%), Administrative & Support (47 | 8.4%), and Mining, Quarrying, & Extraction (31 | 5.5%).
Employment Industries by Sex in Elmo
The Elmo industries that see more men than women are Mining, Quarrying, & Extraction (100.0%), Administrative & Support (100.0%), and Public Administration (100.0%), whereas the industries that tend to have a higher number of women are Retail Trade (100.0%), Professional & Scientific (100.0%), and Educational Services (100.0%).
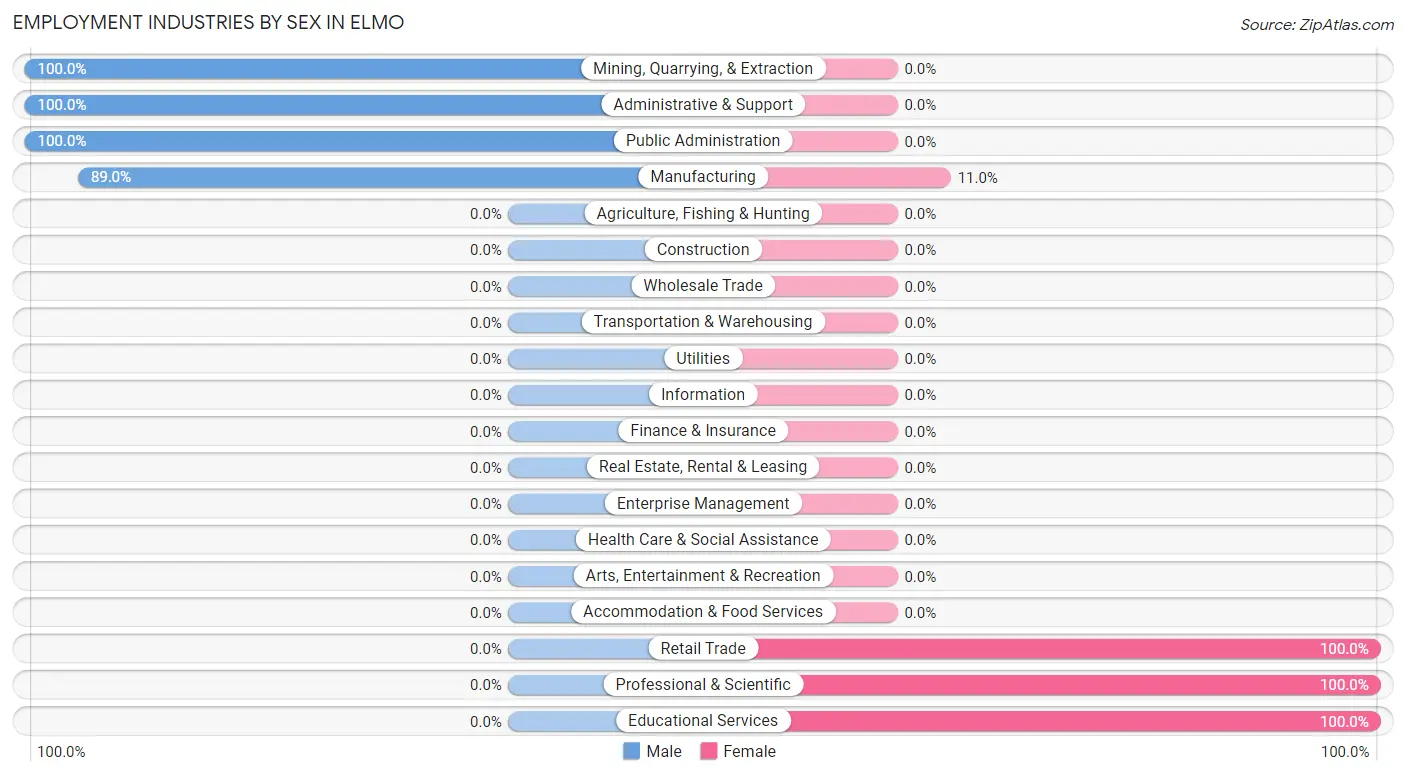
| Industry | Male | Female |
| Agriculture, Fishing & Hunting | 0 (0.0%) | 0 (0.0%) |
| Mining, Quarrying, & Extraction | 31 (100.0%) | 0 (0.0%) |
| Construction | 0 (0.0%) | 0 (0.0%) |
| Manufacturing | 121 (89.0%) | 15 (11.0%) |
| Wholesale Trade | 0 (0.0%) | 0 (0.0%) |
| Retail Trade | 0 (0.0%) | 19 (100.0%) |
| Transportation & Warehousing | 0 (0.0%) | 0 (0.0%) |
| Utilities | 0 (0.0%) | 0 (0.0%) |
| Information | 0 (0.0%) | 0 (0.0%) |
| Finance & Insurance | 0 (0.0%) | 0 (0.0%) |
| Real Estate, Rental & Leasing | 0 (0.0%) | 0 (0.0%) |
| Professional & Scientific | 0 (0.0%) | 195 (100.0%) |
| Enterprise Management | 0 (0.0%) | 0 (0.0%) |
| Administrative & Support | 47 (100.0%) | 0 (0.0%) |
| Educational Services | 0 (0.0%) | 23 (100.0%) |
| Health Care & Social Assistance | 0 (0.0%) | 0 (0.0%) |
| Arts, Entertainment & Recreation | 0 (0.0%) | 0 (0.0%) |
| Accommodation & Food Services | 0 (0.0%) | 0 (0.0%) |
| Public Administration | 83 (100.0%) | 0 (0.0%) |
| Total | 282 (50.2%) | 280 (49.8%) |
Education in Elmo
School Enrollment in Elmo
| School Level | # Students | % Students |
| Nursery / Preschool | 0 | 0.0% |
| Kindergarten | 0 | 0.0% |
| Elementary School | 0 | 0.0% |
| Middle School | 0 | 0.0% |
| High School | 0 | 0.0% |
| College / Undergraduate | 0 | 0.0% |
| Graduate / Professional | 0 | 0.0% |
| Total | 0 | 0.0% |
School Enrollment by Age by Funding Source in Elmo
| Age Bracket | Public School | Private School |
| 3 to 4 Year Olds | 0 (0.0%) | 0 (0.0%) |
| 5 to 9 Year Old | 0 (0.0%) | 0 (0.0%) |
| 10 to 14 Year Olds | 0 (0.0%) | 0 (0.0%) |
| 15 to 17 Year Olds | 0 (0.0%) | 0 (0.0%) |
| 18 to 19 Year Olds | 0 (0.0%) | 0 (0.0%) |
| 20 to 24 Year Olds | 0 (0.0%) | 0 (0.0%) |
| 25 to 34 Year Olds | 0 (0.0%) | 0 (0.0%) |
| 35 Years and over | 0 (0.0%) | 0 (0.0%) |
| Total | 0 (0.0%) | 0 (0.0%) |
Educational Attainment by Field of Study in Elmo
Bio, nature & agricultural (14 | 35.0%), engineering (13 | 32.5%), and science & technology (13 | 32.5%) are the most common fields of study among 40 individuals in Elmo who have obtained a bachelor's degree or higher.
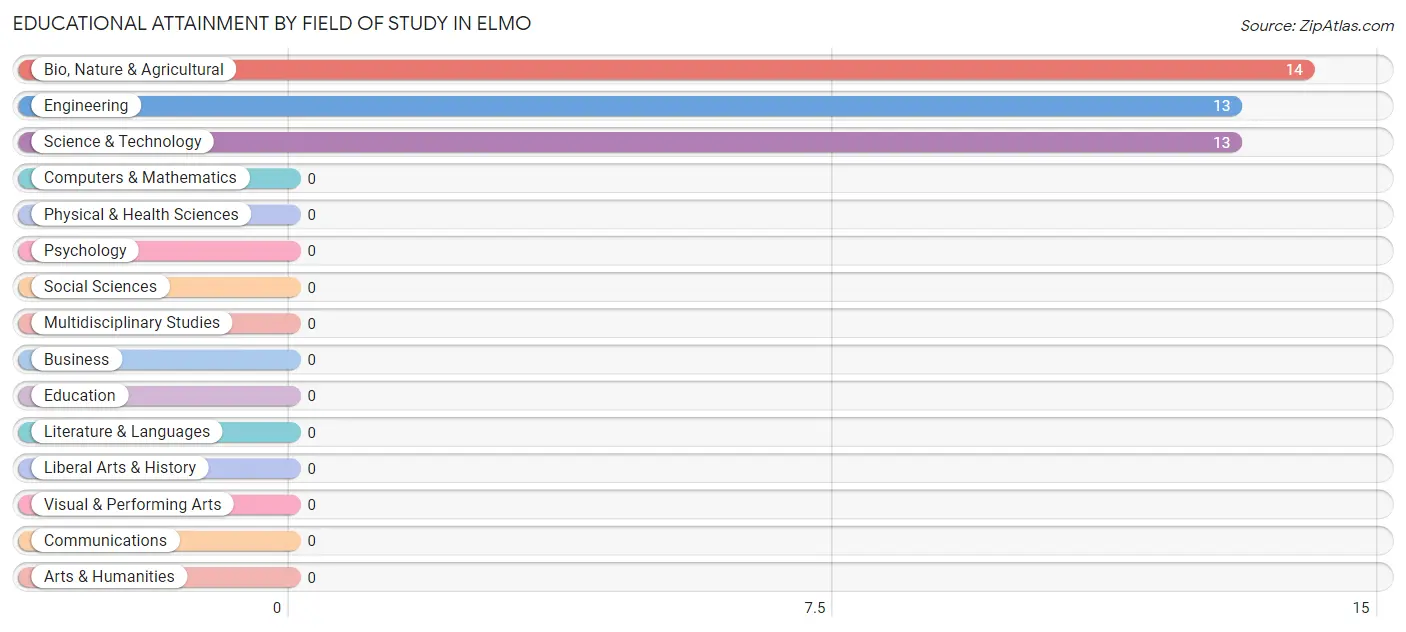
| Field of Study | # Graduates | % Graduates |
| Computers & Mathematics | 0 | 0.0% |
| Bio, Nature & Agricultural | 14 | 35.0% |
| Physical & Health Sciences | 0 | 0.0% |
| Psychology | 0 | 0.0% |
| Social Sciences | 0 | 0.0% |
| Engineering | 13 | 32.5% |
| Multidisciplinary Studies | 0 | 0.0% |
| Science & Technology | 13 | 32.5% |
| Business | 0 | 0.0% |
| Education | 0 | 0.0% |
| Literature & Languages | 0 | 0.0% |
| Liberal Arts & History | 0 | 0.0% |
| Visual & Performing Arts | 0 | 0.0% |
| Communications | 0 | 0.0% |
| Arts & Humanities | 0 | 0.0% |
| Total | 40 | 100.0% |
Transportation & Commute in Elmo
Vehicle Availability by Sex in Elmo
The most prevalent vehicle ownership categories in Elmo are males with 3 vehicles (204, accounting for 72.3%) and females with 3 vehicles (28, making up 72.9%).
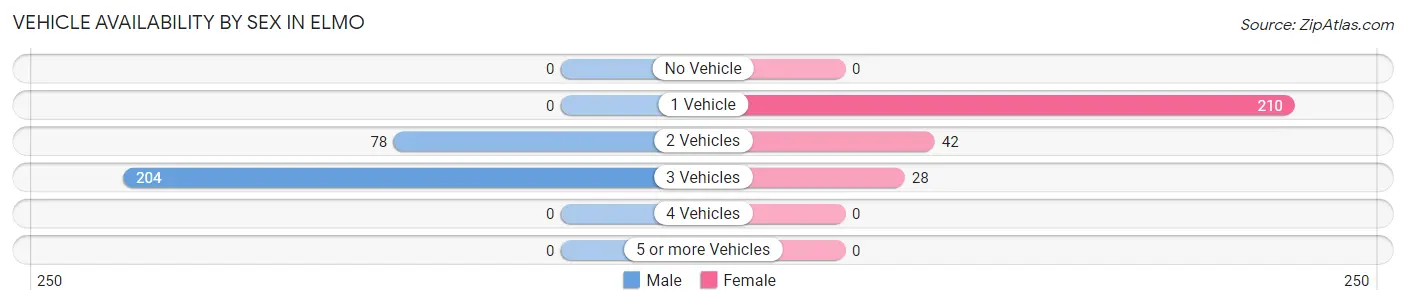
| Vehicles Available | Male | Female |
| No Vehicle | 0 (0.0%) | 0 (0.0%) |
| 1 Vehicle | 0 (0.0%) | 210 (75.0%) |
| 2 Vehicles | 78 (27.7%) | 42 (15.0%) |
| 3 Vehicles | 204 (72.3%) | 28 (10.0%) |
| 4 Vehicles | 0 (0.0%) | 0 (0.0%) |
| 5 or more Vehicles | 0 (0.0%) | 0 (0.0%) |
| Total | 282 (100.0%) | 280 (100.0%) |
Commute Time in Elmo
The most frequently occuring commute durations in Elmo are 45 to 59 minutes (220 commuters, 40.1%), 30 to 34 minutes (189 commuters, 34.4%), and 40 to 44 minutes (102 commuters, 18.6%).
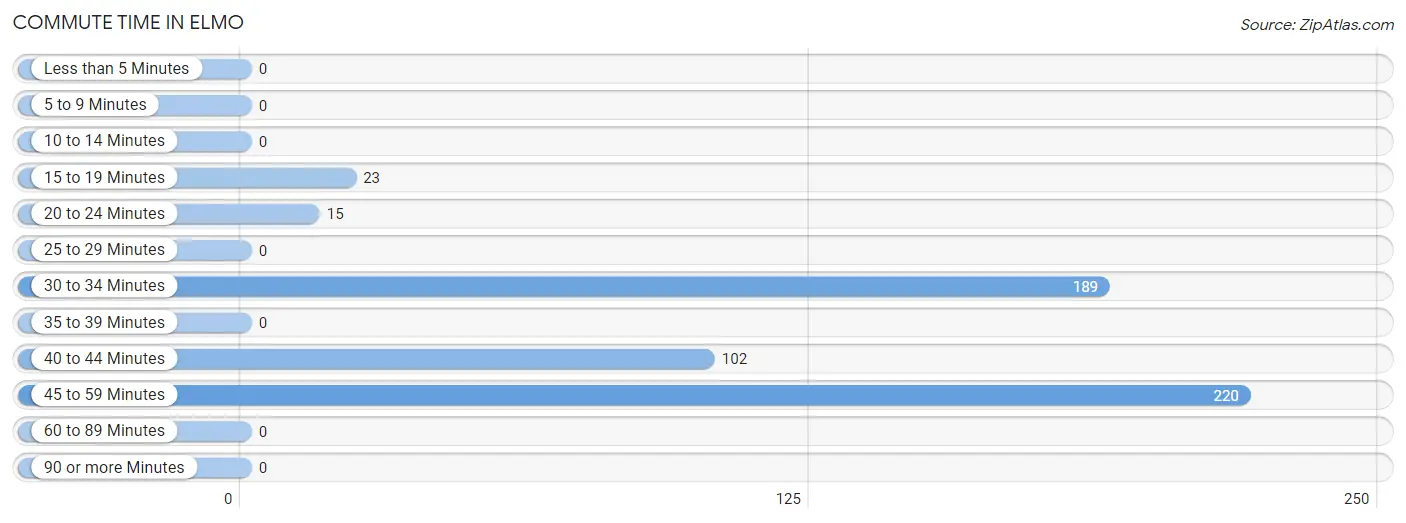
| Commute Time | # Commuters | % Commuters |
| Less than 5 Minutes | 0 | 0.0% |
| 5 to 9 Minutes | 0 | 0.0% |
| 10 to 14 Minutes | 0 | 0.0% |
| 15 to 19 Minutes | 23 | 4.2% |
| 20 to 24 Minutes | 15 | 2.7% |
| 25 to 29 Minutes | 0 | 0.0% |
| 30 to 34 Minutes | 189 | 34.4% |
| 35 to 39 Minutes | 0 | 0.0% |
| 40 to 44 Minutes | 102 | 18.6% |
| 45 to 59 Minutes | 220 | 40.1% |
| 60 to 89 Minutes | 0 | 0.0% |
| 90 or more Minutes | 0 | 0.0% |
Commute Time by Sex in Elmo
The most common commute times in Elmo are 30 to 34 minutes (189 commuters, 67.0%) for males and 45 to 59 minutes (210 commuters, 78.6%) for females.
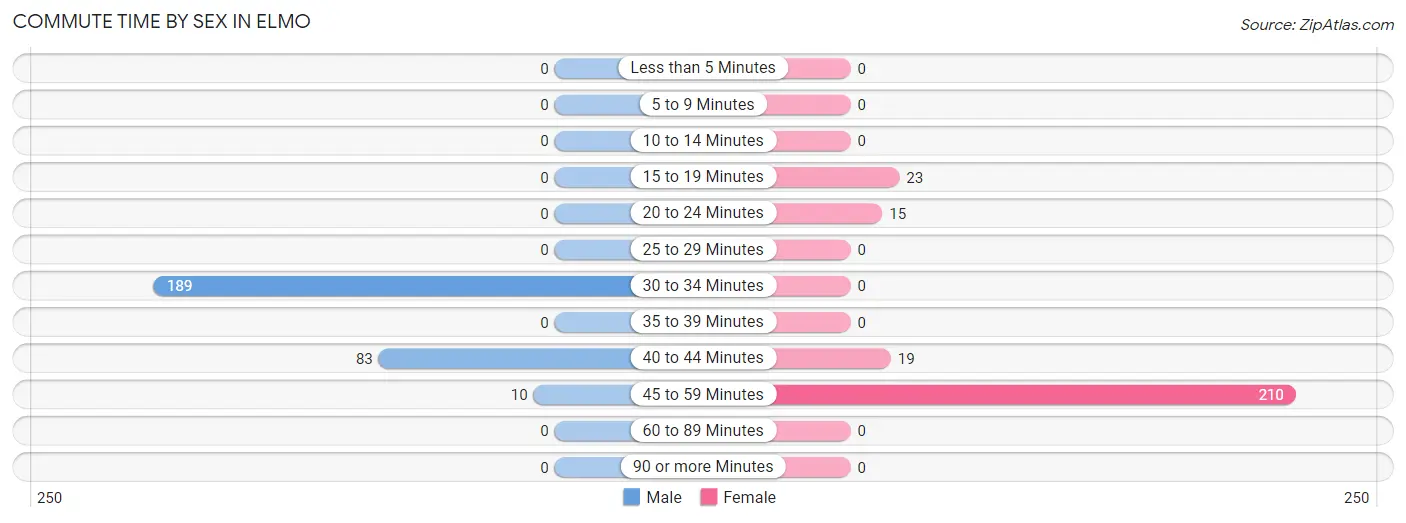
| Commute Time | Male | Female |
| Less than 5 Minutes | 0 (0.0%) | 0 (0.0%) |
| 5 to 9 Minutes | 0 (0.0%) | 0 (0.0%) |
| 10 to 14 Minutes | 0 (0.0%) | 0 (0.0%) |
| 15 to 19 Minutes | 0 (0.0%) | 23 (8.6%) |
| 20 to 24 Minutes | 0 (0.0%) | 15 (5.6%) |
| 25 to 29 Minutes | 0 (0.0%) | 0 (0.0%) |
| 30 to 34 Minutes | 189 (67.0%) | 0 (0.0%) |
| 35 to 39 Minutes | 0 (0.0%) | 0 (0.0%) |
| 40 to 44 Minutes | 83 (29.4%) | 19 (7.1%) |
| 45 to 59 Minutes | 10 (3.5%) | 210 (78.6%) |
| 60 to 89 Minutes | 0 (0.0%) | 0 (0.0%) |
| 90 or more Minutes | 0 (0.0%) | 0 (0.0%) |
Time of Departure to Work by Sex in Elmo
The most frequent times of departure to work in Elmo are 4:00 PM to 11:59 PM (111, 39.4%) for males and 9:00 AM to 9:59 AM (196, 73.4%) for females.
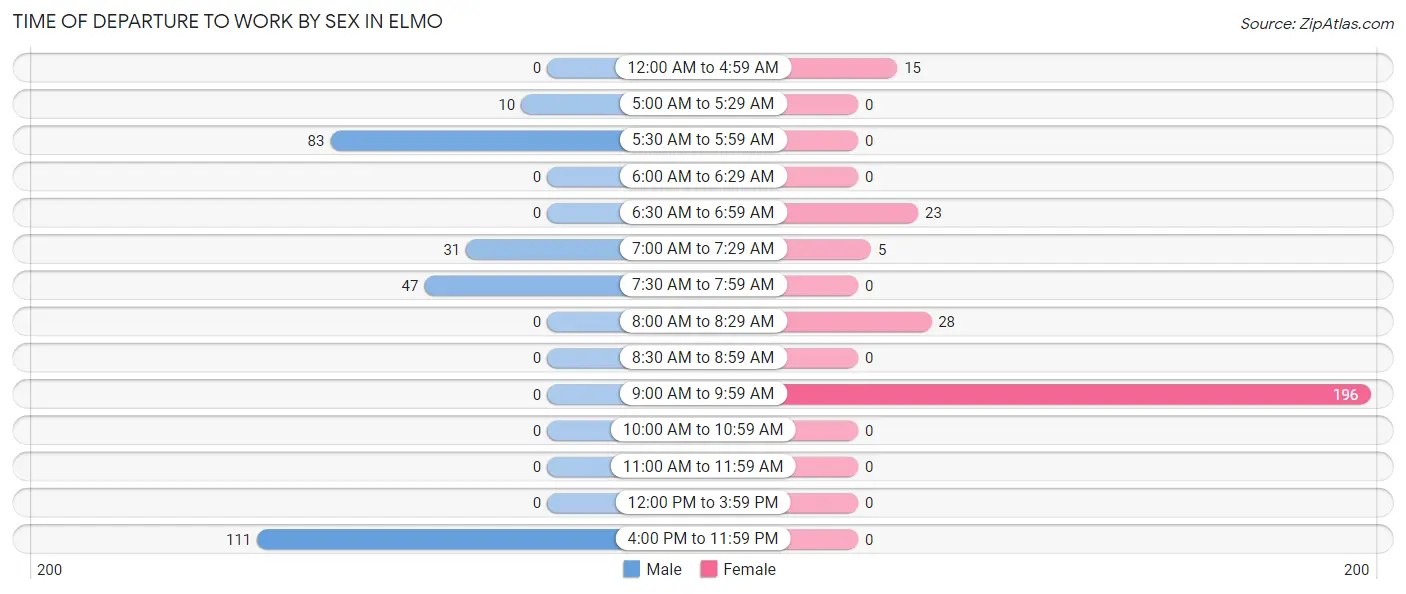
| Time of Departure | Male | Female |
| 12:00 AM to 4:59 AM | 0 (0.0%) | 15 (5.6%) |
| 5:00 AM to 5:29 AM | 10 (3.5%) | 0 (0.0%) |
| 5:30 AM to 5:59 AM | 83 (29.4%) | 0 (0.0%) |
| 6:00 AM to 6:29 AM | 0 (0.0%) | 0 (0.0%) |
| 6:30 AM to 6:59 AM | 0 (0.0%) | 23 (8.6%) |
| 7:00 AM to 7:29 AM | 31 (11.0%) | 5 (1.9%) |
| 7:30 AM to 7:59 AM | 47 (16.7%) | 0 (0.0%) |
| 8:00 AM to 8:29 AM | 0 (0.0%) | 28 (10.5%) |
| 8:30 AM to 8:59 AM | 0 (0.0%) | 0 (0.0%) |
| 9:00 AM to 9:59 AM | 0 (0.0%) | 196 (73.4%) |
| 10:00 AM to 10:59 AM | 0 (0.0%) | 0 (0.0%) |
| 11:00 AM to 11:59 AM | 0 (0.0%) | 0 (0.0%) |
| 12:00 PM to 3:59 PM | 0 (0.0%) | 0 (0.0%) |
| 4:00 PM to 11:59 PM | 111 (39.4%) | 0 (0.0%) |
| Total | 282 (100.0%) | 267 (100.0%) |
Housing Occupancy in Elmo
Occupancy by Ownership in Elmo
Of the total 486 dwellings in Elmo, owner-occupied units account for 251 (51.6%), while renter-occupied units make up 235 (48.3%).
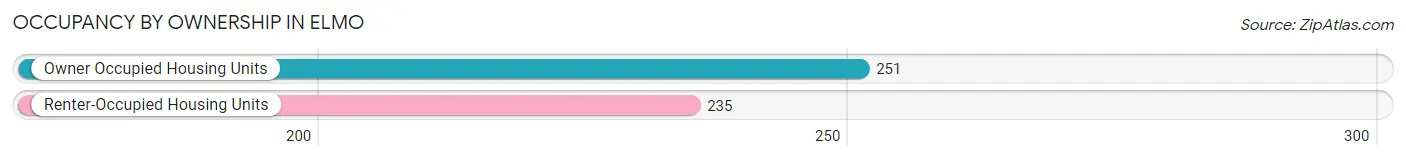
| Occupancy | # Housing Units | % Housing Units |
| Owner Occupied Housing Units | 251 | 51.6% |
| Renter-Occupied Housing Units | 235 | 48.3% |
| Total Occupied Housing Units | 486 | 100.0% |
Occupancy by Household Size in Elmo
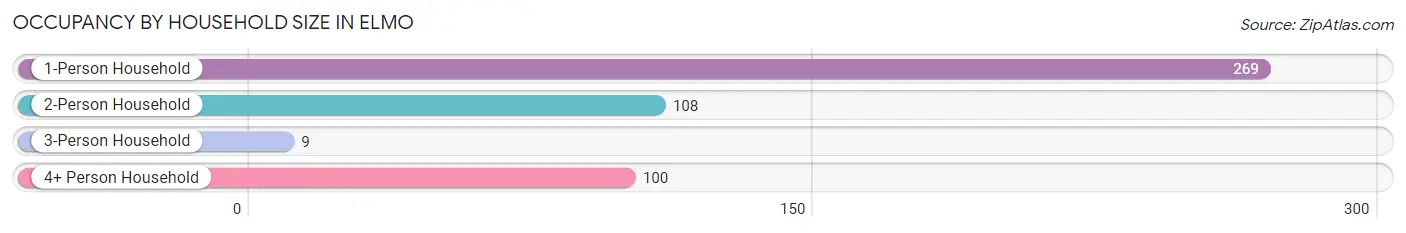
| Household Size | # Housing Units | % Housing Units |
| 1-Person Household | 269 | 55.3% |
| 2-Person Household | 108 | 22.2% |
| 3-Person Household | 9 | 1.8% |
| 4+ Person Household | 100 | 20.6% |
| Total Housing Units | 486 | 100.0% |
Occupancy by Ownership by Household Size in Elmo
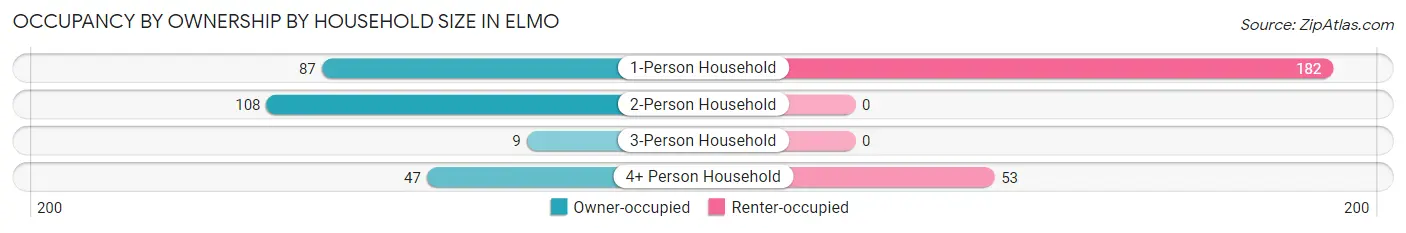
| Household Size | Owner-occupied | Renter-occupied |
| 1-Person Household | 87 (32.3%) | 182 (67.7%) |
| 2-Person Household | 108 (100.0%) | 0 (0.0%) |
| 3-Person Household | 9 (100.0%) | 0 (0.0%) |
| 4+ Person Household | 47 (47.0%) | 53 (53.0%) |
| Total Housing Units | 251 (51.6%) | 235 (48.3%) |
Occupancy by Educational Attainment in Elmo
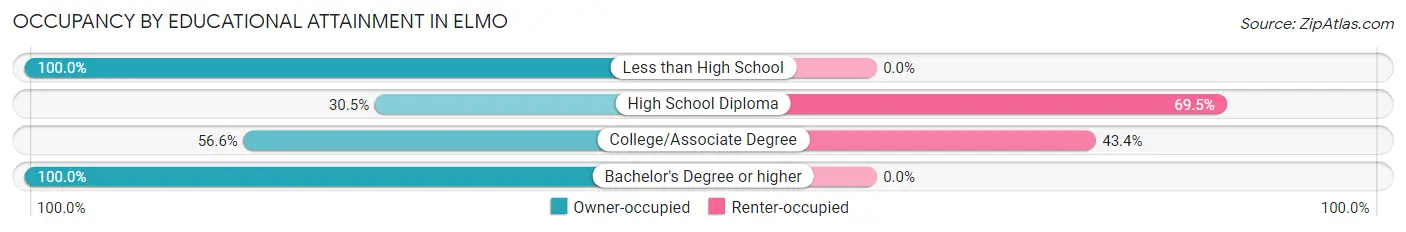
| Household Size | Owner-occupied | Renter-occupied |
| Less than High School | 89 (100.0%) | 0 (0.0%) |
| High School Diploma | 80 (30.5%) | 182 (69.5%) |
| College/Associate Degree | 69 (56.6%) | 53 (43.4%) |
| Bachelor's Degree or higher | 13 (100.0%) | 0 (0.0%) |
Occupancy by Age of Householder in Elmo
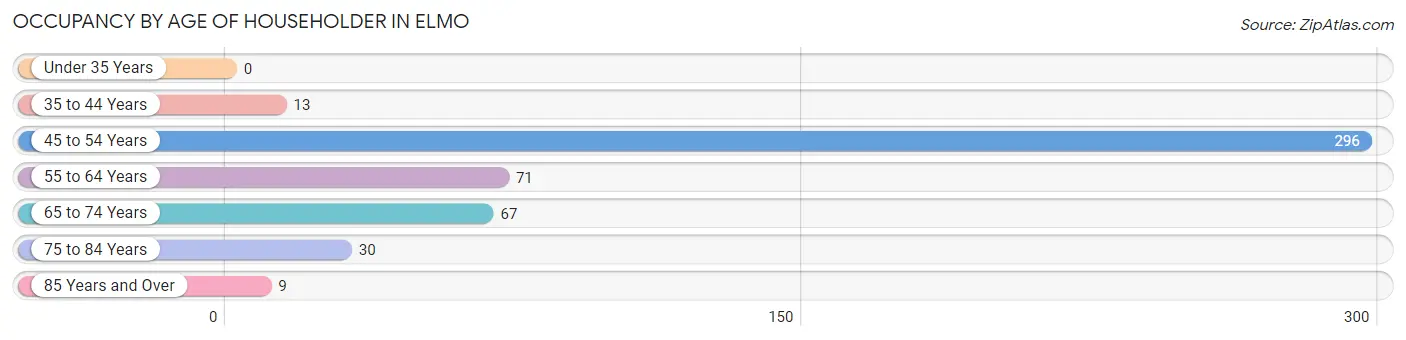
| Age Bracket | # Households | % Households |
| Under 35 Years | 0 | 0.0% |
| 35 to 44 Years | 13 | 2.7% |
| 45 to 54 Years | 296 | 60.9% |
| 55 to 64 Years | 71 | 14.6% |
| 65 to 74 Years | 67 | 13.8% |
| 75 to 84 Years | 30 | 6.2% |
| 85 Years and Over | 9 | 1.8% |
| Total | 486 | 100.0% |
Housing Finances in Elmo
Median Income by Occupancy in Elmo
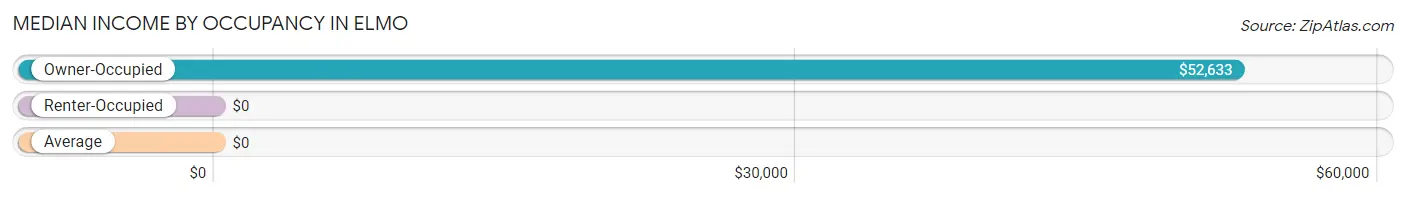
| Occupancy Type | # Households | Median Income |
| Owner-Occupied | 251 (51.6%) | $52,633 |
| Renter-Occupied | 235 (48.3%) | $0 |
| Average | 486 (100.0%) | $0 |
Occupancy by Householder Income Bracket in Elmo
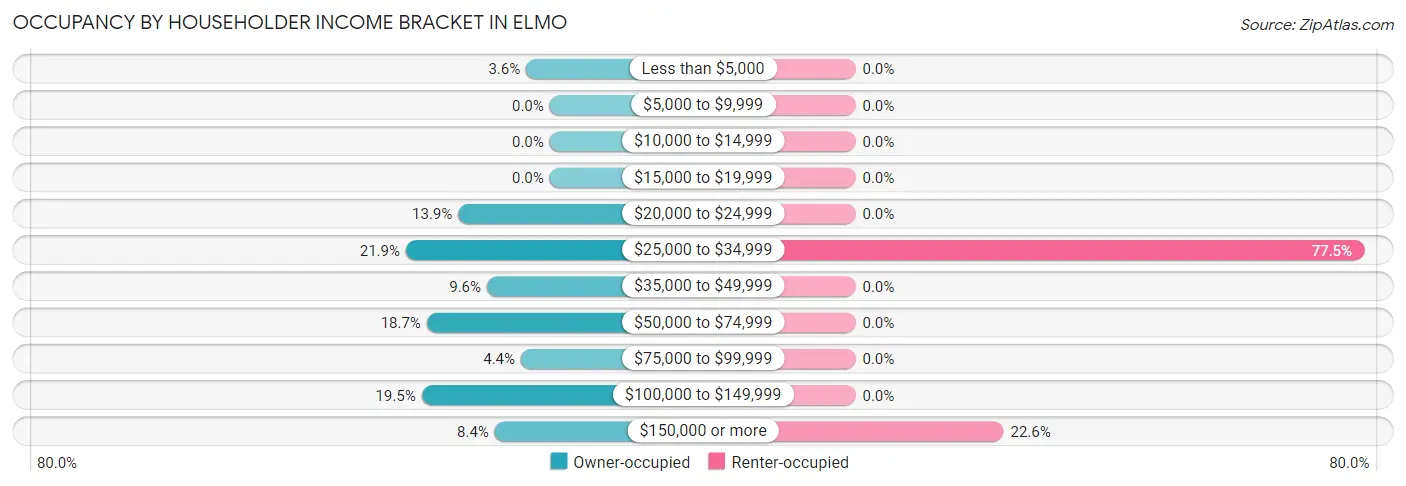
| Income Bracket | Owner-occupied | Renter-occupied |
| Less than $5,000 | 9 (3.6%) | 0 (0.0%) |
| $5,000 to $9,999 | 0 (0.0%) | 0 (0.0%) |
| $10,000 to $14,999 | 0 (0.0%) | 0 (0.0%) |
| $15,000 to $19,999 | 0 (0.0%) | 0 (0.0%) |
| $20,000 to $24,999 | 35 (13.9%) | 0 (0.0%) |
| $25,000 to $34,999 | 55 (21.9%) | 182 (77.4%) |
| $35,000 to $49,999 | 24 (9.6%) | 0 (0.0%) |
| $50,000 to $74,999 | 47 (18.7%) | 0 (0.0%) |
| $75,000 to $99,999 | 11 (4.4%) | 0 (0.0%) |
| $100,000 to $149,999 | 49 (19.5%) | 0 (0.0%) |
| $150,000 or more | 21 (8.4%) | 53 (22.6%) |
| Total | 251 (100.0%) | 235 (100.0%) |
Monthly Housing Cost Tiers in Elmo
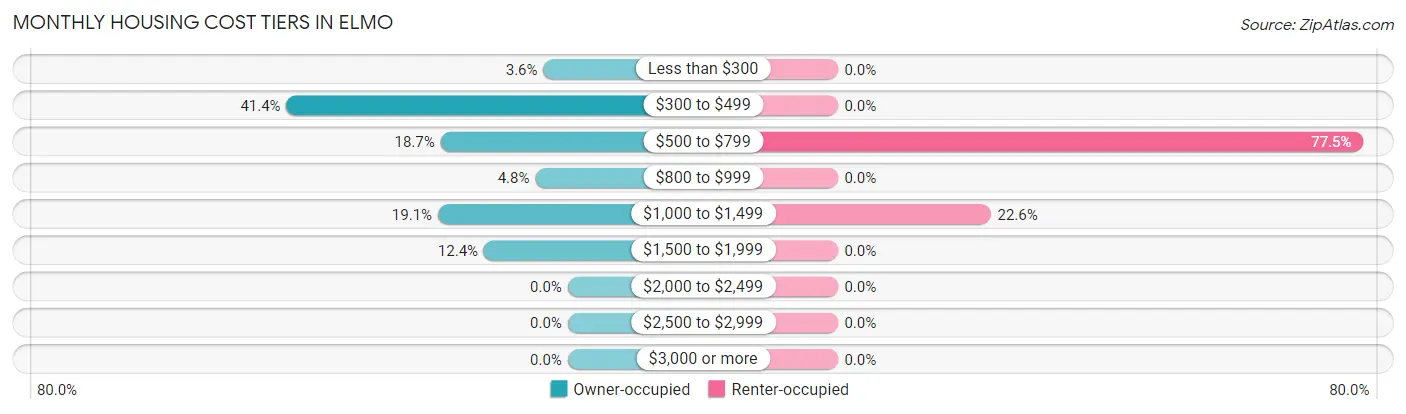
| Monthly Cost | Owner-occupied | Renter-occupied |
| Less than $300 | 9 (3.6%) | 0 (0.0%) |
| $300 to $499 | 104 (41.4%) | 0 (0.0%) |
| $500 to $799 | 47 (18.7%) | 182 (77.4%) |
| $800 to $999 | 12 (4.8%) | 0 (0.0%) |
| $1,000 to $1,499 | 48 (19.1%) | 53 (22.6%) |
| $1,500 to $1,999 | 31 (12.3%) | 0 (0.0%) |
| $2,000 to $2,499 | 0 (0.0%) | 0 (0.0%) |
| $2,500 to $2,999 | 0 (0.0%) | 0 (0.0%) |
| $3,000 or more | 0 (0.0%) | 0 (0.0%) |
| Total | 251 (100.0%) | 235 (100.0%) |
Physical Housing Characteristics in Elmo
Housing Structures in Elmo
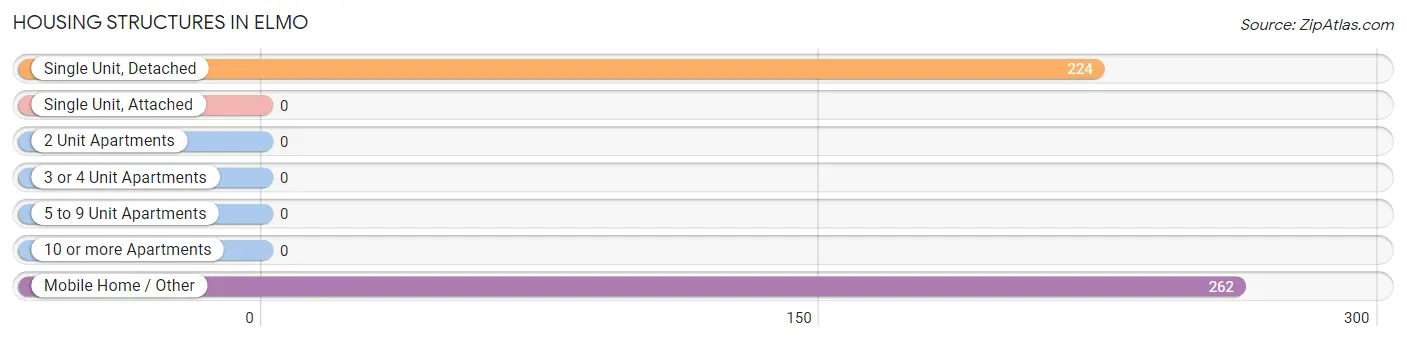
| Structure Type | # Housing Units | % Housing Units |
| Single Unit, Detached | 224 | 46.1% |
| Single Unit, Attached | 0 | 0.0% |
| 2 Unit Apartments | 0 | 0.0% |
| 3 or 4 Unit Apartments | 0 | 0.0% |
| 5 to 9 Unit Apartments | 0 | 0.0% |
| 10 or more Apartments | 0 | 0.0% |
| Mobile Home / Other | 262 | 53.9% |
| Total | 486 | 100.0% |
Housing Structures by Occupancy in Elmo
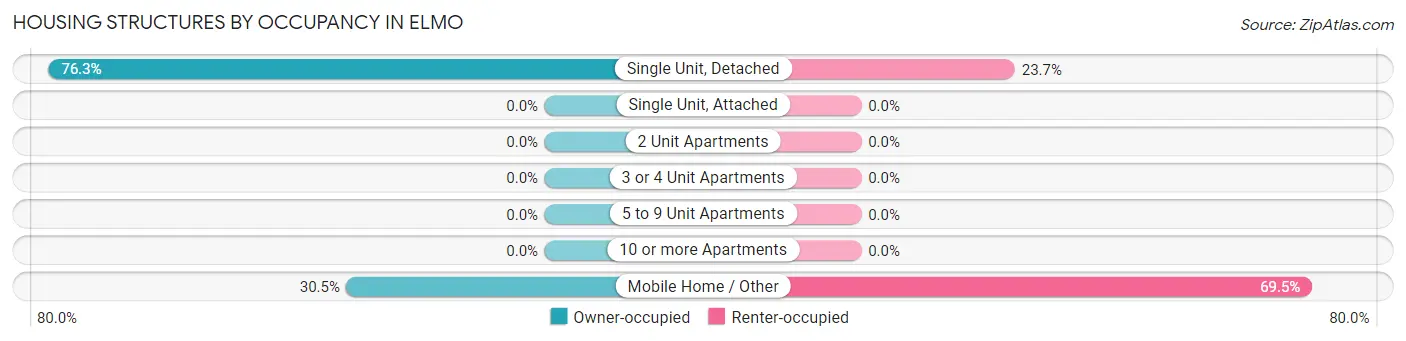
| Structure Type | Owner-occupied | Renter-occupied |
| Single Unit, Detached | 171 (76.3%) | 53 (23.7%) |
| Single Unit, Attached | 0 (0.0%) | 0 (0.0%) |
| 2 Unit Apartments | 0 (0.0%) | 0 (0.0%) |
| 3 or 4 Unit Apartments | 0 (0.0%) | 0 (0.0%) |
| 5 to 9 Unit Apartments | 0 (0.0%) | 0 (0.0%) |
| 10 or more Apartments | 0 (0.0%) | 0 (0.0%) |
| Mobile Home / Other | 80 (30.5%) | 182 (69.5%) |
| Total | 251 (51.6%) | 235 (48.3%) |
Housing Structures by Number of Rooms in Elmo
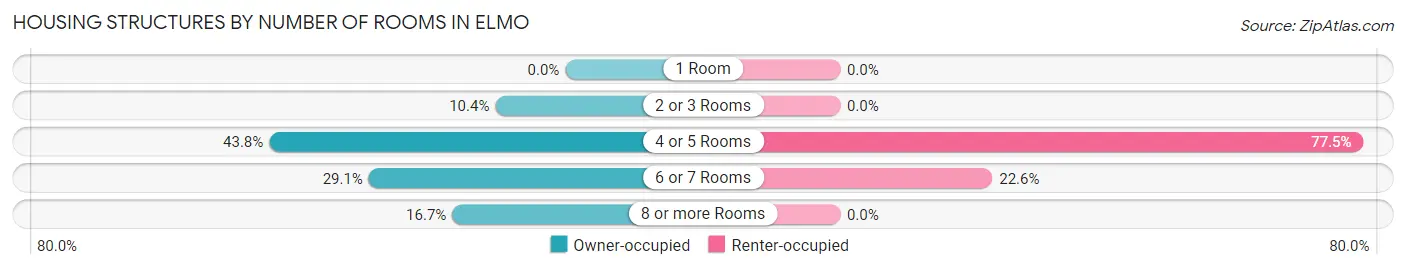
| Number of Rooms | Owner-occupied | Renter-occupied |
| 1 Room | 0 (0.0%) | 0 (0.0%) |
| 2 or 3 Rooms | 26 (10.4%) | 0 (0.0%) |
| 4 or 5 Rooms | 110 (43.8%) | 182 (77.4%) |
| 6 or 7 Rooms | 73 (29.1%) | 53 (22.6%) |
| 8 or more Rooms | 42 (16.7%) | 0 (0.0%) |
| Total | 251 (100.0%) | 235 (100.0%) |
Housing Structure by Heating Type in Elmo
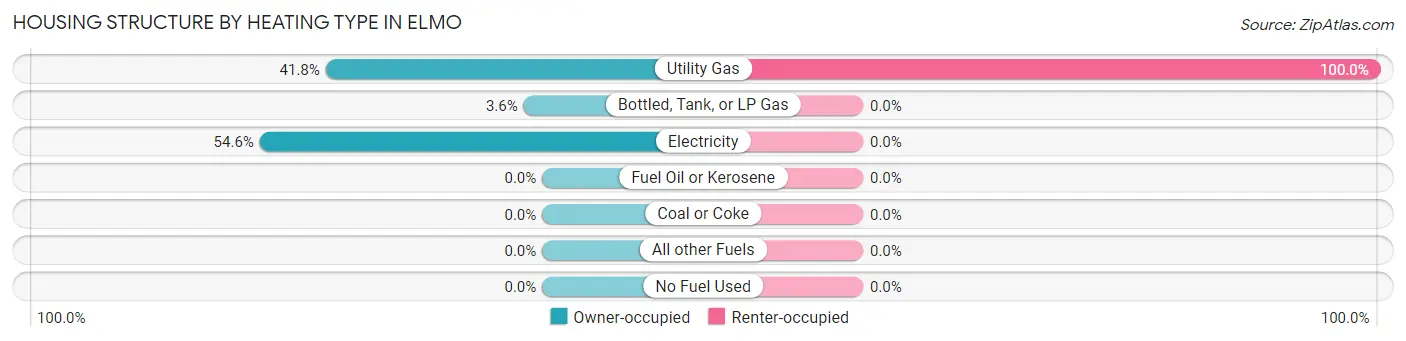
| Heating Type | Owner-occupied | Renter-occupied |
| Utility Gas | 105 (41.8%) | 235 (100.0%) |
| Bottled, Tank, or LP Gas | 9 (3.6%) | 0 (0.0%) |
| Electricity | 137 (54.6%) | 0 (0.0%) |
| Fuel Oil or Kerosene | 0 (0.0%) | 0 (0.0%) |
| Coal or Coke | 0 (0.0%) | 0 (0.0%) |
| All other Fuels | 0 (0.0%) | 0 (0.0%) |
| No Fuel Used | 0 (0.0%) | 0 (0.0%) |
| Total | 251 (100.0%) | 235 (100.0%) |
Household Vehicle Usage in Elmo
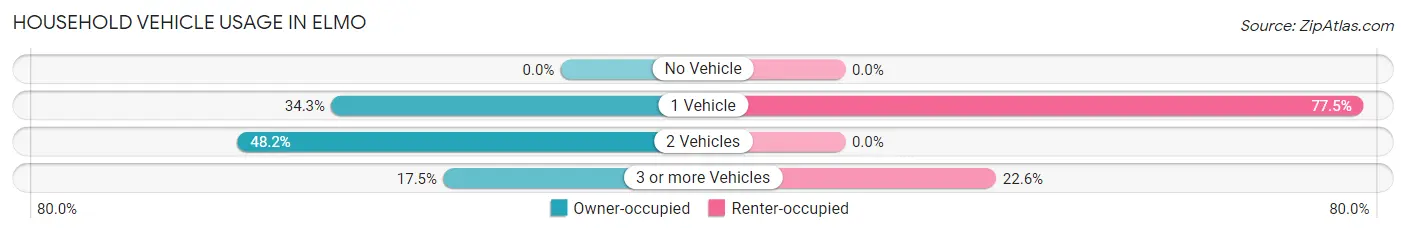
| Vehicles per Household | Owner-occupied | Renter-occupied |
| No Vehicle | 0 (0.0%) | 0 (0.0%) |
| 1 Vehicle | 86 (34.3%) | 182 (77.4%) |
| 2 Vehicles | 121 (48.2%) | 0 (0.0%) |
| 3 or more Vehicles | 44 (17.5%) | 53 (22.6%) |
| Total | 251 (100.0%) | 235 (100.0%) |
Real Estate & Mortgages in Elmo
Real Estate and Mortgage Overview in Elmo
| Characteristic | Without Mortgage | With Mortgage |
| Housing Units | 172 | 79 |
| Median Property Value | - | - |
| Median Household Income | $49,444 | $0 |
| Monthly Housing Costs | $453 | $0 |
| Real Estate Taxes | $518 | $0 |
Property Value by Mortgage Status in Elmo
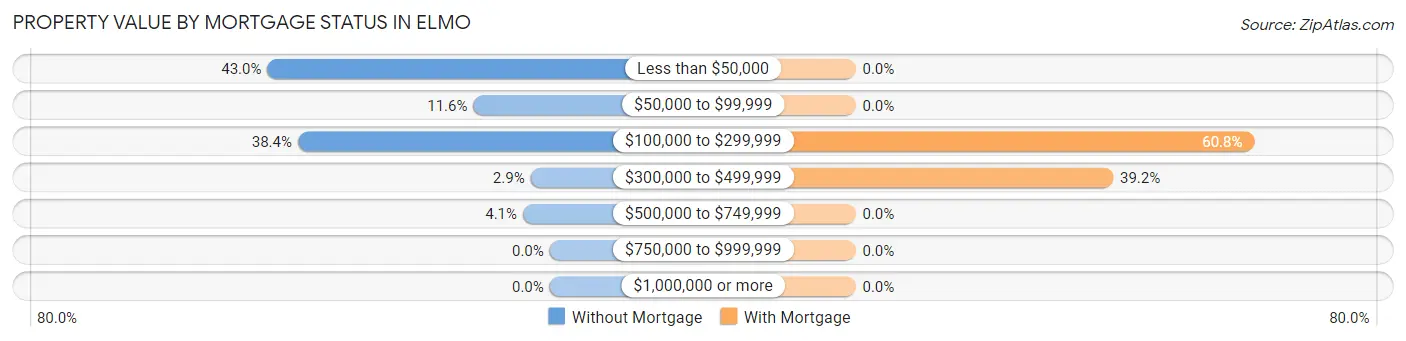
| Property Value | Without Mortgage | With Mortgage |
| Less than $50,000 | 74 (43.0%) | 0 (0.0%) |
| $50,000 to $99,999 | 20 (11.6%) | 0 (0.0%) |
| $100,000 to $299,999 | 66 (38.4%) | 48 (60.8%) |
| $300,000 to $499,999 | 5 (2.9%) | 31 (39.2%) |
| $500,000 to $749,999 | 7 (4.1%) | 0 (0.0%) |
| $750,000 to $999,999 | 0 (0.0%) | 0 (0.0%) |
| $1,000,000 or more | 0 (0.0%) | 0 (0.0%) |
| Total | 172 (100.0%) | 79 (100.0%) |
Household Income by Mortgage Status in Elmo
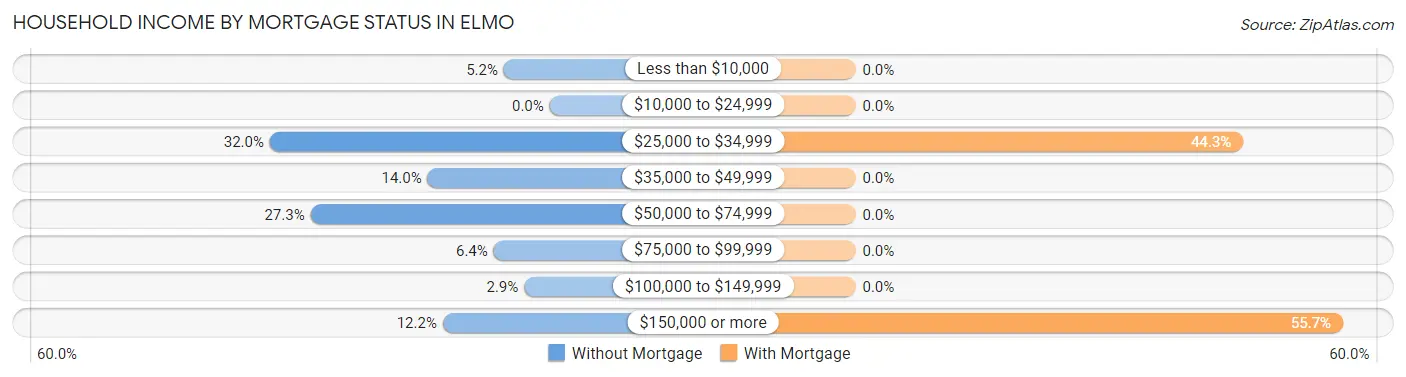
| Household Income | Without Mortgage | With Mortgage |
| Less than $10,000 | 9 (5.2%) | 0 (0.0%) |
| $10,000 to $24,999 | 0 (0.0%) | 0 (0.0%) |
| $25,000 to $34,999 | 55 (32.0%) | 35 (44.3%) |
| $35,000 to $49,999 | 24 (14.0%) | 0 (0.0%) |
| $50,000 to $74,999 | 47 (27.3%) | 0 (0.0%) |
| $75,000 to $99,999 | 11 (6.4%) | 0 (0.0%) |
| $100,000 to $149,999 | 5 (2.9%) | 0 (0.0%) |
| $150,000 or more | 21 (12.2%) | 44 (55.7%) |
| Total | 172 (100.0%) | 79 (100.0%) |
Property Value to Household Income Ratio in Elmo
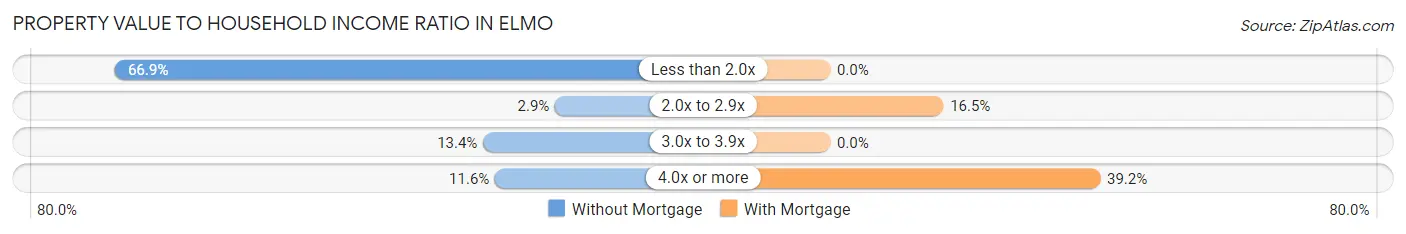
| Value-to-Income Ratio | Without Mortgage | With Mortgage |
| Less than 2.0x | 115 (66.9%) | 0 (0.0%) |
| 2.0x to 2.9x | 5 (2.9%) | 13 (16.5%) |
| 3.0x to 3.9x | 23 (13.4%) | 0 (0.0%) |
| 4.0x or more | 20 (11.6%) | 31 (39.2%) |
| Total | 172 (100.0%) | 79 (100.0%) |
Real Estate Taxes by Mortgage Status in Elmo
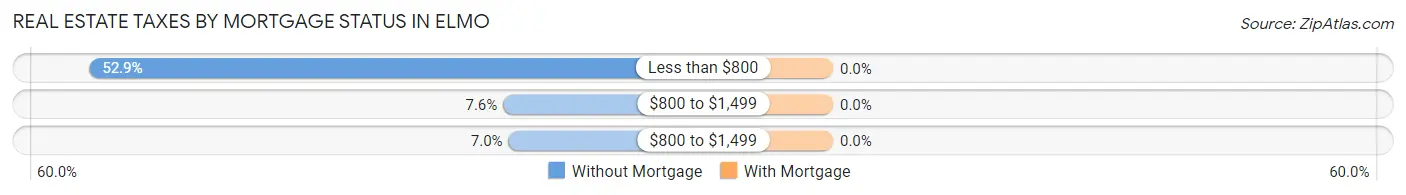
| Property Taxes | Without Mortgage | With Mortgage |
| Less than $800 | 91 (52.9%) | 0 (0.0%) |
| $800 to $1,499 | 13 (7.6%) | 0 (0.0%) |
| $800 to $1,499 | 12 (7.0%) | 0 (0.0%) |
| Total | 172 (100.0%) | 79 (100.0%) |
Health & Disability in Elmo
Health Insurance Coverage by Age in Elmo
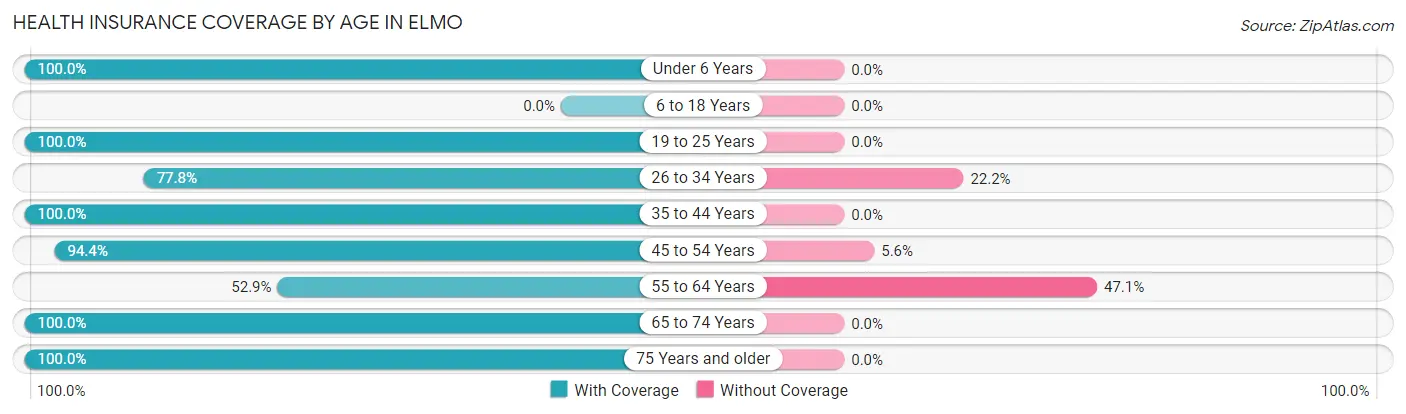
| Age Bracket | With Coverage | Without Coverage |
| Under 6 Years | 30 (100.0%) | 0 (0.0%) |
| 6 to 18 Years | 0 (0.0%) | 0 (0.0%) |
| 19 to 25 Years | 58 (100.0%) | 0 (0.0%) |
| 26 to 34 Years | 49 (77.8%) | 14 (22.2%) |
| 35 to 44 Years | 96 (100.0%) | 0 (0.0%) |
| 45 to 54 Years | 355 (94.4%) | 21 (5.6%) |
| 55 to 64 Years | 92 (52.9%) | 82 (47.1%) |
| 65 to 74 Years | 147 (100.0%) | 0 (0.0%) |
| 75 Years and older | 58 (100.0%) | 0 (0.0%) |
| Total | 885 (88.3%) | 117 (11.7%) |
Health Insurance Coverage by Citizenship Status in Elmo
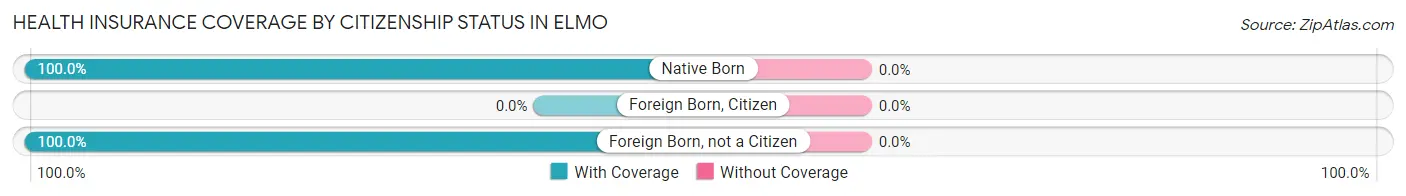
| Citizenship Status | With Coverage | Without Coverage |
| Native Born | 30 (100.0%) | 0 (0.0%) |
| Foreign Born, Citizen | 0 (0.0%) | 0 (0.0%) |
| Foreign Born, not a Citizen | 58 (100.0%) | 0 (0.0%) |
Health Insurance Coverage by Household Income in Elmo
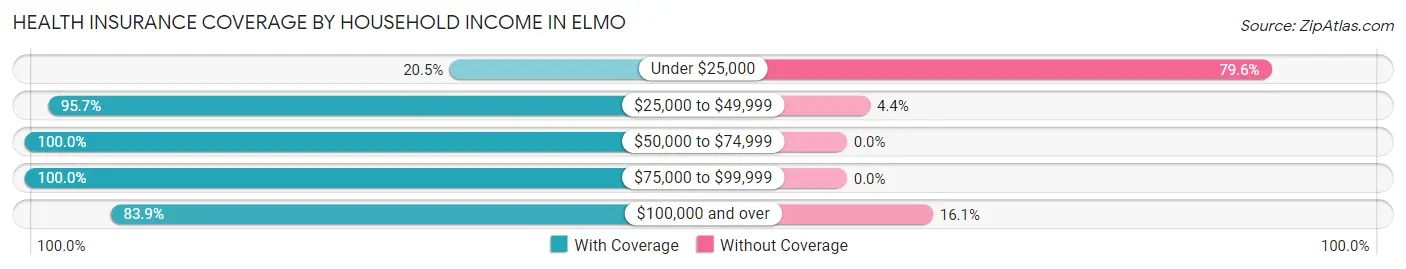
| Household Income | With Coverage | Without Coverage |
| Under $25,000 | 9 (20.4%) | 35 (79.5%) |
| $25,000 to $49,999 | 308 (95.7%) | 14 (4.3%) |
| $50,000 to $74,999 | 192 (100.0%) | 0 (0.0%) |
| $75,000 to $99,999 | 22 (100.0%) | 0 (0.0%) |
| $100,000 and over | 354 (83.9%) | 68 (16.1%) |
Public vs Private Health Insurance Coverage by Age in Elmo
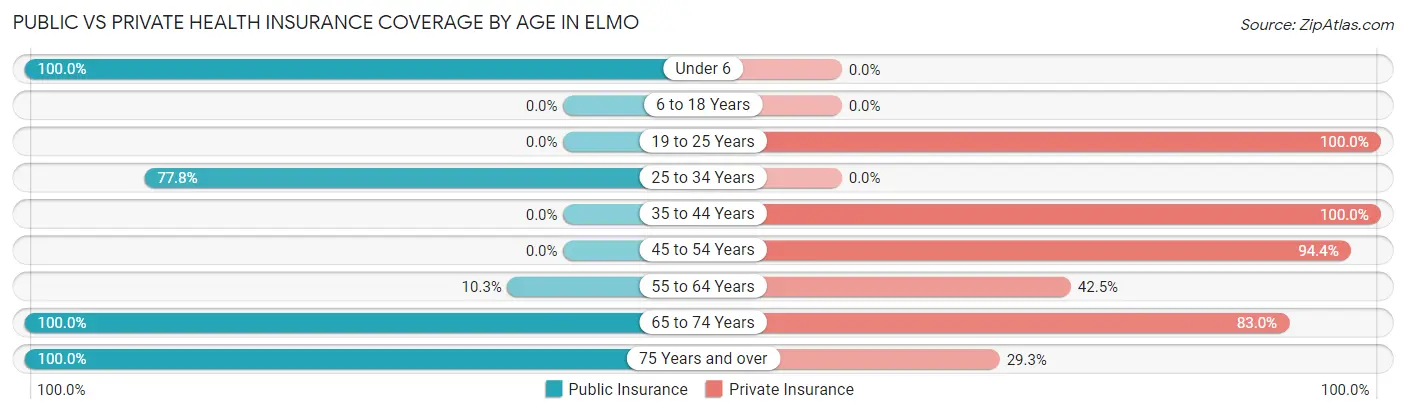
| Age Bracket | Public Insurance | Private Insurance |
| Under 6 | 30 (100.0%) | 0 (0.0%) |
| 6 to 18 Years | 0 (0.0%) | 0 (0.0%) |
| 19 to 25 Years | 0 (0.0%) | 58 (100.0%) |
| 25 to 34 Years | 49 (77.8%) | 0 (0.0%) |
| 35 to 44 Years | 0 (0.0%) | 96 (100.0%) |
| 45 to 54 Years | 0 (0.0%) | 355 (94.4%) |
| 55 to 64 Years | 18 (10.3%) | 74 (42.5%) |
| 65 to 74 Years | 147 (100.0%) | 122 (83.0%) |
| 75 Years and over | 58 (100.0%) | 17 (29.3%) |
| Total | 302 (30.1%) | 722 (72.1%) |
Disability Status by Sex by Age in Elmo
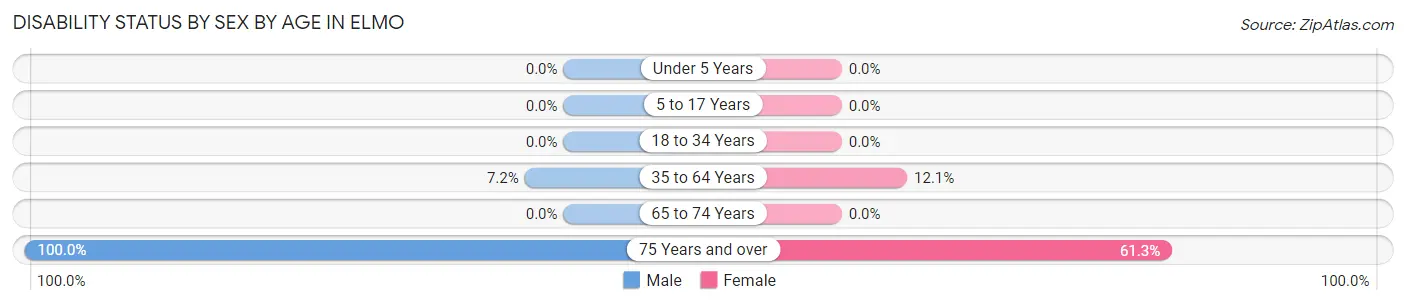
| Age Bracket | Male | Female |
| Under 5 Years | 0 (0.0%) | 0 (0.0%) |
| 5 to 17 Years | 0 (0.0%) | 0 (0.0%) |
| 18 to 34 Years | 0 (0.0%) | 0 (0.0%) |
| 35 to 64 Years | 18 (7.2%) | 48 (12.1%) |
| 65 to 74 Years | 0 (0.0%) | 0 (0.0%) |
| 75 Years and over | 27 (100.0%) | 19 (61.3%) |
Disability Class by Sex by Age in Elmo
Disability Class: Hearing Difficulty
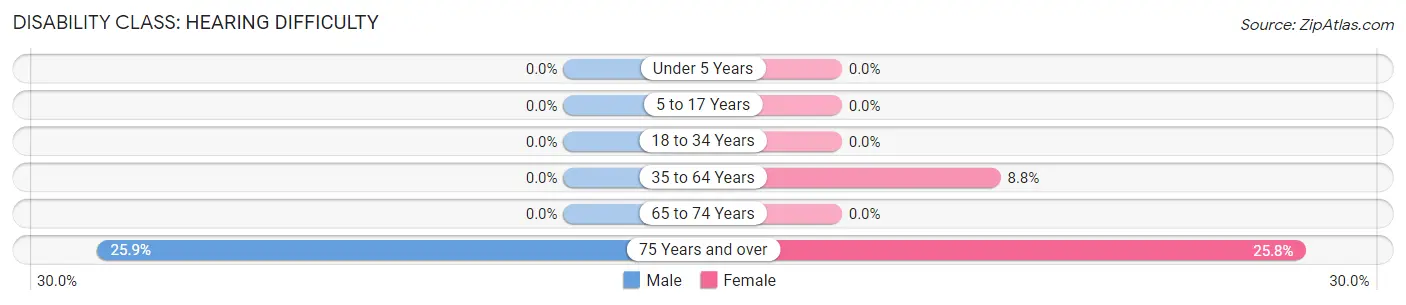
| Age Bracket | Male | Female |
| Under 5 Years | 0 (0.0%) | 0 (0.0%) |
| 5 to 17 Years | 0 (0.0%) | 0 (0.0%) |
| 18 to 34 Years | 0 (0.0%) | 0 (0.0%) |
| 35 to 64 Years | 0 (0.0%) | 35 (8.8%) |
| 65 to 74 Years | 0 (0.0%) | 0 (0.0%) |
| 75 Years and over | 7 (25.9%) | 8 (25.8%) |
Disability Class: Vision Difficulty
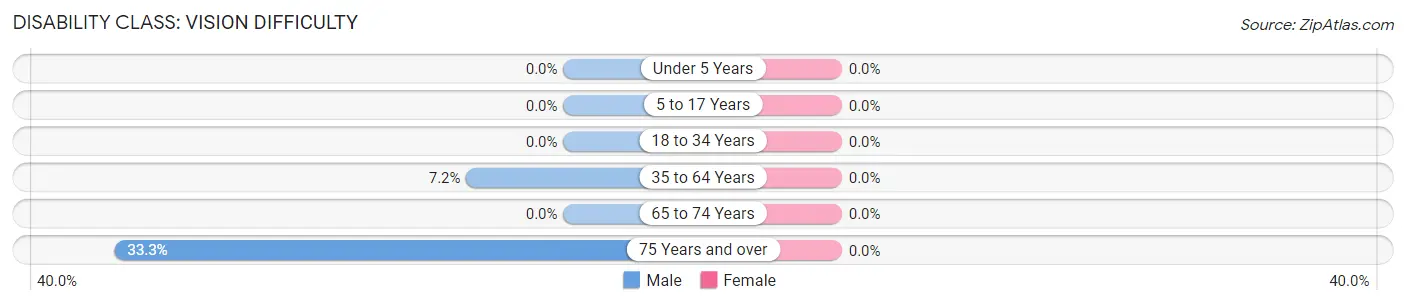
| Age Bracket | Male | Female |
| Under 5 Years | 0 (0.0%) | 0 (0.0%) |
| 5 to 17 Years | 0 (0.0%) | 0 (0.0%) |
| 18 to 34 Years | 0 (0.0%) | 0 (0.0%) |
| 35 to 64 Years | 18 (7.2%) | 0 (0.0%) |
| 65 to 74 Years | 0 (0.0%) | 0 (0.0%) |
| 75 Years and over | 9 (33.3%) | 0 (0.0%) |
Disability Class: Cognitive Difficulty
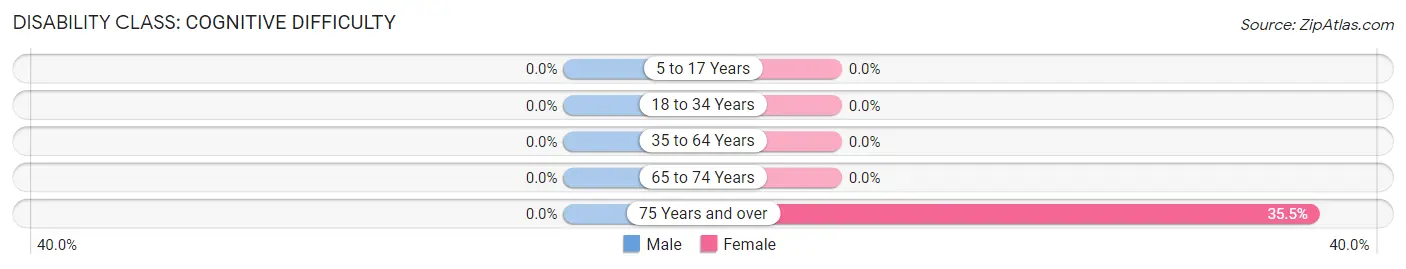
| Age Bracket | Male | Female |
| 5 to 17 Years | 0 (0.0%) | 0 (0.0%) |
| 18 to 34 Years | 0 (0.0%) | 0 (0.0%) |
| 35 to 64 Years | 0 (0.0%) | 0 (0.0%) |
| 65 to 74 Years | 0 (0.0%) | 0 (0.0%) |
| 75 Years and over | 0 (0.0%) | 11 (35.5%) |
Disability Class: Ambulatory Difficulty
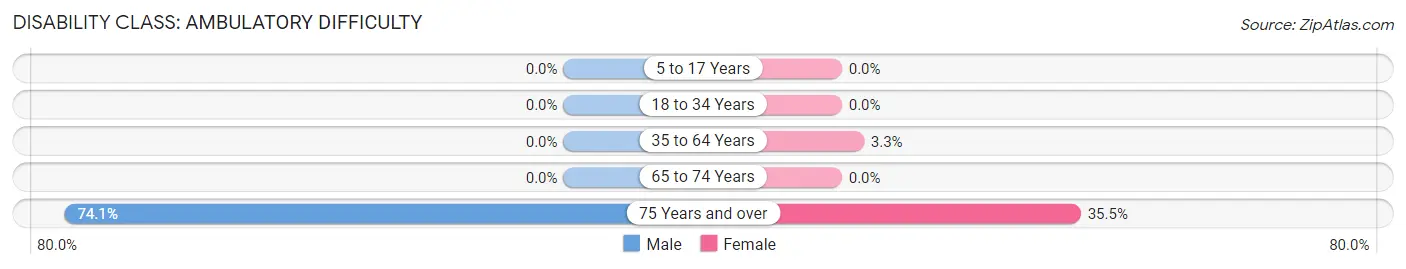
| Age Bracket | Male | Female |
| 5 to 17 Years | 0 (0.0%) | 0 (0.0%) |
| 18 to 34 Years | 0 (0.0%) | 0 (0.0%) |
| 35 to 64 Years | 0 (0.0%) | 13 (3.3%) |
| 65 to 74 Years | 0 (0.0%) | 0 (0.0%) |
| 75 Years and over | 20 (74.1%) | 11 (35.5%) |
Disability Class: Self-Care Difficulty

| Age Bracket | Male | Female |
| 5 to 17 Years | 0 (0.0%) | 0 (0.0%) |
| 18 to 34 Years | 0 (0.0%) | 0 (0.0%) |
| 35 to 64 Years | 0 (0.0%) | 0 (0.0%) |
| 65 to 74 Years | 0 (0.0%) | 0 (0.0%) |
| 75 Years and over | 0 (0.0%) | 11 (35.5%) |
Technology Access in Elmo
Computing Device Access in Elmo
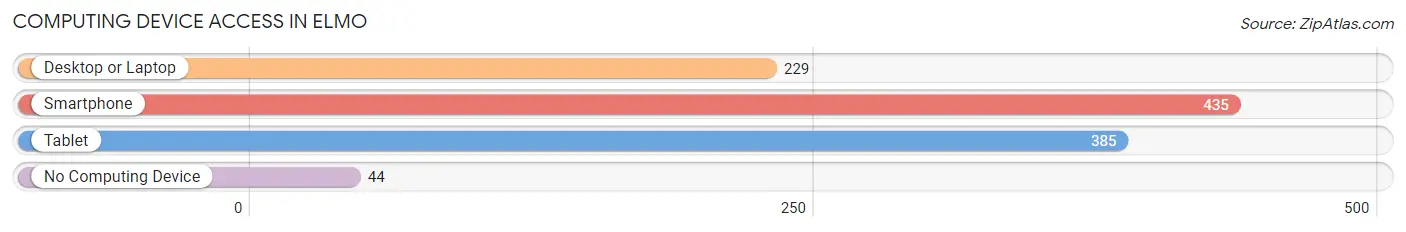
| Device Type | # Households | % Households |
| Desktop or Laptop | 229 | 47.1% |
| Smartphone | 435 | 89.5% |
| Tablet | 385 | 79.2% |
| No Computing Device | 44 | 9.0% |
| Total | 486 | 100.0% |
Internet Access in Elmo
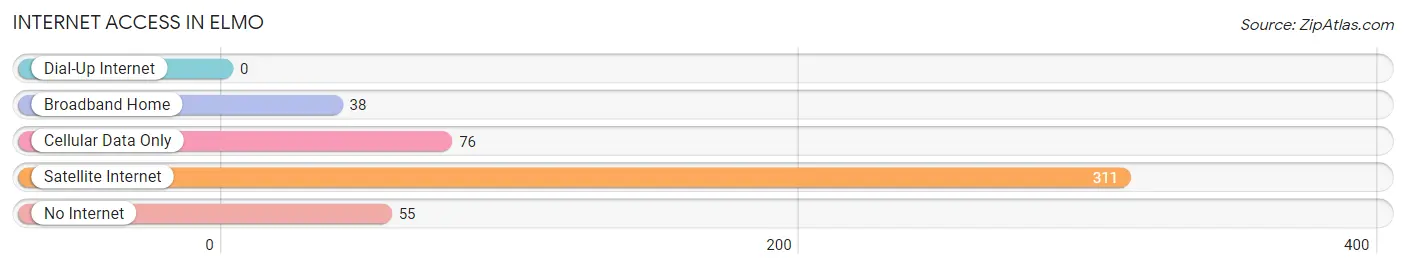
| Internet Type | # Households | % Households |
| Dial-Up Internet | 0 | 0.0% |
| Broadband Home | 38 | 7.8% |
| Cellular Data Only | 76 | 15.6% |
| Satellite Internet | 311 | 64.0% |
| No Internet | 55 | 11.3% |
| Total | 486 | 100.0% |
Elmo Summary
Elmo, Texas is a small town located in Ellis County, Texas, United States. It is situated about 20 miles south of Dallas and is part of the Dallas-Fort Worth metropolitan area. The town was founded in 1881 and was named after Elmo, the son of one of the original settlers.
Geography
Elmo is located at 32°30'25" North, 96°45'45" West (32.506944, -96.762500). It is situated at an elevation of 590 feet (180 m). The town is located in the Blackland Prairie region of Texas, which is characterized by flat terrain and fertile soil. The area is known for its rolling hills and lush vegetation.
The town is located in the Central Time Zone and observes Daylight Saving Time. The climate is humid subtropical, with hot summers and mild winters. The average annual temperature is 68°F (20°C). The average annual precipitation is 37.5 inches (95 cm).
Demographics
As of the 2010 census, Elmo had a population of 1,093. The racial makeup of the town was 94.3% White, 0.7% African American, 0.3% Native American, 0.2% Asian, 0.1% Pacific Islander, 2.7% from other races, and 1.7% from two or more races. Hispanic or Latino of any race were 5.3% of the population.
Economy
The economy of Elmo is largely based on agriculture. The town is home to several farms and ranches, which produce a variety of crops, including cotton, corn, wheat, and hay. The town also has a few small businesses, including a grocery store, a hardware store, and a few restaurants.
The town is served by the Ellis County School District, which operates two elementary schools, one middle school, and one high school. The town also has a public library and a post office.
Elmo is home to the Elmo Historical Society, which is dedicated to preserving the town's history and culture. The society hosts a variety of events throughout the year, including a Fourth of July celebration, a Christmas parade, and a rodeo.
Conclusion
Elmo, Texas is a small town located in Ellis County, Texas, United States. It is situated about 20 miles south of Dallas and is part of the Dallas-Fort Worth metropolitan area. The town was founded in 1881 and was named after Elmo, the son of one of the original settlers. The town is located in the Blackland Prairie region of Texas, which is characterized by flat terrain and fertile soil. As of the 2010 census, Elmo had a population of 1,093. The economy of Elmo is largely based on agriculture, and the town is served by the Ellis County School District. Elmo is home to the Elmo Historical Society, which is dedicated to preserving the town's history and culture.
Common Questions
What is Per Capita Income in Elmo?
Per Capita income in Elmo is $35,466.
What is the Median Family Income in Elmo?
Median Family Income in Elmo is $111,827.
What is Inequality or Gini Index in Elmo?
Inequality or Gini Index in Elmo is 0.43.
What is the Total Population of Elmo?
Total Population of Elmo is 1,002.
What is the Total Male Population of Elmo?
Total Male Population of Elmo is 399.
What is the Total Female Population of Elmo?
Total Female Population of Elmo is 603.
What is the Ratio of Males per 100 Females in Elmo?
There are 66.17 Males per 100 Females in Elmo.
What is the Ratio of Females per 100 Males in Elmo?
There are 151.13 Females per 100 Males in Elmo.
What is the Median Population Age in Elmo?
Median Population Age in Elmo is 50.1 Years.
What is the Average Family Size in Elmo
Average Family Size in Elmo is 3.4 People.
What is the Average Household Size in Elmo
Average Household Size in Elmo is 2.1 People.
How Large is the Labor Force in Elmo?
There are 663 People in the Labor Forcein in Elmo.
What is the Percentage of People in the Labor Force in Elmo?
68.2% of People are in the Labor Force in Elmo.
What is the Unemployment Rate in Elmo?
Unemployment Rate in Elmo is 15.2%.