Channing, TX Map & Demographics
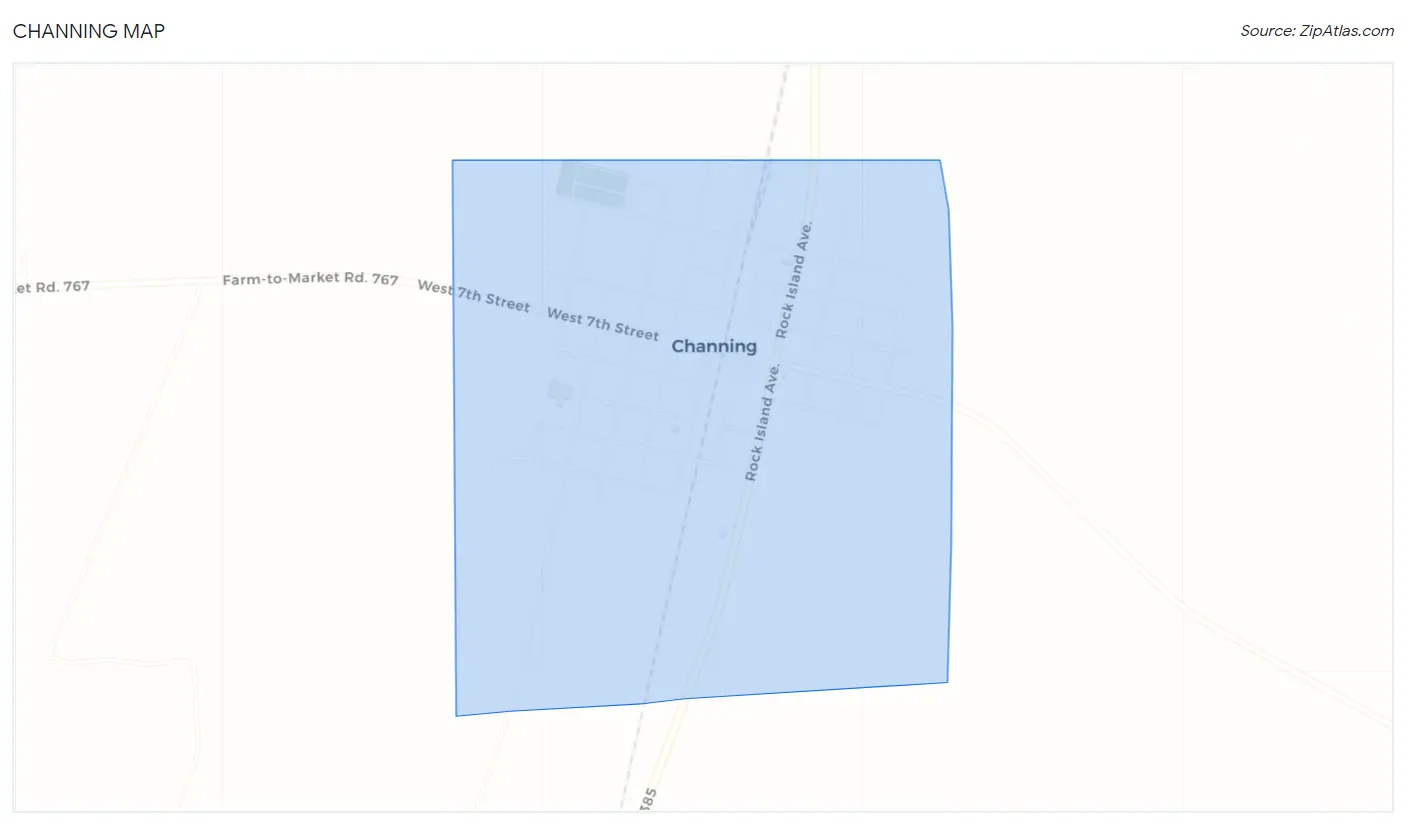
Channing Map
Channing Overview
$45,382
PER CAPITA INCOME
$66,750
AVG FAMILY INCOME
$53,125
AVG HOUSEHOLD INCOME
7.4%
WAGE / INCOME GAP [ % ]
92.6¢/ $1
WAGE / INCOME GAP [ $ ]
0.51
INEQUALITY / GINI INDEX
244
TOTAL POPULATION
83
MALE POPULATION
161
FEMALE POPULATION
51.55
MALES / 100 FEMALES
193.98
FEMALES / 100 MALES
48.0
MEDIAN AGE
2.8
AVG FAMILY SIZE
2.4
AVG HOUSEHOLD SIZE
97
LABOR FORCE [ PEOPLE ]
50.0%
PERCENT IN LABOR FORCE
1.0%
UNEMPLOYMENT RATE
Channing Zip Codes
Channing Area Codes
Income in Channing
Income Overview in Channing
Per Capita Income in Channing is $45,382, while median incomes of families and households are $66,750 and $53,125 respectively.
| Characteristic | Number | Measure |
| Per Capita Income | 244 | $45,382 |
| Median Family Income | 67 | $66,750 |
| Mean Family Income | 67 | $108,049 |
| Median Household Income | 101 | $53,125 |
| Mean Household Income | 101 | $85,518 |
| Income Deficit | 67 | $0 |
| Wage / Income Gap (%) | 244 | 7.38% |
| Wage / Income Gap ($) | 244 | 92.62¢ per $1 |
| Gini / Inequality Index | 244 | 0.51 |
Earnings by Sex in Channing
Average Earnings in Channing are $60,536, $61,071 for men and $56,563 for women, a difference of 7.4%.
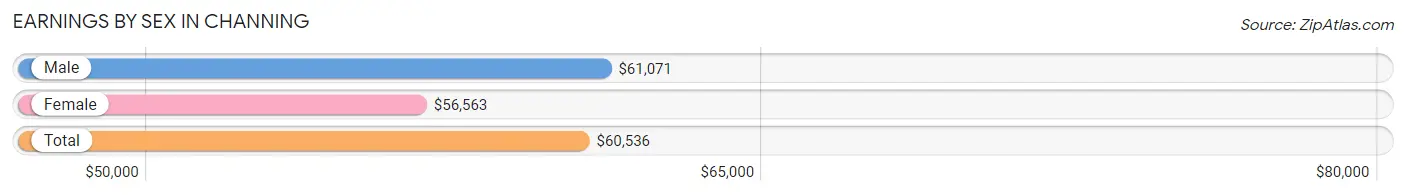
| Sex | Number | Average Earnings |
| Male | 44 (41.9%) | $61,071 |
| Female | 61 (58.1%) | $56,563 |
| Total | 105 (100.0%) | $60,536 |
Earnings by Sex by Income Bracket in Channing
The most common earnings brackets in Channing are $55,000 to $64,999 for men (11 | 25.0%) and $100,000+ for women (21 | 34.4%).
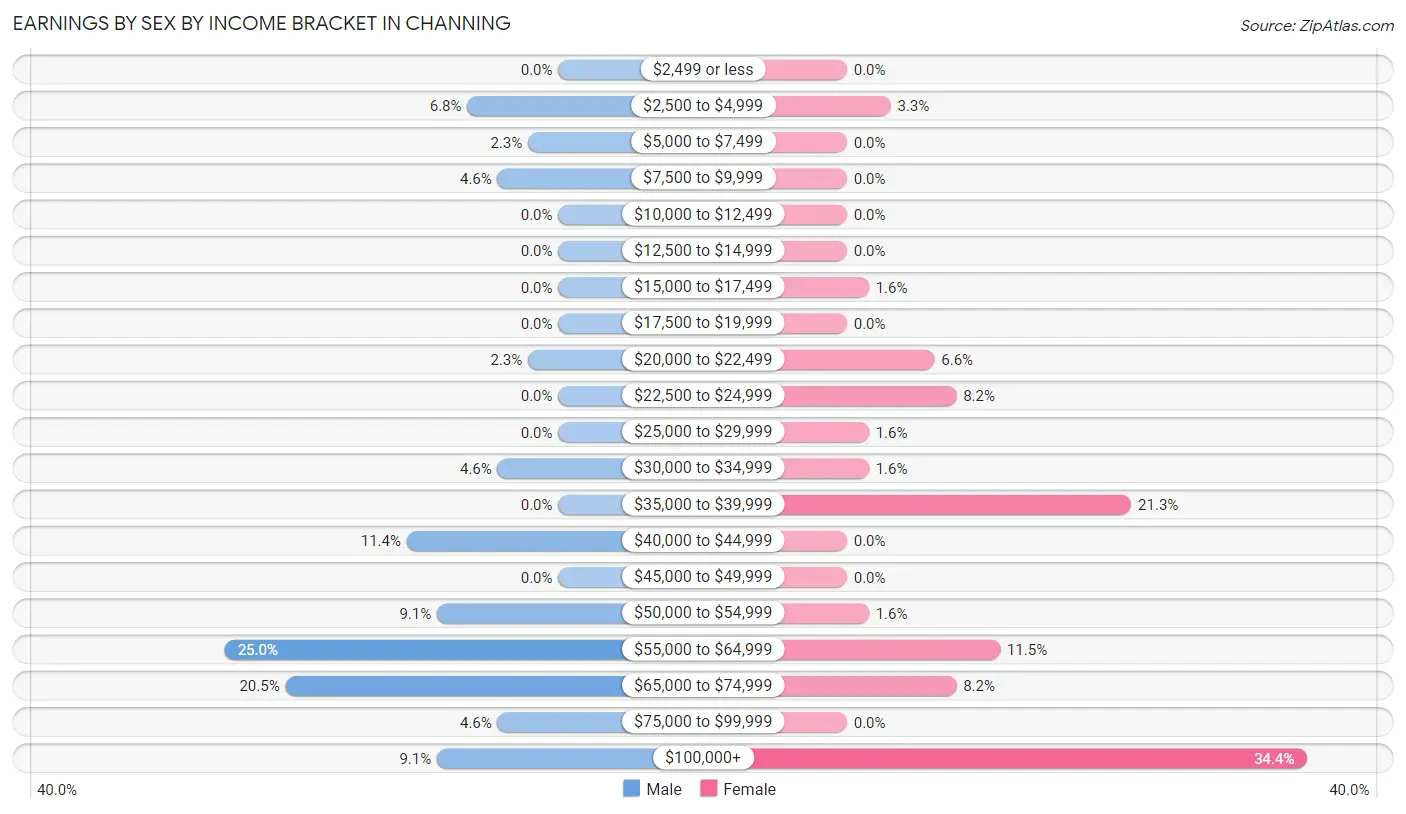
| Income | Male | Female |
| $2,499 or less | 0 (0.0%) | 0 (0.0%) |
| $2,500 to $4,999 | 3 (6.8%) | 2 (3.3%) |
| $5,000 to $7,499 | 1 (2.3%) | 0 (0.0%) |
| $7,500 to $9,999 | 2 (4.5%) | 0 (0.0%) |
| $10,000 to $12,499 | 0 (0.0%) | 0 (0.0%) |
| $12,500 to $14,999 | 0 (0.0%) | 0 (0.0%) |
| $15,000 to $17,499 | 0 (0.0%) | 1 (1.6%) |
| $17,500 to $19,999 | 0 (0.0%) | 0 (0.0%) |
| $20,000 to $22,499 | 1 (2.3%) | 4 (6.6%) |
| $22,500 to $24,999 | 0 (0.0%) | 5 (8.2%) |
| $25,000 to $29,999 | 0 (0.0%) | 1 (1.6%) |
| $30,000 to $34,999 | 2 (4.5%) | 1 (1.6%) |
| $35,000 to $39,999 | 0 (0.0%) | 13 (21.3%) |
| $40,000 to $44,999 | 5 (11.4%) | 0 (0.0%) |
| $45,000 to $49,999 | 0 (0.0%) | 0 (0.0%) |
| $50,000 to $54,999 | 4 (9.1%) | 1 (1.6%) |
| $55,000 to $64,999 | 11 (25.0%) | 7 (11.5%) |
| $65,000 to $74,999 | 9 (20.4%) | 5 (8.2%) |
| $75,000 to $99,999 | 2 (4.5%) | 0 (0.0%) |
| $100,000+ | 4 (9.1%) | 21 (34.4%) |
| Total | 44 (100.0%) | 61 (100.0%) |
Earnings by Sex by Educational Attainment in Channing
Average earnings in Channing are $62,143 for men and $56,875 for women, a difference of 8.5%. Men with an educational attainment of high school diploma enjoy the highest average annual earnings of $63,333, while those with bachelor's degree education earn the least with $61,875. Women with an educational attainment of bachelor's degree earn the most with the average annual earnings of $250,001, while those with college or associate's degree education have the smallest earnings of $37,639.
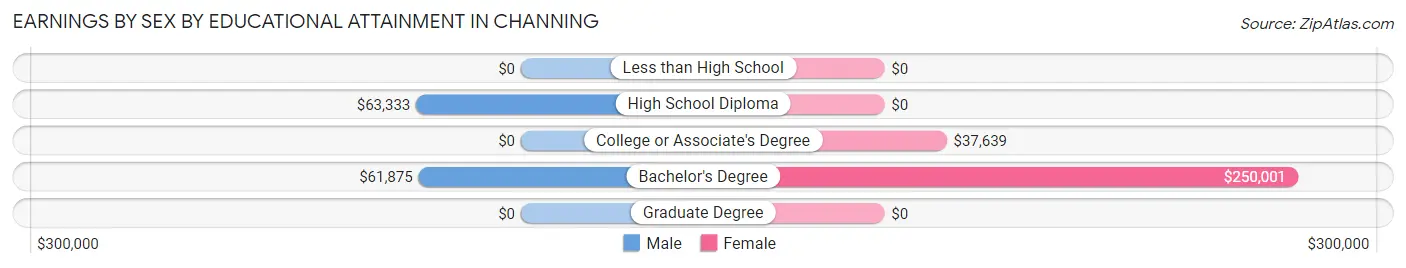
| Educational Attainment | Male Income | Female Income |
| Less than High School | - | - |
| High School Diploma | $63,333 | $0 |
| College or Associate's Degree | - | - |
| Bachelor's Degree | $61,875 | $250,001 |
| Graduate Degree | - | - |
| Total | $62,143 | $56,875 |
Family Income in Channing
Family Income Brackets in Channing
According to the Channing family income data, there are 16 families falling into the $50,000 to $74,999 income range, which is the most common income bracket and makes up 23.9% of all families.
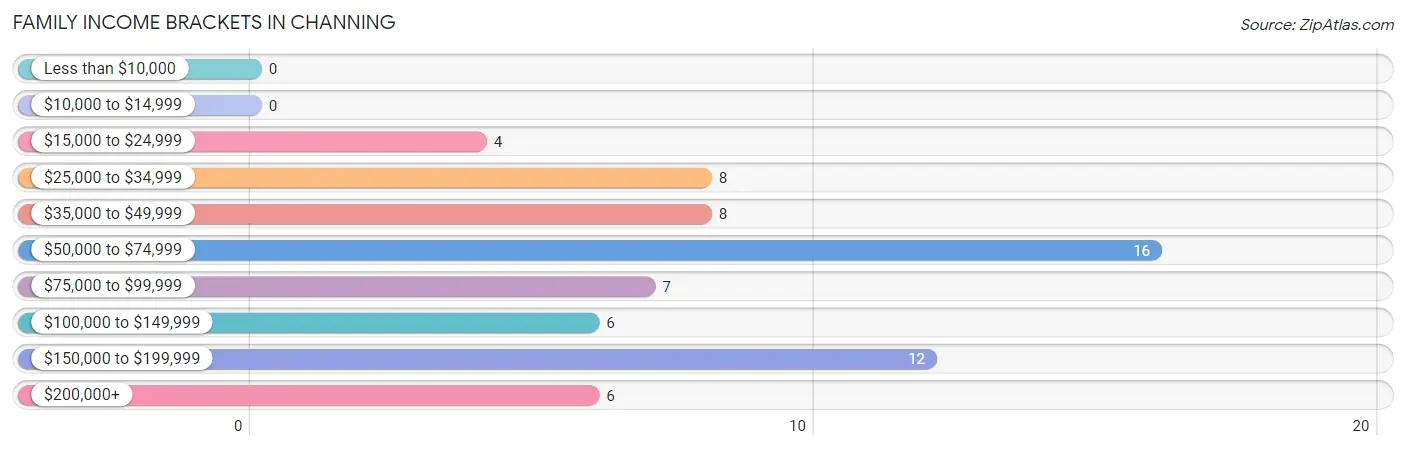
| Income Bracket | # Families | % Families |
| Less than $10,000 | 0 | 0.0% |
| $10,000 to $14,999 | 0 | 0.0% |
| $15,000 to $24,999 | 4 | 6.0% |
| $25,000 to $34,999 | 8 | 11.9% |
| $35,000 to $49,999 | 8 | 11.9% |
| $50,000 to $74,999 | 16 | 23.9% |
| $75,000 to $99,999 | 7 | 10.4% |
| $100,000 to $149,999 | 6 | 9.0% |
| $150,000 to $199,999 | 12 | 17.9% |
| $200,000+ | 6 | 9.0% |
Family Income by Famaliy Size in Channing
| Income Bracket | # Families | Median Income |
| 2-Person Families | 32 (47.8%) | $0 |
| 3-Person Families | 17 (25.4%) | $0 |
| 4-Person Families | 17 (25.4%) | $0 |
| 5-Person Families | 0 (0.0%) | $0 |
| 6-Person Families | 0 (0.0%) | $0 |
| 7+ Person Families | 1 (1.5%) | $0 |
| Total | 67 (100.0%) | $66,750 |
Family Income by Number of Earners in Channing
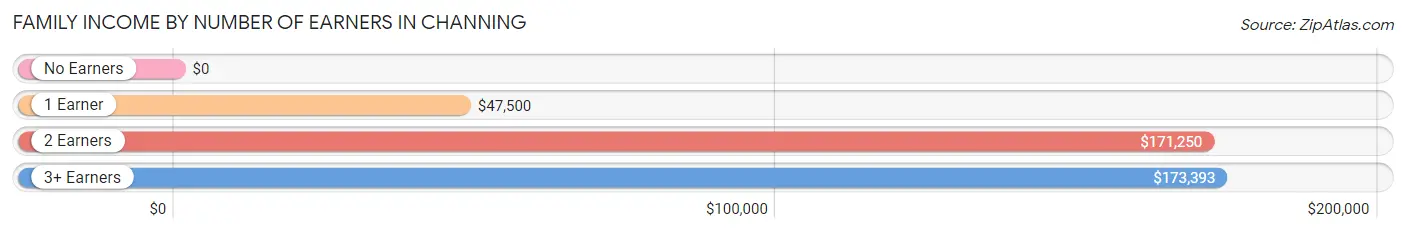
| Number of Earners | # Families | Median Income |
| No Earners | 12 (17.9%) | $0 |
| 1 Earner | 26 (38.8%) | $47,500 |
| 2 Earners | 18 (26.9%) | $171,250 |
| 3+ Earners | 11 (16.4%) | $173,393 |
| Total | 67 (100.0%) | $66,750 |
Household Income in Channing
Household Income Brackets in Channing
With 24 households falling in the category, the $15,000 to $24,999 income range is the most frequent in Channing, accounting for 23.8% of all households.
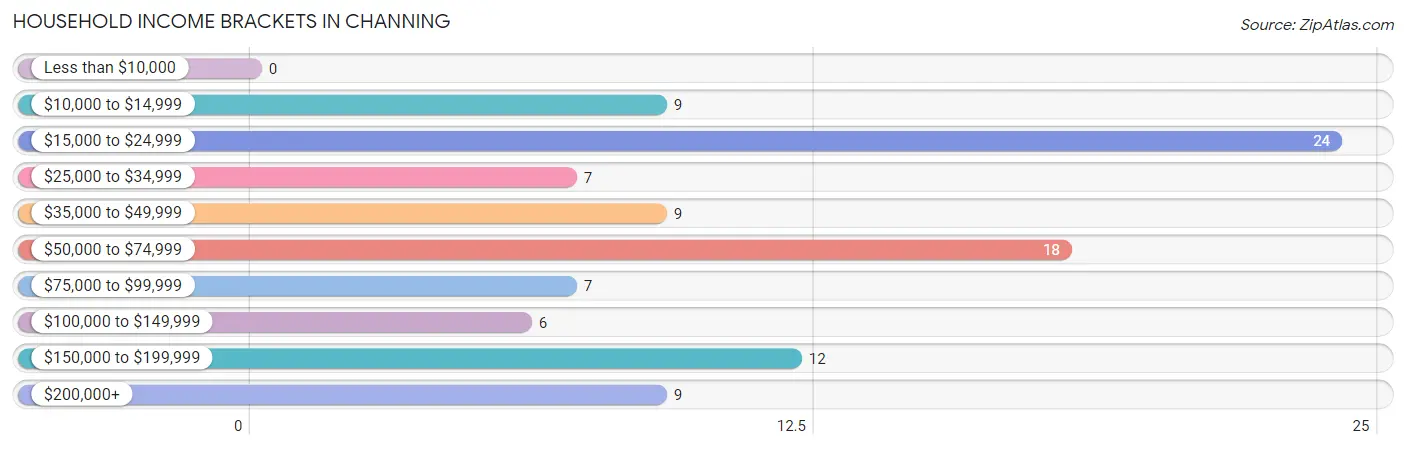
| Income Bracket | # Households | % Households |
| Less than $10,000 | 0 | 0.0% |
| $10,000 to $14,999 | 9 | 8.9% |
| $15,000 to $24,999 | 24 | 23.8% |
| $25,000 to $34,999 | 7 | 6.9% |
| $35,000 to $49,999 | 9 | 8.9% |
| $50,000 to $74,999 | 18 | 17.8% |
| $75,000 to $99,999 | 7 | 6.9% |
| $100,000 to $149,999 | 6 | 5.9% |
| $150,000 to $199,999 | 12 | 11.9% |
| $200,000+ | 9 | 8.9% |
Household Income by Householder Age in Channing
The median household income in Channing is $53,125, with the highest median household income of $171,875 found in the 45 to 64 years age bracket for the primary householder. A total of 33 households (32.7%) fall into this category.
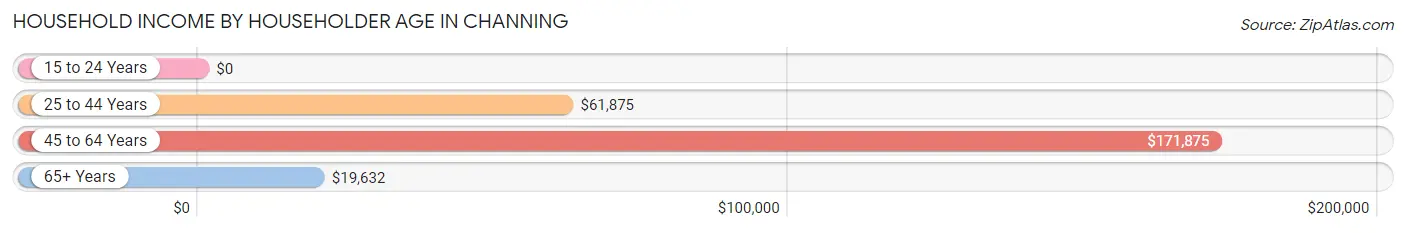
| Income Bracket | # Households | Median Income |
| 15 to 24 Years | 0 (0.0%) | $0 |
| 25 to 44 Years | 21 (20.8%) | $61,875 |
| 45 to 64 Years | 33 (32.7%) | $171,875 |
| 65+ Years | 47 (46.5%) | $19,632 |
| Total | 101 (100.0%) | $53,125 |
Poverty in Channing
Income Below Poverty by Sex and Age in Channing
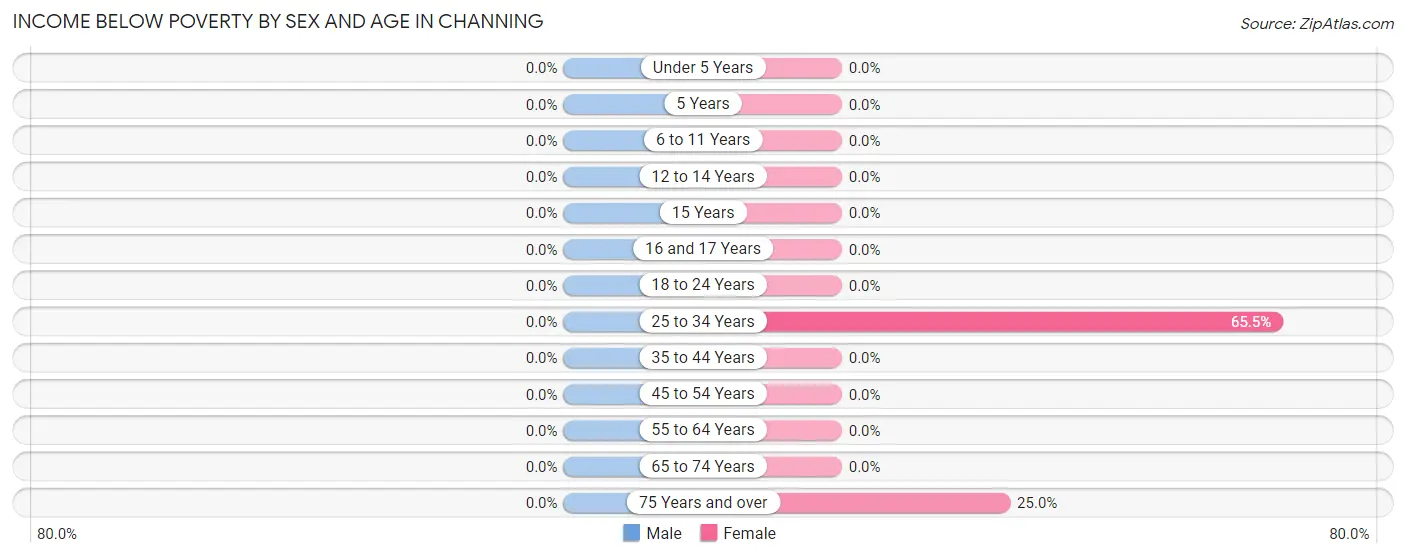
| Age Bracket | Male | Female |
| Under 5 Years | 0 (0.0%) | 0 (0.0%) |
| 5 Years | 0 (0.0%) | 0 (0.0%) |
| 6 to 11 Years | 0 (0.0%) | 0 (0.0%) |
| 12 to 14 Years | 0 (0.0%) | 0 (0.0%) |
| 15 Years | 0 (0.0%) | 0 (0.0%) |
| 16 and 17 Years | 0 (0.0%) | 0 (0.0%) |
| 18 to 24 Years | 0 (0.0%) | 0 (0.0%) |
| 25 to 34 Years | 0 (0.0%) | 19 (65.5%) |
| 35 to 44 Years | 0 (0.0%) | 0 (0.0%) |
| 45 to 54 Years | 0 (0.0%) | 0 (0.0%) |
| 55 to 64 Years | 0 (0.0%) | 0 (0.0%) |
| 65 to 74 Years | 0 (0.0%) | 0 (0.0%) |
| 75 Years and over | 0 (0.0%) | 9 (25.0%) |
| Total | 0 (0.0%) | 28 (17.4%) |
Income Above Poverty by Sex and Age in Channing
According to the poverty statistics in Channing, males aged 6 to 11 years and females aged under 5 years are the age groups that are most secure financially, with 100.0% of males and 100.0% of females in these age groups living above the poverty line.
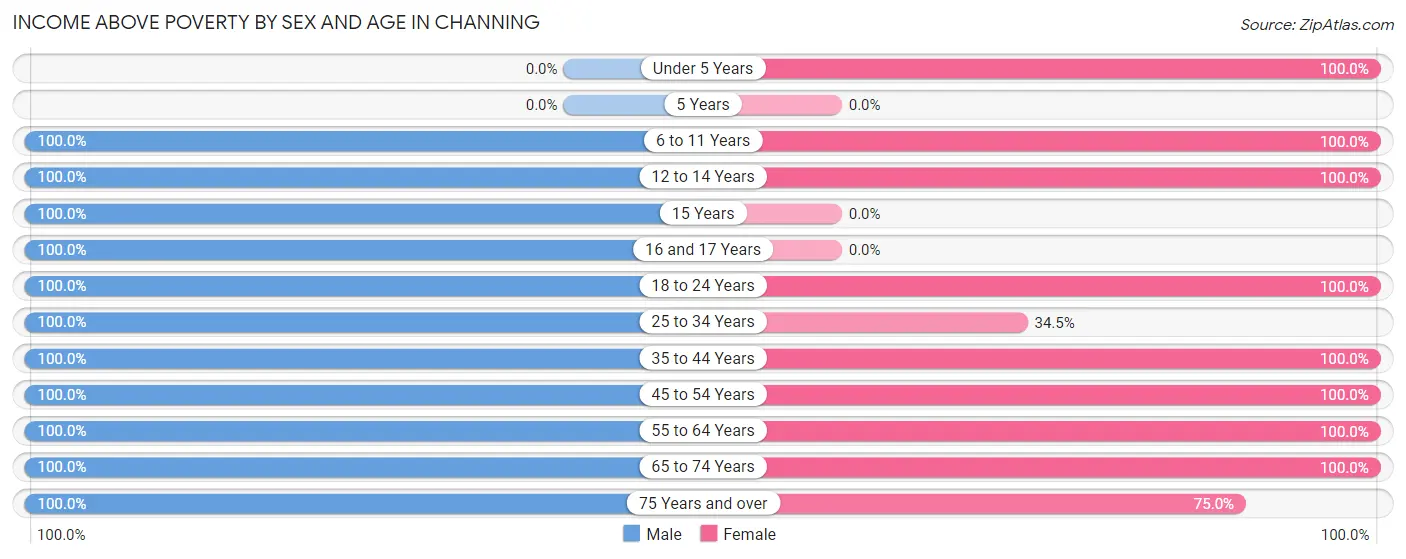
| Age Bracket | Male | Female |
| Under 5 Years | 0 (0.0%) | 14 (100.0%) |
| 5 Years | 0 (0.0%) | 0 (0.0%) |
| 6 to 11 Years | 17 (100.0%) | 7 (100.0%) |
| 12 to 14 Years | 3 (100.0%) | 7 (100.0%) |
| 15 Years | 2 (100.0%) | 0 (0.0%) |
| 16 and 17 Years | 3 (100.0%) | 0 (0.0%) |
| 18 to 24 Years | 3 (100.0%) | 1 (100.0%) |
| 25 to 34 Years | 9 (100.0%) | 10 (34.5%) |
| 35 to 44 Years | 5 (100.0%) | 12 (100.0%) |
| 45 to 54 Years | 8 (100.0%) | 25 (100.0%) |
| 55 to 64 Years | 18 (100.0%) | 22 (100.0%) |
| 65 to 74 Years | 8 (100.0%) | 8 (100.0%) |
| 75 Years and over | 7 (100.0%) | 27 (75.0%) |
| Total | 83 (100.0%) | 133 (82.6%) |
Income Below Poverty Among Married-Couple Families in Channing
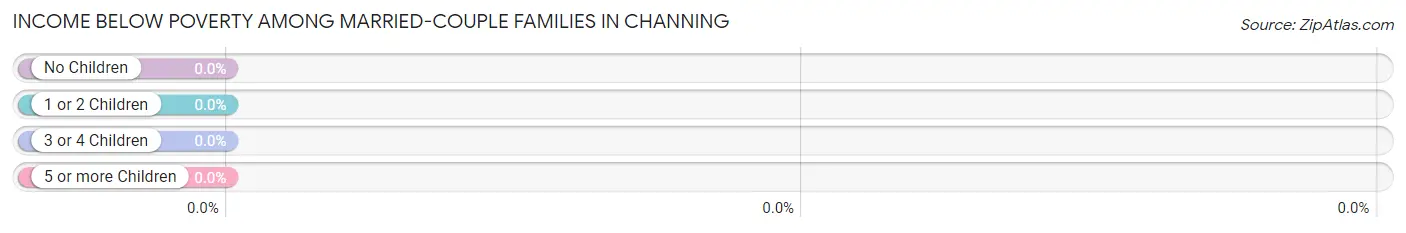
| Children | Above Poverty | Below Poverty |
| No Children | 46 (100.0%) | 0 (0.0%) |
| 1 or 2 Children | 4 (100.0%) | 0 (0.0%) |
| 3 or 4 Children | 0 (0.0%) | 0 (0.0%) |
| 5 or more Children | 1 (100.0%) | 0 (0.0%) |
| Total | 51 (100.0%) | 0 (0.0%) |
Income Below Poverty Among Single-Parent Households in Channing
| Children | Single Father | Single Mother |
| No Children | 0 (0.0%) | 0 (0.0%) |
| 1 or 2 Children | 0 (0.0%) | 0 (0.0%) |
| 3 or 4 Children | 0 (0.0%) | 0 (0.0%) |
| 5 or more Children | 0 (0.0%) | 0 (0.0%) |
| Total | 0 (0.0%) | 0 (0.0%) |
Income Below Poverty Among Married-Couple vs Single-Parent Households in Channing
| Children | Married-Couple Families | Single-Parent Households |
| No Children | 0 (0.0%) | 0 (0.0%) |
| 1 or 2 Children | 0 (0.0%) | 0 (0.0%) |
| 3 or 4 Children | 0 (0.0%) | 0 (0.0%) |
| 5 or more Children | 0 (0.0%) | 0 (0.0%) |
| Total | 0 (0.0%) | 0 (0.0%) |
Race in Channing
The most populous races in Channing are White / Caucasian (236 | 96.7%), Hispanic or Latino (47 | 19.3%), and Two or more Races (8 | 3.3%).
| Race | # Population | % Population |
| Asian | 0 | 0.0% |
| Black / African American | 0 | 0.0% |
| Hawaiian / Pacific | 0 | 0.0% |
| Hispanic or Latino | 47 | 19.3% |
| Native / Alaskan | 0 | 0.0% |
| White / Caucasian | 236 | 96.7% |
| Two or more Races | 8 | 3.3% |
| Some other Race | 0 | 0.0% |
| Total | 244 | 100.0% |
Ancestry in Channing
The most populous ancestries reported in Channing are German (48 | 19.7%), Mexican (42 | 17.2%), Irish (38 | 15.6%), English (28 | 11.5%), and American (10 | 4.1%), together accounting for 68.0% of all Channing residents.
| Ancestry | # Population | % Population |
| American | 10 | 4.1% |
| British | 5 | 2.1% |
| Cherokee | 6 | 2.5% |
| Czech | 10 | 4.1% |
| Danish | 1 | 0.4% |
| Dutch | 8 | 3.3% |
| English | 28 | 11.5% |
| European | 6 | 2.5% |
| French | 7 | 2.9% |
| French Canadian | 5 | 2.1% |
| German | 48 | 19.7% |
| Irish | 38 | 15.6% |
| Mexican | 42 | 17.2% |
| Norwegian | 3 | 1.2% |
| Scottish | 9 | 3.7% | View All 15 Rows |
Immigrants in Channing
The most numerous immigrant groups reported in Channing came from Central America (3 | 1.2%), Latin America (3 | 1.2%), and Mexico (3 | 1.2%), together accounting for 3.7% of all Channing residents.
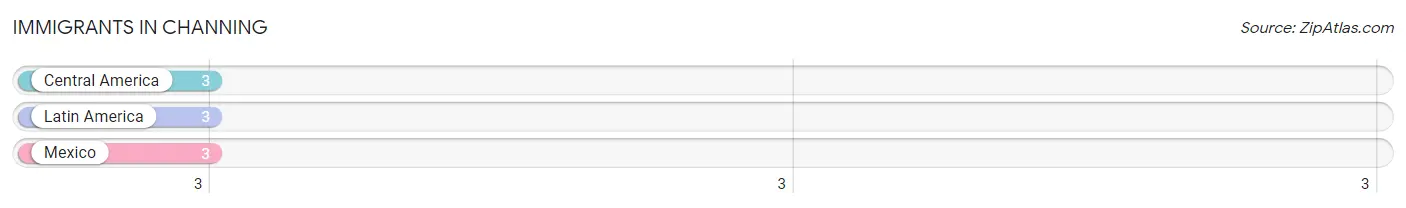
| Immigration Origin | # Population | % Population |
| Central America | 3 | 1.2% |
| Latin America | 3 | 1.2% |
| Mexico | 3 | 1.2% | View All 3 Rows |
Sex and Age in Channing
Sex and Age in Channing
The most populous age groups in Channing are 60 to 64 Years (14 | 16.9%) for men and 80 to 84 Years (22 | 13.7%) for women.
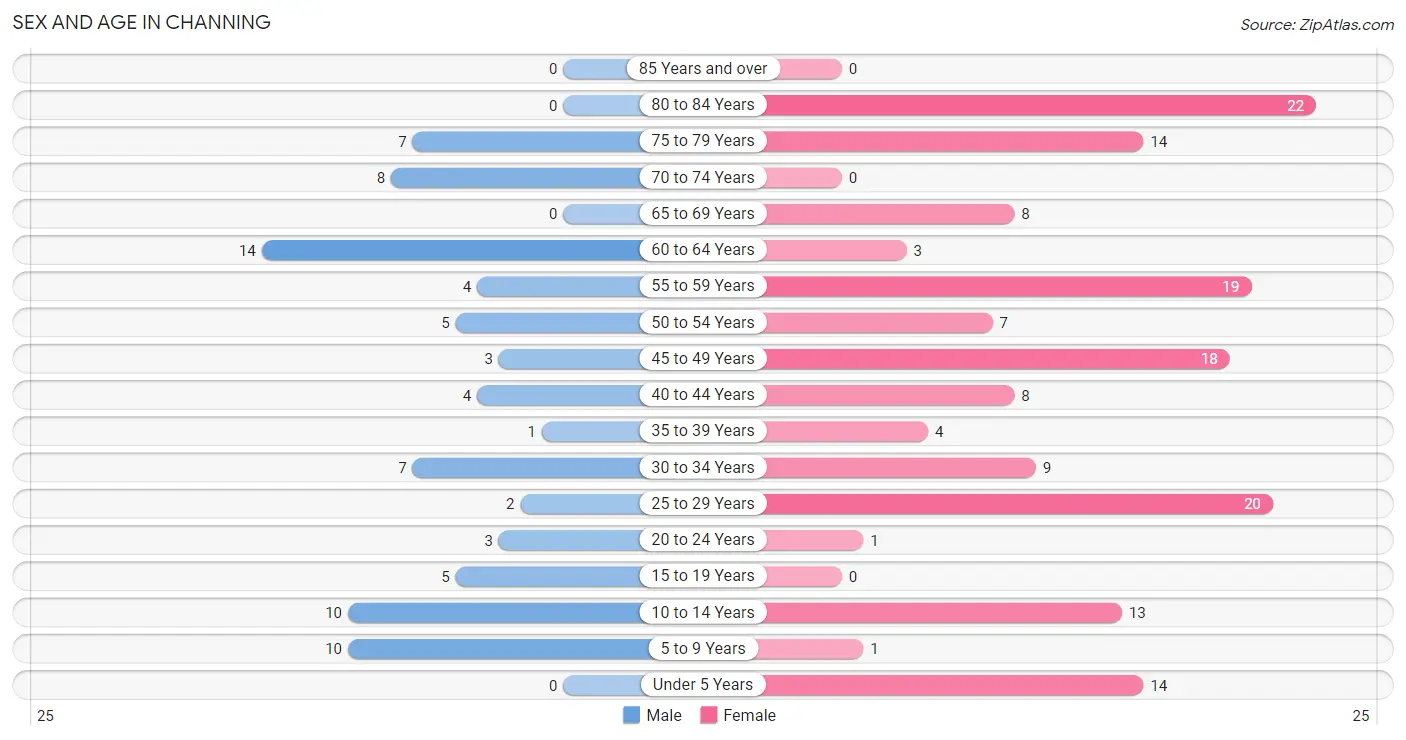
| Age Bracket | Male | Female |
| Under 5 Years | 0 (0.0%) | 14 (8.7%) |
| 5 to 9 Years | 10 (12.0%) | 1 (0.6%) |
| 10 to 14 Years | 10 (12.0%) | 13 (8.1%) |
| 15 to 19 Years | 5 (6.0%) | 0 (0.0%) |
| 20 to 24 Years | 3 (3.6%) | 1 (0.6%) |
| 25 to 29 Years | 2 (2.4%) | 20 (12.4%) |
| 30 to 34 Years | 7 (8.4%) | 9 (5.6%) |
| 35 to 39 Years | 1 (1.2%) | 4 (2.5%) |
| 40 to 44 Years | 4 (4.8%) | 8 (5.0%) |
| 45 to 49 Years | 3 (3.6%) | 18 (11.2%) |
| 50 to 54 Years | 5 (6.0%) | 7 (4.3%) |
| 55 to 59 Years | 4 (4.8%) | 19 (11.8%) |
| 60 to 64 Years | 14 (16.9%) | 3 (1.9%) |
| 65 to 69 Years | 0 (0.0%) | 8 (5.0%) |
| 70 to 74 Years | 8 (9.6%) | 0 (0.0%) |
| 75 to 79 Years | 7 (8.4%) | 14 (8.7%) |
| 80 to 84 Years | 0 (0.0%) | 22 (13.7%) |
| 85 Years and over | 0 (0.0%) | 0 (0.0%) |
| Total | 83 (100.0%) | 161 (100.0%) |
Families and Households in Channing
Median Family Size in Channing
The median family size in Channing is 2.84 persons per family, with single male/father families (7 | 10.4%) accounting for the largest median family size of 3.71 persons per family. On the other hand, single female/mother families (9 | 13.4%) represent the smallest median family size with 2.44 persons per family.
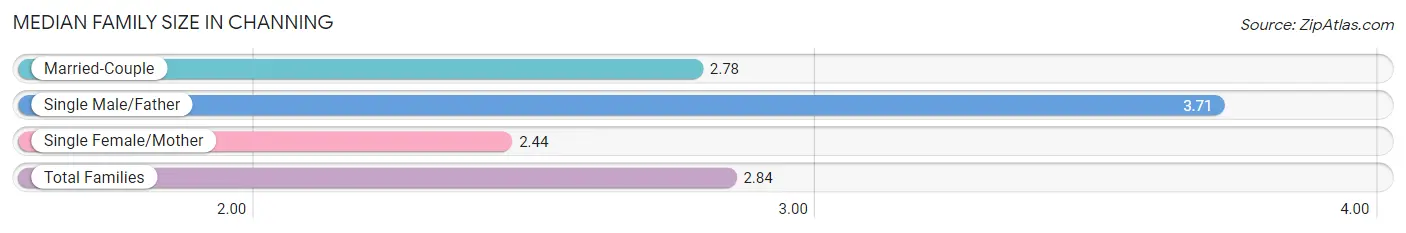
| Family Type | # Families | Family Size |
| Married-Couple | 51 (76.1%) | 2.78 |
| Single Male/Father | 7 (10.4%) | 3.71 |
| Single Female/Mother | 9 (13.4%) | 2.44 |
| Total Families | 67 (100.0%) | 2.84 |
Median Household Size in Channing
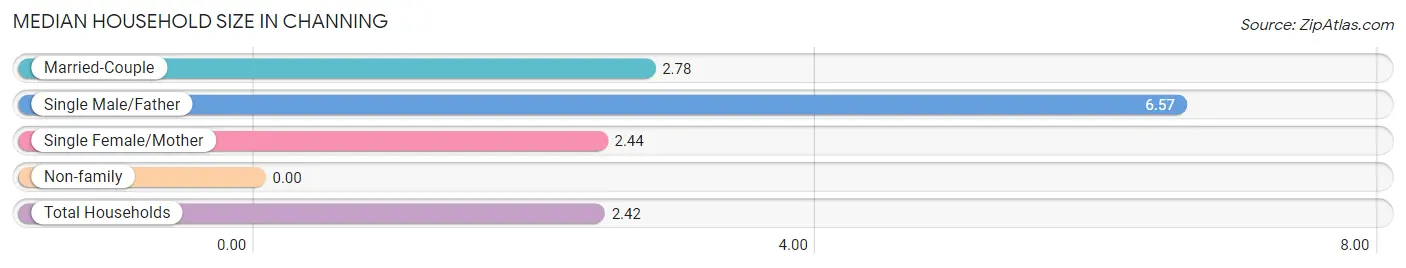
| Household Type | # Households | Household Size |
| Married-Couple | 51 (50.5%) | 2.78 |
| Single Male/Father | 7 (6.9%) | 6.57 |
| Single Female/Mother | 9 (8.9%) | 2.44 |
| Non-family | 34 (33.7%) | - |
| Total Households | 101 (100.0%) | 2.42 |
Household Size by Marriage Status in Channing
Out of a total of 101 households in Channing, 67 (66.3%) are family households, while 34 (33.7%) are nonfamily households. The most numerous type of family households are 2-person households, comprising 32, and the most common type of nonfamily households are 1-person households, comprising 34.
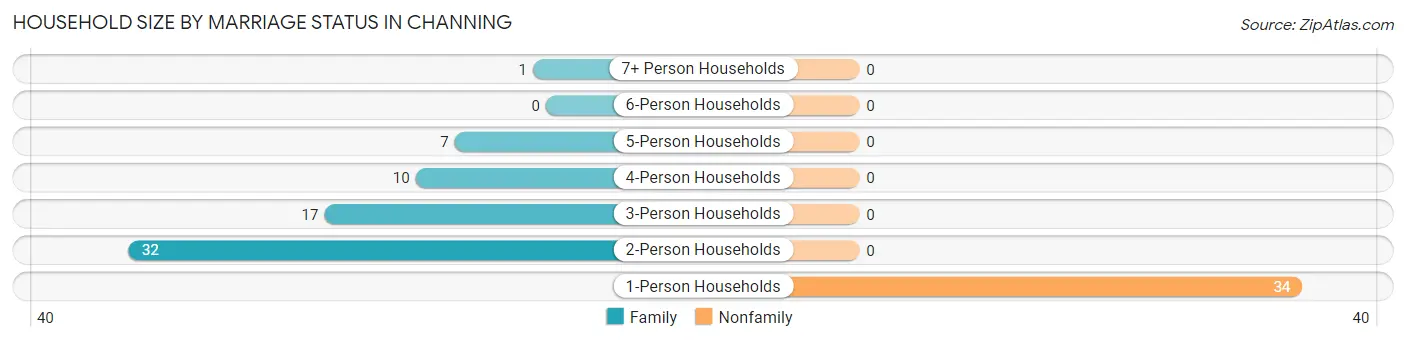
| Household Size | Family Households | Nonfamily Households |
| 1-Person Households | - | 34 (33.7%) |
| 2-Person Households | 32 (31.7%) | 0 (0.0%) |
| 3-Person Households | 17 (16.8%) | 0 (0.0%) |
| 4-Person Households | 10 (9.9%) | 0 (0.0%) |
| 5-Person Households | 7 (6.9%) | 0 (0.0%) |
| 6-Person Households | 0 (0.0%) | 0 (0.0%) |
| 7+ Person Households | 1 (1.0%) | 0 (0.0%) |
| Total | 67 (66.3%) | 34 (33.7%) |
Female Fertility in Channing
Fertility by Age in Channing
Average fertility rate in Channing is 333.0 births per 1,000 women. Women in the age bracket of 20 to 34 years have the highest fertility rate with 667.0 births per 1,000 women. Women in the age bracket of 20 to 34 years acount for 100.0% of all women with births.
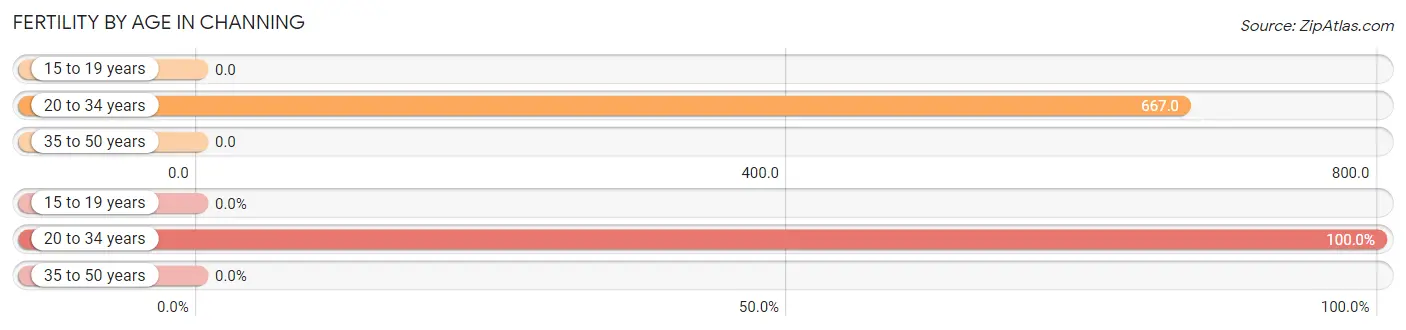
| Age Bracket | Women with Births | Births / 1,000 Women |
| 15 to 19 years | 0 (0.0%) | 0.0 |
| 20 to 34 years | 20 (100.0%) | 667.0 |
| 35 to 50 years | 0 (0.0%) | 0.0 |
| Total | 20 (100.0%) | 333.0 |
Fertility by Age by Marriage Status in Channing
5.0% of women with births (20) in Channing are married. The highest percentage of unmarried women with births falls into 20 to 34 years age bracket with 95.0% of them unmarried at the time of birth, while the lowest percentage of unmarried women with births belong to 20 to 34 years age bracket with 95.0% of them unmarried.
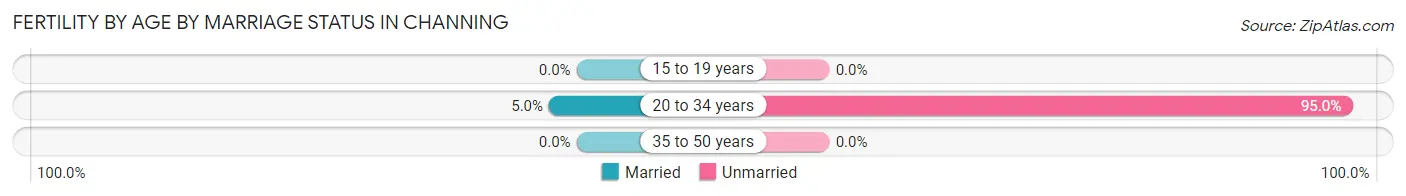
| Age Bracket | Married | Unmarried |
| 15 to 19 years | 0 (0.0%) | 0 (0.0%) |
| 20 to 34 years | 1 (5.0%) | 19 (95.0%) |
| 35 to 50 years | 0 (0.0%) | 0 (0.0%) |
| Total | 1 (5.0%) | 19 (95.0%) |
Fertility by Education in Channing
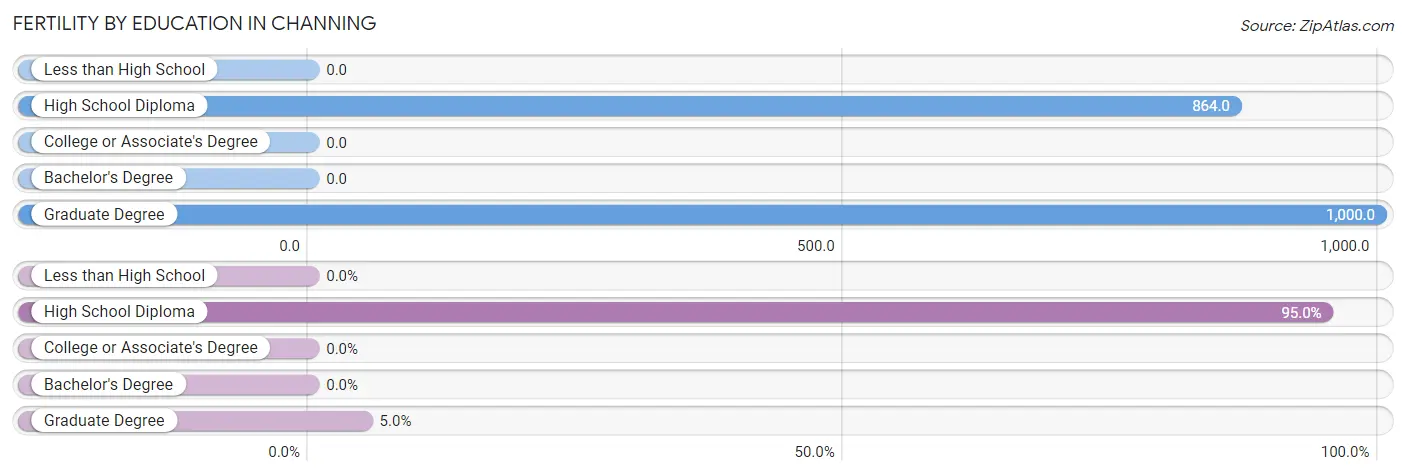
| Educational Attainment | Women with Births | Births / 1,000 Women |
| Less than High School | 0 (0.0%) | 0.0 |
| High School Diploma | 19 (95.0%) | 864.0 |
| College or Associate's Degree | 0 (0.0%) | 0.0 |
| Bachelor's Degree | 0 (0.0%) | 0.0 |
| Graduate Degree | 1 (5.0%) | 1,000.0 |
| Total | 20 (100.0%) | 333.0 |
Fertility by Education by Marriage Status in Channing
95.0% of women with births in Channing are unmarried. Women with the educational attainment of graduate degree are most likely to be married with 100.0% of them married at childbirth, while women with the educational attainment of high school diploma are least likely to be married with 100.0% of them unmarried at childbirth.
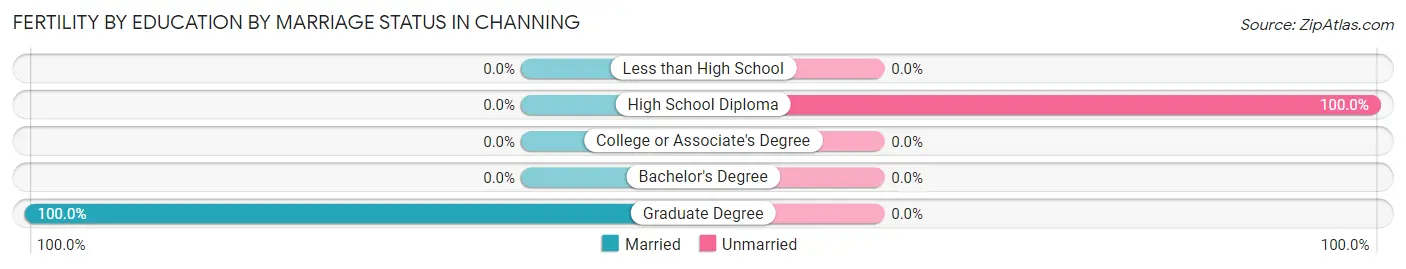
| Educational Attainment | Married | Unmarried |
| Less than High School | 0 (0.0%) | 0 (0.0%) |
| High School Diploma | 0 (0.0%) | 19 (100.0%) |
| College or Associate's Degree | 0 (0.0%) | 0 (0.0%) |
| Bachelor's Degree | 0 (0.0%) | 0 (0.0%) |
| Graduate Degree | 1 (100.0%) | 0 (0.0%) |
| Total | 1 (5.0%) | 19 (95.0%) |
Employment Characteristics in Channing
Employment by Class of Employer in Channing
Among the 96 employed individuals in Channing, private company employees (58 | 60.4%), local government employees (21 | 21.9%), and not-for-profit organizations (13 | 13.5%) make up the most common classes of employment.
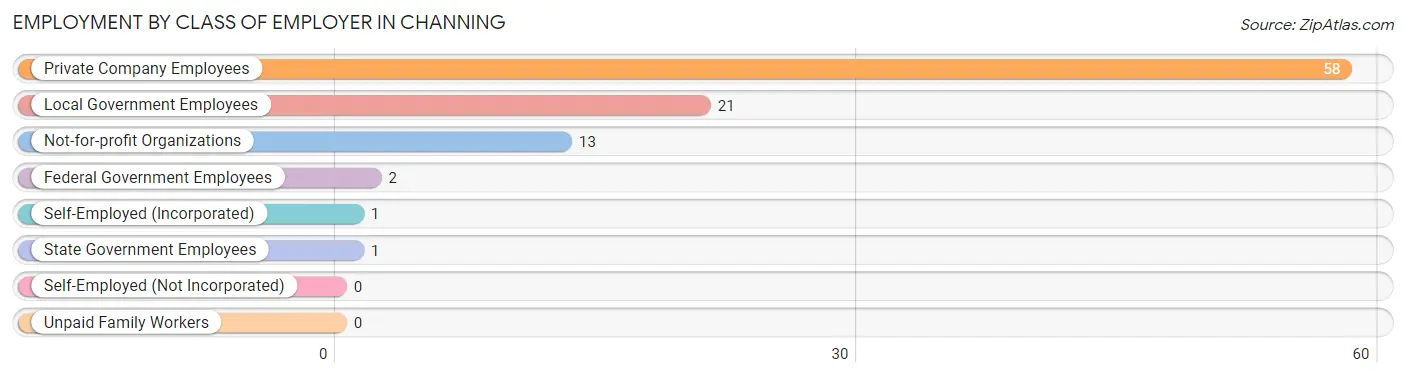
| Employer Class | # Employees | % Employees |
| Private Company Employees | 58 | 60.4% |
| Self-Employed (Incorporated) | 1 | 1.0% |
| Self-Employed (Not Incorporated) | 0 | 0.0% |
| Not-for-profit Organizations | 13 | 13.5% |
| Local Government Employees | 21 | 21.9% |
| State Government Employees | 1 | 1.0% |
| Federal Government Employees | 2 | 2.1% |
| Unpaid Family Workers | 0 | 0.0% |
| Total | 96 | 100.0% |
Employment Status by Age in Channing
According to the labor force statistics for Channing, out of the total population over 16 years of age (194), 50.0% or 97 individuals are in the labor force, with 1.0% or 1 of them unemployed. The age group with the highest labor force participation rate is 16 to 19 years, with 100.0% or 3 individuals in the labor force. Within the labor force, the 20 to 24 years age range has the highest percentage of unemployed individuals, with 33.3% or 1 of them being unemployed.
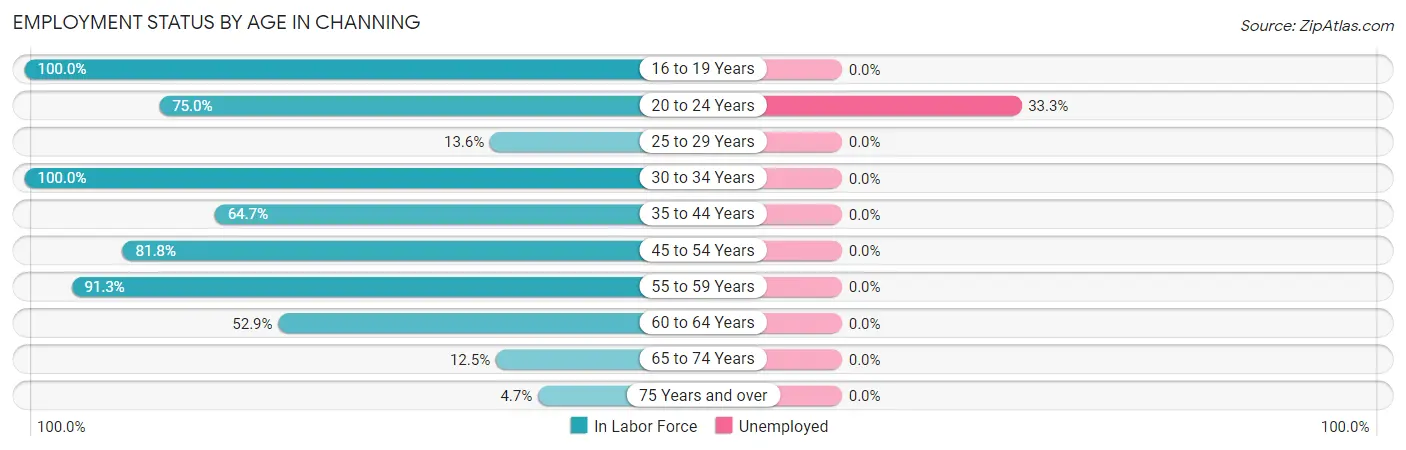
| Age Bracket | In Labor Force | Unemployed |
| 16 to 19 Years | 3 (100.0%) | 0 (0.0%) |
| 20 to 24 Years | 3 (75.0%) | 1 (33.3%) |
| 25 to 29 Years | 3 (13.6%) | 0 (0.0%) |
| 30 to 34 Years | 16 (100.0%) | 0 (0.0%) |
| 35 to 44 Years | 11 (64.7%) | 0 (0.0%) |
| 45 to 54 Years | 27 (81.8%) | 0 (0.0%) |
| 55 to 59 Years | 21 (91.3%) | 0 (0.0%) |
| 60 to 64 Years | 9 (52.9%) | 0 (0.0%) |
| 65 to 74 Years | 2 (12.5%) | 0 (0.0%) |
| 75 Years and over | 2 (4.7%) | 0 (0.0%) |
| Total | 97 (50.0%) | 1 (1.0%) |
Employment Status by Educational Attainment in Channing
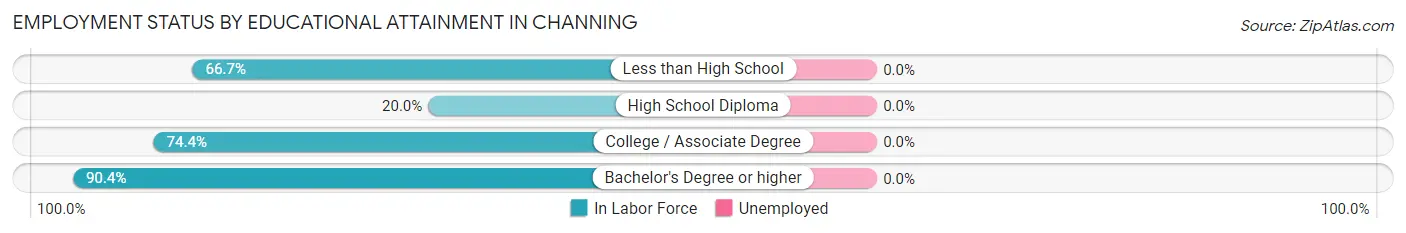
| Educational Attainment | In Labor Force | Unemployed |
| Less than High School | 2 (66.7%) | 0 (0.0%) |
| High School Diploma | 6 (20.0%) | 0 (0.0%) |
| College / Associate Degree | 32 (74.4%) | 0 (0.0%) |
| Bachelor's Degree or higher | 47 (90.4%) | 0 (0.0%) |
| Total | 87 (68.0%) | 0 (0.0%) |
Employment Occupations by Sex in Channing
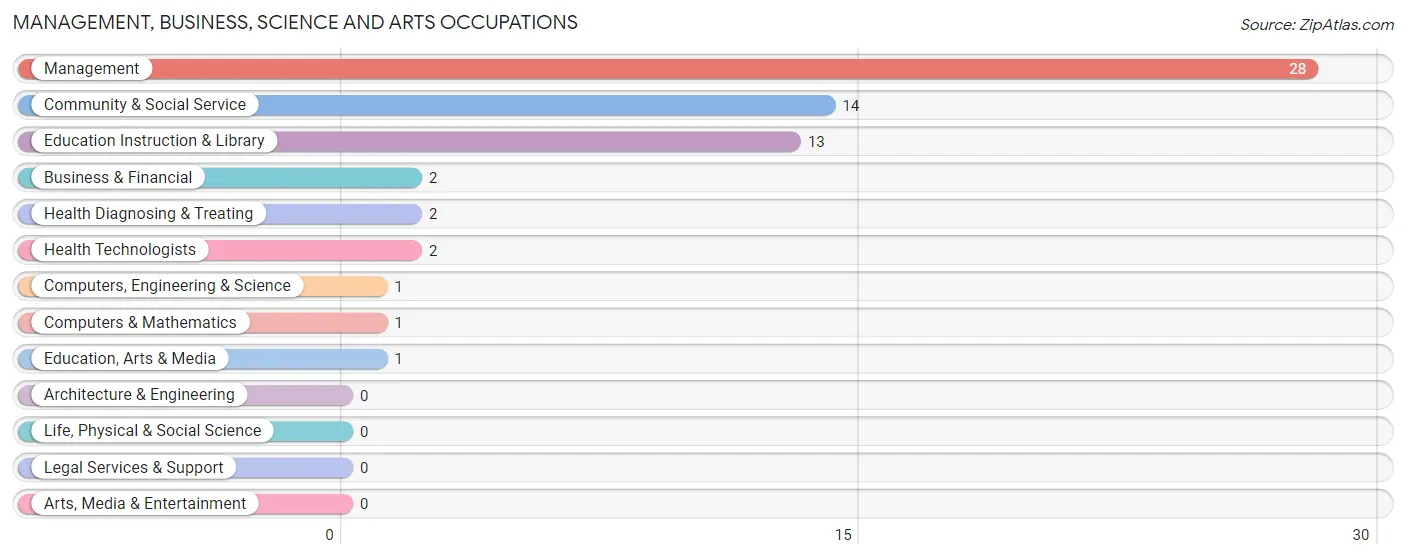
Management, Business, Science and Arts Occupations
The most common Management, Business, Science and Arts occupations in Channing are Management (28 | 29.2%), Community & Social Service (14 | 14.6%), Education Instruction & Library (13 | 13.5%), Business & Financial (2 | 2.1%), and Health Diagnosing & Treating (2 | 2.1%).
Management, Business, Science and Arts Occupations by Sex
Within the Management, Business, Science and Arts occupations in Channing, the most male-oriented occupations are Computers, Engineering & Science (100.0%), Computers & Mathematics (100.0%), and Business & Financial (50.0%), while the most female-oriented occupations are Education, Arts & Media (100.0%), Health Diagnosing & Treating (100.0%), and Health Technologists (100.0%).
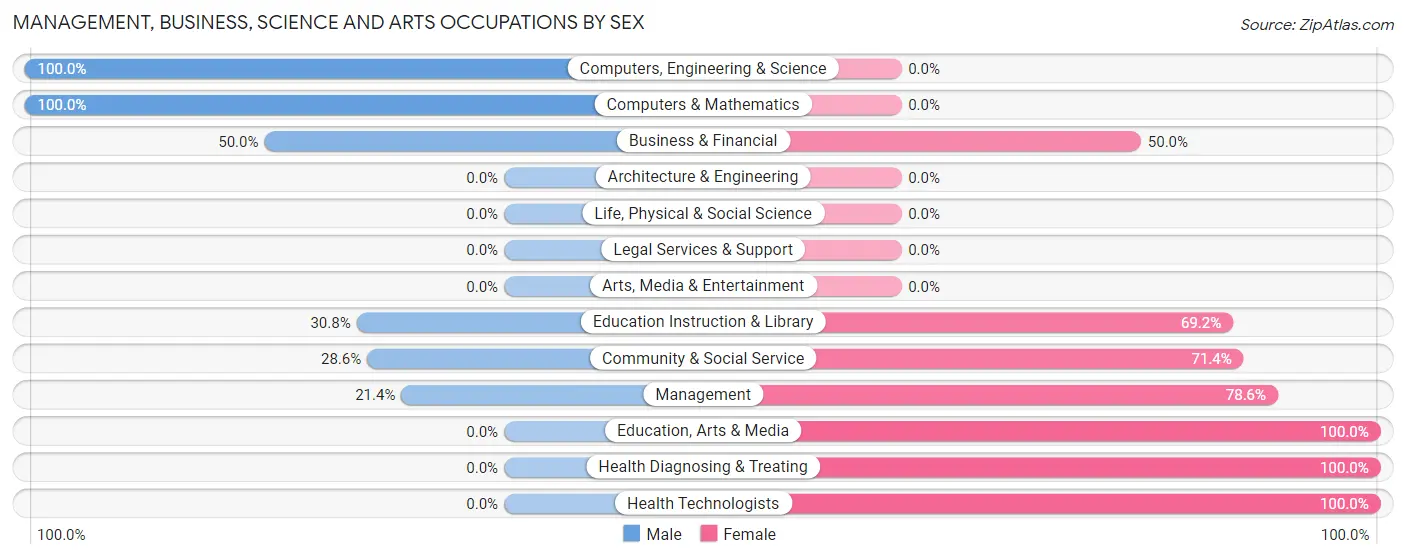
| Occupation | Male | Female |
| Management | 6 (21.4%) | 22 (78.6%) |
| Business & Financial | 1 (50.0%) | 1 (50.0%) |
| Computers, Engineering & Science | 1 (100.0%) | 0 (0.0%) |
| Computers & Mathematics | 1 (100.0%) | 0 (0.0%) |
| Architecture & Engineering | 0 (0.0%) | 0 (0.0%) |
| Life, Physical & Social Science | 0 (0.0%) | 0 (0.0%) |
| Community & Social Service | 4 (28.6%) | 10 (71.4%) |
| Education, Arts & Media | 0 (0.0%) | 1 (100.0%) |
| Legal Services & Support | 0 (0.0%) | 0 (0.0%) |
| Education Instruction & Library | 4 (30.8%) | 9 (69.2%) |
| Arts, Media & Entertainment | 0 (0.0%) | 0 (0.0%) |
| Health Diagnosing & Treating | 0 (0.0%) | 2 (100.0%) |
| Health Technologists | 0 (0.0%) | 2 (100.0%) |
| Total (Category) | 12 (25.5%) | 35 (74.5%) |
| Total (Overall) | 37 (38.5%) | 59 (61.5%) |
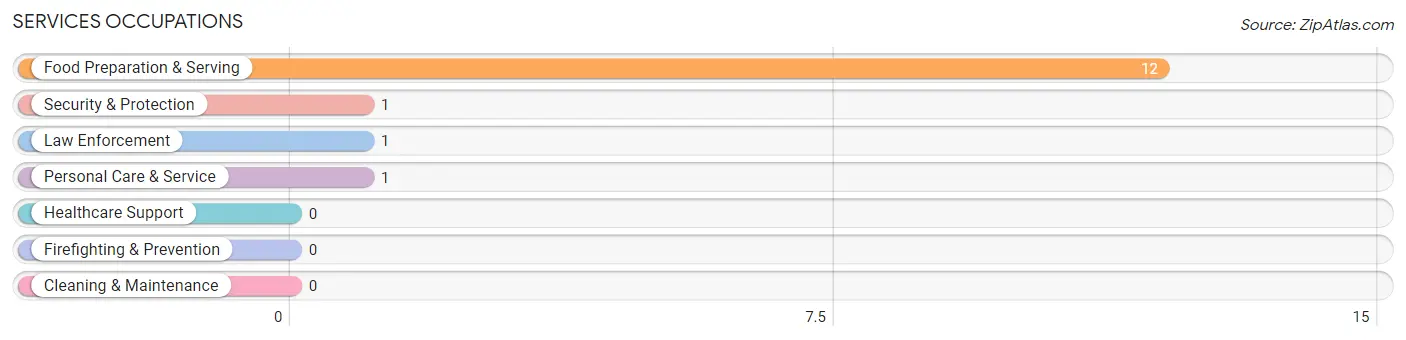
Services Occupations
The most common Services occupations in Channing are Food Preparation & Serving (12 | 12.5%), Security & Protection (1 | 1.0%), Law Enforcement (1 | 1.0%), and Personal Care & Service (1 | 1.0%).
Services Occupations by Sex
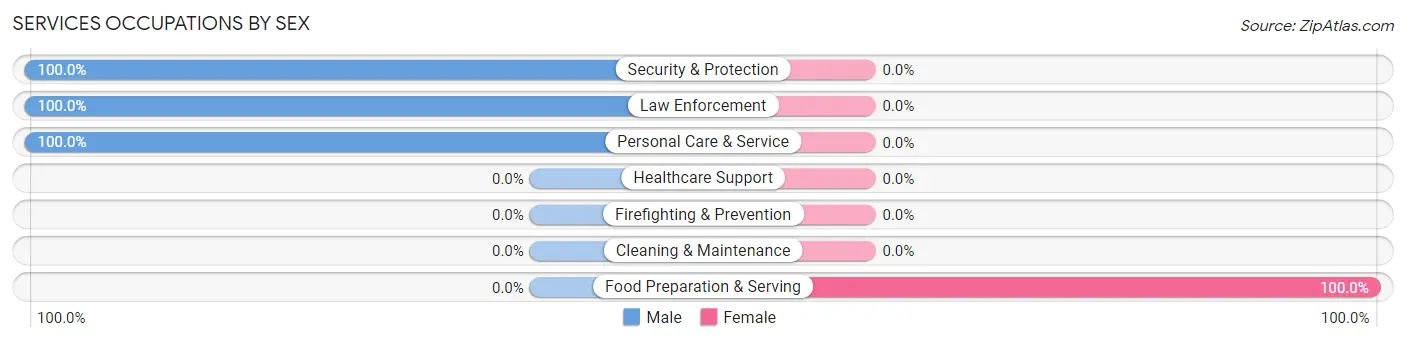
| Occupation | Male | Female |
| Healthcare Support | 0 (0.0%) | 0 (0.0%) |
| Security & Protection | 1 (100.0%) | 0 (0.0%) |
| Firefighting & Prevention | 0 (0.0%) | 0 (0.0%) |
| Law Enforcement | 1 (100.0%) | 0 (0.0%) |
| Food Preparation & Serving | 0 (0.0%) | 12 (100.0%) |
| Cleaning & Maintenance | 0 (0.0%) | 0 (0.0%) |
| Personal Care & Service | 1 (100.0%) | 0 (0.0%) |
| Total (Category) | 2 (14.3%) | 12 (85.7%) |
| Total (Overall) | 37 (38.5%) | 59 (61.5%) |
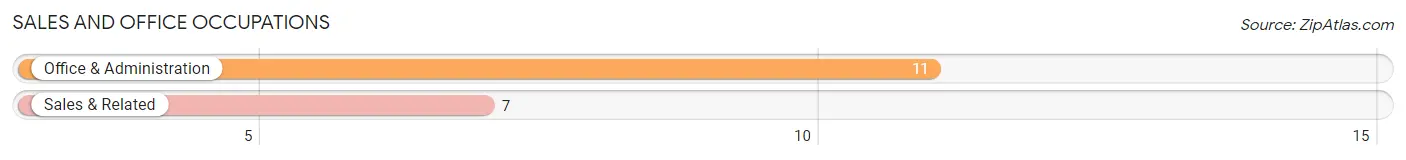
Sales and Office Occupations
The most common Sales and Office occupations in Channing are Office & Administration (11 | 11.5%), and Sales & Related (7 | 7.3%).
Sales and Office Occupations by Sex
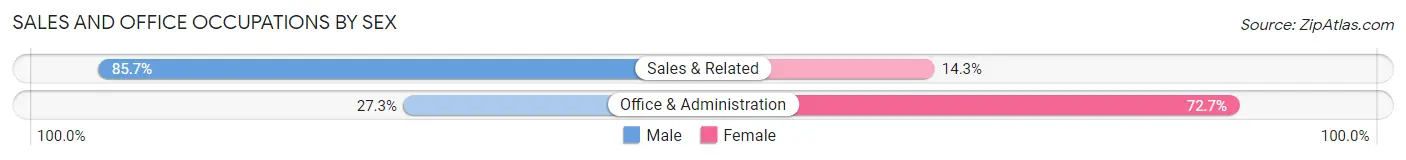
| Occupation | Male | Female |
| Sales & Related | 6 (85.7%) | 1 (14.3%) |
| Office & Administration | 3 (27.3%) | 8 (72.7%) |
| Total (Category) | 9 (50.0%) | 9 (50.0%) |
| Total (Overall) | 37 (38.5%) | 59 (61.5%) |
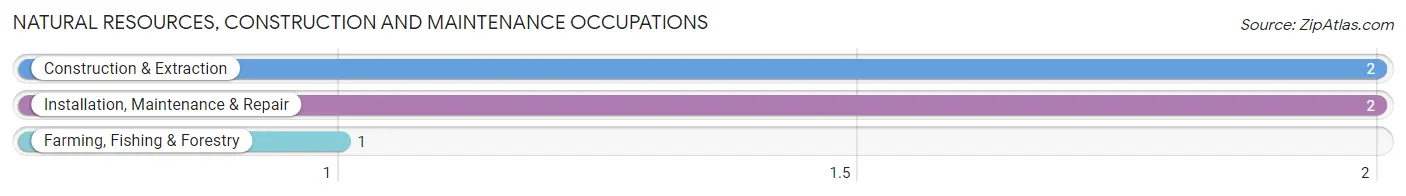
Natural Resources, Construction and Maintenance Occupations
The most common Natural Resources, Construction and Maintenance occupations in Channing are Construction & Extraction (2 | 2.1%), Installation, Maintenance & Repair (2 | 2.1%), and Farming, Fishing & Forestry (1 | 1.0%).
Natural Resources, Construction and Maintenance Occupations by Sex
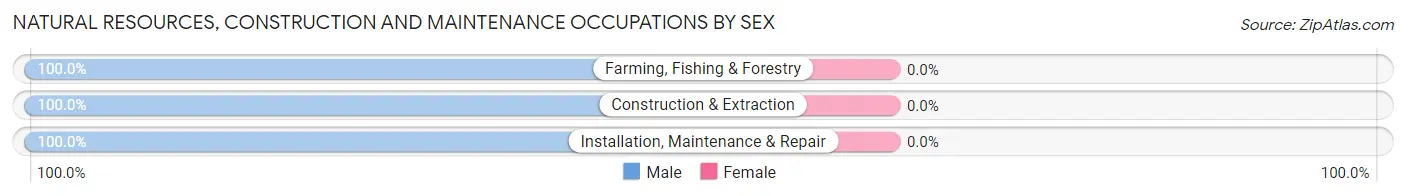
| Occupation | Male | Female |
| Farming, Fishing & Forestry | 1 (100.0%) | 0 (0.0%) |
| Construction & Extraction | 2 (100.0%) | 0 (0.0%) |
| Installation, Maintenance & Repair | 2 (100.0%) | 0 (0.0%) |
| Total (Category) | 5 (100.0%) | 0 (0.0%) |
| Total (Overall) | 37 (38.5%) | 59 (61.5%) |
Production, Transportation and Moving Occupations
The most common Production, Transportation and Moving occupations in Channing are Material Moving (10 | 10.4%), and Transportation (2 | 2.1%).
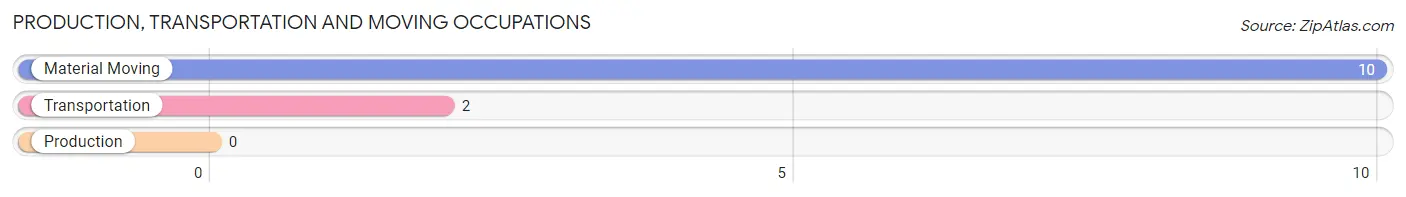
Production, Transportation and Moving Occupations by Sex
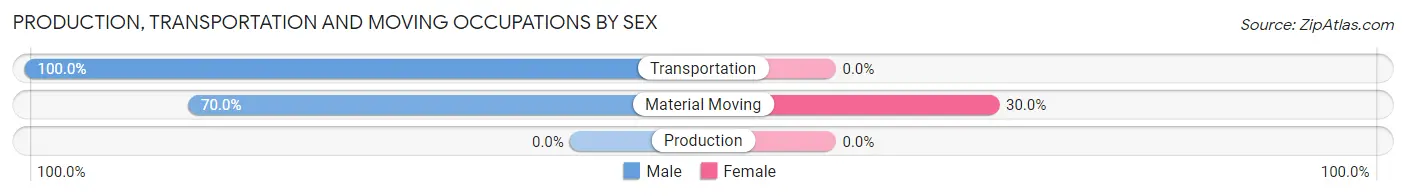
| Occupation | Male | Female |
| Production | 0 (0.0%) | 0 (0.0%) |
| Transportation | 2 (100.0%) | 0 (0.0%) |
| Material Moving | 7 (70.0%) | 3 (30.0%) |
| Total (Category) | 9 (75.0%) | 3 (25.0%) |
| Total (Overall) | 37 (38.5%) | 59 (61.5%) |
Employment Industries by Sex in Channing
Employment Industries in Channing
The major employment industries in Channing include Accommodation & Food Services (20 | 20.8%), Educational Services (18 | 18.8%), Health Care & Social Assistance (14 | 14.6%), Retail Trade (11 | 11.5%), and Manufacturing (10 | 10.4%).
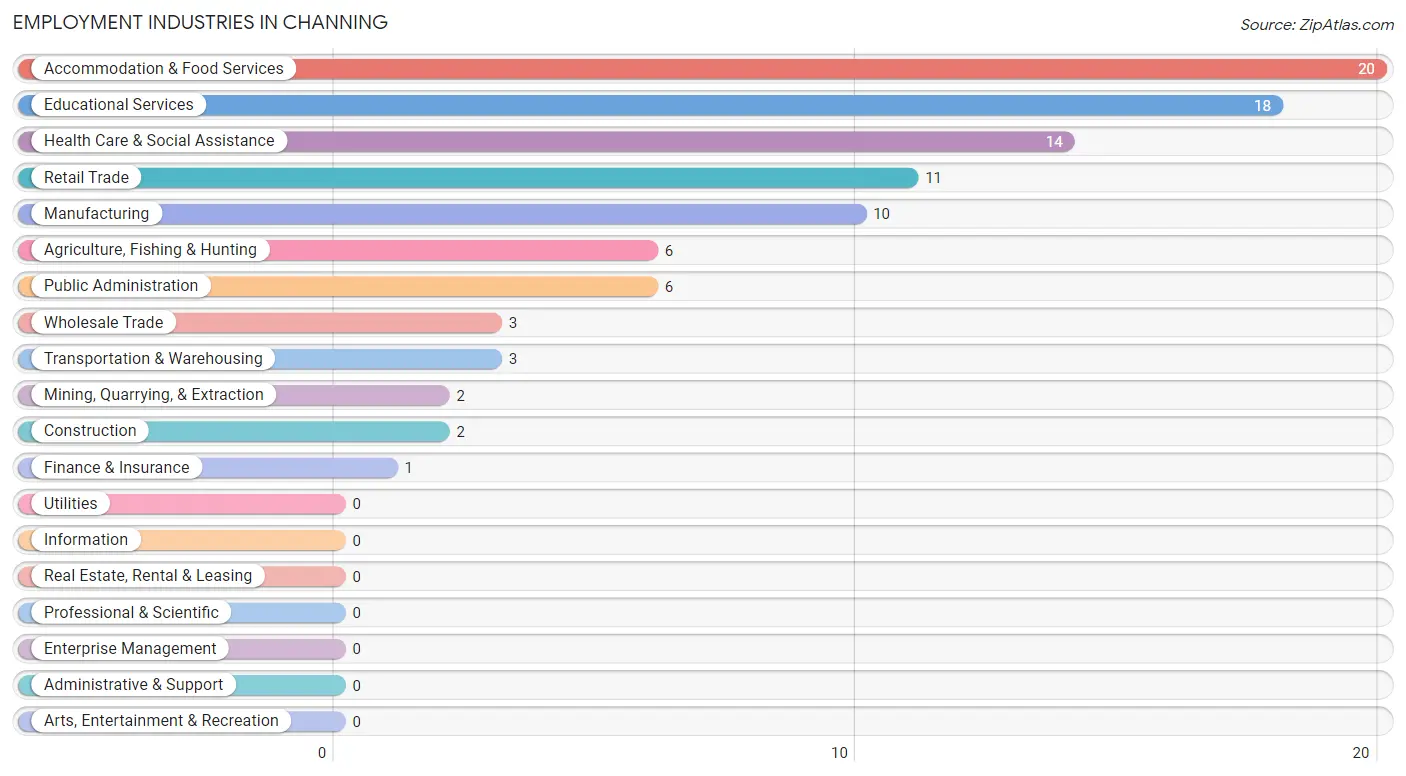
Employment Industries by Sex in Channing
The Channing industries that see more men than women are Mining, Quarrying, & Extraction (100.0%), Construction (100.0%), and Manufacturing (100.0%), whereas the industries that tend to have a higher number of women are Wholesale Trade (100.0%), Health Care & Social Assistance (85.7%), and Accommodation & Food Services (85.0%).
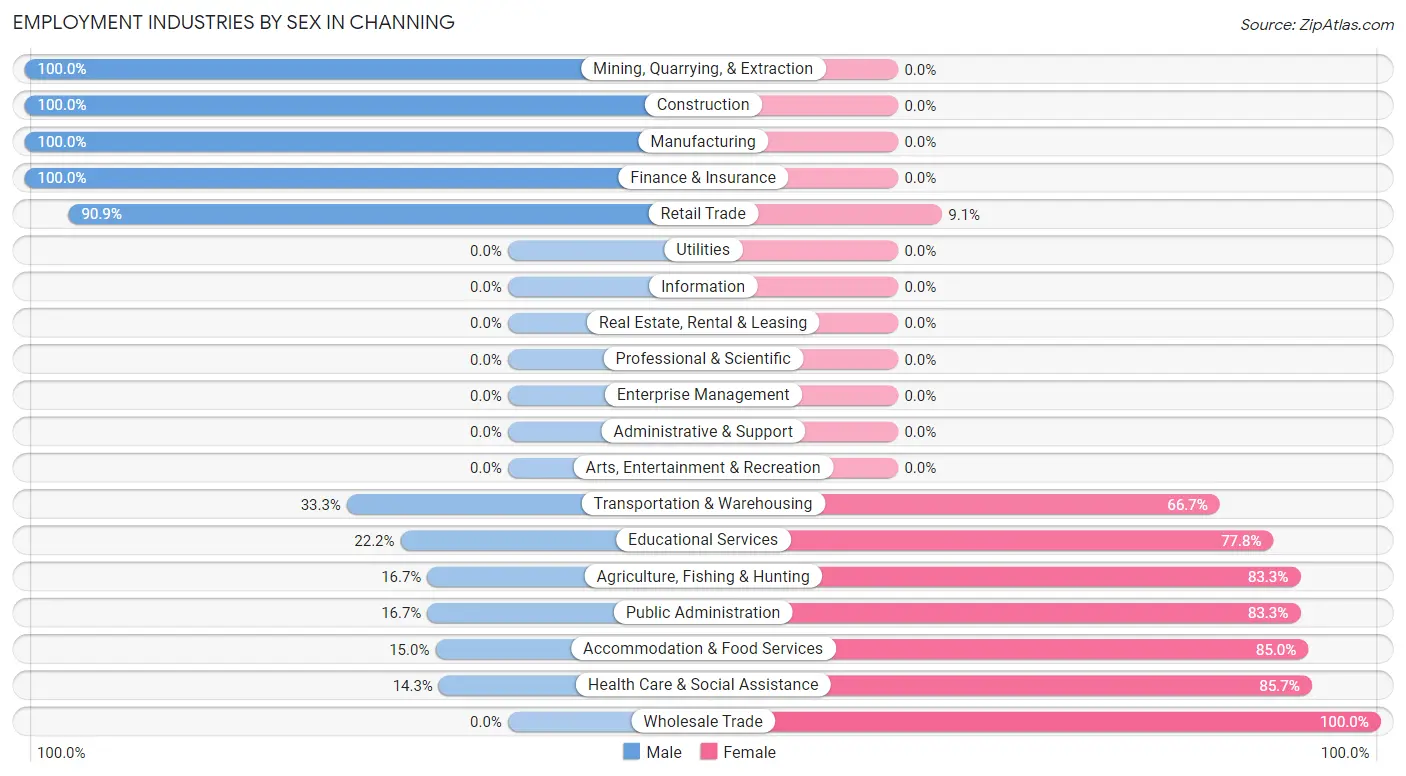
| Industry | Male | Female |
| Agriculture, Fishing & Hunting | 1 (16.7%) | 5 (83.3%) |
| Mining, Quarrying, & Extraction | 2 (100.0%) | 0 (0.0%) |
| Construction | 2 (100.0%) | 0 (0.0%) |
| Manufacturing | 10 (100.0%) | 0 (0.0%) |
| Wholesale Trade | 0 (0.0%) | 3 (100.0%) |
| Retail Trade | 10 (90.9%) | 1 (9.1%) |
| Transportation & Warehousing | 1 (33.3%) | 2 (66.7%) |
| Utilities | 0 (0.0%) | 0 (0.0%) |
| Information | 0 (0.0%) | 0 (0.0%) |
| Finance & Insurance | 1 (100.0%) | 0 (0.0%) |
| Real Estate, Rental & Leasing | 0 (0.0%) | 0 (0.0%) |
| Professional & Scientific | 0 (0.0%) | 0 (0.0%) |
| Enterprise Management | 0 (0.0%) | 0 (0.0%) |
| Administrative & Support | 0 (0.0%) | 0 (0.0%) |
| Educational Services | 4 (22.2%) | 14 (77.8%) |
| Health Care & Social Assistance | 2 (14.3%) | 12 (85.7%) |
| Arts, Entertainment & Recreation | 0 (0.0%) | 0 (0.0%) |
| Accommodation & Food Services | 3 (15.0%) | 17 (85.0%) |
| Public Administration | 1 (16.7%) | 5 (83.3%) |
| Total | 37 (38.5%) | 59 (61.5%) |
Education in Channing
School Enrollment in Channing
The most common levels of schooling among the 46 students in Channing are middle school (23 | 50.0%), elementary school (11 | 23.9%), and graduate / professional (7 | 15.2%).
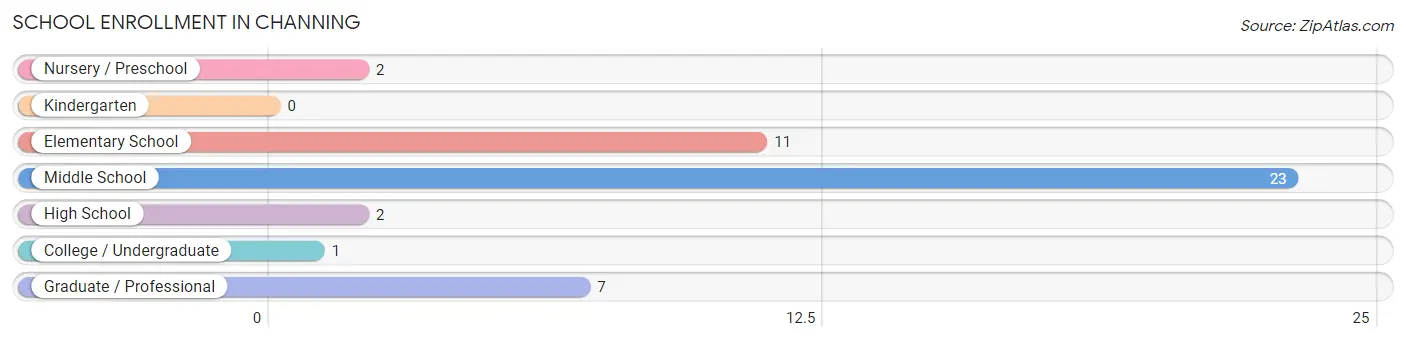
| School Level | # Students | % Students |
| Nursery / Preschool | 2 | 4.3% |
| Kindergarten | 0 | 0.0% |
| Elementary School | 11 | 23.9% |
| Middle School | 23 | 50.0% |
| High School | 2 | 4.3% |
| College / Undergraduate | 1 | 2.2% |
| Graduate / Professional | 7 | 15.2% |
| Total | 46 | 100.0% |
School Enrollment by Age by Funding Source in Channing
Out of a total of 46 students who are enrolled in schools in Channing, 3 (6.5%) attend a private institution, while the remaining 43 (93.5%) are enrolled in public schools. The age group of 3 to 4 year olds has the highest likelihood of being enrolled in private schools, with 2 (100.0% in the age bracket) enrolled. Conversely, the age group of 5 to 9 year old has the lowest likelihood of being enrolled in a private school, with 11 (100.0% in the age bracket) attending a public institution.
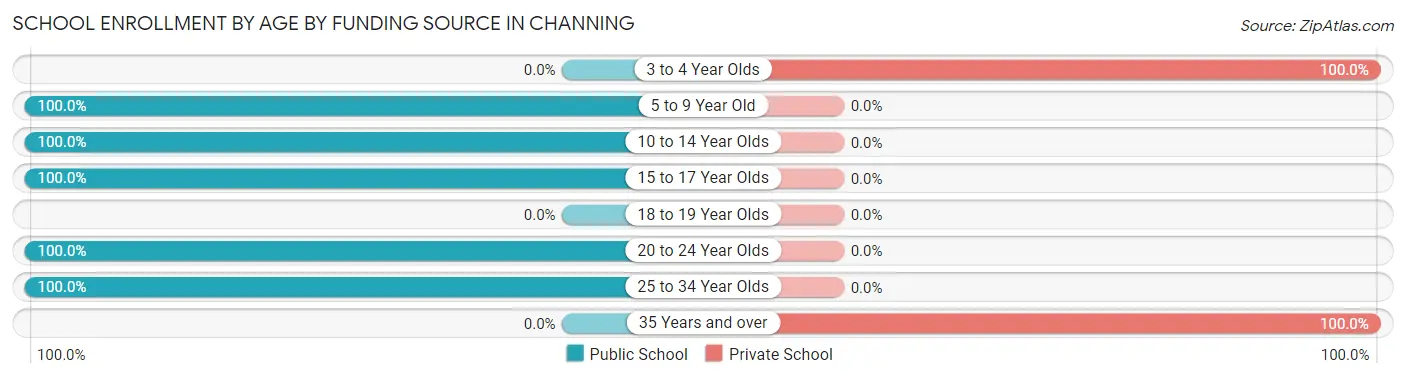
| Age Bracket | Public School | Private School |
| 3 to 4 Year Olds | 0 (0.0%) | 2 (100.0%) |
| 5 to 9 Year Old | 11 (100.0%) | 0 (0.0%) |
| 10 to 14 Year Olds | 23 (100.0%) | 0 (0.0%) |
| 15 to 17 Year Olds | 2 (100.0%) | 0 (0.0%) |
| 18 to 19 Year Olds | 0 (0.0%) | 0 (0.0%) |
| 20 to 24 Year Olds | 1 (100.0%) | 0 (0.0%) |
| 25 to 34 Year Olds | 6 (100.0%) | 0 (0.0%) |
| 35 Years and over | 0 (0.0%) | 1 (100.0%) |
| Total | 43 (93.5%) | 3 (6.5%) |
Educational Attainment by Field of Study in Channing
Business (19 | 33.9%), science & technology (17 | 30.4%), education (5 | 8.9%), communications (5 | 8.9%), and bio, nature & agricultural (3 | 5.4%) are the most common fields of study among 56 individuals in Channing who have obtained a bachelor's degree or higher.
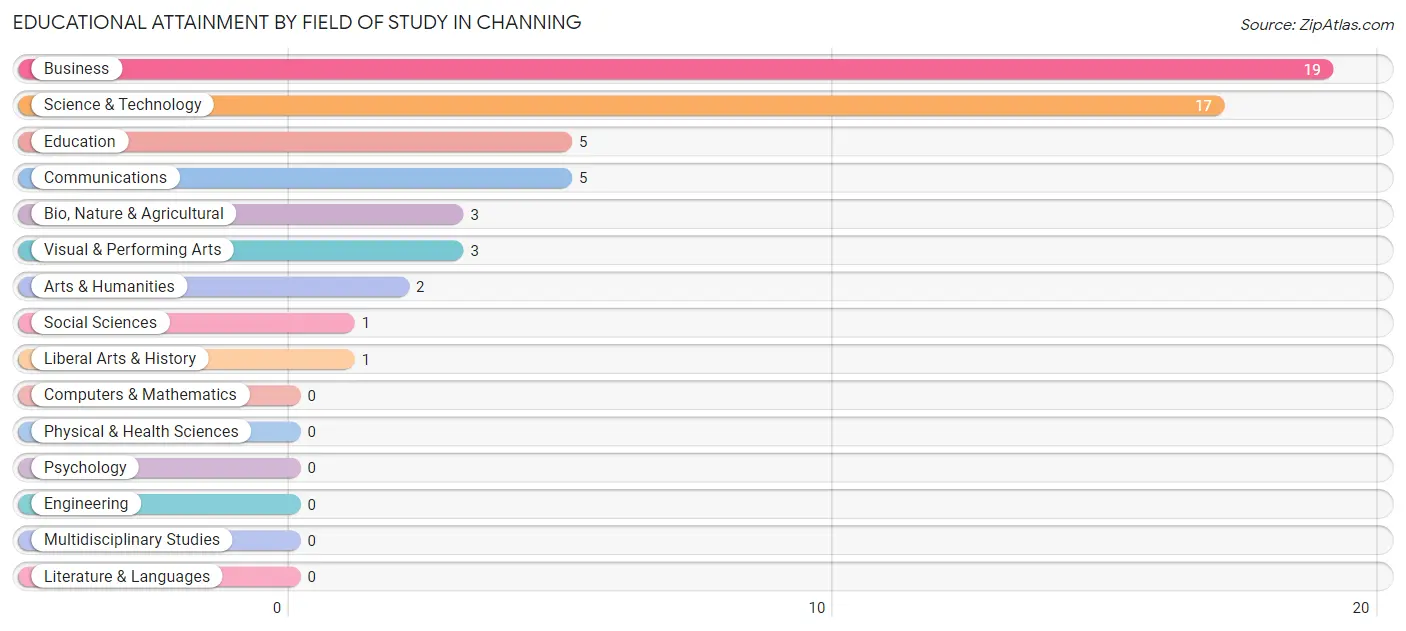
| Field of Study | # Graduates | % Graduates |
| Computers & Mathematics | 0 | 0.0% |
| Bio, Nature & Agricultural | 3 | 5.4% |
| Physical & Health Sciences | 0 | 0.0% |
| Psychology | 0 | 0.0% |
| Social Sciences | 1 | 1.8% |
| Engineering | 0 | 0.0% |
| Multidisciplinary Studies | 0 | 0.0% |
| Science & Technology | 17 | 30.4% |
| Business | 19 | 33.9% |
| Education | 5 | 8.9% |
| Literature & Languages | 0 | 0.0% |
| Liberal Arts & History | 1 | 1.8% |
| Visual & Performing Arts | 3 | 5.4% |
| Communications | 5 | 8.9% |
| Arts & Humanities | 2 | 3.6% |
| Total | 56 | 100.0% |
Transportation & Commute in Channing
Vehicle Availability by Sex in Channing
The most prevalent vehicle ownership categories in Channing are males with 2 vehicles (18, accounting for 48.6%) and females with 2 vehicles (9, making up 30.5%).
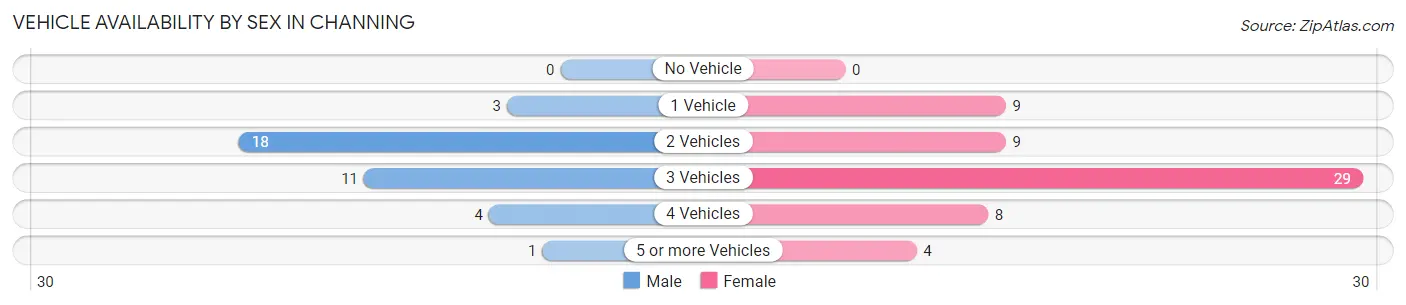
| Vehicles Available | Male | Female |
| No Vehicle | 0 (0.0%) | 0 (0.0%) |
| 1 Vehicle | 3 (8.1%) | 9 (15.2%) |
| 2 Vehicles | 18 (48.6%) | 9 (15.2%) |
| 3 Vehicles | 11 (29.7%) | 29 (49.1%) |
| 4 Vehicles | 4 (10.8%) | 8 (13.6%) |
| 5 or more Vehicles | 1 (2.7%) | 4 (6.8%) |
| Total | 37 (100.0%) | 59 (100.0%) |
Commute Time in Channing
The most frequently occuring commute durations in Channing are 30 to 34 minutes (24 commuters, 25.3%), 20 to 24 minutes (22 commuters, 23.2%), and 15 to 19 minutes (18 commuters, 19.0%).
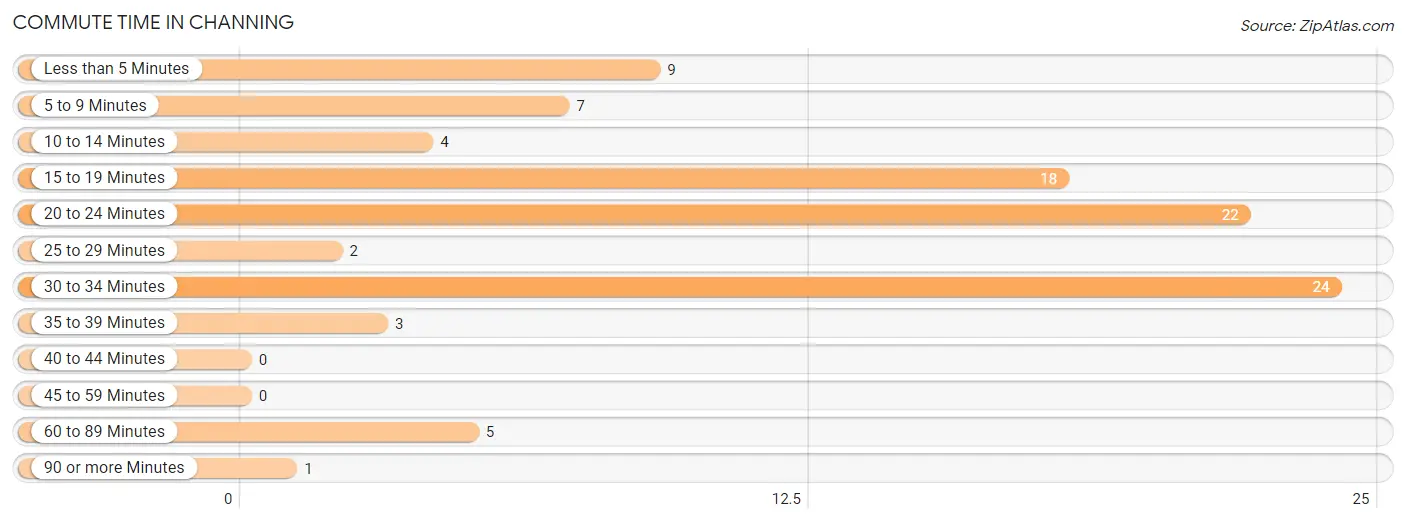
| Commute Time | # Commuters | % Commuters |
| Less than 5 Minutes | 9 | 9.5% |
| 5 to 9 Minutes | 7 | 7.4% |
| 10 to 14 Minutes | 4 | 4.2% |
| 15 to 19 Minutes | 18 | 19.0% |
| 20 to 24 Minutes | 22 | 23.2% |
| 25 to 29 Minutes | 2 | 2.1% |
| 30 to 34 Minutes | 24 | 25.3% |
| 35 to 39 Minutes | 3 | 3.2% |
| 40 to 44 Minutes | 0 | 0.0% |
| 45 to 59 Minutes | 0 | 0.0% |
| 60 to 89 Minutes | 5 | 5.3% |
| 90 or more Minutes | 1 | 1.1% |
Commute Time by Sex in Channing
The most common commute times in Channing are 20 to 24 minutes (11 commuters, 29.7%) for males and 30 to 34 minutes (19 commuters, 32.8%) for females.
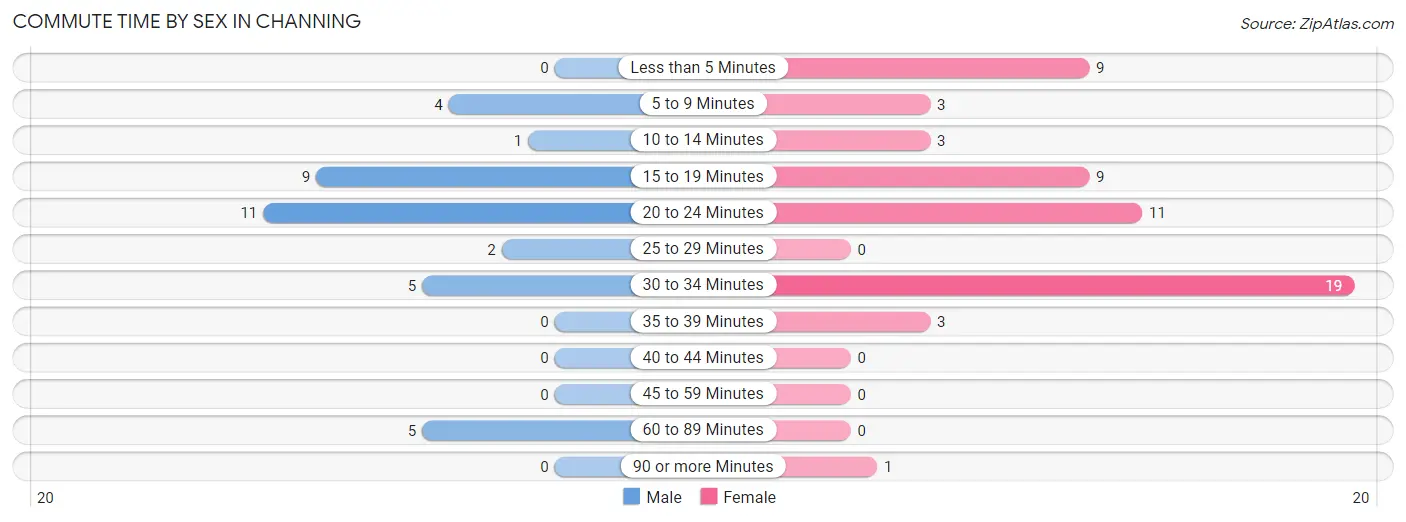
| Commute Time | Male | Female |
| Less than 5 Minutes | 0 (0.0%) | 9 (15.5%) |
| 5 to 9 Minutes | 4 (10.8%) | 3 (5.2%) |
| 10 to 14 Minutes | 1 (2.7%) | 3 (5.2%) |
| 15 to 19 Minutes | 9 (24.3%) | 9 (15.5%) |
| 20 to 24 Minutes | 11 (29.7%) | 11 (19.0%) |
| 25 to 29 Minutes | 2 (5.4%) | 0 (0.0%) |
| 30 to 34 Minutes | 5 (13.5%) | 19 (32.8%) |
| 35 to 39 Minutes | 0 (0.0%) | 3 (5.2%) |
| 40 to 44 Minutes | 0 (0.0%) | 0 (0.0%) |
| 45 to 59 Minutes | 0 (0.0%) | 0 (0.0%) |
| 60 to 89 Minutes | 5 (13.5%) | 0 (0.0%) |
| 90 or more Minutes | 0 (0.0%) | 1 (1.7%) |
Time of Departure to Work by Sex in Channing
The most frequent times of departure to work in Channing are 7:00 AM to 7:29 AM (18, 48.6%) for males and 6:00 AM to 6:29 AM (19, 32.8%) for females.
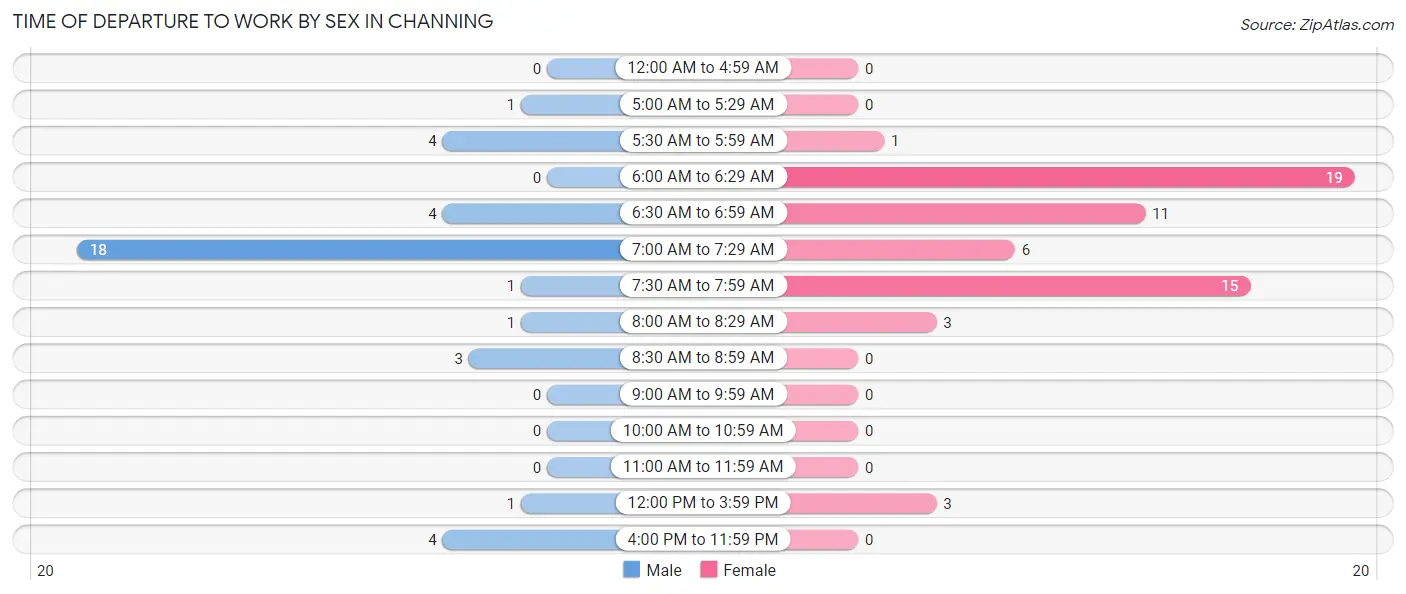
| Time of Departure | Male | Female |
| 12:00 AM to 4:59 AM | 0 (0.0%) | 0 (0.0%) |
| 5:00 AM to 5:29 AM | 1 (2.7%) | 0 (0.0%) |
| 5:30 AM to 5:59 AM | 4 (10.8%) | 1 (1.7%) |
| 6:00 AM to 6:29 AM | 0 (0.0%) | 19 (32.8%) |
| 6:30 AM to 6:59 AM | 4 (10.8%) | 11 (19.0%) |
| 7:00 AM to 7:29 AM | 18 (48.6%) | 6 (10.3%) |
| 7:30 AM to 7:59 AM | 1 (2.7%) | 15 (25.9%) |
| 8:00 AM to 8:29 AM | 1 (2.7%) | 3 (5.2%) |
| 8:30 AM to 8:59 AM | 3 (8.1%) | 0 (0.0%) |
| 9:00 AM to 9:59 AM | 0 (0.0%) | 0 (0.0%) |
| 10:00 AM to 10:59 AM | 0 (0.0%) | 0 (0.0%) |
| 11:00 AM to 11:59 AM | 0 (0.0%) | 0 (0.0%) |
| 12:00 PM to 3:59 PM | 1 (2.7%) | 3 (5.2%) |
| 4:00 PM to 11:59 PM | 4 (10.8%) | 0 (0.0%) |
| Total | 37 (100.0%) | 58 (100.0%) |
Housing Occupancy in Channing
Occupancy by Ownership in Channing
Of the total 101 dwellings in Channing, owner-occupied units account for 70 (69.3%), while renter-occupied units make up 31 (30.7%).
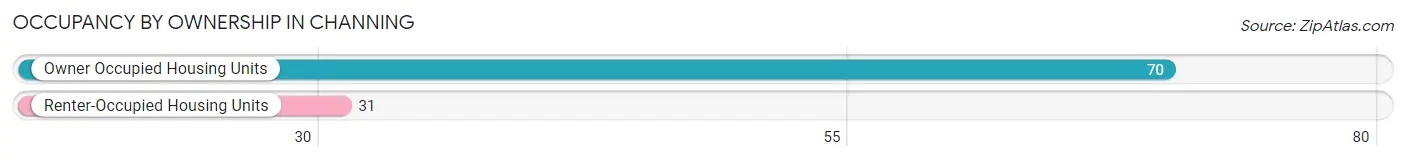
| Occupancy | # Housing Units | % Housing Units |
| Owner Occupied Housing Units | 70 | 69.3% |
| Renter-Occupied Housing Units | 31 | 30.7% |
| Total Occupied Housing Units | 101 | 100.0% |
Occupancy by Household Size in Channing
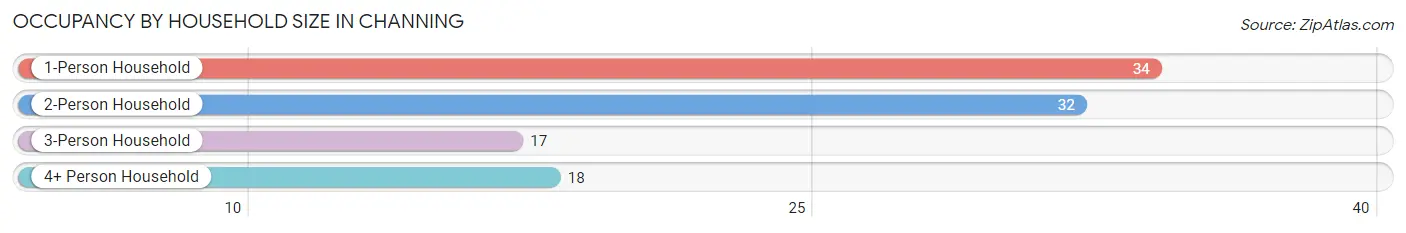
| Household Size | # Housing Units | % Housing Units |
| 1-Person Household | 34 | 33.7% |
| 2-Person Household | 32 | 31.7% |
| 3-Person Household | 17 | 16.8% |
| 4+ Person Household | 18 | 17.8% |
| Total Housing Units | 101 | 100.0% |
Occupancy by Ownership by Household Size in Channing
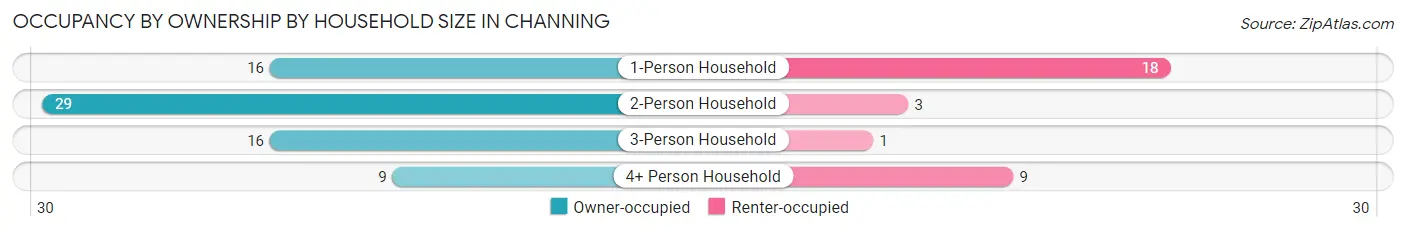
| Household Size | Owner-occupied | Renter-occupied |
| 1-Person Household | 16 (47.1%) | 18 (52.9%) |
| 2-Person Household | 29 (90.6%) | 3 (9.4%) |
| 3-Person Household | 16 (94.1%) | 1 (5.9%) |
| 4+ Person Household | 9 (50.0%) | 9 (50.0%) |
| Total Housing Units | 70 (69.3%) | 31 (30.7%) |
Occupancy by Educational Attainment in Channing
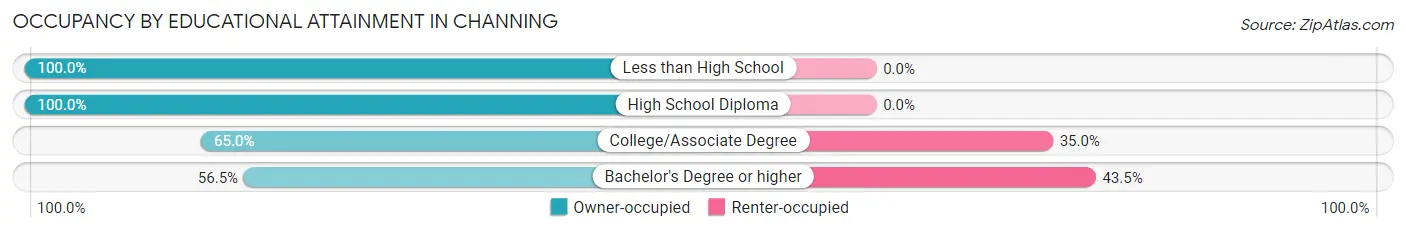
| Household Size | Owner-occupied | Renter-occupied |
| Less than High School | 8 (100.0%) | 0 (0.0%) |
| High School Diploma | 10 (100.0%) | 0 (0.0%) |
| College/Associate Degree | 39 (65.0%) | 21 (35.0%) |
| Bachelor's Degree or higher | 13 (56.5%) | 10 (43.5%) |
Occupancy by Age of Householder in Channing
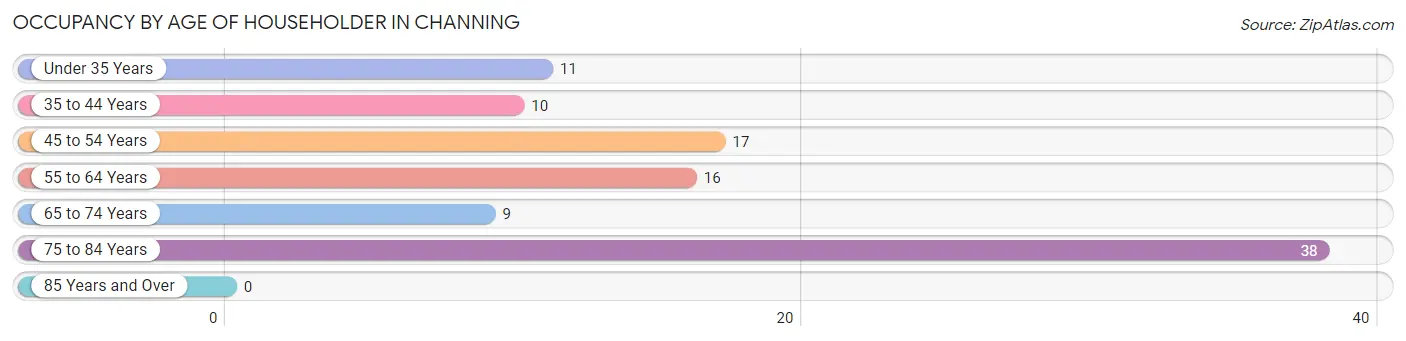
| Age Bracket | # Households | % Households |
| Under 35 Years | 11 | 10.9% |
| 35 to 44 Years | 10 | 9.9% |
| 45 to 54 Years | 17 | 16.8% |
| 55 to 64 Years | 16 | 15.8% |
| 65 to 74 Years | 9 | 8.9% |
| 75 to 84 Years | 38 | 37.6% |
| 85 Years and Over | 0 | 0.0% |
| Total | 101 | 100.0% |
Housing Finances in Channing
Median Income by Occupancy in Channing
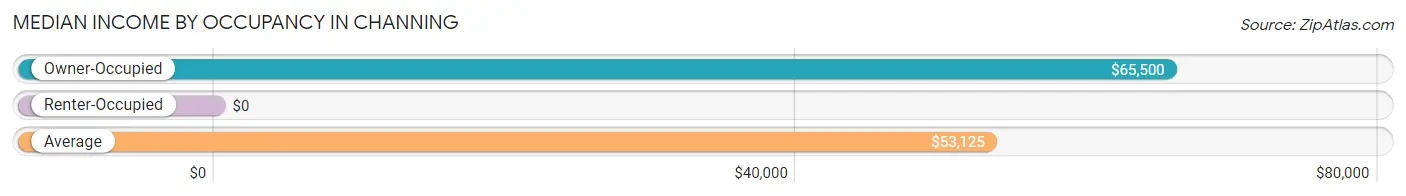
| Occupancy Type | # Households | Median Income |
| Owner-Occupied | 70 (69.3%) | $65,500 |
| Renter-Occupied | 31 (30.7%) | $0 |
| Average | 101 (100.0%) | $53,125 |
Occupancy by Householder Income Bracket in Channing
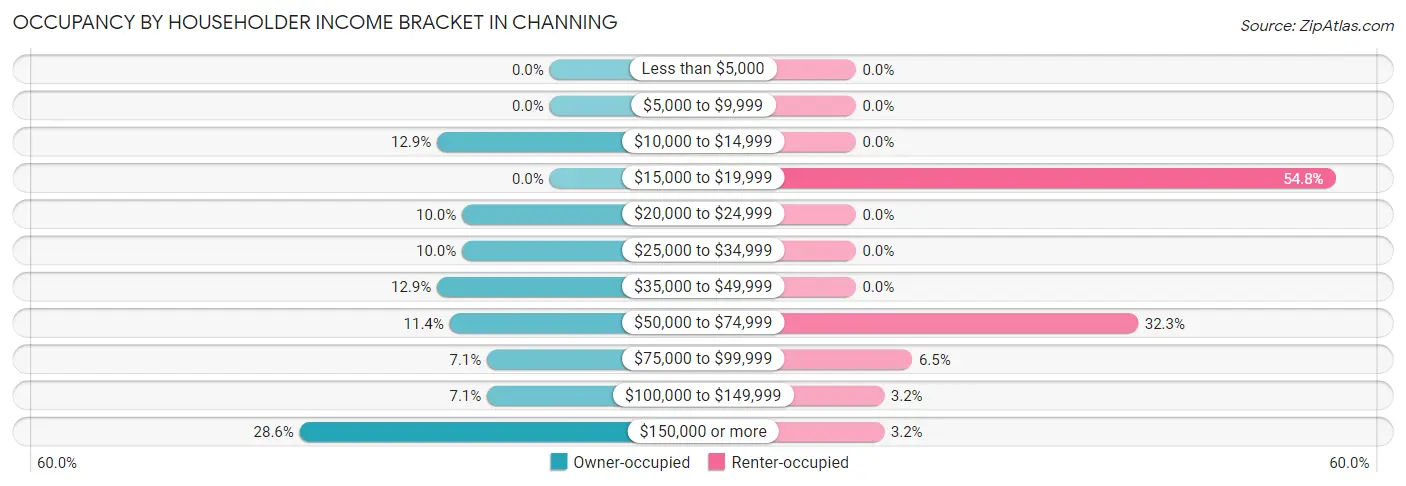
| Income Bracket | Owner-occupied | Renter-occupied |
| Less than $5,000 | 0 (0.0%) | 0 (0.0%) |
| $5,000 to $9,999 | 0 (0.0%) | 0 (0.0%) |
| $10,000 to $14,999 | 9 (12.9%) | 0 (0.0%) |
| $15,000 to $19,999 | 0 (0.0%) | 17 (54.8%) |
| $20,000 to $24,999 | 7 (10.0%) | 0 (0.0%) |
| $25,000 to $34,999 | 7 (10.0%) | 0 (0.0%) |
| $35,000 to $49,999 | 9 (12.9%) | 0 (0.0%) |
| $50,000 to $74,999 | 8 (11.4%) | 10 (32.3%) |
| $75,000 to $99,999 | 5 (7.1%) | 2 (6.5%) |
| $100,000 to $149,999 | 5 (7.1%) | 1 (3.2%) |
| $150,000 or more | 20 (28.6%) | 1 (3.2%) |
| Total | 70 (100.0%) | 31 (100.0%) |
Monthly Housing Cost Tiers in Channing
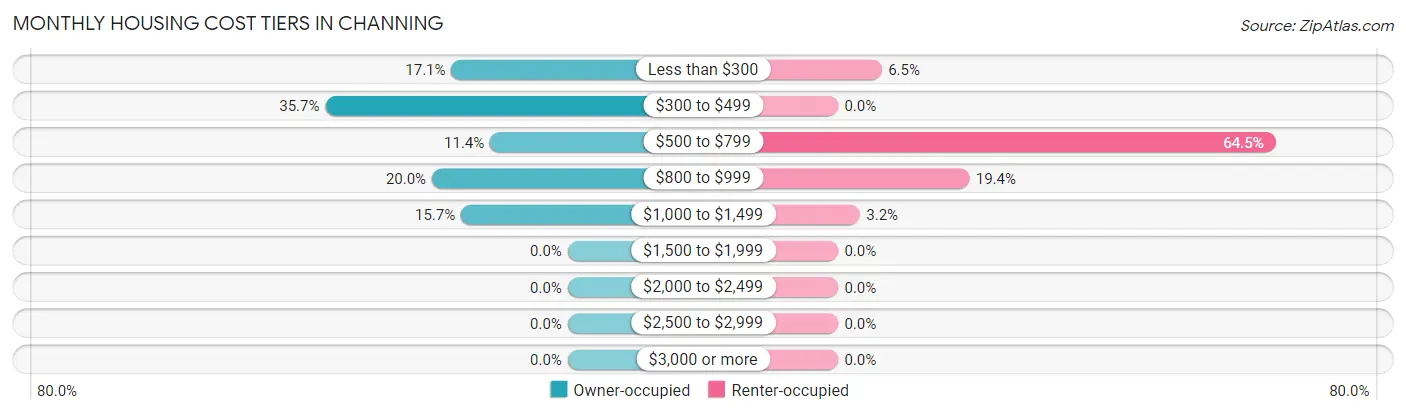
| Monthly Cost | Owner-occupied | Renter-occupied |
| Less than $300 | 12 (17.1%) | 2 (6.5%) |
| $300 to $499 | 25 (35.7%) | 0 (0.0%) |
| $500 to $799 | 8 (11.4%) | 20 (64.5%) |
| $800 to $999 | 14 (20.0%) | 6 (19.4%) |
| $1,000 to $1,499 | 11 (15.7%) | 1 (3.2%) |
| $1,500 to $1,999 | 0 (0.0%) | 0 (0.0%) |
| $2,000 to $2,499 | 0 (0.0%) | 0 (0.0%) |
| $2,500 to $2,999 | 0 (0.0%) | 0 (0.0%) |
| $3,000 or more | 0 (0.0%) | 0 (0.0%) |
| Total | 70 (100.0%) | 31 (100.0%) |
Physical Housing Characteristics in Channing
Housing Structures in Channing
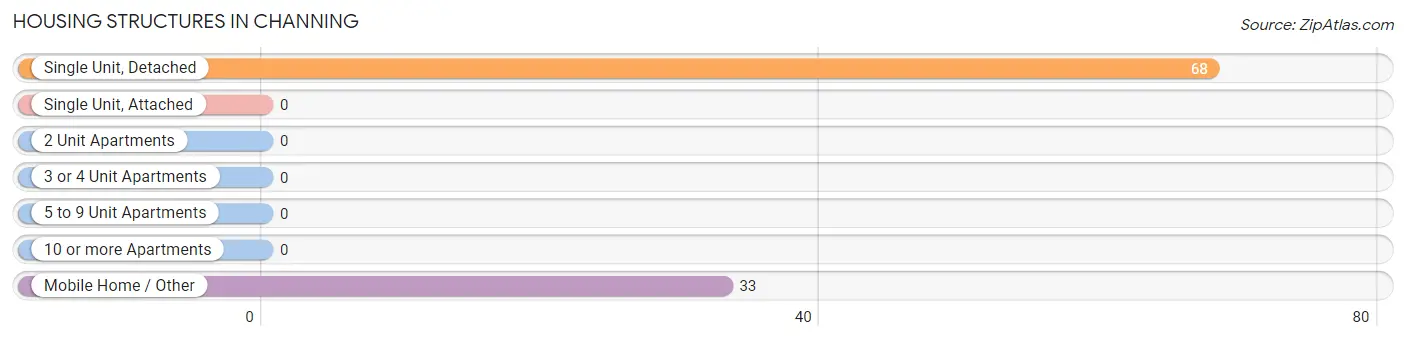
| Structure Type | # Housing Units | % Housing Units |
| Single Unit, Detached | 68 | 67.3% |
| Single Unit, Attached | 0 | 0.0% |
| 2 Unit Apartments | 0 | 0.0% |
| 3 or 4 Unit Apartments | 0 | 0.0% |
| 5 to 9 Unit Apartments | 0 | 0.0% |
| 10 or more Apartments | 0 | 0.0% |
| Mobile Home / Other | 33 | 32.7% |
| Total | 101 | 100.0% |
Housing Structures by Occupancy in Channing
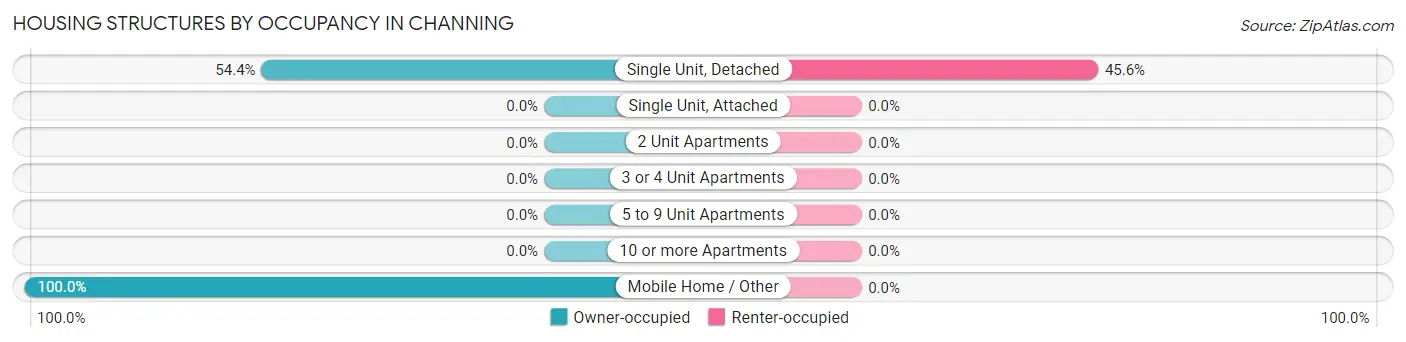
| Structure Type | Owner-occupied | Renter-occupied |
| Single Unit, Detached | 37 (54.4%) | 31 (45.6%) |
| Single Unit, Attached | 0 (0.0%) | 0 (0.0%) |
| 2 Unit Apartments | 0 (0.0%) | 0 (0.0%) |
| 3 or 4 Unit Apartments | 0 (0.0%) | 0 (0.0%) |
| 5 to 9 Unit Apartments | 0 (0.0%) | 0 (0.0%) |
| 10 or more Apartments | 0 (0.0%) | 0 (0.0%) |
| Mobile Home / Other | 33 (100.0%) | 0 (0.0%) |
| Total | 70 (69.3%) | 31 (30.7%) |
Housing Structures by Number of Rooms in Channing
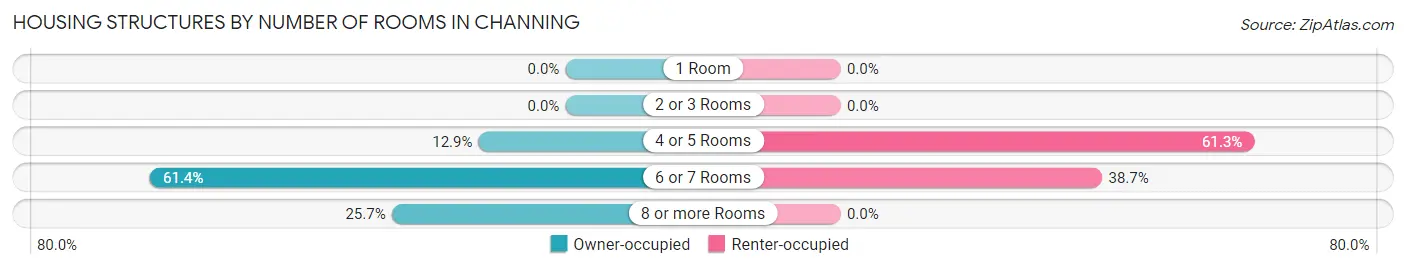
| Number of Rooms | Owner-occupied | Renter-occupied |
| 1 Room | 0 (0.0%) | 0 (0.0%) |
| 2 or 3 Rooms | 0 (0.0%) | 0 (0.0%) |
| 4 or 5 Rooms | 9 (12.9%) | 19 (61.3%) |
| 6 or 7 Rooms | 43 (61.4%) | 12 (38.7%) |
| 8 or more Rooms | 18 (25.7%) | 0 (0.0%) |
| Total | 70 (100.0%) | 31 (100.0%) |
Housing Structure by Heating Type in Channing
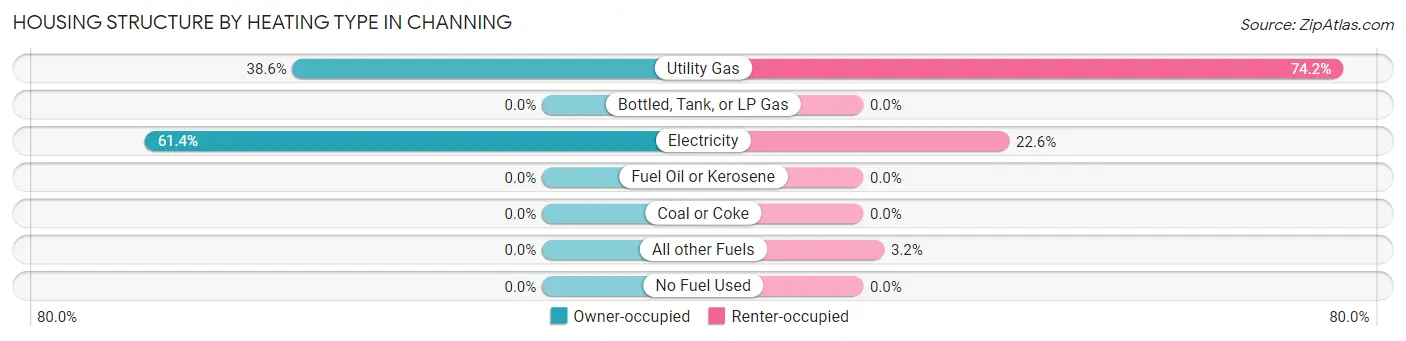
| Heating Type | Owner-occupied | Renter-occupied |
| Utility Gas | 27 (38.6%) | 23 (74.2%) |
| Bottled, Tank, or LP Gas | 0 (0.0%) | 0 (0.0%) |
| Electricity | 43 (61.4%) | 7 (22.6%) |
| Fuel Oil or Kerosene | 0 (0.0%) | 0 (0.0%) |
| Coal or Coke | 0 (0.0%) | 0 (0.0%) |
| All other Fuels | 0 (0.0%) | 1 (3.2%) |
| No Fuel Used | 0 (0.0%) | 0 (0.0%) |
| Total | 70 (100.0%) | 31 (100.0%) |
Household Vehicle Usage in Channing
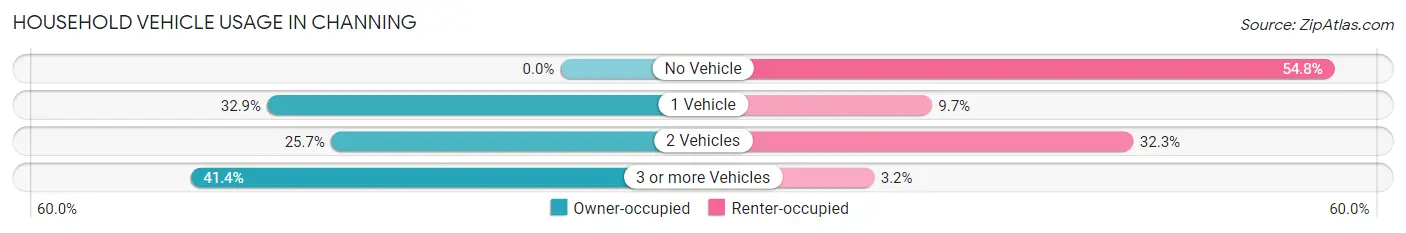
| Vehicles per Household | Owner-occupied | Renter-occupied |
| No Vehicle | 0 (0.0%) | 17 (54.8%) |
| 1 Vehicle | 23 (32.9%) | 3 (9.7%) |
| 2 Vehicles | 18 (25.7%) | 10 (32.3%) |
| 3 or more Vehicles | 29 (41.4%) | 1 (3.2%) |
| Total | 70 (100.0%) | 31 (100.0%) |
Real Estate & Mortgages in Channing
Real Estate and Mortgage Overview in Channing
| Characteristic | Without Mortgage | With Mortgage |
| Housing Units | 44 | 26 |
| Median Property Value | $70,000 | $100,000 |
| Median Household Income | - | - |
| Monthly Housing Costs | $375 | $0 |
| Real Estate Taxes | $800 | $0 |
Property Value by Mortgage Status in Channing
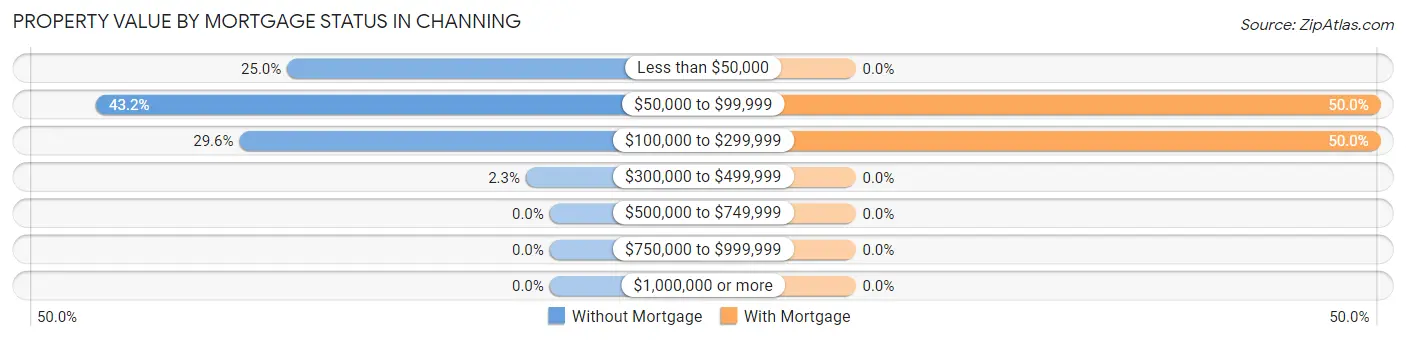
| Property Value | Without Mortgage | With Mortgage |
| Less than $50,000 | 11 (25.0%) | 0 (0.0%) |
| $50,000 to $99,999 | 19 (43.2%) | 13 (50.0%) |
| $100,000 to $299,999 | 13 (29.5%) | 13 (50.0%) |
| $300,000 to $499,999 | 1 (2.3%) | 0 (0.0%) |
| $500,000 to $749,999 | 0 (0.0%) | 0 (0.0%) |
| $750,000 to $999,999 | 0 (0.0%) | 0 (0.0%) |
| $1,000,000 or more | 0 (0.0%) | 0 (0.0%) |
| Total | 44 (100.0%) | 26 (100.0%) |
Household Income by Mortgage Status in Channing
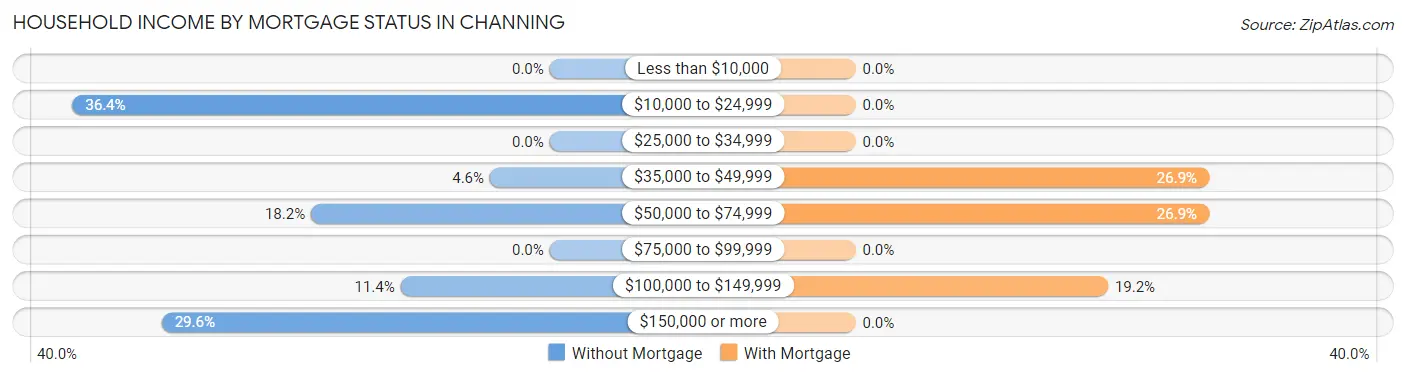
| Household Income | Without Mortgage | With Mortgage |
| Less than $10,000 | 0 (0.0%) | 0 (0.0%) |
| $10,000 to $24,999 | 16 (36.4%) | 0 (0.0%) |
| $25,000 to $34,999 | 0 (0.0%) | 0 (0.0%) |
| $35,000 to $49,999 | 2 (4.5%) | 7 (26.9%) |
| $50,000 to $74,999 | 8 (18.2%) | 7 (26.9%) |
| $75,000 to $99,999 | 0 (0.0%) | 0 (0.0%) |
| $100,000 to $149,999 | 5 (11.4%) | 5 (19.2%) |
| $150,000 or more | 13 (29.5%) | 0 (0.0%) |
| Total | 44 (100.0%) | 26 (100.0%) |
Property Value to Household Income Ratio in Channing
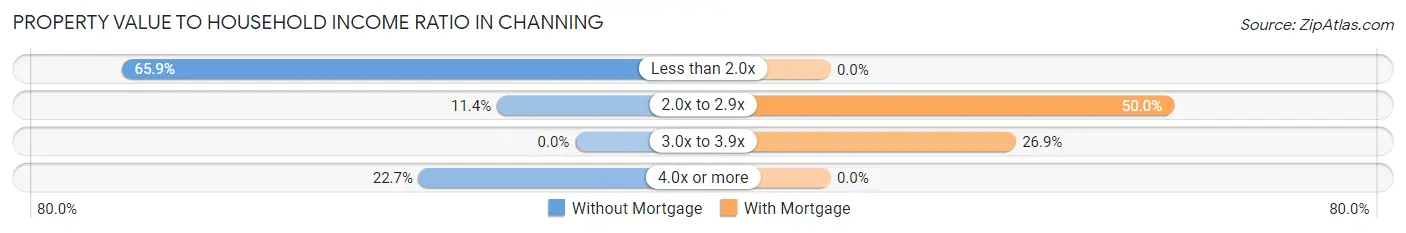
| Value-to-Income Ratio | Without Mortgage | With Mortgage |
| Less than 2.0x | 29 (65.9%) | 0 (0.0%) |
| 2.0x to 2.9x | 5 (11.4%) | 13 (50.0%) |
| 3.0x to 3.9x | 0 (0.0%) | 7 (26.9%) |
| 4.0x or more | 10 (22.7%) | 0 (0.0%) |
| Total | 44 (100.0%) | 26 (100.0%) |
Real Estate Taxes by Mortgage Status in Channing
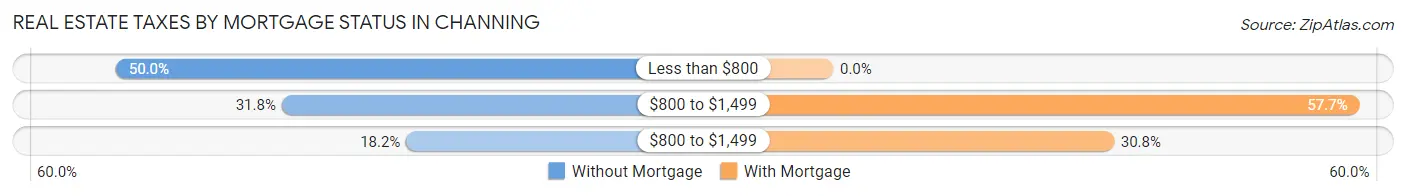
| Property Taxes | Without Mortgage | With Mortgage |
| Less than $800 | 22 (50.0%) | 0 (0.0%) |
| $800 to $1,499 | 14 (31.8%) | 15 (57.7%) |
| $800 to $1,499 | 8 (18.2%) | 8 (30.8%) |
| Total | 44 (100.0%) | 26 (100.0%) |
Health & Disability in Channing
Health Insurance Coverage by Age in Channing
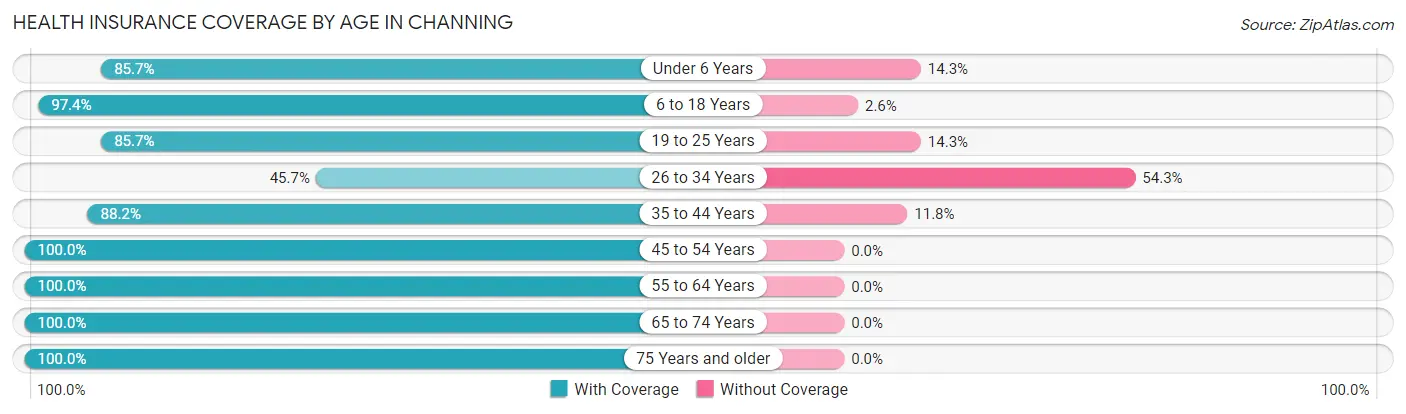
| Age Bracket | With Coverage | Without Coverage |
| Under 6 Years | 12 (85.7%) | 2 (14.3%) |
| 6 to 18 Years | 38 (97.4%) | 1 (2.6%) |
| 19 to 25 Years | 6 (85.7%) | 1 (14.3%) |
| 26 to 34 Years | 16 (45.7%) | 19 (54.3%) |
| 35 to 44 Years | 15 (88.2%) | 2 (11.8%) |
| 45 to 54 Years | 33 (100.0%) | 0 (0.0%) |
| 55 to 64 Years | 40 (100.0%) | 0 (0.0%) |
| 65 to 74 Years | 16 (100.0%) | 0 (0.0%) |
| 75 Years and older | 43 (100.0%) | 0 (0.0%) |
| Total | 219 (89.7%) | 25 (10.2%) |
Health Insurance Coverage by Citizenship Status in Channing
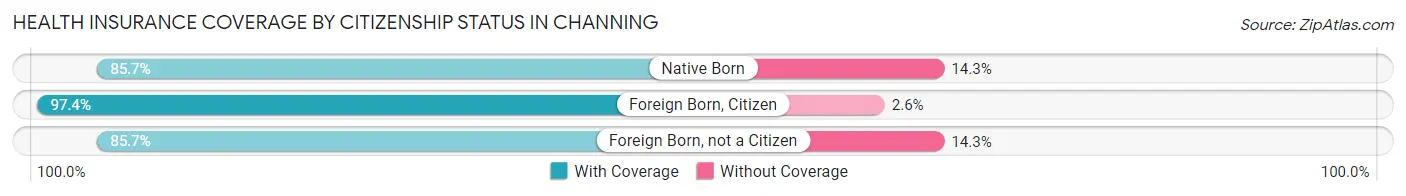
| Citizenship Status | With Coverage | Without Coverage |
| Native Born | 12 (85.7%) | 2 (14.3%) |
| Foreign Born, Citizen | 38 (97.4%) | 1 (2.6%) |
| Foreign Born, not a Citizen | 6 (85.7%) | 1 (14.3%) |
Health Insurance Coverage by Household Income in Channing
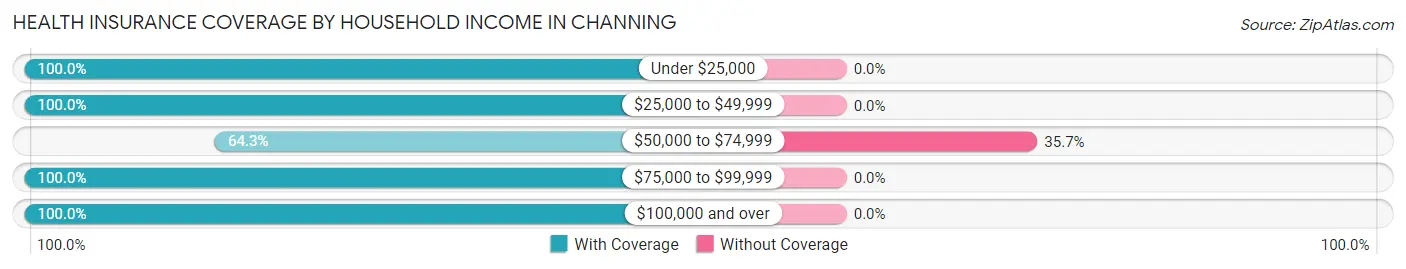
| Household Income | With Coverage | Without Coverage |
| Under $25,000 | 39 (100.0%) | 0 (0.0%) |
| $25,000 to $49,999 | 32 (100.0%) | 0 (0.0%) |
| $50,000 to $74,999 | 45 (64.3%) | 25 (35.7%) |
| $75,000 to $99,999 | 40 (100.0%) | 0 (0.0%) |
| $100,000 and over | 63 (100.0%) | 0 (0.0%) |
Public vs Private Health Insurance Coverage by Age in Channing
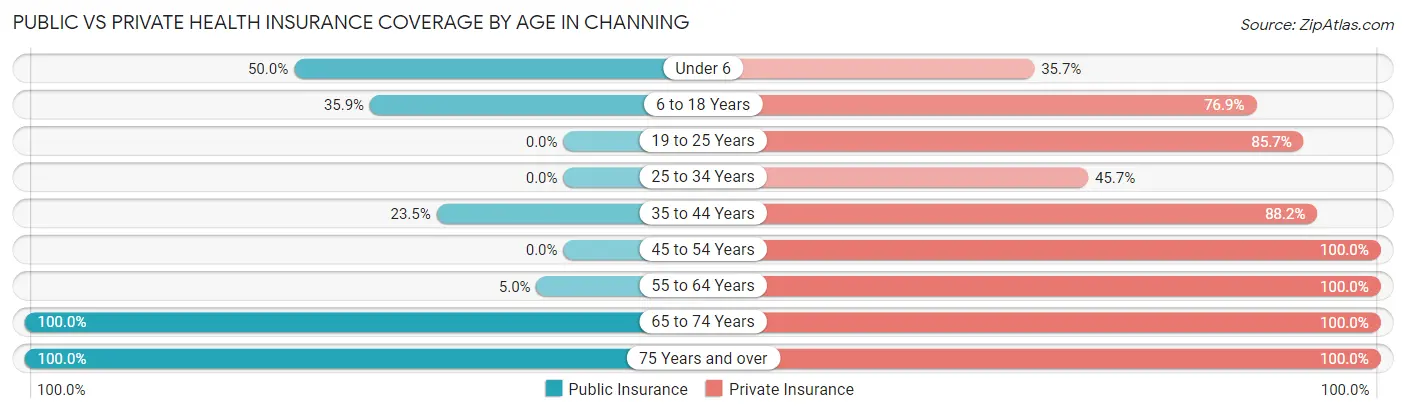
| Age Bracket | Public Insurance | Private Insurance |
| Under 6 | 7 (50.0%) | 5 (35.7%) |
| 6 to 18 Years | 14 (35.9%) | 30 (76.9%) |
| 19 to 25 Years | 0 (0.0%) | 6 (85.7%) |
| 25 to 34 Years | 0 (0.0%) | 16 (45.7%) |
| 35 to 44 Years | 4 (23.5%) | 15 (88.2%) |
| 45 to 54 Years | 0 (0.0%) | 33 (100.0%) |
| 55 to 64 Years | 2 (5.0%) | 40 (100.0%) |
| 65 to 74 Years | 16 (100.0%) | 16 (100.0%) |
| 75 Years and over | 43 (100.0%) | 43 (100.0%) |
| Total | 86 (35.2%) | 204 (83.6%) |
Disability Status by Sex by Age in Channing
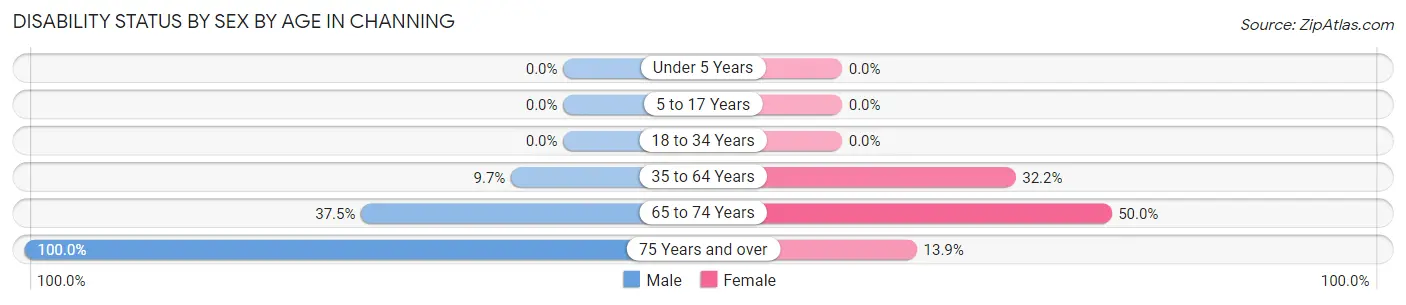
| Age Bracket | Male | Female |
| Under 5 Years | 0 (0.0%) | 0 (0.0%) |
| 5 to 17 Years | 0 (0.0%) | 0 (0.0%) |
| 18 to 34 Years | 0 (0.0%) | 0 (0.0%) |
| 35 to 64 Years | 3 (9.7%) | 19 (32.2%) |
| 65 to 74 Years | 3 (37.5%) | 4 (50.0%) |
| 75 Years and over | 7 (100.0%) | 5 (13.9%) |
Disability Class by Sex by Age in Channing
Disability Class: Hearing Difficulty
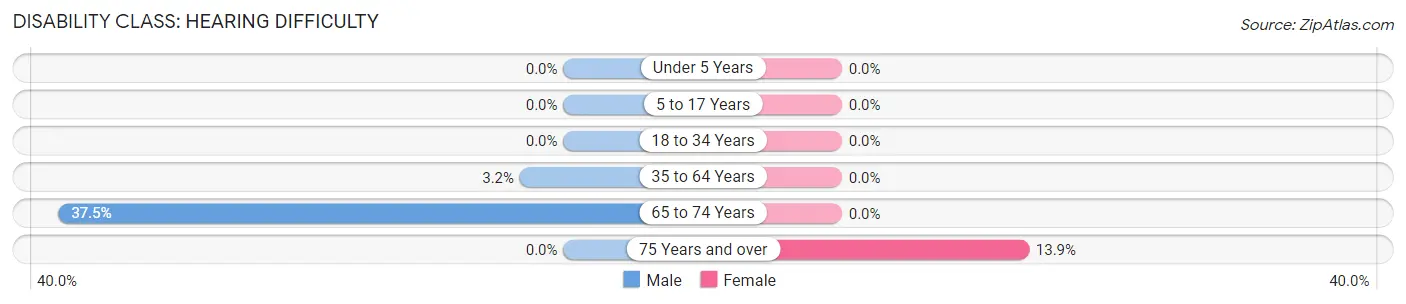
| Age Bracket | Male | Female |
| Under 5 Years | 0 (0.0%) | 0 (0.0%) |
| 5 to 17 Years | 0 (0.0%) | 0 (0.0%) |
| 18 to 34 Years | 0 (0.0%) | 0 (0.0%) |
| 35 to 64 Years | 1 (3.2%) | 0 (0.0%) |
| 65 to 74 Years | 3 (37.5%) | 0 (0.0%) |
| 75 Years and over | 0 (0.0%) | 5 (13.9%) |
Disability Class: Vision Difficulty
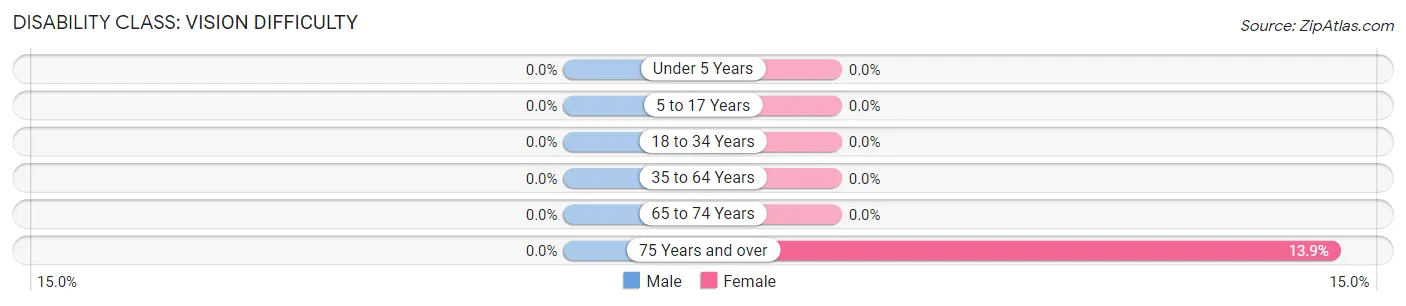
| Age Bracket | Male | Female |
| Under 5 Years | 0 (0.0%) | 0 (0.0%) |
| 5 to 17 Years | 0 (0.0%) | 0 (0.0%) |
| 18 to 34 Years | 0 (0.0%) | 0 (0.0%) |
| 35 to 64 Years | 0 (0.0%) | 0 (0.0%) |
| 65 to 74 Years | 0 (0.0%) | 0 (0.0%) |
| 75 Years and over | 0 (0.0%) | 5 (13.9%) |
Disability Class: Cognitive Difficulty
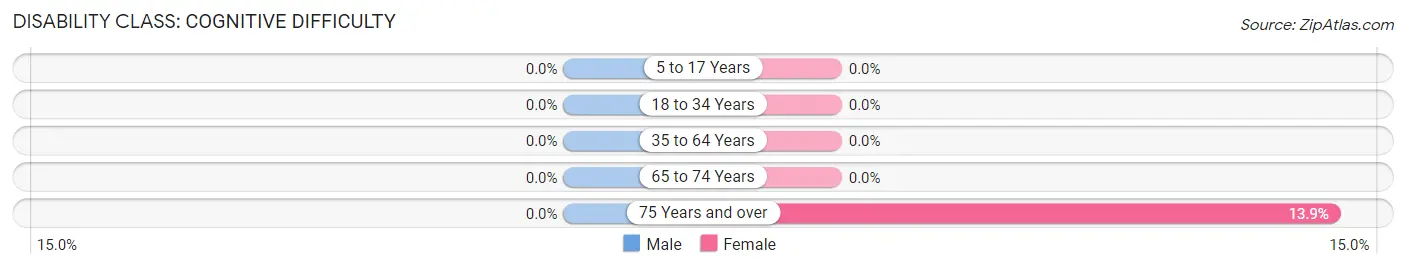
| Age Bracket | Male | Female |
| 5 to 17 Years | 0 (0.0%) | 0 (0.0%) |
| 18 to 34 Years | 0 (0.0%) | 0 (0.0%) |
| 35 to 64 Years | 0 (0.0%) | 0 (0.0%) |
| 65 to 74 Years | 0 (0.0%) | 0 (0.0%) |
| 75 Years and over | 0 (0.0%) | 5 (13.9%) |
Disability Class: Ambulatory Difficulty
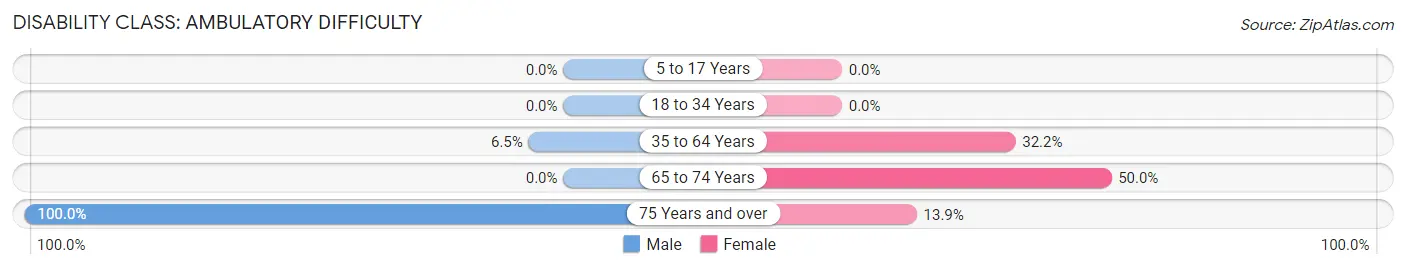
| Age Bracket | Male | Female |
| 5 to 17 Years | 0 (0.0%) | 0 (0.0%) |
| 18 to 34 Years | 0 (0.0%) | 0 (0.0%) |
| 35 to 64 Years | 2 (6.5%) | 19 (32.2%) |
| 65 to 74 Years | 0 (0.0%) | 4 (50.0%) |
| 75 Years and over | 7 (100.0%) | 5 (13.9%) |
Disability Class: Self-Care Difficulty
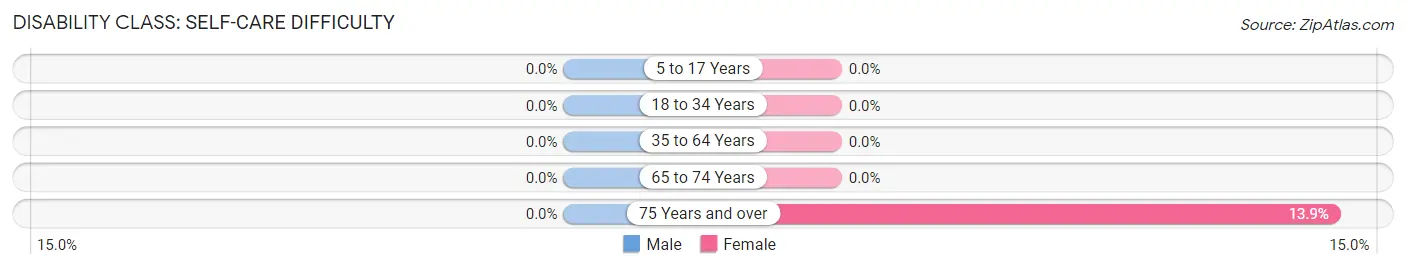
| Age Bracket | Male | Female |
| 5 to 17 Years | 0 (0.0%) | 0 (0.0%) |
| 18 to 34 Years | 0 (0.0%) | 0 (0.0%) |
| 35 to 64 Years | 0 (0.0%) | 0 (0.0%) |
| 65 to 74 Years | 0 (0.0%) | 0 (0.0%) |
| 75 Years and over | 0 (0.0%) | 5 (13.9%) |
Technology Access in Channing
Computing Device Access in Channing
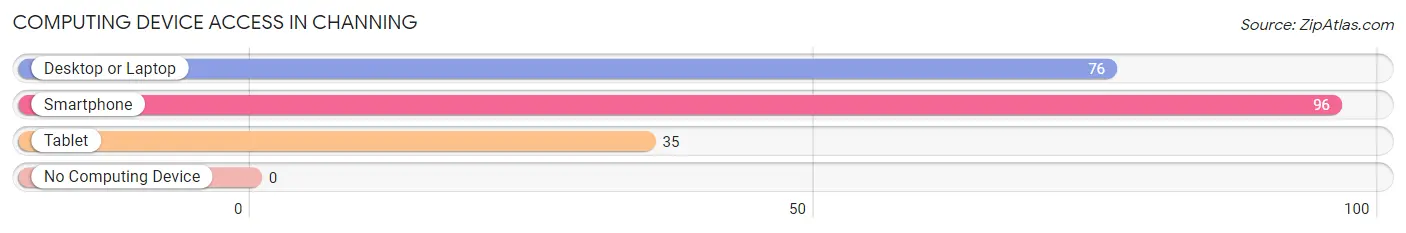
| Device Type | # Households | % Households |
| Desktop or Laptop | 76 | 75.2% |
| Smartphone | 96 | 95.1% |
| Tablet | 35 | 34.6% |
| No Computing Device | 0 | 0.0% |
| Total | 101 | 100.0% |
Internet Access in Channing
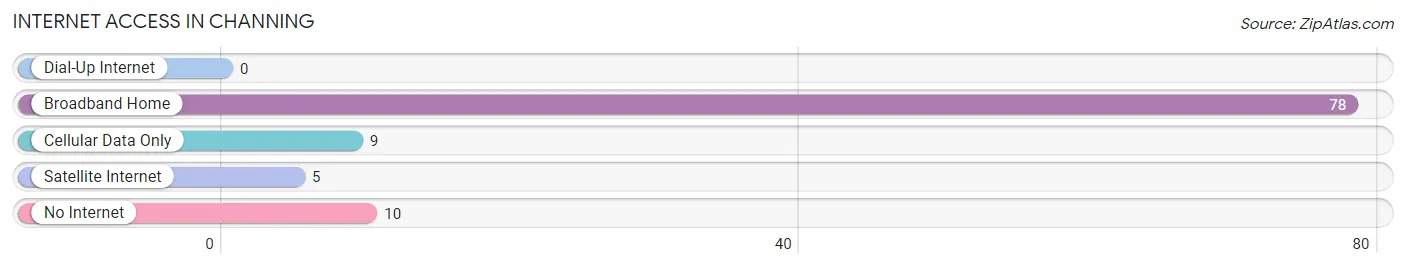
| Internet Type | # Households | % Households |
| Dial-Up Internet | 0 | 0.0% |
| Broadband Home | 78 | 77.2% |
| Cellular Data Only | 9 | 8.9% |
| Satellite Internet | 5 | 5.0% |
| No Internet | 10 | 9.9% |
| Total | 101 | 100.0% |
Channing Summary
Channing is a small town located in the Texas Panhandle, in the county of Hartley. It is situated on the western edge of the Texas Panhandle, approximately 25 miles east of the New Mexico border. The town was founded in 1891 and was named after the local rancher, John Channing.
History
The town of Channing was founded in 1891 by John Channing, a local rancher. The town was originally known as Channingville, but the name was changed to Channing in 1895. The town was incorporated in 1909 and was the first town in Hartley County to be incorporated.
The town was originally a farming and ranching community, but in the early 1900s, the discovery of oil in the area led to an economic boom. The town quickly grew and by the 1920s, it had become a major oil-producing center. The oil industry continued to be a major part of the town's economy until the late 1970s, when the oil industry began to decline.
In the late 1970s, the town began to diversify its economy and began to focus on tourism and recreation. The town is now home to several tourist attractions, including the Hartley County Historical Museum, the Hartley County Courthouse, and the Hartley County Fairgrounds.
Geography
Channing is located in the Texas Panhandle, in the county of Hartley. It is situated on the western edge of the Texas Panhandle, approximately 25 miles east of the New Mexico border. The town is located at an elevation of 3,400 feet and has a total area of 1.2 square miles.
The town is located in a semi-arid climate, with hot summers and cold winters. The average annual temperature is 64 degrees Fahrenheit, with an average high of 90 degrees in the summer and an average low of 32 degrees in the winter. The average annual precipitation is 17.5 inches.
Economy
The economy of Channing is largely based on tourism and recreation. The town is home to several tourist attractions, including the Hartley County Historical Museum, the Hartley County Courthouse, and the Hartley County Fairgrounds.
The town is also home to several businesses, including restaurants, retail stores, and service providers. The town is also home to several oil and gas companies, which are still a major part of the local economy.
Demographics
As of the 2010 census, the population of Channing was 1,093. The racial makeup of the town was 94.3% White, 0.7% African American, 0.3% Native American, 0.2% Asian, 0.1% Pacific Islander, 2.7% from other races, and 1.7% from two or more races. Hispanic or Latino of any race were 5.3% of the population.
The median household income in Channing was $37,500, and the median family income was $45,000. The per capita income was $18,000. About 11.3% of families and 14.2% of the population were below the poverty line, including 18.2% of those under age 18 and 8.3% of those age 65 or over.
Common Questions
What is Per Capita Income in Channing?
Per Capita income in Channing is $45,382.
What is the Median Family Income in Channing?
Median Family Income in Channing is $66,750.
What is the Median Household income in Channing?
Median Household Income in Channing is $53,125.
What is Income or Wage Gap in Channing?
Income or Wage Gap in Channing is 7.4%.
Women in Channing earn 92.6 cents for every dollar earned by a man.
What is Inequality or Gini Index in Channing?
Inequality or Gini Index in Channing is 0.51.
What is the Total Population of Channing?
Total Population of Channing is 244.
What is the Total Male Population of Channing?
Total Male Population of Channing is 83.
What is the Total Female Population of Channing?
Total Female Population of Channing is 161.
What is the Ratio of Males per 100 Females in Channing?
There are 51.55 Males per 100 Females in Channing.
What is the Ratio of Females per 100 Males in Channing?
There are 193.98 Females per 100 Males in Channing.
What is the Median Population Age in Channing?
Median Population Age in Channing is 48.0 Years.
What is the Average Family Size in Channing
Average Family Size in Channing is 2.8 People.
What is the Average Household Size in Channing
Average Household Size in Channing is 2.4 People.
How Large is the Labor Force in Channing?
There are 97 People in the Labor Forcein in Channing.
What is the Percentage of People in the Labor Force in Channing?
50.0% of People are in the Labor Force in Channing.
What is the Unemployment Rate in Channing?
Unemployment Rate in Channing is 1.0%.