Lake Medina Shores, TX Map & Demographics
Lake Medina Shores Map
Lake Medina Shores Overview
$31,086
PER CAPITA INCOME
$56,200
AVG HOUSEHOLD INCOME
0.36
INEQUALITY / GINI INDEX
532
TOTAL POPULATION
166
MALE POPULATION
366
FEMALE POPULATION
45.36
MALES / 100 FEMALES
220.48
FEMALES / 100 MALES
58.5
MEDIAN AGE
2.3
AVG FAMILY SIZE
2.0
AVG HOUSEHOLD SIZE
152
LABOR FORCE [ PEOPLE ]
29.0%
PERCENT IN LABOR FORCE
Income in Lake Medina Shores
Income Overview in Lake Medina Shores
| Characteristic | Number | Measure |
| Per Capita Income | 532 | $31,086 |
| Median Family Income | 149 | $0 |
| Mean Family Income | 149 | $84,573 |
| Median Household Income | 264 | $56,200 |
| Mean Household Income | 264 | $69,916 |
| Income Deficit | 149 | $0 |
| Wage / Income Gap (%) | 532 | 0.00% |
| Wage / Income Gap ($) | 532 | 100.00¢ per $1 |
| Gini / Inequality Index | 532 | 0.36 |
Earnings by Sex in Lake Medina Shores
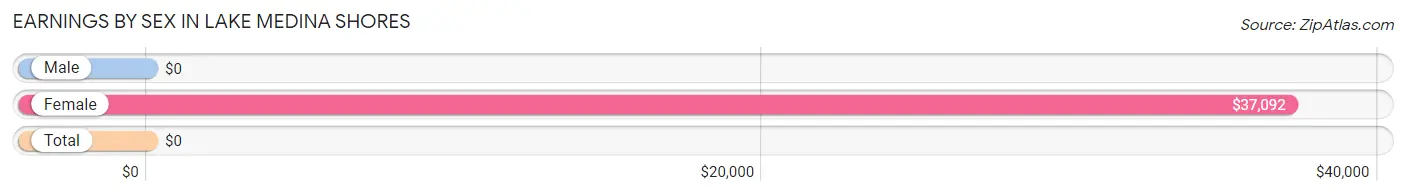
| Sex | Number | Average Earnings |
| Male | 53 (29.1%) | $0 |
| Female | 129 (70.9%) | $37,092 |
| Total | 182 (100.0%) | $0 |
Earnings by Sex by Income Bracket in Lake Medina Shores
The most common earnings brackets in Lake Medina Shores are $20,000 to $22,499 for men (29 | 54.7%) and $35,000 to $39,999 for women (46 | 35.7%).
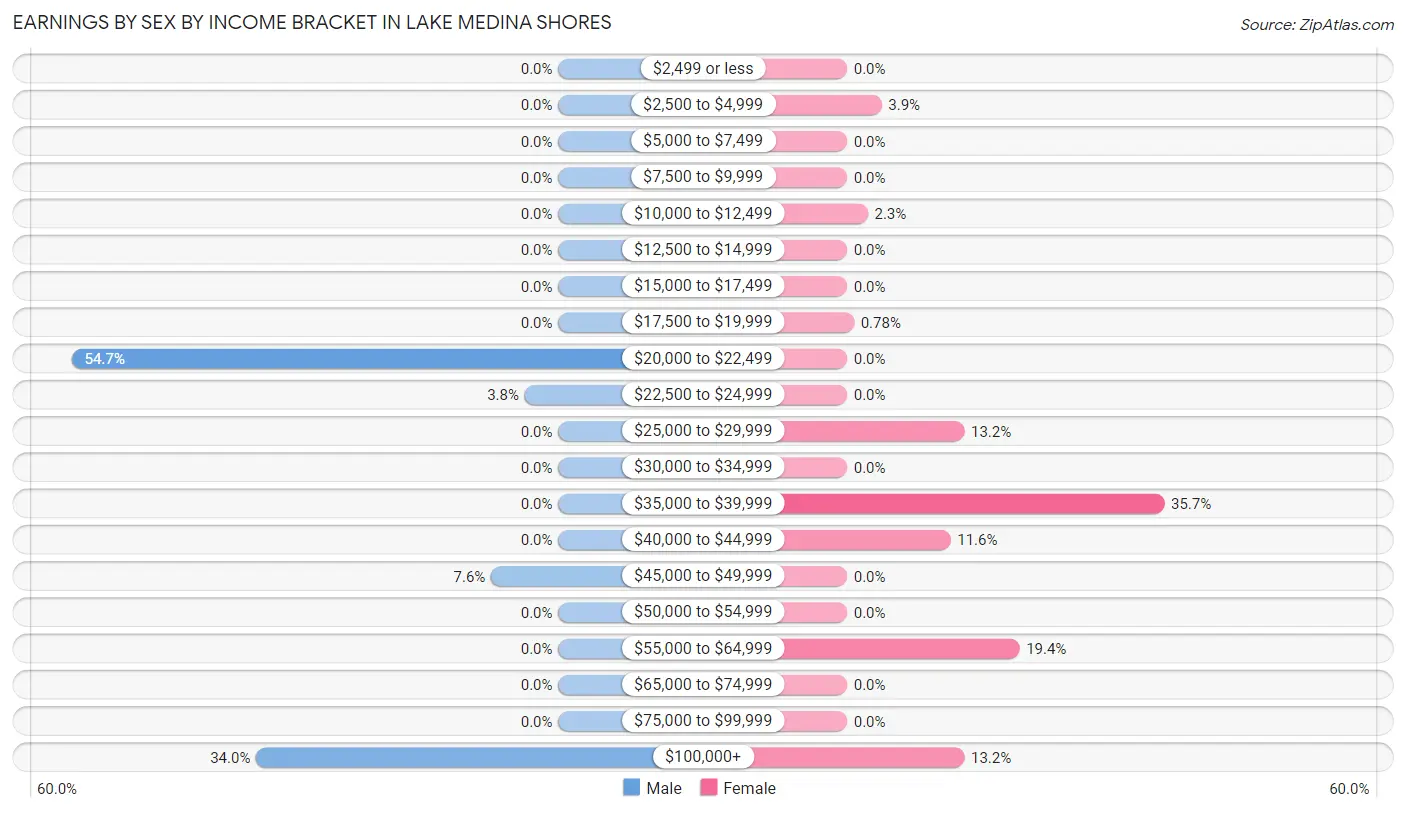
| Income | Male | Female |
| $2,499 or less | 0 (0.0%) | 0 (0.0%) |
| $2,500 to $4,999 | 0 (0.0%) | 5 (3.9%) |
| $5,000 to $7,499 | 0 (0.0%) | 0 (0.0%) |
| $7,500 to $9,999 | 0 (0.0%) | 0 (0.0%) |
| $10,000 to $12,499 | 0 (0.0%) | 3 (2.3%) |
| $12,500 to $14,999 | 0 (0.0%) | 0 (0.0%) |
| $15,000 to $17,499 | 0 (0.0%) | 0 (0.0%) |
| $17,500 to $19,999 | 0 (0.0%) | 1 (0.8%) |
| $20,000 to $22,499 | 29 (54.7%) | 0 (0.0%) |
| $22,500 to $24,999 | 2 (3.8%) | 0 (0.0%) |
| $25,000 to $29,999 | 0 (0.0%) | 17 (13.2%) |
| $30,000 to $34,999 | 0 (0.0%) | 0 (0.0%) |
| $35,000 to $39,999 | 0 (0.0%) | 46 (35.7%) |
| $40,000 to $44,999 | 0 (0.0%) | 15 (11.6%) |
| $45,000 to $49,999 | 4 (7.5%) | 0 (0.0%) |
| $50,000 to $54,999 | 0 (0.0%) | 0 (0.0%) |
| $55,000 to $64,999 | 0 (0.0%) | 25 (19.4%) |
| $65,000 to $74,999 | 0 (0.0%) | 0 (0.0%) |
| $75,000 to $99,999 | 0 (0.0%) | 0 (0.0%) |
| $100,000+ | 18 (34.0%) | 17 (13.2%) |
| Total | 53 (100.0%) | 129 (100.0%) |
Earnings by Sex by Educational Attainment in Lake Medina Shores
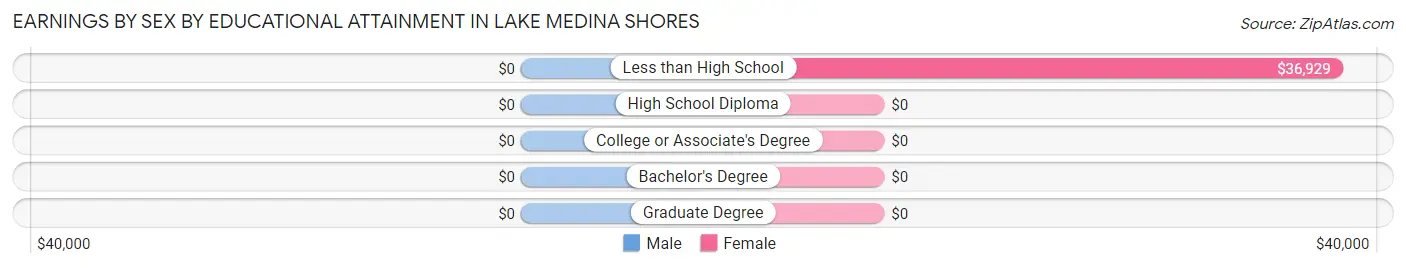
| Educational Attainment | Male Income | Female Income |
| Less than High School | - | - |
| High School Diploma | - | - |
| College or Associate's Degree | - | - |
| Bachelor's Degree | - | - |
| Graduate Degree | - | - |
| Total | - | - |
Family Income in Lake Medina Shores
Family Income Brackets in Lake Medina Shores
According to the Lake Medina Shores family income data, there are 62 families falling into the $50,000 to $74,999 income range, which is the most common income bracket and makes up 41.6% of all families.
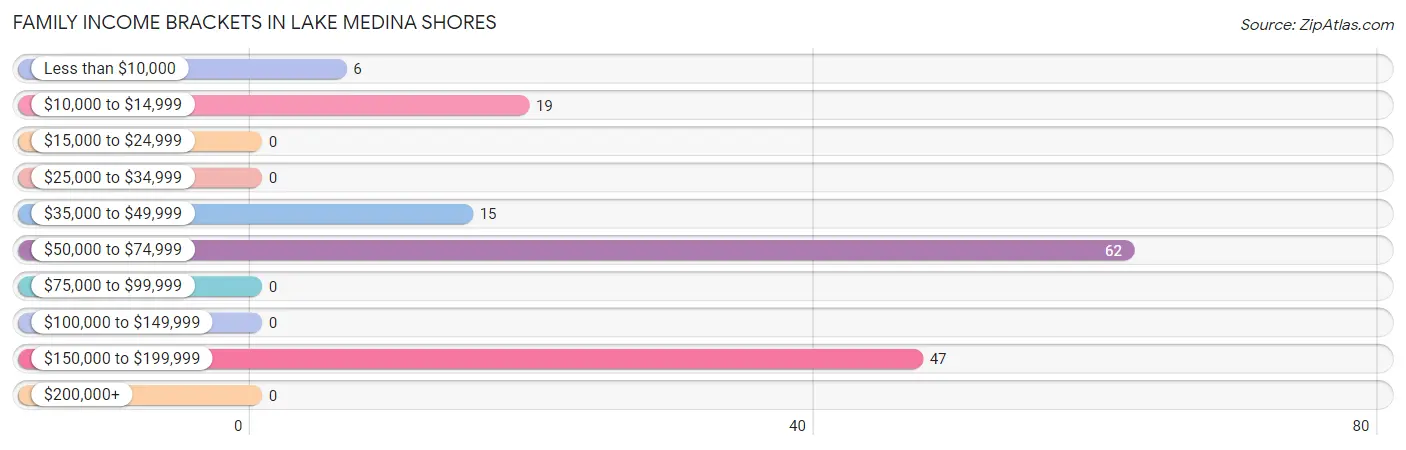
| Income Bracket | # Families | % Families |
| Less than $10,000 | 6 | 4.0% |
| $10,000 to $14,999 | 19 | 12.8% |
| $15,000 to $24,999 | 0 | 0.0% |
| $25,000 to $34,999 | 0 | 0.0% |
| $35,000 to $49,999 | 15 | 10.1% |
| $50,000 to $74,999 | 62 | 41.6% |
| $75,000 to $99,999 | 0 | 0.0% |
| $100,000 to $149,999 | 0 | 0.0% |
| $150,000 to $199,999 | 47 | 31.5% |
| $200,000+ | 0 | 0.0% |
Family Income by Famaliy Size in Lake Medina Shores
| Income Bracket | # Families | Median Income |
| 2-Person Families | 83 (55.7%) | $0 |
| 3-Person Families | 60 (40.3%) | $0 |
| 4-Person Families | 6 (4.0%) | $0 |
| 5-Person Families | 0 (0.0%) | $0 |
| 6-Person Families | 0 (0.0%) | $0 |
| 7+ Person Families | 0 (0.0%) | $0 |
| Total | 149 (100.0%) | $0 |
Family Income by Number of Earners in Lake Medina Shores
| Number of Earners | # Families | Median Income |
| No Earners | 50 (33.6%) | $0 |
| 1 Earner | 33 (22.2%) | $0 |
| 2 Earners | 34 (22.8%) | $0 |
| 3+ Earners | 32 (21.5%) | $0 |
| Total | 149 (100.0%) | $0 |
Household Income in Lake Medina Shores
Household Income Brackets in Lake Medina Shores
With 81 households falling in the category, the $50,000 to $74,999 income range is the most frequent in Lake Medina Shores, accounting for 30.7% of all households.
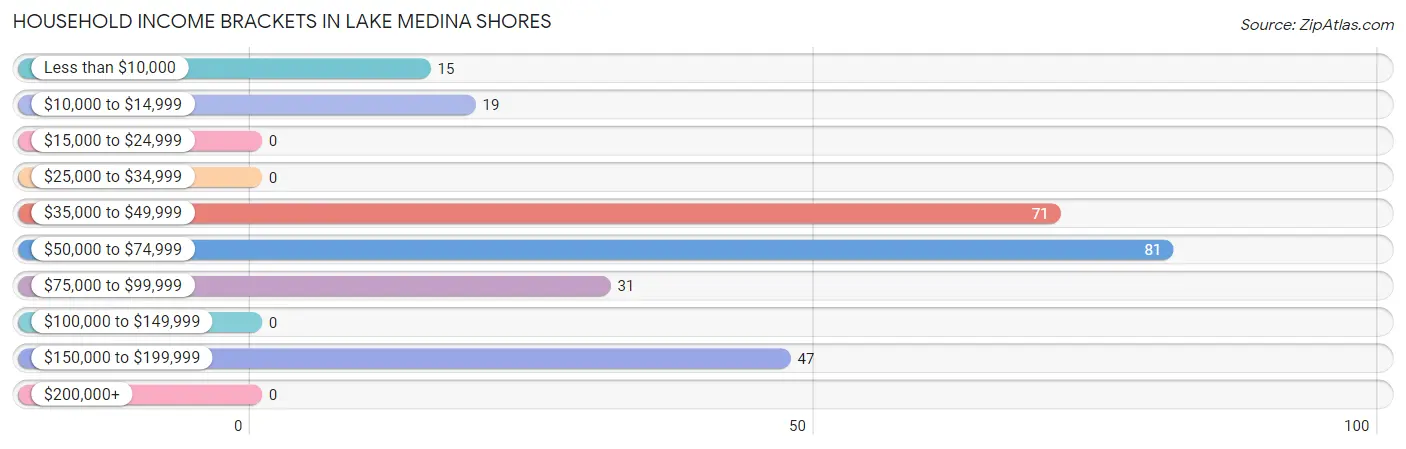
| Income Bracket | # Households | % Households |
| Less than $10,000 | 15 | 5.7% |
| $10,000 to $14,999 | 19 | 7.2% |
| $15,000 to $24,999 | 0 | 0.0% |
| $25,000 to $34,999 | 0 | 0.0% |
| $35,000 to $49,999 | 71 | 26.9% |
| $50,000 to $74,999 | 81 | 30.7% |
| $75,000 to $99,999 | 31 | 11.7% |
| $100,000 to $149,999 | 0 | 0.0% |
| $150,000 to $199,999 | 47 | 17.8% |
| $200,000+ | 0 | 0.0% |
Household Income by Householder Age in Lake Medina Shores
The median household income in Lake Medina Shores is $56,200, with the highest median household income of $55,875 found in the 65+ years age bracket for the primary householder. A total of 177 households (67.0%) fall into this category.
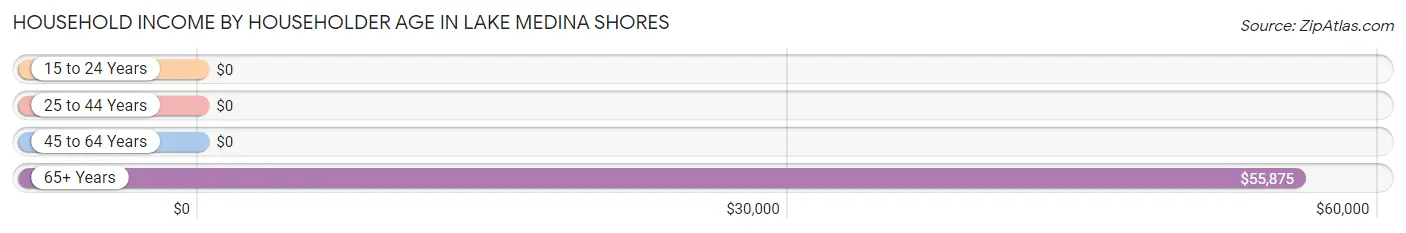
| Income Bracket | # Households | Median Income |
| 15 to 24 Years | 0 (0.0%) | $0 |
| 25 to 44 Years | 29 (11.0%) | $0 |
| 45 to 64 Years | 58 (22.0%) | $0 |
| 65+ Years | 177 (67.0%) | $55,875 |
| Total | 264 (100.0%) | $56,200 |
Poverty in Lake Medina Shores
Income Below Poverty by Sex and Age in Lake Medina Shores
With 20.5% poverty level for males and 33.6% for females among the residents of Lake Medina Shores, 55 to 64 year old males and 45 to 54 year old females are the most vulnerable to poverty, with 19 males (37.2%) and 115 females (97.5%) in their respective age groups living below the poverty level.
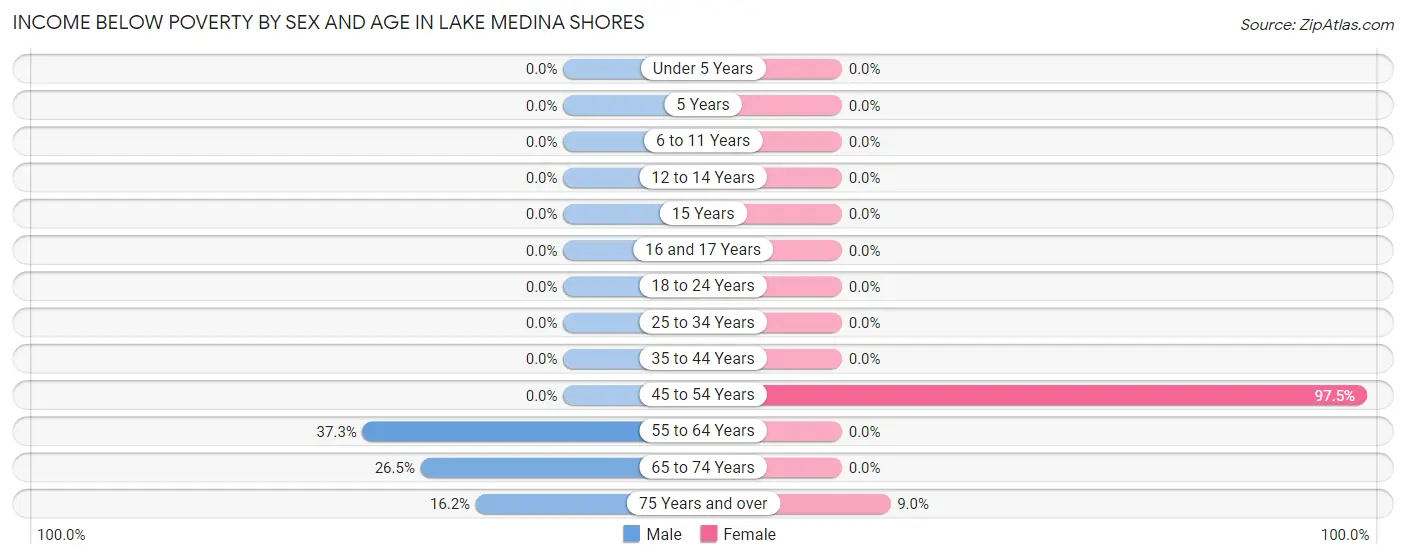
| Age Bracket | Male | Female |
| Under 5 Years | 0 (0.0%) | 0 (0.0%) |
| 5 Years | 0 (0.0%) | 0 (0.0%) |
| 6 to 11 Years | 0 (0.0%) | 0 (0.0%) |
| 12 to 14 Years | 0 (0.0%) | 0 (0.0%) |
| 15 Years | 0 (0.0%) | 0 (0.0%) |
| 16 and 17 Years | 0 (0.0%) | 0 (0.0%) |
| 18 to 24 Years | 0 (0.0%) | 0 (0.0%) |
| 25 to 34 Years | 0 (0.0%) | 0 (0.0%) |
| 35 to 44 Years | 0 (0.0%) | 0 (0.0%) |
| 45 to 54 Years | 0 (0.0%) | 115 (97.5%) |
| 55 to 64 Years | 19 (37.2%) | 0 (0.0%) |
| 65 to 74 Years | 9 (26.5%) | 0 (0.0%) |
| 75 Years and over | 6 (16.2%) | 8 (9.0%) |
| Total | 34 (20.5%) | 123 (33.6%) |
Income Above Poverty by Sex and Age in Lake Medina Shores
According to the poverty statistics in Lake Medina Shores, males aged 12 to 14 years and females aged 18 to 24 years are the age groups that are most secure financially, with 100.0% of males and 100.0% of females in these age groups living above the poverty line.
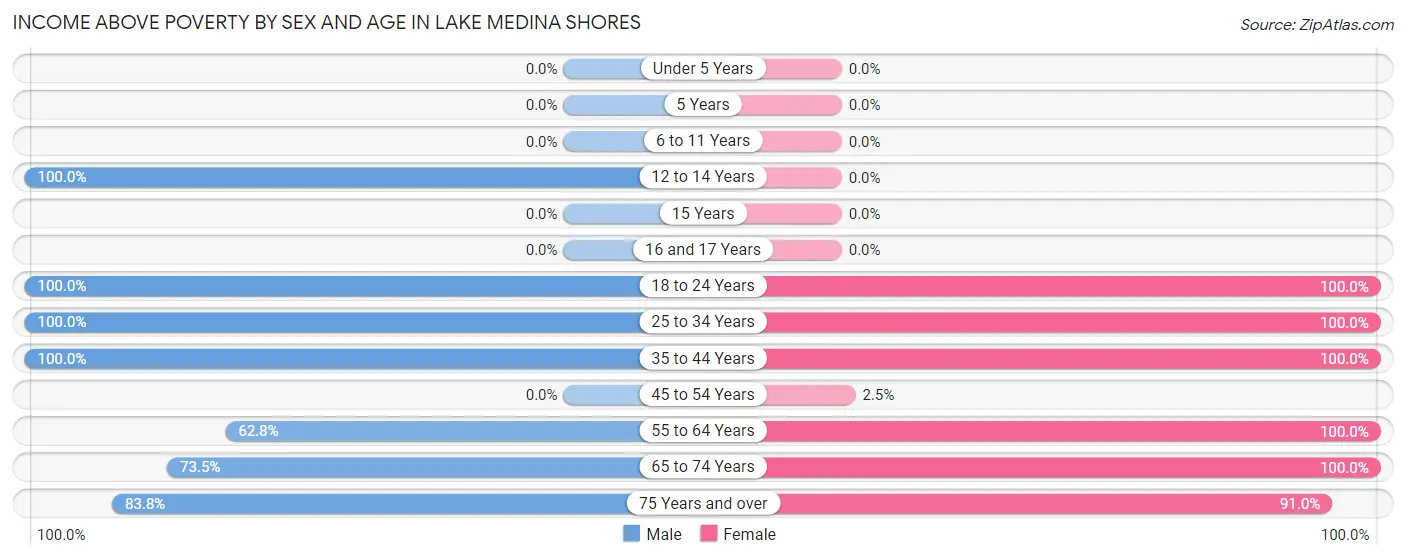
| Age Bracket | Male | Female |
| Under 5 Years | 0 (0.0%) | 0 (0.0%) |
| 5 Years | 0 (0.0%) | 0 (0.0%) |
| 6 to 11 Years | 0 (0.0%) | 0 (0.0%) |
| 12 to 14 Years | 7 (100.0%) | 0 (0.0%) |
| 15 Years | 0 (0.0%) | 0 (0.0%) |
| 16 and 17 Years | 0 (0.0%) | 0 (0.0%) |
| 18 to 24 Years | 2 (100.0%) | 22 (100.0%) |
| 25 to 34 Years | 2 (100.0%) | 1 (100.0%) |
| 35 to 44 Years | 33 (100.0%) | 29 (100.0%) |
| 45 to 54 Years | 0 (0.0%) | 3 (2.5%) |
| 55 to 64 Years | 32 (62.7%) | 70 (100.0%) |
| 65 to 74 Years | 25 (73.5%) | 37 (100.0%) |
| 75 Years and over | 31 (83.8%) | 81 (91.0%) |
| Total | 132 (79.5%) | 243 (66.4%) |
Income Below Poverty Among Married-Couple Families in Lake Medina Shores
The poverty statistics for married-couple families in Lake Medina Shores show that 21.7% or 25 of the total 115 families live below the poverty line. Families with no children have the highest poverty rate of 22.3%, comprising of 25 families. On the other hand, families with 1 or 2 children have the lowest poverty rate of 0.0%, which includes 0 families.
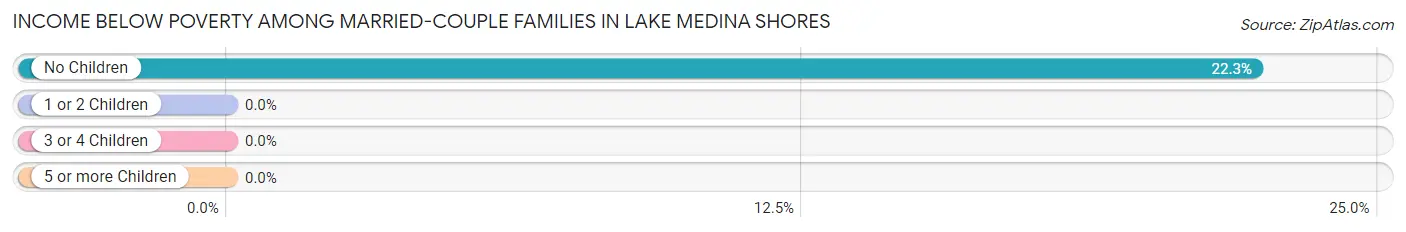
| Children | Above Poverty | Below Poverty |
| No Children | 87 (77.7%) | 25 (22.3%) |
| 1 or 2 Children | 3 (100.0%) | 0 (0.0%) |
| 3 or 4 Children | 0 (0.0%) | 0 (0.0%) |
| 5 or more Children | 0 (0.0%) | 0 (0.0%) |
| Total | 90 (78.3%) | 25 (21.7%) |
Income Below Poverty Among Single-Parent Households in Lake Medina Shores
| Children | Single Father | Single Mother |
| No Children | 0 (0.0%) | 0 (0.0%) |
| 1 or 2 Children | 0 (0.0%) | 0 (0.0%) |
| 3 or 4 Children | 0 (0.0%) | 0 (0.0%) |
| 5 or more Children | 0 (0.0%) | 0 (0.0%) |
| Total | 0 (0.0%) | 0 (0.0%) |
Income Below Poverty Among Married-Couple vs Single-Parent Households in Lake Medina Shores
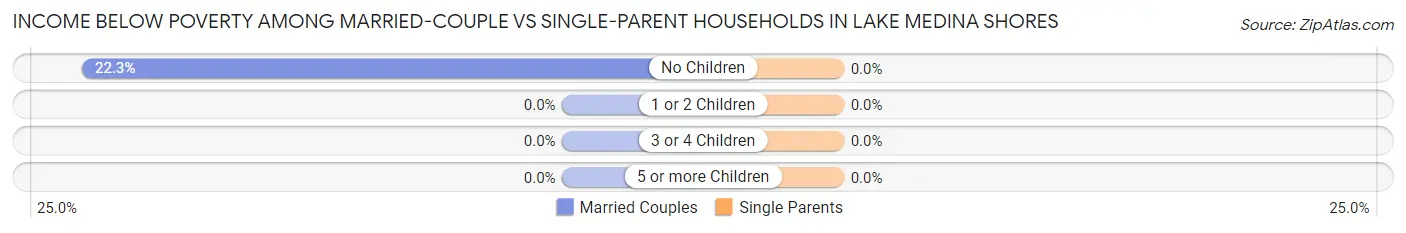
| Children | Married-Couple Families | Single-Parent Households |
| No Children | 25 (22.3%) | 0 (0.0%) |
| 1 or 2 Children | 0 (0.0%) | 0 (0.0%) |
| 3 or 4 Children | 0 (0.0%) | 0 (0.0%) |
| 5 or more Children | 0 (0.0%) | 0 (0.0%) |
| Total | 25 (21.7%) | 0 (0.0%) |
Race in Lake Medina Shores
The most populous races in Lake Medina Shores are White / Caucasian (304 | 57.1%), Hispanic or Latino (218 | 41.0%), and Two or more Races (151 | 28.4%).
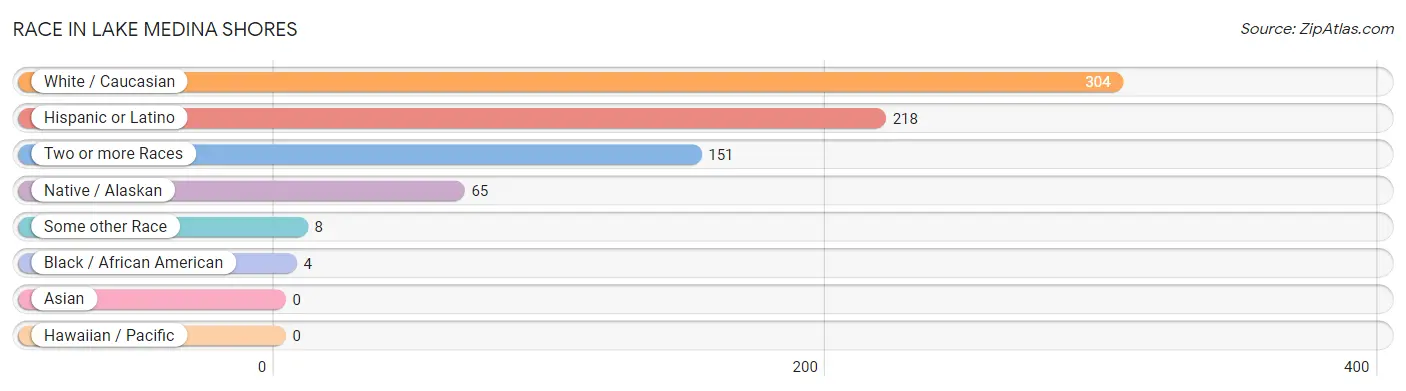
| Race | # Population | % Population |
| Asian | 0 | 0.0% |
| Black / African American | 4 | 0.7% |
| Hawaiian / Pacific | 0 | 0.0% |
| Hispanic or Latino | 218 | 41.0% |
| Native / Alaskan | 65 | 12.2% |
| White / Caucasian | 304 | 57.1% |
| Two or more Races | 151 | 28.4% |
| Some other Race | 8 | 1.5% |
| Total | 532 | 100.0% |
Ancestry in Lake Medina Shores
The most populous ancestries reported in Lake Medina Shores are Mexican (146 | 27.4%), American (104 | 19.6%), Irish (103 | 19.4%), Polish (78 | 14.7%), and Cherokee (65 | 12.2%), together accounting for 93.2% of all Lake Medina Shores residents.
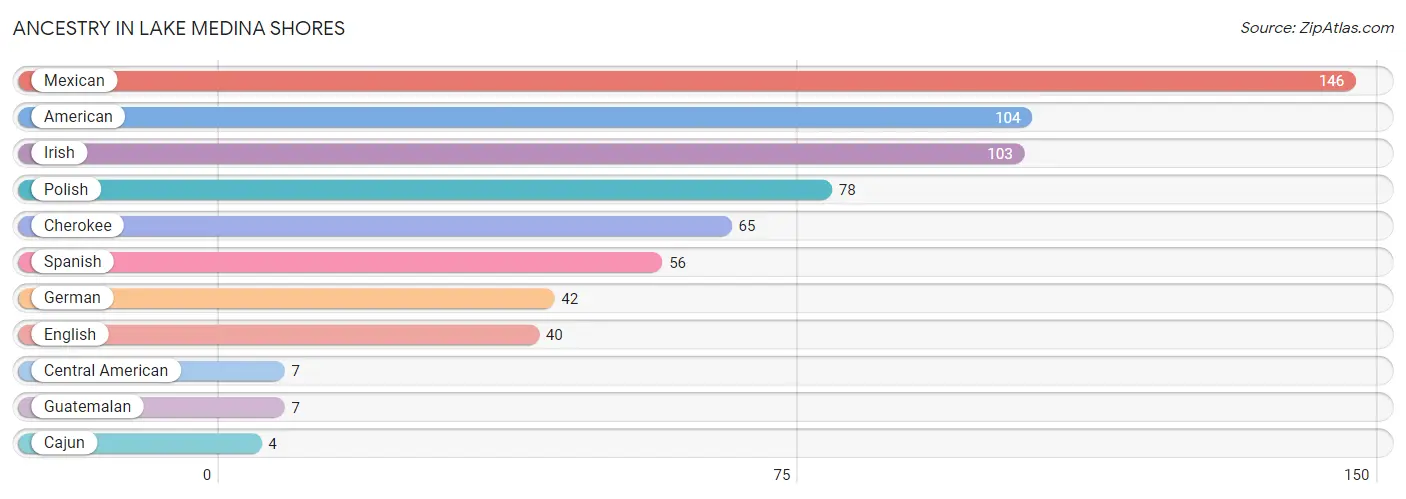
| Ancestry | # Population | % Population |
| American | 104 | 19.6% |
| Cajun | 4 | 0.7% |
| Central American | 7 | 1.3% |
| Cherokee | 65 | 12.2% |
| English | 40 | 7.5% |
| German | 42 | 7.9% |
| Guatemalan | 7 | 1.3% |
| Irish | 103 | 19.4% |
| Mexican | 146 | 27.4% |
| Polish | 78 | 14.7% |
| Spanish | 56 | 10.5% | View All 11 Rows |
Immigrants in Lake Medina Shores
The most numerous immigrant groups reported in Lake Medina Shores came from Central America (58 | 10.9%), Latin America (58 | 10.9%), and Mexico (58 | 10.9%), together accounting for 32.7% of all Lake Medina Shores residents.
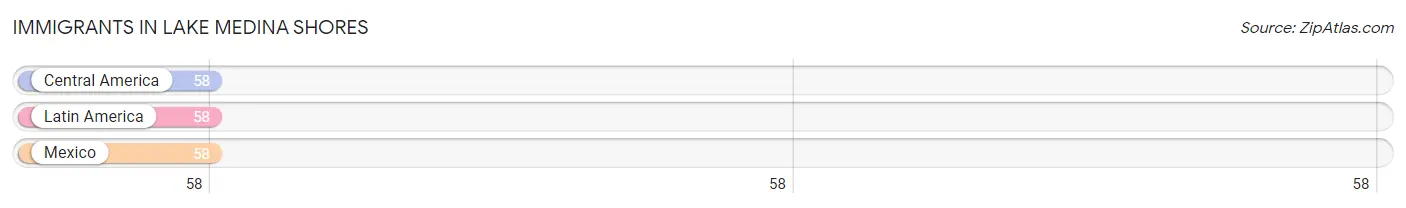
| Immigration Origin | # Population | % Population |
| Central America | 58 | 10.9% |
| Latin America | 58 | 10.9% |
| Mexico | 58 | 10.9% | View All 3 Rows |
Sex and Age in Lake Medina Shores
Sex and Age in Lake Medina Shores
The most populous age groups in Lake Medina Shores are 75 to 79 Years (37 | 22.3%) for men and 50 to 54 Years (115 | 31.4%) for women.
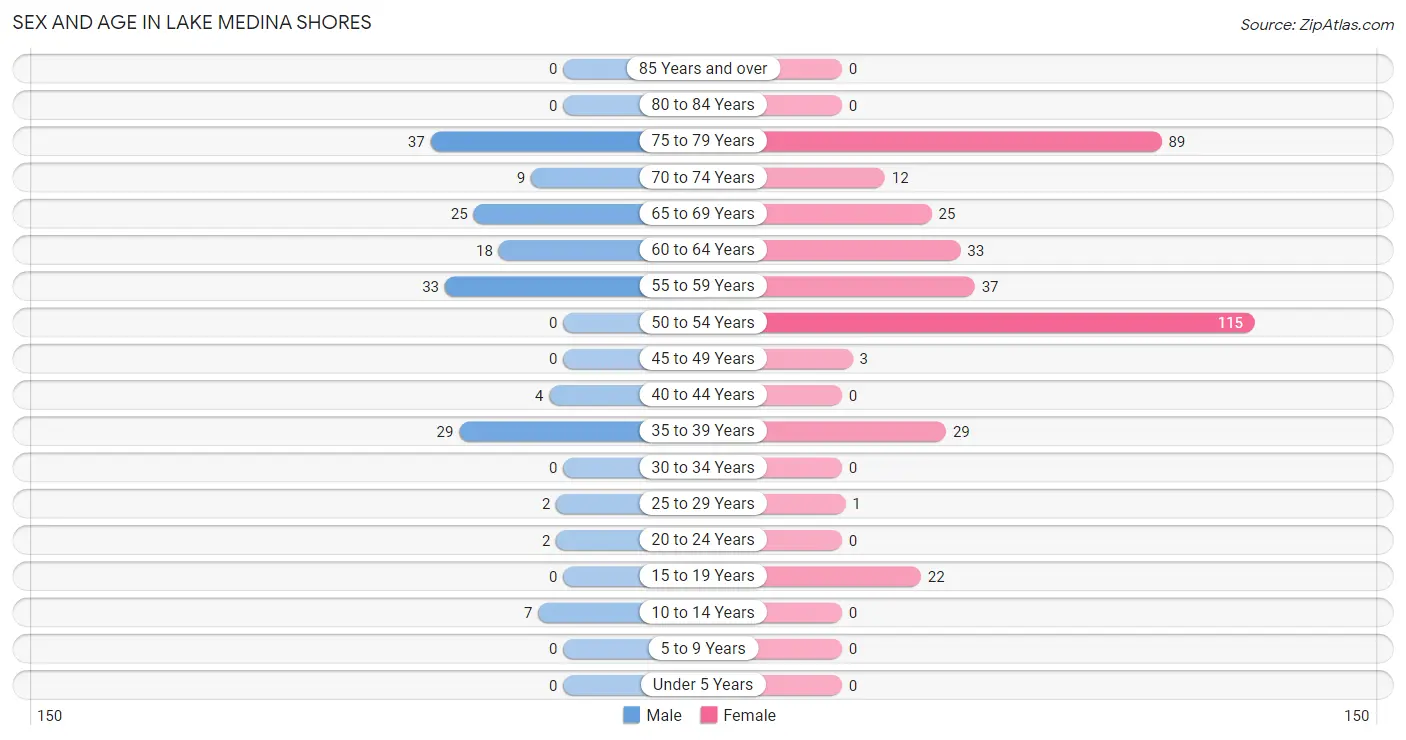
| Age Bracket | Male | Female |
| Under 5 Years | 0 (0.0%) | 0 (0.0%) |
| 5 to 9 Years | 0 (0.0%) | 0 (0.0%) |
| 10 to 14 Years | 7 (4.2%) | 0 (0.0%) |
| 15 to 19 Years | 0 (0.0%) | 22 (6.0%) |
| 20 to 24 Years | 2 (1.2%) | 0 (0.0%) |
| 25 to 29 Years | 2 (1.2%) | 1 (0.3%) |
| 30 to 34 Years | 0 (0.0%) | 0 (0.0%) |
| 35 to 39 Years | 29 (17.5%) | 29 (7.9%) |
| 40 to 44 Years | 4 (2.4%) | 0 (0.0%) |
| 45 to 49 Years | 0 (0.0%) | 3 (0.8%) |
| 50 to 54 Years | 0 (0.0%) | 115 (31.4%) |
| 55 to 59 Years | 33 (19.9%) | 37 (10.1%) |
| 60 to 64 Years | 18 (10.8%) | 33 (9.0%) |
| 65 to 69 Years | 25 (15.1%) | 25 (6.8%) |
| 70 to 74 Years | 9 (5.4%) | 12 (3.3%) |
| 75 to 79 Years | 37 (22.3%) | 89 (24.3%) |
| 80 to 84 Years | 0 (0.0%) | 0 (0.0%) |
| 85 Years and over | 0 (0.0%) | 0 (0.0%) |
| Total | 166 (100.0%) | 366 (100.0%) |
Families and Households in Lake Medina Shores
Median Family Size in Lake Medina Shores
The median family size in Lake Medina Shores is 2.28 persons per family, with single female/mother families (3 | 2.0%) accounting for the largest median family size of 2.67 persons per family. On the other hand, single male/father families (31 | 20.8%) represent the smallest median family size with 2.10 persons per family.
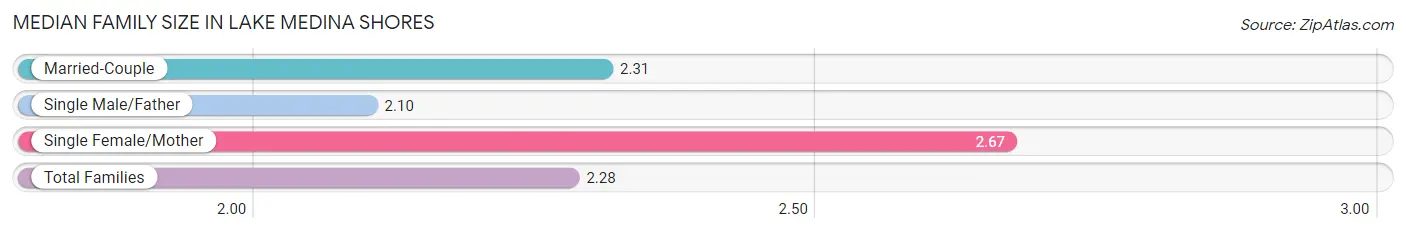
| Family Type | # Families | Family Size |
| Married-Couple | 115 (77.2%) | 2.31 |
| Single Male/Father | 31 (20.8%) | 2.10 |
| Single Female/Mother | 3 (2.0%) | 2.67 |
| Total Families | 149 (100.0%) | 2.28 |
Median Household Size in Lake Medina Shores
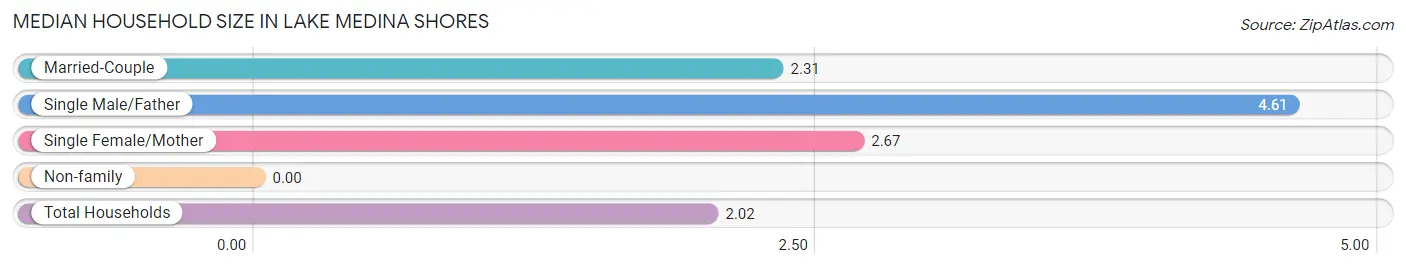
| Household Type | # Households | Household Size |
| Married-Couple | 115 (43.6%) | 2.31 |
| Single Male/Father | 31 (11.7%) | 4.61 |
| Single Female/Mother | 3 (1.1%) | 2.67 |
| Non-family | 115 (43.6%) | - |
| Total Households | 264 (100.0%) | 2.02 |
Household Size by Marriage Status in Lake Medina Shores
Out of a total of 264 households in Lake Medina Shores, 149 (56.4%) are family households, while 115 (43.6%) are nonfamily households. The most numerous type of family households are 2-person households, comprising 83, and the most common type of nonfamily households are 1-person households, comprising 115.
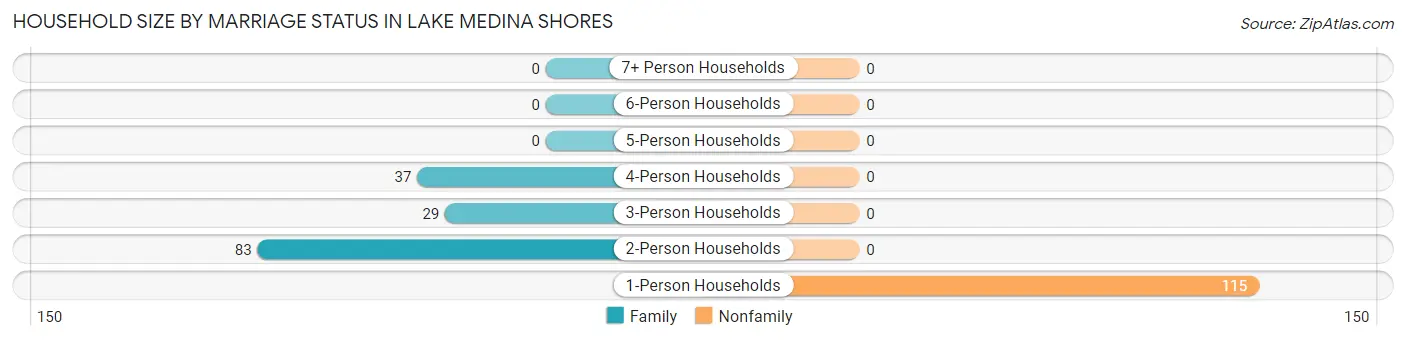
| Household Size | Family Households | Nonfamily Households |
| 1-Person Households | - | 115 (43.6%) |
| 2-Person Households | 83 (31.4%) | 0 (0.0%) |
| 3-Person Households | 29 (11.0%) | 0 (0.0%) |
| 4-Person Households | 37 (14.0%) | 0 (0.0%) |
| 5-Person Households | 0 (0.0%) | 0 (0.0%) |
| 6-Person Households | 0 (0.0%) | 0 (0.0%) |
| 7+ Person Households | 0 (0.0%) | 0 (0.0%) |
| Total | 149 (56.4%) | 115 (43.6%) |
Female Fertility in Lake Medina Shores
Fertility by Age in Lake Medina Shores
| Age Bracket | Women with Births | Births / 1,000 Women |
| 15 to 19 years | 0 (0.0%) | 0.0 |
| 20 to 34 years | 0 (0.0%) | 0.0 |
| 35 to 50 years | 0 (0.0%) | 0.0 |
| Total | 0 (0.0%) | 0.0 |
Fertility by Age by Marriage Status in Lake Medina Shores
| Age Bracket | Married | Unmarried |
| 15 to 19 years | 0 (0.0%) | 0 (0.0%) |
| 20 to 34 years | 0 (0.0%) | 0 (0.0%) |
| 35 to 50 years | 0 (0.0%) | 0 (0.0%) |
| Total | 0 (0.0%) | 0 (0.0%) |
Fertility by Education in Lake Medina Shores
| Educational Attainment | Women with Births | Births / 1,000 Women |
| Less than High School | 0 (0.0%) | 0.0 |
| High School Diploma | 0 (0.0%) | 0.0 |
| College or Associate's Degree | 0 (0.0%) | 0.0 |
| Bachelor's Degree | 0 (0.0%) | 0.0 |
| Graduate Degree | 0 (0.0%) | 0.0 |
| Total | 0 (0.0%) | 0.0 |
Fertility by Education by Marriage Status in Lake Medina Shores
| Educational Attainment | Married | Unmarried |
| Less than High School | 0 (0.0%) | 0 (0.0%) |
| High School Diploma | 0 (0.0%) | 0 (0.0%) |
| College or Associate's Degree | 0 (0.0%) | 0 (0.0%) |
| Bachelor's Degree | 0 (0.0%) | 0 (0.0%) |
| Graduate Degree | 0 (0.0%) | 0 (0.0%) |
| Total | 0 (0.0%) | 0 (0.0%) |
Employment Characteristics in Lake Medina Shores
Employment by Class of Employer in Lake Medina Shores
Among the 152 employed individuals in Lake Medina Shores, private company employees (120 | 78.9%), and self-employed (not incorporated) (32 | 21.0%) make up the most common classes of employment.
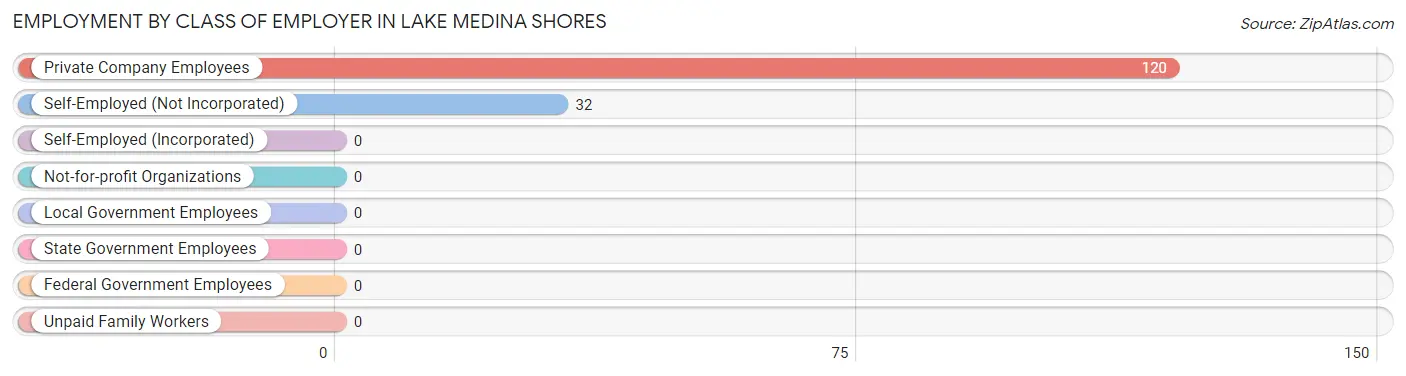
| Employer Class | # Employees | % Employees |
| Private Company Employees | 120 | 78.9% |
| Self-Employed (Incorporated) | 0 | 0.0% |
| Self-Employed (Not Incorporated) | 32 | 21.0% |
| Not-for-profit Organizations | 0 | 0.0% |
| Local Government Employees | 0 | 0.0% |
| State Government Employees | 0 | 0.0% |
| Federal Government Employees | 0 | 0.0% |
| Unpaid Family Workers | 0 | 0.0% |
| Total | 152 | 100.0% |
Employment Status by Age in Lake Medina Shores
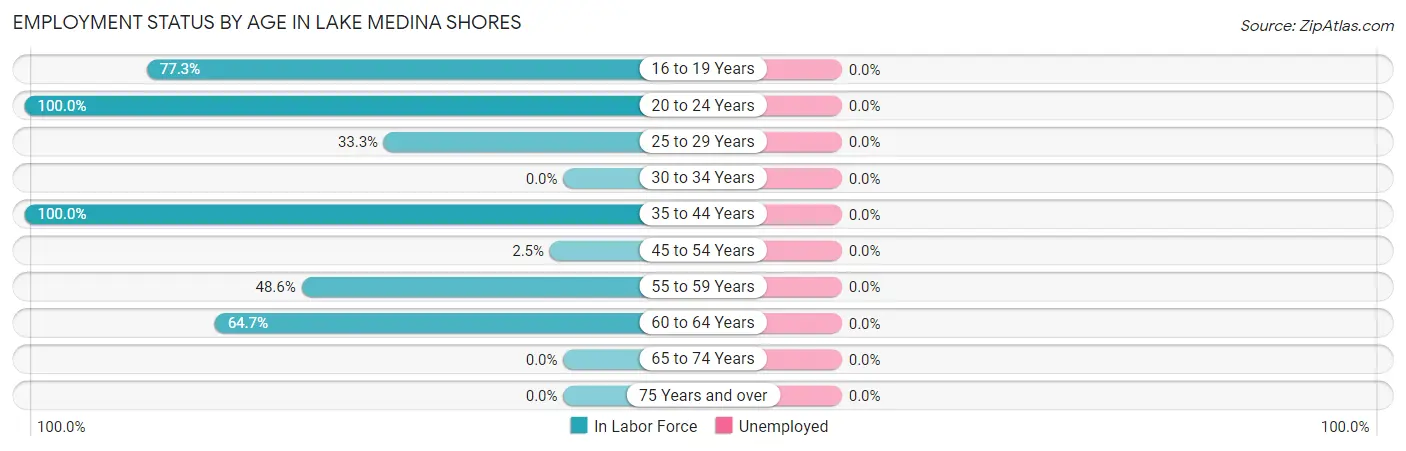
| Age Bracket | In Labor Force | Unemployed |
| 16 to 19 Years | 17 (77.3%) | 0 (0.0%) |
| 20 to 24 Years | 2 (100.0%) | 0 (0.0%) |
| 25 to 29 Years | 1 (33.3%) | 0 (0.0%) |
| 30 to 34 Years | 0 (0.0%) | 0 (0.0%) |
| 35 to 44 Years | 62 (100.0%) | 0 (0.0%) |
| 45 to 54 Years | 3 (2.5%) | 0 (0.0%) |
| 55 to 59 Years | 34 (48.6%) | 0 (0.0%) |
| 60 to 64 Years | 33 (64.7%) | 0 (0.0%) |
| 65 to 74 Years | 0 (0.0%) | 0 (0.0%) |
| 75 Years and over | 0 (0.0%) | 0 (0.0%) |
| Total | 152 (29.0%) | 0 (0.0%) |
Employment Status by Educational Attainment in Lake Medina Shores
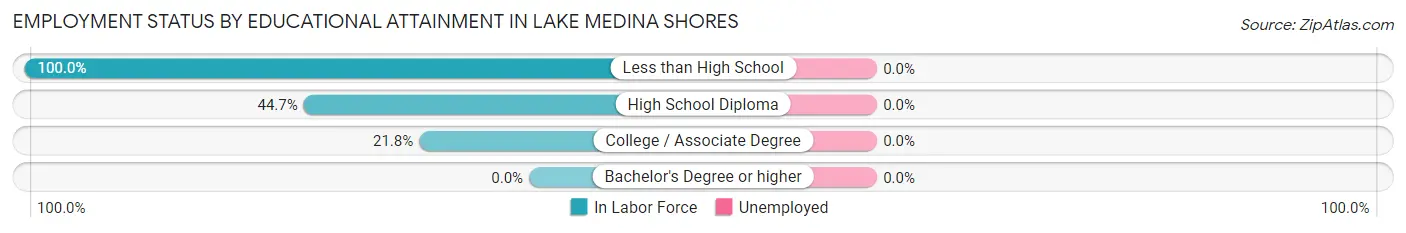
| Educational Attainment | In Labor Force | Unemployed |
| Less than High School | 75 (100.0%) | 0 (0.0%) |
| High School Diploma | 17 (44.7%) | 0 (0.0%) |
| College / Associate Degree | 41 (21.8%) | 0 (0.0%) |
| Bachelor's Degree or higher | 0 (0.0%) | 0 (0.0%) |
| Total | 133 (43.8%) | 0 (0.0%) |
Employment Occupations by Sex in Lake Medina Shores
Management, Business, Science and Arts Occupations
The most common Management, Business, Science and Arts occupations in Lake Medina Shores are , and Business & Financial (15 | 9.9%).
Management, Business, Science and Arts Occupations by Sex
| Occupation | Male | Female |
| Management | 0 (0.0%) | 0 (0.0%) |
| Business & Financial | 0 (0.0%) | 15 (100.0%) |
| Computers, Engineering & Science | 0 (0.0%) | 0 (0.0%) |
| Computers & Mathematics | 0 (0.0%) | 0 (0.0%) |
| Architecture & Engineering | 0 (0.0%) | 0 (0.0%) |
| Life, Physical & Social Science | 0 (0.0%) | 0 (0.0%) |
| Community & Social Service | 0 (0.0%) | 0 (0.0%) |
| Education, Arts & Media | 0 (0.0%) | 0 (0.0%) |
| Legal Services & Support | 0 (0.0%) | 0 (0.0%) |
| Education Instruction & Library | 0 (0.0%) | 0 (0.0%) |
| Arts, Media & Entertainment | 0 (0.0%) | 0 (0.0%) |
| Health Diagnosing & Treating | 0 (0.0%) | 0 (0.0%) |
| Health Technologists | 0 (0.0%) | 0 (0.0%) |
| Total (Category) | 0 (0.0%) | 15 (100.0%) |
| Total (Overall) | 53 (34.9%) | 99 (65.1%) |
Services Occupations
Services Occupations by Sex
| Occupation | Male | Female |
| Healthcare Support | 0 (0.0%) | 0 (0.0%) |
| Security & Protection | 0 (0.0%) | 0 (0.0%) |
| Firefighting & Prevention | 0 (0.0%) | 0 (0.0%) |
| Law Enforcement | 0 (0.0%) | 0 (0.0%) |
| Food Preparation & Serving | 0 (0.0%) | 0 (0.0%) |
| Cleaning & Maintenance | 0 (0.0%) | 0 (0.0%) |
| Personal Care & Service | 0 (0.0%) | 0 (0.0%) |
| Total (Category) | 0 (0.0%) | 0 (0.0%) |
| Total (Overall) | 53 (34.9%) | 99 (65.1%) |
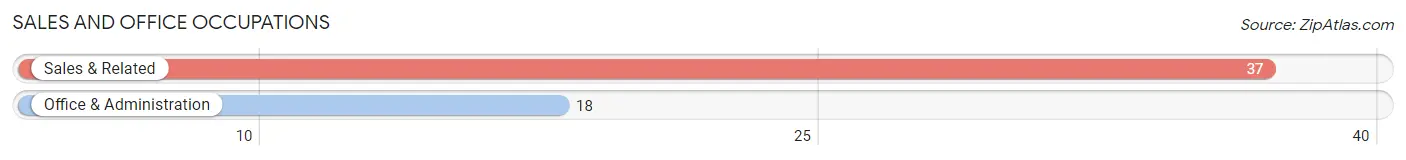
Sales and Office Occupations
The most common Sales and Office occupations in Lake Medina Shores are Sales & Related (37 | 24.3%), and Office & Administration (18 | 11.8%).
Sales and Office Occupations by Sex
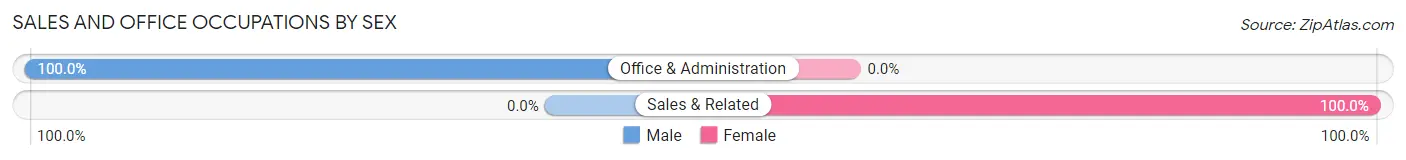
| Occupation | Male | Female |
| Sales & Related | 0 (0.0%) | 37 (100.0%) |
| Office & Administration | 18 (100.0%) | 0 (0.0%) |
| Total (Category) | 18 (32.7%) | 37 (67.3%) |
| Total (Overall) | 53 (34.9%) | 99 (65.1%) |
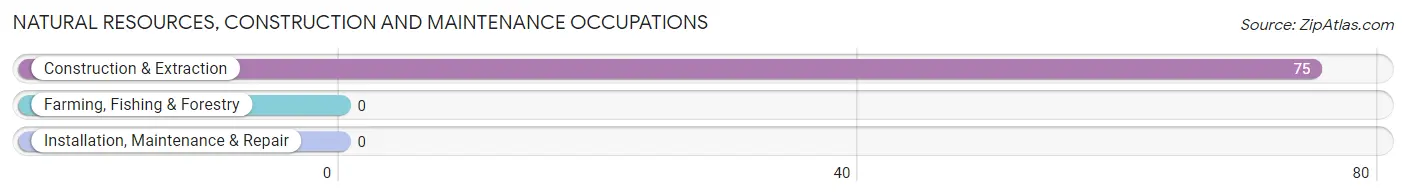
Natural Resources, Construction and Maintenance Occupations
The most common Natural Resources, Construction and Maintenance occupations in Lake Medina Shores are , and Construction & Extraction (75 | 49.3%).
Natural Resources, Construction and Maintenance Occupations by Sex
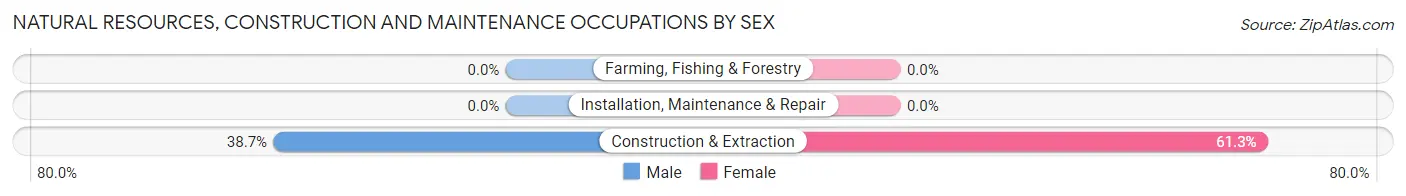
| Occupation | Male | Female |
| Farming, Fishing & Forestry | 0 (0.0%) | 0 (0.0%) |
| Construction & Extraction | 29 (38.7%) | 46 (61.3%) |
| Installation, Maintenance & Repair | 0 (0.0%) | 0 (0.0%) |
| Total (Category) | 29 (38.7%) | 46 (61.3%) |
| Total (Overall) | 53 (34.9%) | 99 (65.1%) |
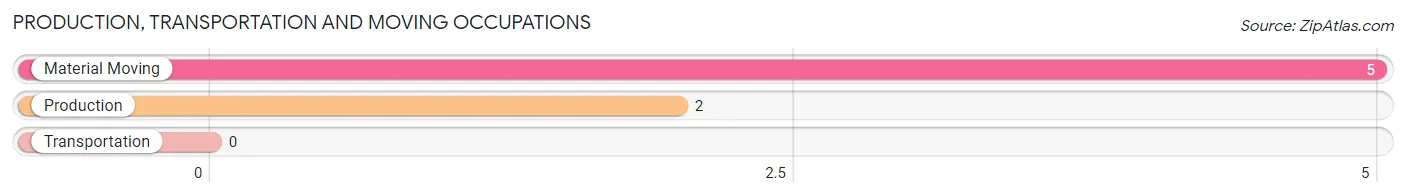
Production, Transportation and Moving Occupations
The most common Production, Transportation and Moving occupations in Lake Medina Shores are Material Moving (5 | 3.3%), and Production (2 | 1.3%).
Production, Transportation and Moving Occupations by Sex
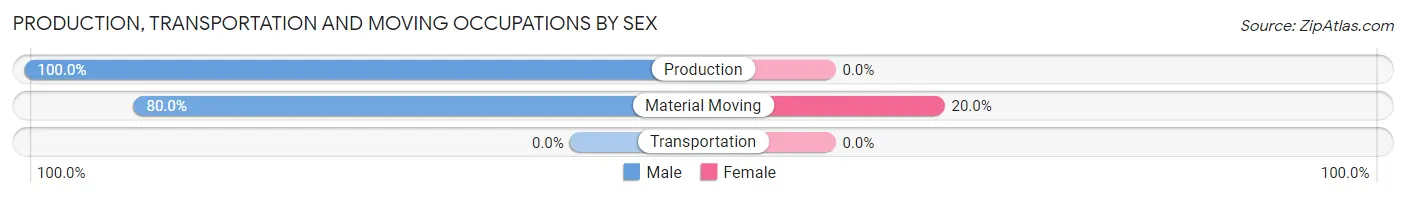
| Occupation | Male | Female |
| Production | 2 (100.0%) | 0 (0.0%) |
| Transportation | 0 (0.0%) | 0 (0.0%) |
| Material Moving | 4 (80.0%) | 1 (20.0%) |
| Total (Category) | 6 (85.7%) | 1 (14.3%) |
| Total (Overall) | 53 (34.9%) | 99 (65.1%) |
Employment Industries by Sex in Lake Medina Shores
Employment Industries in Lake Medina Shores
The major employment industries in Lake Medina Shores include Construction (90 | 59.2%), Retail Trade (38 | 25.0%), Professional & Scientific (18 | 11.8%), Mining, Quarrying, & Extraction (4 | 2.6%), and Manufacturing (2 | 1.3%).
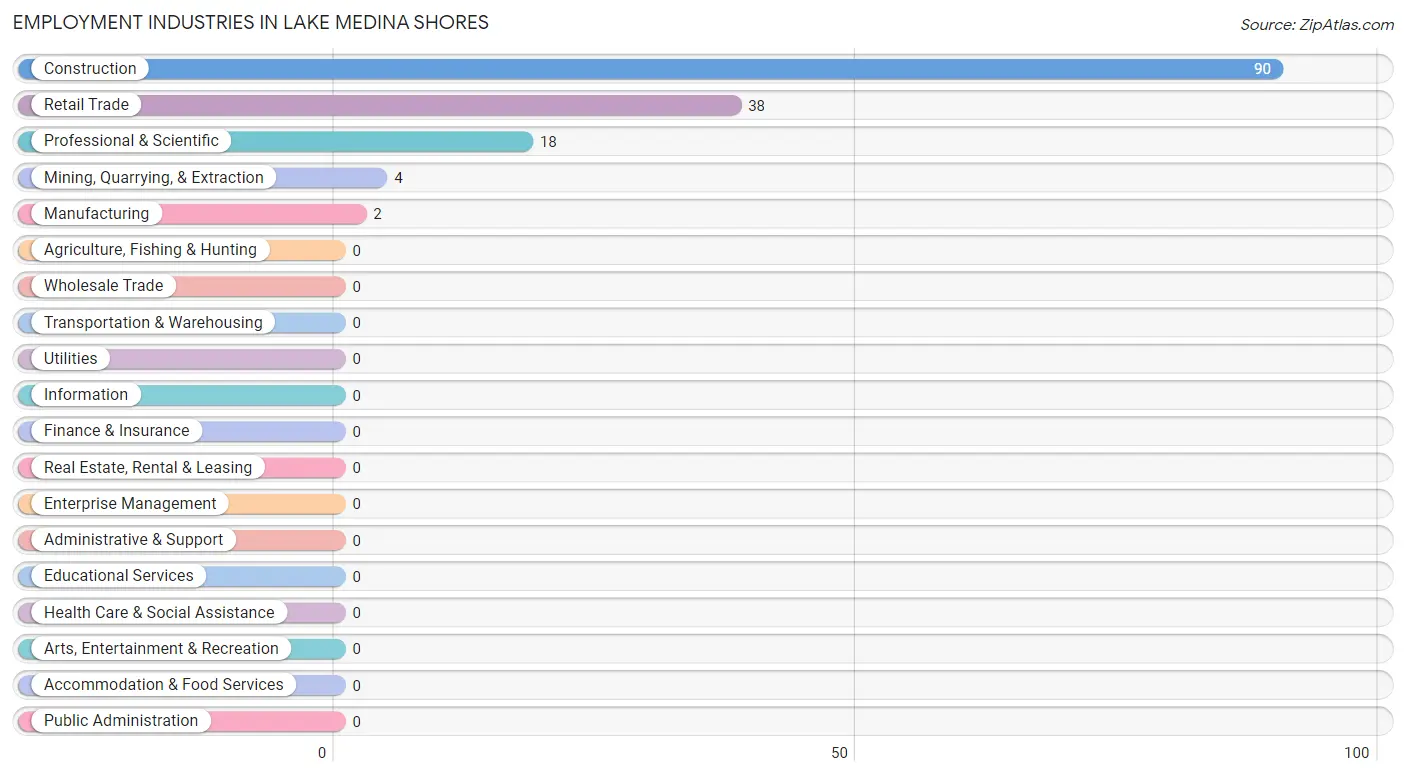
Employment Industries by Sex in Lake Medina Shores
The Lake Medina Shores industries that see more men than women are Mining, Quarrying, & Extraction (100.0%), Manufacturing (100.0%), and Professional & Scientific (100.0%), whereas the industries that tend to have a higher number of women are Retail Trade (100.0%), and Construction (67.8%).
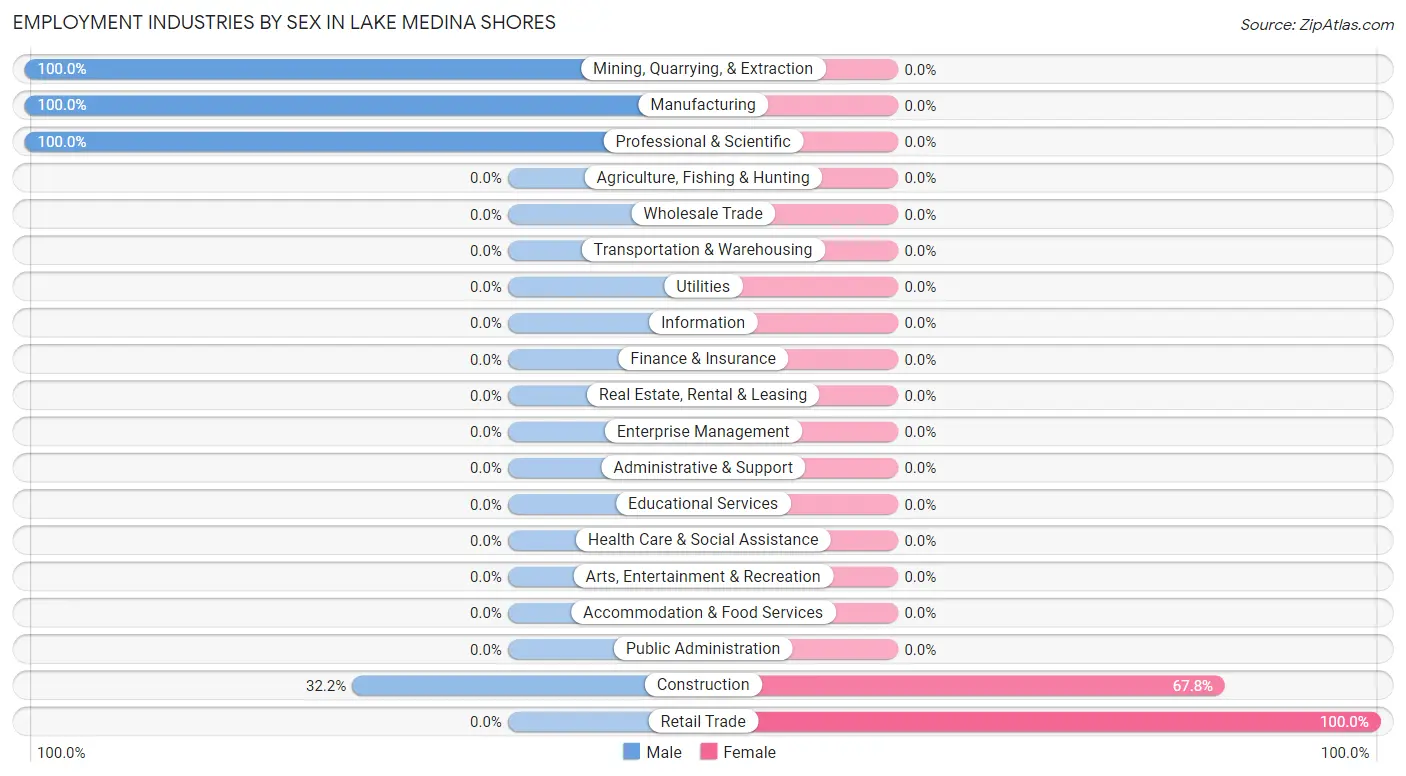
| Industry | Male | Female |
| Agriculture, Fishing & Hunting | 0 (0.0%) | 0 (0.0%) |
| Mining, Quarrying, & Extraction | 4 (100.0%) | 0 (0.0%) |
| Construction | 29 (32.2%) | 61 (67.8%) |
| Manufacturing | 2 (100.0%) | 0 (0.0%) |
| Wholesale Trade | 0 (0.0%) | 0 (0.0%) |
| Retail Trade | 0 (0.0%) | 38 (100.0%) |
| Transportation & Warehousing | 0 (0.0%) | 0 (0.0%) |
| Utilities | 0 (0.0%) | 0 (0.0%) |
| Information | 0 (0.0%) | 0 (0.0%) |
| Finance & Insurance | 0 (0.0%) | 0 (0.0%) |
| Real Estate, Rental & Leasing | 0 (0.0%) | 0 (0.0%) |
| Professional & Scientific | 18 (100.0%) | 0 (0.0%) |
| Enterprise Management | 0 (0.0%) | 0 (0.0%) |
| Administrative & Support | 0 (0.0%) | 0 (0.0%) |
| Educational Services | 0 (0.0%) | 0 (0.0%) |
| Health Care & Social Assistance | 0 (0.0%) | 0 (0.0%) |
| Arts, Entertainment & Recreation | 0 (0.0%) | 0 (0.0%) |
| Accommodation & Food Services | 0 (0.0%) | 0 (0.0%) |
| Public Administration | 0 (0.0%) | 0 (0.0%) |
| Total | 53 (34.9%) | 99 (65.1%) |
Education in Lake Medina Shores
School Enrollment in Lake Medina Shores
The most common levels of schooling among the 29 students in Lake Medina Shores are college / undergraduate (22 | 75.9%), and high school (7 | 24.1%).
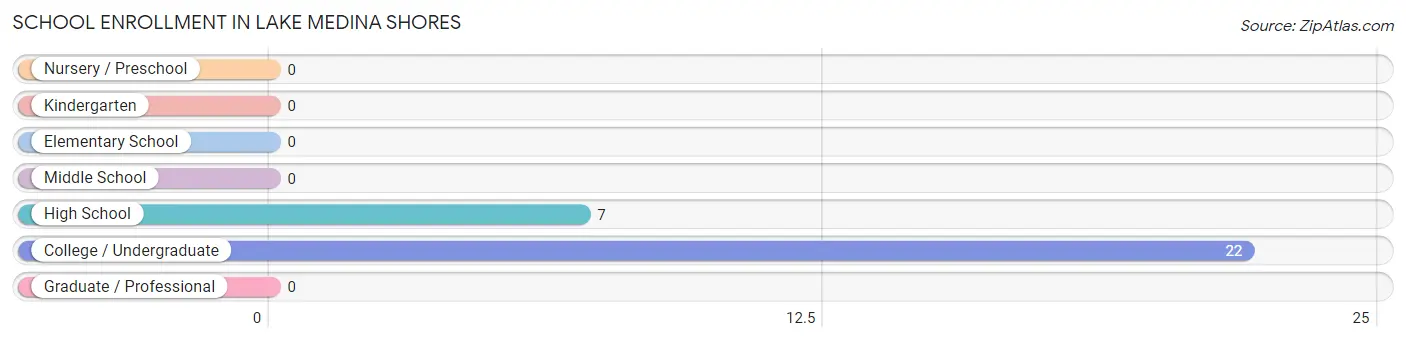
| School Level | # Students | % Students |
| Nursery / Preschool | 0 | 0.0% |
| Kindergarten | 0 | 0.0% |
| Elementary School | 0 | 0.0% |
| Middle School | 0 | 0.0% |
| High School | 7 | 24.1% |
| College / Undergraduate | 22 | 75.9% |
| Graduate / Professional | 0 | 0.0% |
| Total | 29 | 100.0% |
School Enrollment by Age by Funding Source in Lake Medina Shores
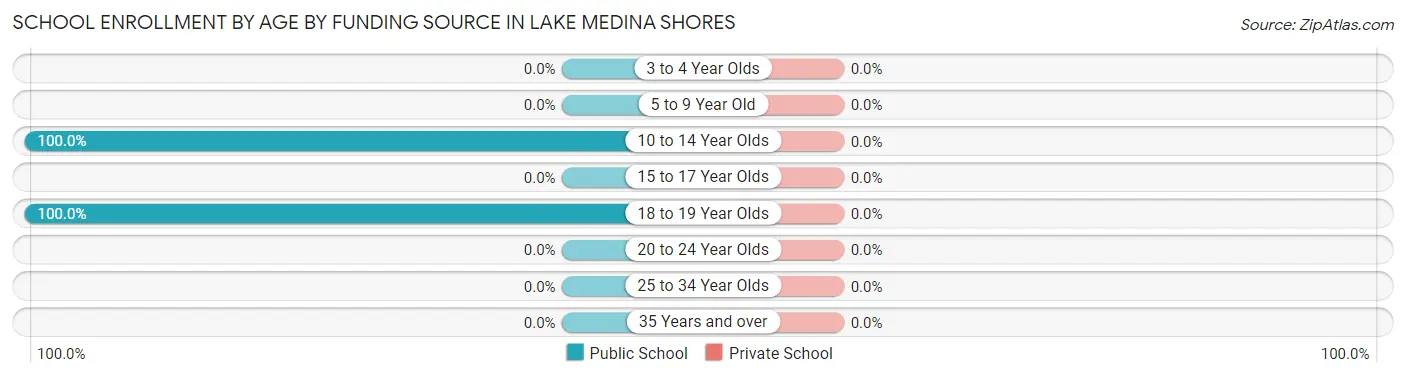
| Age Bracket | Public School | Private School |
| 3 to 4 Year Olds | 0 (0.0%) | 0 (0.0%) |
| 5 to 9 Year Old | 0 (0.0%) | 0 (0.0%) |
| 10 to 14 Year Olds | 7 (100.0%) | 0 (0.0%) |
| 15 to 17 Year Olds | 0 (0.0%) | 0 (0.0%) |
| 18 to 19 Year Olds | 22 (100.0%) | 0 (0.0%) |
| 20 to 24 Year Olds | 0 (0.0%) | 0 (0.0%) |
| 25 to 34 Year Olds | 0 (0.0%) | 0 (0.0%) |
| 35 Years and over | 0 (0.0%) | 0 (0.0%) |
| Total | 29 (100.0%) | 0 (0.0%) |
Educational Attainment by Field of Study in Lake Medina Shores
Science & technology (25 | 48.1%), bio, nature & agricultural (12 | 23.1%), physical & health sciences (12 | 23.1%), and computers & mathematics (3 | 5.8%) are the most common fields of study among 52 individuals in Lake Medina Shores who have obtained a bachelor's degree or higher.
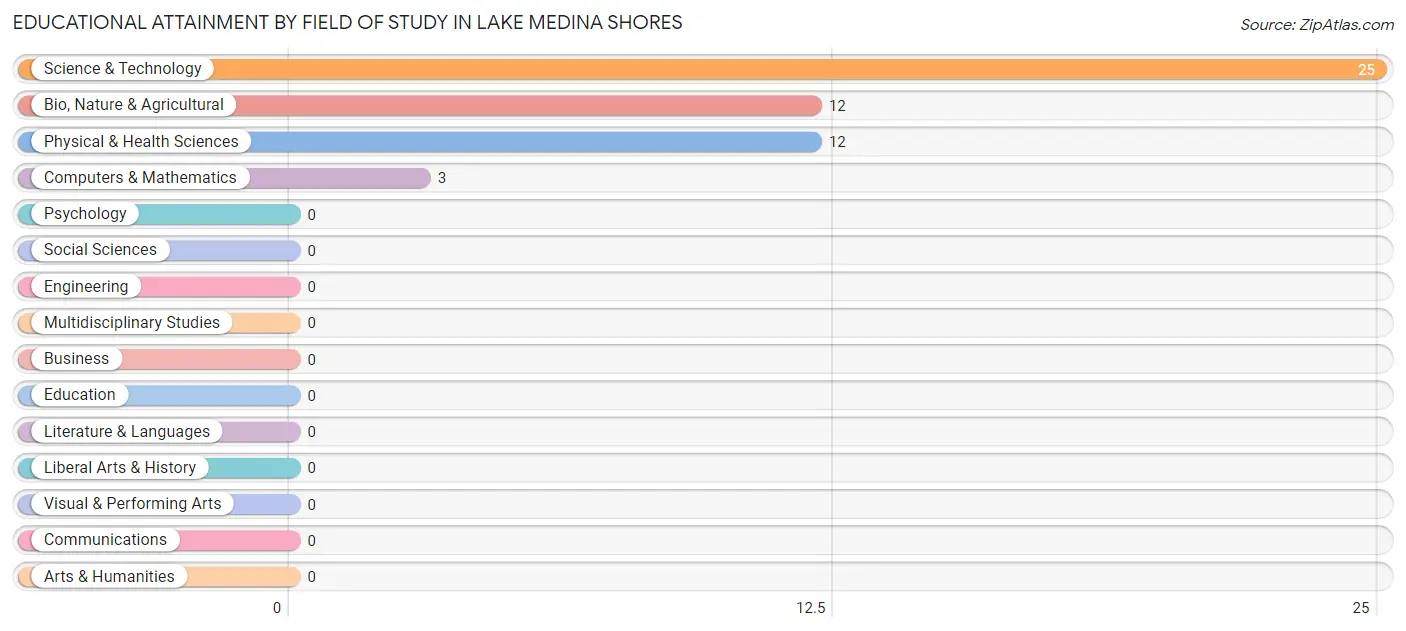
| Field of Study | # Graduates | % Graduates |
| Computers & Mathematics | 3 | 5.8% |
| Bio, Nature & Agricultural | 12 | 23.1% |
| Physical & Health Sciences | 12 | 23.1% |
| Psychology | 0 | 0.0% |
| Social Sciences | 0 | 0.0% |
| Engineering | 0 | 0.0% |
| Multidisciplinary Studies | 0 | 0.0% |
| Science & Technology | 25 | 48.1% |
| Business | 0 | 0.0% |
| Education | 0 | 0.0% |
| Literature & Languages | 0 | 0.0% |
| Liberal Arts & History | 0 | 0.0% |
| Visual & Performing Arts | 0 | 0.0% |
| Communications | 0 | 0.0% |
| Arts & Humanities | 0 | 0.0% |
| Total | 52 | 100.0% |
Transportation & Commute in Lake Medina Shores
Vehicle Availability by Sex in Lake Medina Shores
The most prevalent vehicle ownership categories in Lake Medina Shores are males with 1 vehicle (29, accounting for 54.7%) and females with 1 vehicle (46, making up 29.3%).
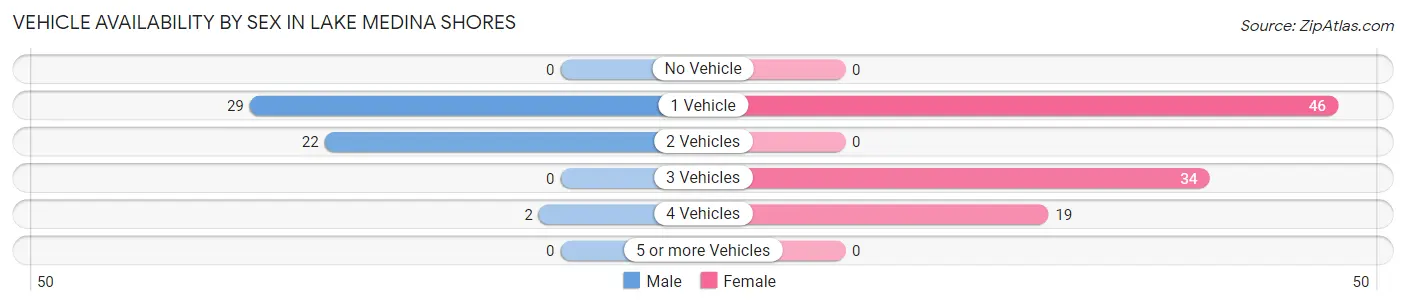
| Vehicles Available | Male | Female |
| No Vehicle | 0 (0.0%) | 0 (0.0%) |
| 1 Vehicle | 29 (54.7%) | 46 (46.5%) |
| 2 Vehicles | 22 (41.5%) | 0 (0.0%) |
| 3 Vehicles | 0 (0.0%) | 34 (34.3%) |
| 4 Vehicles | 2 (3.8%) | 19 (19.2%) |
| 5 or more Vehicles | 0 (0.0%) | 0 (0.0%) |
| Total | 53 (100.0%) | 99 (100.0%) |
Commute Time in Lake Medina Shores
The most frequently occuring commute durations in Lake Medina Shores are 60 to 89 minutes (111 commuters, 76.5%), 20 to 24 minutes (17 commuters, 11.7%), and 45 to 59 minutes (17 commuters, 11.7%).
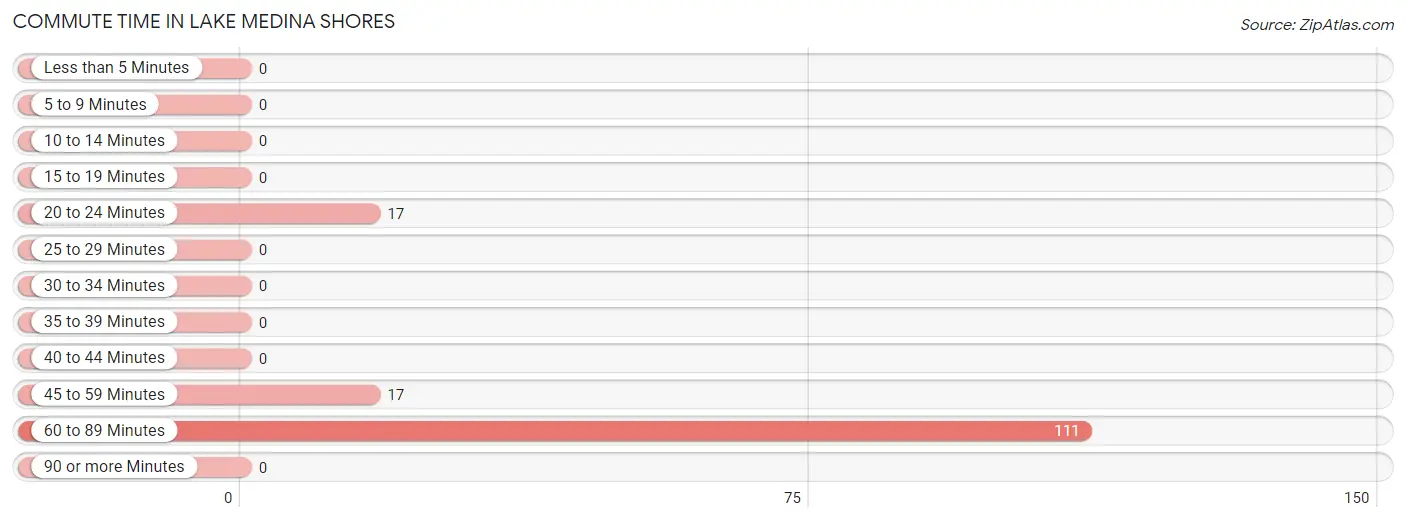
| Commute Time | # Commuters | % Commuters |
| Less than 5 Minutes | 0 | 0.0% |
| 5 to 9 Minutes | 0 | 0.0% |
| 10 to 14 Minutes | 0 | 0.0% |
| 15 to 19 Minutes | 0 | 0.0% |
| 20 to 24 Minutes | 17 | 11.7% |
| 25 to 29 Minutes | 0 | 0.0% |
| 30 to 34 Minutes | 0 | 0.0% |
| 35 to 39 Minutes | 0 | 0.0% |
| 40 to 44 Minutes | 0 | 0.0% |
| 45 to 59 Minutes | 17 | 11.7% |
| 60 to 89 Minutes | 111 | 76.5% |
| 90 or more Minutes | 0 | 0.0% |
Commute Time by Sex in Lake Medina Shores
The most common commute times in Lake Medina Shores are 60 to 89 minutes (49 commuters, 100.0%) for males and 60 to 89 minutes (62 commuters, 64.6%) for females.
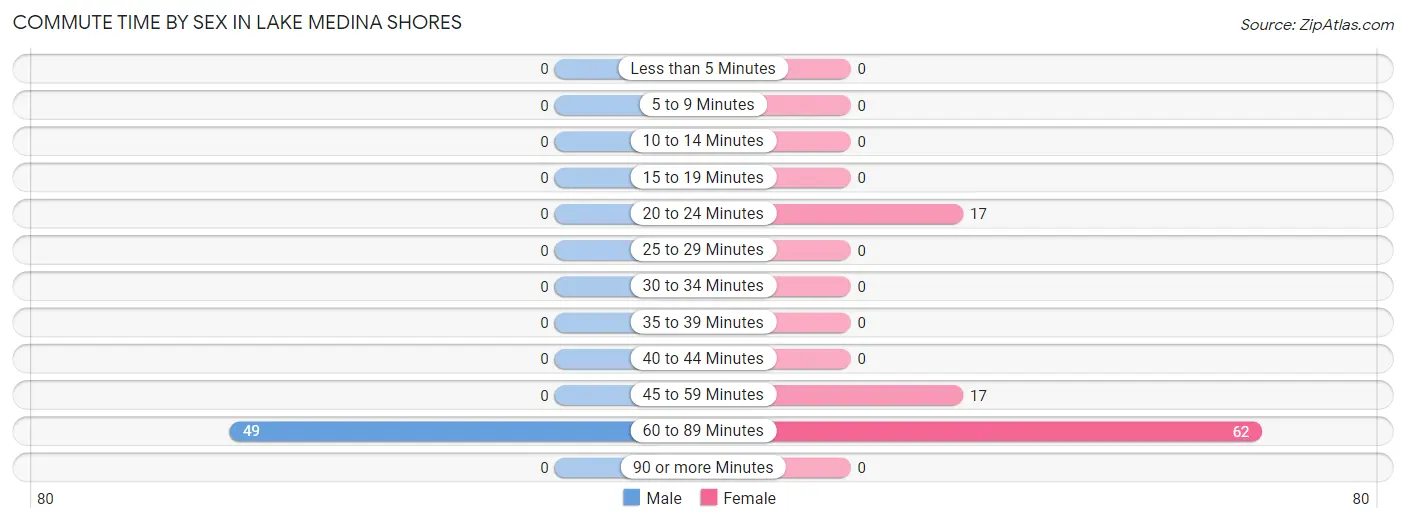
| Commute Time | Male | Female |
| Less than 5 Minutes | 0 (0.0%) | 0 (0.0%) |
| 5 to 9 Minutes | 0 (0.0%) | 0 (0.0%) |
| 10 to 14 Minutes | 0 (0.0%) | 0 (0.0%) |
| 15 to 19 Minutes | 0 (0.0%) | 0 (0.0%) |
| 20 to 24 Minutes | 0 (0.0%) | 17 (17.7%) |
| 25 to 29 Minutes | 0 (0.0%) | 0 (0.0%) |
| 30 to 34 Minutes | 0 (0.0%) | 0 (0.0%) |
| 35 to 39 Minutes | 0 (0.0%) | 0 (0.0%) |
| 40 to 44 Minutes | 0 (0.0%) | 0 (0.0%) |
| 45 to 59 Minutes | 0 (0.0%) | 17 (17.7%) |
| 60 to 89 Minutes | 49 (100.0%) | 62 (64.6%) |
| 90 or more Minutes | 0 (0.0%) | 0 (0.0%) |
Time of Departure to Work by Sex in Lake Medina Shores
The most frequent times of departure to work in Lake Medina Shores are 6:30 AM to 6:59 AM (29, 59.2%) for males and 6:30 AM to 6:59 AM (46, 47.9%) for females.
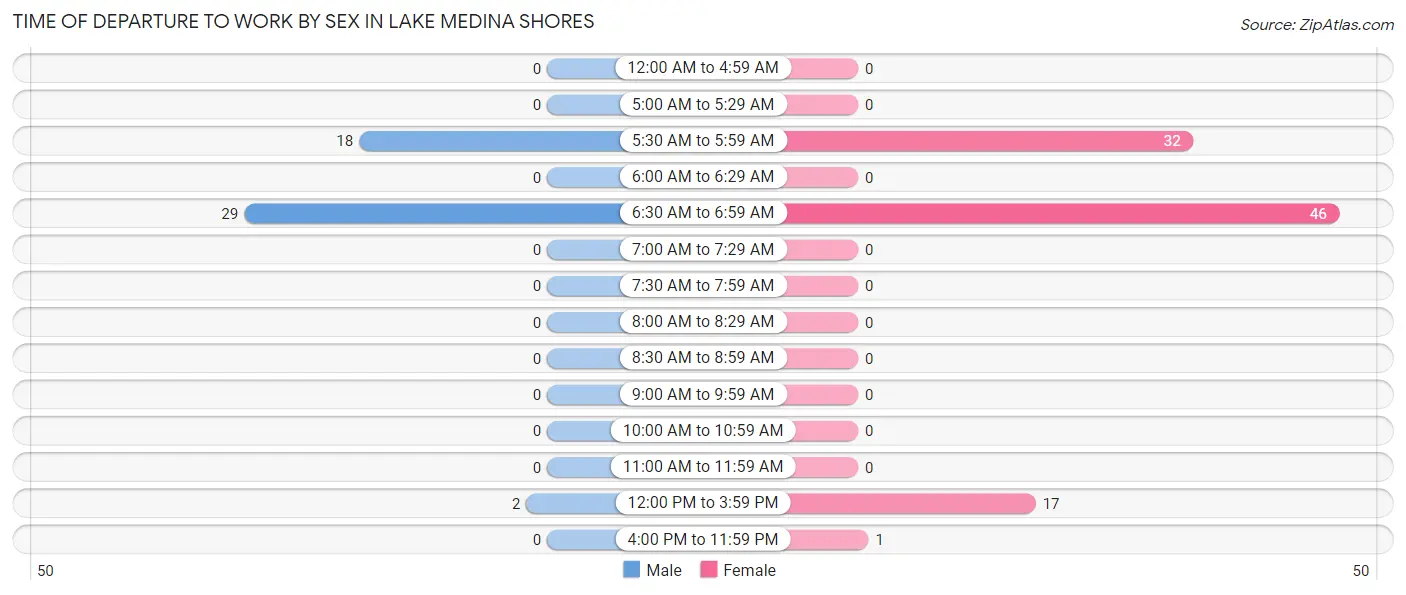
| Time of Departure | Male | Female |
| 12:00 AM to 4:59 AM | 0 (0.0%) | 0 (0.0%) |
| 5:00 AM to 5:29 AM | 0 (0.0%) | 0 (0.0%) |
| 5:30 AM to 5:59 AM | 18 (36.7%) | 32 (33.3%) |
| 6:00 AM to 6:29 AM | 0 (0.0%) | 0 (0.0%) |
| 6:30 AM to 6:59 AM | 29 (59.2%) | 46 (47.9%) |
| 7:00 AM to 7:29 AM | 0 (0.0%) | 0 (0.0%) |
| 7:30 AM to 7:59 AM | 0 (0.0%) | 0 (0.0%) |
| 8:00 AM to 8:29 AM | 0 (0.0%) | 0 (0.0%) |
| 8:30 AM to 8:59 AM | 0 (0.0%) | 0 (0.0%) |
| 9:00 AM to 9:59 AM | 0 (0.0%) | 0 (0.0%) |
| 10:00 AM to 10:59 AM | 0 (0.0%) | 0 (0.0%) |
| 11:00 AM to 11:59 AM | 0 (0.0%) | 0 (0.0%) |
| 12:00 PM to 3:59 PM | 2 (4.1%) | 17 (17.7%) |
| 4:00 PM to 11:59 PM | 0 (0.0%) | 1 (1.0%) |
| Total | 49 (100.0%) | 96 (100.0%) |
Housing Occupancy in Lake Medina Shores
Occupancy by Ownership in Lake Medina Shores
Of the total 264 dwellings in Lake Medina Shores, owner-occupied units account for 232 (87.9%), while renter-occupied units make up 32 (12.1%).
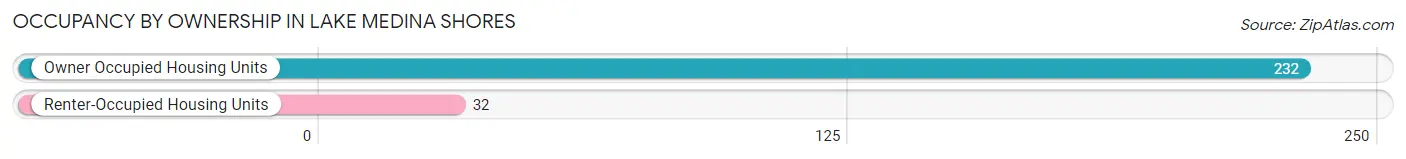
| Occupancy | # Housing Units | % Housing Units |
| Owner Occupied Housing Units | 232 | 87.9% |
| Renter-Occupied Housing Units | 32 | 12.1% |
| Total Occupied Housing Units | 264 | 100.0% |
Occupancy by Household Size in Lake Medina Shores
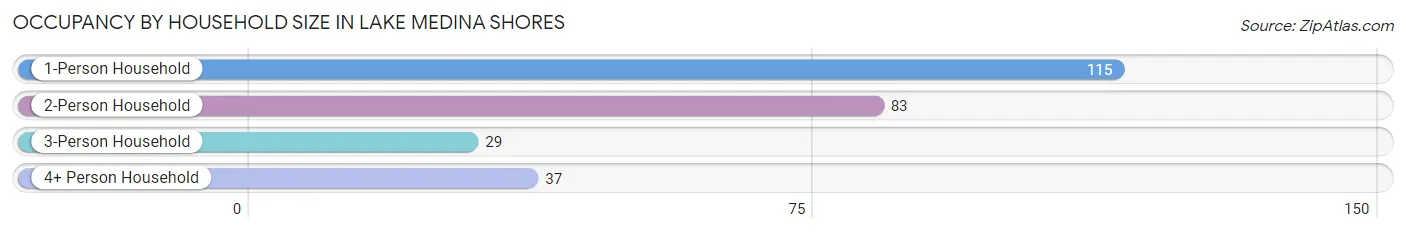
| Household Size | # Housing Units | % Housing Units |
| 1-Person Household | 115 | 43.6% |
| 2-Person Household | 83 | 31.4% |
| 3-Person Household | 29 | 11.0% |
| 4+ Person Household | 37 | 14.0% |
| Total Housing Units | 264 | 100.0% |
Occupancy by Ownership by Household Size in Lake Medina Shores
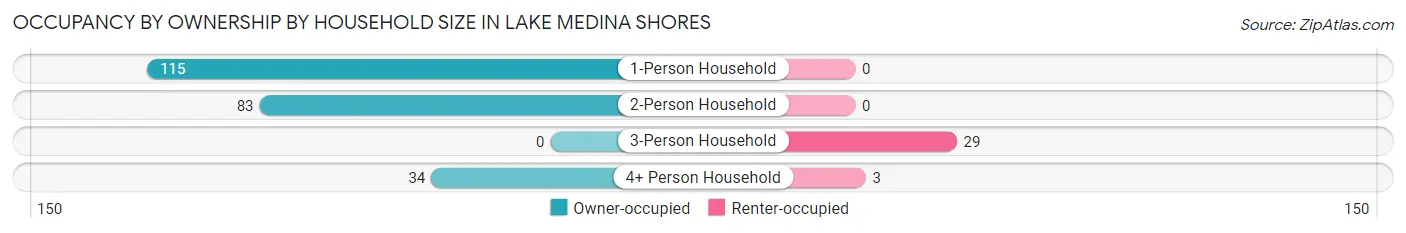
| Household Size | Owner-occupied | Renter-occupied |
| 1-Person Household | 115 (100.0%) | 0 (0.0%) |
| 2-Person Household | 83 (100.0%) | 0 (0.0%) |
| 3-Person Household | 0 (0.0%) | 29 (100.0%) |
| 4+ Person Household | 34 (91.9%) | 3 (8.1%) |
| Total Housing Units | 232 (87.9%) | 32 (12.1%) |
Occupancy by Educational Attainment in Lake Medina Shores
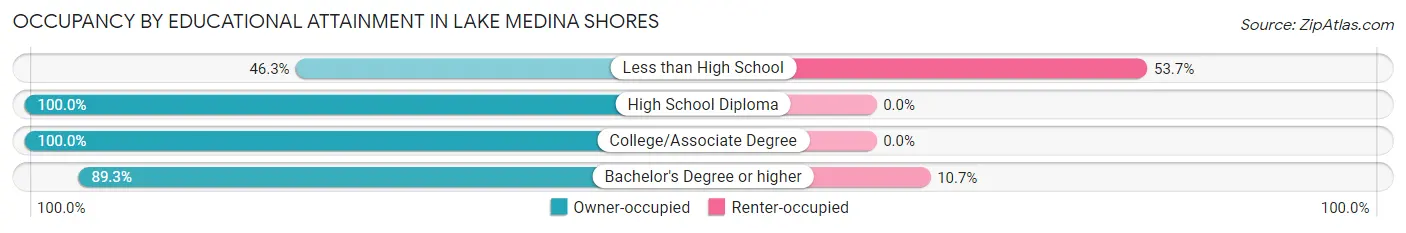
| Household Size | Owner-occupied | Renter-occupied |
| Less than High School | 25 (46.3%) | 29 (53.7%) |
| High School Diploma | 65 (100.0%) | 0 (0.0%) |
| College/Associate Degree | 117 (100.0%) | 0 (0.0%) |
| Bachelor's Degree or higher | 25 (89.3%) | 3 (10.7%) |
Occupancy by Age of Householder in Lake Medina Shores
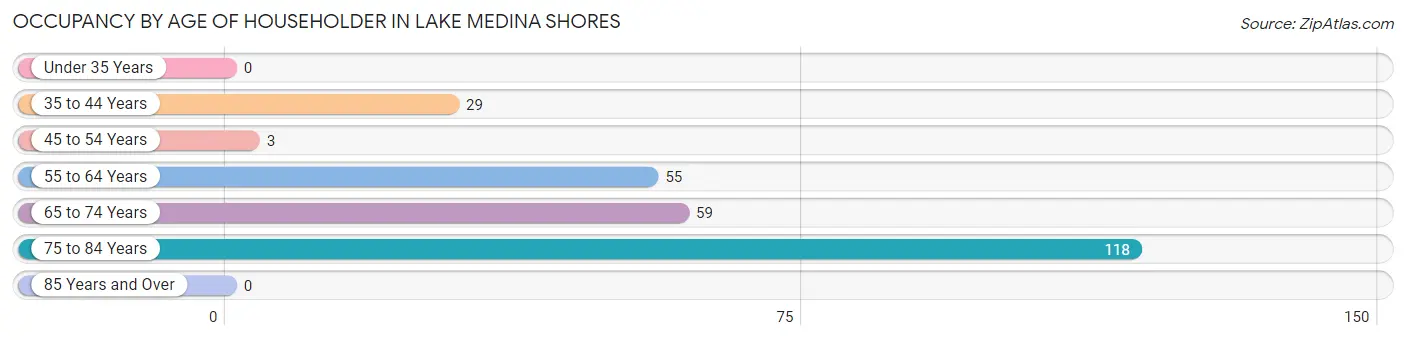
| Age Bracket | # Households | % Households |
| Under 35 Years | 0 | 0.0% |
| 35 to 44 Years | 29 | 11.0% |
| 45 to 54 Years | 3 | 1.1% |
| 55 to 64 Years | 55 | 20.8% |
| 65 to 74 Years | 59 | 22.4% |
| 75 to 84 Years | 118 | 44.7% |
| 85 Years and Over | 0 | 0.0% |
| Total | 264 | 100.0% |
Housing Finances in Lake Medina Shores
Median Income by Occupancy in Lake Medina Shores
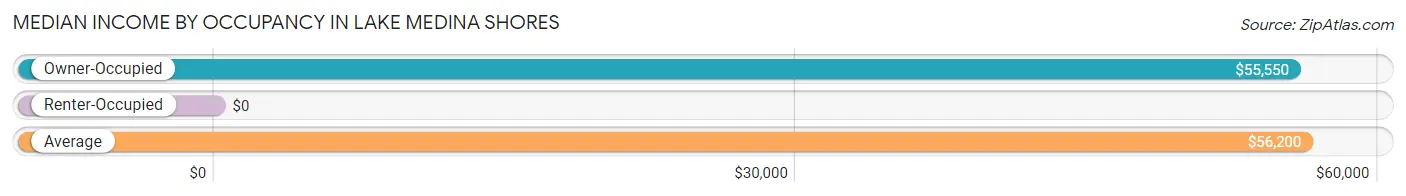
| Occupancy Type | # Households | Median Income |
| Owner-Occupied | 232 (87.9%) | $55,550 |
| Renter-Occupied | 32 (12.1%) | $0 |
| Average | 264 (100.0%) | $56,200 |
Occupancy by Householder Income Bracket in Lake Medina Shores
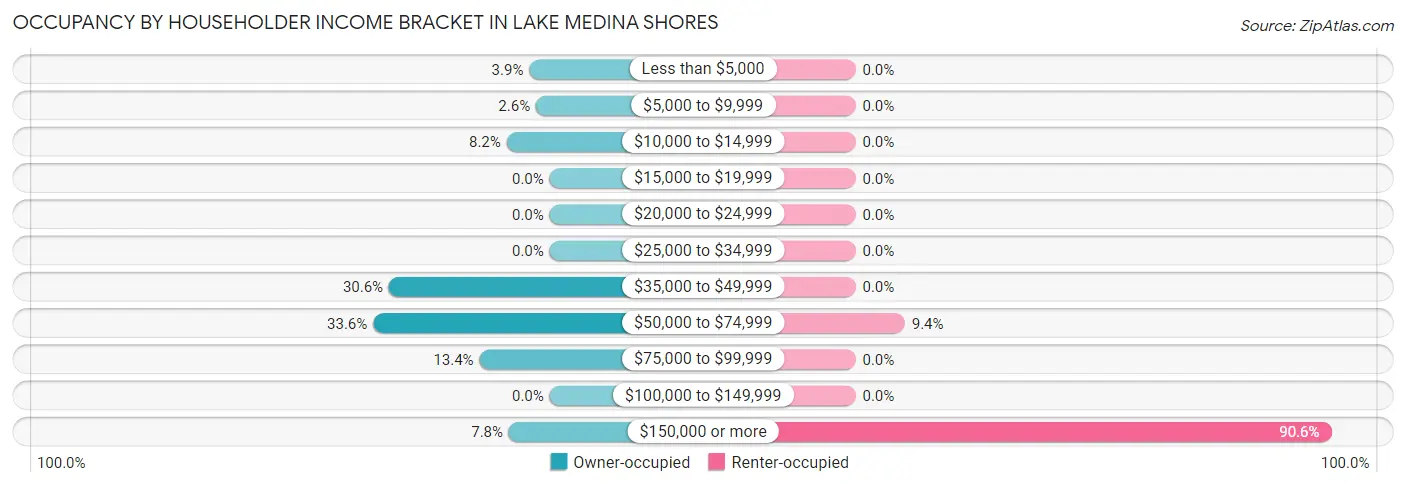
| Income Bracket | Owner-occupied | Renter-occupied |
| Less than $5,000 | 9 (3.9%) | 0 (0.0%) |
| $5,000 to $9,999 | 6 (2.6%) | 0 (0.0%) |
| $10,000 to $14,999 | 19 (8.2%) | 0 (0.0%) |
| $15,000 to $19,999 | 0 (0.0%) | 0 (0.0%) |
| $20,000 to $24,999 | 0 (0.0%) | 0 (0.0%) |
| $25,000 to $34,999 | 0 (0.0%) | 0 (0.0%) |
| $35,000 to $49,999 | 71 (30.6%) | 0 (0.0%) |
| $50,000 to $74,999 | 78 (33.6%) | 3 (9.4%) |
| $75,000 to $99,999 | 31 (13.4%) | 0 (0.0%) |
| $100,000 to $149,999 | 0 (0.0%) | 0 (0.0%) |
| $150,000 or more | 18 (7.8%) | 29 (90.6%) |
| Total | 232 (100.0%) | 32 (100.0%) |
Monthly Housing Cost Tiers in Lake Medina Shores
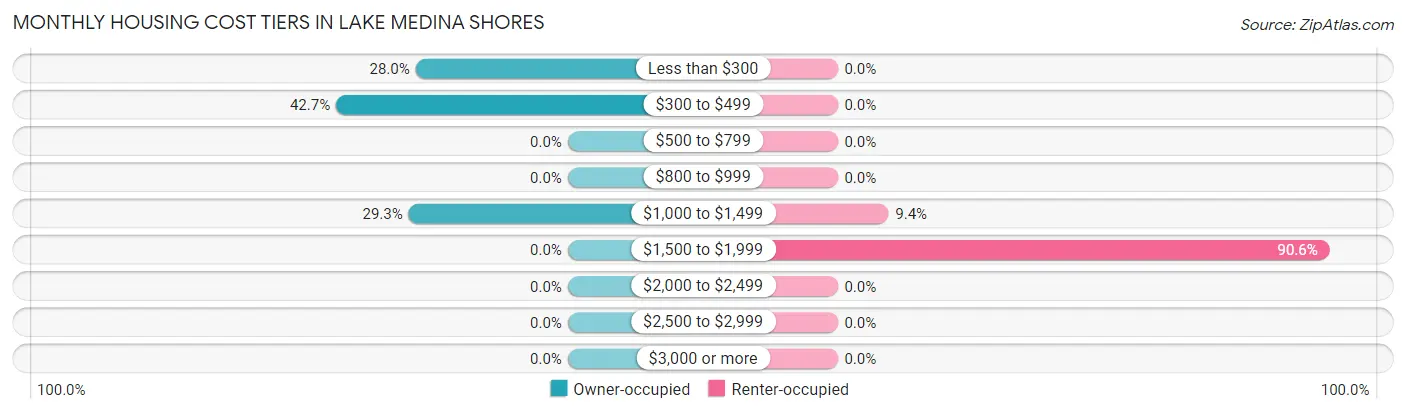
| Monthly Cost | Owner-occupied | Renter-occupied |
| Less than $300 | 65 (28.0%) | 0 (0.0%) |
| $300 to $499 | 99 (42.7%) | 0 (0.0%) |
| $500 to $799 | 0 (0.0%) | 0 (0.0%) |
| $800 to $999 | 0 (0.0%) | 0 (0.0%) |
| $1,000 to $1,499 | 68 (29.3%) | 3 (9.4%) |
| $1,500 to $1,999 | 0 (0.0%) | 29 (90.6%) |
| $2,000 to $2,499 | 0 (0.0%) | 0 (0.0%) |
| $2,500 to $2,999 | 0 (0.0%) | 0 (0.0%) |
| $3,000 or more | 0 (0.0%) | 0 (0.0%) |
| Total | 232 (100.0%) | 32 (100.0%) |
Physical Housing Characteristics in Lake Medina Shores
Housing Structures in Lake Medina Shores
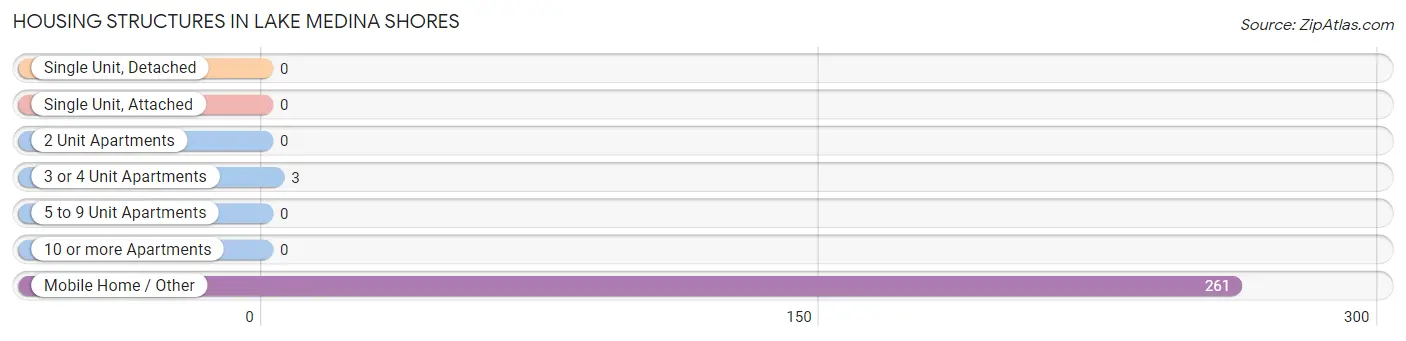
| Structure Type | # Housing Units | % Housing Units |
| Single Unit, Detached | 0 | 0.0% |
| Single Unit, Attached | 0 | 0.0% |
| 2 Unit Apartments | 0 | 0.0% |
| 3 or 4 Unit Apartments | 3 | 1.1% |
| 5 to 9 Unit Apartments | 0 | 0.0% |
| 10 or more Apartments | 0 | 0.0% |
| Mobile Home / Other | 261 | 98.9% |
| Total | 264 | 100.0% |
Housing Structures by Occupancy in Lake Medina Shores
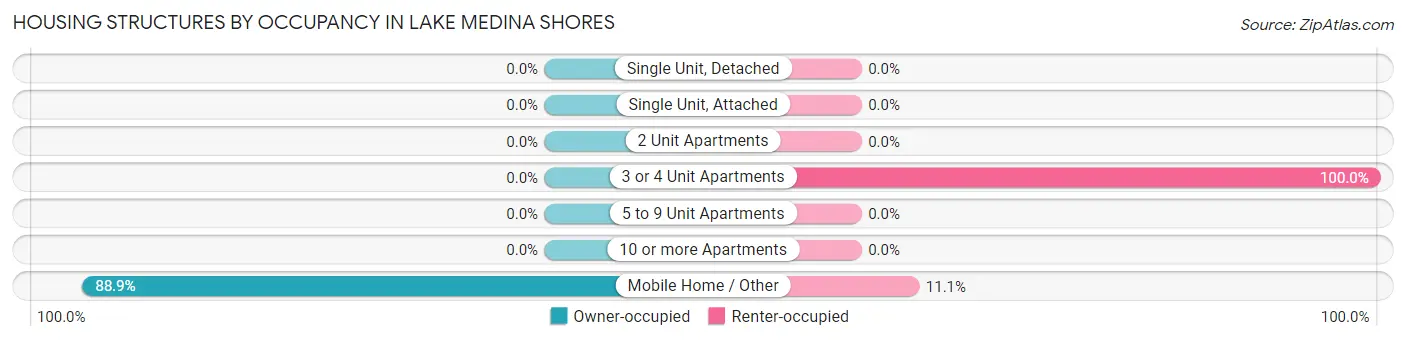
| Structure Type | Owner-occupied | Renter-occupied |
| Single Unit, Detached | 0 (0.0%) | 0 (0.0%) |
| Single Unit, Attached | 0 (0.0%) | 0 (0.0%) |
| 2 Unit Apartments | 0 (0.0%) | 0 (0.0%) |
| 3 or 4 Unit Apartments | 0 (0.0%) | 3 (100.0%) |
| 5 to 9 Unit Apartments | 0 (0.0%) | 0 (0.0%) |
| 10 or more Apartments | 0 (0.0%) | 0 (0.0%) |
| Mobile Home / Other | 232 (88.9%) | 29 (11.1%) |
| Total | 232 (87.9%) | 32 (12.1%) |
Housing Structures by Number of Rooms in Lake Medina Shores
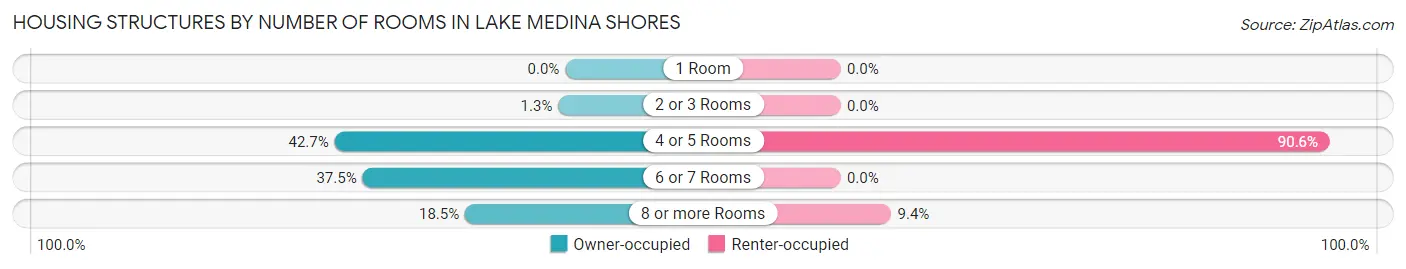
| Number of Rooms | Owner-occupied | Renter-occupied |
| 1 Room | 0 (0.0%) | 0 (0.0%) |
| 2 or 3 Rooms | 3 (1.3%) | 0 (0.0%) |
| 4 or 5 Rooms | 99 (42.7%) | 29 (90.6%) |
| 6 or 7 Rooms | 87 (37.5%) | 0 (0.0%) |
| 8 or more Rooms | 43 (18.5%) | 3 (9.4%) |
| Total | 232 (100.0%) | 32 (100.0%) |
Housing Structure by Heating Type in Lake Medina Shores
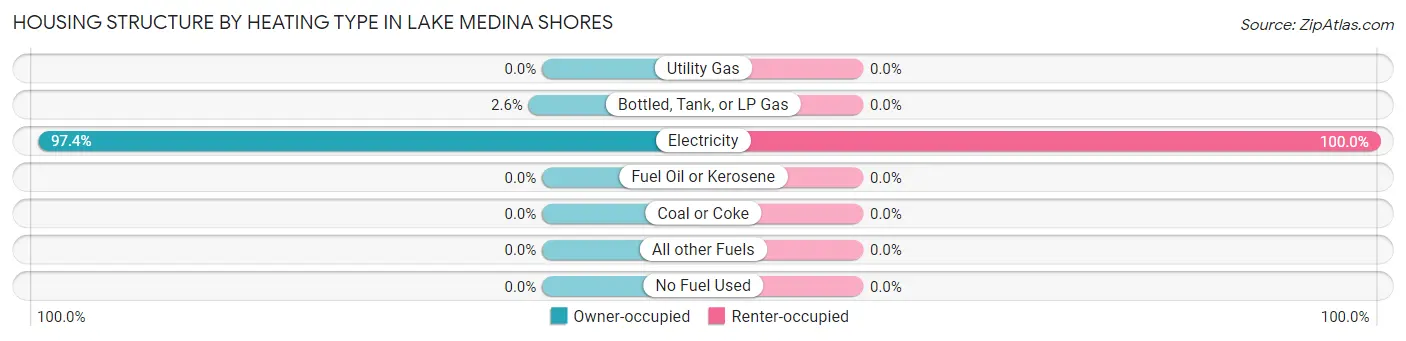
| Heating Type | Owner-occupied | Renter-occupied |
| Utility Gas | 0 (0.0%) | 0 (0.0%) |
| Bottled, Tank, or LP Gas | 6 (2.6%) | 0 (0.0%) |
| Electricity | 226 (97.4%) | 32 (100.0%) |
| Fuel Oil or Kerosene | 0 (0.0%) | 0 (0.0%) |
| Coal or Coke | 0 (0.0%) | 0 (0.0%) |
| All other Fuels | 0 (0.0%) | 0 (0.0%) |
| No Fuel Used | 0 (0.0%) | 0 (0.0%) |
| Total | 232 (100.0%) | 32 (100.0%) |
Household Vehicle Usage in Lake Medina Shores
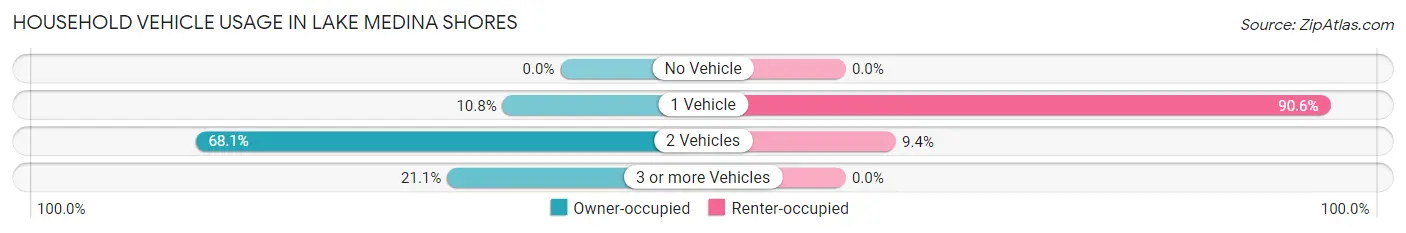
| Vehicles per Household | Owner-occupied | Renter-occupied |
| No Vehicle | 0 (0.0%) | 0 (0.0%) |
| 1 Vehicle | 25 (10.8%) | 29 (90.6%) |
| 2 Vehicles | 158 (68.1%) | 3 (9.4%) |
| 3 or more Vehicles | 49 (21.1%) | 0 (0.0%) |
| Total | 232 (100.0%) | 32 (100.0%) |
Real Estate & Mortgages in Lake Medina Shores
Real Estate and Mortgage Overview in Lake Medina Shores
| Characteristic | Without Mortgage | With Mortgage |
| Housing Units | 167 | 65 |
| Median Property Value | - | - |
| Median Household Income | $42,060 | $0 |
| Monthly Housing Costs | $413 | $0 |
| Real Estate Taxes | $864 | $0 |
Property Value by Mortgage Status in Lake Medina Shores
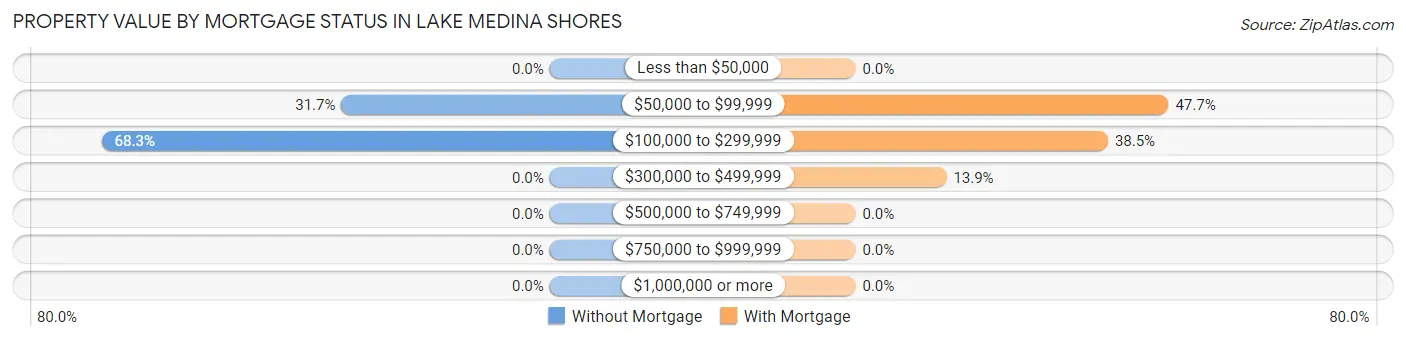
| Property Value | Without Mortgage | With Mortgage |
| Less than $50,000 | 0 (0.0%) | 0 (0.0%) |
| $50,000 to $99,999 | 53 (31.7%) | 31 (47.7%) |
| $100,000 to $299,999 | 114 (68.3%) | 25 (38.5%) |
| $300,000 to $499,999 | 0 (0.0%) | 9 (13.9%) |
| $500,000 to $749,999 | 0 (0.0%) | 0 (0.0%) |
| $750,000 to $999,999 | 0 (0.0%) | 0 (0.0%) |
| $1,000,000 or more | 0 (0.0%) | 0 (0.0%) |
| Total | 167 (100.0%) | 65 (100.0%) |
Household Income by Mortgage Status in Lake Medina Shores
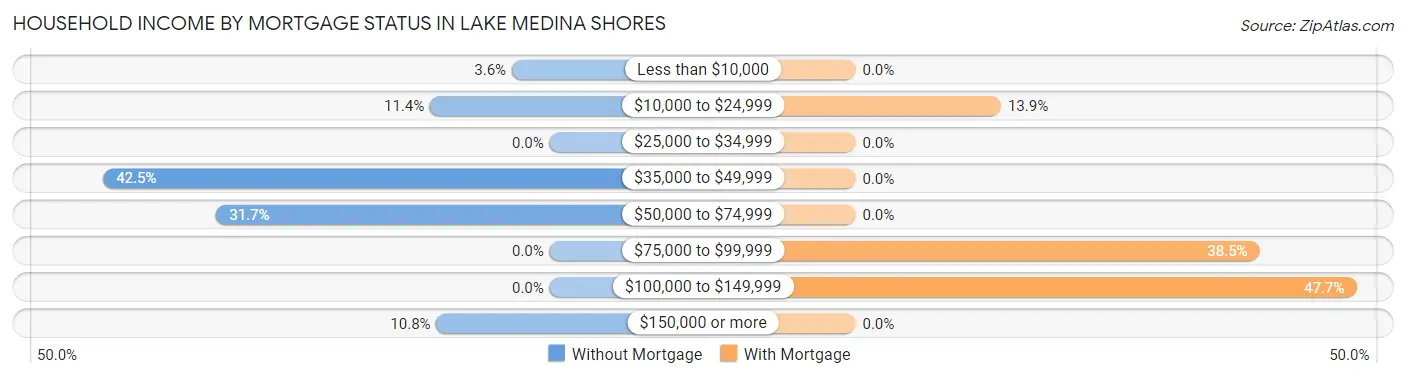
| Household Income | Without Mortgage | With Mortgage |
| Less than $10,000 | 6 (3.6%) | 0 (0.0%) |
| $10,000 to $24,999 | 19 (11.4%) | 9 (13.9%) |
| $25,000 to $34,999 | 0 (0.0%) | 0 (0.0%) |
| $35,000 to $49,999 | 71 (42.5%) | 0 (0.0%) |
| $50,000 to $74,999 | 53 (31.7%) | 0 (0.0%) |
| $75,000 to $99,999 | 0 (0.0%) | 25 (38.5%) |
| $100,000 to $149,999 | 0 (0.0%) | 31 (47.7%) |
| $150,000 or more | 18 (10.8%) | 0 (0.0%) |
| Total | 167 (100.0%) | 65 (100.0%) |
Property Value to Household Income Ratio in Lake Medina Shores
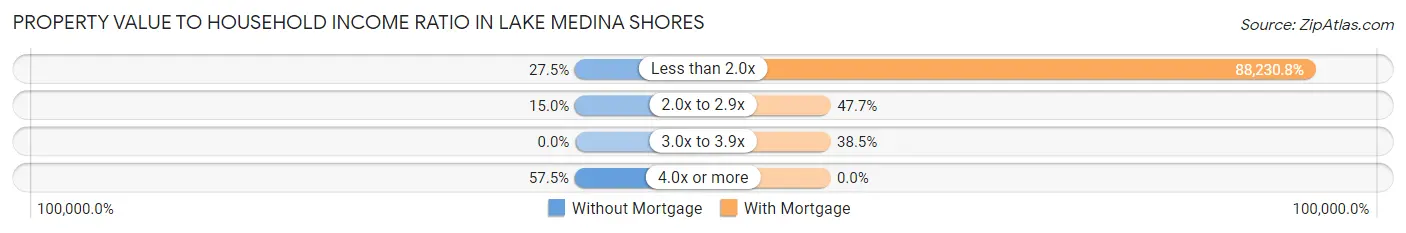
| Value-to-Income Ratio | Without Mortgage | With Mortgage |
| Less than 2.0x | 46 (27.5%) | 57,350 (88,230.8%) |
| 2.0x to 2.9x | 25 (15.0%) | 31 (47.7%) |
| 3.0x to 3.9x | 0 (0.0%) | 25 (38.5%) |
| 4.0x or more | 96 (57.5%) | 0 (0.0%) |
| Total | 167 (100.0%) | 65 (100.0%) |
Real Estate Taxes by Mortgage Status in Lake Medina Shores
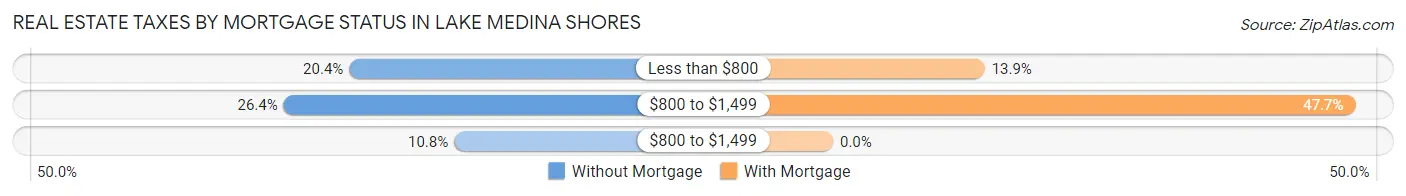
| Property Taxes | Without Mortgage | With Mortgage |
| Less than $800 | 34 (20.4%) | 9 (13.9%) |
| $800 to $1,499 | 44 (26.4%) | 31 (47.7%) |
| $800 to $1,499 | 18 (10.8%) | 0 (0.0%) |
| Total | 167 (100.0%) | 65 (100.0%) |
Health & Disability in Lake Medina Shores
Health Insurance Coverage by Age in Lake Medina Shores
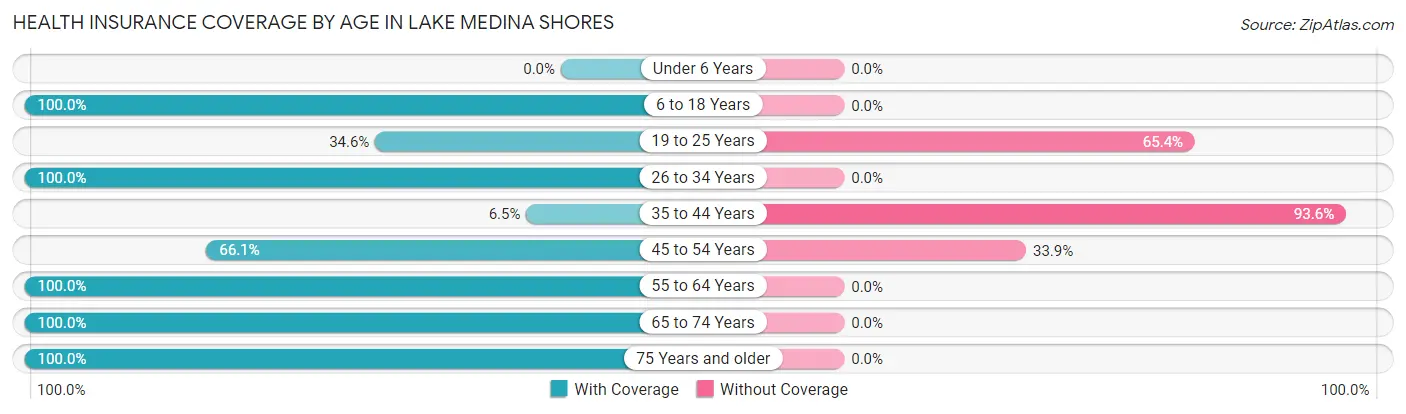
| Age Bracket | With Coverage | Without Coverage |
| Under 6 Years | 0 (0.0%) | 0 (0.0%) |
| 6 to 18 Years | 7 (100.0%) | 0 (0.0%) |
| 19 to 25 Years | 9 (34.6%) | 17 (65.4%) |
| 26 to 34 Years | 1 (100.0%) | 0 (0.0%) |
| 35 to 44 Years | 4 (6.5%) | 58 (93.5%) |
| 45 to 54 Years | 78 (66.1%) | 40 (33.9%) |
| 55 to 64 Years | 121 (100.0%) | 0 (0.0%) |
| 65 to 74 Years | 71 (100.0%) | 0 (0.0%) |
| 75 Years and older | 126 (100.0%) | 0 (0.0%) |
| Total | 417 (78.4%) | 115 (21.6%) |
Health Insurance Coverage by Citizenship Status in Lake Medina Shores

| Citizenship Status | With Coverage | Without Coverage |
| Native Born | 0 (0.0%) | 0 (0.0%) |
| Foreign Born, Citizen | 7 (100.0%) | 0 (0.0%) |
| Foreign Born, not a Citizen | 9 (34.6%) | 17 (65.4%) |
Health Insurance Coverage by Household Income in Lake Medina Shores
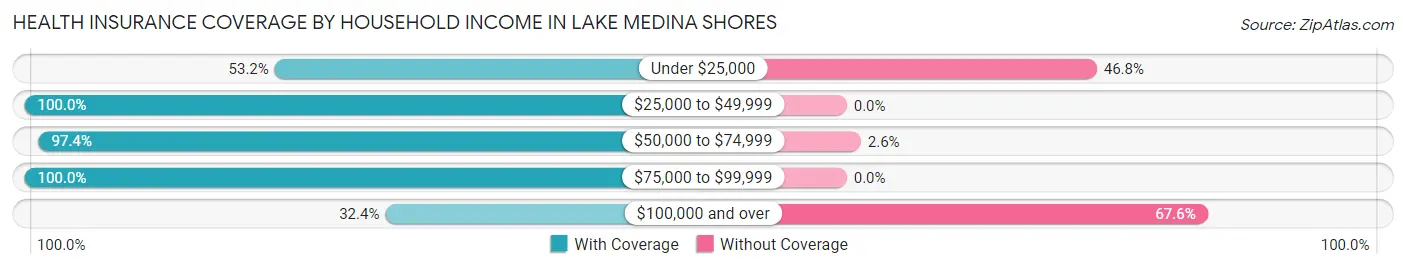
| Household Income | With Coverage | Without Coverage |
| Under $25,000 | 42 (53.2%) | 37 (46.8%) |
| $25,000 to $49,999 | 85 (100.0%) | 0 (0.0%) |
| $50,000 to $74,999 | 111 (97.4%) | 3 (2.6%) |
| $75,000 to $99,999 | 143 (100.0%) | 0 (0.0%) |
| $100,000 and over | 36 (32.4%) | 75 (67.6%) |
Public vs Private Health Insurance Coverage by Age in Lake Medina Shores
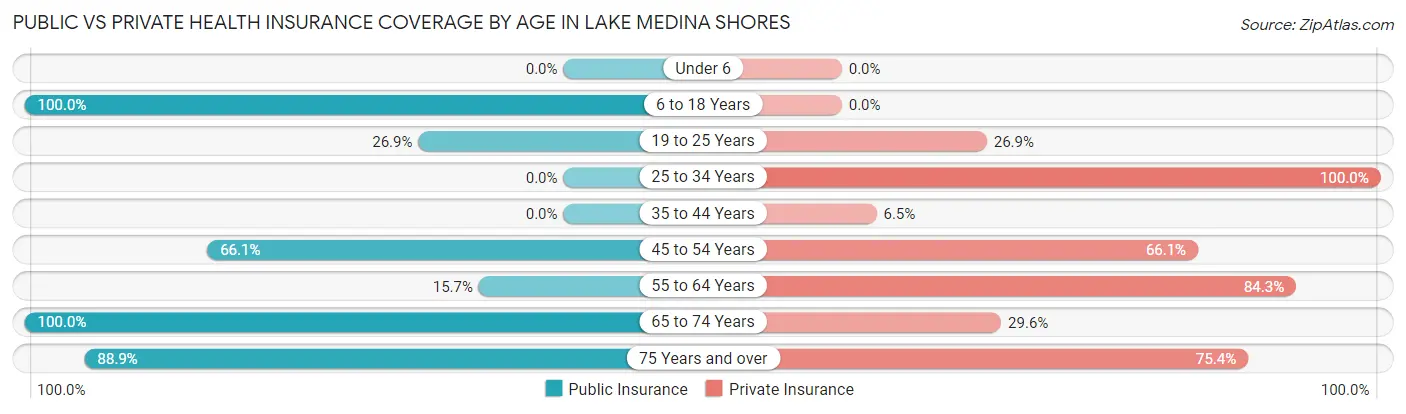
| Age Bracket | Public Insurance | Private Insurance |
| Under 6 | 0 (0.0%) | 0 (0.0%) |
| 6 to 18 Years | 7 (100.0%) | 0 (0.0%) |
| 19 to 25 Years | 7 (26.9%) | 7 (26.9%) |
| 25 to 34 Years | 0 (0.0%) | 1 (100.0%) |
| 35 to 44 Years | 0 (0.0%) | 4 (6.5%) |
| 45 to 54 Years | 78 (66.1%) | 78 (66.1%) |
| 55 to 64 Years | 19 (15.7%) | 102 (84.3%) |
| 65 to 74 Years | 71 (100.0%) | 21 (29.6%) |
| 75 Years and over | 112 (88.9%) | 95 (75.4%) |
| Total | 294 (55.3%) | 308 (57.9%) |
Disability Status by Sex by Age in Lake Medina Shores
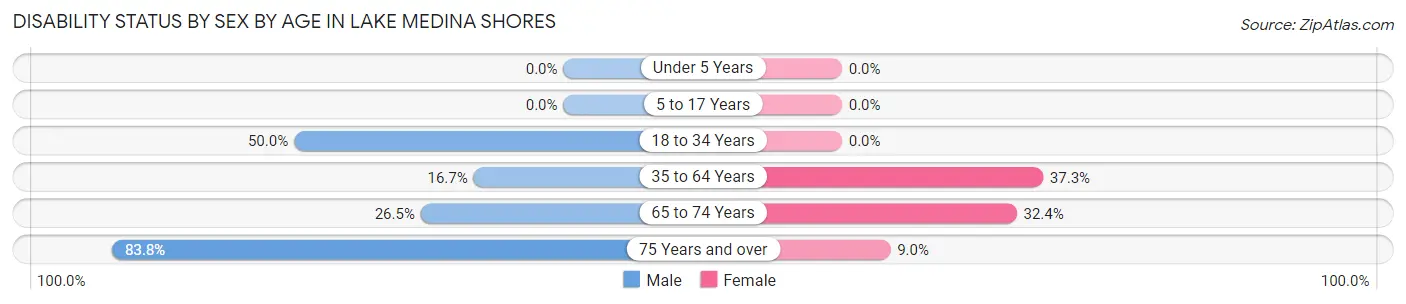
| Age Bracket | Male | Female |
| Under 5 Years | 0 (0.0%) | 0 (0.0%) |
| 5 to 17 Years | 0 (0.0%) | 0 (0.0%) |
| 18 to 34 Years | 2 (50.0%) | 0 (0.0%) |
| 35 to 64 Years | 14 (16.7%) | 81 (37.3%) |
| 65 to 74 Years | 9 (26.5%) | 12 (32.4%) |
| 75 Years and over | 31 (83.8%) | 8 (9.0%) |
Disability Class by Sex by Age in Lake Medina Shores
Disability Class: Hearing Difficulty
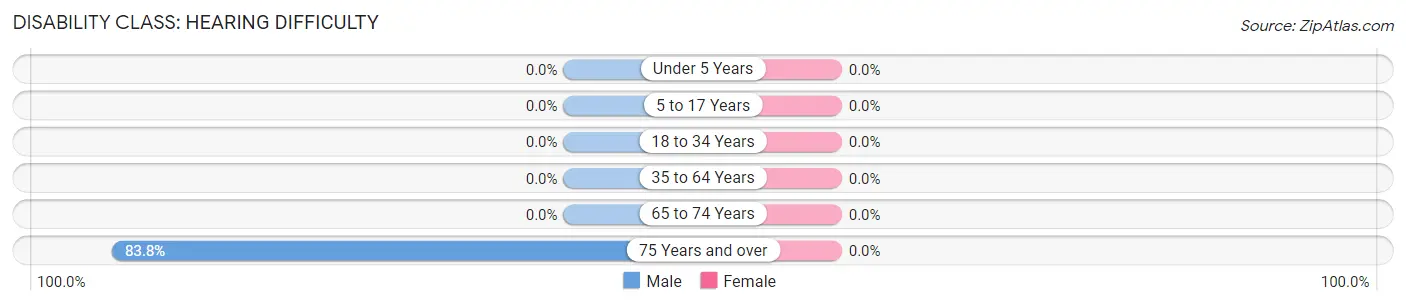
| Age Bracket | Male | Female |
| Under 5 Years | 0 (0.0%) | 0 (0.0%) |
| 5 to 17 Years | 0 (0.0%) | 0 (0.0%) |
| 18 to 34 Years | 0 (0.0%) | 0 (0.0%) |
| 35 to 64 Years | 0 (0.0%) | 0 (0.0%) |
| 65 to 74 Years | 0 (0.0%) | 0 (0.0%) |
| 75 Years and over | 31 (83.8%) | 0 (0.0%) |
Disability Class: Vision Difficulty
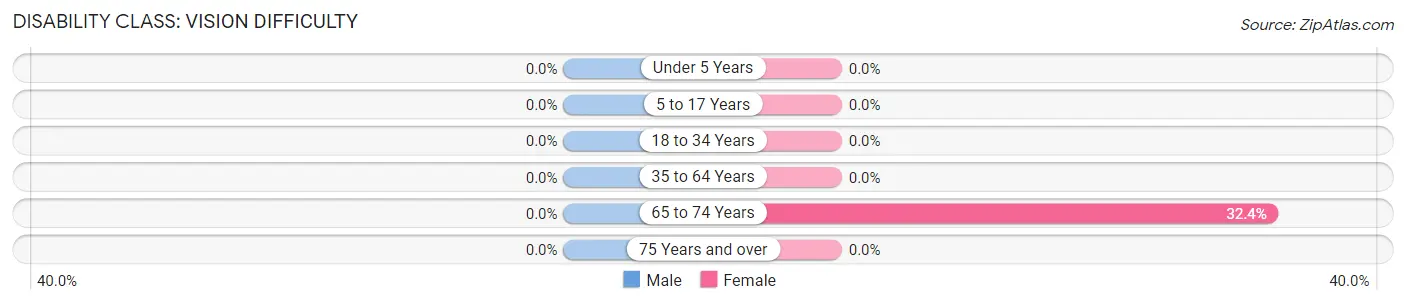
| Age Bracket | Male | Female |
| Under 5 Years | 0 (0.0%) | 0 (0.0%) |
| 5 to 17 Years | 0 (0.0%) | 0 (0.0%) |
| 18 to 34 Years | 0 (0.0%) | 0 (0.0%) |
| 35 to 64 Years | 0 (0.0%) | 0 (0.0%) |
| 65 to 74 Years | 0 (0.0%) | 12 (32.4%) |
| 75 Years and over | 0 (0.0%) | 0 (0.0%) |
Disability Class: Cognitive Difficulty
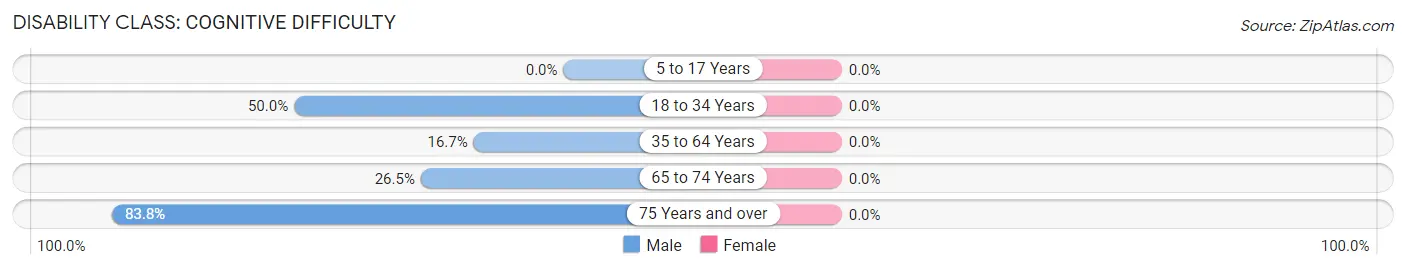
| Age Bracket | Male | Female |
| 5 to 17 Years | 0 (0.0%) | 0 (0.0%) |
| 18 to 34 Years | 2 (50.0%) | 0 (0.0%) |
| 35 to 64 Years | 14 (16.7%) | 0 (0.0%) |
| 65 to 74 Years | 9 (26.5%) | 0 (0.0%) |
| 75 Years and over | 31 (83.8%) | 0 (0.0%) |
Disability Class: Ambulatory Difficulty
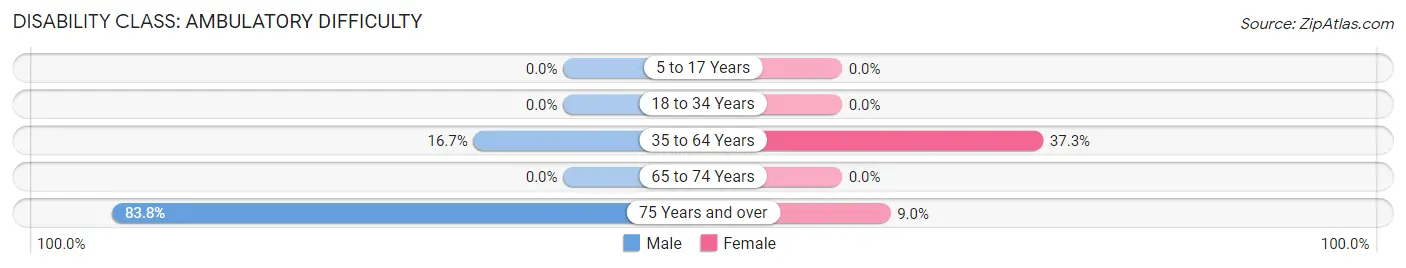
| Age Bracket | Male | Female |
| 5 to 17 Years | 0 (0.0%) | 0 (0.0%) |
| 18 to 34 Years | 0 (0.0%) | 0 (0.0%) |
| 35 to 64 Years | 14 (16.7%) | 81 (37.3%) |
| 65 to 74 Years | 0 (0.0%) | 0 (0.0%) |
| 75 Years and over | 31 (83.8%) | 8 (9.0%) |
Disability Class: Self-Care Difficulty
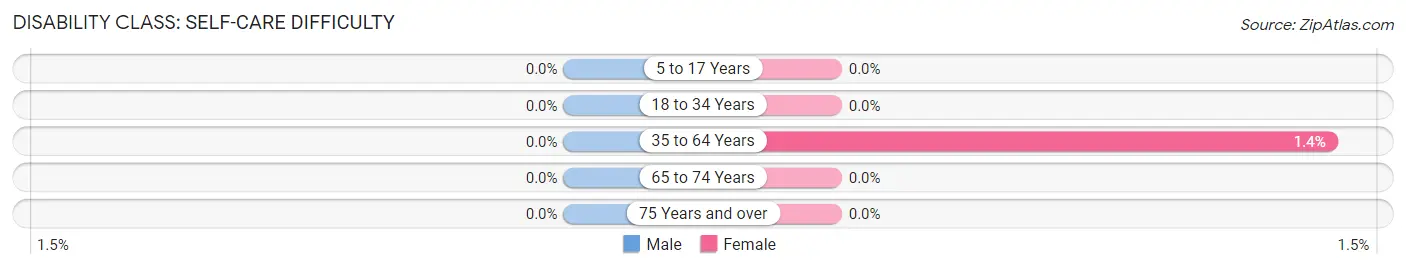
| Age Bracket | Male | Female |
| 5 to 17 Years | 0 (0.0%) | 0 (0.0%) |
| 18 to 34 Years | 0 (0.0%) | 0 (0.0%) |
| 35 to 64 Years | 0 (0.0%) | 3 (1.4%) |
| 65 to 74 Years | 0 (0.0%) | 0 (0.0%) |
| 75 Years and over | 0 (0.0%) | 0 (0.0%) |
Technology Access in Lake Medina Shores
Computing Device Access in Lake Medina Shores
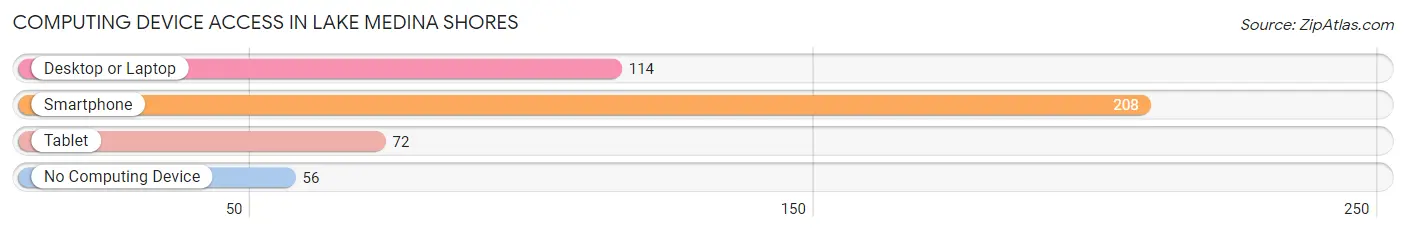
| Device Type | # Households | % Households |
| Desktop or Laptop | 114 | 43.2% |
| Smartphone | 208 | 78.8% |
| Tablet | 72 | 27.3% |
| No Computing Device | 56 | 21.2% |
| Total | 264 | 100.0% |
Internet Access in Lake Medina Shores
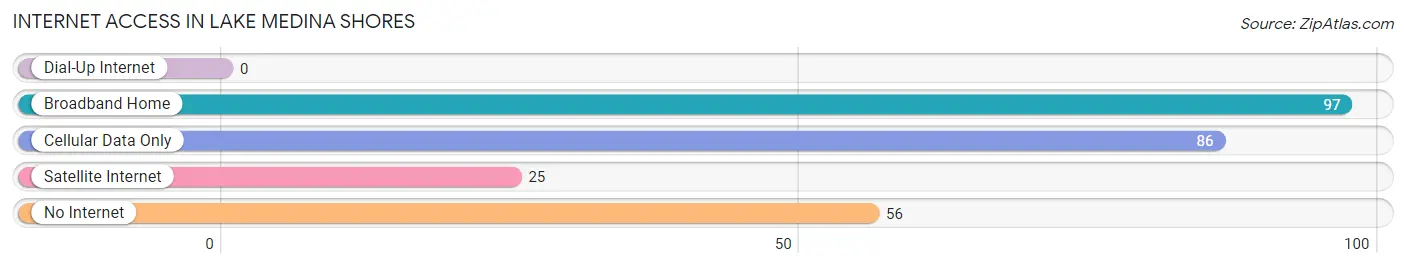
| Internet Type | # Households | % Households |
| Dial-Up Internet | 0 | 0.0% |
| Broadband Home | 97 | 36.7% |
| Cellular Data Only | 86 | 32.6% |
| Satellite Internet | 25 | 9.5% |
| No Internet | 56 | 21.2% |
| Total | 264 | 100.0% |
Lake Medina Shores Summary
Medina Lake Shores is a small town located in Bandera County, Texas. It is situated on the shores of Medina Lake, a reservoir created by the Medina Dam. The town is located about 30 miles northwest of San Antonio and is part of the San Antonio–New Braunfels Metropolitan Statistical Area.
History
The area around Medina Lake was first settled in the late 1800s by German and Czech immigrants. The town of Medina Lake Shores was established in the early 1900s and was originally known as “The Shores”. The town was named after the lake, which was named after the nearby Medina River.
The town grew slowly over the years, but it was not until the 1950s that it began to experience significant growth. This was due to the construction of the Medina Dam, which created the lake and provided a reliable source of water for the area. The dam was completed in 1953 and the lake was filled by 1955.
The town experienced a boom in the 1960s and 1970s as the lake became a popular destination for recreational activities such as fishing, boating, and swimming. The town also became a popular retirement destination for those looking to escape the hustle and bustle of the city.
Geography
Medina Lake Shores is located in Bandera County, Texas. It is situated on the shores of Medina Lake, a reservoir created by the Medina Dam. The lake covers an area of approximately 8,000 acres and is the largest lake in the county.
The town is located about 30 miles northwest of San Antonio and is part of the San Antonio–New Braunfels Metropolitan Statistical Area. The town is situated in a rural area and is surrounded by rolling hills and farmland.
Economy
The economy of Medina Lake Shores is largely based on tourism and recreation. The lake is a popular destination for fishing, boating, and swimming. The town also has several restaurants, bars, and other businesses catering to tourists.
In addition, the town is home to several small businesses, including a grocery store, a hardware store, and a gas station. The town also has a post office and a library.
Demographics
As of the 2010 census, the population of Medina Lake Shores was 1,845. The racial makeup of the town was 94.3% White, 0.7% African American, 0.3% Native American, 0.2% Asian, 0.1% Pacific Islander, 2.7% from other races, and 1.9% from two or more races. Hispanic or Latino of any race were 8.2% of the population.
The median household income in Medina Lake Shores was $41,250, and the median family income was $45,000. The per capita income was $19,945. About 11.2% of families and 13.2% of the population were below the poverty line, including 17.2% of those under age 18 and 8.3% of those age 65 or over.
Common Questions
What is Per Capita Income in Lake Medina Shores?
Per Capita income in Lake Medina Shores is $31,086.
What is the Median Household income in Lake Medina Shores?
Median Household Income in Lake Medina Shores is $56,200.
What is Inequality or Gini Index in Lake Medina Shores?
Inequality or Gini Index in Lake Medina Shores is 0.36.
What is the Total Population of Lake Medina Shores?
Total Population of Lake Medina Shores is 532.
What is the Total Male Population of Lake Medina Shores?
Total Male Population of Lake Medina Shores is 166.
What is the Total Female Population of Lake Medina Shores?
Total Female Population of Lake Medina Shores is 366.
What is the Ratio of Males per 100 Females in Lake Medina Shores?
There are 45.36 Males per 100 Females in Lake Medina Shores.
What is the Ratio of Females per 100 Males in Lake Medina Shores?
There are 220.48 Females per 100 Males in Lake Medina Shores.
What is the Median Population Age in Lake Medina Shores?
Median Population Age in Lake Medina Shores is 58.5 Years.
What is the Average Family Size in Lake Medina Shores
Average Family Size in Lake Medina Shores is 2.3 People.
What is the Average Household Size in Lake Medina Shores
Average Household Size in Lake Medina Shores is 2.0 People.
How Large is the Labor Force in Lake Medina Shores?
There are 152 People in the Labor Forcein in Lake Medina Shores.
What is the Percentage of People in the Labor Force in Lake Medina Shores?
29.0% of People are in the Labor Force in Lake Medina Shores.