Zip Codes with the Highest Percentage of Population with a Degree in Science and Engineering in San Antonio, TX
RELATED REPORTS & OPTIONS
Science and Engineering
San Antonio
Compare Zip Codes
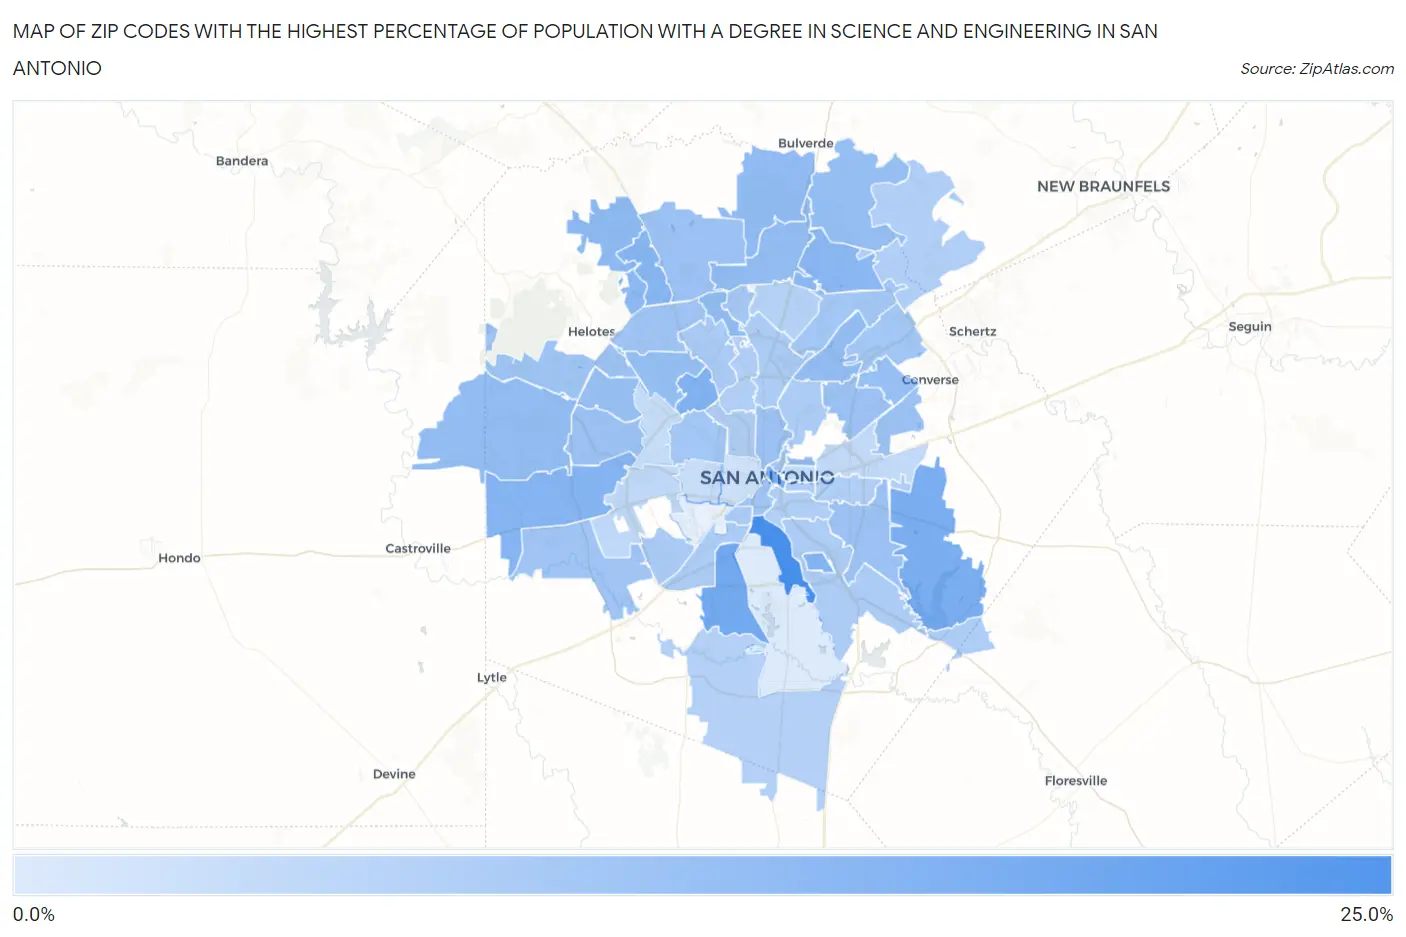
Map of Zip Codes with the Highest Percentage of Population with a Degree in Science and Engineering in San Antonio
1.6%
24.1%
Zip Codes with the Highest Percentage of Population with a Degree in Science and Engineering in San Antonio, TX
| Zip Code | % Graduates | vs State | vs National | |
| 1. | 78214 | 24.1% | 9.5%(+14.6)#63 | 9.8%(+14.4)#2,128 |
| 2. | 78224 | 17.1% | 9.5%(+7.57)#181 | 9.8%(+7.31)#4,874 |
| 3. | 78263 | 15.9% | 9.5%(+6.41)#223 | 9.8%(+6.15)#5,784 |
| 4. | 78205 | 15.9% | 9.5%(+6.37)#225 | 9.8%(+6.11)#5,813 |
| 5. | 78229 | 15.0% | 9.5%(+5.50)#259 | 9.8%(+5.24)#6,686 |
| 6. | 78235 | 14.6% | 9.5%(+5.06)#290 | 9.8%(+4.80)#7,151 |
| 7. | 78245 | 14.1% | 9.5%(+4.58)#317 | 9.8%(+4.32)#7,730 |
| 8. | 78256 | 13.9% | 9.5%(+4.41)#325 | 9.8%(+4.15)#7,932 |
| 9. | 78259 | 13.5% | 9.5%(+3.96)#355 | 9.8%(+3.70)#8,517 |
| 10. | 78255 | 13.0% | 9.5%(+3.44)#394 | 9.8%(+3.18)#9,301 |
| 11. | 78260 | 12.6% | 9.5%(+3.03)#432 | 9.8%(+2.77)#9,942 |
| 12. | 78231 | 12.5% | 9.5%(+2.96)#437 | 9.8%(+2.70)#10,081 |
| 13. | 78217 | 12.3% | 9.5%(+2.77)#455 | 9.8%(+2.51)#10,378 |
| 14. | 78258 | 12.1% | 9.5%(+2.63)#469 | 9.8%(+2.37)#10,638 |
| 15. | 78208 | 12.1% | 9.5%(+2.62)#470 | 9.8%(+2.36)#10,651 |
| 16. | 78253 | 12.1% | 9.5%(+2.62)#471 | 9.8%(+2.36)#10,652 |
| 17. | 78240 | 11.9% | 9.5%(+2.41)#493 | 9.8%(+2.15)#11,008 |
| 18. | 78261 | 11.6% | 9.5%(+2.09)#522 | 9.8%(+1.83)#11,629 |
| 19. | 78239 | 11.4% | 9.5%(+1.92)#536 | 9.8%(+1.66)#11,951 |
| 20. | 78250 | 11.4% | 9.5%(+1.89)#540 | 9.8%(+1.63)#12,010 |
| 21. | 78251 | 11.2% | 9.5%(+1.67)#567 | 9.8%(+1.41)#12,449 |
| 22. | 78244 | 11.1% | 9.5%(+1.61)#573 | 9.8%(+1.35)#12,554 |
| 23. | 78222 | 11.1% | 9.5%(+1.58)#580 | 9.8%(+1.32)#12,676 |
| 24. | 78218 | 11.0% | 9.5%(+1.50)#596 | 9.8%(+1.24)#12,825 |
| 25. | 78257 | 10.9% | 9.5%(+1.37)#610 | 9.8%(+1.11)#13,102 |
| 26. | 78212 | 10.6% | 9.5%(+1.12)#631 | 9.8%(+0.864)#13,643 |
| 27. | 78254 | 10.4% | 9.5%(+0.877)#662 | 9.8%(+0.617)#14,192 |
| 28. | 78249 | 10.2% | 9.5%(+0.629)#686 | 9.8%(+0.370)#14,697 |
| 29. | 78252 | 10.0% | 9.5%(+0.462)#709 | 9.8%(+0.202)#15,067 |
| 30. | 78204 | 10.0% | 9.5%(+0.441)#714 | 9.8%(+0.182)#15,115 |
| 31. | 78247 | 9.9% | 9.5%(+0.361)#734 | 9.8%(+0.102)#15,303 |
| 32. | 78233 | 9.8% | 9.5%(+0.231)#744 | 9.8%(-0.028)#15,581 |
| 33. | 78228 | 9.7% | 9.5%(+0.172)#755 | 9.8%(-0.088)#15,720 |
| 34. | 78215 | 9.5% | 9.5%(-0.009)#784 | 9.8%(-0.269)#16,138 |
| 35. | 78248 | 9.4% | 9.5%(-0.138)#803 | 9.8%(-0.397)#16,431 |
| 36. | 78230 | 8.8% | 9.5%(-0.687)#890 | 9.8%(-0.947)#17,700 |
| 37. | 78242 | 8.8% | 9.5%(-0.688)#891 | 9.8%(-0.947)#17,701 |
| 38. | 78225 | 8.7% | 9.5%(-0.779)#906 | 9.8%(-1.04)#17,927 |
| 39. | 78209 | 8.5% | 9.5%(-1.04)#935 | 9.8%(-1.30)#18,500 |
| 40. | 78211 | 8.5% | 9.5%(-1.07)#939 | 9.8%(-1.33)#18,570 |
| 41. | 78216 | 8.4% | 9.5%(-1.08)#942 | 9.8%(-1.34)#18,607 |
| 42. | 78223 | 8.3% | 9.5%(-1.22)#964 | 9.8%(-1.48)#18,977 |
| 43. | 78201 | 8.0% | 9.5%(-1.57)#1,011 | 9.8%(-1.83)#19,738 |
| 44. | 78210 | 7.8% | 9.5%(-1.77)#1,047 | 9.8%(-2.02)#20,164 |
| 45. | 78203 | 7.7% | 9.5%(-1.81)#1,052 | 9.8%(-2.07)#20,269 |
| 46. | 78220 | 7.6% | 9.5%(-1.87)#1,063 | 9.8%(-2.13)#20,432 |
| 47. | 78266 | 7.6% | 9.5%(-1.90)#1,067 | 9.8%(-2.16)#20,486 |
| 48. | 78213 | 7.6% | 9.5%(-1.95)#1,078 | 9.8%(-2.21)#20,594 |
| 49. | 78264 | 7.4% | 9.5%(-2.15)#1,099 | 9.8%(-2.41)#20,987 |
| 50. | 78232 | 6.9% | 9.5%(-2.61)#1,154 | 9.8%(-2.87)#21,866 |
| 51. | 78227 | 5.8% | 9.5%(-3.74)#1,300 | 9.8%(-4.00)#23,771 |
| 52. | 78219 | 5.6% | 9.5%(-3.96)#1,316 | 9.8%(-4.22)#24,041 |
| 53. | 78202 | 5.2% | 9.5%(-4.36)#1,360 | 9.8%(-4.62)#24,556 |
| 54. | 78238 | 4.7% | 9.5%(-4.83)#1,401 | 9.8%(-5.09)#25,083 |
| 55. | 78237 | 4.5% | 9.5%(-5.00)#1,418 | 9.8%(-5.25)#25,270 |
| 56. | 78207 | 3.5% | 9.5%(-6.01)#1,469 | 9.8%(-6.27)#26,122 |
| 57. | 78221 | 1.6% | 9.5%(-7.92)#1,539 | 9.8%(-8.18)#27,164 |
1
Common Questions
What are the Top 10 Zip Codes with the Highest Percentage of Population with a Degree in Science and Engineering in San Antonio, TX?
Top 10 Zip Codes with the Highest Percentage of Population with a Degree in Science and Engineering in San Antonio, TX are:
What zip code has the Highest Percentage of Population with a Degree in Science and Engineering in San Antonio, TX?
78214 has the Highest Percentage of Population with a Degree in Science and Engineering in San Antonio, TX with 24.1%.
What is the Percentage of Population with a Degree in Science and Engineering in San Antonio, TX?
Percentage of Population with a Degree in Science and Engineering in San Antonio is 10.5%.
What is the Percentage of Population with a Degree in Science and Engineering in Texas?
Percentage of Population with a Degree in Science and Engineering in Texas is 9.5%.
What is the Percentage of Population with a Degree in Science and Engineering in the United States?
Percentage of Population with a Degree in Science and Engineering in the United States is 9.8%.