Dalhart, TX Map & Demographics
Dalhart Map
Dalhart Overview
$30,162
PER CAPITA INCOME
$89,309
AVG FAMILY INCOME
$75,000
AVG HOUSEHOLD INCOME
54.4%
WAGE / INCOME GAP [ % ]
45.6¢/ $1
WAGE / INCOME GAP [ $ ]
0.35
INEQUALITY / GINI INDEX
8,013
TOTAL POPULATION
4,040
MALE POPULATION
3,973
FEMALE POPULATION
101.69
MALES / 100 FEMALES
98.34
FEMALES / 100 MALES
34.7
MEDIAN AGE
3.4
AVG FAMILY SIZE
2.8
AVG HOUSEHOLD SIZE
4,347
LABOR FORCE [ PEOPLE ]
75.5%
PERCENT IN LABOR FORCE
2.2%
UNEMPLOYMENT RATE
Dalhart Zip Codes
Dalhart Area Codes
Income in Dalhart
Income Overview in Dalhart
Per Capita Income in Dalhart is $30,162, while median incomes of families and households are $89,309 and $75,000 respectively.
| Characteristic | Number | Measure |
| Per Capita Income | 8,013 | $30,162 |
| Median Family Income | 1,973 | $89,309 |
| Mean Family Income | 1,973 | $102,387 |
| Median Household Income | 2,820 | $75,000 |
| Mean Household Income | 2,820 | $87,436 |
| Income Deficit | 1,973 | $0 |
| Wage / Income Gap (%) | 8,013 | 54.41% |
| Wage / Income Gap ($) | 8,013 | 45.59¢ per $1 |
| Gini / Inequality Index | 8,013 | 0.35 |
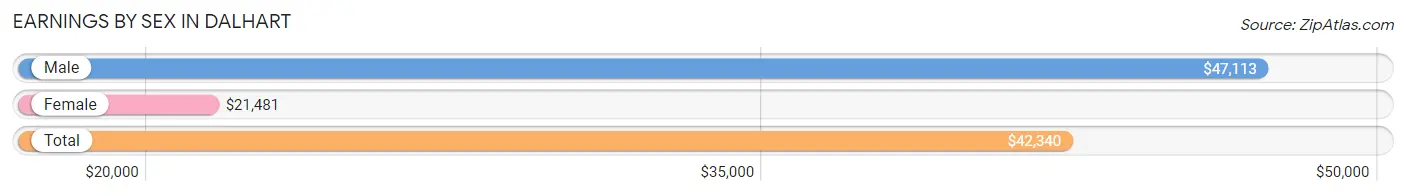
Earnings by Sex in Dalhart
Average Earnings in Dalhart are $42,340, $47,113 for men and $21,481 for women, a difference of 54.4%.
| Sex | Number | Average Earnings |
| Male | 2,677 (59.1%) | $47,113 |
| Female | 1,855 (40.9%) | $21,481 |
| Total | 4,532 (100.0%) | $42,340 |
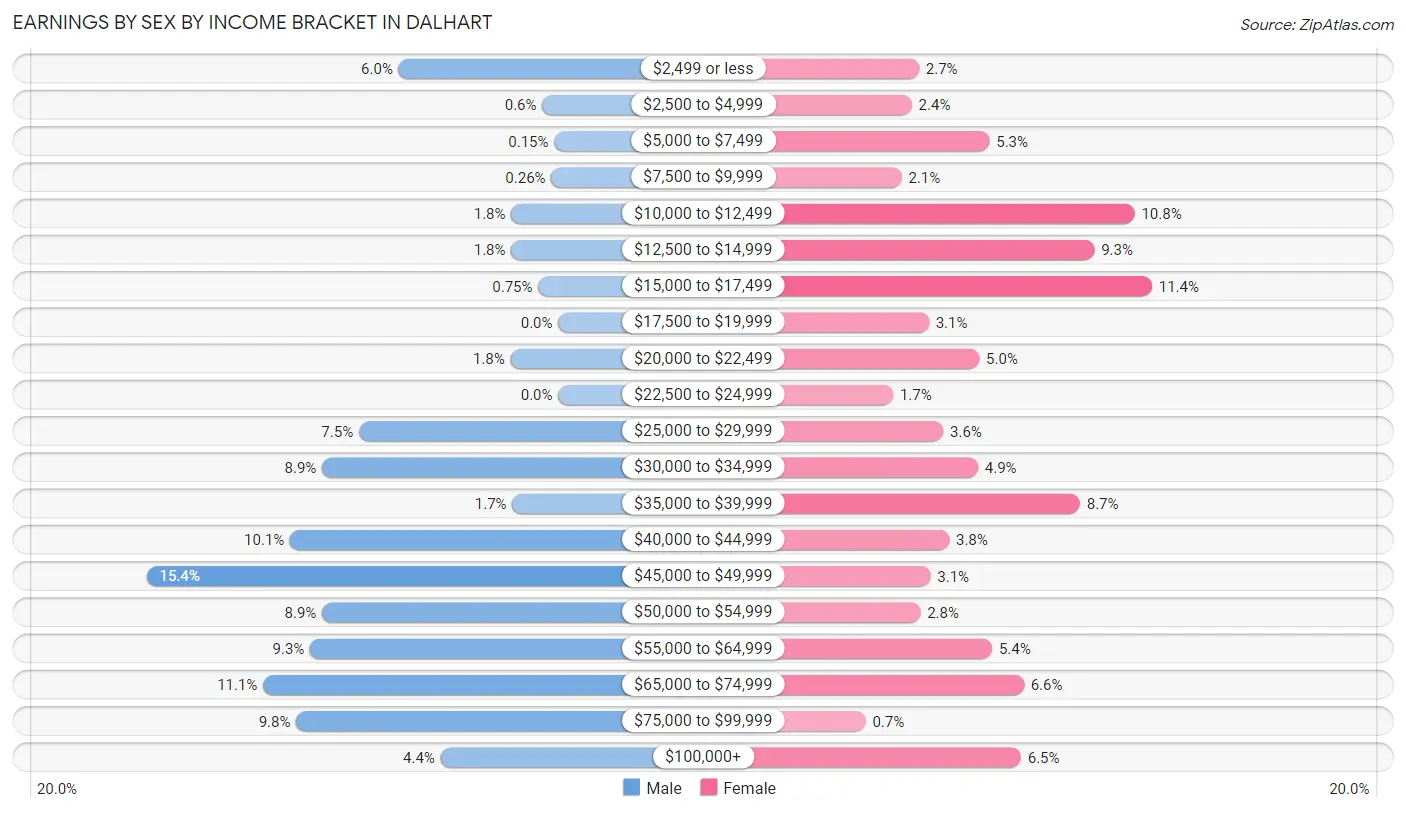
Earnings by Sex by Income Bracket in Dalhart
The most common earnings brackets in Dalhart are $45,000 to $49,999 for men (413 | 15.4%) and $15,000 to $17,499 for women (212 | 11.4%).
| Income | Male | Female |
| $2,499 or less | 160 (6.0%) | 50 (2.7%) |
| $2,500 to $4,999 | 16 (0.6%) | 45 (2.4%) |
| $5,000 to $7,499 | 4 (0.2%) | 99 (5.3%) |
| $7,500 to $9,999 | 7 (0.3%) | 38 (2.1%) |
| $10,000 to $12,499 | 47 (1.8%) | 200 (10.8%) |
| $12,500 to $14,999 | 47 (1.8%) | 172 (9.3%) |
| $15,000 to $17,499 | 20 (0.7%) | 212 (11.4%) |
| $17,500 to $19,999 | 0 (0.0%) | 57 (3.1%) |
| $20,000 to $22,499 | 48 (1.8%) | 92 (5.0%) |
| $22,500 to $24,999 | 0 (0.0%) | 32 (1.7%) |
| $25,000 to $29,999 | 200 (7.5%) | 67 (3.6%) |
| $30,000 to $34,999 | 237 (8.8%) | 91 (4.9%) |
| $35,000 to $39,999 | 46 (1.7%) | 162 (8.7%) |
| $40,000 to $44,999 | 269 (10.1%) | 71 (3.8%) |
| $45,000 to $49,999 | 413 (15.4%) | 58 (3.1%) |
| $50,000 to $54,999 | 237 (8.8%) | 51 (2.8%) |
| $55,000 to $64,999 | 249 (9.3%) | 101 (5.4%) |
| $65,000 to $74,999 | 296 (11.1%) | 123 (6.6%) |
| $75,000 to $99,999 | 263 (9.8%) | 13 (0.7%) |
| $100,000+ | 118 (4.4%) | 121 (6.5%) |
| Total | 2,677 (100.0%) | 1,855 (100.0%) |
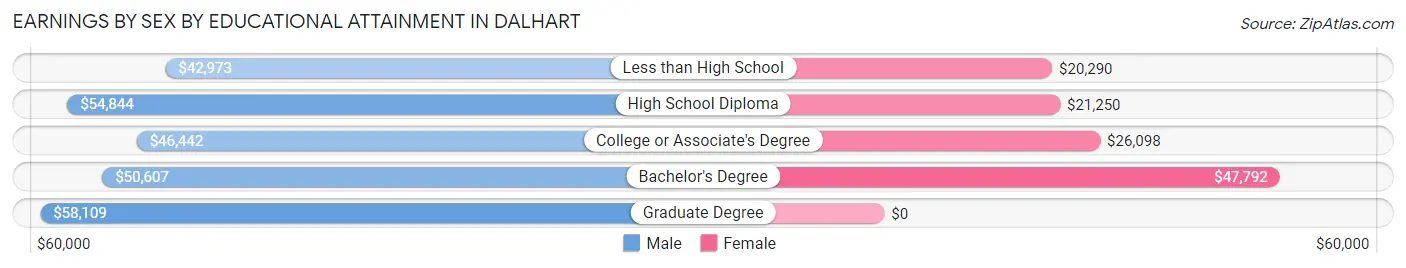
Earnings by Sex by Educational Attainment in Dalhart
Average earnings in Dalhart are $48,229 for men and $27,073 for women, a difference of 43.9%. Men with an educational attainment of graduate degree enjoy the highest average annual earnings of $58,109, while those with less than high school education earn the least with $42,973. Women with an educational attainment of bachelor's degree earn the most with the average annual earnings of $47,792, while those with less than high school education have the smallest earnings of $20,290.
| Educational Attainment | Male Income | Female Income |
| Less than High School | $42,973 | $20,290 |
| High School Diploma | $54,844 | $21,250 |
| College or Associate's Degree | $46,442 | $26,098 |
| Bachelor's Degree | $50,607 | $47,792 |
| Graduate Degree | $58,109 | $0 |
| Total | $48,229 | $27,073 |
Family Income in Dalhart
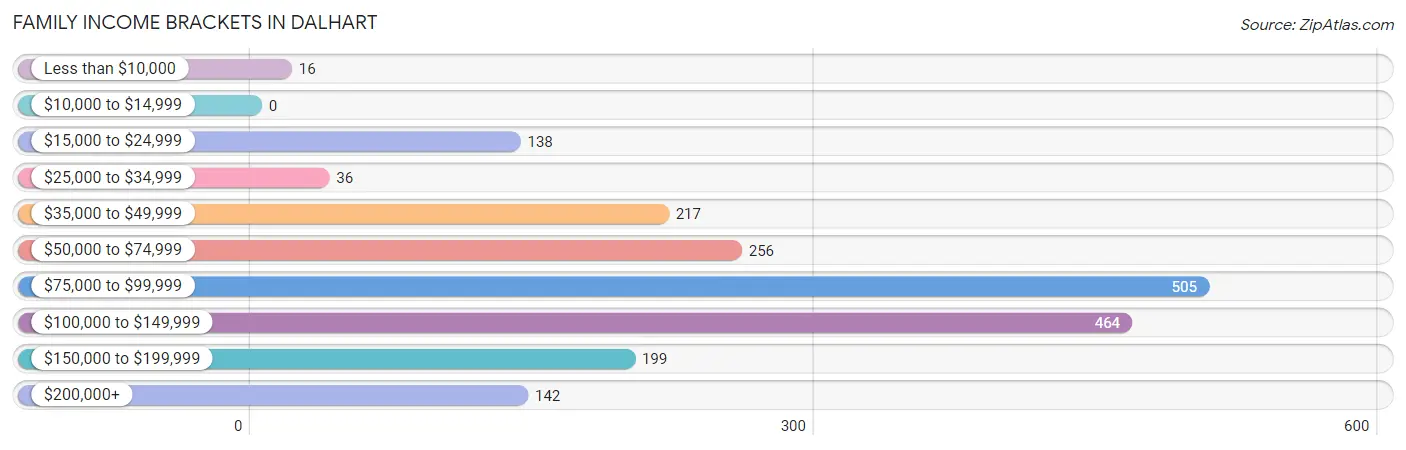
Family Income Brackets in Dalhart
According to the Dalhart family income data, there are 505 families falling into the $75,000 to $99,999 income range, which is the most common income bracket and makes up 25.6% of all families.
| Income Bracket | # Families | % Families |
| Less than $10,000 | 16 | 0.8% |
| $10,000 to $14,999 | 0 | 0.0% |
| $15,000 to $24,999 | 138 | 7.0% |
| $25,000 to $34,999 | 36 | 1.8% |
| $35,000 to $49,999 | 217 | 11.0% |
| $50,000 to $74,999 | 256 | 13.0% |
| $75,000 to $99,999 | 505 | 25.6% |
| $100,000 to $149,999 | 464 | 23.5% |
| $150,000 to $199,999 | 199 | 10.1% |
| $200,000+ | 142 | 7.2% |
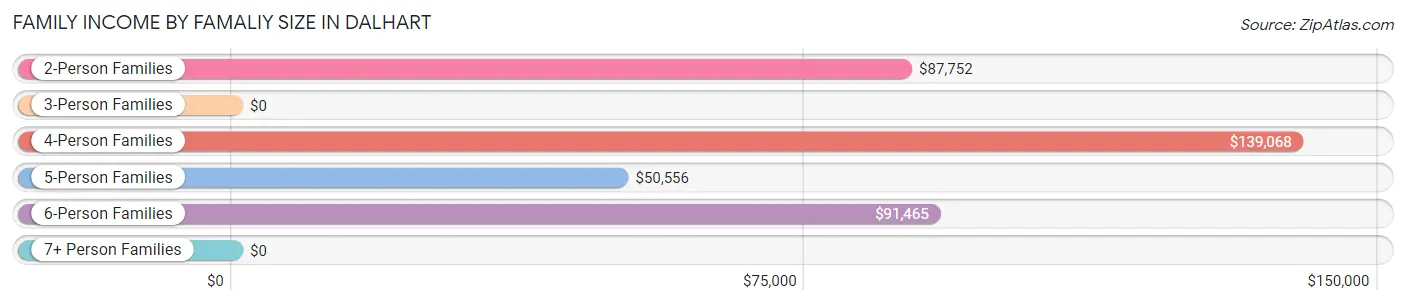
Family Income by Famaliy Size in Dalhart
4-person families (450 | 22.8%) account for the highest median family income in Dalhart with $139,068 per family, while 2-person families (990 | 50.2%) have the highest median income of $43,876 per family member.
| Income Bracket | # Families | Median Income |
| 2-Person Families | 990 (50.2%) | $87,752 |
| 3-Person Families | 61 (3.1%) | $0 |
| 4-Person Families | 450 (22.8%) | $139,068 |
| 5-Person Families | 312 (15.8%) | $50,556 |
| 6-Person Families | 135 (6.8%) | $91,465 |
| 7+ Person Families | 25 (1.3%) | $0 |
| Total | 1,973 (100.0%) | $89,309 |
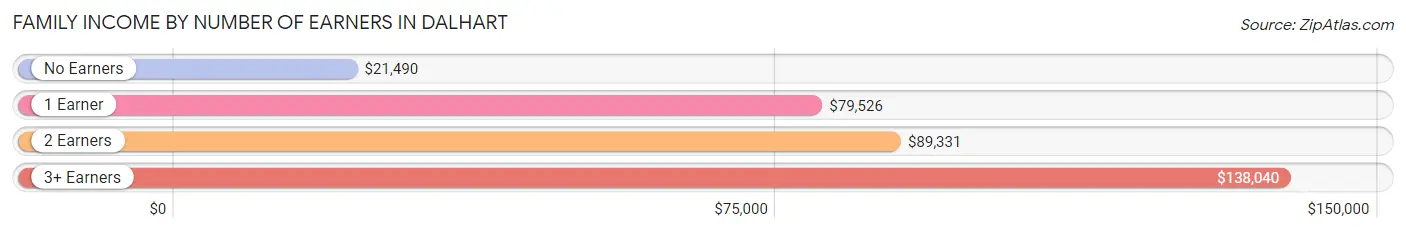
Family Income by Number of Earners in Dalhart
The median family income in Dalhart is $89,309, with families comprising 3+ earners (301) having the highest median family income of $138,040, while families with no earners (92) have the lowest median family income of $21,490, accounting for 15.3% and 4.7% of families, respectively.
| Number of Earners | # Families | Median Income |
| No Earners | 92 (4.7%) | $21,490 |
| 1 Earner | 491 (24.9%) | $79,526 |
| 2 Earners | 1,089 (55.2%) | $89,331 |
| 3+ Earners | 301 (15.3%) | $138,040 |
| Total | 1,973 (100.0%) | $89,309 |
Household Income in Dalhart
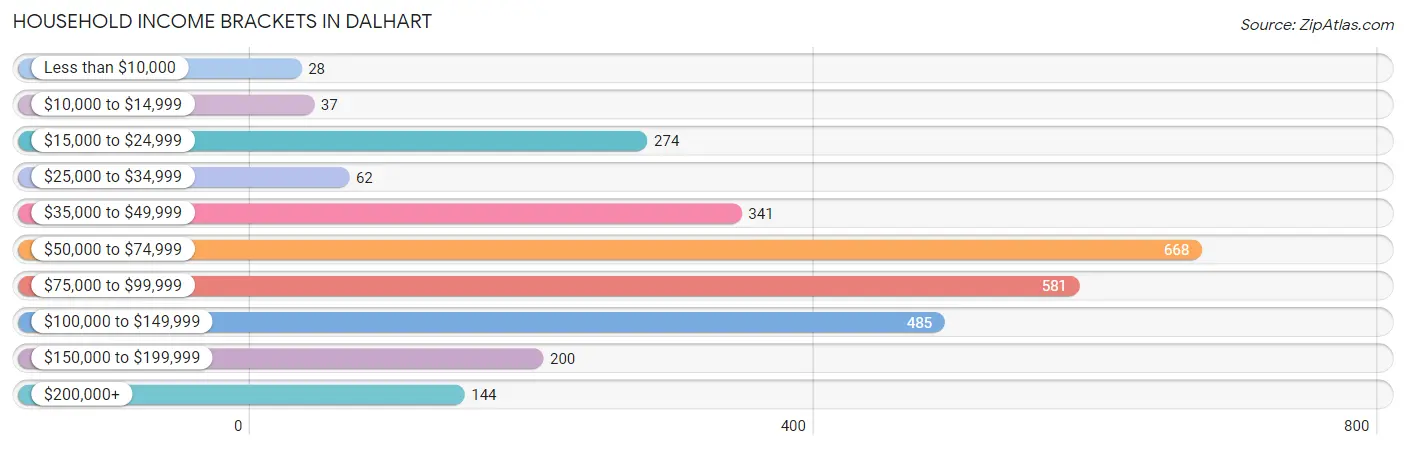
Household Income Brackets in Dalhart
With 668 households falling in the category, the $50,000 to $74,999 income range is the most frequent in Dalhart, accounting for 23.7% of all households. In contrast, only 28 households (1.0%) fall into the less than $10,000 income bracket, making it the least populous group.
| Income Bracket | # Households | % Households |
| Less than $10,000 | 28 | 1.0% |
| $10,000 to $14,999 | 37 | 1.3% |
| $15,000 to $24,999 | 274 | 9.7% |
| $25,000 to $34,999 | 62 | 2.2% |
| $35,000 to $49,999 | 341 | 12.1% |
| $50,000 to $74,999 | 668 | 23.7% |
| $75,000 to $99,999 | 581 | 20.6% |
| $100,000 to $149,999 | 485 | 17.2% |
| $150,000 to $199,999 | 200 | 7.1% |
| $200,000+ | 144 | 5.1% |
Household Income by Householder Age in Dalhart
The median household income in Dalhart is $75,000, with the highest median household income of $77,803 found in the 45 to 64 years age bracket for the primary householder. A total of 928 households (32.9%) fall into this category. Meanwhile, the 65+ years age bracket for the primary householder has the lowest median household income of $71,319, with 701 households (24.9%) in this group.
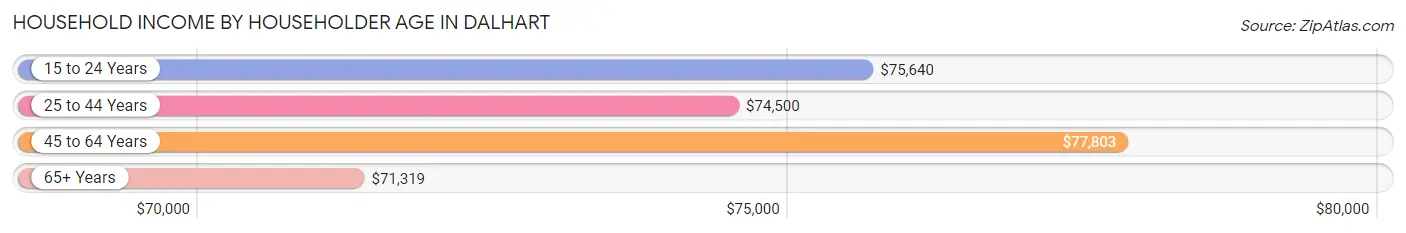
| Income Bracket | # Households | Median Income |
| 15 to 24 Years | 61 (2.2%) | $75,640 |
| 25 to 44 Years | 1,130 (40.1%) | $74,500 |
| 45 to 64 Years | 928 (32.9%) | $77,803 |
| 65+ Years | 701 (24.9%) | $71,319 |
| Total | 2,820 (100.0%) | $75,000 |
Poverty in Dalhart
Income Below Poverty by Sex and Age in Dalhart
With 7.4% poverty level for males and 9.8% for females among the residents of Dalhart, 12 to 14 year old males and under 5 year old females are the most vulnerable to poverty, with 52 males (38.8%) and 77 females (24.1%) in their respective age groups living below the poverty level.
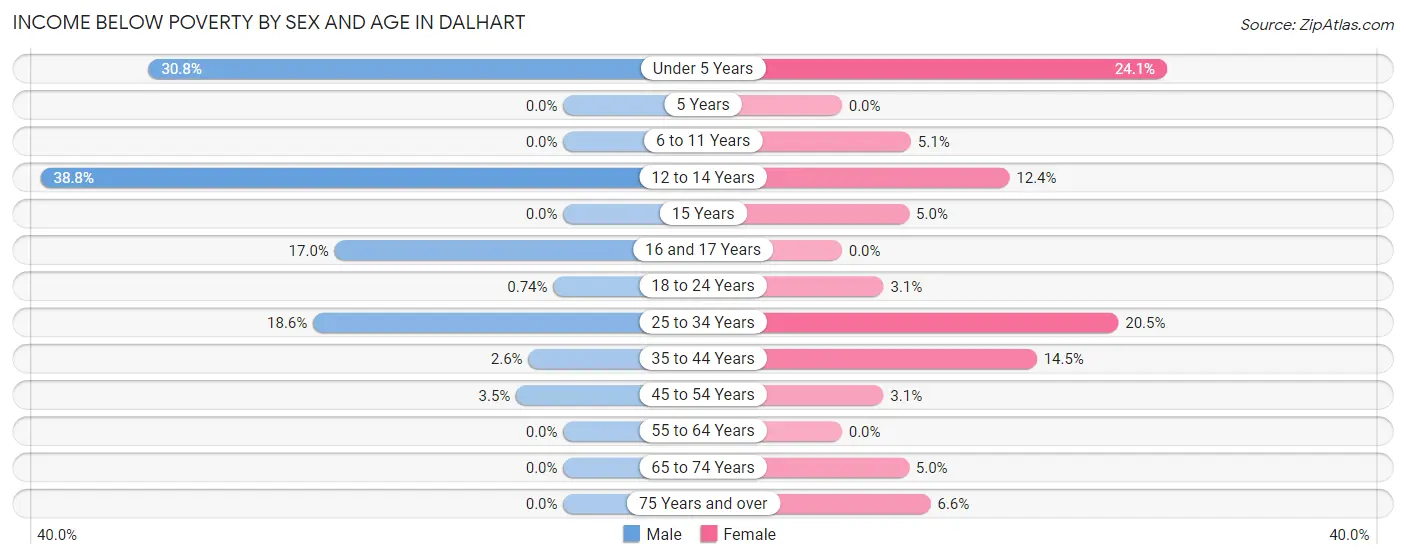
| Age Bracket | Male | Female |
| Under 5 Years | 69 (30.8%) | 77 (24.1%) |
| 5 Years | 0 (0.0%) | 0 (0.0%) |
| 6 to 11 Years | 0 (0.0%) | 26 (5.1%) |
| 12 to 14 Years | 52 (38.8%) | 28 (12.4%) |
| 15 Years | 0 (0.0%) | 6 (5.0%) |
| 16 and 17 Years | 18 (17.0%) | 0 (0.0%) |
| 18 to 24 Years | 1 (0.7%) | 8 (3.1%) |
| 25 to 34 Years | 123 (18.6%) | 116 (20.5%) |
| 35 to 44 Years | 15 (2.6%) | 68 (14.5%) |
| 45 to 54 Years | 17 (3.5%) | 12 (3.1%) |
| 55 to 64 Years | 0 (0.0%) | 0 (0.0%) |
| 65 to 74 Years | 0 (0.0%) | 14 (5.0%) |
| 75 Years and over | 0 (0.0%) | 18 (6.6%) |
| Total | 295 (7.4%) | 373 (9.8%) |
Income Above Poverty by Sex and Age in Dalhart
According to the poverty statistics in Dalhart, males aged 5 years and females aged 16 and 17 years are the age groups that are most secure financially, with 100.0% of males and 100.0% of females in these age groups living above the poverty line.
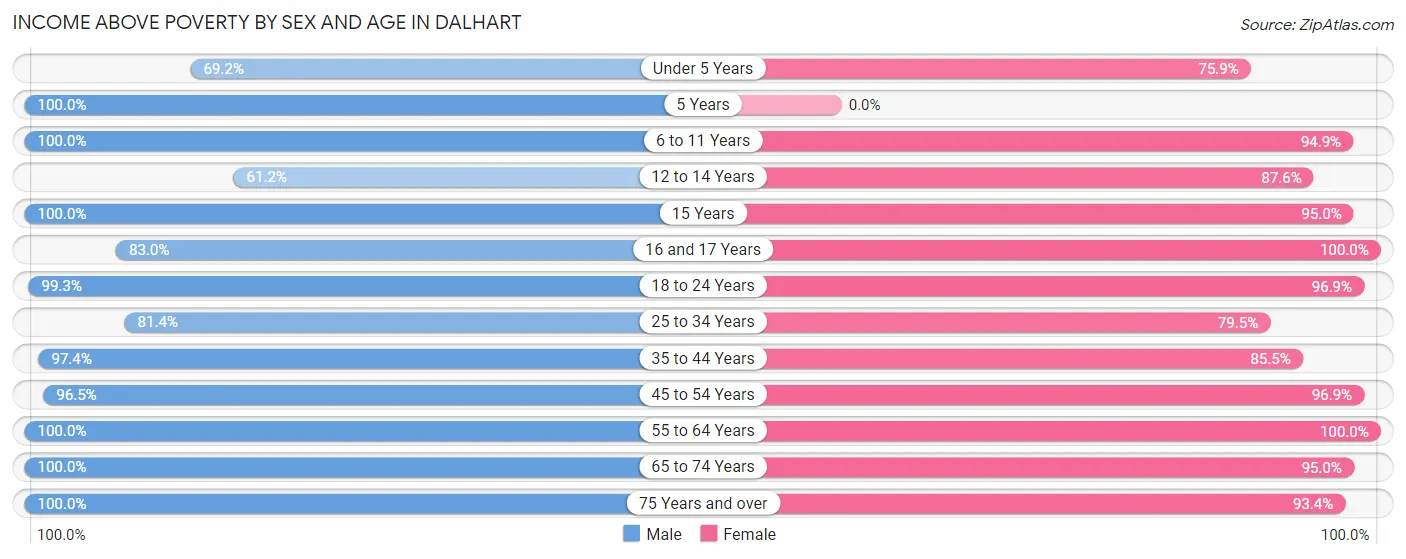
| Age Bracket | Male | Female |
| Under 5 Years | 155 (69.2%) | 242 (75.9%) |
| 5 Years | 8 (100.0%) | 0 (0.0%) |
| 6 to 11 Years | 586 (100.0%) | 481 (94.9%) |
| 12 to 14 Years | 82 (61.2%) | 197 (87.6%) |
| 15 Years | 12 (100.0%) | 114 (95.0%) |
| 16 and 17 Years | 88 (83.0%) | 37 (100.0%) |
| 18 to 24 Years | 135 (99.3%) | 250 (96.9%) |
| 25 to 34 Years | 539 (81.4%) | 449 (79.5%) |
| 35 to 44 Years | 565 (97.4%) | 402 (85.5%) |
| 45 to 54 Years | 469 (96.5%) | 376 (96.9%) |
| 55 to 64 Years | 510 (100.0%) | 362 (100.0%) |
| 65 to 74 Years | 309 (100.0%) | 267 (95.0%) |
| 75 Years and over | 236 (100.0%) | 255 (93.4%) |
| Total | 3,694 (92.6%) | 3,432 (90.2%) |
Income Below Poverty Among Married-Couple Families in Dalhart
The poverty statistics for married-couple families in Dalhart show that 1.5% or 27 of the total 1,750 families live below the poverty line. Families with 3 or 4 children have the highest poverty rate of 4.1%, comprising of 12 families. On the other hand, families with no children have the lowest poverty rate of 0.0%, which includes 0 families.
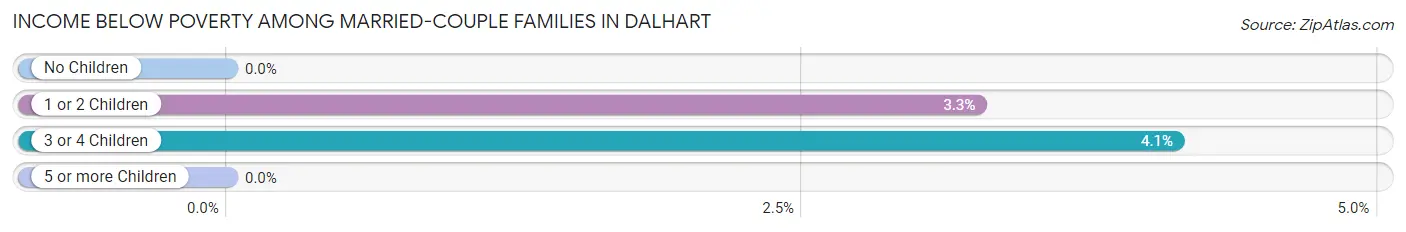
| Children | Above Poverty | Below Poverty |
| No Children | 999 (100.0%) | 0 (0.0%) |
| 1 or 2 Children | 445 (96.7%) | 15 (3.3%) |
| 3 or 4 Children | 279 (95.9%) | 12 (4.1%) |
| 5 or more Children | 0 (0.0%) | 0 (0.0%) |
| Total | 1,723 (98.5%) | 27 (1.5%) |
Income Below Poverty Among Single-Parent Households in Dalhart
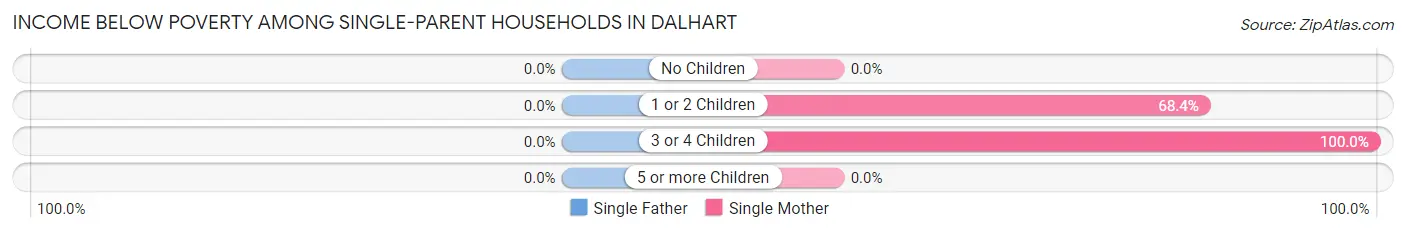
| Children | Single Father | Single Mother |
| No Children | 0 (0.0%) | 0 (0.0%) |
| 1 or 2 Children | 0 (0.0%) | 54 (68.3%) |
| 3 or 4 Children | 0 (0.0%) | 32 (100.0%) |
| 5 or more Children | 0 (0.0%) | 0 (0.0%) |
| Total | 0 (0.0%) | 86 (60.1%) |
Income Below Poverty Among Married-Couple vs Single-Parent Households in Dalhart
The poverty data for Dalhart shows that 27 of the married-couple family households (1.5%) and 86 of the single-parent households (38.6%) are living below the poverty level. Within the married-couple family households, those with 3 or 4 children have the highest poverty rate, with 12 households (4.1%) falling below the poverty line. Among the single-parent households, those with 3 or 4 children have the highest poverty rate, with 32 household (100.0%) living below poverty.
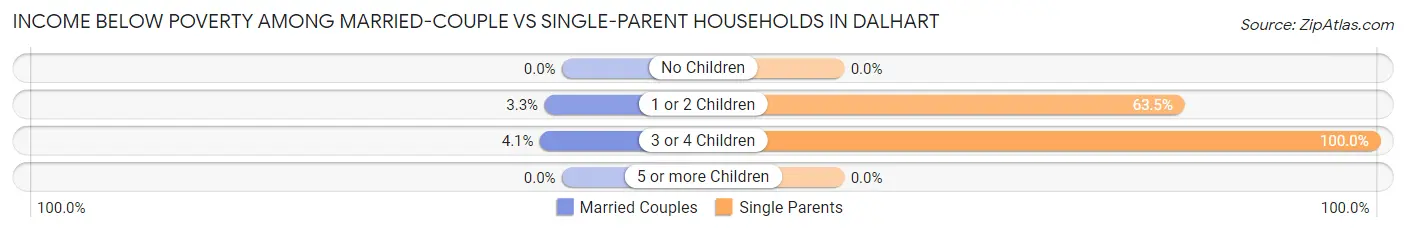
| Children | Married-Couple Families | Single-Parent Households |
| No Children | 0 (0.0%) | 0 (0.0%) |
| 1 or 2 Children | 15 (3.3%) | 54 (63.5%) |
| 3 or 4 Children | 12 (4.1%) | 32 (100.0%) |
| 5 or more Children | 0 (0.0%) | 0 (0.0%) |
| Total | 27 (1.5%) | 86 (38.6%) |
Race in Dalhart
The most populous races in Dalhart are White / Caucasian (5,691 | 71.0%), Hispanic or Latino (3,875 | 48.4%), and Two or more Races (1,279 | 16.0%).
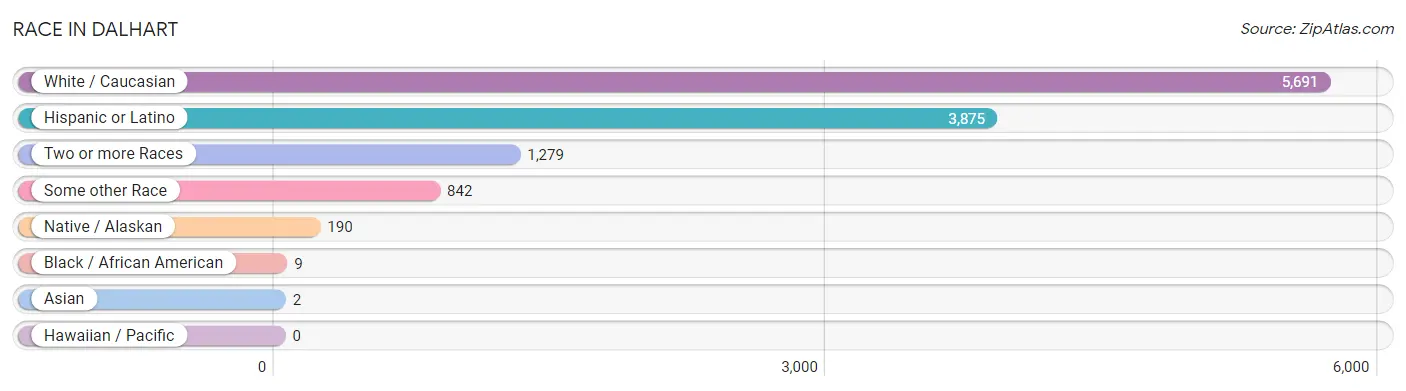
| Race | # Population | % Population |
| Asian | 2 | 0.0% |
| Black / African American | 9 | 0.1% |
| Hawaiian / Pacific | 0 | 0.0% |
| Hispanic or Latino | 3,875 | 48.4% |
| Native / Alaskan | 190 | 2.4% |
| White / Caucasian | 5,691 | 71.0% |
| Two or more Races | 1,279 | 16.0% |
| Some other Race | 842 | 10.5% |
| Total | 8,013 | 100.0% |
Ancestry in Dalhart
The most populous ancestries reported in Dalhart are Mexican (3,757 | 46.9%), German (902 | 11.3%), English (787 | 9.8%), Irish (613 | 7.6%), and American (378 | 4.7%), together accounting for 80.3% of all Dalhart residents.
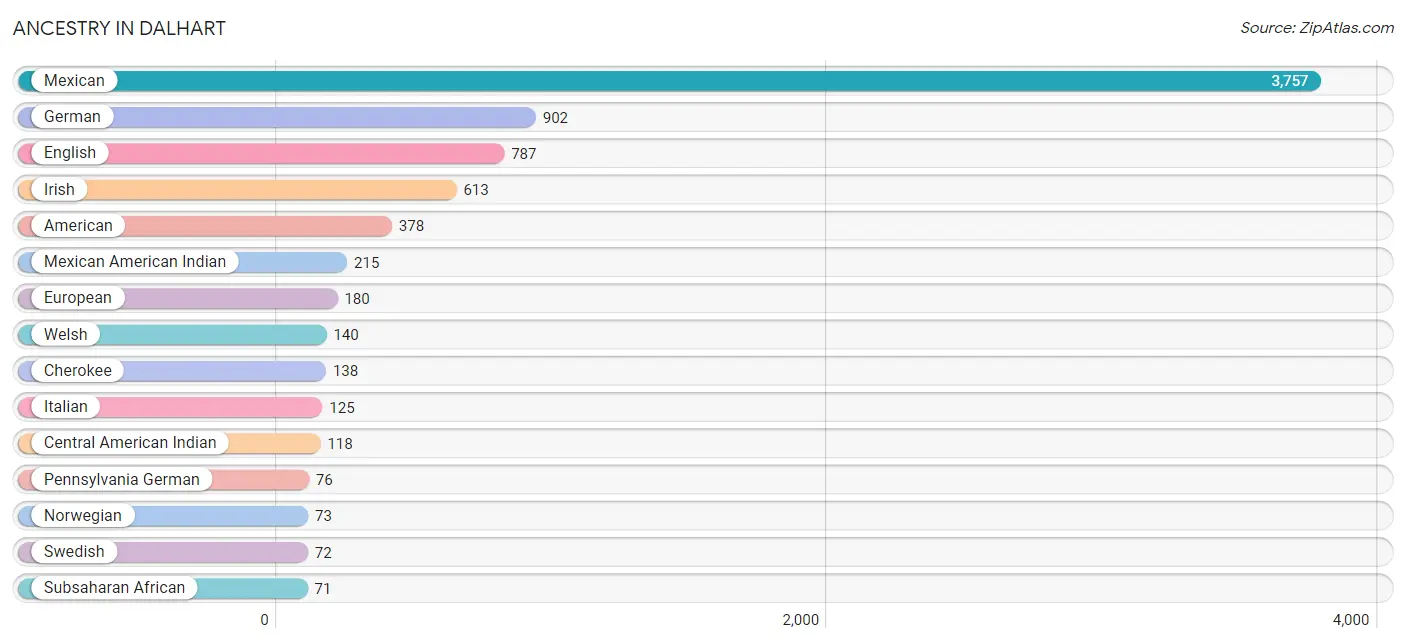
| Ancestry | # Population | % Population |
| African | 13 | 0.2% |
| American | 378 | 4.7% |
| Apache | 34 | 0.4% |
| Bhutanese | 13 | 0.2% |
| Brazilian | 44 | 0.5% |
| British | 7 | 0.1% |
| Canadian | 17 | 0.2% |
| Celtic | 15 | 0.2% |
| Central American | 19 | 0.2% |
| Central American Indian | 118 | 1.5% |
| Cherokee | 138 | 1.7% |
| Creek | 21 | 0.3% |
| Czech | 3 | 0.0% |
| Dutch | 56 | 0.7% |
| Dutch West Indian | 29 | 0.4% |
| English | 787 | 9.8% |
| European | 180 | 2.2% |
| French | 62 | 0.8% |
| German | 902 | 11.3% |
| Guatemalan | 19 | 0.2% |
| Irish | 613 | 7.6% |
| Italian | 125 | 1.6% |
| Korean | 20 | 0.3% |
| Mexican | 3,757 | 46.9% |
| Mexican American Indian | 215 | 2.7% |
| Northern European | 25 | 0.3% |
| Norwegian | 73 | 0.9% |
| Pennsylvania German | 76 | 0.9% |
| Polish | 48 | 0.6% |
| Portuguese | 2 | 0.0% |
| Scotch-Irish | 25 | 0.3% |
| Scottish | 41 | 0.5% |
| Slavic | 11 | 0.1% |
| Slovak | 3 | 0.0% |
| South African | 58 | 0.7% |
| Spaniard | 46 | 0.6% |
| Spanish | 52 | 0.6% |
| Subsaharan African | 71 | 0.9% |
| Swedish | 72 | 0.9% |
| Ukrainian | 30 | 0.4% |
| Welsh | 140 | 1.8% | View All 41 Rows |
Immigrants in Dalhart
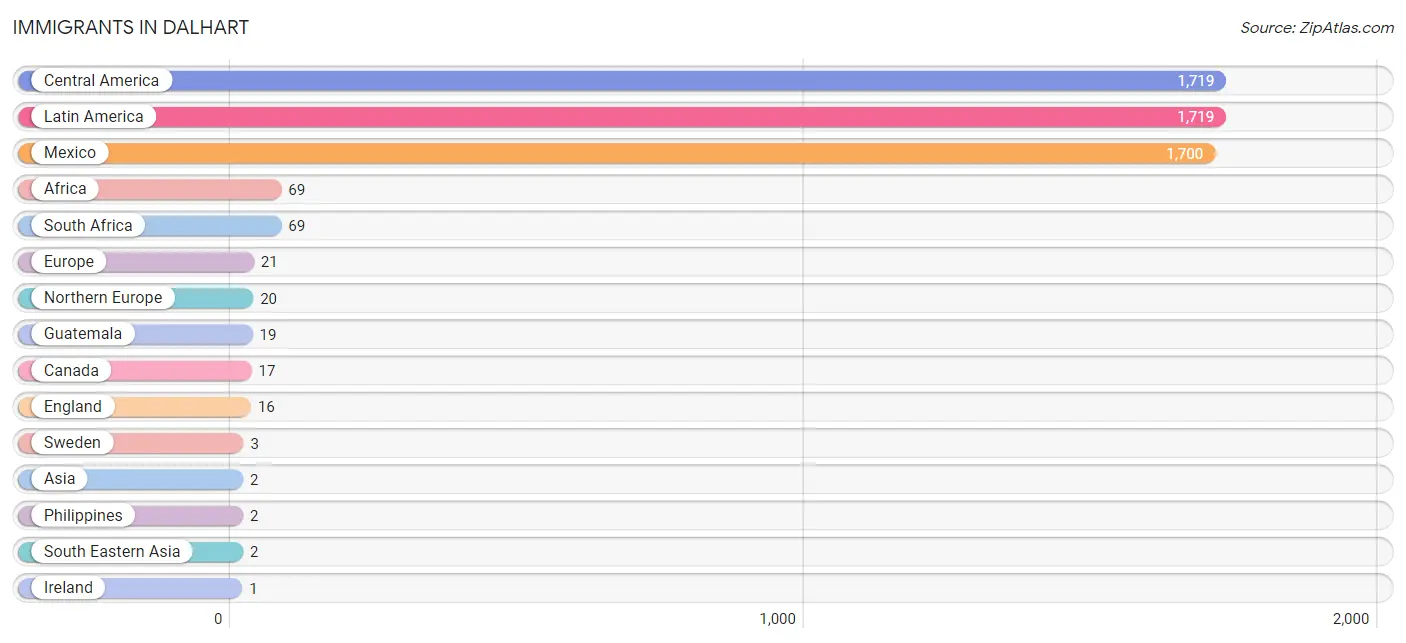
The most numerous immigrant groups reported in Dalhart came from Central America (1,719 | 21.4%), Latin America (1,719 | 21.4%), Mexico (1,700 | 21.2%), Africa (69 | 0.9%), and South Africa (69 | 0.9%), together accounting for 65.8% of all Dalhart residents.
| Immigration Origin | # Population | % Population |
| Africa | 69 | 0.9% |
| Asia | 2 | 0.0% |
| Canada | 17 | 0.2% |
| Central America | 1,719 | 21.4% |
| England | 16 | 0.2% |
| Europe | 21 | 0.3% |
| Guatemala | 19 | 0.2% |
| Ireland | 1 | 0.0% |
| Latin America | 1,719 | 21.4% |
| Mexico | 1,700 | 21.2% |
| Northern Europe | 20 | 0.3% |
| Philippines | 2 | 0.0% |
| South Africa | 69 | 0.9% |
| South Eastern Asia | 2 | 0.0% |
| Southern Europe | 1 | 0.0% |
| Spain | 1 | 0.0% |
| Sweden | 3 | 0.0% | View All 17 Rows |
Sex and Age in Dalhart
Sex and Age in Dalhart
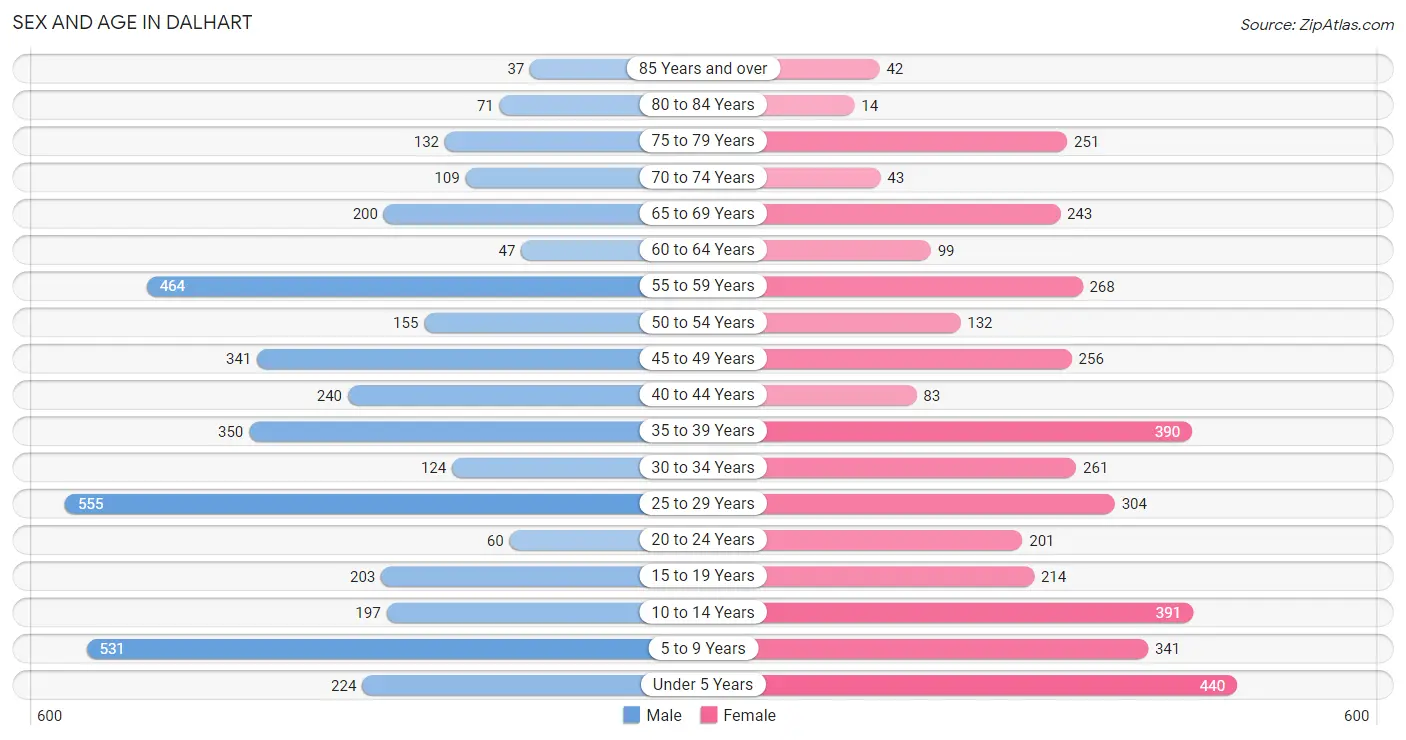
The most populous age groups in Dalhart are 25 to 29 Years (555 | 13.7%) for men and Under 5 Years (440 | 11.1%) for women.
| Age Bracket | Male | Female |
| Under 5 Years | 224 (5.5%) | 440 (11.1%) |
| 5 to 9 Years | 531 (13.1%) | 341 (8.6%) |
| 10 to 14 Years | 197 (4.9%) | 391 (9.8%) |
| 15 to 19 Years | 203 (5.0%) | 214 (5.4%) |
| 20 to 24 Years | 60 (1.5%) | 201 (5.1%) |
| 25 to 29 Years | 555 (13.7%) | 304 (7.6%) |
| 30 to 34 Years | 124 (3.1%) | 261 (6.6%) |
| 35 to 39 Years | 350 (8.7%) | 390 (9.8%) |
| 40 to 44 Years | 240 (5.9%) | 83 (2.1%) |
| 45 to 49 Years | 341 (8.4%) | 256 (6.4%) |
| 50 to 54 Years | 155 (3.8%) | 132 (3.3%) |
| 55 to 59 Years | 464 (11.5%) | 268 (6.8%) |
| 60 to 64 Years | 47 (1.2%) | 99 (2.5%) |
| 65 to 69 Years | 200 (5.0%) | 243 (6.1%) |
| 70 to 74 Years | 109 (2.7%) | 43 (1.1%) |
| 75 to 79 Years | 132 (3.3%) | 251 (6.3%) |
| 80 to 84 Years | 71 (1.8%) | 14 (0.4%) |
| 85 Years and over | 37 (0.9%) | 42 (1.1%) |
| Total | 4,040 (100.0%) | 3,973 (100.0%) |
Families and Households in Dalhart
Median Family Size in Dalhart
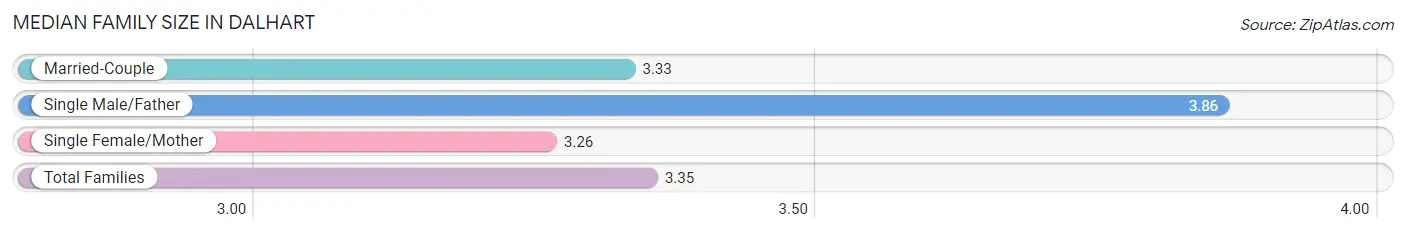
The median family size in Dalhart is 3.35 persons per family, with single male/father families (80 | 4.1%) accounting for the largest median family size of 3.86 persons per family. On the other hand, single female/mother families (143 | 7.2%) represent the smallest median family size with 3.26 persons per family.
| Family Type | # Families | Family Size |
| Married-Couple | 1,750 (88.7%) | 3.33 |
| Single Male/Father | 80 (4.1%) | 3.86 |
| Single Female/Mother | 143 (7.2%) | 3.26 |
| Total Families | 1,973 (100.0%) | 3.35 |
Median Household Size in Dalhart
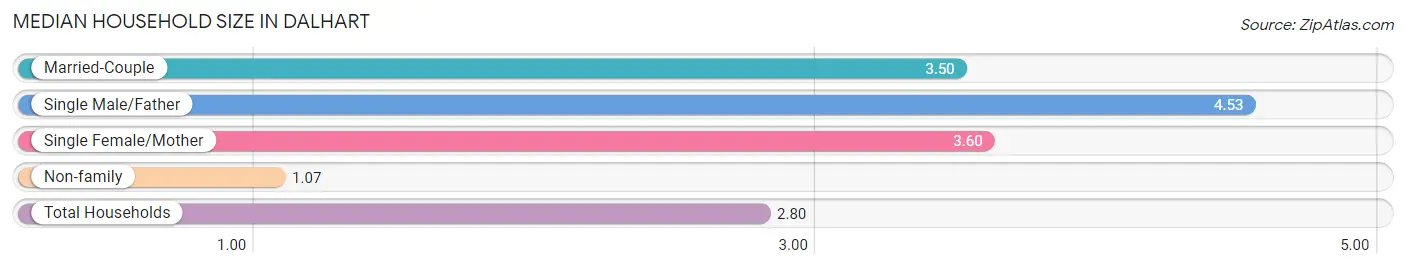
The median household size in Dalhart is 2.80 persons per household, with single male/father households (80 | 2.8%) accounting for the largest median household size of 4.53 persons per household. non-family households (847 | 30.0%) represent the smallest median household size with 1.07 persons per household.
| Household Type | # Households | Household Size |
| Married-Couple | 1,750 (62.1%) | 3.50 |
| Single Male/Father | 80 (2.8%) | 4.53 |
| Single Female/Mother | 143 (5.1%) | 3.60 |
| Non-family | 847 (30.0%) | 1.07 |
| Total Households | 2,820 (100.0%) | 2.80 |
Household Size by Marriage Status in Dalhart
Out of a total of 2,820 households in Dalhart, 1,973 (70.0%) are family households, while 847 (30.0%) are nonfamily households. The most numerous type of family households are 2-person households, comprising 977, and the most common type of nonfamily households are 1-person households, comprising 791.
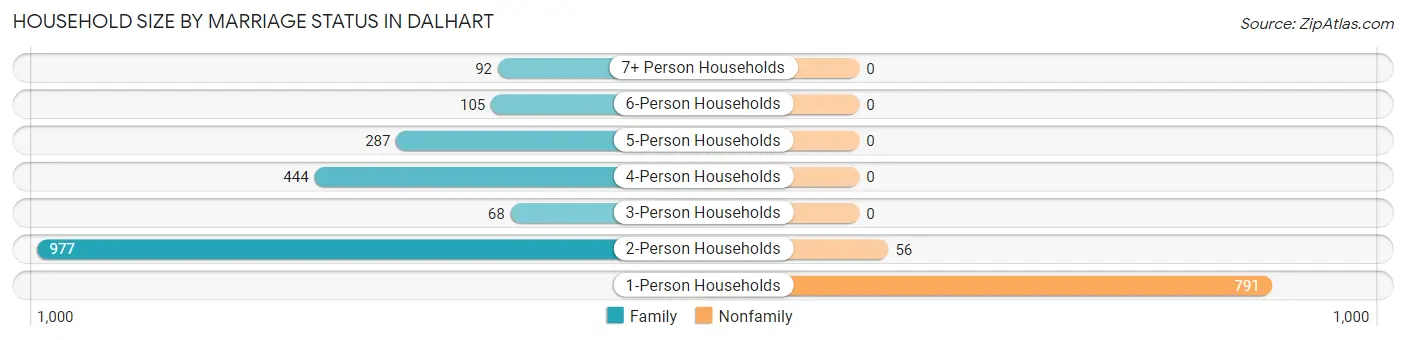
| Household Size | Family Households | Nonfamily Households |
| 1-Person Households | - | 791 (28.1%) |
| 2-Person Households | 977 (34.6%) | 56 (2.0%) |
| 3-Person Households | 68 (2.4%) | 0 (0.0%) |
| 4-Person Households | 444 (15.7%) | 0 (0.0%) |
| 5-Person Households | 287 (10.2%) | 0 (0.0%) |
| 6-Person Households | 105 (3.7%) | 0 (0.0%) |
| 7+ Person Households | 92 (3.3%) | 0 (0.0%) |
| Total | 1,973 (70.0%) | 847 (30.0%) |
Female Fertility in Dalhart
Fertility by Age in Dalhart
Average fertility rate in Dalhart is 67.0 births per 1,000 women. Women in the age bracket of 20 to 34 years have the highest fertility rate with 150.0 births per 1,000 women. Women in the age bracket of 20 to 34 years acount for 100.0% of all women with births.
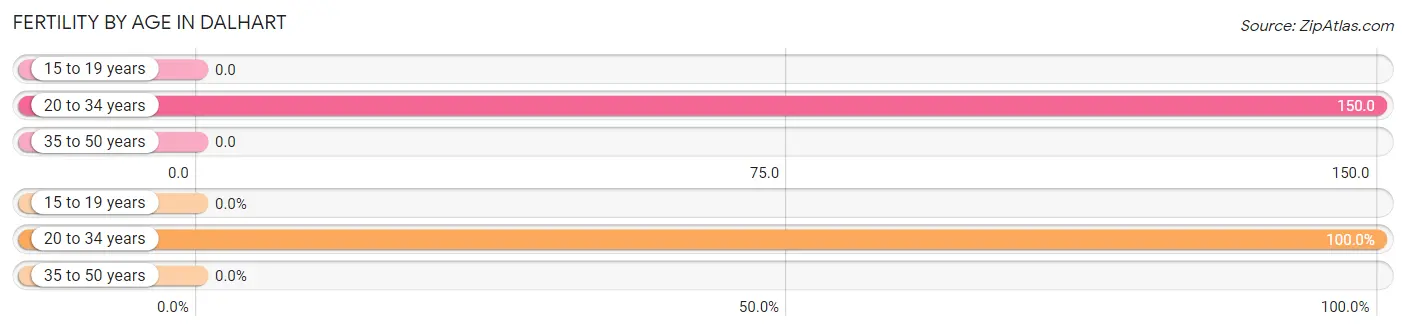
| Age Bracket | Women with Births | Births / 1,000 Women |
| 15 to 19 years | 0 (0.0%) | 0.0 |
| 20 to 34 years | 115 (100.0%) | 150.0 |
| 35 to 50 years | 0 (0.0%) | 0.0 |
| Total | 115 (100.0%) | 67.0 |
Fertility by Age by Marriage Status in Dalhart
82.6% of women with births (115) in Dalhart are married. The highest percentage of unmarried women with births falls into 20 to 34 years age bracket with 17.4% of them unmarried at the time of birth, while the lowest percentage of unmarried women with births belong to 20 to 34 years age bracket with 17.4% of them unmarried.
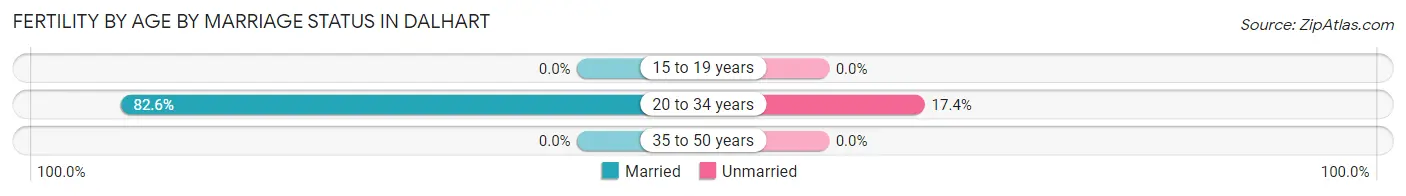
| Age Bracket | Married | Unmarried |
| 15 to 19 years | 0 (0.0%) | 0 (0.0%) |
| 20 to 34 years | 95 (82.6%) | 20 (17.4%) |
| 35 to 50 years | 0 (0.0%) | 0 (0.0%) |
| Total | 95 (82.6%) | 20 (17.4%) |
Fertility by Education in Dalhart
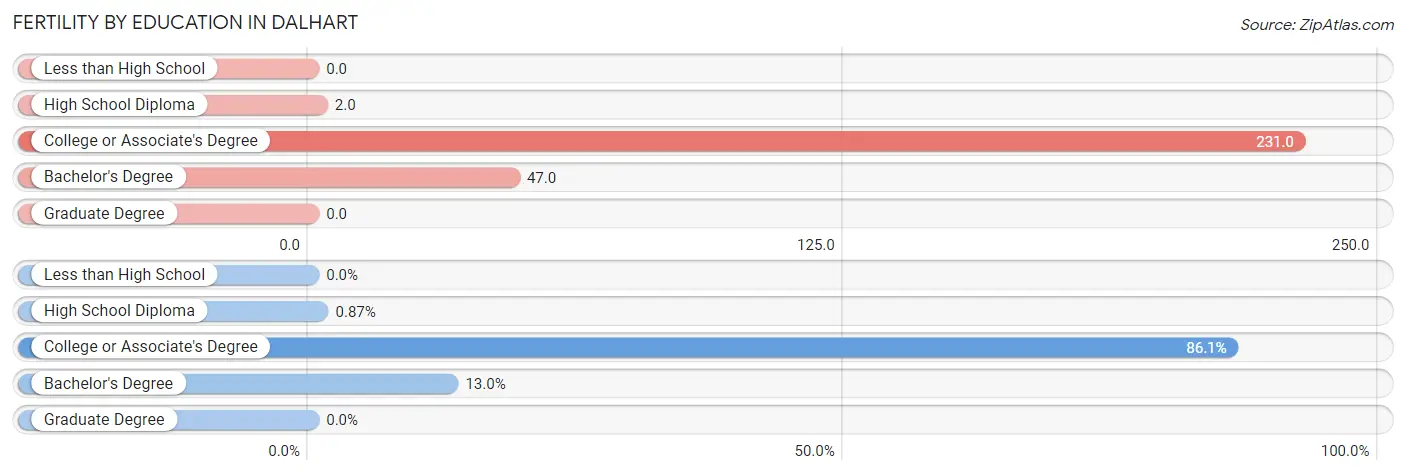
| Educational Attainment | Women with Births | Births / 1,000 Women |
| Less than High School | 0 (0.0%) | 0.0 |
| High School Diploma | 1 (0.9%) | 2.0 |
| College or Associate's Degree | 99 (86.1%) | 231.0 |
| Bachelor's Degree | 15 (13.0%) | 47.0 |
| Graduate Degree | 0 (0.0%) | 0.0 |
| Total | 115 (100.0%) | 67.0 |
Fertility by Education by Marriage Status in Dalhart
17.4% of women with births in Dalhart are unmarried. Women with the educational attainment of bachelor's degree are most likely to be married with 100.0% of them married at childbirth, while women with the educational attainment of high school diploma are least likely to be married with 100.0% of them unmarried at childbirth.
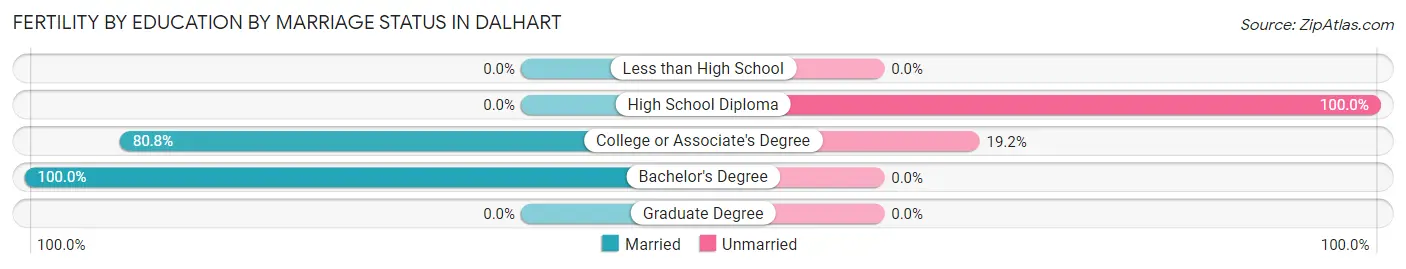
| Educational Attainment | Married | Unmarried |
| Less than High School | 0 (0.0%) | 0 (0.0%) |
| High School Diploma | 0 (0.0%) | 1 (100.0%) |
| College or Associate's Degree | 80 (80.8%) | 19 (19.2%) |
| Bachelor's Degree | 15 (100.0%) | 0 (0.0%) |
| Graduate Degree | 0 (0.0%) | 0 (0.0%) |
| Total | 95 (82.6%) | 20 (17.4%) |
Employment Characteristics in Dalhart
Employment by Class of Employer in Dalhart
Among the 4,176 employed individuals in Dalhart, private company employees (2,847 | 68.2%), self-employed (not incorporated) (726 | 17.4%), and local government employees (327 | 7.8%) make up the most common classes of employment.
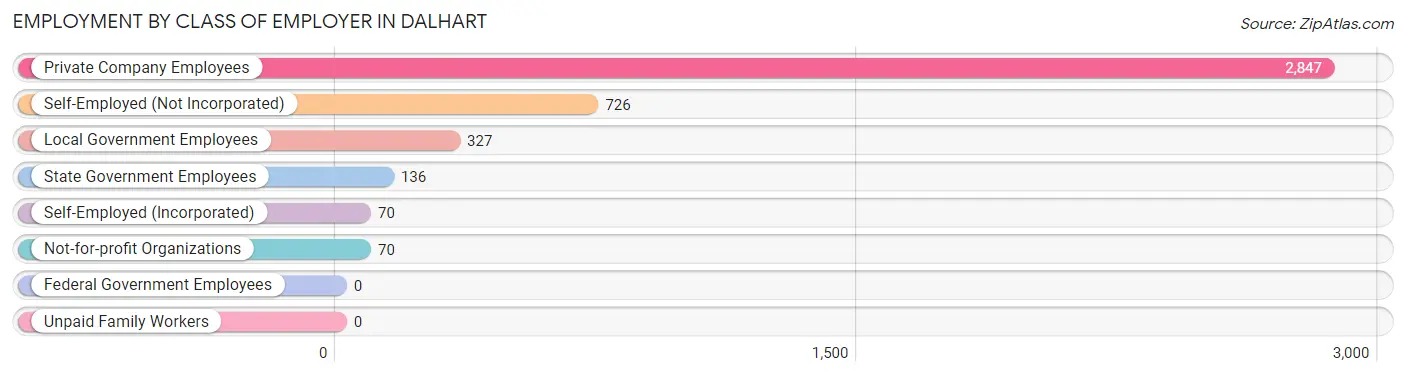
| Employer Class | # Employees | % Employees |
| Private Company Employees | 2,847 | 68.2% |
| Self-Employed (Incorporated) | 70 | 1.7% |
| Self-Employed (Not Incorporated) | 726 | 17.4% |
| Not-for-profit Organizations | 70 | 1.7% |
| Local Government Employees | 327 | 7.8% |
| State Government Employees | 136 | 3.3% |
| Federal Government Employees | 0 | 0.0% |
| Unpaid Family Workers | 0 | 0.0% |
| Total | 4,176 | 100.0% |
Employment Status by Age in Dalhart
According to the labor force statistics for Dalhart, out of the total population over 16 years of age (5,757), 75.5% or 4,347 individuals are in the labor force, with 2.2% or 96 of them unemployed. The age group with the highest labor force participation rate is 35 to 44 years, with 93.1% or 990 individuals in the labor force. Within the labor force, the 20 to 24 years age range has the highest percentage of unemployed individuals, with 29.1% or 32 of them being unemployed.
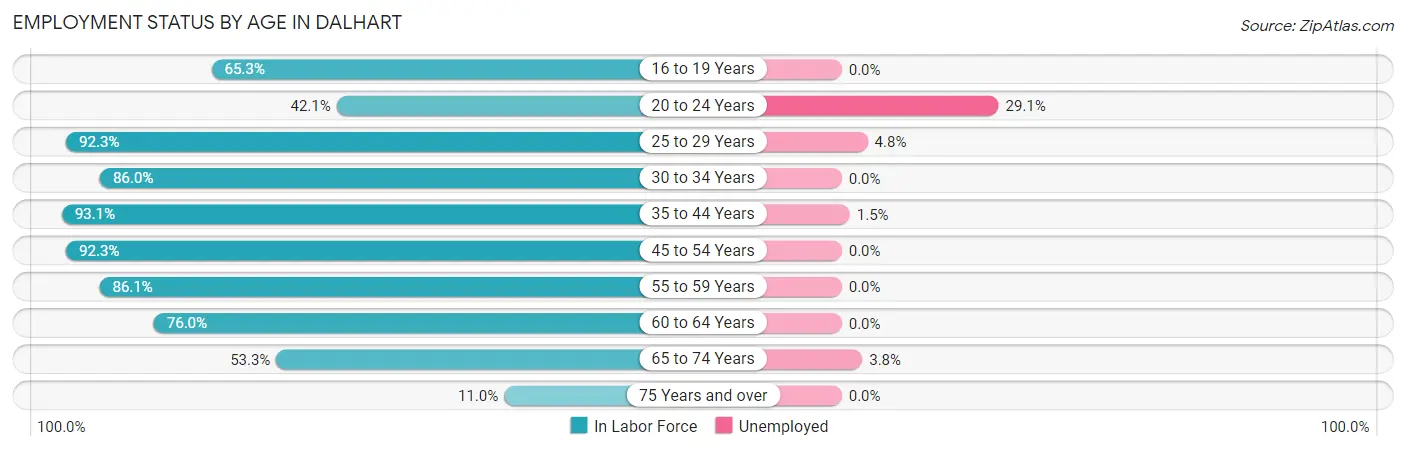
| Age Bracket | In Labor Force | Unemployed |
| 16 to 19 Years | 186 (65.3%) | 0 (0.0%) |
| 20 to 24 Years | 110 (42.1%) | 32 (29.1%) |
| 25 to 29 Years | 793 (92.3%) | 38 (4.8%) |
| 30 to 34 Years | 331 (86.0%) | 0 (0.0%) |
| 35 to 44 Years | 990 (93.1%) | 15 (1.5%) |
| 45 to 54 Years | 816 (92.3%) | 0 (0.0%) |
| 55 to 59 Years | 630 (86.1%) | 0 (0.0%) |
| 60 to 64 Years | 111 (76.0%) | 0 (0.0%) |
| 65 to 74 Years | 317 (53.3%) | 12 (3.8%) |
| 75 Years and over | 60 (11.0%) | 0 (0.0%) |
| Total | 4,347 (75.5%) | 96 (2.2%) |
Employment Status by Educational Attainment in Dalhart
According to labor force statistics for Dalhart, 90.2% of individuals (3,670) out of the total population between 25 and 64 years of age (4,069) are in the labor force, with 1.4% or 51 of them being unemployed. The group with the highest labor force participation rate are those with the educational attainment of college / associate degree, with 95.7% or 1,052 individuals in the labor force. Within the labor force, individuals with high school diploma education have the highest percentage of unemployment, with 2.6% or 34 of them being unemployed.
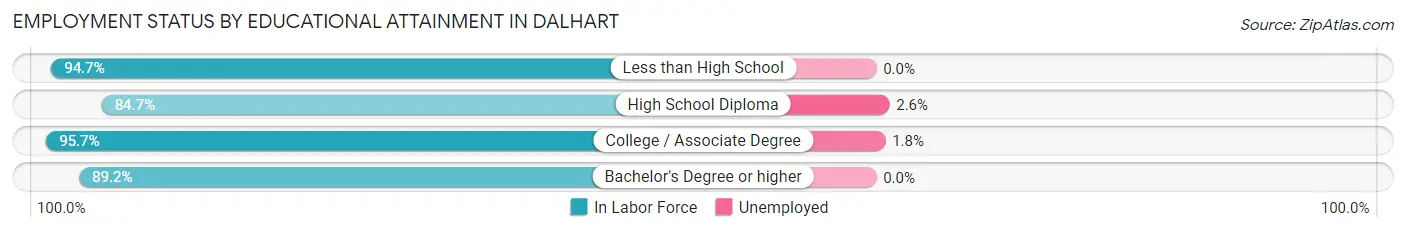
| Educational Attainment | In Labor Force | Unemployed |
| Less than High School | 680 (94.7%) | 0 (0.0%) |
| High School Diploma | 1,304 (84.7%) | 40 (2.6%) |
| College / Associate Degree | 1,052 (95.7%) | 20 (1.8%) |
| Bachelor's Degree or higher | 635 (89.2%) | 0 (0.0%) |
| Total | 3,670 (90.2%) | 57 (1.4%) |
Employment Occupations by Sex in Dalhart
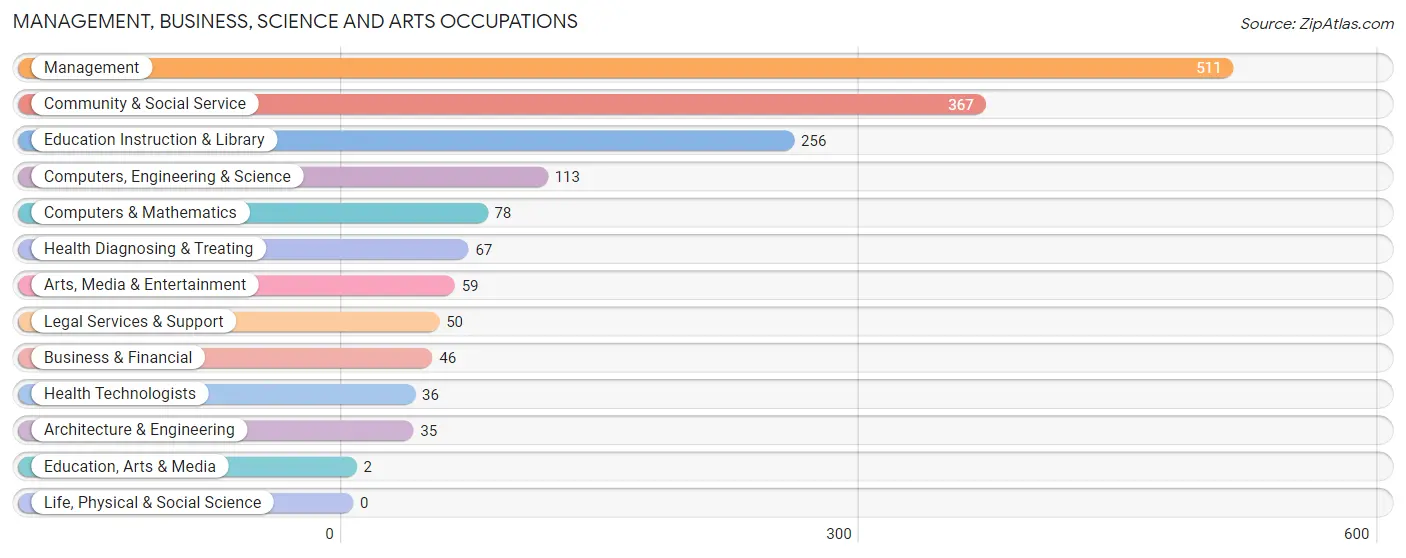
Management, Business, Science and Arts Occupations
The most common Management, Business, Science and Arts occupations in Dalhart are Management (511 | 12.0%), Community & Social Service (367 | 8.6%), Education Instruction & Library (256 | 6.0%), Computers, Engineering & Science (113 | 2.7%), and Computers & Mathematics (78 | 1.8%).
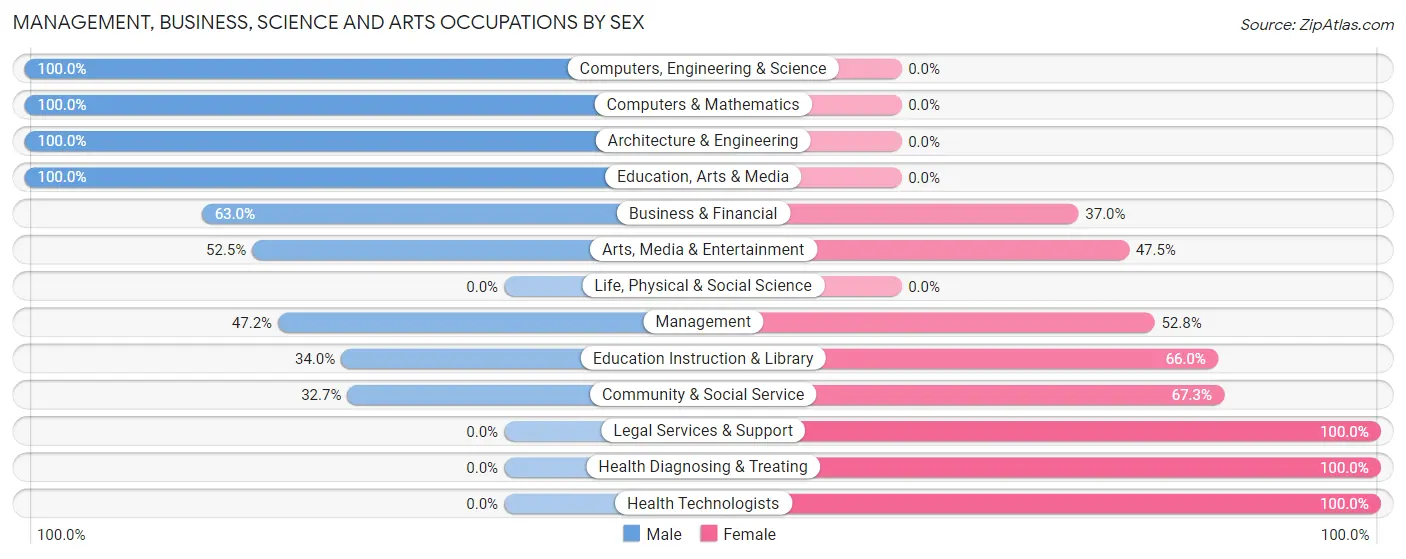
Management, Business, Science and Arts Occupations by Sex
Within the Management, Business, Science and Arts occupations in Dalhart, the most male-oriented occupations are Computers, Engineering & Science (100.0%), Computers & Mathematics (100.0%), and Architecture & Engineering (100.0%), while the most female-oriented occupations are Legal Services & Support (100.0%), Health Diagnosing & Treating (100.0%), and Health Technologists (100.0%).
| Occupation | Male | Female |
| Management | 241 (47.2%) | 270 (52.8%) |
| Business & Financial | 29 (63.0%) | 17 (37.0%) |
| Computers, Engineering & Science | 113 (100.0%) | 0 (0.0%) |
| Computers & Mathematics | 78 (100.0%) | 0 (0.0%) |
| Architecture & Engineering | 35 (100.0%) | 0 (0.0%) |
| Life, Physical & Social Science | 0 (0.0%) | 0 (0.0%) |
| Community & Social Service | 120 (32.7%) | 247 (67.3%) |
| Education, Arts & Media | 2 (100.0%) | 0 (0.0%) |
| Legal Services & Support | 0 (0.0%) | 50 (100.0%) |
| Education Instruction & Library | 87 (34.0%) | 169 (66.0%) |
| Arts, Media & Entertainment | 31 (52.5%) | 28 (47.5%) |
| Health Diagnosing & Treating | 0 (0.0%) | 67 (100.0%) |
| Health Technologists | 0 (0.0%) | 36 (100.0%) |
| Total (Category) | 503 (45.6%) | 601 (54.4%) |
| Total (Overall) | 2,558 (60.2%) | 1,689 (39.8%) |
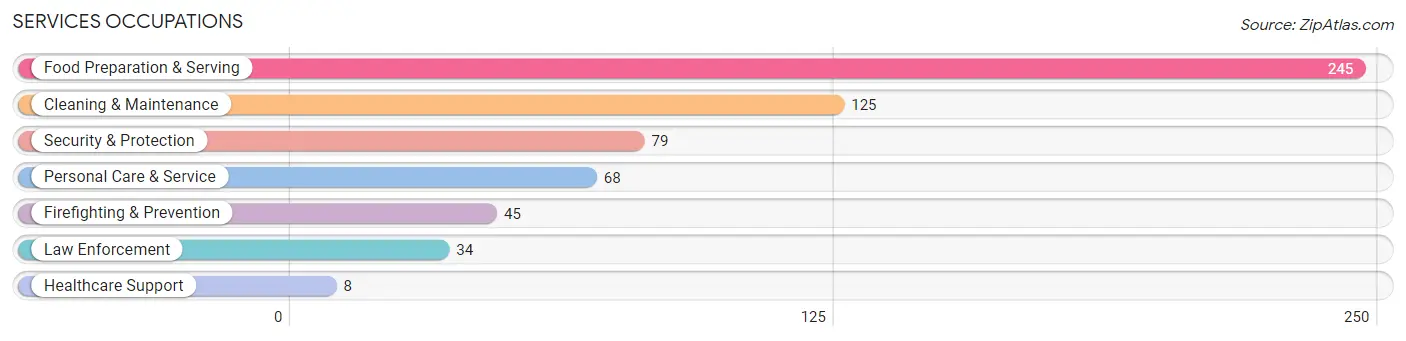
Services Occupations
The most common Services occupations in Dalhart are Food Preparation & Serving (245 | 5.8%), Cleaning & Maintenance (125 | 2.9%), Security & Protection (79 | 1.9%), Personal Care & Service (68 | 1.6%), and Firefighting & Prevention (45 | 1.1%).
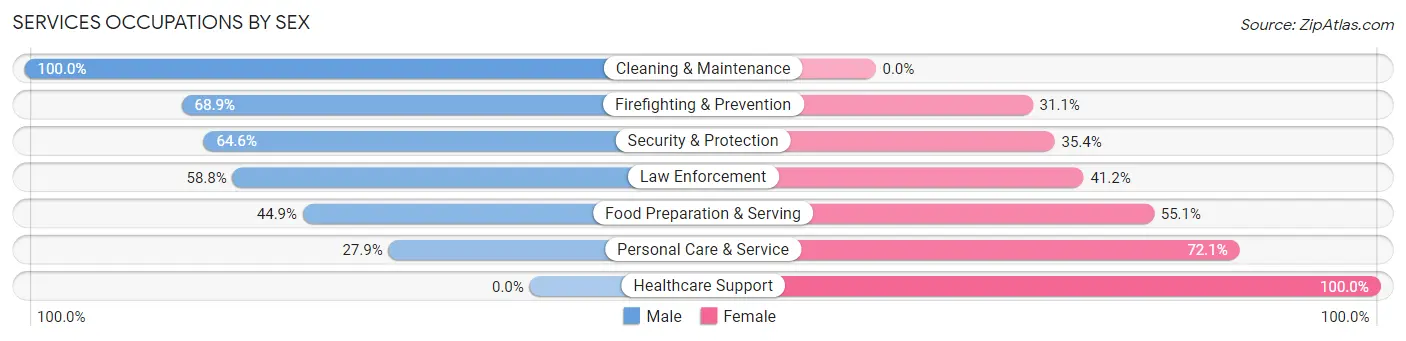
Services Occupations by Sex
Within the Services occupations in Dalhart, the most male-oriented occupations are Cleaning & Maintenance (100.0%), Firefighting & Prevention (68.9%), and Security & Protection (64.6%), while the most female-oriented occupations are Healthcare Support (100.0%), Personal Care & Service (72.1%), and Food Preparation & Serving (55.1%).
| Occupation | Male | Female |
| Healthcare Support | 0 (0.0%) | 8 (100.0%) |
| Security & Protection | 51 (64.6%) | 28 (35.4%) |
| Firefighting & Prevention | 31 (68.9%) | 14 (31.1%) |
| Law Enforcement | 20 (58.8%) | 14 (41.2%) |
| Food Preparation & Serving | 110 (44.9%) | 135 (55.1%) |
| Cleaning & Maintenance | 125 (100.0%) | 0 (0.0%) |
| Personal Care & Service | 19 (27.9%) | 49 (72.1%) |
| Total (Category) | 305 (58.1%) | 220 (41.9%) |
| Total (Overall) | 2,558 (60.2%) | 1,689 (39.8%) |
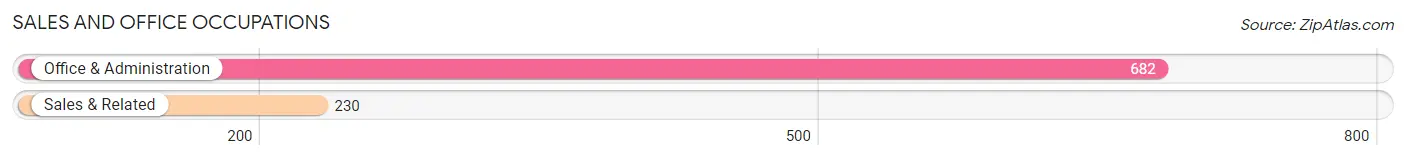
Sales and Office Occupations
The most common Sales and Office occupations in Dalhart are Office & Administration (682 | 16.1%), and Sales & Related (230 | 5.4%).
Sales and Office Occupations by Sex

| Occupation | Male | Female |
| Sales & Related | 75 (32.6%) | 155 (67.4%) |
| Office & Administration | 127 (18.6%) | 555 (81.4%) |
| Total (Category) | 202 (22.2%) | 710 (77.8%) |
| Total (Overall) | 2,558 (60.2%) | 1,689 (39.8%) |
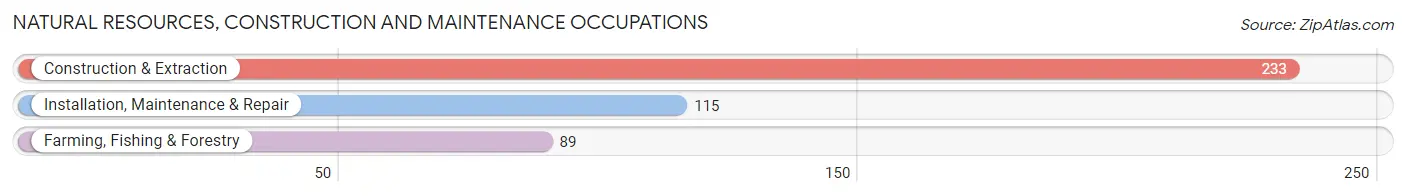
Natural Resources, Construction and Maintenance Occupations
The most common Natural Resources, Construction and Maintenance occupations in Dalhart are Construction & Extraction (233 | 5.5%), Installation, Maintenance & Repair (115 | 2.7%), and Farming, Fishing & Forestry (89 | 2.1%).
Natural Resources, Construction and Maintenance Occupations by Sex
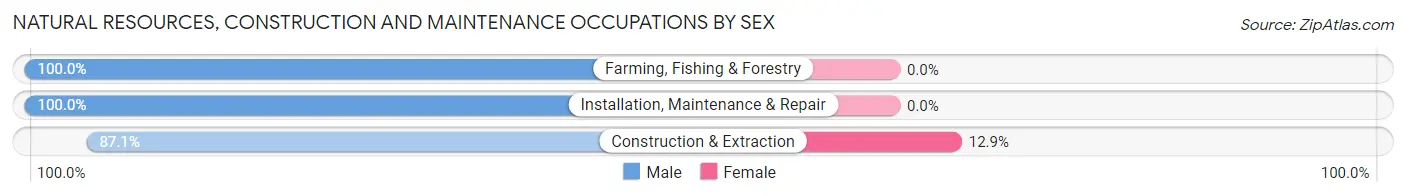
| Occupation | Male | Female |
| Farming, Fishing & Forestry | 89 (100.0%) | 0 (0.0%) |
| Construction & Extraction | 203 (87.1%) | 30 (12.9%) |
| Installation, Maintenance & Repair | 115 (100.0%) | 0 (0.0%) |
| Total (Category) | 407 (93.1%) | 30 (6.9%) |
| Total (Overall) | 2,558 (60.2%) | 1,689 (39.8%) |
Production, Transportation and Moving Occupations
The most common Production, Transportation and Moving occupations in Dalhart are Transportation (764 | 18.0%), Production (301 | 7.1%), and Material Moving (204 | 4.8%).
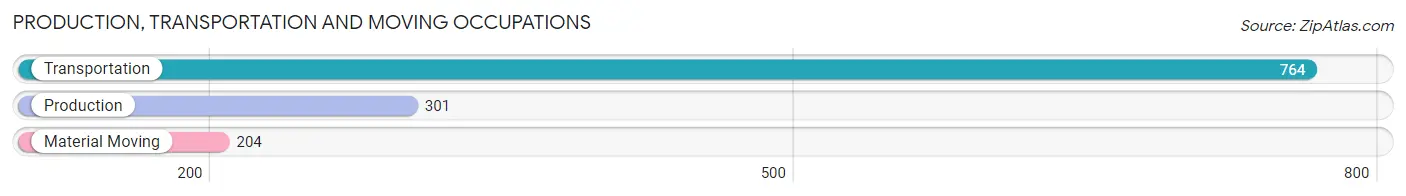
Production, Transportation and Moving Occupations by Sex
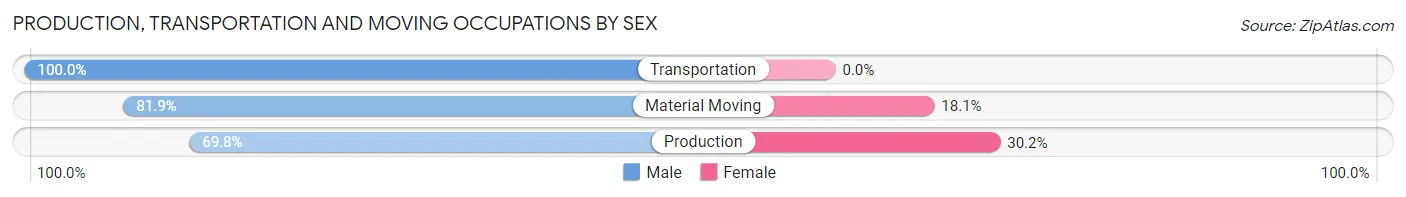
| Occupation | Male | Female |
| Production | 210 (69.8%) | 91 (30.2%) |
| Transportation | 764 (100.0%) | 0 (0.0%) |
| Material Moving | 167 (81.9%) | 37 (18.1%) |
| Total (Category) | 1,141 (89.9%) | 128 (10.1%) |
| Total (Overall) | 2,558 (60.2%) | 1,689 (39.8%) |
Employment Industries by Sex in Dalhart
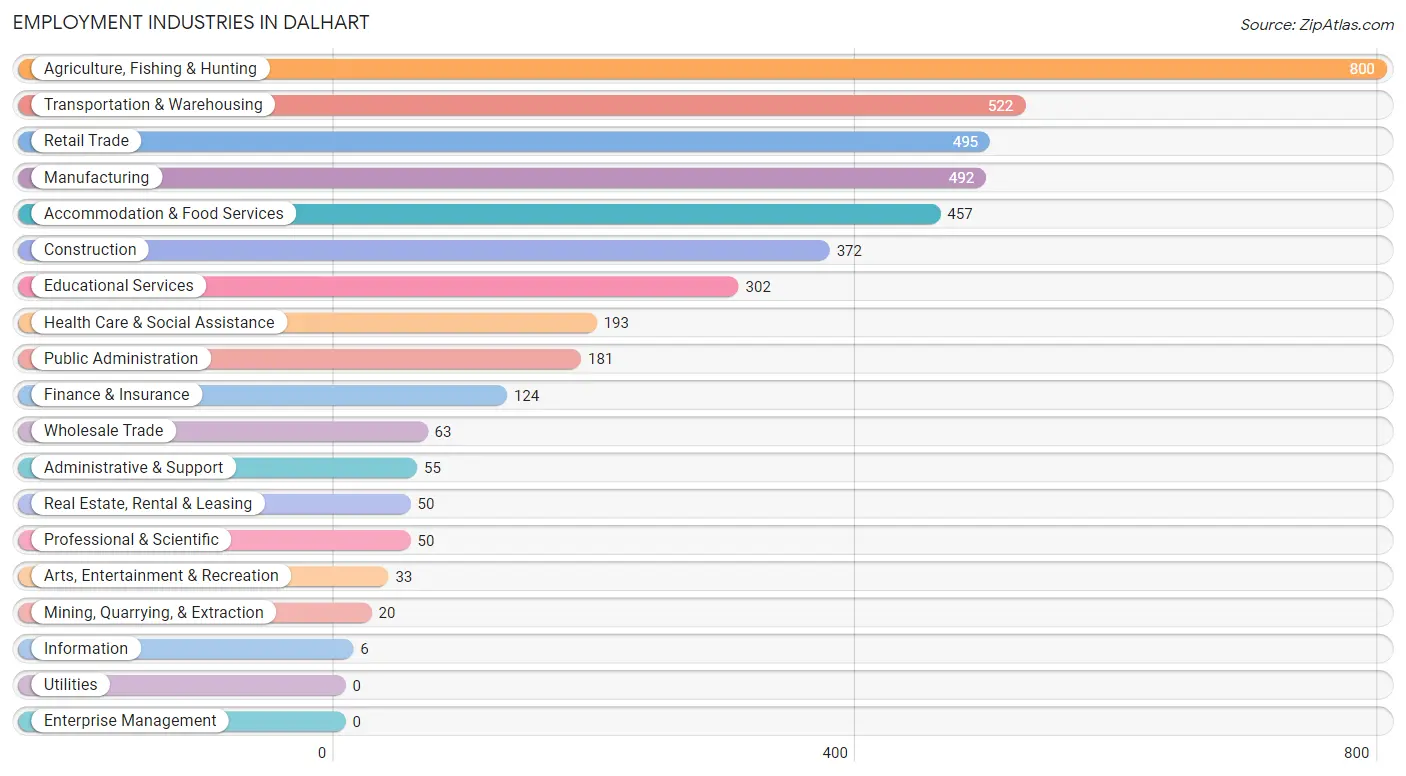
Employment Industries in Dalhart
The major employment industries in Dalhart include Agriculture, Fishing & Hunting (800 | 18.8%), Transportation & Warehousing (522 | 12.3%), Retail Trade (495 | 11.7%), Manufacturing (492 | 11.6%), and Accommodation & Food Services (457 | 10.8%).
Employment Industries by Sex in Dalhart
The Dalhart industries that see more men than women are Mining, Quarrying, & Extraction (100.0%), Transportation & Warehousing (90.4%), and Agriculture, Fishing & Hunting (81.0%), whereas the industries that tend to have a higher number of women are Information (100.0%), Professional & Scientific (100.0%), and Health Care & Social Assistance (98.5%).
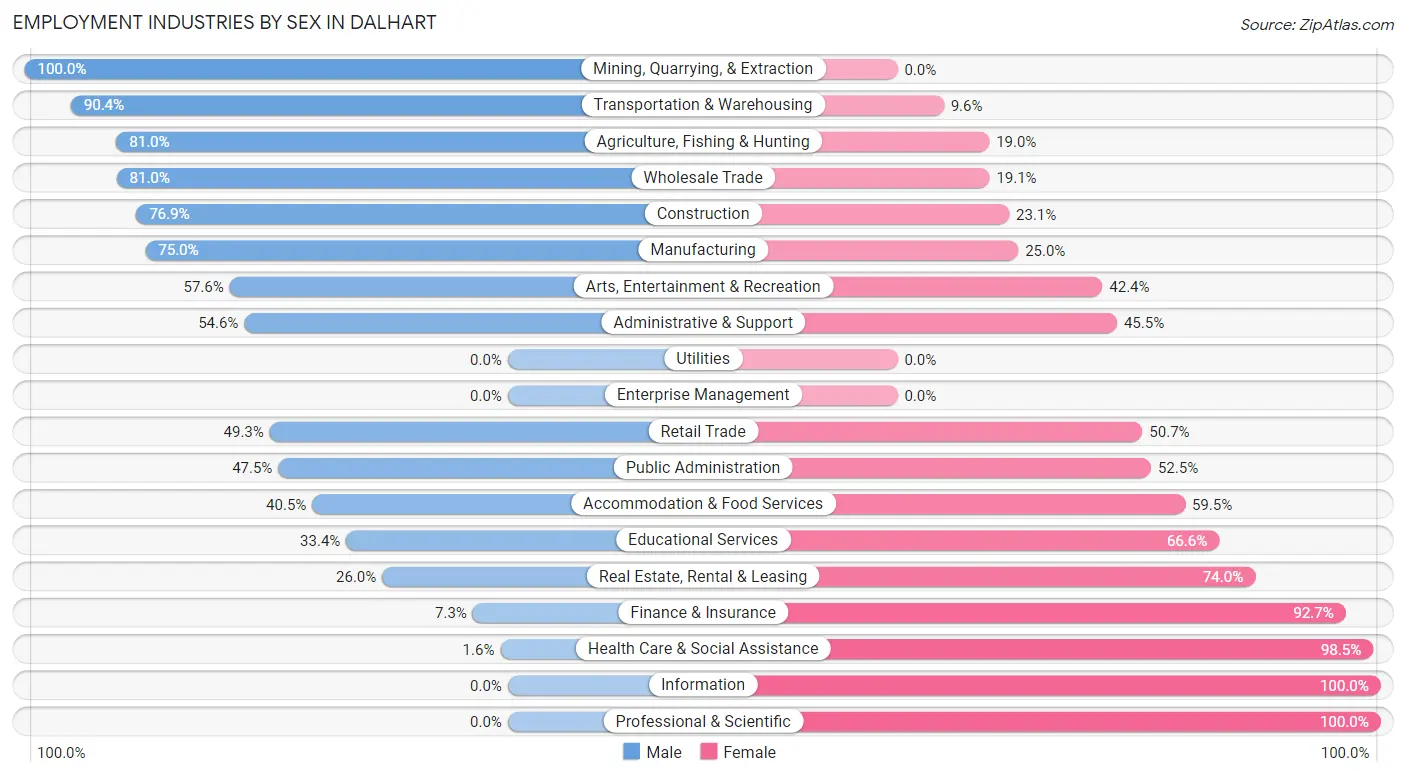
| Industry | Male | Female |
| Agriculture, Fishing & Hunting | 648 (81.0%) | 152 (19.0%) |
| Mining, Quarrying, & Extraction | 20 (100.0%) | 0 (0.0%) |
| Construction | 286 (76.9%) | 86 (23.1%) |
| Manufacturing | 369 (75.0%) | 123 (25.0%) |
| Wholesale Trade | 51 (80.9%) | 12 (19.1%) |
| Retail Trade | 244 (49.3%) | 251 (50.7%) |
| Transportation & Warehousing | 472 (90.4%) | 50 (9.6%) |
| Utilities | 0 (0.0%) | 0 (0.0%) |
| Information | 0 (0.0%) | 6 (100.0%) |
| Finance & Insurance | 9 (7.3%) | 115 (92.7%) |
| Real Estate, Rental & Leasing | 13 (26.0%) | 37 (74.0%) |
| Professional & Scientific | 0 (0.0%) | 50 (100.0%) |
| Enterprise Management | 0 (0.0%) | 0 (0.0%) |
| Administrative & Support | 30 (54.5%) | 25 (45.5%) |
| Educational Services | 101 (33.4%) | 201 (66.6%) |
| Health Care & Social Assistance | 3 (1.5%) | 190 (98.5%) |
| Arts, Entertainment & Recreation | 19 (57.6%) | 14 (42.4%) |
| Accommodation & Food Services | 185 (40.5%) | 272 (59.5%) |
| Public Administration | 86 (47.5%) | 95 (52.5%) |
| Total | 2,558 (60.2%) | 1,689 (39.8%) |
Education in Dalhart
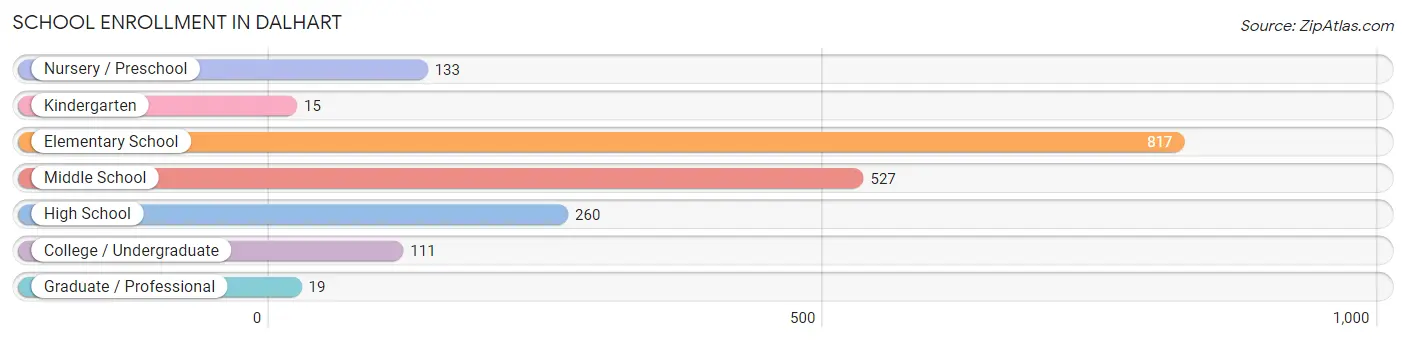
School Enrollment in Dalhart
The most common levels of schooling among the 1,882 students in Dalhart are elementary school (817 | 43.4%), middle school (527 | 28.0%), and high school (260 | 13.8%).
| School Level | # Students | % Students |
| Nursery / Preschool | 133 | 7.1% |
| Kindergarten | 15 | 0.8% |
| Elementary School | 817 | 43.4% |
| Middle School | 527 | 28.0% |
| High School | 260 | 13.8% |
| College / Undergraduate | 111 | 5.9% |
| Graduate / Professional | 19 | 1.0% |
| Total | 1,882 | 100.0% |
School Enrollment by Age by Funding Source in Dalhart
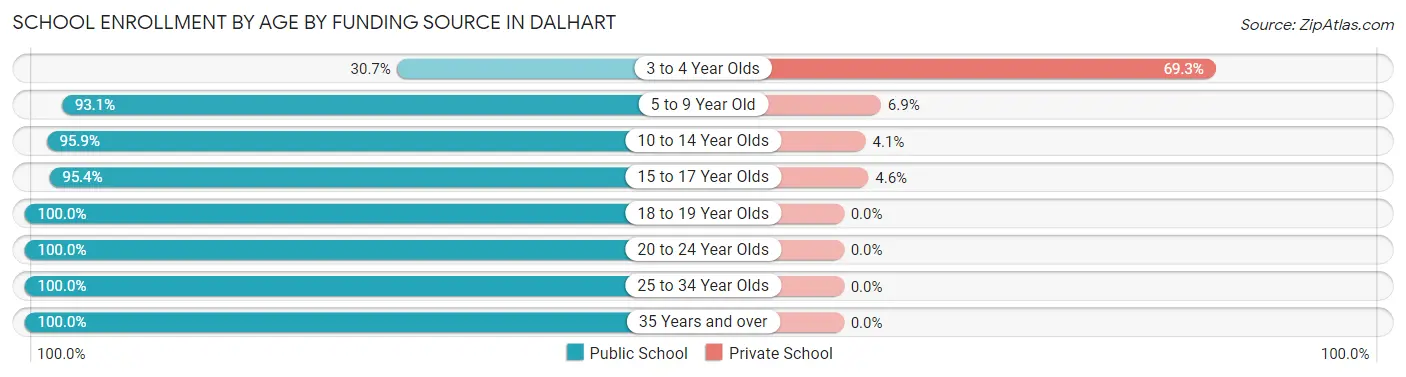
Out of a total of 1,882 students who are enrolled in schools in Dalhart, 184 (9.8%) attend a private institution, while the remaining 1,698 (90.2%) are enrolled in public schools. The age group of 3 to 4 year olds has the highest likelihood of being enrolled in private schools, with 97 (69.3% in the age bracket) enrolled. Conversely, the age group of 18 to 19 year olds has the lowest likelihood of being enrolled in a private school, with 58 (100.0% in the age bracket) attending a public institution.
| Age Bracket | Public School | Private School |
| 3 to 4 Year Olds | 43 (30.7%) | 97 (69.3%) |
| 5 to 9 Year Old | 711 (93.1%) | 53 (6.9%) |
| 10 to 14 Year Olds | 564 (95.9%) | 24 (4.1%) |
| 15 to 17 Year Olds | 228 (95.4%) | 11 (4.6%) |
| 18 to 19 Year Olds | 58 (100.0%) | 0 (0.0%) |
| 20 to 24 Year Olds | 9 (100.0%) | 0 (0.0%) |
| 25 to 34 Year Olds | 64 (100.0%) | 0 (0.0%) |
| 35 Years and over | 20 (100.0%) | 0 (0.0%) |
| Total | 1,698 (90.2%) | 184 (9.8%) |
Educational Attainment by Field of Study in Dalhart
Education (373 | 32.5%), arts & humanities (154 | 13.4%), business (130 | 11.3%), bio, nature & agricultural (82 | 7.1%), and psychology (81 | 7.1%) are the most common fields of study among 1,148 individuals in Dalhart who have obtained a bachelor's degree or higher.
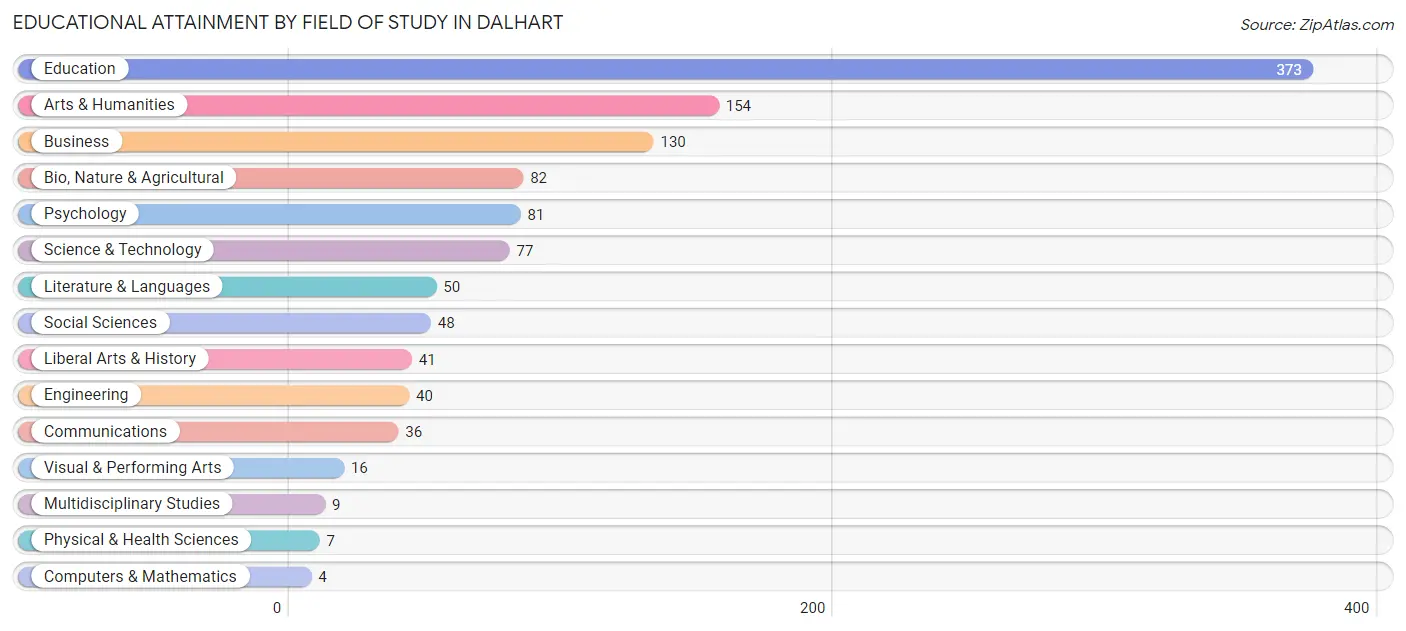
| Field of Study | # Graduates | % Graduates |
| Computers & Mathematics | 4 | 0.4% |
| Bio, Nature & Agricultural | 82 | 7.1% |
| Physical & Health Sciences | 7 | 0.6% |
| Psychology | 81 | 7.1% |
| Social Sciences | 48 | 4.2% |
| Engineering | 40 | 3.5% |
| Multidisciplinary Studies | 9 | 0.8% |
| Science & Technology | 77 | 6.7% |
| Business | 130 | 11.3% |
| Education | 373 | 32.5% |
| Literature & Languages | 50 | 4.4% |
| Liberal Arts & History | 41 | 3.6% |
| Visual & Performing Arts | 16 | 1.4% |
| Communications | 36 | 3.1% |
| Arts & Humanities | 154 | 13.4% |
| Total | 1,148 | 100.0% |
Transportation & Commute in Dalhart
Vehicle Availability by Sex in Dalhart
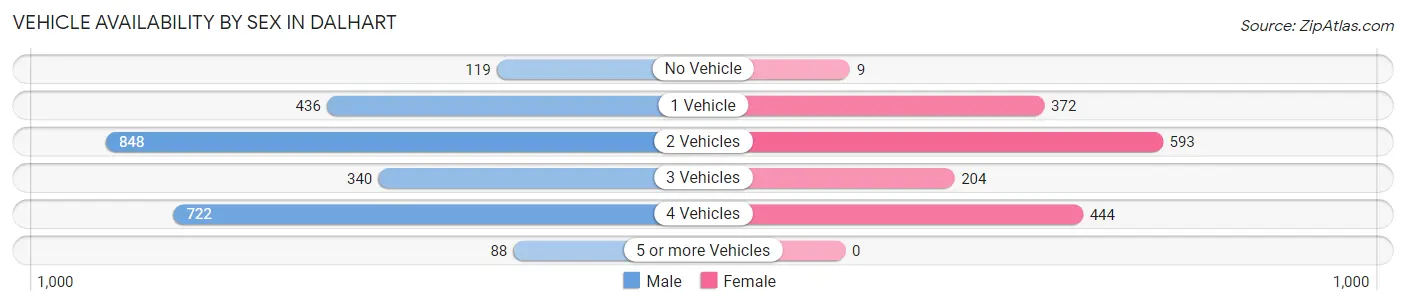
The most prevalent vehicle ownership categories in Dalhart are males with 2 vehicles (848, accounting for 33.2%) and females with 2 vehicles (593, making up 52.3%).
| Vehicles Available | Male | Female |
| No Vehicle | 119 (4.7%) | 9 (0.5%) |
| 1 Vehicle | 436 (17.1%) | 372 (22.9%) |
| 2 Vehicles | 848 (33.2%) | 593 (36.6%) |
| 3 Vehicles | 340 (13.3%) | 204 (12.6%) |
| 4 Vehicles | 722 (28.3%) | 444 (27.4%) |
| 5 or more Vehicles | 88 (3.5%) | 0 (0.0%) |
| Total | 2,553 (100.0%) | 1,622 (100.0%) |
Commute Time in Dalhart
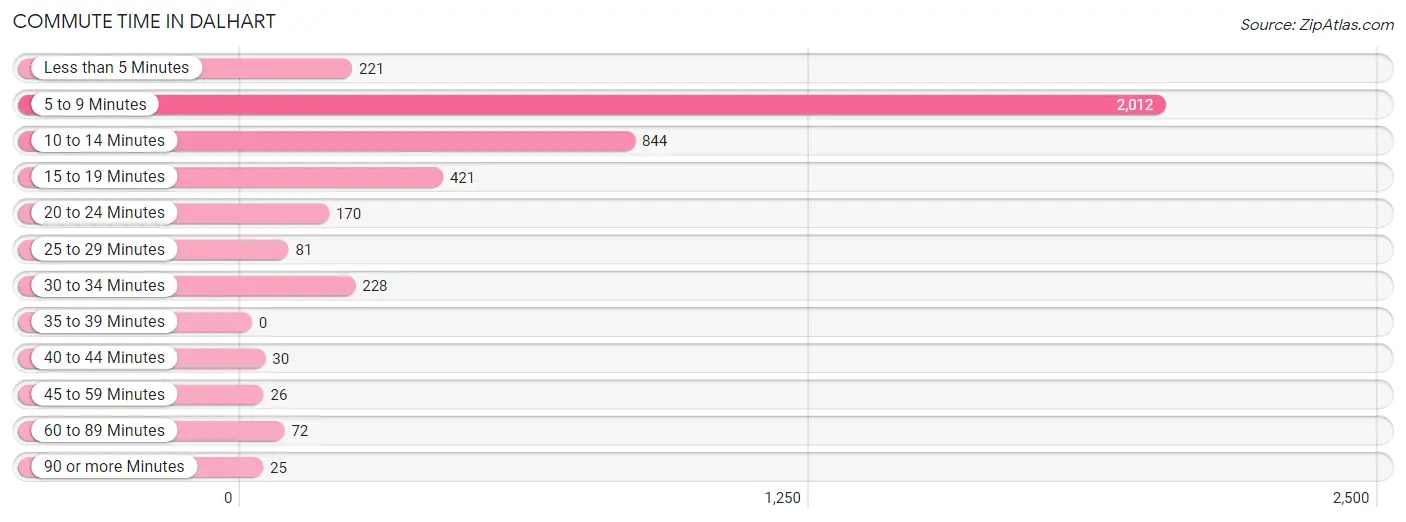
The most frequently occuring commute durations in Dalhart are 5 to 9 minutes (2,012 commuters, 48.7%), 10 to 14 minutes (844 commuters, 20.4%), and 15 to 19 minutes (421 commuters, 10.2%).
| Commute Time | # Commuters | % Commuters |
| Less than 5 Minutes | 221 | 5.3% |
| 5 to 9 Minutes | 2,012 | 48.7% |
| 10 to 14 Minutes | 844 | 20.4% |
| 15 to 19 Minutes | 421 | 10.2% |
| 20 to 24 Minutes | 170 | 4.1% |
| 25 to 29 Minutes | 81 | 2.0% |
| 30 to 34 Minutes | 228 | 5.5% |
| 35 to 39 Minutes | 0 | 0.0% |
| 40 to 44 Minutes | 30 | 0.7% |
| 45 to 59 Minutes | 26 | 0.6% |
| 60 to 89 Minutes | 72 | 1.7% |
| 90 or more Minutes | 25 | 0.6% |
Commute Time by Sex in Dalhart
The most common commute times in Dalhart are 5 to 9 minutes (1,232 commuters, 48.5%) for males and 5 to 9 minutes (780 commuters, 49.0%) for females.
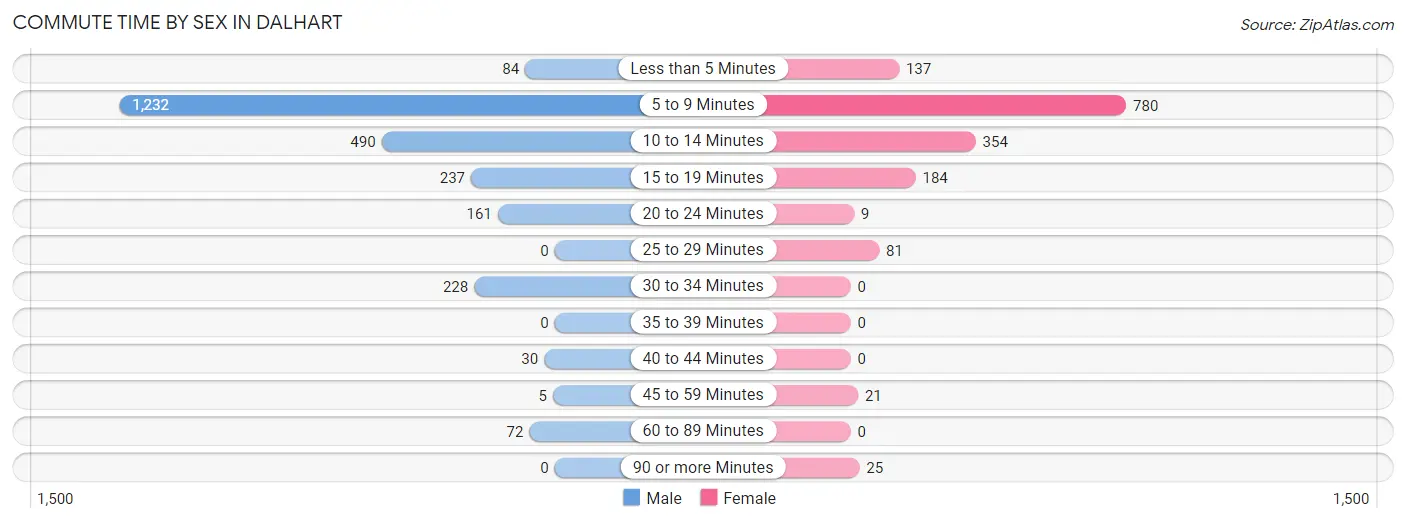
| Commute Time | Male | Female |
| Less than 5 Minutes | 84 (3.3%) | 137 (8.6%) |
| 5 to 9 Minutes | 1,232 (48.5%) | 780 (49.0%) |
| 10 to 14 Minutes | 490 (19.3%) | 354 (22.3%) |
| 15 to 19 Minutes | 237 (9.3%) | 184 (11.6%) |
| 20 to 24 Minutes | 161 (6.3%) | 9 (0.6%) |
| 25 to 29 Minutes | 0 (0.0%) | 81 (5.1%) |
| 30 to 34 Minutes | 228 (9.0%) | 0 (0.0%) |
| 35 to 39 Minutes | 0 (0.0%) | 0 (0.0%) |
| 40 to 44 Minutes | 30 (1.2%) | 0 (0.0%) |
| 45 to 59 Minutes | 5 (0.2%) | 21 (1.3%) |
| 60 to 89 Minutes | 72 (2.8%) | 0 (0.0%) |
| 90 or more Minutes | 0 (0.0%) | 25 (1.6%) |
Time of Departure to Work by Sex in Dalhart
The most frequent times of departure to work in Dalhart are 7:30 AM to 7:59 AM (467, 18.4%) for males and 7:30 AM to 7:59 AM (367, 23.1%) for females.
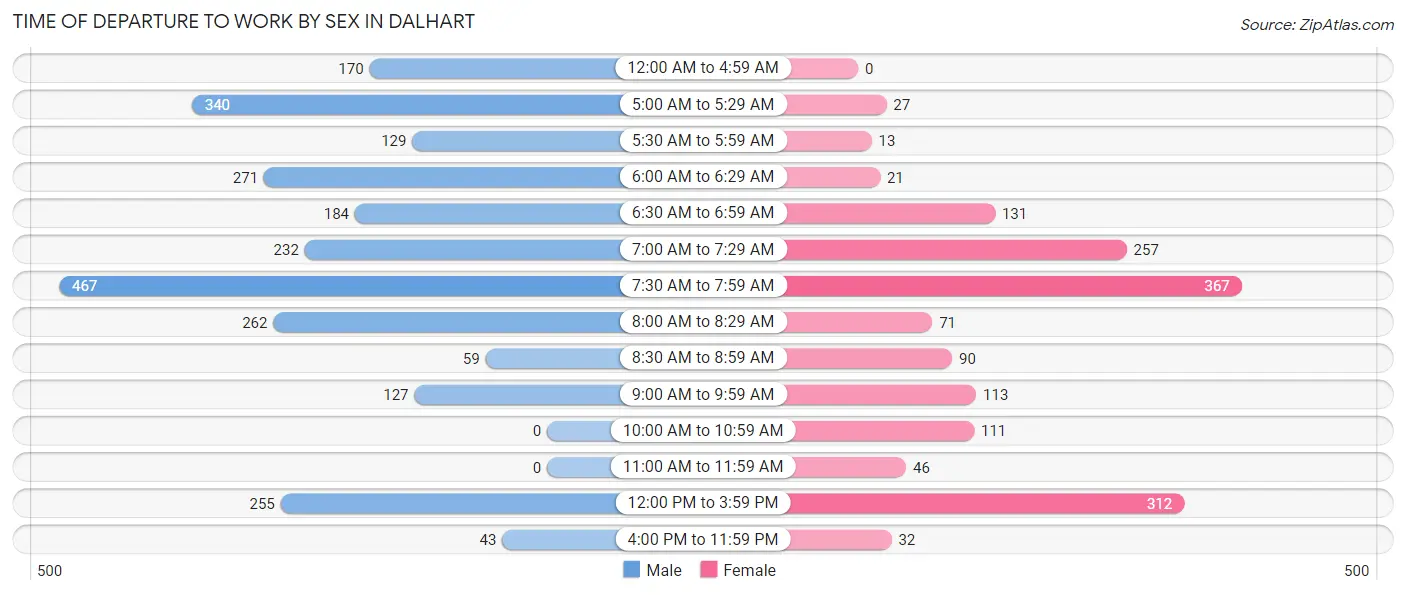
| Time of Departure | Male | Female |
| 12:00 AM to 4:59 AM | 170 (6.7%) | 0 (0.0%) |
| 5:00 AM to 5:29 AM | 340 (13.4%) | 27 (1.7%) |
| 5:30 AM to 5:59 AM | 129 (5.1%) | 13 (0.8%) |
| 6:00 AM to 6:29 AM | 271 (10.7%) | 21 (1.3%) |
| 6:30 AM to 6:59 AM | 184 (7.2%) | 131 (8.2%) |
| 7:00 AM to 7:29 AM | 232 (9.1%) | 257 (16.2%) |
| 7:30 AM to 7:59 AM | 467 (18.4%) | 367 (23.1%) |
| 8:00 AM to 8:29 AM | 262 (10.3%) | 71 (4.5%) |
| 8:30 AM to 8:59 AM | 59 (2.3%) | 90 (5.7%) |
| 9:00 AM to 9:59 AM | 127 (5.0%) | 113 (7.1%) |
| 10:00 AM to 10:59 AM | 0 (0.0%) | 111 (7.0%) |
| 11:00 AM to 11:59 AM | 0 (0.0%) | 46 (2.9%) |
| 12:00 PM to 3:59 PM | 255 (10.0%) | 312 (19.6%) |
| 4:00 PM to 11:59 PM | 43 (1.7%) | 32 (2.0%) |
| Total | 2,539 (100.0%) | 1,591 (100.0%) |
Housing Occupancy in Dalhart
Occupancy by Ownership in Dalhart
Of the total 2,820 dwellings in Dalhart, owner-occupied units account for 2,202 (78.1%), while renter-occupied units make up 618 (21.9%).
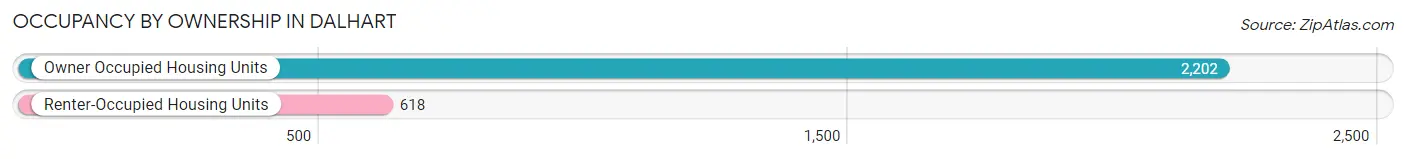
| Occupancy | # Housing Units | % Housing Units |
| Owner Occupied Housing Units | 2,202 | 78.1% |
| Renter-Occupied Housing Units | 618 | 21.9% |
| Total Occupied Housing Units | 2,820 | 100.0% |
Occupancy by Household Size in Dalhart
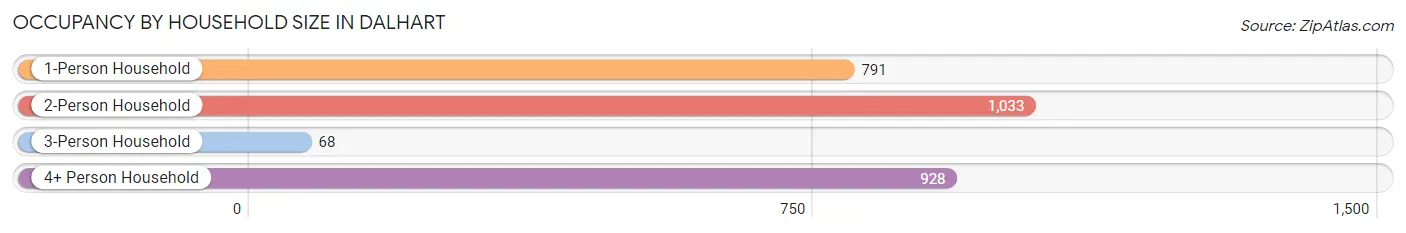
| Household Size | # Housing Units | % Housing Units |
| 1-Person Household | 791 | 28.1% |
| 2-Person Household | 1,033 | 36.6% |
| 3-Person Household | 68 | 2.4% |
| 4+ Person Household | 928 | 32.9% |
| Total Housing Units | 2,820 | 100.0% |
Occupancy by Ownership by Household Size in Dalhart
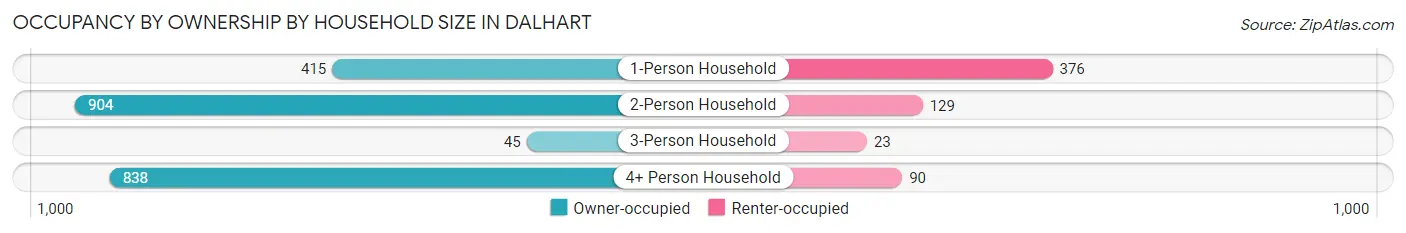
| Household Size | Owner-occupied | Renter-occupied |
| 1-Person Household | 415 (52.5%) | 376 (47.5%) |
| 2-Person Household | 904 (87.5%) | 129 (12.5%) |
| 3-Person Household | 45 (66.2%) | 23 (33.8%) |
| 4+ Person Household | 838 (90.3%) | 90 (9.7%) |
| Total Housing Units | 2,202 (78.1%) | 618 (21.9%) |
Occupancy by Educational Attainment in Dalhart
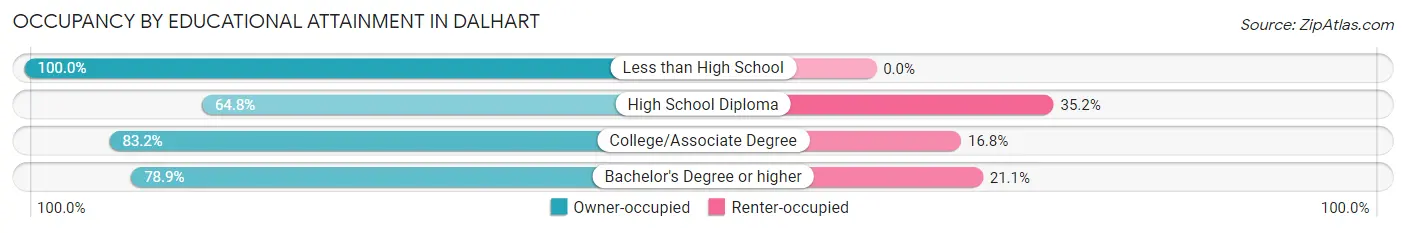
| Household Size | Owner-occupied | Renter-occupied |
| Less than High School | 391 (100.0%) | 0 (0.0%) |
| High School Diploma | 625 (64.8%) | 339 (35.2%) |
| College/Associate Degree | 593 (83.2%) | 120 (16.8%) |
| Bachelor's Degree or higher | 593 (78.9%) | 159 (21.1%) |
Occupancy by Age of Householder in Dalhart
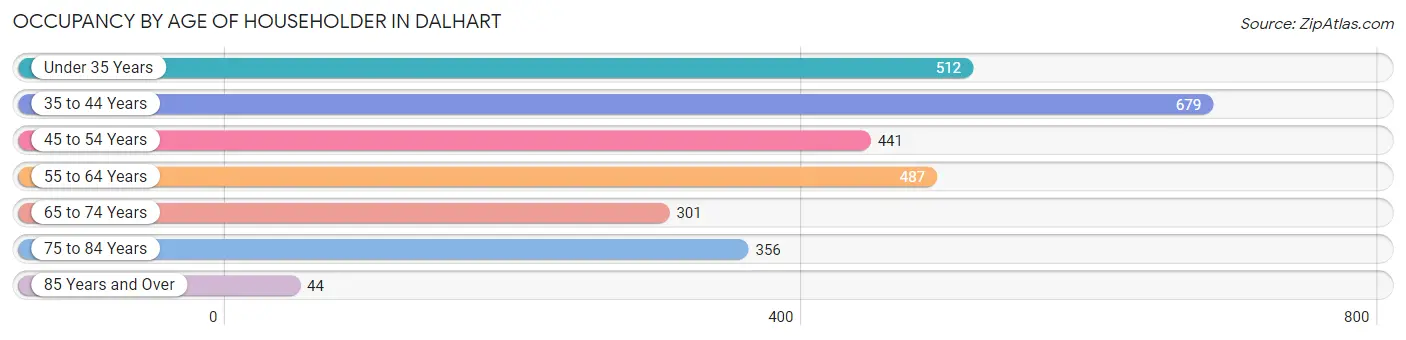
| Age Bracket | # Households | % Households |
| Under 35 Years | 512 | 18.2% |
| 35 to 44 Years | 679 | 24.1% |
| 45 to 54 Years | 441 | 15.6% |
| 55 to 64 Years | 487 | 17.3% |
| 65 to 74 Years | 301 | 10.7% |
| 75 to 84 Years | 356 | 12.6% |
| 85 Years and Over | 44 | 1.6% |
| Total | 2,820 | 100.0% |
Housing Finances in Dalhart
Median Income by Occupancy in Dalhart
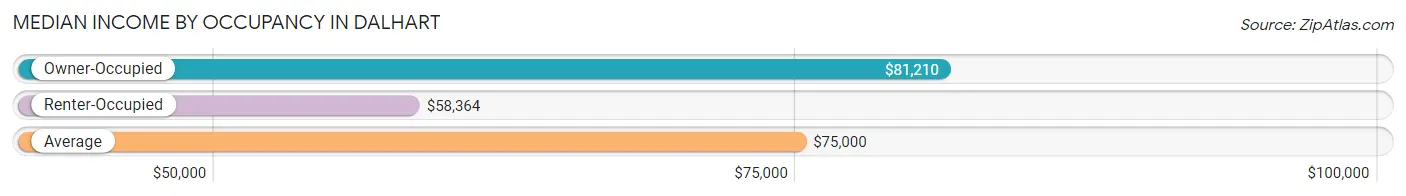
| Occupancy Type | # Households | Median Income |
| Owner-Occupied | 2,202 (78.1%) | $81,210 |
| Renter-Occupied | 618 (21.9%) | $58,364 |
| Average | 2,820 (100.0%) | $75,000 |
Occupancy by Householder Income Bracket in Dalhart
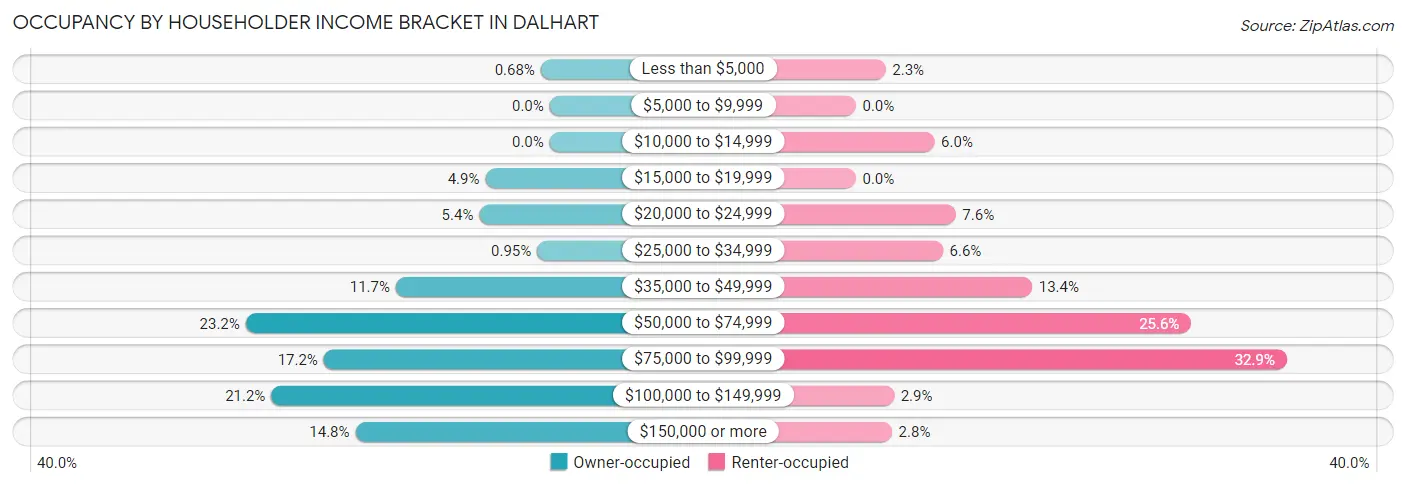
| Income Bracket | Owner-occupied | Renter-occupied |
| Less than $5,000 | 15 (0.7%) | 14 (2.3%) |
| $5,000 to $9,999 | 0 (0.0%) | 0 (0.0%) |
| $10,000 to $14,999 | 0 (0.0%) | 37 (6.0%) |
| $15,000 to $19,999 | 108 (4.9%) | 0 (0.0%) |
| $20,000 to $24,999 | 118 (5.4%) | 47 (7.6%) |
| $25,000 to $34,999 | 21 (0.9%) | 41 (6.6%) |
| $35,000 to $49,999 | 258 (11.7%) | 83 (13.4%) |
| $50,000 to $74,999 | 510 (23.2%) | 158 (25.6%) |
| $75,000 to $99,999 | 379 (17.2%) | 203 (32.9%) |
| $100,000 to $149,999 | 467 (21.2%) | 18 (2.9%) |
| $150,000 or more | 326 (14.8%) | 17 (2.8%) |
| Total | 2,202 (100.0%) | 618 (100.0%) |
Monthly Housing Cost Tiers in Dalhart
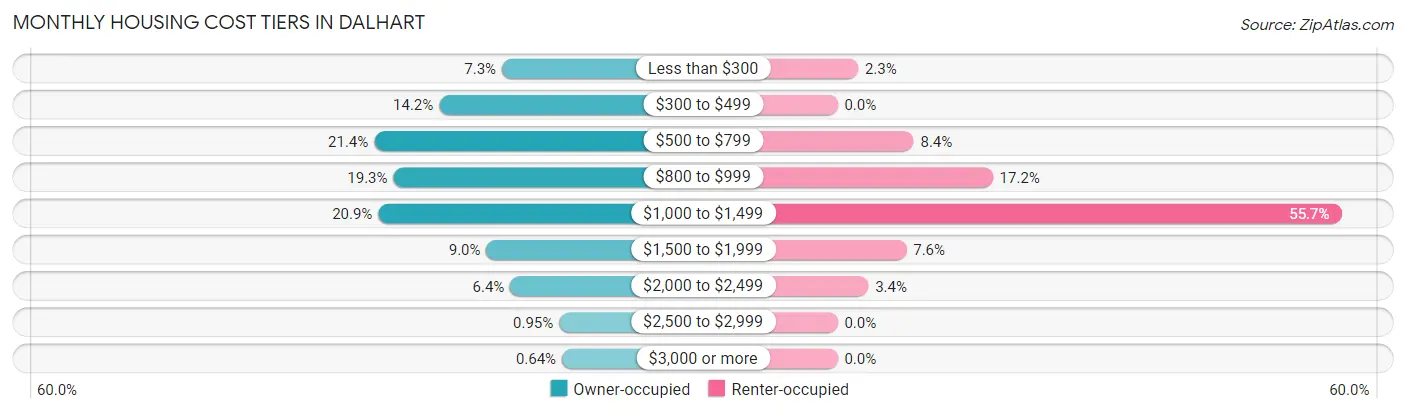
| Monthly Cost | Owner-occupied | Renter-occupied |
| Less than $300 | 160 (7.3%) | 14 (2.3%) |
| $300 to $499 | 313 (14.2%) | 0 (0.0%) |
| $500 to $799 | 471 (21.4%) | 52 (8.4%) |
| $800 to $999 | 424 (19.3%) | 106 (17.2%) |
| $1,000 to $1,499 | 461 (20.9%) | 344 (55.7%) |
| $1,500 to $1,999 | 198 (9.0%) | 47 (7.6%) |
| $2,000 to $2,499 | 140 (6.4%) | 21 (3.4%) |
| $2,500 to $2,999 | 21 (0.9%) | 0 (0.0%) |
| $3,000 or more | 14 (0.6%) | 0 (0.0%) |
| Total | 2,202 (100.0%) | 618 (100.0%) |
Physical Housing Characteristics in Dalhart
Housing Structures in Dalhart
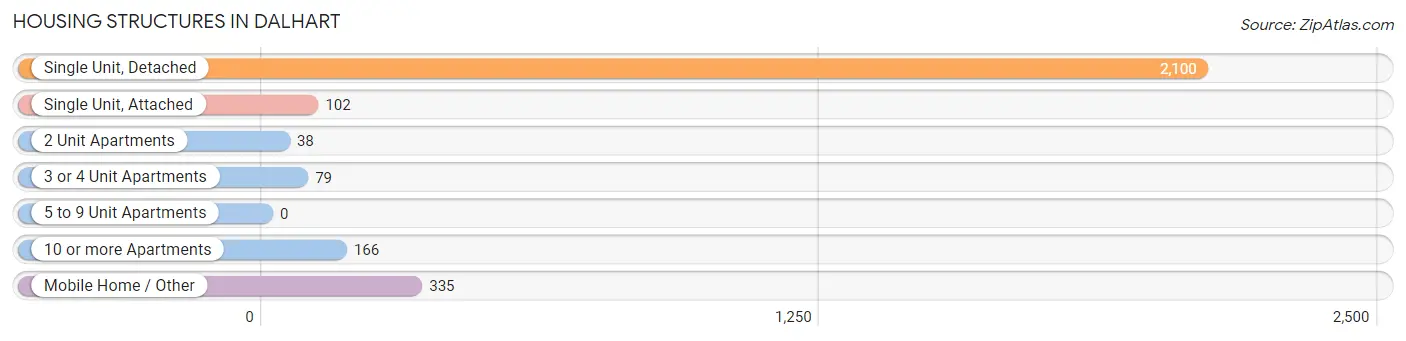
| Structure Type | # Housing Units | % Housing Units |
| Single Unit, Detached | 2,100 | 74.5% |
| Single Unit, Attached | 102 | 3.6% |
| 2 Unit Apartments | 38 | 1.3% |
| 3 or 4 Unit Apartments | 79 | 2.8% |
| 5 to 9 Unit Apartments | 0 | 0.0% |
| 10 or more Apartments | 166 | 5.9% |
| Mobile Home / Other | 335 | 11.9% |
| Total | 2,820 | 100.0% |
Housing Structures by Occupancy in Dalhart
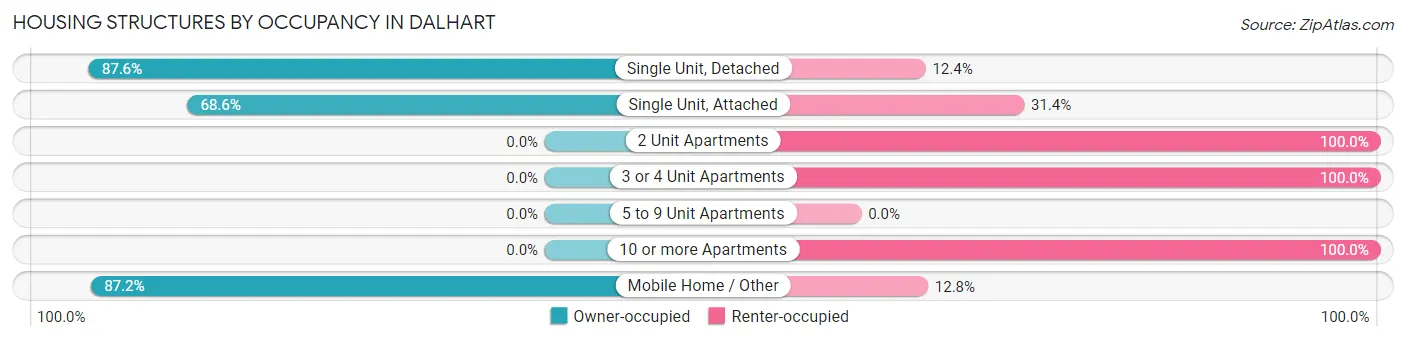
| Structure Type | Owner-occupied | Renter-occupied |
| Single Unit, Detached | 1,840 (87.6%) | 260 (12.4%) |
| Single Unit, Attached | 70 (68.6%) | 32 (31.4%) |
| 2 Unit Apartments | 0 (0.0%) | 38 (100.0%) |
| 3 or 4 Unit Apartments | 0 (0.0%) | 79 (100.0%) |
| 5 to 9 Unit Apartments | 0 (0.0%) | 0 (0.0%) |
| 10 or more Apartments | 0 (0.0%) | 166 (100.0%) |
| Mobile Home / Other | 292 (87.2%) | 43 (12.8%) |
| Total | 2,202 (78.1%) | 618 (21.9%) |
Housing Structures by Number of Rooms in Dalhart
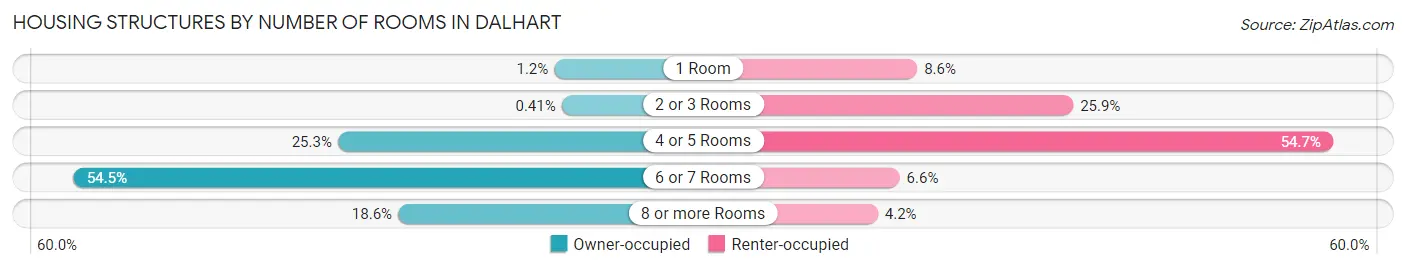
| Number of Rooms | Owner-occupied | Renter-occupied |
| 1 Room | 27 (1.2%) | 53 (8.6%) |
| 2 or 3 Rooms | 9 (0.4%) | 160 (25.9%) |
| 4 or 5 Rooms | 556 (25.3%) | 338 (54.7%) |
| 6 or 7 Rooms | 1,201 (54.5%) | 41 (6.6%) |
| 8 or more Rooms | 409 (18.6%) | 26 (4.2%) |
| Total | 2,202 (100.0%) | 618 (100.0%) |
Housing Structure by Heating Type in Dalhart
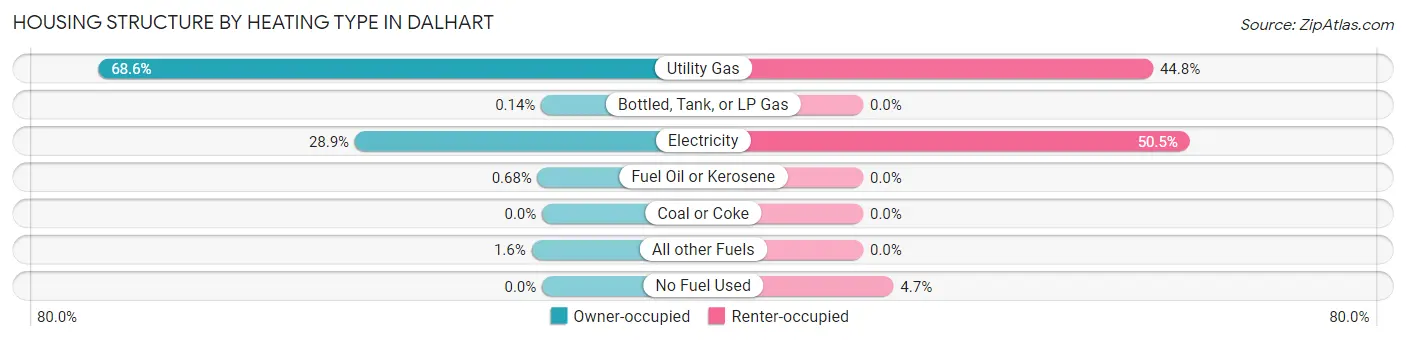
| Heating Type | Owner-occupied | Renter-occupied |
| Utility Gas | 1,511 (68.6%) | 277 (44.8%) |
| Bottled, Tank, or LP Gas | 3 (0.1%) | 0 (0.0%) |
| Electricity | 637 (28.9%) | 312 (50.5%) |
| Fuel Oil or Kerosene | 15 (0.7%) | 0 (0.0%) |
| Coal or Coke | 0 (0.0%) | 0 (0.0%) |
| All other Fuels | 36 (1.6%) | 0 (0.0%) |
| No Fuel Used | 0 (0.0%) | 29 (4.7%) |
| Total | 2,202 (100.0%) | 618 (100.0%) |
Household Vehicle Usage in Dalhart
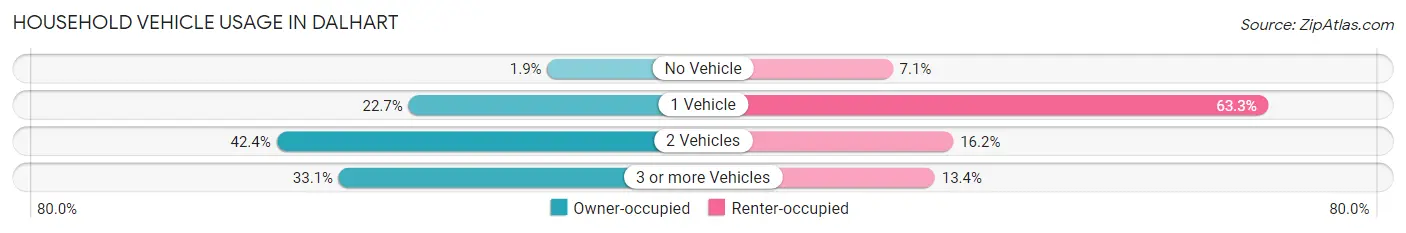
| Vehicles per Household | Owner-occupied | Renter-occupied |
| No Vehicle | 42 (1.9%) | 44 (7.1%) |
| 1 Vehicle | 499 (22.7%) | 391 (63.3%) |
| 2 Vehicles | 933 (42.4%) | 100 (16.2%) |
| 3 or more Vehicles | 728 (33.1%) | 83 (13.4%) |
| Total | 2,202 (100.0%) | 618 (100.0%) |
Real Estate & Mortgages in Dalhart
Real Estate and Mortgage Overview in Dalhart
| Characteristic | Without Mortgage | With Mortgage |
| Housing Units | 1,150 | 1,052 |
| Median Property Value | $142,600 | $130,900 |
| Median Household Income | $59,956 | $178 |
| Monthly Housing Costs | $534 | $0 |
| Real Estate Taxes | $1,343 | $36 |
Property Value by Mortgage Status in Dalhart
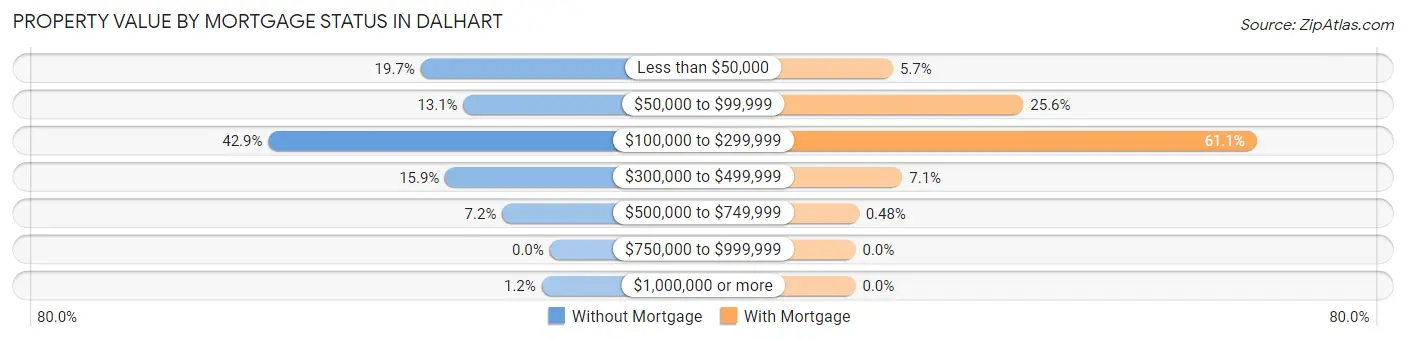
| Property Value | Without Mortgage | With Mortgage |
| Less than $50,000 | 226 (19.7%) | 60 (5.7%) |
| $50,000 to $99,999 | 151 (13.1%) | 269 (25.6%) |
| $100,000 to $299,999 | 493 (42.9%) | 643 (61.1%) |
| $300,000 to $499,999 | 183 (15.9%) | 75 (7.1%) |
| $500,000 to $749,999 | 83 (7.2%) | 5 (0.5%) |
| $750,000 to $999,999 | 0 (0.0%) | 0 (0.0%) |
| $1,000,000 or more | 14 (1.2%) | 0 (0.0%) |
| Total | 1,150 (100.0%) | 1,052 (100.0%) |
Household Income by Mortgage Status in Dalhart
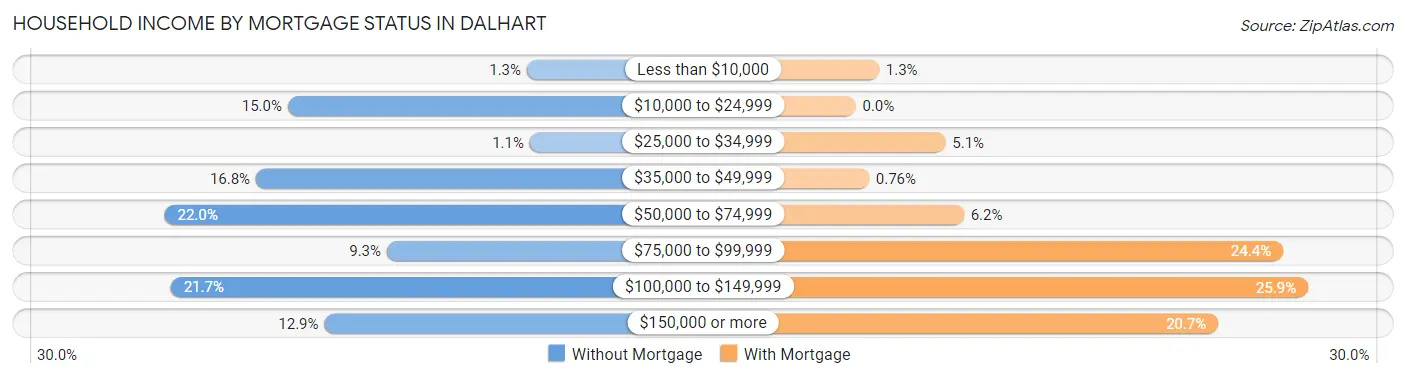
| Household Income | Without Mortgage | With Mortgage |
| Less than $10,000 | 15 (1.3%) | 14 (1.3%) |
| $10,000 to $24,999 | 172 (15.0%) | 0 (0.0%) |
| $25,000 to $34,999 | 13 (1.1%) | 54 (5.1%) |
| $35,000 to $49,999 | 193 (16.8%) | 8 (0.8%) |
| $50,000 to $74,999 | 253 (22.0%) | 65 (6.2%) |
| $75,000 to $99,999 | 107 (9.3%) | 257 (24.4%) |
| $100,000 to $149,999 | 249 (21.6%) | 272 (25.9%) |
| $150,000 or more | 148 (12.9%) | 218 (20.7%) |
| Total | 1,150 (100.0%) | 1,052 (100.0%) |
Property Value to Household Income Ratio in Dalhart
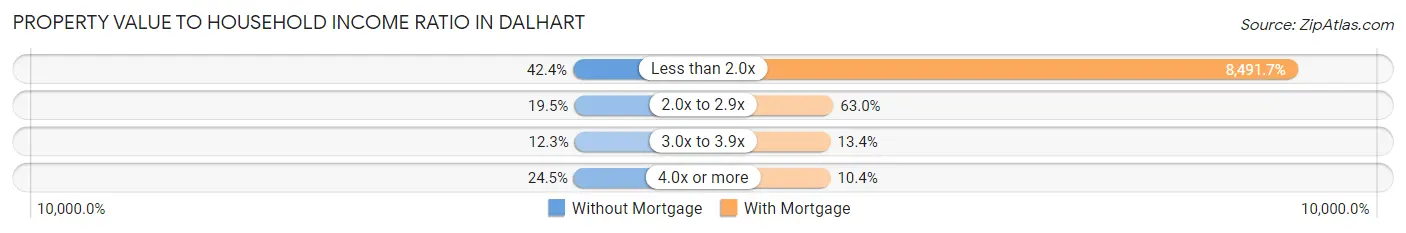
| Value-to-Income Ratio | Without Mortgage | With Mortgage |
| Less than 2.0x | 488 (42.4%) | 89,333 (8,491.7%) |
| 2.0x to 2.9x | 224 (19.5%) | 663 (63.0%) |
| 3.0x to 3.9x | 141 (12.3%) | 141 (13.4%) |
| 4.0x or more | 282 (24.5%) | 109 (10.4%) |
| Total | 1,150 (100.0%) | 1,052 (100.0%) |
Real Estate Taxes by Mortgage Status in Dalhart
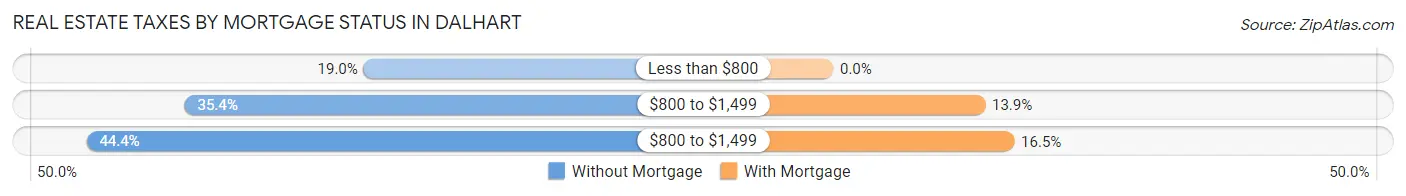
| Property Taxes | Without Mortgage | With Mortgage |
| Less than $800 | 219 (19.0%) | 0 (0.0%) |
| $800 to $1,499 | 407 (35.4%) | 146 (13.9%) |
| $800 to $1,499 | 510 (44.4%) | 174 (16.5%) |
| Total | 1,150 (100.0%) | 1,052 (100.0%) |
Health & Disability in Dalhart
Health Insurance Coverage by Age in Dalhart
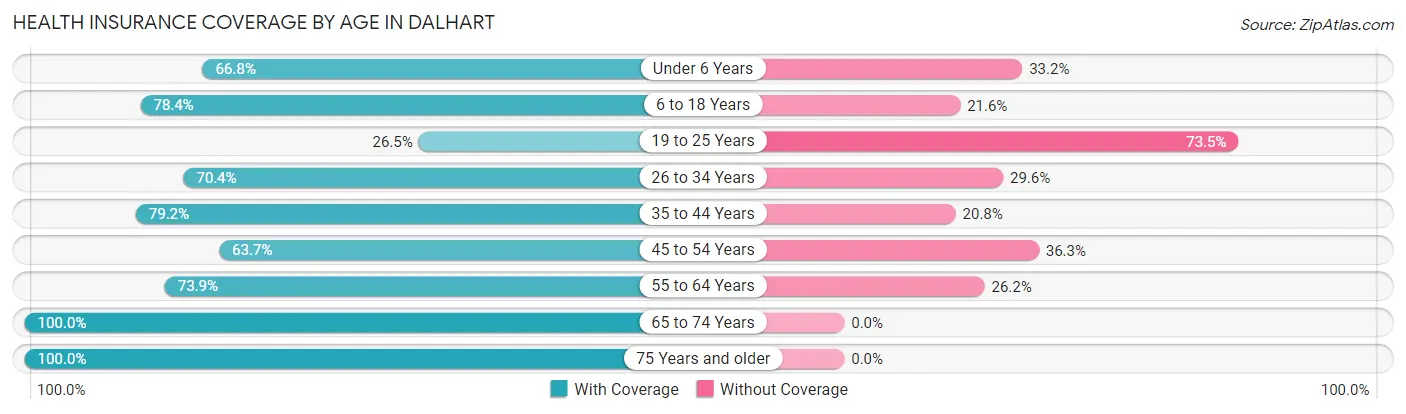
| Age Bracket | With Coverage | Without Coverage |
| Under 6 Years | 449 (66.8%) | 223 (33.2%) |
| 6 to 18 Years | 1,440 (78.4%) | 397 (21.6%) |
| 19 to 25 Years | 211 (26.5%) | 584 (73.5%) |
| 26 to 34 Years | 504 (70.4%) | 212 (29.6%) |
| 35 to 44 Years | 832 (79.2%) | 218 (20.8%) |
| 45 to 54 Years | 557 (63.7%) | 317 (36.3%) |
| 55 to 64 Years | 644 (73.9%) | 228 (26.2%) |
| 65 to 74 Years | 590 (100.0%) | 0 (0.0%) |
| 75 Years and older | 509 (100.0%) | 0 (0.0%) |
| Total | 5,736 (72.5%) | 2,179 (27.5%) |
Health Insurance Coverage by Citizenship Status in Dalhart
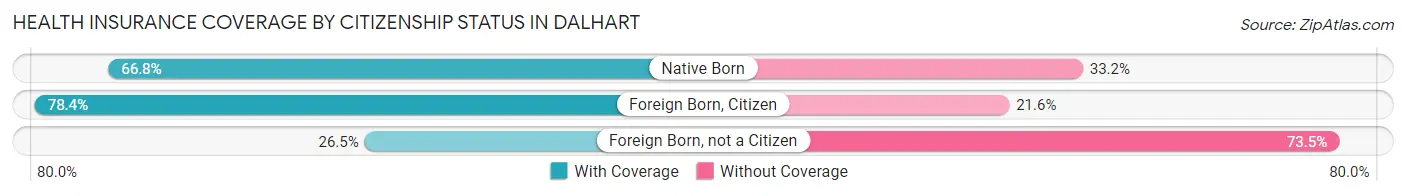
| Citizenship Status | With Coverage | Without Coverage |
| Native Born | 449 (66.8%) | 223 (33.2%) |
| Foreign Born, Citizen | 1,440 (78.4%) | 397 (21.6%) |
| Foreign Born, not a Citizen | 211 (26.5%) | 584 (73.5%) |
Health Insurance Coverage by Household Income in Dalhart
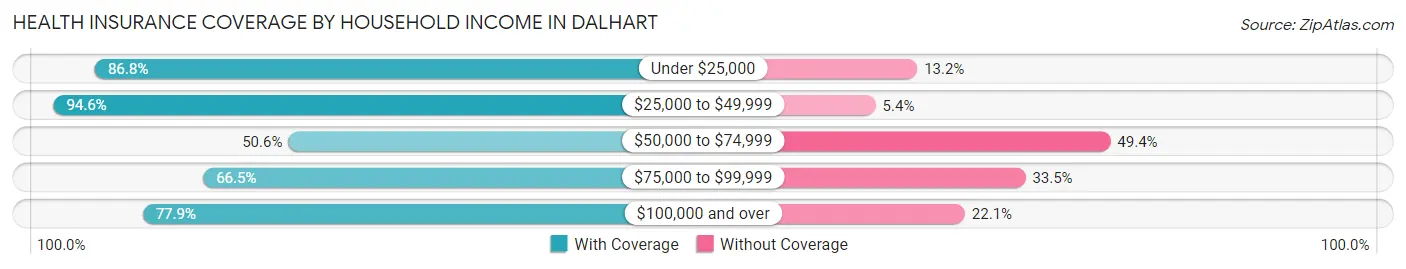
| Household Income | With Coverage | Without Coverage |
| Under $25,000 | 487 (86.8%) | 74 (13.2%) |
| $25,000 to $49,999 | 997 (94.6%) | 57 (5.4%) |
| $50,000 to $74,999 | 750 (50.6%) | 732 (49.4%) |
| $75,000 to $99,999 | 1,469 (66.5%) | 739 (33.5%) |
| $100,000 and over | 2,027 (77.9%) | 576 (22.1%) |
Public vs Private Health Insurance Coverage by Age in Dalhart
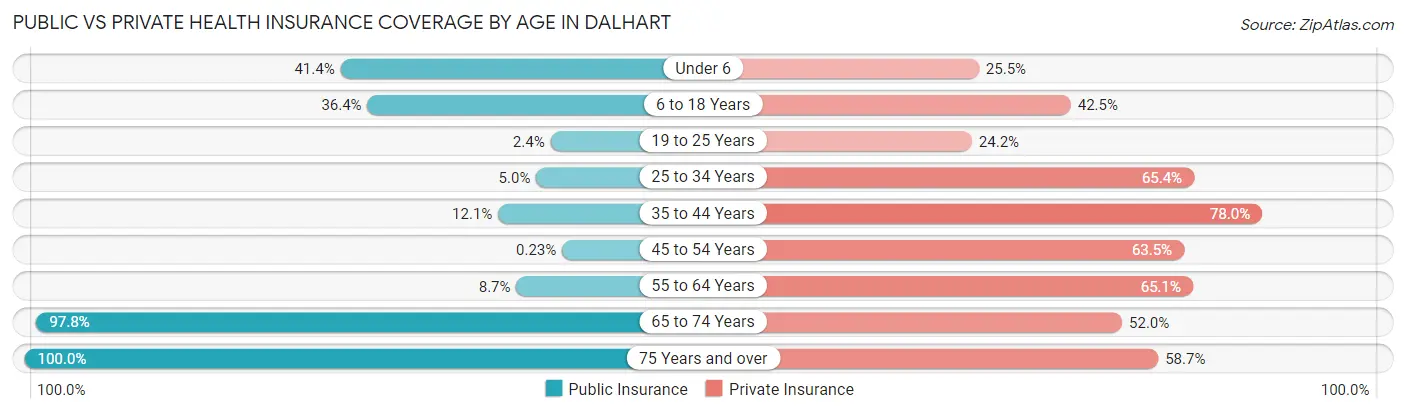
| Age Bracket | Public Insurance | Private Insurance |
| Under 6 | 278 (41.4%) | 171 (25.5%) |
| 6 to 18 Years | 668 (36.4%) | 781 (42.5%) |
| 19 to 25 Years | 19 (2.4%) | 192 (24.1%) |
| 25 to 34 Years | 36 (5.0%) | 468 (65.4%) |
| 35 to 44 Years | 127 (12.1%) | 819 (78.0%) |
| 45 to 54 Years | 2 (0.2%) | 555 (63.5%) |
| 55 to 64 Years | 76 (8.7%) | 568 (65.1%) |
| 65 to 74 Years | 577 (97.8%) | 307 (52.0%) |
| 75 Years and over | 509 (100.0%) | 299 (58.7%) |
| Total | 2,292 (29.0%) | 4,160 (52.6%) |
Disability Status by Sex by Age in Dalhart
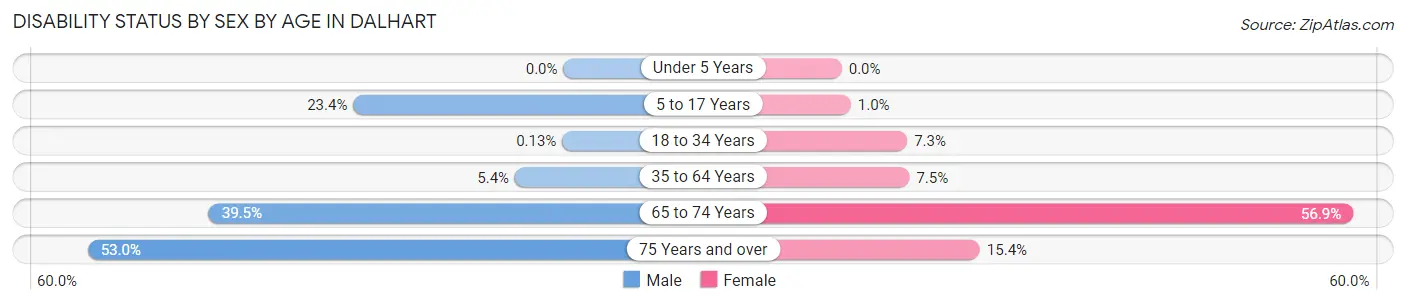
| Age Bracket | Male | Female |
| Under 5 Years | 0 (0.0%) | 0 (0.0%) |
| 5 to 17 Years | 198 (23.4%) | 9 (1.0%) |
| 18 to 34 Years | 1 (0.1%) | 60 (7.3%) |
| 35 to 64 Years | 85 (5.4%) | 92 (7.5%) |
| 65 to 74 Years | 122 (39.5%) | 160 (56.9%) |
| 75 Years and over | 125 (53.0%) | 42 (15.4%) |
Disability Class by Sex by Age in Dalhart
Disability Class: Hearing Difficulty
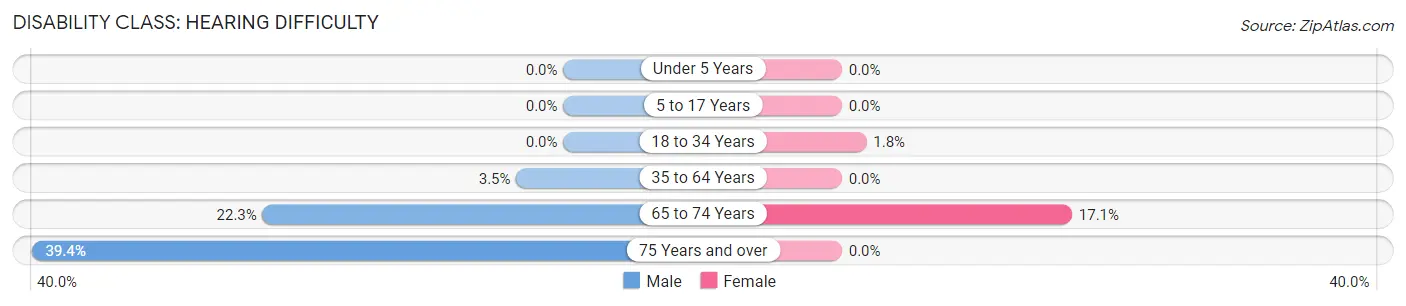
| Age Bracket | Male | Female |
| Under 5 Years | 0 (0.0%) | 0 (0.0%) |
| 5 to 17 Years | 0 (0.0%) | 0 (0.0%) |
| 18 to 34 Years | 0 (0.0%) | 15 (1.8%) |
| 35 to 64 Years | 55 (3.5%) | 0 (0.0%) |
| 65 to 74 Years | 69 (22.3%) | 48 (17.1%) |
| 75 Years and over | 93 (39.4%) | 0 (0.0%) |
Disability Class: Vision Difficulty
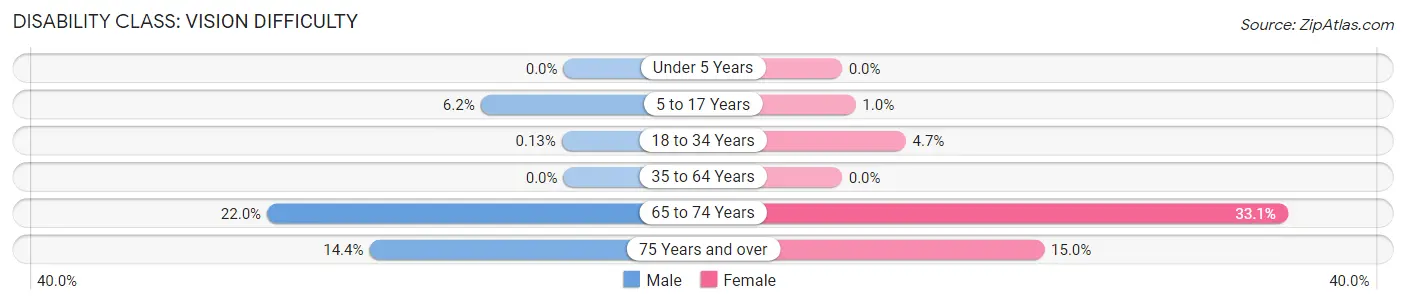
| Age Bracket | Male | Female |
| Under 5 Years | 0 (0.0%) | 0 (0.0%) |
| 5 to 17 Years | 52 (6.1%) | 9 (1.0%) |
| 18 to 34 Years | 1 (0.1%) | 39 (4.7%) |
| 35 to 64 Years | 0 (0.0%) | 0 (0.0%) |
| 65 to 74 Years | 68 (22.0%) | 93 (33.1%) |
| 75 Years and over | 34 (14.4%) | 41 (15.0%) |
Disability Class: Cognitive Difficulty
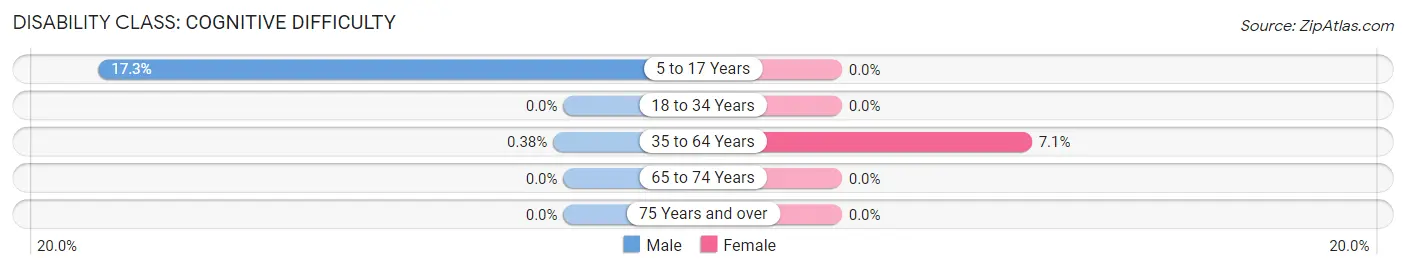
| Age Bracket | Male | Female |
| 5 to 17 Years | 146 (17.3%) | 0 (0.0%) |
| 18 to 34 Years | 0 (0.0%) | 0 (0.0%) |
| 35 to 64 Years | 6 (0.4%) | 86 (7.0%) |
| 65 to 74 Years | 0 (0.0%) | 0 (0.0%) |
| 75 Years and over | 0 (0.0%) | 0 (0.0%) |
Disability Class: Ambulatory Difficulty
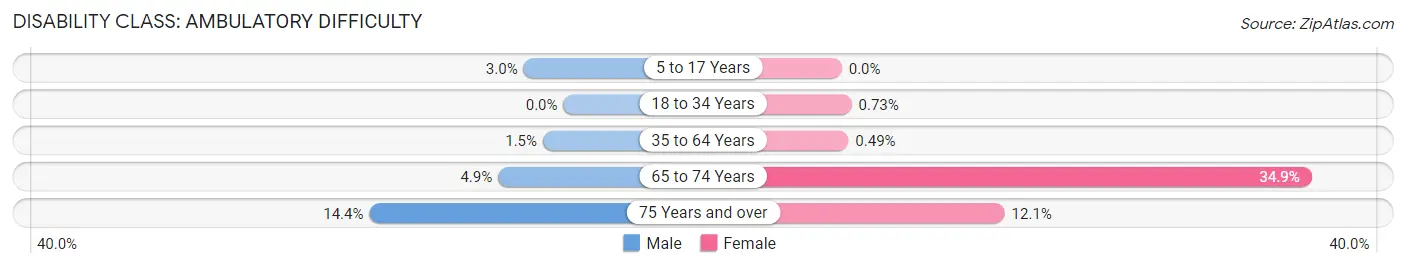
| Age Bracket | Male | Female |
| 5 to 17 Years | 25 (3.0%) | 0 (0.0%) |
| 18 to 34 Years | 0 (0.0%) | 6 (0.7%) |
| 35 to 64 Years | 24 (1.5%) | 6 (0.5%) |
| 65 to 74 Years | 15 (4.9%) | 98 (34.9%) |
| 75 Years and over | 34 (14.4%) | 33 (12.1%) |
Disability Class: Self-Care Difficulty
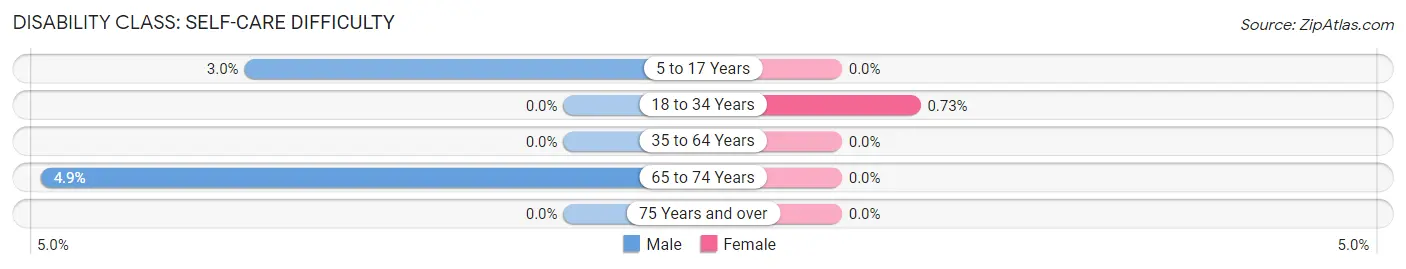
| Age Bracket | Male | Female |
| 5 to 17 Years | 25 (3.0%) | 0 (0.0%) |
| 18 to 34 Years | 0 (0.0%) | 6 (0.7%) |
| 35 to 64 Years | 0 (0.0%) | 0 (0.0%) |
| 65 to 74 Years | 15 (4.9%) | 0 (0.0%) |
| 75 Years and over | 0 (0.0%) | 0 (0.0%) |
Technology Access in Dalhart
Computing Device Access in Dalhart
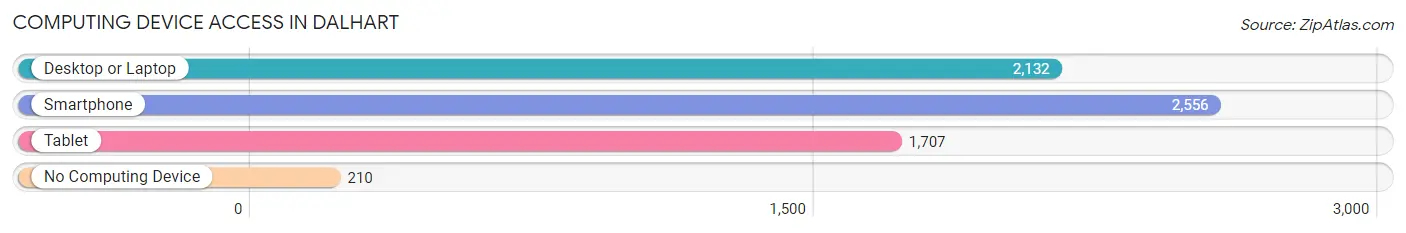
| Device Type | # Households | % Households |
| Desktop or Laptop | 2,132 | 75.6% |
| Smartphone | 2,556 | 90.6% |
| Tablet | 1,707 | 60.5% |
| No Computing Device | 210 | 7.4% |
| Total | 2,820 | 100.0% |
Internet Access in Dalhart
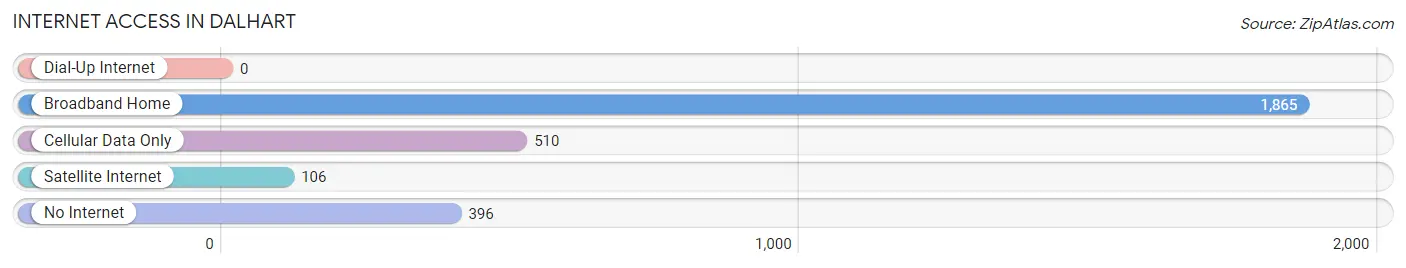
| Internet Type | # Households | % Households |
| Dial-Up Internet | 0 | 0.0% |
| Broadband Home | 1,865 | 66.1% |
| Cellular Data Only | 510 | 18.1% |
| Satellite Internet | 106 | 3.8% |
| No Internet | 396 | 14.0% |
| Total | 2,820 | 100.0% |
Dalhart Summary
Dalhart is a city located in the northwest corner of the Texas Panhandle. It is the county seat of Dallam County and is located on the border of Texas and Oklahoma. The city is situated on the High Plains of the Llano Estacado, a vast region of flat land that stretches from the Texas Panhandle to the Rocky Mountains. The city is known for its windy climate, its agricultural production, and its proximity to the Oklahoma border.
History
The area that is now Dalhart was first settled in the late 19th century by ranchers and farmers. The town was originally known as “Dalhart” after two of its earliest settlers, Dallam and Hart. The town was officially incorporated in 1901 and quickly grew to become a major center for the region’s agricultural production.
In the early 20th century, Dalhart was a major stop on the Chicago, Rock Island and Pacific Railroad. The railroad brought a large influx of new settlers to the area, and the town quickly grew to become a major center for the region’s agricultural production.
In the 1920s, Dalhart was the site of a major dust storm, which caused significant damage to the town and its surrounding area. The storm was part of a larger phenomenon known as the Dust Bowl, which affected much of the Great Plains region during the 1930s.
Geography
Dalhart is located in the northwest corner of the Texas Panhandle, on the border of Texas and Oklahoma. The city is situated on the High Plains of the Llano Estacado, a vast region of flat land that stretches from the Texas Panhandle to the Rocky Mountains. The city is known for its windy climate, its agricultural production, and its proximity to the Oklahoma border.
The city is located at the intersection of U.S. Highway 87 and U.S. Highway 54. The city is served by the Dalhart Municipal Airport, which is located just outside of town.
Economy
Dalhart’s economy is largely based on agriculture. The city is a major center for the region’s agricultural production, with a variety of crops grown in the area, including wheat, corn, sorghum, and cotton. The city is also home to a number of livestock operations, including cattle, sheep, and hogs.
In addition to agriculture, Dalhart is home to a number of manufacturing and service-based businesses. The city is home to a number of oil and gas companies, as well as a number of businesses that provide services to the agricultural industry.
Demographics
As of the 2010 census, the population of Dalhart was 7,930. The city has a population that is predominantly white (86.3%), with a small Hispanic population (7.7%) and a small African American population (2.2%). The median household income in Dalhart is $41,945, and the median home value is $90,000. The city has a poverty rate of 17.2%.
Conclusion
Dalhart is a city located in the northwest corner of the Texas Panhandle. It is the county seat of Dallam County and is located on the border of Texas and Oklahoma. The city is known for its windy climate, its agricultural production, and its proximity to the Oklahoma border. The city’s economy is largely based on agriculture, and it is home to a number of manufacturing and service-based businesses. The population of Dalhart is predominantly white, with a small Hispanic and African American population. The median household income in Dalhart is $41,945, and the median home value is $90,000.
Common Questions
What is Per Capita Income in Dalhart?
Per Capita income in Dalhart is $30,162.
What is the Median Family Income in Dalhart?
Median Family Income in Dalhart is $89,309.
What is the Median Household income in Dalhart?
Median Household Income in Dalhart is $75,000.
What is Income or Wage Gap in Dalhart?
Income or Wage Gap in Dalhart is 54.4%.
Women in Dalhart earn 45.6 cents for every dollar earned by a man.
What is Inequality or Gini Index in Dalhart?
Inequality or Gini Index in Dalhart is 0.35.
What is the Total Population of Dalhart?
Total Population of Dalhart is 8,013.
What is the Total Male Population of Dalhart?
Total Male Population of Dalhart is 4,040.
What is the Total Female Population of Dalhart?
Total Female Population of Dalhart is 3,973.
What is the Ratio of Males per 100 Females in Dalhart?
There are 101.69 Males per 100 Females in Dalhart.
What is the Ratio of Females per 100 Males in Dalhart?
There are 98.34 Females per 100 Males in Dalhart.
What is the Median Population Age in Dalhart?
Median Population Age in Dalhart is 34.7 Years.
What is the Average Family Size in Dalhart
Average Family Size in Dalhart is 3.4 People.
What is the Average Household Size in Dalhart
Average Household Size in Dalhart is 2.8 People.
How Large is the Labor Force in Dalhart?
There are 4,347 People in the Labor Forcein in Dalhart.
What is the Percentage of People in the Labor Force in Dalhart?
75.5% of People are in the Labor Force in Dalhart.
What is the Unemployment Rate in Dalhart?
Unemployment Rate in Dalhart is 2.2%.