Lake Kiowa, TX Map & Demographics
Lake Kiowa Map
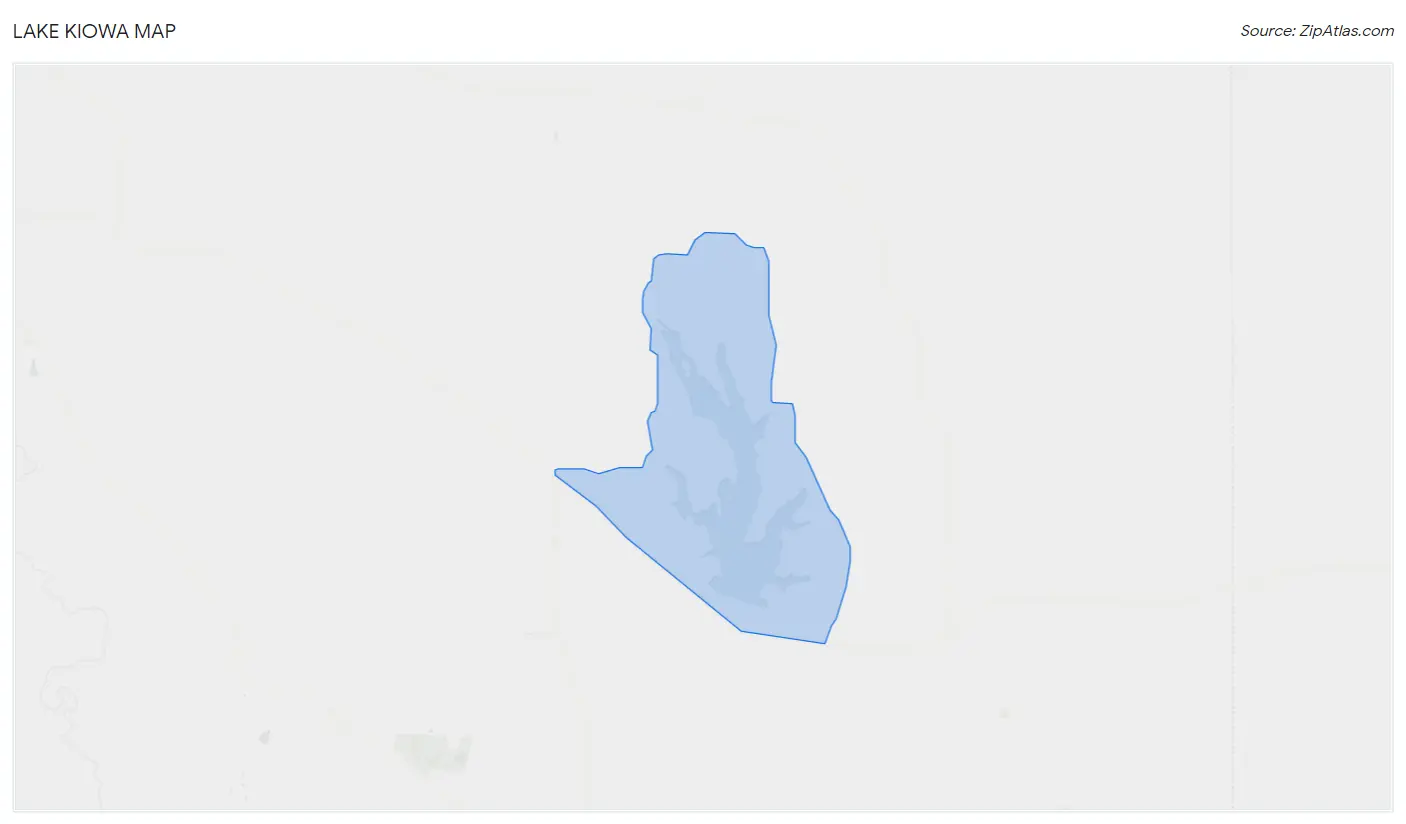
Lake Kiowa Overview
$70,138
PER CAPITA INCOME
$118,620
AVG FAMILY INCOME
$107,414
AVG HOUSEHOLD INCOME
39.9%
WAGE / INCOME GAP [ % ]
60.1¢/ $1
WAGE / INCOME GAP [ $ ]
0.49
INEQUALITY / GINI INDEX
2,728
TOTAL POPULATION
1,176
MALE POPULATION
1,552
FEMALE POPULATION
75.77
MALES / 100 FEMALES
131.97
FEMALES / 100 MALES
58.7
MEDIAN AGE
2.6
AVG FAMILY SIZE
2.3
AVG HOUSEHOLD SIZE
1,251
LABOR FORCE [ PEOPLE ]
53.9%
PERCENT IN LABOR FORCE
Lake Kiowa Area Codes
Income in Lake Kiowa
Income Overview in Lake Kiowa
Per Capita Income in Lake Kiowa is $70,138, while median incomes of families and households are $118,620 and $107,414 respectively.
| Characteristic | Number | Measure |
| Per Capita Income | 2,728 | $70,138 |
| Median Family Income | 961 | $118,620 |
| Mean Family Income | 961 | $185,746 |
| Median Household Income | 1,198 | $107,414 |
| Mean Household Income | 1,198 | $158,970 |
| Income Deficit | 961 | $0 |
| Wage / Income Gap (%) | 2,728 | 39.95% |
| Wage / Income Gap ($) | 2,728 | 60.05¢ per $1 |
| Gini / Inequality Index | 2,728 | 0.49 |
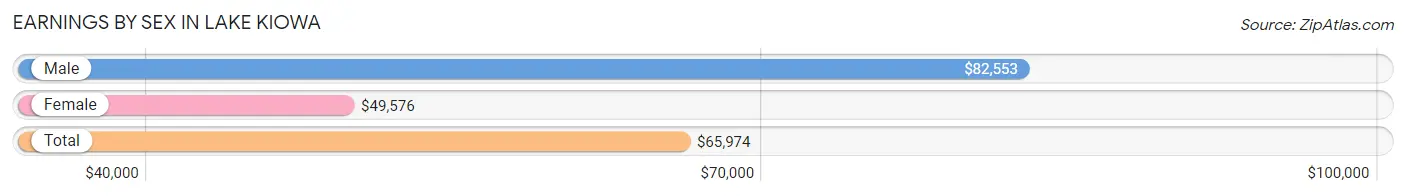
Earnings by Sex in Lake Kiowa
Average Earnings in Lake Kiowa are $65,974, $82,553 for men and $49,576 for women, a difference of 40.0%.
| Sex | Number | Average Earnings |
| Male | 681 (52.3%) | $82,553 |
| Female | 622 (47.7%) | $49,576 |
| Total | 1,303 (100.0%) | $65,974 |
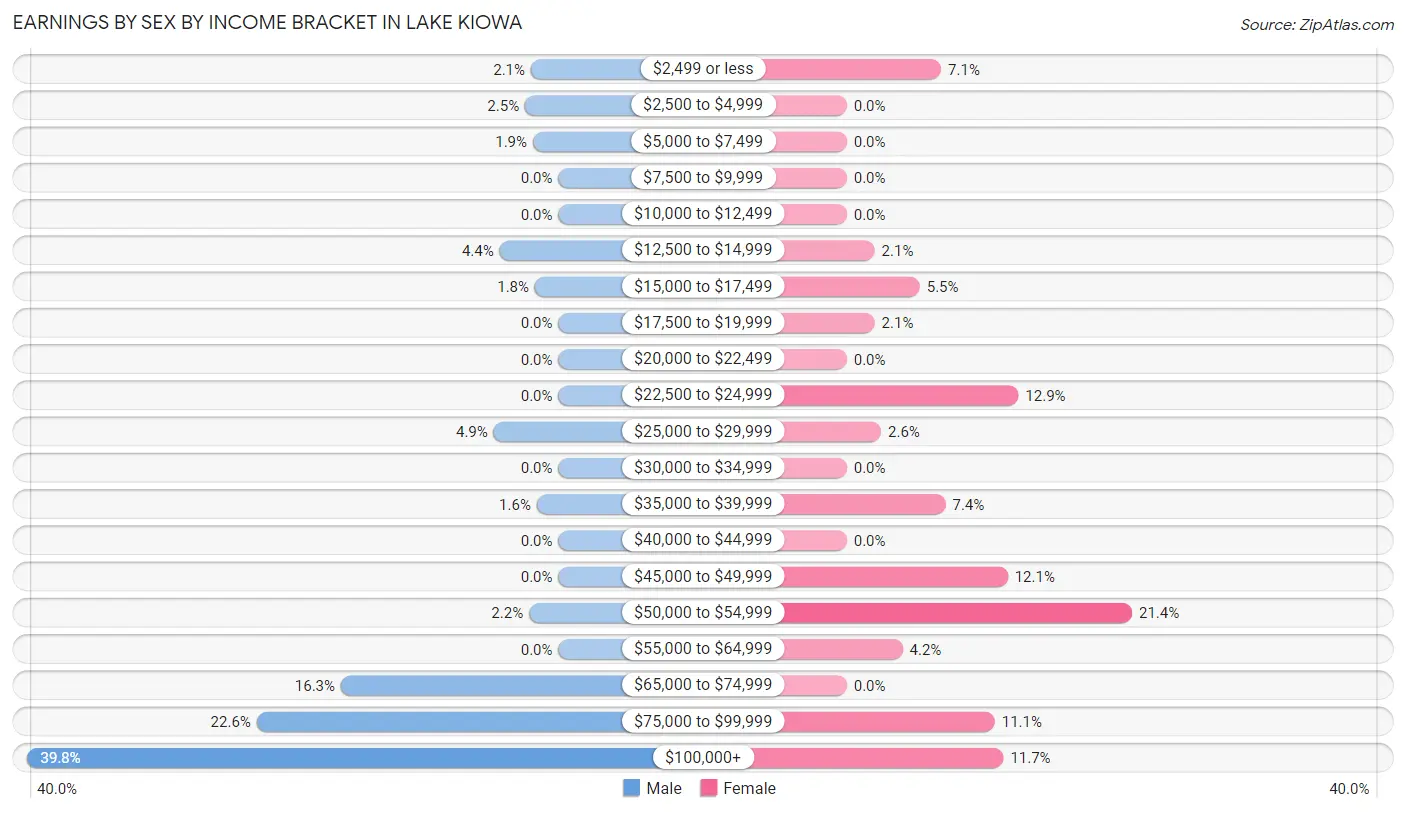
Earnings by Sex by Income Bracket in Lake Kiowa
The most common earnings brackets in Lake Kiowa are $100,000+ for men (271 | 39.8%) and $50,000 to $54,999 for women (133 | 21.4%).
| Income | Male | Female |
| $2,499 or less | 14 (2.1%) | 44 (7.1%) |
| $2,500 to $4,999 | 17 (2.5%) | 0 (0.0%) |
| $5,000 to $7,499 | 13 (1.9%) | 0 (0.0%) |
| $7,500 to $9,999 | 0 (0.0%) | 0 (0.0%) |
| $10,000 to $12,499 | 0 (0.0%) | 0 (0.0%) |
| $12,500 to $14,999 | 30 (4.4%) | 13 (2.1%) |
| $15,000 to $17,499 | 12 (1.8%) | 34 (5.5%) |
| $17,500 to $19,999 | 0 (0.0%) | 13 (2.1%) |
| $20,000 to $22,499 | 0 (0.0%) | 0 (0.0%) |
| $22,500 to $24,999 | 0 (0.0%) | 80 (12.9%) |
| $25,000 to $29,999 | 33 (4.9%) | 16 (2.6%) |
| $30,000 to $34,999 | 0 (0.0%) | 0 (0.0%) |
| $35,000 to $39,999 | 11 (1.6%) | 46 (7.4%) |
| $40,000 to $44,999 | 0 (0.0%) | 0 (0.0%) |
| $45,000 to $49,999 | 0 (0.0%) | 75 (12.1%) |
| $50,000 to $54,999 | 15 (2.2%) | 133 (21.4%) |
| $55,000 to $64,999 | 0 (0.0%) | 26 (4.2%) |
| $65,000 to $74,999 | 111 (16.3%) | 0 (0.0%) |
| $75,000 to $99,999 | 154 (22.6%) | 69 (11.1%) |
| $100,000+ | 271 (39.8%) | 73 (11.7%) |
| Total | 681 (100.0%) | 622 (100.0%) |
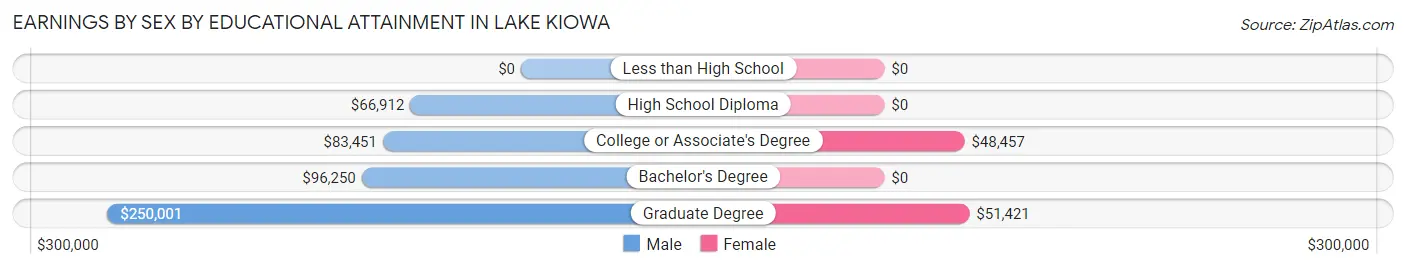
Earnings by Sex by Educational Attainment in Lake Kiowa
Average earnings in Lake Kiowa are $82,852 for men and $49,576 for women, a difference of 40.2%. Men with an educational attainment of graduate degree enjoy the highest average annual earnings of $250,001, while those with high school diploma education earn the least with $66,912. Women with an educational attainment of graduate degree earn the most with the average annual earnings of $51,421, while those with college or associate's degree education have the smallest earnings of $48,457.
| Educational Attainment | Male Income | Female Income |
| Less than High School | - | - |
| High School Diploma | $66,912 | $0 |
| College or Associate's Degree | $83,451 | $48,457 |
| Bachelor's Degree | $96,250 | $0 |
| Graduate Degree | $250,001 | $51,421 |
| Total | $82,852 | $49,576 |
Family Income in Lake Kiowa
Family Income Brackets in Lake Kiowa
According to the Lake Kiowa family income data, there are 439 families falling into the $100,000 to $149,999 income range, which is the most common income bracket and makes up 45.7% of all families.
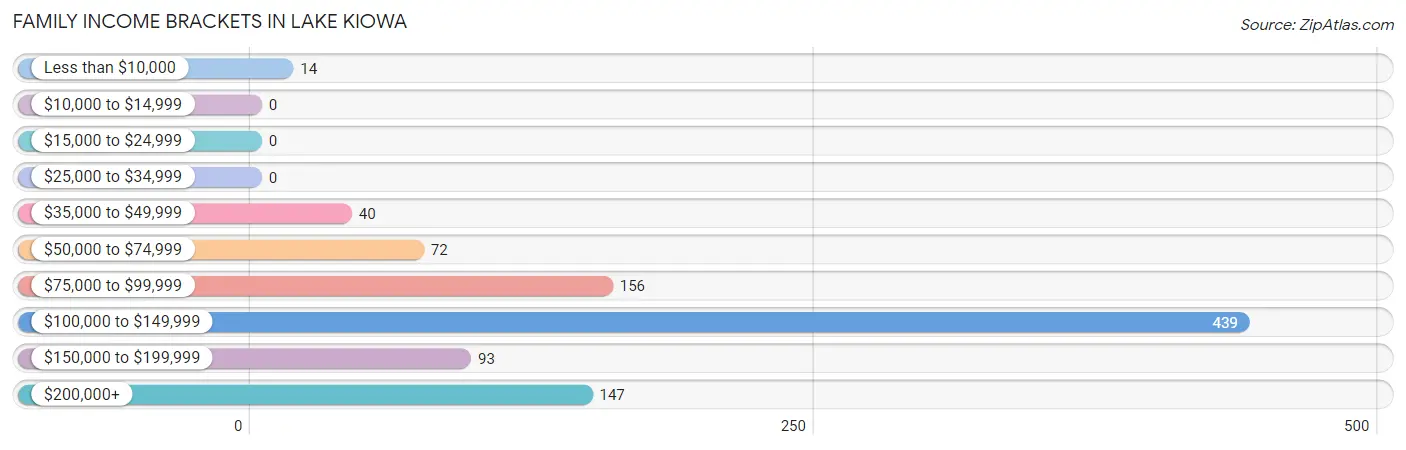
| Income Bracket | # Families | % Families |
| Less than $10,000 | 14 | 1.5% |
| $10,000 to $14,999 | 0 | 0.0% |
| $15,000 to $24,999 | 0 | 0.0% |
| $25,000 to $34,999 | 0 | 0.0% |
| $35,000 to $49,999 | 40 | 4.2% |
| $50,000 to $74,999 | 72 | 7.5% |
| $75,000 to $99,999 | 156 | 16.2% |
| $100,000 to $149,999 | 439 | 45.7% |
| $150,000 to $199,999 | 93 | 9.7% |
| $200,000+ | 147 | 15.3% |
Family Income by Famaliy Size in Lake Kiowa
3-person families (177 | 18.4%) account for the highest median family income in Lake Kiowa with $123,042 per family, while 2-person families (598 | 62.2%) have the highest median income of $57,120 per family member.
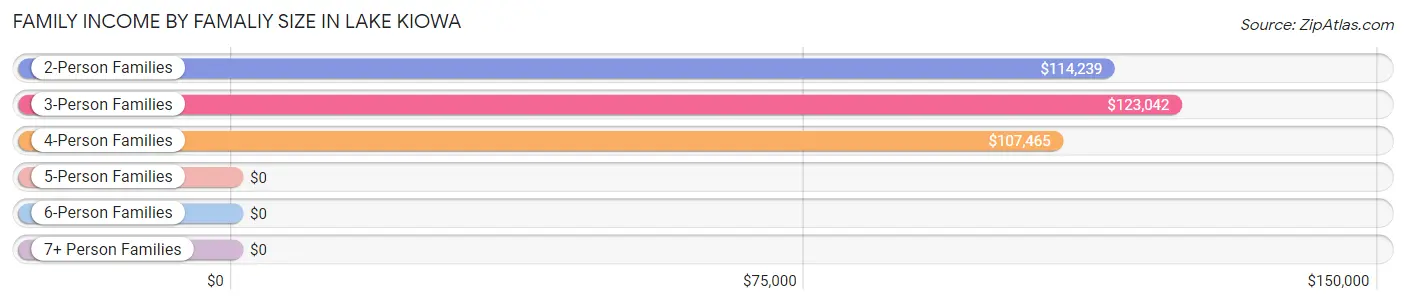
| Income Bracket | # Families | Median Income |
| 2-Person Families | 598 (62.2%) | $114,239 |
| 3-Person Families | 177 (18.4%) | $123,042 |
| 4-Person Families | 170 (17.7%) | $107,465 |
| 5-Person Families | 16 (1.7%) | $0 |
| 6-Person Families | 0 (0.0%) | $0 |
| 7+ Person Families | 0 (0.0%) | $0 |
| Total | 961 (100.0%) | $118,620 |
Family Income by Number of Earners in Lake Kiowa
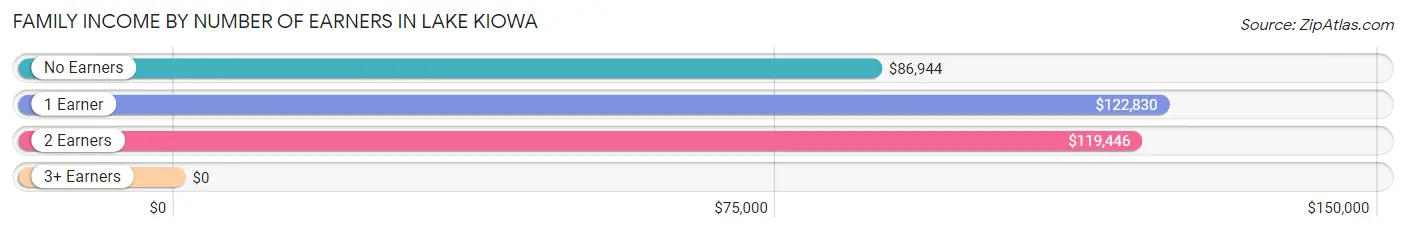
| Number of Earners | # Families | Median Income |
| No Earners | 216 (22.5%) | $86,944 |
| 1 Earner | 300 (31.2%) | $122,830 |
| 2 Earners | 433 (45.1%) | $119,446 |
| 3+ Earners | 12 (1.3%) | $0 |
| Total | 961 (100.0%) | $118,620 |
Household Income in Lake Kiowa
Household Income Brackets in Lake Kiowa
With 438 households falling in the category, the $100,000 to $149,999 income range is the most frequent in Lake Kiowa, accounting for 36.6% of all households. In contrast, only 14 households (1.2%) fall into the less than $10,000 income bracket, making it the least populous group.
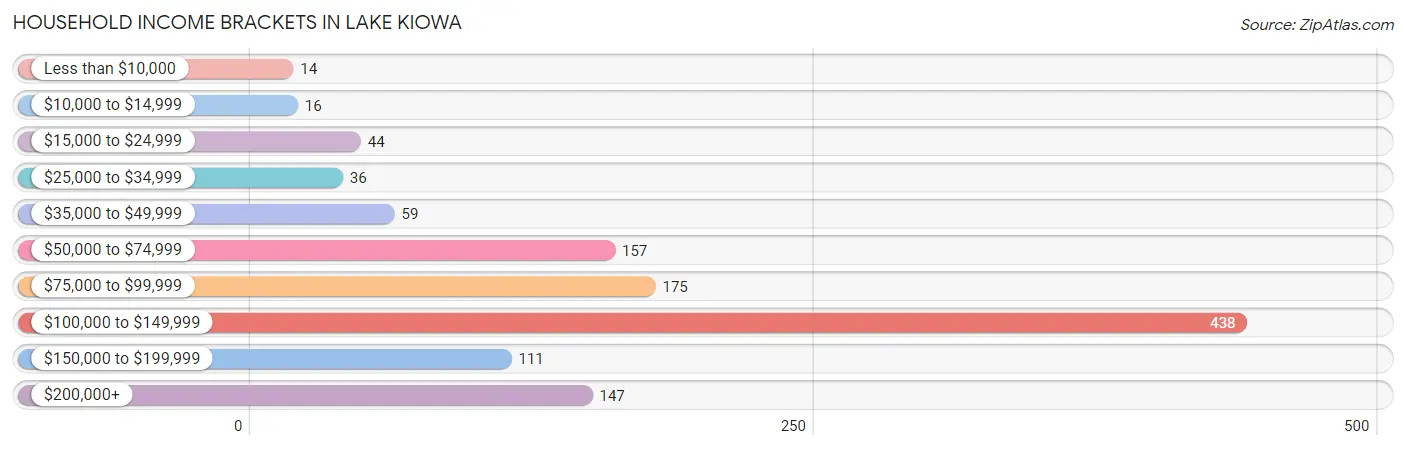
| Income Bracket | # Households | % Households |
| Less than $10,000 | 14 | 1.2% |
| $10,000 to $14,999 | 16 | 1.3% |
| $15,000 to $24,999 | 44 | 3.7% |
| $25,000 to $34,999 | 36 | 3.0% |
| $35,000 to $49,999 | 59 | 4.9% |
| $50,000 to $74,999 | 157 | 13.1% |
| $75,000 to $99,999 | 175 | 14.6% |
| $100,000 to $149,999 | 438 | 36.6% |
| $150,000 to $199,999 | 111 | 9.3% |
| $200,000+ | 147 | 12.3% |
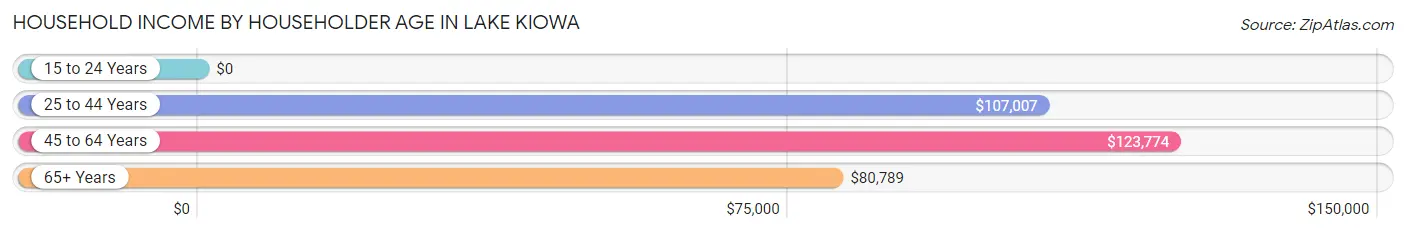
Household Income by Householder Age in Lake Kiowa
The median household income in Lake Kiowa is $107,414, with the highest median household income of $123,774 found in the 45 to 64 years age bracket for the primary householder. A total of 422 households (35.2%) fall into this category.
| Income Bracket | # Households | Median Income |
| 15 to 24 Years | 0 (0.0%) | $0 |
| 25 to 44 Years | 190 (15.9%) | $107,007 |
| 45 to 64 Years | 422 (35.2%) | $123,774 |
| 65+ Years | 586 (48.9%) | $80,789 |
| Total | 1,198 (100.0%) | $107,414 |
Poverty in Lake Kiowa
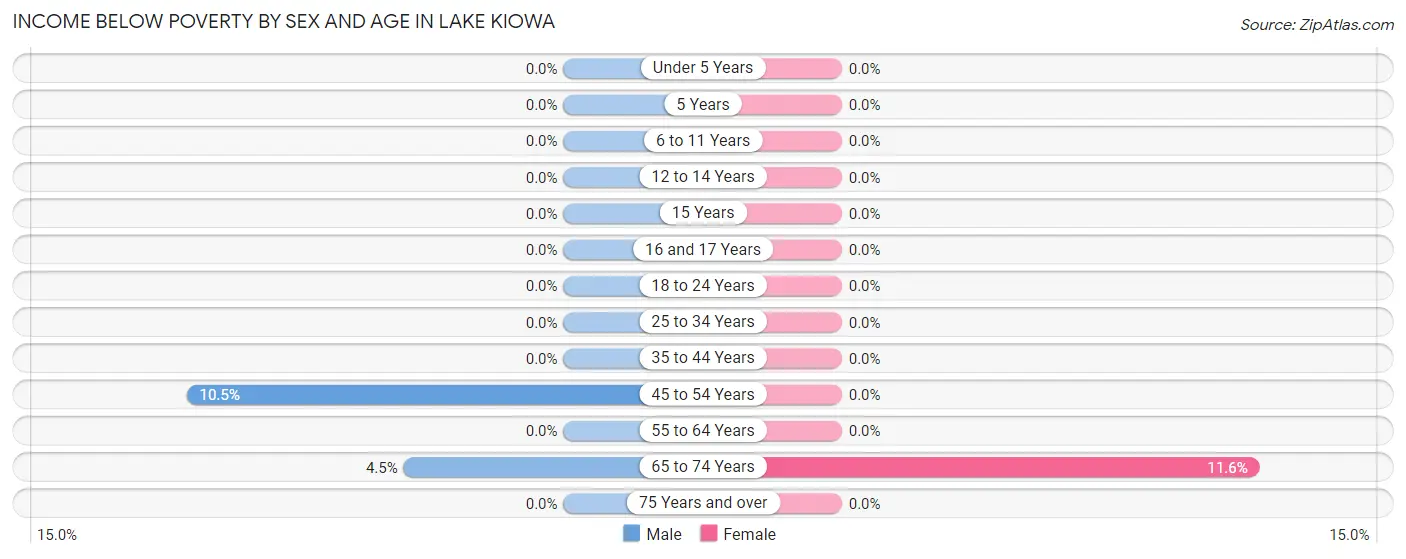
Income Below Poverty by Sex and Age in Lake Kiowa
With 2.5% poverty level for males and 1.9% for females among the residents of Lake Kiowa, 45 to 54 year old males and 65 to 74 year old females are the most vulnerable to poverty, with 17 males (10.5%) and 30 females (11.6%) in their respective age groups living below the poverty level.
| Age Bracket | Male | Female |
| Under 5 Years | 0 (0.0%) | 0 (0.0%) |
| 5 Years | 0 (0.0%) | 0 (0.0%) |
| 6 to 11 Years | 0 (0.0%) | 0 (0.0%) |
| 12 to 14 Years | 0 (0.0%) | 0 (0.0%) |
| 15 Years | 0 (0.0%) | 0 (0.0%) |
| 16 and 17 Years | 0 (0.0%) | 0 (0.0%) |
| 18 to 24 Years | 0 (0.0%) | 0 (0.0%) |
| 25 to 34 Years | 0 (0.0%) | 0 (0.0%) |
| 35 to 44 Years | 0 (0.0%) | 0 (0.0%) |
| 45 to 54 Years | 17 (10.5%) | 0 (0.0%) |
| 55 to 64 Years | 0 (0.0%) | 0 (0.0%) |
| 65 to 74 Years | 13 (4.4%) | 30 (11.6%) |
| 75 Years and over | 0 (0.0%) | 0 (0.0%) |
| Total | 30 (2.5%) | 30 (1.9%) |
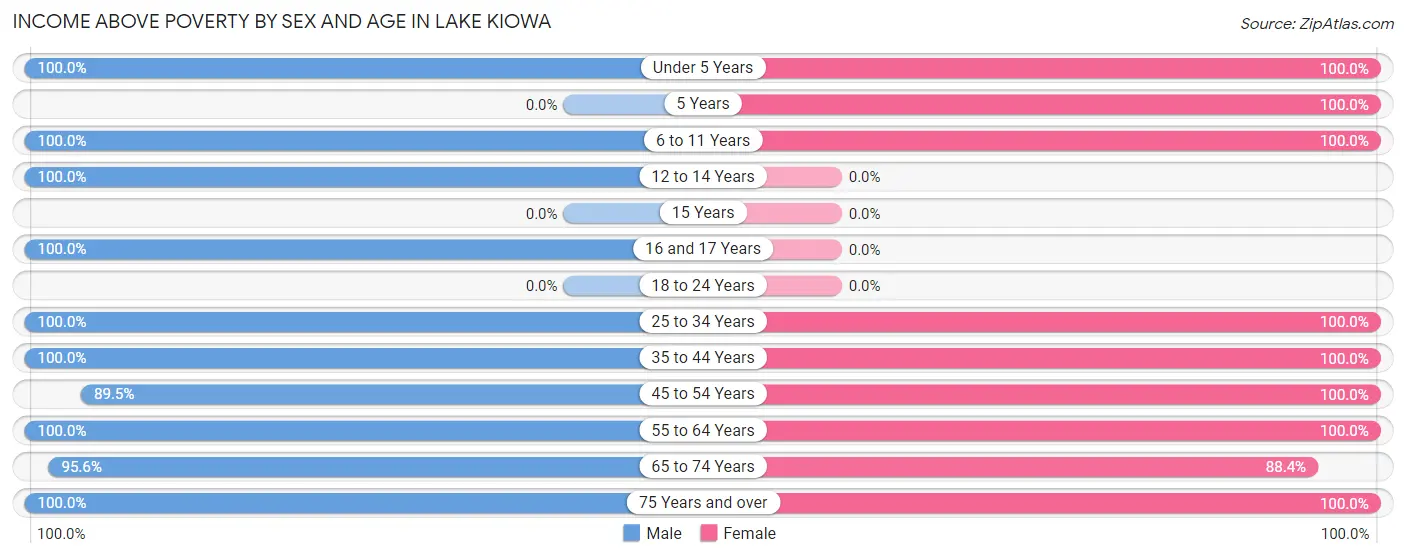
Income Above Poverty by Sex and Age in Lake Kiowa
According to the poverty statistics in Lake Kiowa, males aged under 5 years and females aged under 5 years are the age groups that are most secure financially, with 100.0% of males and 100.0% of females in these age groups living above the poverty line.
| Age Bracket | Male | Female |
| Under 5 Years | 20 (100.0%) | 238 (100.0%) |
| 5 Years | 0 (0.0%) | 54 (100.0%) |
| 6 to 11 Years | 12 (100.0%) | 49 (100.0%) |
| 12 to 14 Years | 34 (100.0%) | 0 (0.0%) |
| 15 Years | 0 (0.0%) | 0 (0.0%) |
| 16 and 17 Years | 17 (100.0%) | 0 (0.0%) |
| 18 to 24 Years | 0 (0.0%) | 0 (0.0%) |
| 25 to 34 Years | 87 (100.0%) | 95 (100.0%) |
| 35 to 44 Years | 85 (100.0%) | 212 (100.0%) |
| 45 to 54 Years | 145 (89.5%) | 120 (100.0%) |
| 55 to 64 Years | 265 (100.0%) | 288 (100.0%) |
| 65 to 74 Years | 279 (95.6%) | 228 (88.4%) |
| 75 Years and over | 202 (100.0%) | 238 (100.0%) |
| Total | 1,146 (97.5%) | 1,522 (98.1%) |
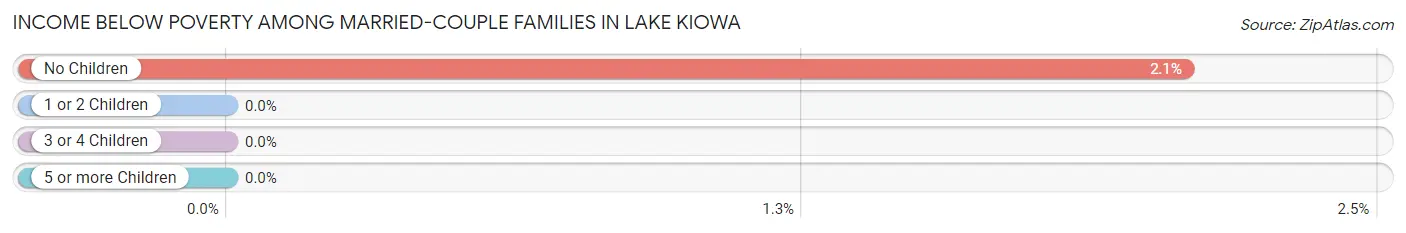
Income Below Poverty Among Married-Couple Families in Lake Kiowa
The poverty statistics for married-couple families in Lake Kiowa show that 1.5% or 14 of the total 912 families live below the poverty line. Families with no children have the highest poverty rate of 2.1%, comprising of 14 families. On the other hand, families with 1 or 2 children have the lowest poverty rate of 0.0%, which includes 0 families.
| Children | Above Poverty | Below Poverty |
| No Children | 658 (97.9%) | 14 (2.1%) |
| 1 or 2 Children | 224 (100.0%) | 0 (0.0%) |
| 3 or 4 Children | 16 (100.0%) | 0 (0.0%) |
| 5 or more Children | 0 (0.0%) | 0 (0.0%) |
| Total | 898 (98.5%) | 14 (1.5%) |
Income Below Poverty Among Single-Parent Households in Lake Kiowa
| Children | Single Father | Single Mother |
| No Children | 0 (0.0%) | 0 (0.0%) |
| 1 or 2 Children | 0 (0.0%) | 0 (0.0%) |
| 3 or 4 Children | 0 (0.0%) | 0 (0.0%) |
| 5 or more Children | 0 (0.0%) | 0 (0.0%) |
| Total | 0 (0.0%) | 0 (0.0%) |
Income Below Poverty Among Married-Couple vs Single-Parent Households in Lake Kiowa
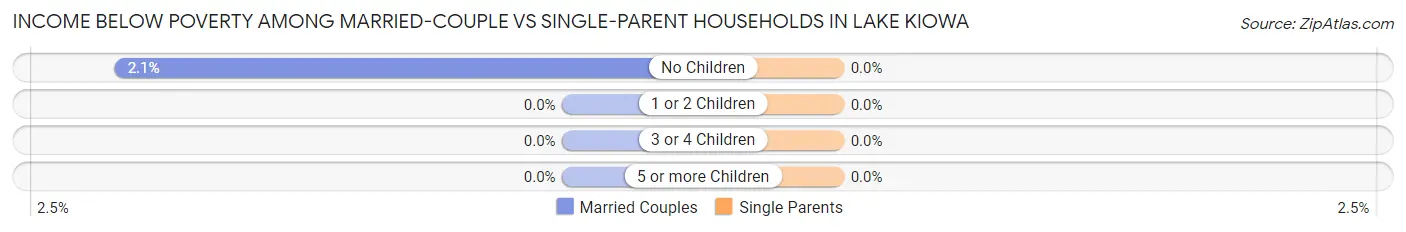
| Children | Married-Couple Families | Single-Parent Households |
| No Children | 14 (2.1%) | 0 (0.0%) |
| 1 or 2 Children | 0 (0.0%) | 0 (0.0%) |
| 3 or 4 Children | 0 (0.0%) | 0 (0.0%) |
| 5 or more Children | 0 (0.0%) | 0 (0.0%) |
| Total | 14 (1.5%) | 0 (0.0%) |
Race in Lake Kiowa
The most populous races in Lake Kiowa are White / Caucasian (2,603 | 95.4%), Two or more Races (112 | 4.1%), and Hispanic or Latino (75 | 2.8%).
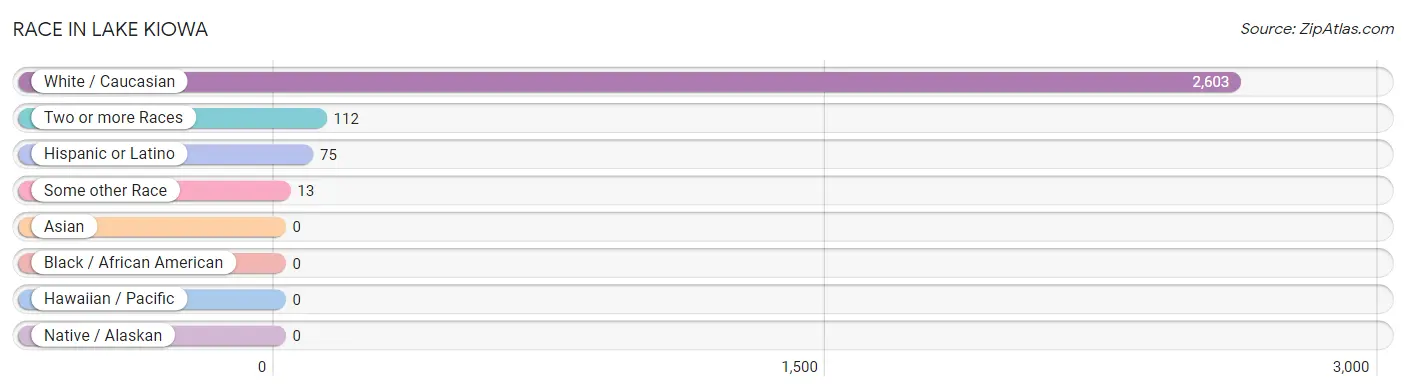
| Race | # Population | % Population |
| Asian | 0 | 0.0% |
| Black / African American | 0 | 0.0% |
| Hawaiian / Pacific | 0 | 0.0% |
| Hispanic or Latino | 75 | 2.8% |
| Native / Alaskan | 0 | 0.0% |
| White / Caucasian | 2,603 | 95.4% |
| Two or more Races | 112 | 4.1% |
| Some other Race | 13 | 0.5% |
| Total | 2,728 | 100.0% |
Ancestry in Lake Kiowa
The most populous ancestries reported in Lake Kiowa are German (473 | 17.3%), Irish (457 | 16.8%), English (453 | 16.6%), Italian (158 | 5.8%), and American (122 | 4.5%), together accounting for 61.0% of all Lake Kiowa residents.
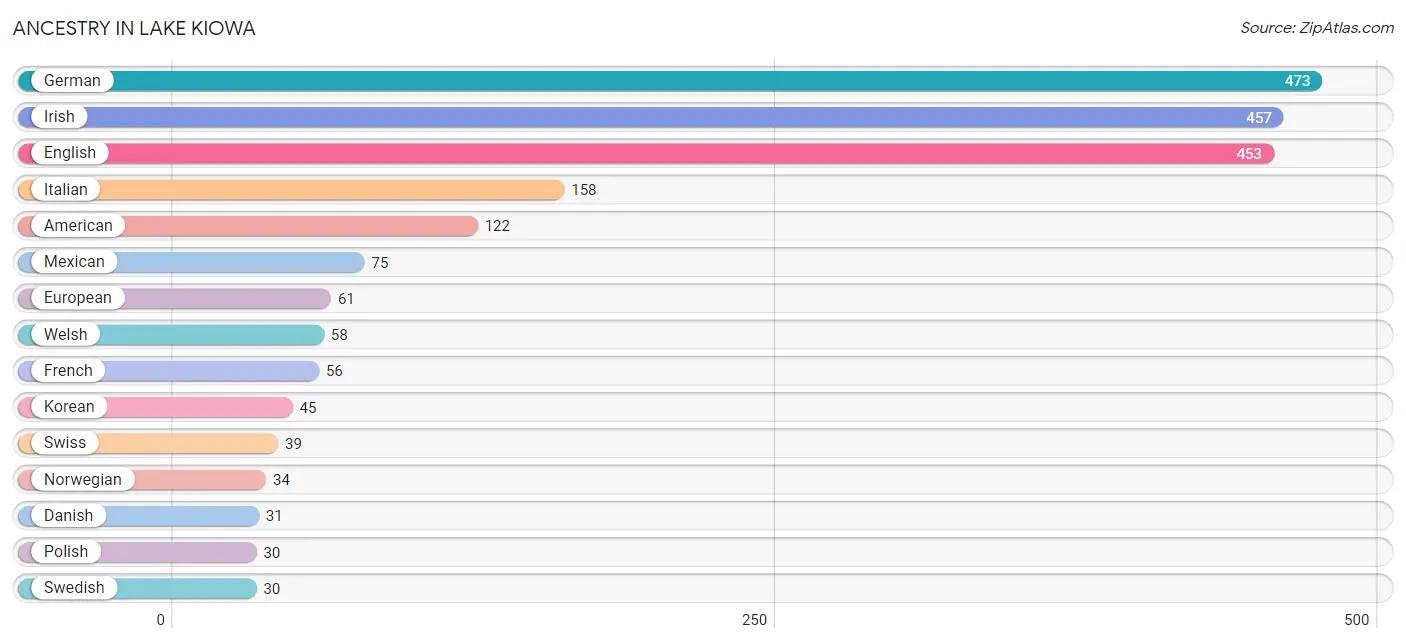
| Ancestry | # Population | % Population |
| American | 122 | 4.5% |
| Choctaw | 8 | 0.3% |
| Croatian | 14 | 0.5% |
| Czech | 23 | 0.8% |
| Danish | 31 | 1.1% |
| Dutch | 24 | 0.9% |
| English | 453 | 16.6% |
| European | 61 | 2.2% |
| French | 56 | 2.1% |
| German | 473 | 17.3% |
| Irish | 457 | 16.8% |
| Italian | 158 | 5.8% |
| Korean | 45 | 1.7% |
| Mexican | 75 | 2.8% |
| Northern European | 14 | 0.5% |
| Norwegian | 34 | 1.3% |
| Polish | 30 | 1.1% |
| Scotch-Irish | 18 | 0.7% |
| Scottish | 14 | 0.5% |
| Swedish | 30 | 1.1% |
| Swiss | 39 | 1.4% |
| Welsh | 58 | 2.1% | View All 22 Rows |
Immigrants in Lake Kiowa

| Immigration Origin | # Population | % Population | View All 0 Rows |
Sex and Age in Lake Kiowa
Sex and Age in Lake Kiowa
The most populous age groups in Lake Kiowa are 70 to 74 Years (207 | 17.6%) for men and Under 5 Years (238 | 15.3%) for women.
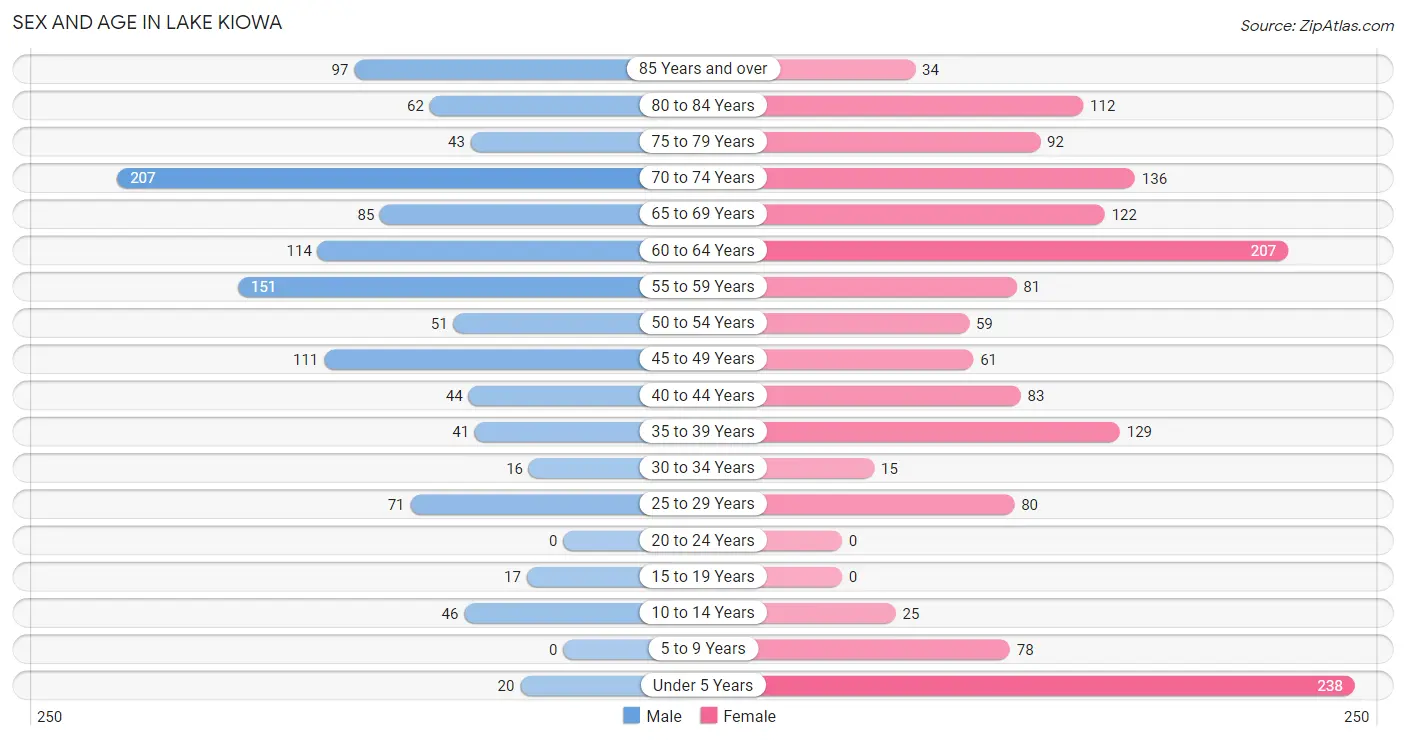
| Age Bracket | Male | Female |
| Under 5 Years | 20 (1.7%) | 238 (15.3%) |
| 5 to 9 Years | 0 (0.0%) | 78 (5.0%) |
| 10 to 14 Years | 46 (3.9%) | 25 (1.6%) |
| 15 to 19 Years | 17 (1.5%) | 0 (0.0%) |
| 20 to 24 Years | 0 (0.0%) | 0 (0.0%) |
| 25 to 29 Years | 71 (6.0%) | 80 (5.1%) |
| 30 to 34 Years | 16 (1.4%) | 15 (1.0%) |
| 35 to 39 Years | 41 (3.5%) | 129 (8.3%) |
| 40 to 44 Years | 44 (3.7%) | 83 (5.3%) |
| 45 to 49 Years | 111 (9.4%) | 61 (3.9%) |
| 50 to 54 Years | 51 (4.3%) | 59 (3.8%) |
| 55 to 59 Years | 151 (12.8%) | 81 (5.2%) |
| 60 to 64 Years | 114 (9.7%) | 207 (13.3%) |
| 65 to 69 Years | 85 (7.2%) | 122 (7.9%) |
| 70 to 74 Years | 207 (17.6%) | 136 (8.8%) |
| 75 to 79 Years | 43 (3.7%) | 92 (5.9%) |
| 80 to 84 Years | 62 (5.3%) | 112 (7.2%) |
| 85 Years and over | 97 (8.3%) | 34 (2.2%) |
| Total | 1,176 (100.0%) | 1,552 (100.0%) |
Families and Households in Lake Kiowa
Median Family Size in Lake Kiowa
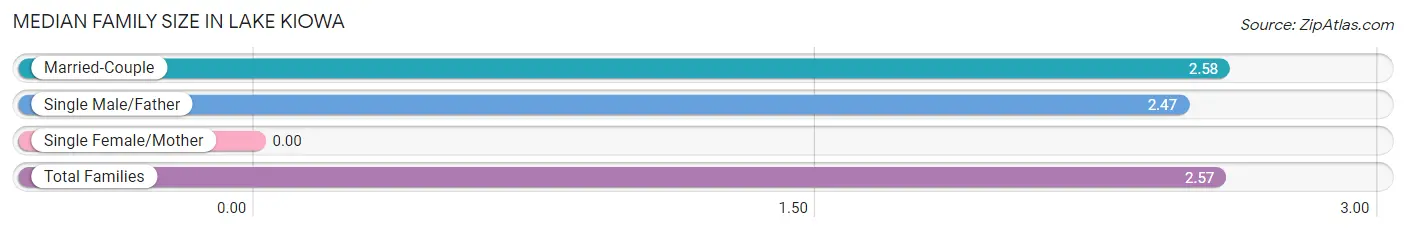
| Family Type | # Families | Family Size |
| Married-Couple | 912 (94.9%) | 2.58 |
| Single Male/Father | 49 (5.1%) | 2.47 |
| Single Female/Mother | 0 (0.0%) | - |
| Total Families | 961 (100.0%) | 2.57 |
Median Household Size in Lake Kiowa
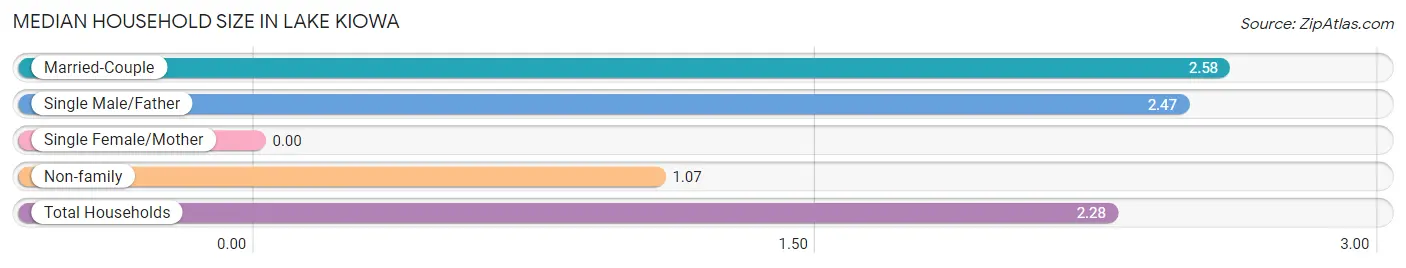
| Household Type | # Households | Household Size |
| Married-Couple | 912 (76.1%) | 2.58 |
| Single Male/Father | 49 (4.1%) | 2.47 |
| Single Female/Mother | 0 (0.0%) | - |
| Non-family | 237 (19.8%) | 1.07 |
| Total Households | 1,198 (100.0%) | 2.28 |
Household Size by Marriage Status in Lake Kiowa
Out of a total of 1,198 households in Lake Kiowa, 961 (80.2%) are family households, while 237 (19.8%) are nonfamily households. The most numerous type of family households are 2-person households, comprising 598, and the most common type of nonfamily households are 1-person households, comprising 221.
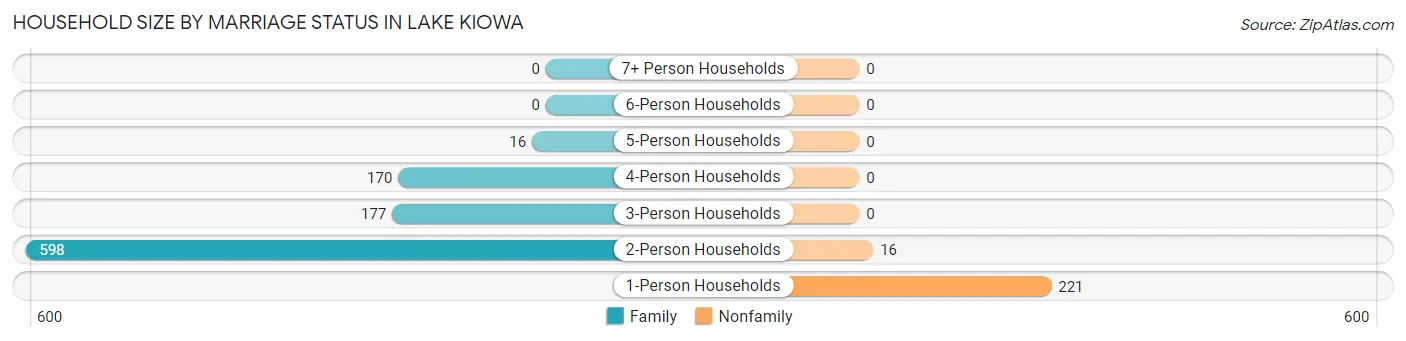
| Household Size | Family Households | Nonfamily Households |
| 1-Person Households | - | 221 (18.4%) |
| 2-Person Households | 598 (49.9%) | 16 (1.3%) |
| 3-Person Households | 177 (14.8%) | 0 (0.0%) |
| 4-Person Households | 170 (14.2%) | 0 (0.0%) |
| 5-Person Households | 16 (1.3%) | 0 (0.0%) |
| 6-Person Households | 0 (0.0%) | 0 (0.0%) |
| 7+ Person Households | 0 (0.0%) | 0 (0.0%) |
| Total | 961 (80.2%) | 237 (19.8%) |
Female Fertility in Lake Kiowa
Fertility by Age in Lake Kiowa
| Age Bracket | Women with Births | Births / 1,000 Women |
| 15 to 19 years | 0 (0.0%) | 0.0 |
| 20 to 34 years | 0 (0.0%) | 0.0 |
| 35 to 50 years | 0 (0.0%) | 0.0 |
| Total | 0 (0.0%) | 0.0 |
Fertility by Age by Marriage Status in Lake Kiowa
| Age Bracket | Married | Unmarried |
| 15 to 19 years | 0 (0.0%) | 0 (0.0%) |
| 20 to 34 years | 0 (0.0%) | 0 (0.0%) |
| 35 to 50 years | 0 (0.0%) | 0 (0.0%) |
| Total | 0 (0.0%) | 0 (0.0%) |
Fertility by Education in Lake Kiowa
| Educational Attainment | Women with Births | Births / 1,000 Women |
| Less than High School | 0 (0.0%) | 0.0 |
| High School Diploma | 0 (0.0%) | 0.0 |
| College or Associate's Degree | 0 (0.0%) | 0.0 |
| Bachelor's Degree | 0 (0.0%) | 0.0 |
| Graduate Degree | 0 (0.0%) | 0.0 |
| Total | 0 (0.0%) | 0.0 |
Fertility by Education by Marriage Status in Lake Kiowa
| Educational Attainment | Married | Unmarried |
| Less than High School | 0 (0.0%) | 0 (0.0%) |
| High School Diploma | 0 (0.0%) | 0 (0.0%) |
| College or Associate's Degree | 0 (0.0%) | 0 (0.0%) |
| Bachelor's Degree | 0 (0.0%) | 0 (0.0%) |
| Graduate Degree | 0 (0.0%) | 0 (0.0%) |
| Total | 0 (0.0%) | 0 (0.0%) |
Employment Characteristics in Lake Kiowa
Employment by Class of Employer in Lake Kiowa
Among the 1,250 employed individuals in Lake Kiowa, private company employees (1,008 | 80.6%), self-employed (incorporated) (110 | 8.8%), and not-for-profit organizations (73 | 5.8%) make up the most common classes of employment.
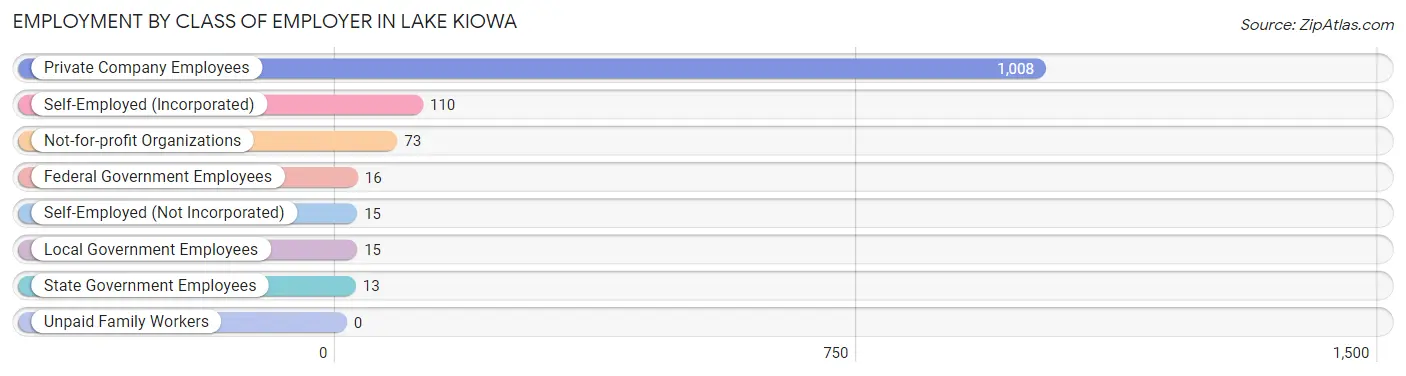
| Employer Class | # Employees | % Employees |
| Private Company Employees | 1,008 | 80.6% |
| Self-Employed (Incorporated) | 110 | 8.8% |
| Self-Employed (Not Incorporated) | 15 | 1.2% |
| Not-for-profit Organizations | 73 | 5.8% |
| Local Government Employees | 15 | 1.2% |
| State Government Employees | 13 | 1.0% |
| Federal Government Employees | 16 | 1.3% |
| Unpaid Family Workers | 0 | 0.0% |
| Total | 1,250 | 100.0% |
Employment Status by Age in Lake Kiowa
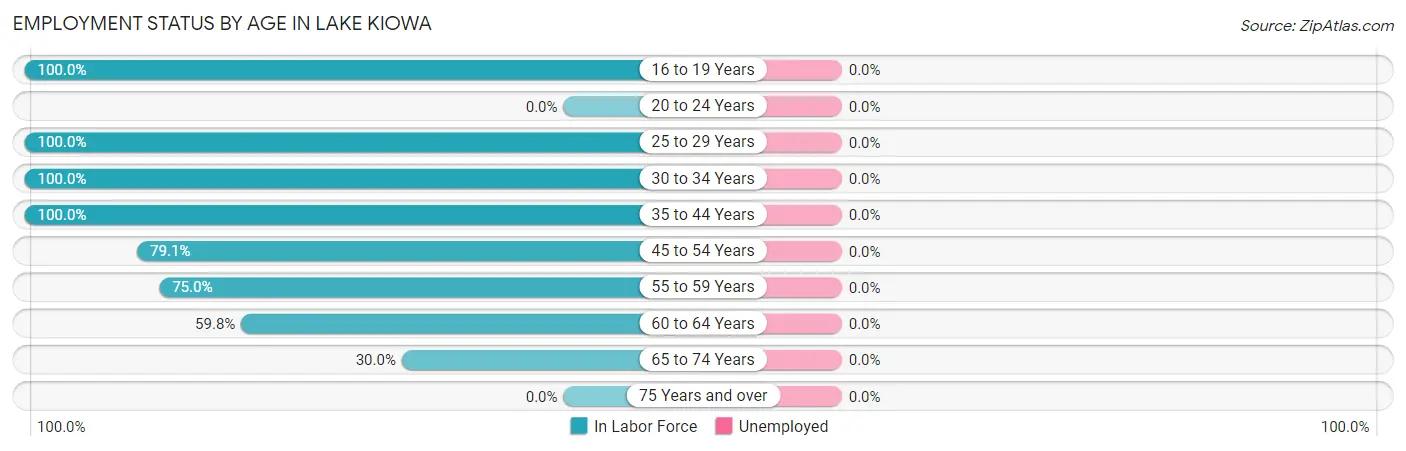
| Age Bracket | In Labor Force | Unemployed |
| 16 to 19 Years | 17 (100.0%) | 0 (0.0%) |
| 20 to 24 Years | 0 (0.0%) | 0 (0.0%) |
| 25 to 29 Years | 151 (100.0%) | 0 (0.0%) |
| 30 to 34 Years | 31 (100.0%) | 0 (0.0%) |
| 35 to 44 Years | 297 (100.0%) | 0 (0.0%) |
| 45 to 54 Years | 223 (79.1%) | 0 (0.0%) |
| 55 to 59 Years | 174 (75.0%) | 0 (0.0%) |
| 60 to 64 Years | 192 (59.8%) | 0 (0.0%) |
| 65 to 74 Years | 165 (30.0%) | 0 (0.0%) |
| 75 Years and over | 0 (0.0%) | 0 (0.0%) |
| Total | 1,251 (53.9%) | 0 (0.0%) |
Employment Status by Educational Attainment in Lake Kiowa
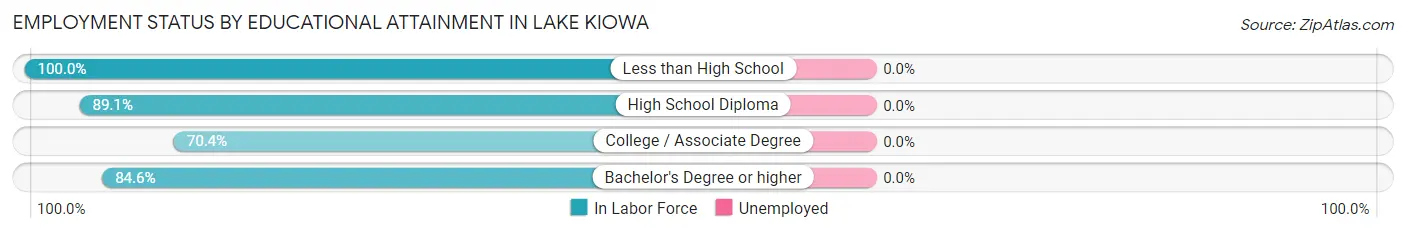
| Educational Attainment | In Labor Force | Unemployed |
| Less than High School | 13 (100.0%) | 0 (0.0%) |
| High School Diploma | 253 (89.1%) | 0 (0.0%) |
| College / Associate Degree | 290 (70.4%) | 0 (0.0%) |
| Bachelor's Degree or higher | 512 (84.6%) | 0 (0.0%) |
| Total | 1,068 (81.3%) | 0 (0.0%) |
Employment Occupations by Sex in Lake Kiowa
Management, Business, Science and Arts Occupations
The most common Management, Business, Science and Arts occupations in Lake Kiowa are Management (357 | 28.6%), Community & Social Service (139 | 11.1%), Health Diagnosing & Treating (102 | 8.2%), Health Technologists (102 | 8.2%), and Education, Arts & Media (95 | 7.6%).
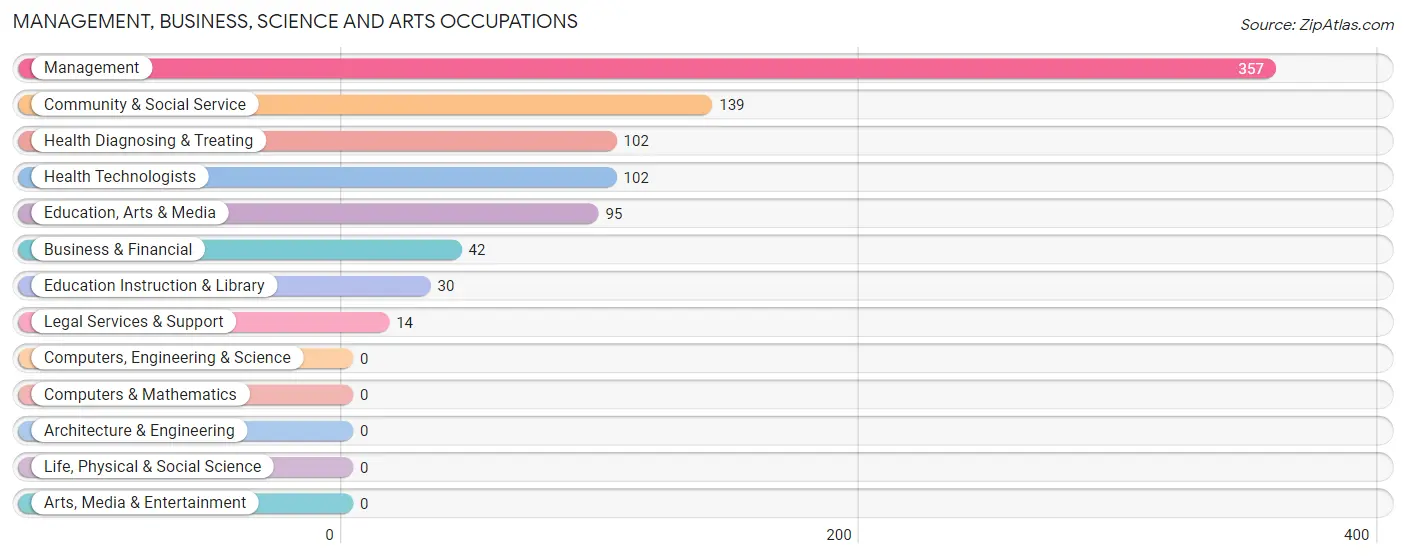
Management, Business, Science and Arts Occupations by Sex
Within the Management, Business, Science and Arts occupations in Lake Kiowa, the most male-oriented occupations are Legal Services & Support (100.0%), Management (56.3%), and Business & Financial (54.8%), while the most female-oriented occupations are Education, Arts & Media (100.0%), Health Diagnosing & Treating (100.0%), and Health Technologists (100.0%).
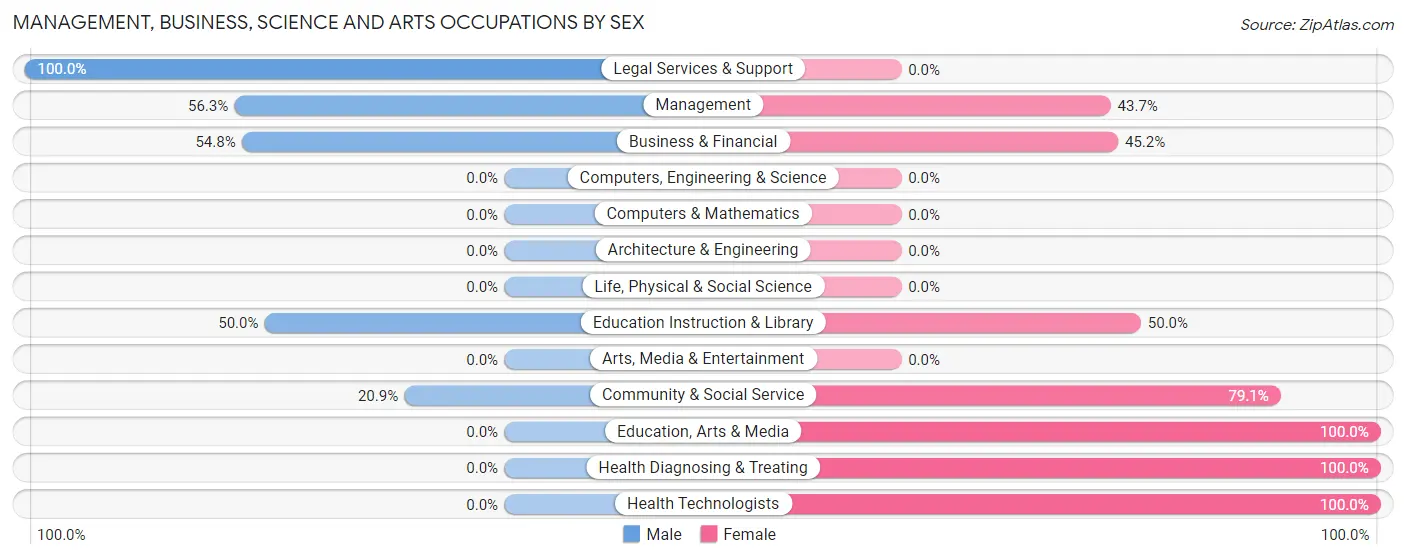
| Occupation | Male | Female |
| Management | 201 (56.3%) | 156 (43.7%) |
| Business & Financial | 23 (54.8%) | 19 (45.2%) |
| Computers, Engineering & Science | 0 (0.0%) | 0 (0.0%) |
| Computers & Mathematics | 0 (0.0%) | 0 (0.0%) |
| Architecture & Engineering | 0 (0.0%) | 0 (0.0%) |
| Life, Physical & Social Science | 0 (0.0%) | 0 (0.0%) |
| Community & Social Service | 29 (20.9%) | 110 (79.1%) |
| Education, Arts & Media | 0 (0.0%) | 95 (100.0%) |
| Legal Services & Support | 14 (100.0%) | 0 (0.0%) |
| Education Instruction & Library | 15 (50.0%) | 15 (50.0%) |
| Arts, Media & Entertainment | 0 (0.0%) | 0 (0.0%) |
| Health Diagnosing & Treating | 0 (0.0%) | 102 (100.0%) |
| Health Technologists | 0 (0.0%) | 102 (100.0%) |
| Total (Category) | 253 (39.5%) | 387 (60.5%) |
| Total (Overall) | 642 (51.4%) | 608 (48.6%) |
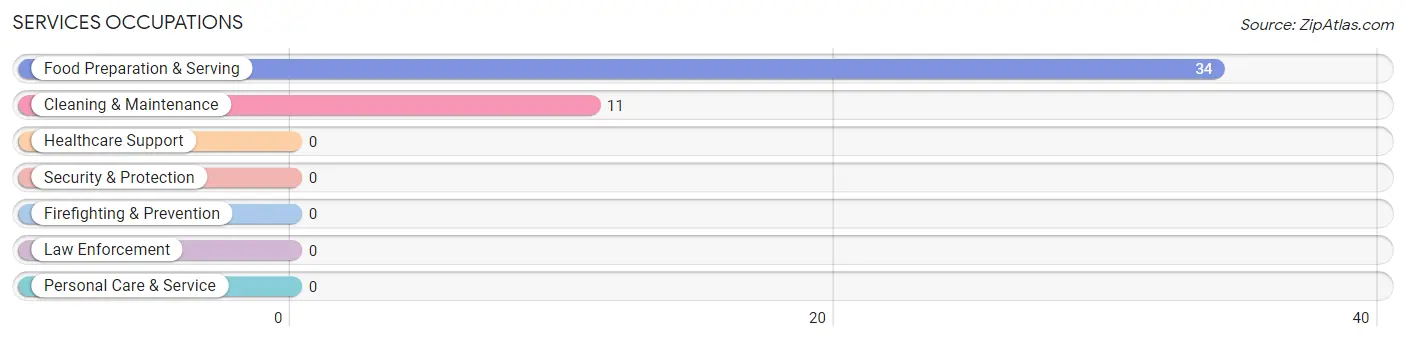
Services Occupations
The most common Services occupations in Lake Kiowa are Food Preparation & Serving (34 | 2.7%), and Cleaning & Maintenance (11 | 0.9%).
Services Occupations by Sex
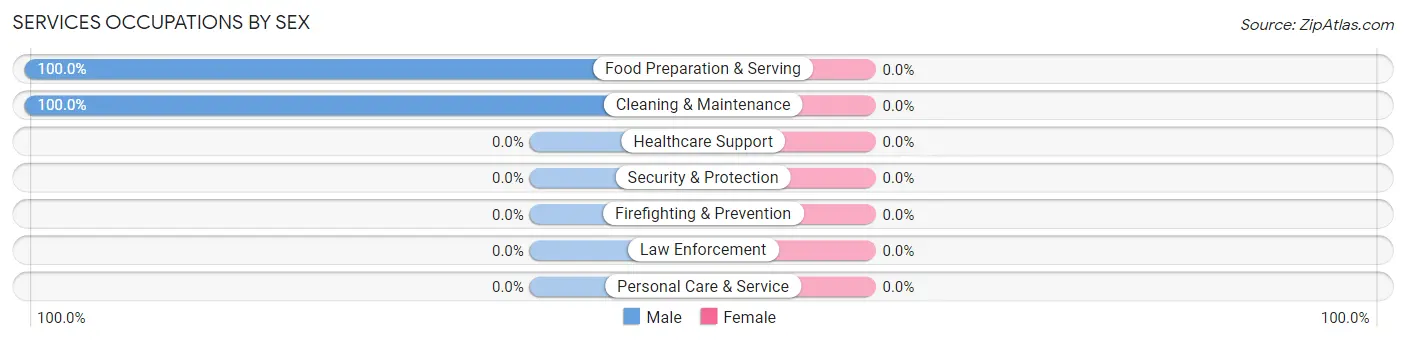
| Occupation | Male | Female |
| Healthcare Support | 0 (0.0%) | 0 (0.0%) |
| Security & Protection | 0 (0.0%) | 0 (0.0%) |
| Firefighting & Prevention | 0 (0.0%) | 0 (0.0%) |
| Law Enforcement | 0 (0.0%) | 0 (0.0%) |
| Food Preparation & Serving | 34 (100.0%) | 0 (0.0%) |
| Cleaning & Maintenance | 11 (100.0%) | 0 (0.0%) |
| Personal Care & Service | 0 (0.0%) | 0 (0.0%) |
| Total (Category) | 45 (100.0%) | 0 (0.0%) |
| Total (Overall) | 642 (51.4%) | 608 (48.6%) |
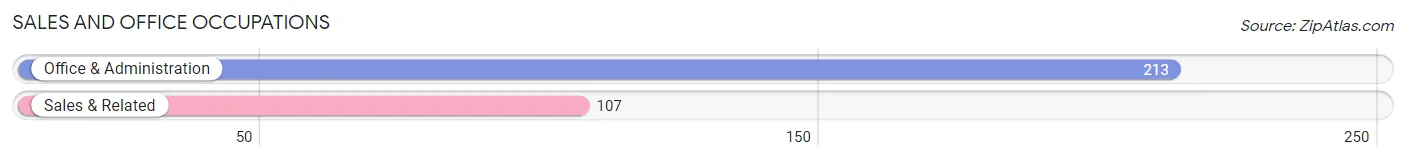
Sales and Office Occupations
The most common Sales and Office occupations in Lake Kiowa are Office & Administration (213 | 17.0%), and Sales & Related (107 | 8.6%).
Sales and Office Occupations by Sex
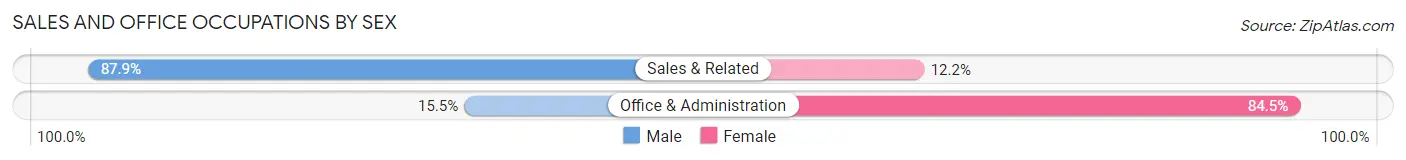
| Occupation | Male | Female |
| Sales & Related | 94 (87.8%) | 13 (12.1%) |
| Office & Administration | 33 (15.5%) | 180 (84.5%) |
| Total (Category) | 127 (39.7%) | 193 (60.3%) |
| Total (Overall) | 642 (51.4%) | 608 (48.6%) |
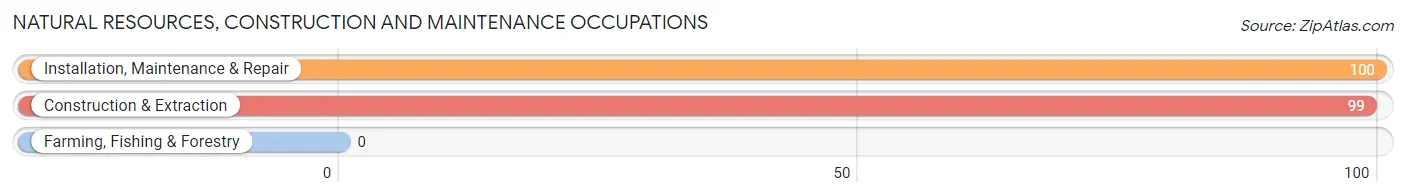
Natural Resources, Construction and Maintenance Occupations
The most common Natural Resources, Construction and Maintenance occupations in Lake Kiowa are Installation, Maintenance & Repair (100 | 8.0%), and Construction & Extraction (99 | 7.9%).
Natural Resources, Construction and Maintenance Occupations by Sex
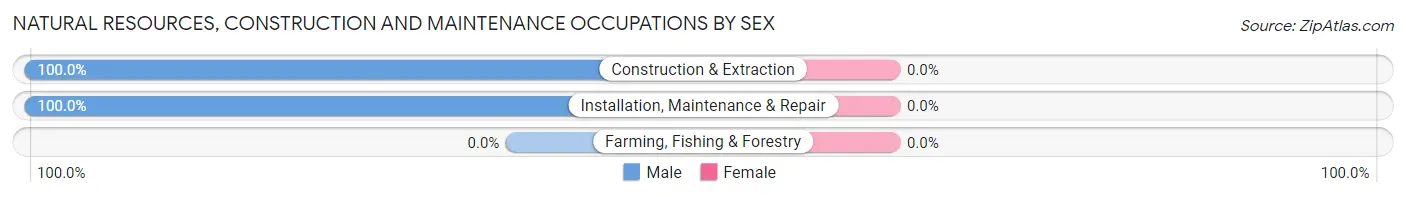
| Occupation | Male | Female |
| Farming, Fishing & Forestry | 0 (0.0%) | 0 (0.0%) |
| Construction & Extraction | 99 (100.0%) | 0 (0.0%) |
| Installation, Maintenance & Repair | 100 (100.0%) | 0 (0.0%) |
| Total (Category) | 199 (100.0%) | 0 (0.0%) |
| Total (Overall) | 642 (51.4%) | 608 (48.6%) |
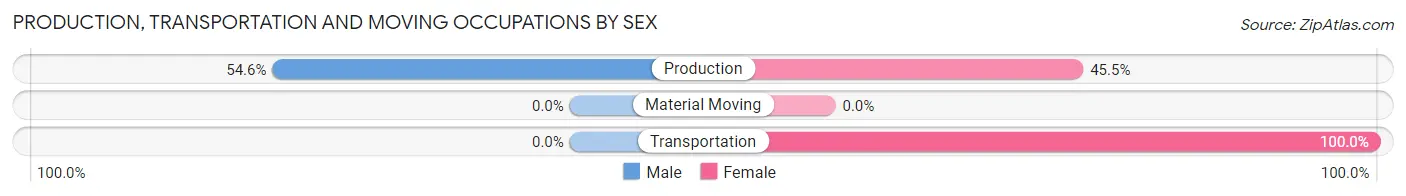
Production, Transportation and Moving Occupations
The most common Production, Transportation and Moving occupations in Lake Kiowa are Production (33 | 2.6%), and Transportation (13 | 1.0%).
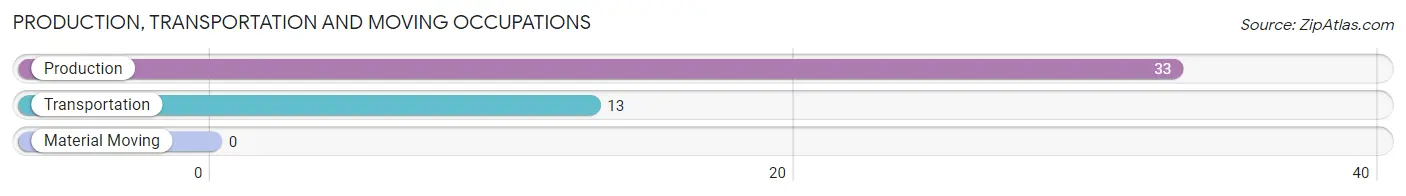
Production, Transportation and Moving Occupations by Sex
| Occupation | Male | Female |
| Production | 18 (54.5%) | 15 (45.5%) |
| Transportation | 0 (0.0%) | 13 (100.0%) |
| Material Moving | 0 (0.0%) | 0 (0.0%) |
| Total (Category) | 18 (39.1%) | 28 (60.9%) |
| Total (Overall) | 642 (51.4%) | 608 (48.6%) |
Employment Industries by Sex in Lake Kiowa
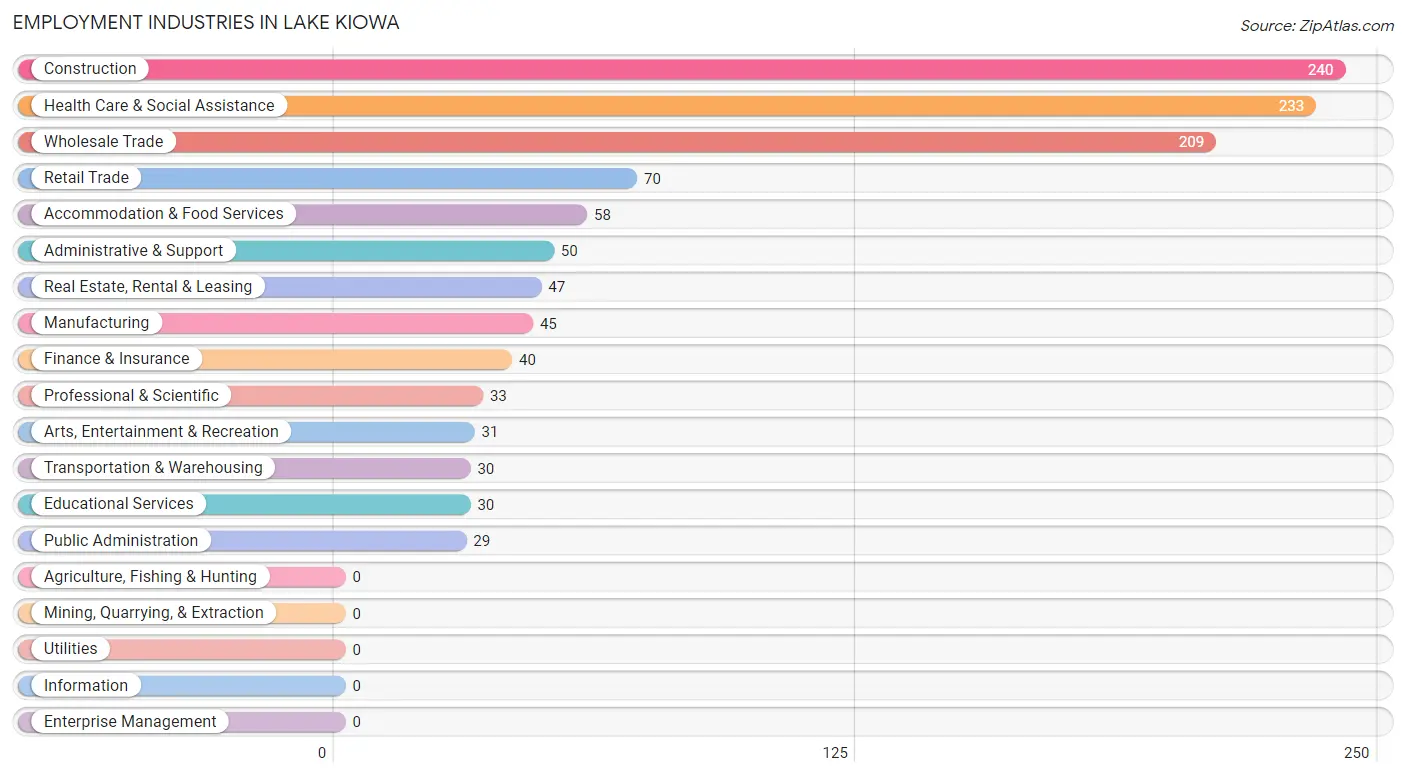
Employment Industries in Lake Kiowa
The major employment industries in Lake Kiowa include Construction (240 | 19.2%), Health Care & Social Assistance (233 | 18.6%), Wholesale Trade (209 | 16.7%), Retail Trade (70 | 5.6%), and Accommodation & Food Services (58 | 4.6%).
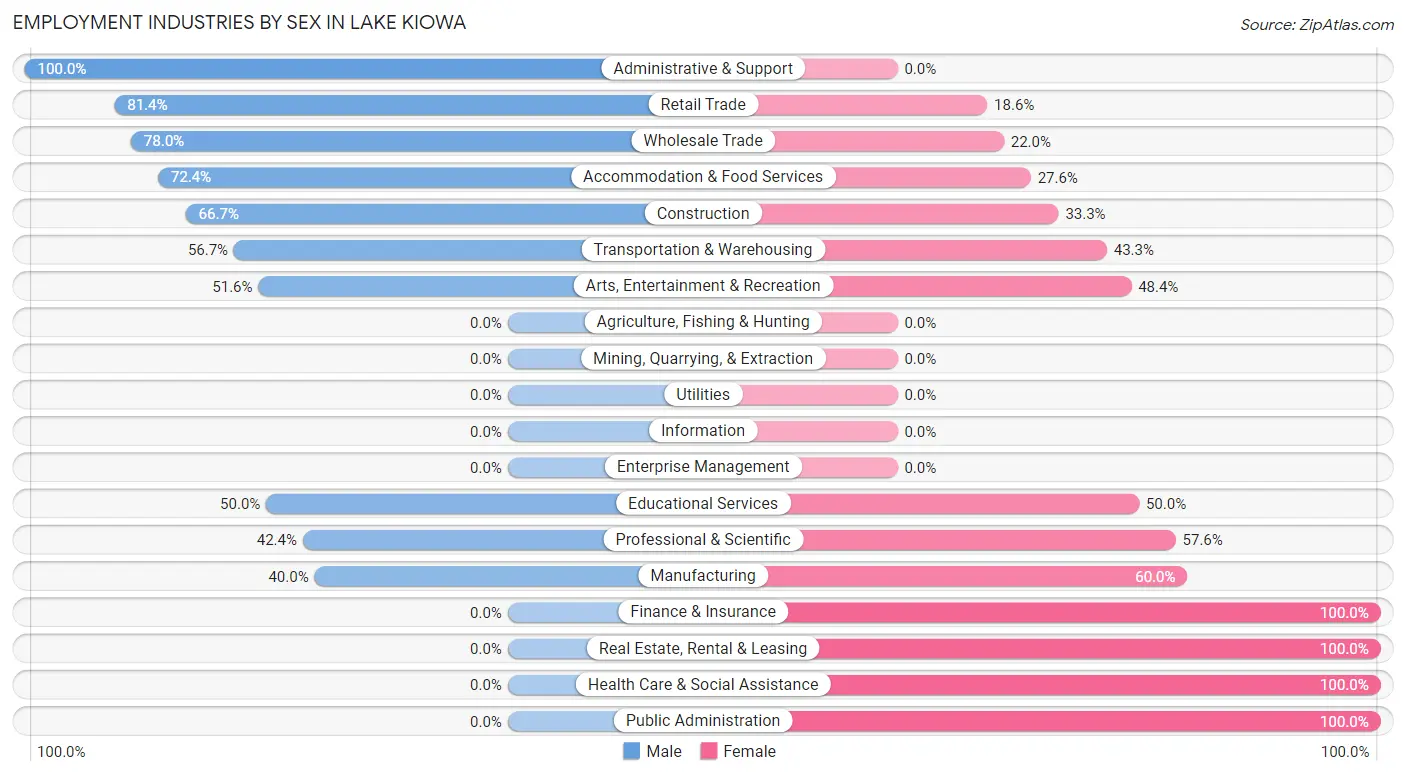
Employment Industries by Sex in Lake Kiowa
The Lake Kiowa industries that see more men than women are Administrative & Support (100.0%), Retail Trade (81.4%), and Wholesale Trade (78.0%), whereas the industries that tend to have a higher number of women are Finance & Insurance (100.0%), Real Estate, Rental & Leasing (100.0%), and Health Care & Social Assistance (100.0%).
| Industry | Male | Female |
| Agriculture, Fishing & Hunting | 0 (0.0%) | 0 (0.0%) |
| Mining, Quarrying, & Extraction | 0 (0.0%) | 0 (0.0%) |
| Construction | 160 (66.7%) | 80 (33.3%) |
| Manufacturing | 18 (40.0%) | 27 (60.0%) |
| Wholesale Trade | 163 (78.0%) | 46 (22.0%) |
| Retail Trade | 57 (81.4%) | 13 (18.6%) |
| Transportation & Warehousing | 17 (56.7%) | 13 (43.3%) |
| Utilities | 0 (0.0%) | 0 (0.0%) |
| Information | 0 (0.0%) | 0 (0.0%) |
| Finance & Insurance | 0 (0.0%) | 40 (100.0%) |
| Real Estate, Rental & Leasing | 0 (0.0%) | 47 (100.0%) |
| Professional & Scientific | 14 (42.4%) | 19 (57.6%) |
| Enterprise Management | 0 (0.0%) | 0 (0.0%) |
| Administrative & Support | 50 (100.0%) | 0 (0.0%) |
| Educational Services | 15 (50.0%) | 15 (50.0%) |
| Health Care & Social Assistance | 0 (0.0%) | 233 (100.0%) |
| Arts, Entertainment & Recreation | 16 (51.6%) | 15 (48.4%) |
| Accommodation & Food Services | 42 (72.4%) | 16 (27.6%) |
| Public Administration | 0 (0.0%) | 29 (100.0%) |
| Total | 642 (51.4%) | 608 (48.6%) |
Education in Lake Kiowa
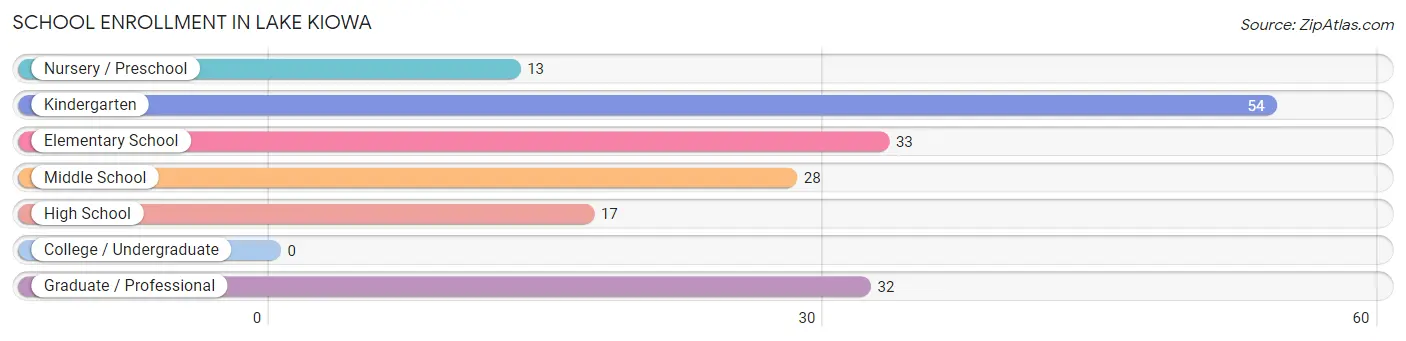
School Enrollment in Lake Kiowa
The most common levels of schooling among the 177 students in Lake Kiowa are kindergarten (54 | 30.5%), elementary school (33 | 18.6%), and graduate / professional (32 | 18.1%).
| School Level | # Students | % Students |
| Nursery / Preschool | 13 | 7.3% |
| Kindergarten | 54 | 30.5% |
| Elementary School | 33 | 18.6% |
| Middle School | 28 | 15.8% |
| High School | 17 | 9.6% |
| College / Undergraduate | 0 | 0.0% |
| Graduate / Professional | 32 | 18.1% |
| Total | 177 | 100.0% |
School Enrollment by Age by Funding Source in Lake Kiowa
Out of a total of 177 students who are enrolled in schools in Lake Kiowa, 68 (38.4%) attend a private institution, while the remaining 109 (61.6%) are enrolled in public schools. The age group of 5 to 9 year old has the highest likelihood of being enrolled in private schools, with 54 (69.2% in the age bracket) enrolled. Conversely, the age group of 3 to 4 year olds has the lowest likelihood of being enrolled in a private school, with 13 (100.0% in the age bracket) attending a public institution.
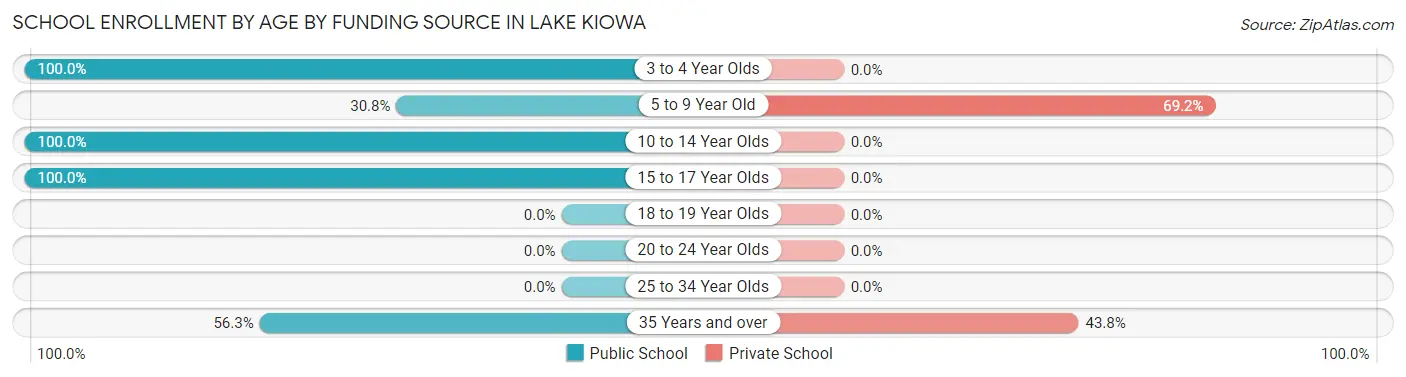
| Age Bracket | Public School | Private School |
| 3 to 4 Year Olds | 13 (100.0%) | 0 (0.0%) |
| 5 to 9 Year Old | 24 (30.8%) | 54 (69.2%) |
| 10 to 14 Year Olds | 37 (100.0%) | 0 (0.0%) |
| 15 to 17 Year Olds | 17 (100.0%) | 0 (0.0%) |
| 18 to 19 Year Olds | 0 (0.0%) | 0 (0.0%) |
| 20 to 24 Year Olds | 0 (0.0%) | 0 (0.0%) |
| 25 to 34 Year Olds | 0 (0.0%) | 0 (0.0%) |
| 35 Years and over | 18 (56.2%) | 14 (43.8%) |
| Total | 109 (61.6%) | 68 (38.4%) |
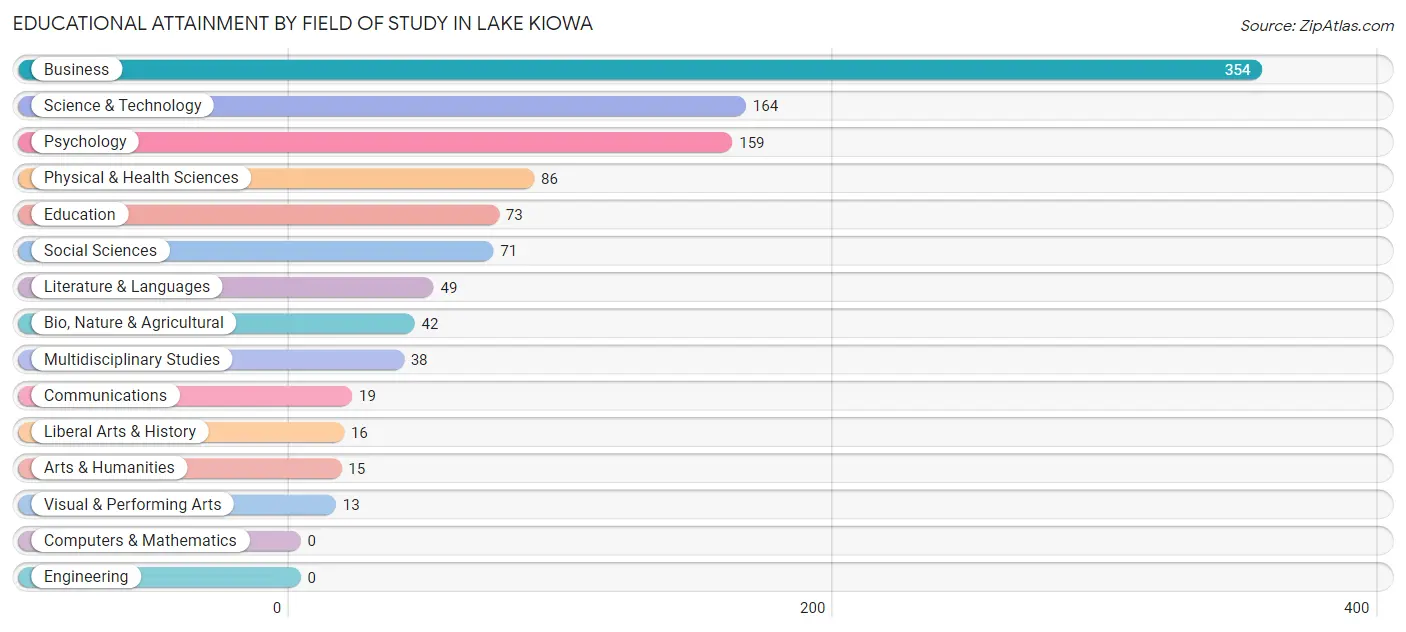
Educational Attainment by Field of Study in Lake Kiowa
Business (354 | 32.2%), science & technology (164 | 14.9%), psychology (159 | 14.5%), physical & health sciences (86 | 7.8%), and education (73 | 6.6%) are the most common fields of study among 1,099 individuals in Lake Kiowa who have obtained a bachelor's degree or higher.
| Field of Study | # Graduates | % Graduates |
| Computers & Mathematics | 0 | 0.0% |
| Bio, Nature & Agricultural | 42 | 3.8% |
| Physical & Health Sciences | 86 | 7.8% |
| Psychology | 159 | 14.5% |
| Social Sciences | 71 | 6.5% |
| Engineering | 0 | 0.0% |
| Multidisciplinary Studies | 38 | 3.5% |
| Science & Technology | 164 | 14.9% |
| Business | 354 | 32.2% |
| Education | 73 | 6.6% |
| Literature & Languages | 49 | 4.5% |
| Liberal Arts & History | 16 | 1.5% |
| Visual & Performing Arts | 13 | 1.2% |
| Communications | 19 | 1.7% |
| Arts & Humanities | 15 | 1.4% |
| Total | 1,099 | 100.0% |
Transportation & Commute in Lake Kiowa
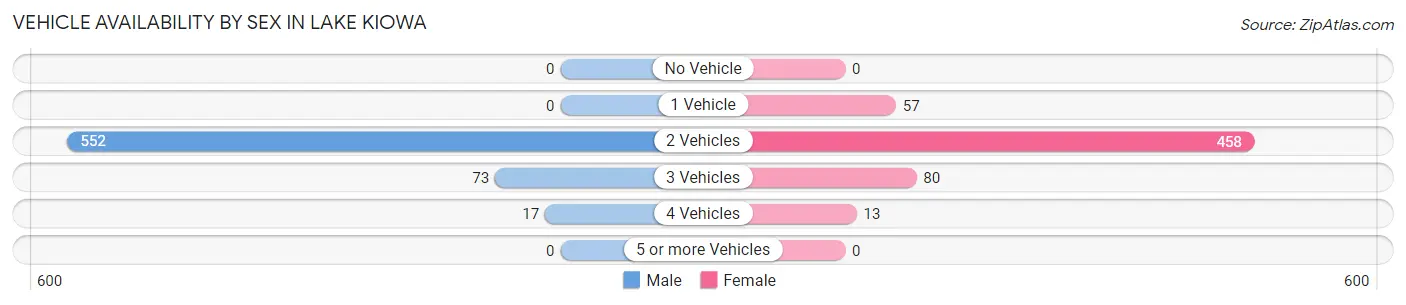
Vehicle Availability by Sex in Lake Kiowa
The most prevalent vehicle ownership categories in Lake Kiowa are males with 2 vehicles (552, accounting for 86.0%) and females with 2 vehicles (458, making up 90.8%).
| Vehicles Available | Male | Female |
| No Vehicle | 0 (0.0%) | 0 (0.0%) |
| 1 Vehicle | 0 (0.0%) | 57 (9.4%) |
| 2 Vehicles | 552 (86.0%) | 458 (75.3%) |
| 3 Vehicles | 73 (11.4%) | 80 (13.2%) |
| 4 Vehicles | 17 (2.6%) | 13 (2.1%) |
| 5 or more Vehicles | 0 (0.0%) | 0 (0.0%) |
| Total | 642 (100.0%) | 608 (100.0%) |
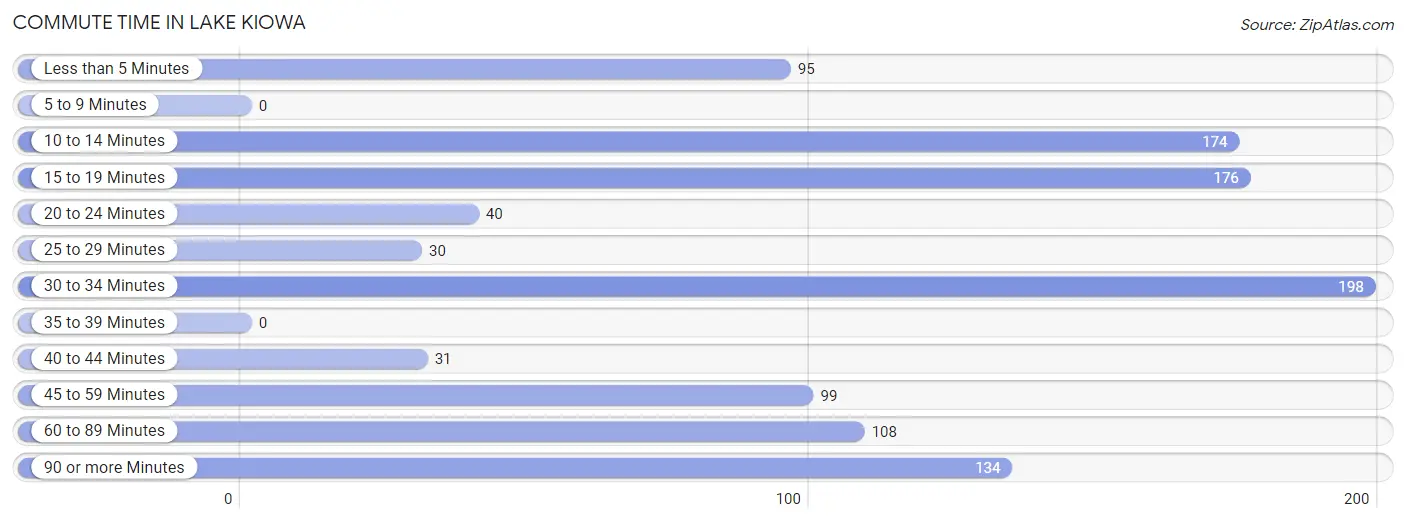
Commute Time in Lake Kiowa
The most frequently occuring commute durations in Lake Kiowa are 30 to 34 minutes (198 commuters, 18.2%), 15 to 19 minutes (176 commuters, 16.2%), and 10 to 14 minutes (174 commuters, 16.0%).
| Commute Time | # Commuters | % Commuters |
| Less than 5 Minutes | 95 | 8.8% |
| 5 to 9 Minutes | 0 | 0.0% |
| 10 to 14 Minutes | 174 | 16.0% |
| 15 to 19 Minutes | 176 | 16.2% |
| 20 to 24 Minutes | 40 | 3.7% |
| 25 to 29 Minutes | 30 | 2.8% |
| 30 to 34 Minutes | 198 | 18.2% |
| 35 to 39 Minutes | 0 | 0.0% |
| 40 to 44 Minutes | 31 | 2.9% |
| 45 to 59 Minutes | 99 | 9.1% |
| 60 to 89 Minutes | 108 | 10.0% |
| 90 or more Minutes | 134 | 12.3% |
Commute Time by Sex in Lake Kiowa
The most common commute times in Lake Kiowa are 30 to 34 minutes (136 commuters, 24.7%) for males and 15 to 19 minutes (109 commuters, 20.4%) for females.
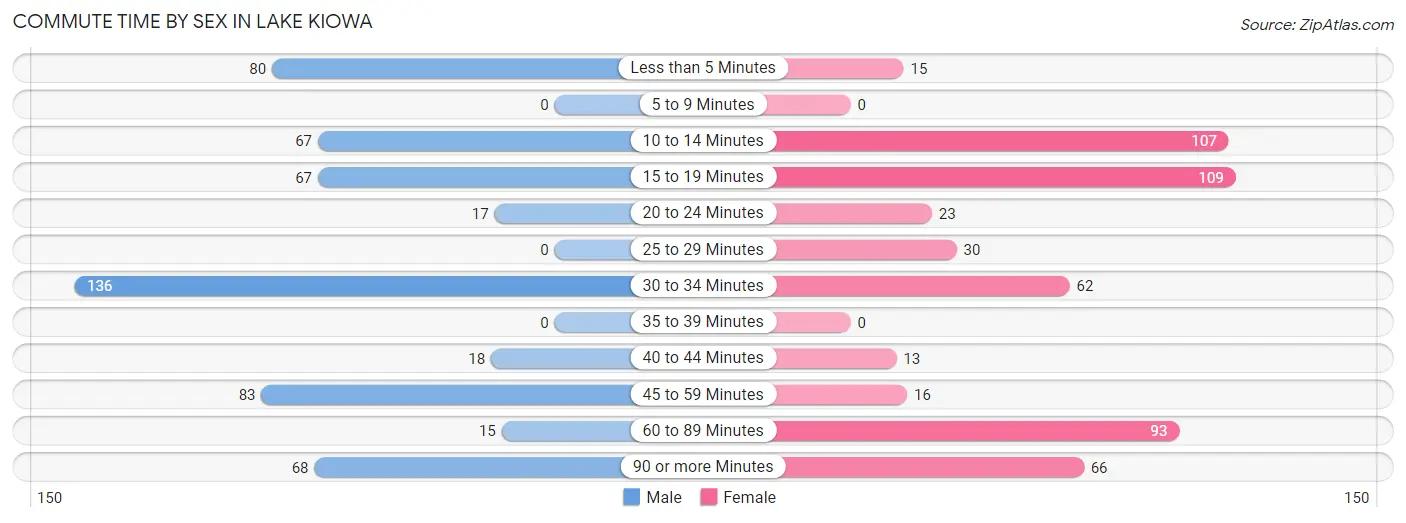
| Commute Time | Male | Female |
| Less than 5 Minutes | 80 (14.5%) | 15 (2.8%) |
| 5 to 9 Minutes | 0 (0.0%) | 0 (0.0%) |
| 10 to 14 Minutes | 67 (12.2%) | 107 (20.0%) |
| 15 to 19 Minutes | 67 (12.2%) | 109 (20.4%) |
| 20 to 24 Minutes | 17 (3.1%) | 23 (4.3%) |
| 25 to 29 Minutes | 0 (0.0%) | 30 (5.6%) |
| 30 to 34 Minutes | 136 (24.7%) | 62 (11.6%) |
| 35 to 39 Minutes | 0 (0.0%) | 0 (0.0%) |
| 40 to 44 Minutes | 18 (3.3%) | 13 (2.4%) |
| 45 to 59 Minutes | 83 (15.1%) | 16 (3.0%) |
| 60 to 89 Minutes | 15 (2.7%) | 93 (17.4%) |
| 90 or more Minutes | 68 (12.3%) | 66 (12.4%) |
Time of Departure to Work by Sex in Lake Kiowa
The most frequent times of departure to work in Lake Kiowa are 7:00 AM to 7:29 AM (106, 19.2%) for males and 7:30 AM to 7:59 AM (137, 25.7%) for females.
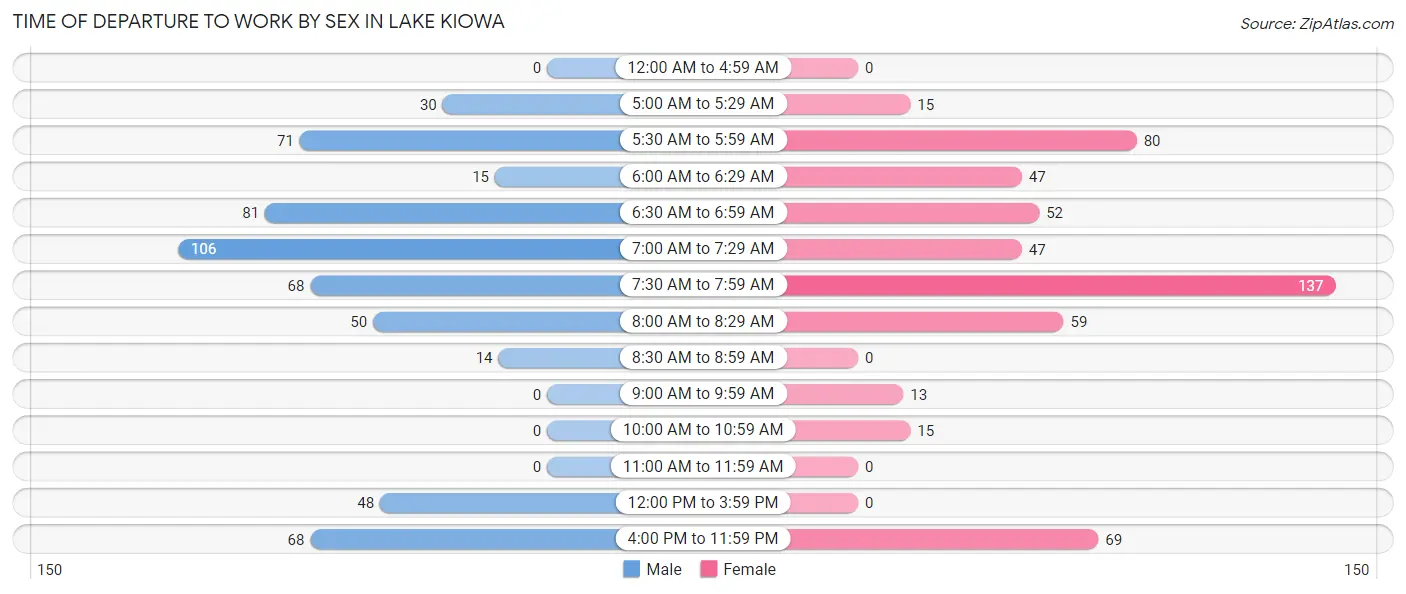
| Time of Departure | Male | Female |
| 12:00 AM to 4:59 AM | 0 (0.0%) | 0 (0.0%) |
| 5:00 AM to 5:29 AM | 30 (5.4%) | 15 (2.8%) |
| 5:30 AM to 5:59 AM | 71 (12.9%) | 80 (15.0%) |
| 6:00 AM to 6:29 AM | 15 (2.7%) | 47 (8.8%) |
| 6:30 AM to 6:59 AM | 81 (14.7%) | 52 (9.7%) |
| 7:00 AM to 7:29 AM | 106 (19.2%) | 47 (8.8%) |
| 7:30 AM to 7:59 AM | 68 (12.3%) | 137 (25.7%) |
| 8:00 AM to 8:29 AM | 50 (9.1%) | 59 (11.1%) |
| 8:30 AM to 8:59 AM | 14 (2.5%) | 0 (0.0%) |
| 9:00 AM to 9:59 AM | 0 (0.0%) | 13 (2.4%) |
| 10:00 AM to 10:59 AM | 0 (0.0%) | 15 (2.8%) |
| 11:00 AM to 11:59 AM | 0 (0.0%) | 0 (0.0%) |
| 12:00 PM to 3:59 PM | 48 (8.7%) | 0 (0.0%) |
| 4:00 PM to 11:59 PM | 68 (12.3%) | 69 (12.9%) |
| Total | 551 (100.0%) | 534 (100.0%) |
Housing Occupancy in Lake Kiowa
Occupancy by Ownership in Lake Kiowa
Of the total 1,198 dwellings in Lake Kiowa, owner-occupied units account for 1,064 (88.8%), while renter-occupied units make up 134 (11.2%).
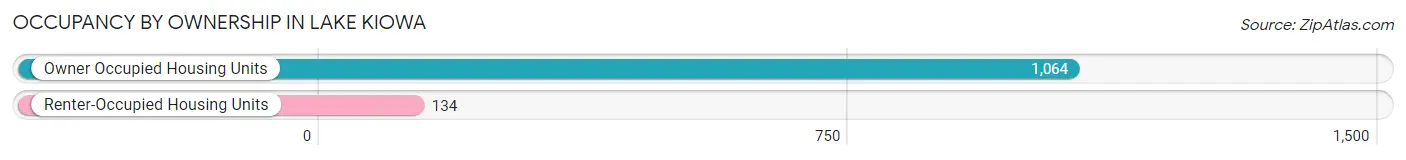
| Occupancy | # Housing Units | % Housing Units |
| Owner Occupied Housing Units | 1,064 | 88.8% |
| Renter-Occupied Housing Units | 134 | 11.2% |
| Total Occupied Housing Units | 1,198 | 100.0% |
Occupancy by Household Size in Lake Kiowa
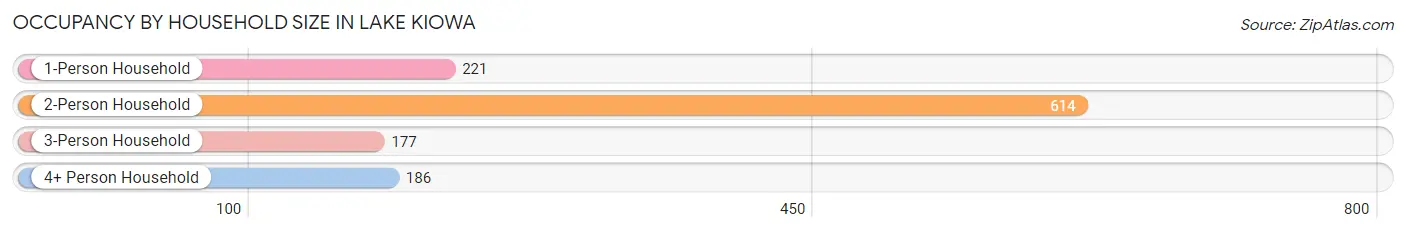
| Household Size | # Housing Units | % Housing Units |
| 1-Person Household | 221 | 18.4% |
| 2-Person Household | 614 | 51.2% |
| 3-Person Household | 177 | 14.8% |
| 4+ Person Household | 186 | 15.5% |
| Total Housing Units | 1,198 | 100.0% |
Occupancy by Ownership by Household Size in Lake Kiowa
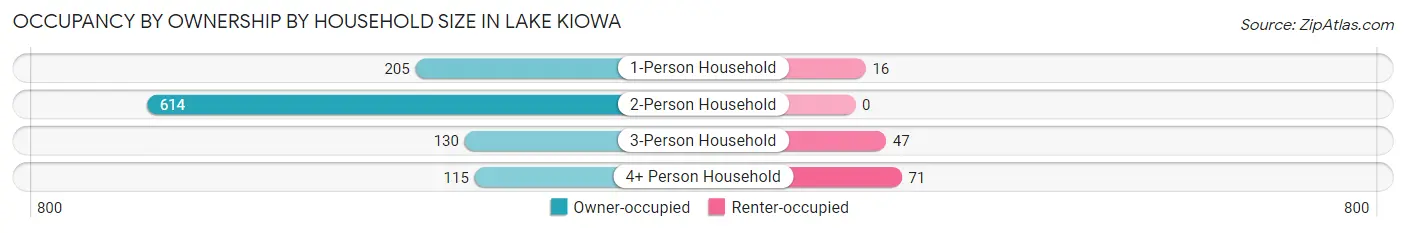
| Household Size | Owner-occupied | Renter-occupied |
| 1-Person Household | 205 (92.8%) | 16 (7.2%) |
| 2-Person Household | 614 (100.0%) | 0 (0.0%) |
| 3-Person Household | 130 (73.5%) | 47 (26.6%) |
| 4+ Person Household | 115 (61.8%) | 71 (38.2%) |
| Total Housing Units | 1,064 (88.8%) | 134 (11.2%) |
Occupancy by Educational Attainment in Lake Kiowa
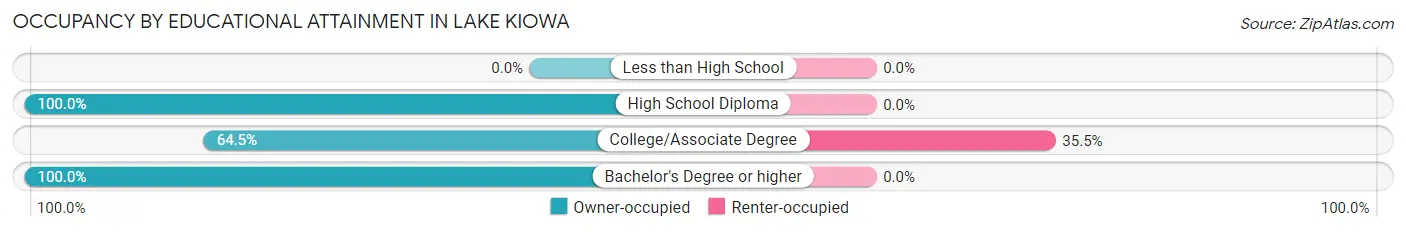
| Household Size | Owner-occupied | Renter-occupied |
| Less than High School | 0 (0.0%) | 0 (0.0%) |
| High School Diploma | 270 (100.0%) | 0 (0.0%) |
| College/Associate Degree | 243 (64.5%) | 134 (35.5%) |
| Bachelor's Degree or higher | 551 (100.0%) | 0 (0.0%) |
Occupancy by Age of Householder in Lake Kiowa
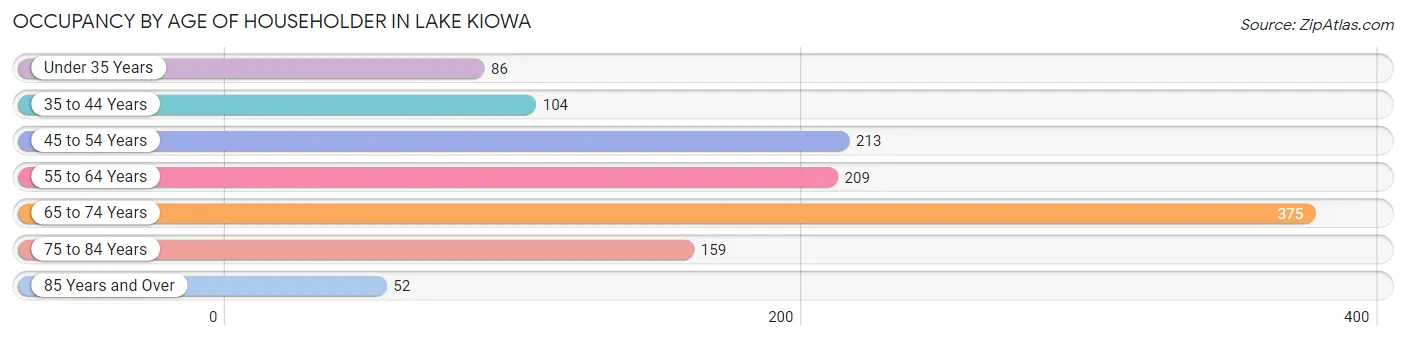
| Age Bracket | # Households | % Households |
| Under 35 Years | 86 | 7.2% |
| 35 to 44 Years | 104 | 8.7% |
| 45 to 54 Years | 213 | 17.8% |
| 55 to 64 Years | 209 | 17.4% |
| 65 to 74 Years | 375 | 31.3% |
| 75 to 84 Years | 159 | 13.3% |
| 85 Years and Over | 52 | 4.3% |
| Total | 1,198 | 100.0% |
Housing Finances in Lake Kiowa
Median Income by Occupancy in Lake Kiowa
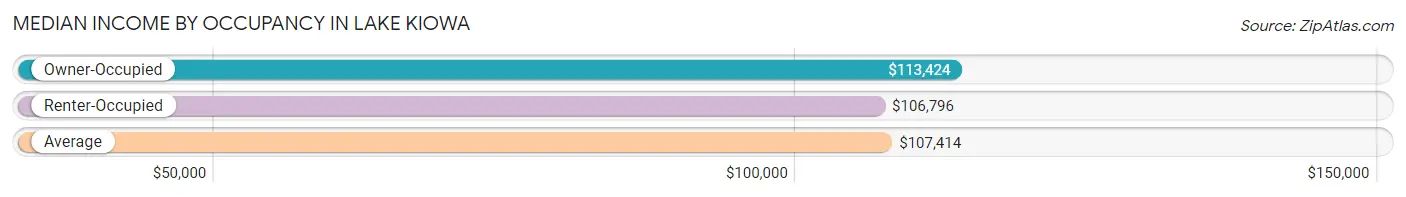
| Occupancy Type | # Households | Median Income |
| Owner-Occupied | 1,064 (88.8%) | $113,424 |
| Renter-Occupied | 134 (11.2%) | $106,796 |
| Average | 1,198 (100.0%) | $107,414 |
Occupancy by Householder Income Bracket in Lake Kiowa
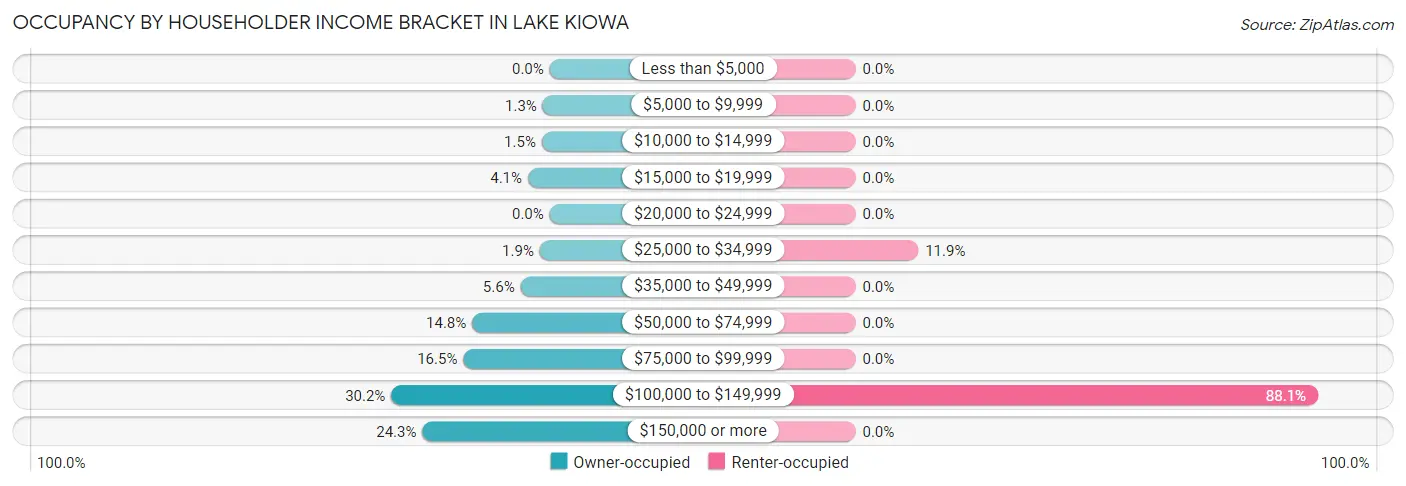
| Income Bracket | Owner-occupied | Renter-occupied |
| Less than $5,000 | 0 (0.0%) | 0 (0.0%) |
| $5,000 to $9,999 | 14 (1.3%) | 0 (0.0%) |
| $10,000 to $14,999 | 16 (1.5%) | 0 (0.0%) |
| $15,000 to $19,999 | 44 (4.1%) | 0 (0.0%) |
| $20,000 to $24,999 | 0 (0.0%) | 0 (0.0%) |
| $25,000 to $34,999 | 20 (1.9%) | 16 (11.9%) |
| $35,000 to $49,999 | 59 (5.6%) | 0 (0.0%) |
| $50,000 to $74,999 | 157 (14.8%) | 0 (0.0%) |
| $75,000 to $99,999 | 175 (16.5%) | 0 (0.0%) |
| $100,000 to $149,999 | 321 (30.2%) | 118 (88.1%) |
| $150,000 or more | 258 (24.2%) | 0 (0.0%) |
| Total | 1,064 (100.0%) | 134 (100.0%) |
Monthly Housing Cost Tiers in Lake Kiowa
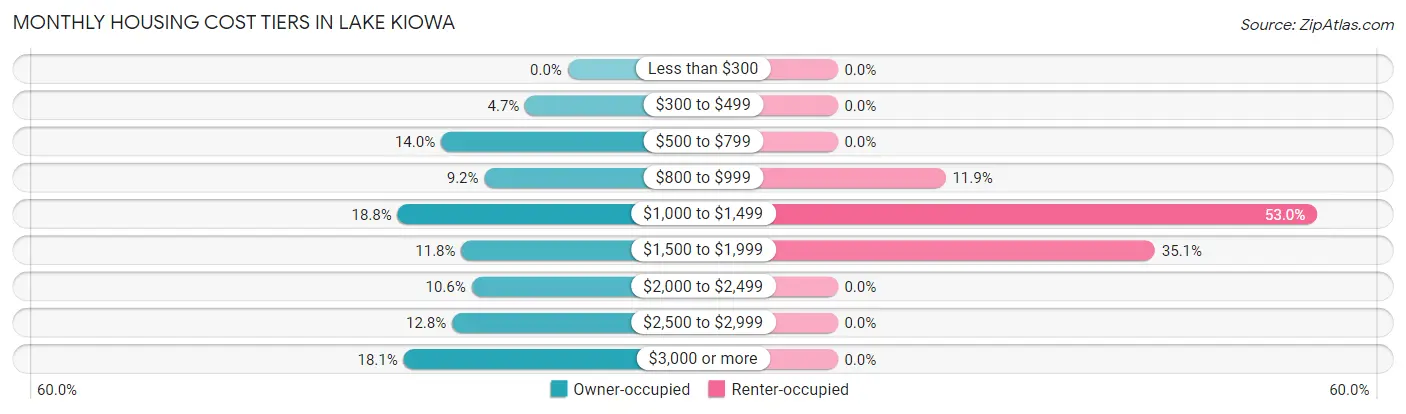
| Monthly Cost | Owner-occupied | Renter-occupied |
| Less than $300 | 0 (0.0%) | 0 (0.0%) |
| $300 to $499 | 50 (4.7%) | 0 (0.0%) |
| $500 to $799 | 149 (14.0%) | 0 (0.0%) |
| $800 to $999 | 98 (9.2%) | 16 (11.9%) |
| $1,000 to $1,499 | 200 (18.8%) | 71 (53.0%) |
| $1,500 to $1,999 | 125 (11.7%) | 47 (35.1%) |
| $2,000 to $2,499 | 113 (10.6%) | 0 (0.0%) |
| $2,500 to $2,999 | 136 (12.8%) | 0 (0.0%) |
| $3,000 or more | 193 (18.1%) | 0 (0.0%) |
| Total | 1,064 (100.0%) | 134 (100.0%) |
Physical Housing Characteristics in Lake Kiowa
Housing Structures in Lake Kiowa
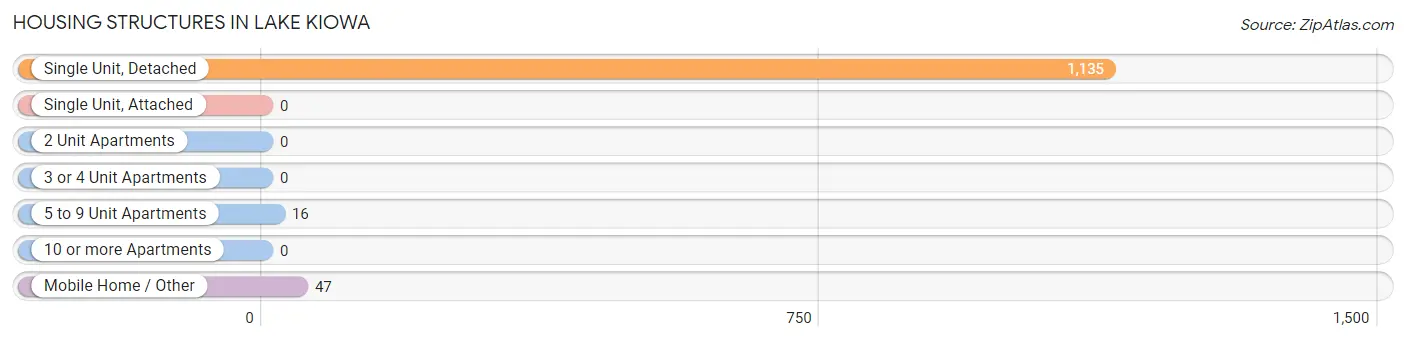
| Structure Type | # Housing Units | % Housing Units |
| Single Unit, Detached | 1,135 | 94.7% |
| Single Unit, Attached | 0 | 0.0% |
| 2 Unit Apartments | 0 | 0.0% |
| 3 or 4 Unit Apartments | 0 | 0.0% |
| 5 to 9 Unit Apartments | 16 | 1.3% |
| 10 or more Apartments | 0 | 0.0% |
| Mobile Home / Other | 47 | 3.9% |
| Total | 1,198 | 100.0% |
Housing Structures by Occupancy in Lake Kiowa
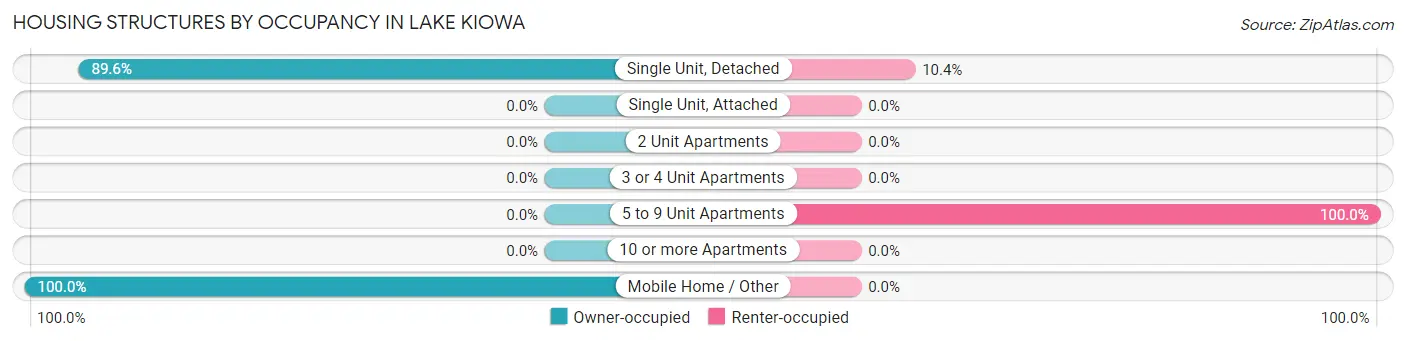
| Structure Type | Owner-occupied | Renter-occupied |
| Single Unit, Detached | 1,017 (89.6%) | 118 (10.4%) |
| Single Unit, Attached | 0 (0.0%) | 0 (0.0%) |
| 2 Unit Apartments | 0 (0.0%) | 0 (0.0%) |
| 3 or 4 Unit Apartments | 0 (0.0%) | 0 (0.0%) |
| 5 to 9 Unit Apartments | 0 (0.0%) | 16 (100.0%) |
| 10 or more Apartments | 0 (0.0%) | 0 (0.0%) |
| Mobile Home / Other | 47 (100.0%) | 0 (0.0%) |
| Total | 1,064 (88.8%) | 134 (11.2%) |
Housing Structures by Number of Rooms in Lake Kiowa
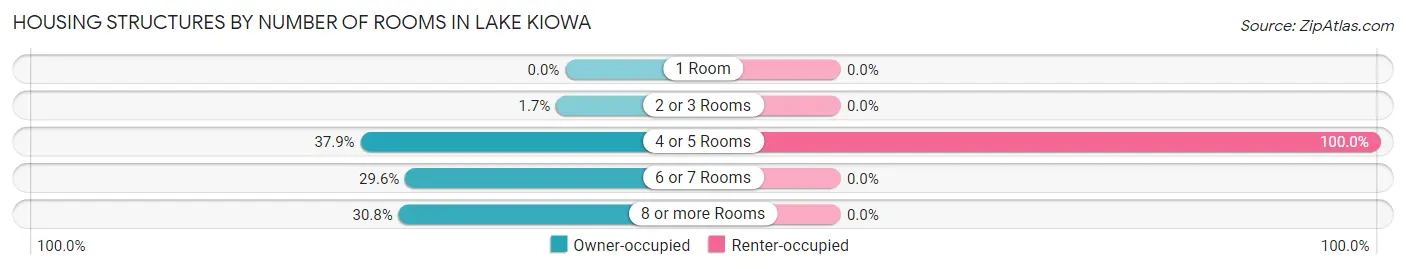
| Number of Rooms | Owner-occupied | Renter-occupied |
| 1 Room | 0 (0.0%) | 0 (0.0%) |
| 2 or 3 Rooms | 18 (1.7%) | 0 (0.0%) |
| 4 or 5 Rooms | 403 (37.9%) | 134 (100.0%) |
| 6 or 7 Rooms | 315 (29.6%) | 0 (0.0%) |
| 8 or more Rooms | 328 (30.8%) | 0 (0.0%) |
| Total | 1,064 (100.0%) | 134 (100.0%) |
Housing Structure by Heating Type in Lake Kiowa
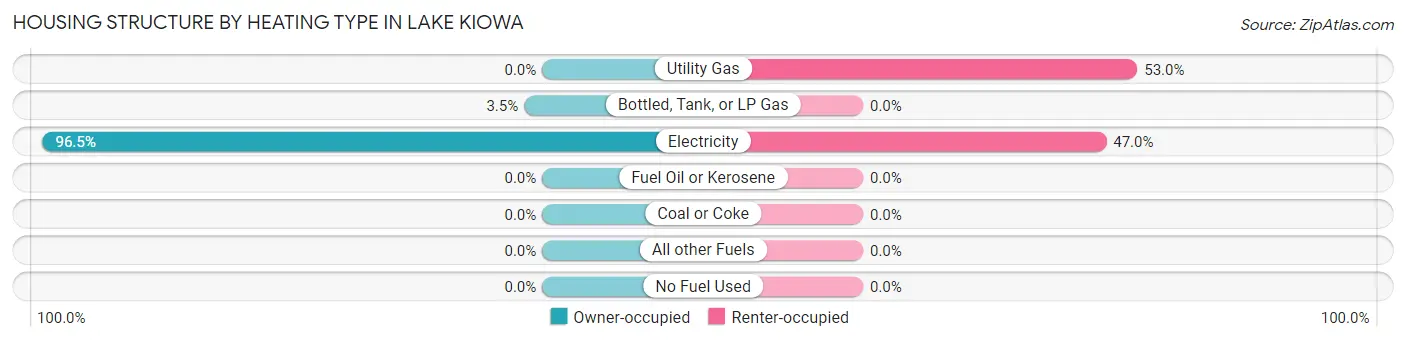
| Heating Type | Owner-occupied | Renter-occupied |
| Utility Gas | 0 (0.0%) | 71 (53.0%) |
| Bottled, Tank, or LP Gas | 37 (3.5%) | 0 (0.0%) |
| Electricity | 1,027 (96.5%) | 63 (47.0%) |
| Fuel Oil or Kerosene | 0 (0.0%) | 0 (0.0%) |
| Coal or Coke | 0 (0.0%) | 0 (0.0%) |
| All other Fuels | 0 (0.0%) | 0 (0.0%) |
| No Fuel Used | 0 (0.0%) | 0 (0.0%) |
| Total | 1,064 (100.0%) | 134 (100.0%) |
Household Vehicle Usage in Lake Kiowa
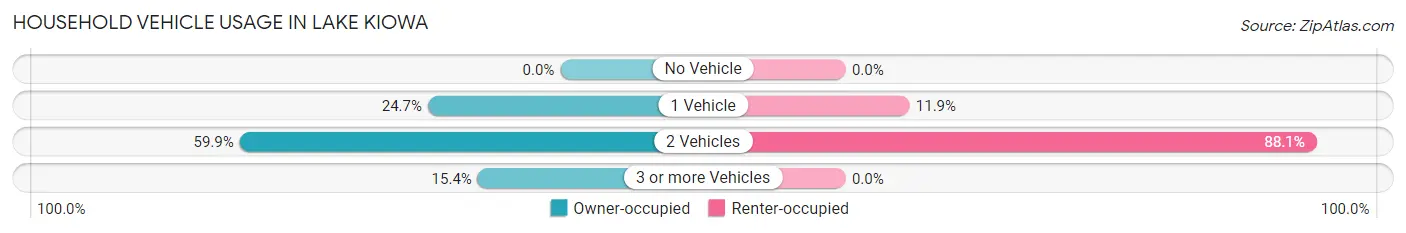
| Vehicles per Household | Owner-occupied | Renter-occupied |
| No Vehicle | 0 (0.0%) | 0 (0.0%) |
| 1 Vehicle | 263 (24.7%) | 16 (11.9%) |
| 2 Vehicles | 637 (59.9%) | 118 (88.1%) |
| 3 or more Vehicles | 164 (15.4%) | 0 (0.0%) |
| Total | 1,064 (100.0%) | 134 (100.0%) |
Real Estate & Mortgages in Lake Kiowa
Real Estate and Mortgage Overview in Lake Kiowa
| Characteristic | Without Mortgage | With Mortgage |
| Housing Units | 425 | 639 |
| Median Property Value | $410,700 | $390,300 |
| Median Household Income | $82,121 | $138 |
| Monthly Housing Costs | $838 | $193 |
| Real Estate Taxes | $5,223 | $12 |
Property Value by Mortgage Status in Lake Kiowa
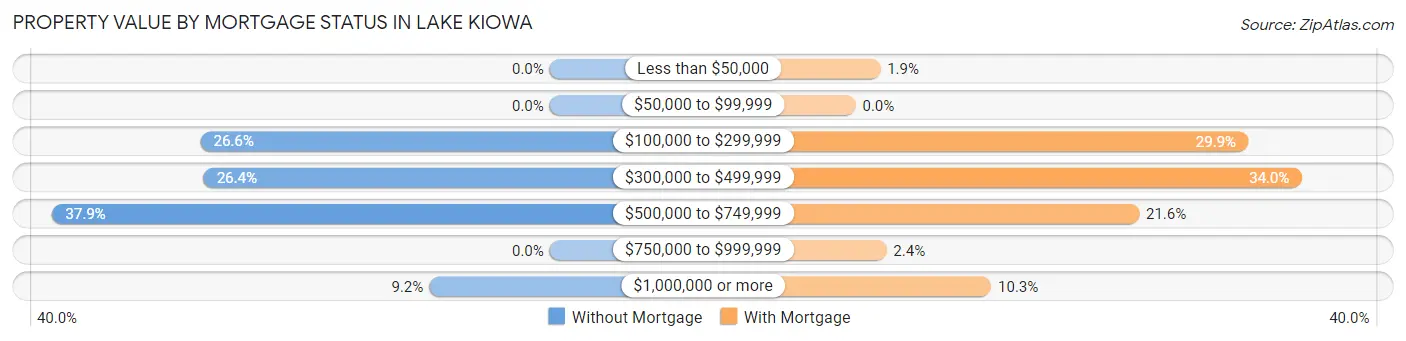
| Property Value | Without Mortgage | With Mortgage |
| Less than $50,000 | 0 (0.0%) | 12 (1.9%) |
| $50,000 to $99,999 | 0 (0.0%) | 0 (0.0%) |
| $100,000 to $299,999 | 113 (26.6%) | 191 (29.9%) |
| $300,000 to $499,999 | 112 (26.4%) | 217 (34.0%) |
| $500,000 to $749,999 | 161 (37.9%) | 138 (21.6%) |
| $750,000 to $999,999 | 0 (0.0%) | 15 (2.4%) |
| $1,000,000 or more | 39 (9.2%) | 66 (10.3%) |
| Total | 425 (100.0%) | 639 (100.0%) |
Household Income by Mortgage Status in Lake Kiowa
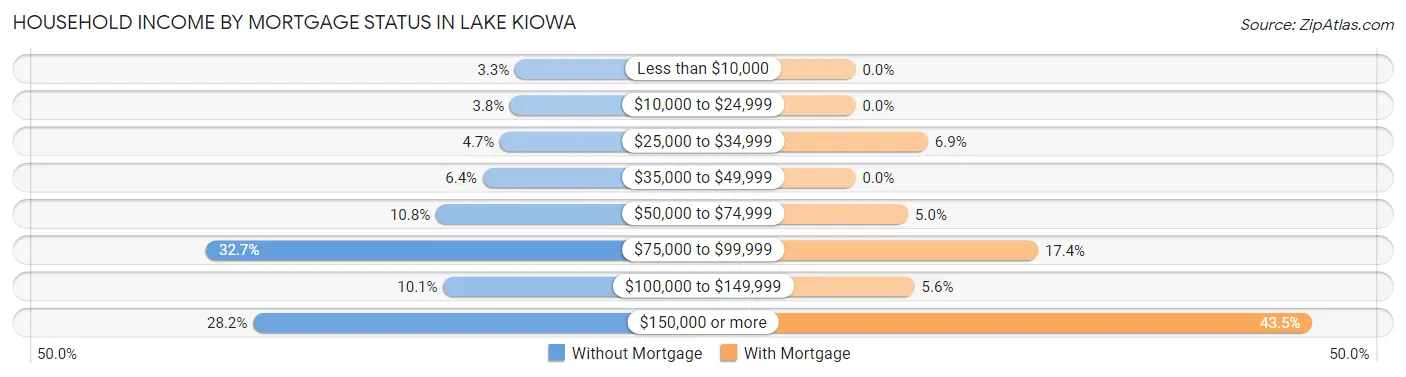
| Household Income | Without Mortgage | With Mortgage |
| Less than $10,000 | 14 (3.3%) | 0 (0.0%) |
| $10,000 to $24,999 | 16 (3.8%) | 0 (0.0%) |
| $25,000 to $34,999 | 20 (4.7%) | 44 (6.9%) |
| $35,000 to $49,999 | 27 (6.4%) | 0 (0.0%) |
| $50,000 to $74,999 | 46 (10.8%) | 32 (5.0%) |
| $75,000 to $99,999 | 139 (32.7%) | 111 (17.4%) |
| $100,000 to $149,999 | 43 (10.1%) | 36 (5.6%) |
| $150,000 or more | 120 (28.2%) | 278 (43.5%) |
| Total | 425 (100.0%) | 639 (100.0%) |
Property Value to Household Income Ratio in Lake Kiowa
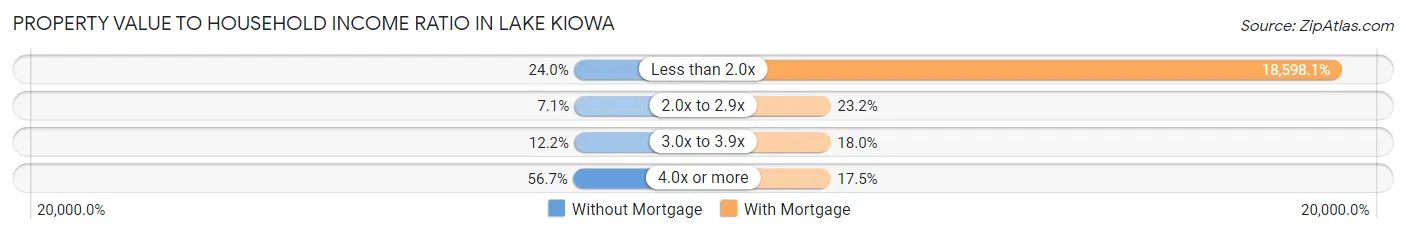
| Value-to-Income Ratio | Without Mortgage | With Mortgage |
| Less than 2.0x | 102 (24.0%) | 118,842 (18,598.1%) |
| 2.0x to 2.9x | 30 (7.1%) | 148 (23.2%) |
| 3.0x to 3.9x | 52 (12.2%) | 115 (18.0%) |
| 4.0x or more | 241 (56.7%) | 112 (17.5%) |
| Total | 425 (100.0%) | 639 (100.0%) |
Real Estate Taxes by Mortgage Status in Lake Kiowa
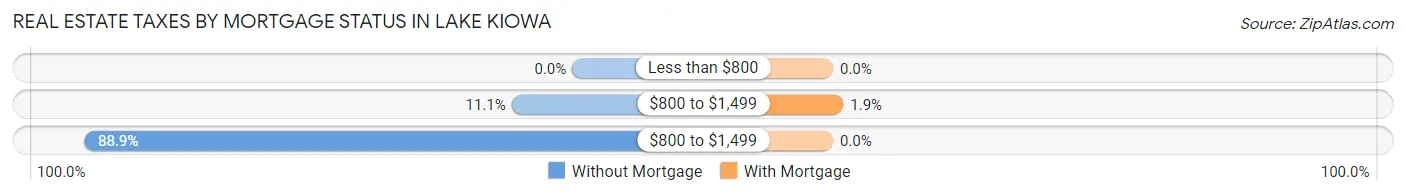
| Property Taxes | Without Mortgage | With Mortgage |
| Less than $800 | 0 (0.0%) | 0 (0.0%) |
| $800 to $1,499 | 47 (11.1%) | 12 (1.9%) |
| $800 to $1,499 | 378 (88.9%) | 0 (0.0%) |
| Total | 425 (100.0%) | 639 (100.0%) |
Health & Disability in Lake Kiowa
Health Insurance Coverage by Age in Lake Kiowa
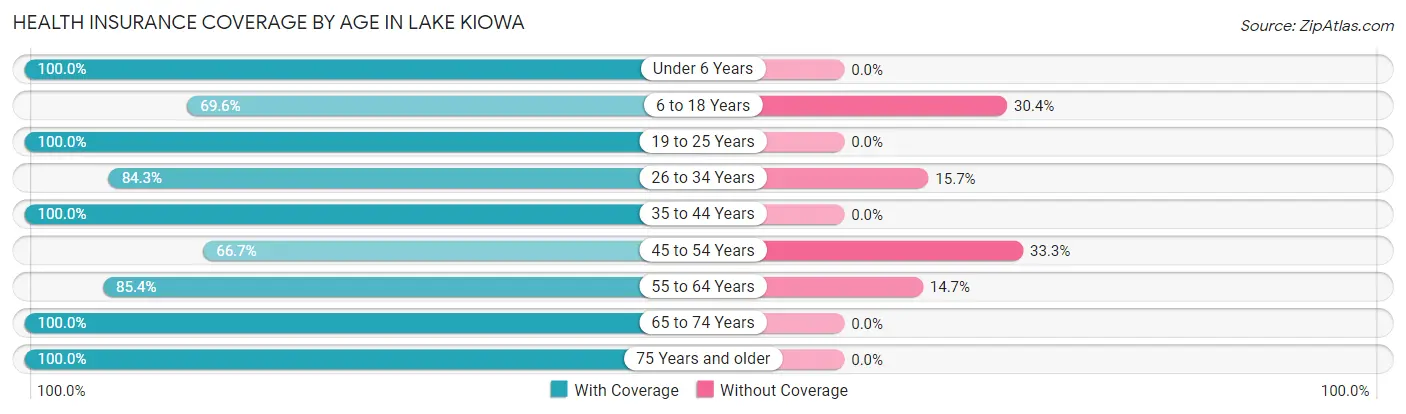
| Age Bracket | With Coverage | Without Coverage |
| Under 6 Years | 312 (100.0%) | 0 (0.0%) |
| 6 to 18 Years | 78 (69.6%) | 34 (30.4%) |
| 19 to 25 Years | 80 (100.0%) | 0 (0.0%) |
| 26 to 34 Years | 86 (84.3%) | 16 (15.7%) |
| 35 to 44 Years | 297 (100.0%) | 0 (0.0%) |
| 45 to 54 Years | 188 (66.7%) | 94 (33.3%) |
| 55 to 64 Years | 472 (85.4%) | 81 (14.6%) |
| 65 to 74 Years | 550 (100.0%) | 0 (0.0%) |
| 75 Years and older | 440 (100.0%) | 0 (0.0%) |
| Total | 2,503 (91.7%) | 225 (8.3%) |
Health Insurance Coverage by Citizenship Status in Lake Kiowa
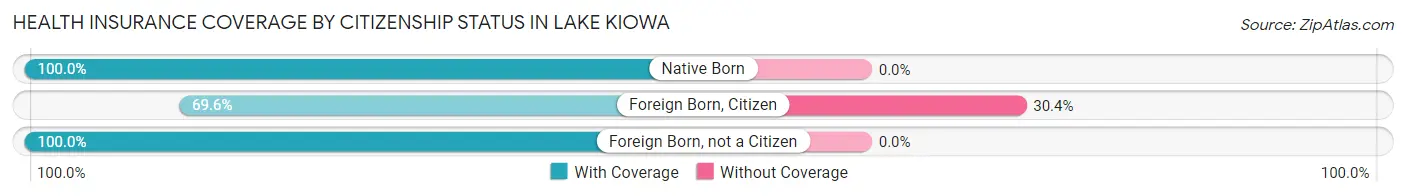
| Citizenship Status | With Coverage | Without Coverage |
| Native Born | 312 (100.0%) | 0 (0.0%) |
| Foreign Born, Citizen | 78 (69.6%) | 34 (30.4%) |
| Foreign Born, not a Citizen | 80 (100.0%) | 0 (0.0%) |
Health Insurance Coverage by Household Income in Lake Kiowa
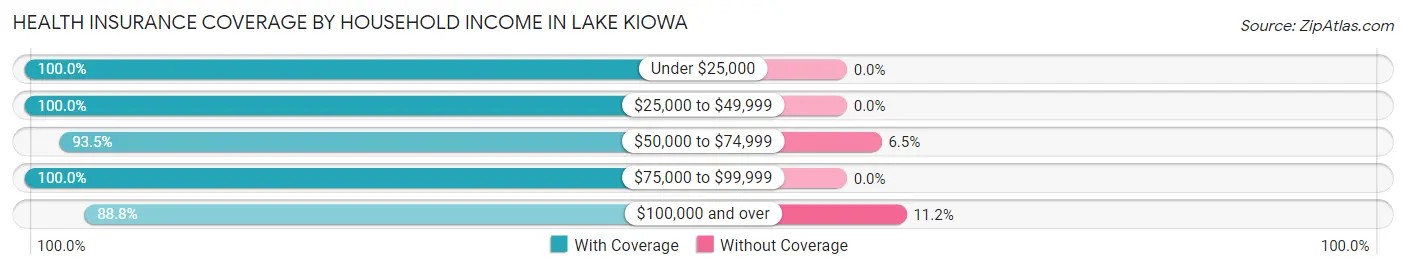
| Household Income | With Coverage | Without Coverage |
| Under $25,000 | 87 (100.0%) | 0 (0.0%) |
| $25,000 to $49,999 | 139 (100.0%) | 0 (0.0%) |
| $50,000 to $74,999 | 245 (93.5%) | 17 (6.5%) |
| $75,000 to $99,999 | 380 (100.0%) | 0 (0.0%) |
| $100,000 and over | 1,652 (88.8%) | 208 (11.2%) |
Public vs Private Health Insurance Coverage by Age in Lake Kiowa
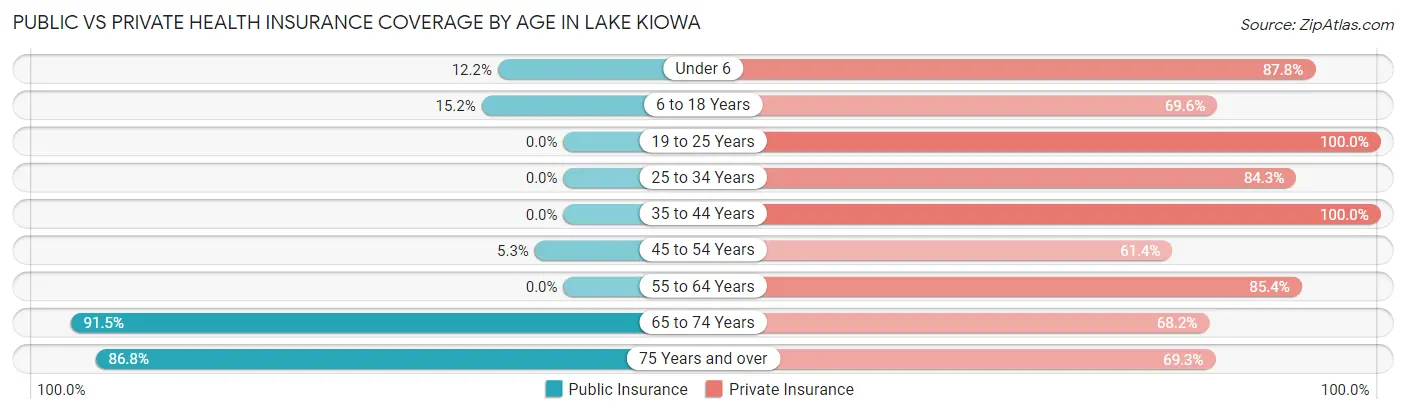
| Age Bracket | Public Insurance | Private Insurance |
| Under 6 | 38 (12.2%) | 274 (87.8%) |
| 6 to 18 Years | 17 (15.2%) | 78 (69.6%) |
| 19 to 25 Years | 0 (0.0%) | 80 (100.0%) |
| 25 to 34 Years | 0 (0.0%) | 86 (84.3%) |
| 35 to 44 Years | 0 (0.0%) | 297 (100.0%) |
| 45 to 54 Years | 15 (5.3%) | 173 (61.4%) |
| 55 to 64 Years | 0 (0.0%) | 472 (85.4%) |
| 65 to 74 Years | 503 (91.4%) | 375 (68.2%) |
| 75 Years and over | 382 (86.8%) | 305 (69.3%) |
| Total | 955 (35.0%) | 2,140 (78.4%) |
Disability Status by Sex by Age in Lake Kiowa
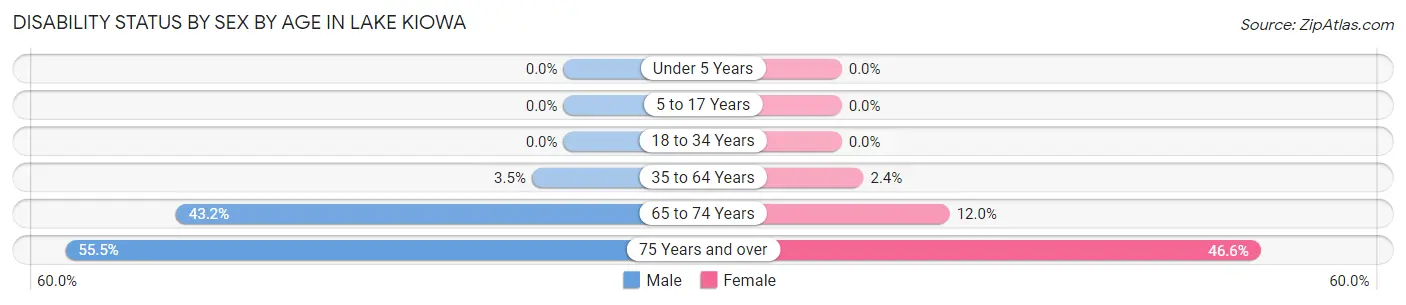
| Age Bracket | Male | Female |
| Under 5 Years | 0 (0.0%) | 0 (0.0%) |
| 5 to 17 Years | 0 (0.0%) | 0 (0.0%) |
| 18 to 34 Years | 0 (0.0%) | 0 (0.0%) |
| 35 to 64 Years | 18 (3.5%) | 15 (2.4%) |
| 65 to 74 Years | 126 (43.1%) | 31 (12.0%) |
| 75 Years and over | 112 (55.4%) | 111 (46.6%) |
Disability Class by Sex by Age in Lake Kiowa
Disability Class: Hearing Difficulty
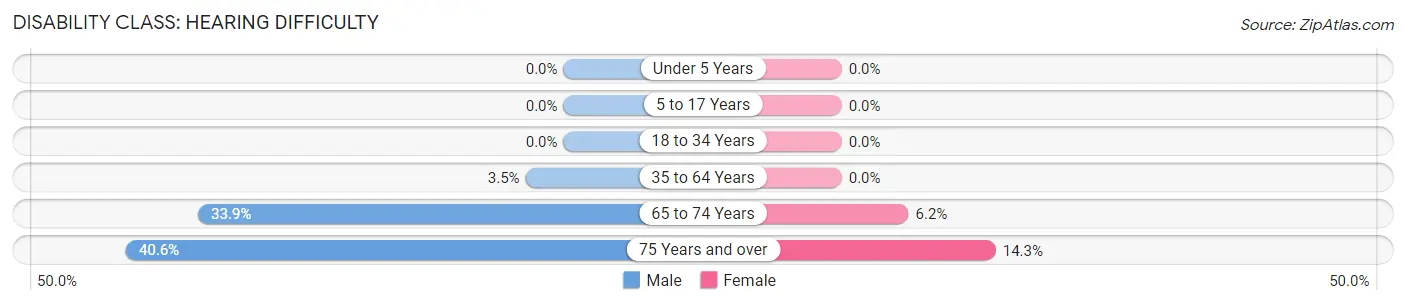
| Age Bracket | Male | Female |
| Under 5 Years | 0 (0.0%) | 0 (0.0%) |
| 5 to 17 Years | 0 (0.0%) | 0 (0.0%) |
| 18 to 34 Years | 0 (0.0%) | 0 (0.0%) |
| 35 to 64 Years | 18 (3.5%) | 0 (0.0%) |
| 65 to 74 Years | 99 (33.9%) | 16 (6.2%) |
| 75 Years and over | 82 (40.6%) | 34 (14.3%) |
Disability Class: Vision Difficulty
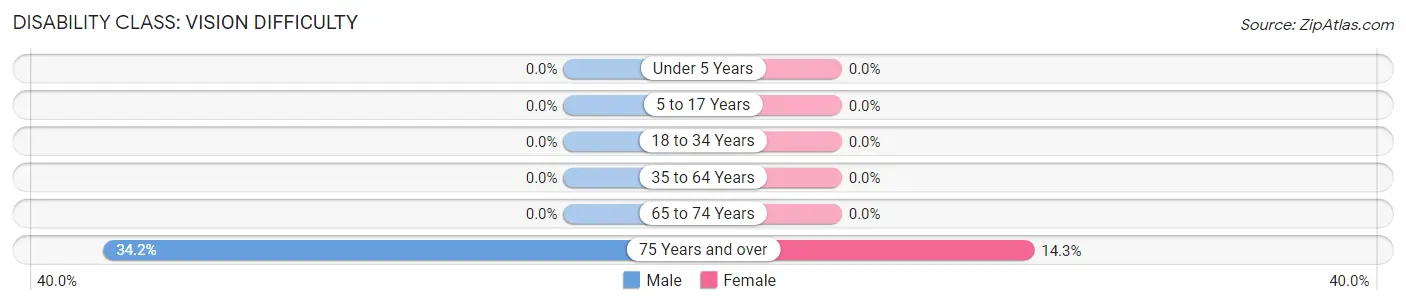
| Age Bracket | Male | Female |
| Under 5 Years | 0 (0.0%) | 0 (0.0%) |
| 5 to 17 Years | 0 (0.0%) | 0 (0.0%) |
| 18 to 34 Years | 0 (0.0%) | 0 (0.0%) |
| 35 to 64 Years | 0 (0.0%) | 0 (0.0%) |
| 65 to 74 Years | 0 (0.0%) | 0 (0.0%) |
| 75 Years and over | 69 (34.2%) | 34 (14.3%) |
Disability Class: Cognitive Difficulty
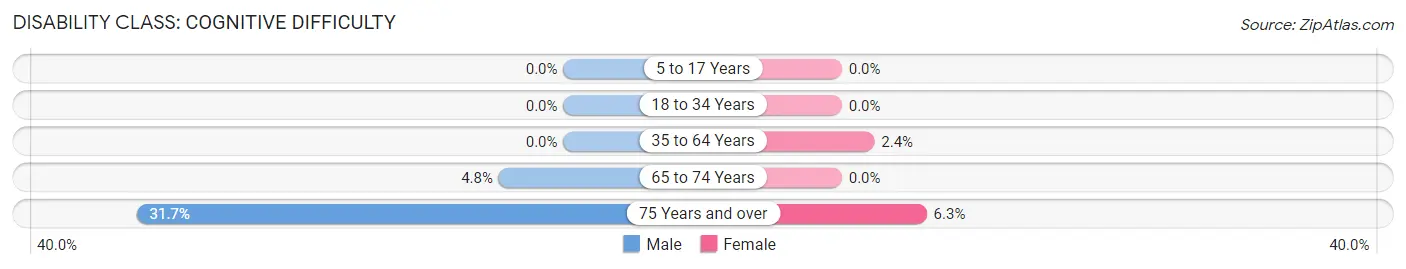
| Age Bracket | Male | Female |
| 5 to 17 Years | 0 (0.0%) | 0 (0.0%) |
| 18 to 34 Years | 0 (0.0%) | 0 (0.0%) |
| 35 to 64 Years | 0 (0.0%) | 15 (2.4%) |
| 65 to 74 Years | 14 (4.8%) | 0 (0.0%) |
| 75 Years and over | 64 (31.7%) | 15 (6.3%) |
Disability Class: Ambulatory Difficulty

| Age Bracket | Male | Female |
| 5 to 17 Years | 0 (0.0%) | 0 (0.0%) |
| 18 to 34 Years | 0 (0.0%) | 0 (0.0%) |
| 35 to 64 Years | 0 (0.0%) | 15 (2.4%) |
| 65 to 74 Years | 40 (13.7%) | 15 (5.8%) |
| 75 Years and over | 81 (40.1%) | 73 (30.7%) |
Disability Class: Self-Care Difficulty
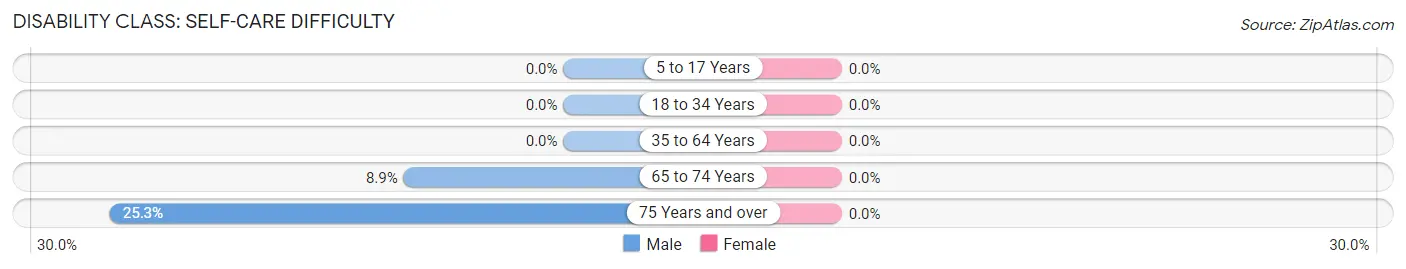
| Age Bracket | Male | Female |
| 5 to 17 Years | 0 (0.0%) | 0 (0.0%) |
| 18 to 34 Years | 0 (0.0%) | 0 (0.0%) |
| 35 to 64 Years | 0 (0.0%) | 0 (0.0%) |
| 65 to 74 Years | 26 (8.9%) | 0 (0.0%) |
| 75 Years and over | 51 (25.3%) | 0 (0.0%) |
Technology Access in Lake Kiowa
Computing Device Access in Lake Kiowa
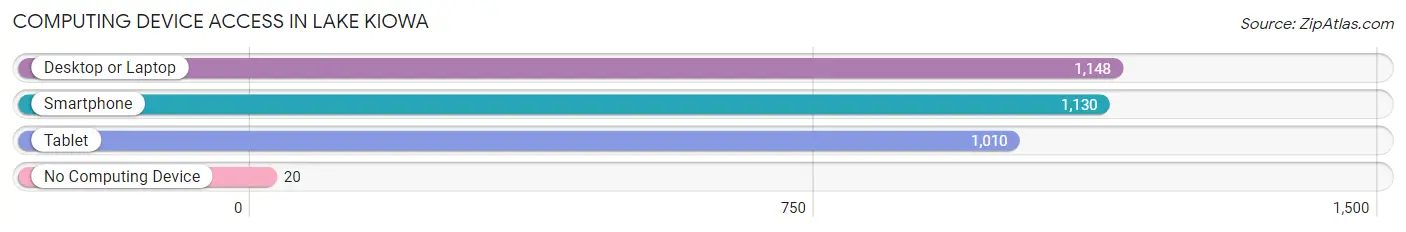
| Device Type | # Households | % Households |
| Desktop or Laptop | 1,148 | 95.8% |
| Smartphone | 1,130 | 94.3% |
| Tablet | 1,010 | 84.3% |
| No Computing Device | 20 | 1.7% |
| Total | 1,198 | 100.0% |
Internet Access in Lake Kiowa
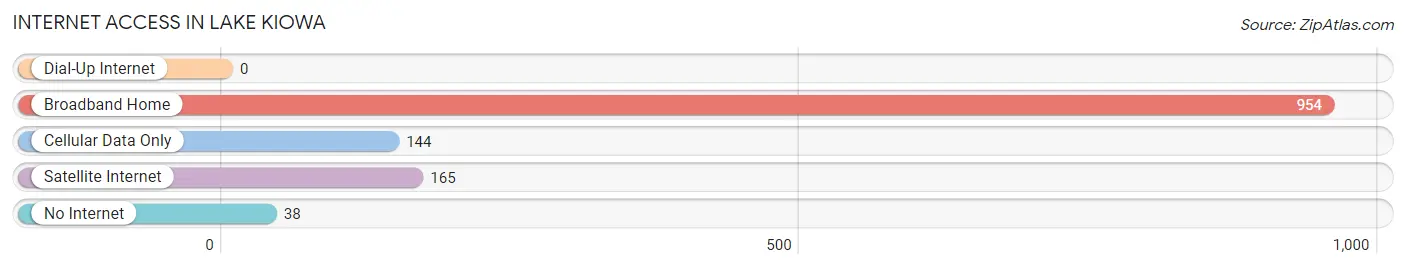
| Internet Type | # Households | % Households |
| Dial-Up Internet | 0 | 0.0% |
| Broadband Home | 954 | 79.6% |
| Cellular Data Only | 144 | 12.0% |
| Satellite Internet | 165 | 13.8% |
| No Internet | 38 | 3.2% |
| Total | 1,198 | 100.0% |
Lake Kiowa Summary
History
Lake Kiowa is a private, gated community located in Cooke County, Texas. It is situated on the shores of Lake Kiowa, a man-made lake that was created in the early 1970s. The lake was created by damming the waters of the Elm Fork of the Trinity River. The lake is approximately 1,400 acres in size and is surrounded by a variety of recreational activities, including fishing, boating, swimming, and camping.
The area around Lake Kiowa has a long and varied history. The area was originally inhabited by the Caddo Indians, who lived in the area for centuries before the arrival of European settlers. The first Europeans to settle in the area were Spanish missionaries, who established a mission in the area in the late 1700s. The area was later settled by Anglo-American settlers in the mid-1800s.
The area around Lake Kiowa was largely rural until the early 1970s, when the lake was created. The lake was created as part of a larger development project, which included the construction of a golf course, a marina, and a variety of other recreational facilities. The development of the lake and the surrounding area led to a population boom in the area, and the population of the area has grown steadily since then.
Geography
Lake Kiowa is located in Cooke County, Texas, approximately 70 miles north of Dallas. The lake is situated on the Elm Fork of the Trinity River, and is approximately 1,400 acres in size. The lake is surrounded by a variety of recreational activities, including fishing, boating, swimming, and camping. The lake is also surrounded by a variety of residential developments, including the Lake Kiowa Country Club and the Lake Kiowa Golf Course.
The area around Lake Kiowa is largely rural, with the majority of the land being used for agricultural purposes. The area is also home to a variety of wildlife, including deer, turkey, and a variety of waterfowl.
Economy
The economy of Lake Kiowa is largely driven by tourism and recreation. The lake is a popular destination for fishing, boating, swimming, and camping, and the surrounding area is home to a variety of recreational activities, including golfing, hiking, and horseback riding. The area is also home to a variety of restaurants, bars, and other businesses that cater to tourists and visitors.
The area around Lake Kiowa is also home to a variety of agricultural businesses, including cattle ranches, farms, and nurseries. The area is also home to a variety of manufacturing businesses, including a furniture factory and a plastics factory.
Demographics
As of the 2010 census, the population of Lake Kiowa was 1,845. The population is largely white (93.3%), with a small percentage of African Americans (2.2%) and Hispanics (2.2%). The median household income in the area is $50,000, and the median age is 44. The area is largely rural, with the majority of the population living in single-family homes. The area is also home to a variety of recreational activities, including fishing, boating, swimming, and camping.
Common Questions
What is Per Capita Income in Lake Kiowa?
Per Capita income in Lake Kiowa is $70,138.
What is the Median Family Income in Lake Kiowa?
Median Family Income in Lake Kiowa is $118,620.
What is the Median Household income in Lake Kiowa?
Median Household Income in Lake Kiowa is $107,414.
What is Income or Wage Gap in Lake Kiowa?
Income or Wage Gap in Lake Kiowa is 39.9%.
Women in Lake Kiowa earn 60.1 cents for every dollar earned by a man.
What is Inequality or Gini Index in Lake Kiowa?
Inequality or Gini Index in Lake Kiowa is 0.49.
What is the Total Population of Lake Kiowa?
Total Population of Lake Kiowa is 2,728.
What is the Total Male Population of Lake Kiowa?
Total Male Population of Lake Kiowa is 1,176.
What is the Total Female Population of Lake Kiowa?
Total Female Population of Lake Kiowa is 1,552.
What is the Ratio of Males per 100 Females in Lake Kiowa?
There are 75.77 Males per 100 Females in Lake Kiowa.
What is the Ratio of Females per 100 Males in Lake Kiowa?
There are 131.97 Females per 100 Males in Lake Kiowa.
What is the Median Population Age in Lake Kiowa?
Median Population Age in Lake Kiowa is 58.7 Years.
What is the Average Family Size in Lake Kiowa
Average Family Size in Lake Kiowa is 2.6 People.
What is the Average Household Size in Lake Kiowa
Average Household Size in Lake Kiowa is 2.3 People.
How Large is the Labor Force in Lake Kiowa?
There are 1,251 People in the Labor Forcein in Lake Kiowa.
What is the Percentage of People in the Labor Force in Lake Kiowa?
53.9% of People are in the Labor Force in Lake Kiowa.