Reno city Parker and Tarrant Counties, TX Map & Demographics
Reno city Parker and Tarrant Counties Overview
$32,790
PER CAPITA INCOME
$81,549
AVG FAMILY INCOME
$76,027
AVG HOUSEHOLD INCOME
43.8%
WAGE / INCOME GAP [ % ]
56.2¢/ $1
WAGE / INCOME GAP [ $ ]
0.40
INEQUALITY / GINI INDEX
3,034
TOTAL POPULATION
1,456
MALE POPULATION
1,578
FEMALE POPULATION
92.27
MALES / 100 FEMALES
108.38
FEMALES / 100 MALES
38.0
MEDIAN AGE
3.2
AVG FAMILY SIZE
2.8
AVG HOUSEHOLD SIZE
1,439
LABOR FORCE [ PEOPLE ]
58.2%
PERCENT IN LABOR FORCE
5.3%
UNEMPLOYMENT RATE
Income in Reno city Parker and Tarrant Counties
Income Overview in Reno city Parker and Tarrant Counties
Per Capita Income in Reno city Parker and Tarrant Counties is $32,790, while median incomes of families and households are $81,549 and $76,027 respectively.
| Characteristic | Number | Measure |
| Per Capita Income | 3,034 | $32,790 |
| Median Family Income | 827 | $81,549 |
| Mean Family Income | 827 | $93,396 |
| Median Household Income | 1,103 | $76,027 |
| Mean Household Income | 1,103 | $85,549 |
| Income Deficit | 827 | $0 |
| Wage / Income Gap (%) | 3,034 | 43.84% |
| Wage / Income Gap ($) | 3,034 | 56.16¢ per $1 |
| Gini / Inequality Index | 3,034 | 0.40 |
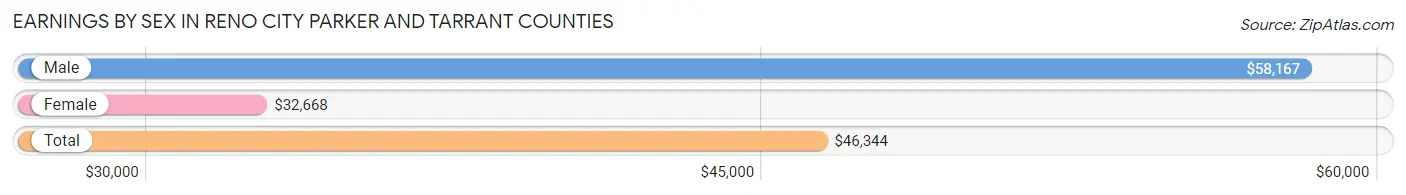
Earnings by Sex in Reno city Parker and Tarrant Counties
Average Earnings in Reno city Parker and Tarrant Counties are $46,344, $58,167 for men and $32,668 for women, a difference of 43.8%.
| Sex | Number | Average Earnings |
| Male | 820 (55.9%) | $58,167 |
| Female | 647 (44.1%) | $32,668 |
| Total | 1,467 (100.0%) | $46,344 |
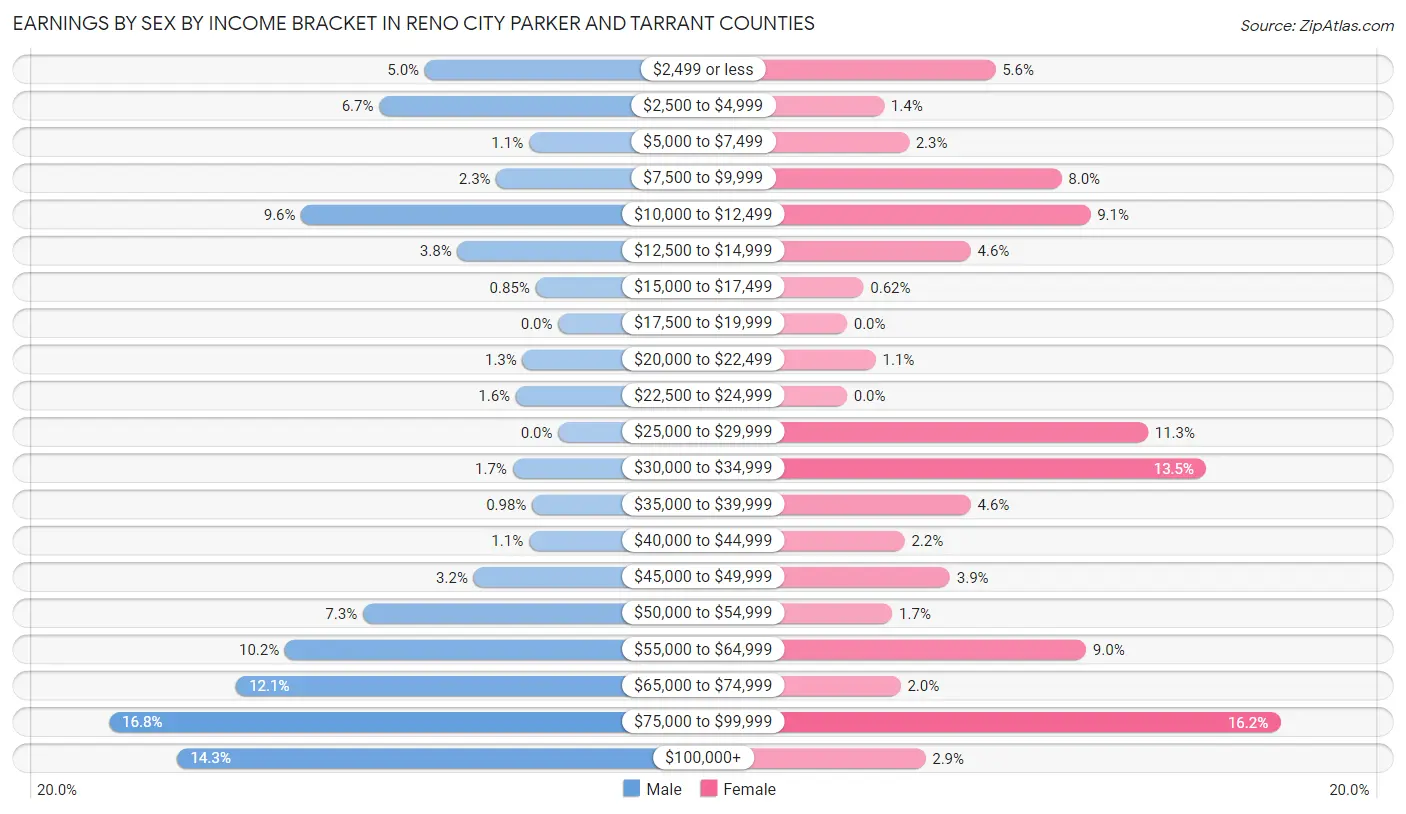
Earnings by Sex by Income Bracket in Reno city Parker and Tarrant Counties
The most common earnings brackets in Reno city Parker and Tarrant Counties are $75,000 to $99,999 for men (138 | 16.8%) and $75,000 to $99,999 for women (105 | 16.2%).
| Income | Male | Female |
| $2,499 or less | 41 (5.0%) | 36 (5.6%) |
| $2,500 to $4,999 | 55 (6.7%) | 9 (1.4%) |
| $5,000 to $7,499 | 9 (1.1%) | 15 (2.3%) |
| $7,500 to $9,999 | 19 (2.3%) | 52 (8.0%) |
| $10,000 to $12,499 | 79 (9.6%) | 59 (9.1%) |
| $12,500 to $14,999 | 31 (3.8%) | 30 (4.6%) |
| $15,000 to $17,499 | 7 (0.9%) | 4 (0.6%) |
| $17,500 to $19,999 | 0 (0.0%) | 0 (0.0%) |
| $20,000 to $22,499 | 11 (1.3%) | 7 (1.1%) |
| $22,500 to $24,999 | 13 (1.6%) | 0 (0.0%) |
| $25,000 to $29,999 | 0 (0.0%) | 73 (11.3%) |
| $30,000 to $34,999 | 14 (1.7%) | 87 (13.5%) |
| $35,000 to $39,999 | 8 (1.0%) | 30 (4.6%) |
| $40,000 to $44,999 | 9 (1.1%) | 14 (2.2%) |
| $45,000 to $49,999 | 26 (3.2%) | 25 (3.9%) |
| $50,000 to $54,999 | 60 (7.3%) | 11 (1.7%) |
| $55,000 to $64,999 | 84 (10.2%) | 58 (9.0%) |
| $65,000 to $74,999 | 99 (12.1%) | 13 (2.0%) |
| $75,000 to $99,999 | 138 (16.8%) | 105 (16.2%) |
| $100,000+ | 117 (14.3%) | 19 (2.9%) |
| Total | 820 (100.0%) | 647 (100.0%) |
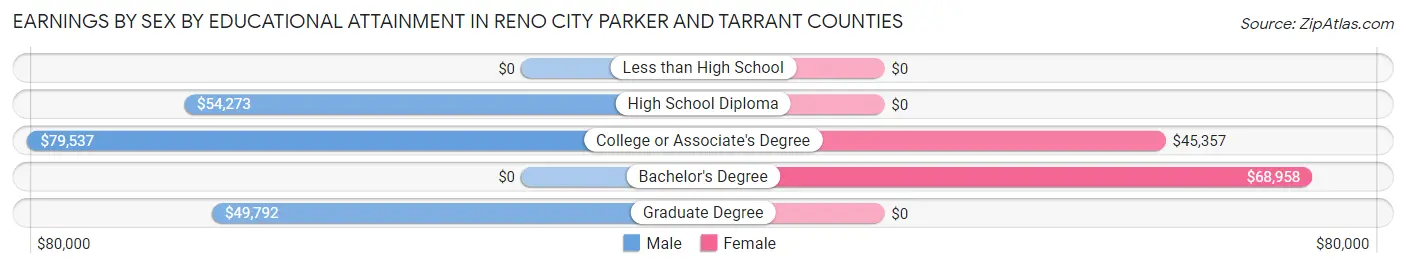
Earnings by Sex by Educational Attainment in Reno city Parker and Tarrant Counties
Average earnings in Reno city Parker and Tarrant Counties are $65,950 for men and $34,303 for women, a difference of 48.0%. Men with an educational attainment of college or associate's degree enjoy the highest average annual earnings of $79,537, while those with graduate degree education earn the least with $49,792. Women with an educational attainment of bachelor's degree earn the most with the average annual earnings of $68,958, while those with college or associate's degree education have the smallest earnings of $45,357.
| Educational Attainment | Male Income | Female Income |
| Less than High School | - | - |
| High School Diploma | $54,273 | $0 |
| College or Associate's Degree | $79,537 | $45,357 |
| Bachelor's Degree | - | - |
| Graduate Degree | $49,792 | $0 |
| Total | $65,950 | $34,303 |
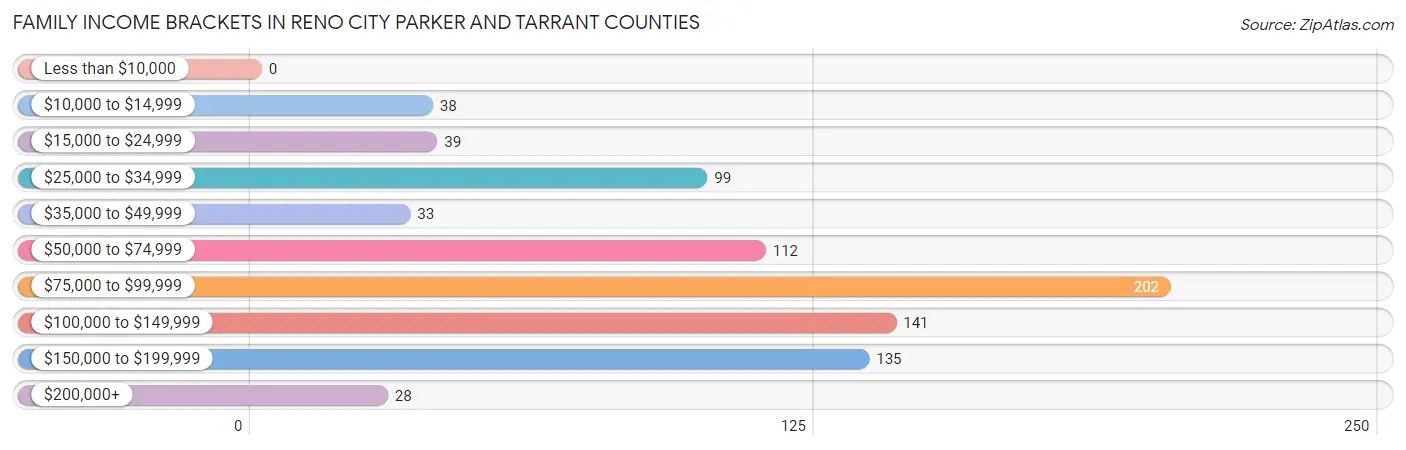
Family Income in Reno city Parker and Tarrant Counties
Family Income Brackets in Reno city Parker and Tarrant Counties
According to the Reno city Parker and Tarrant Counties family income data, there are 202 families falling into the $75,000 to $99,999 income range, which is the most common income bracket and makes up 24.4% of all families.
| Income Bracket | # Families | % Families |
| Less than $10,000 | 0 | 0.0% |
| $10,000 to $14,999 | 38 | 4.6% |
| $15,000 to $24,999 | 39 | 4.7% |
| $25,000 to $34,999 | 99 | 12.0% |
| $35,000 to $49,999 | 33 | 4.0% |
| $50,000 to $74,999 | 112 | 13.5% |
| $75,000 to $99,999 | 202 | 24.4% |
| $100,000 to $149,999 | 141 | 17.0% |
| $150,000 to $199,999 | 135 | 16.3% |
| $200,000+ | 28 | 3.4% |
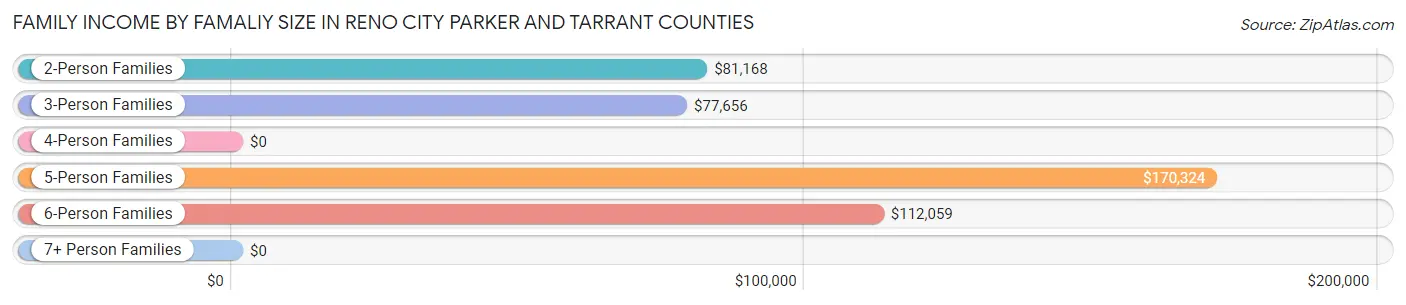
Family Income by Famaliy Size in Reno city Parker and Tarrant Counties
5-person families (63 | 7.6%) account for the highest median family income in Reno city Parker and Tarrant Counties with $170,324 per family, while 2-person families (473 | 57.2%) have the highest median income of $40,584 per family member.
| Income Bracket | # Families | Median Income |
| 2-Person Families | 473 (57.2%) | $81,168 |
| 3-Person Families | 176 (21.3%) | $77,656 |
| 4-Person Families | 43 (5.2%) | $0 |
| 5-Person Families | 63 (7.6%) | $170,324 |
| 6-Person Families | 64 (7.7%) | $112,059 |
| 7+ Person Families | 8 (1.0%) | $0 |
| Total | 827 (100.0%) | $81,549 |
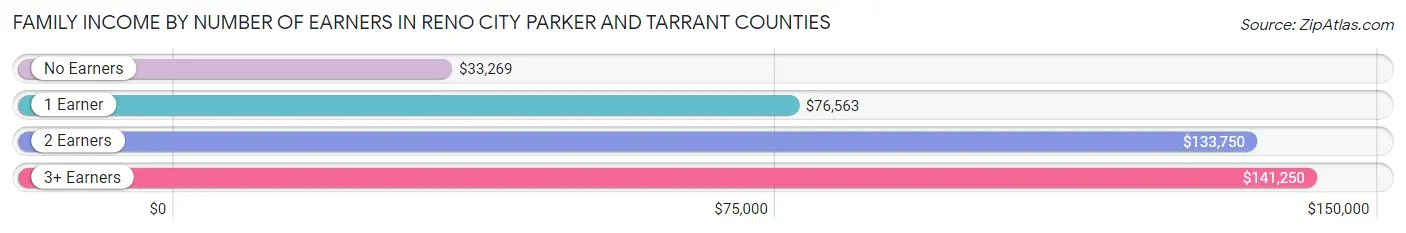
Family Income by Number of Earners in Reno city Parker and Tarrant Counties
The median family income in Reno city Parker and Tarrant Counties is $81,549, with families comprising 3+ earners (58) having the highest median family income of $141,250, while families with no earners (76) have the lowest median family income of $33,269, accounting for 7.0% and 9.2% of families, respectively.
| Number of Earners | # Families | Median Income |
| No Earners | 76 (9.2%) | $33,269 |
| 1 Earner | 403 (48.7%) | $76,563 |
| 2 Earners | 290 (35.1%) | $133,750 |
| 3+ Earners | 58 (7.0%) | $141,250 |
| Total | 827 (100.0%) | $81,549 |
Household Income in Reno city Parker and Tarrant Counties
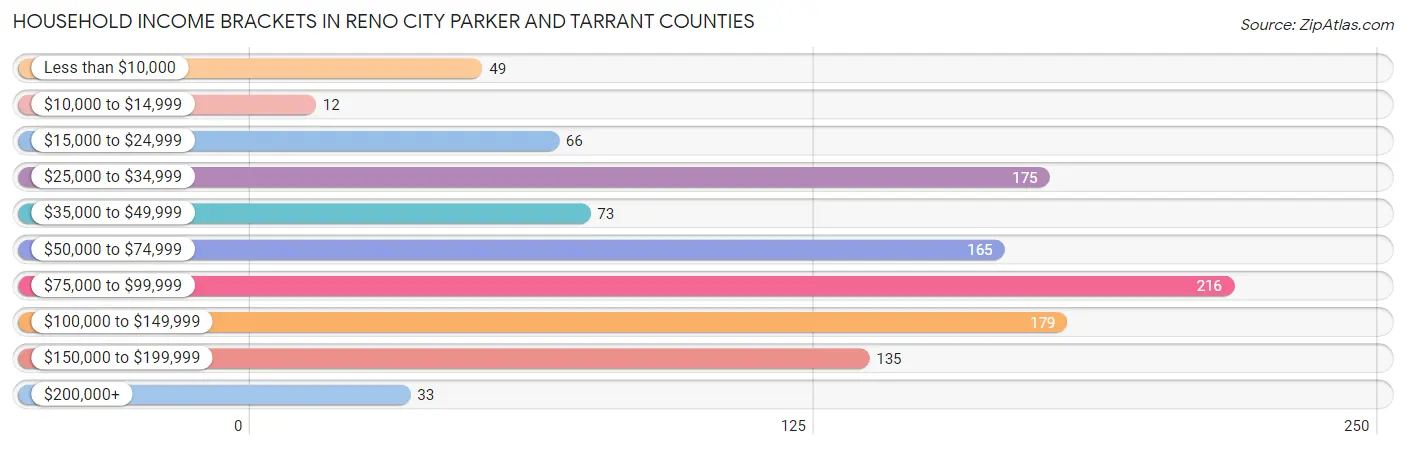
Household Income Brackets in Reno city Parker and Tarrant Counties
With 216 households falling in the category, the $75,000 to $99,999 income range is the most frequent in Reno city Parker and Tarrant Counties, accounting for 19.6% of all households. In contrast, only 12 households (1.1%) fall into the $10,000 to $14,999 income bracket, making it the least populous group.
| Income Bracket | # Households | % Households |
| Less than $10,000 | 49 | 4.4% |
| $10,000 to $14,999 | 12 | 1.1% |
| $15,000 to $24,999 | 66 | 6.0% |
| $25,000 to $34,999 | 175 | 15.9% |
| $35,000 to $49,999 | 73 | 6.6% |
| $50,000 to $74,999 | 165 | 15.0% |
| $75,000 to $99,999 | 216 | 19.6% |
| $100,000 to $149,999 | 179 | 16.2% |
| $150,000 to $199,999 | 135 | 12.2% |
| $200,000+ | 33 | 3.0% |
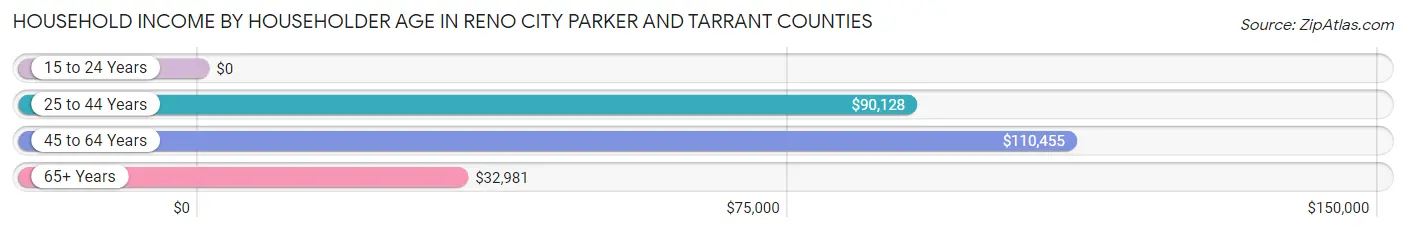
Household Income by Householder Age in Reno city Parker and Tarrant Counties
The median household income in Reno city Parker and Tarrant Counties is $76,027, with the highest median household income of $110,455 found in the 45 to 64 years age bracket for the primary householder. A total of 362 households (32.8%) fall into this category. Meanwhile, the 15 to 24 years age bracket for the primary householder has the lowest median household income of $0, with 42 households (3.8%) in this group.
| Income Bracket | # Households | Median Income |
| 15 to 24 Years | 42 (3.8%) | $0 |
| 25 to 44 Years | 320 (29.0%) | $90,128 |
| 45 to 64 Years | 362 (32.8%) | $110,455 |
| 65+ Years | 379 (34.4%) | $32,981 |
| Total | 1,103 (100.0%) | $76,027 |
Poverty in Reno city Parker and Tarrant Counties
Income Below Poverty by Sex and Age in Reno city Parker and Tarrant Counties
With 7.2% poverty level for males and 13.6% for females among the residents of Reno city Parker and Tarrant Counties, 25 to 34 year old males and 15 year old females are the most vulnerable to poverty, with 42 males (45.7%) and 30 females (75.0%) in their respective age groups living below the poverty level.
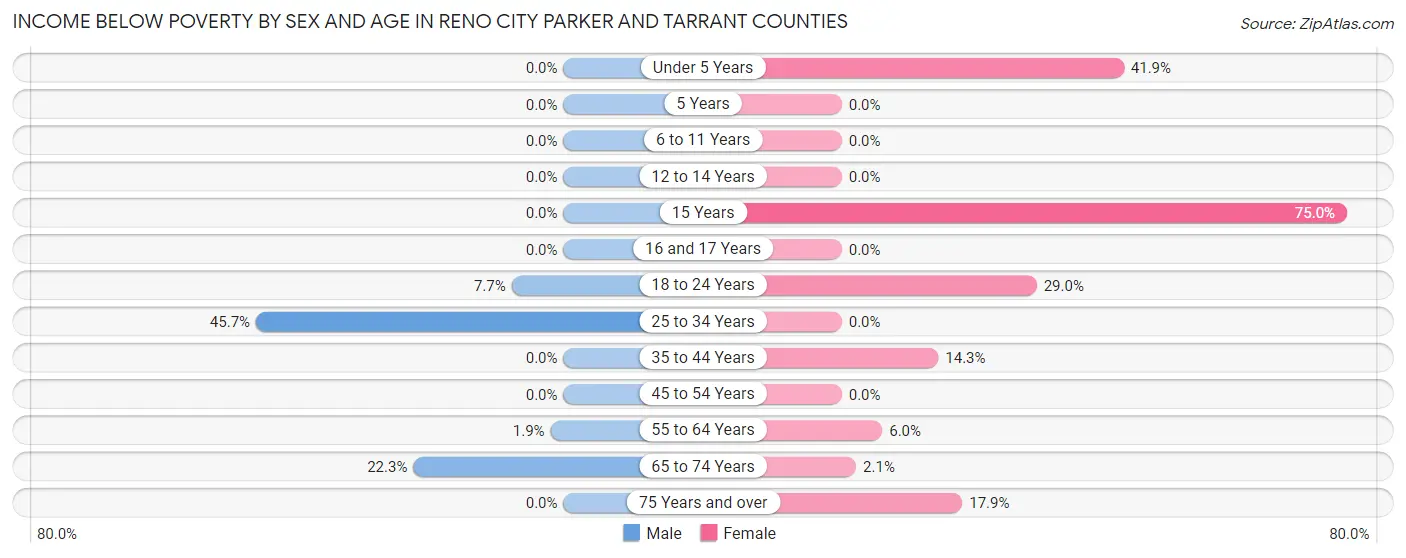
| Age Bracket | Male | Female |
| Under 5 Years | 0 (0.0%) | 80 (41.9%) |
| 5 Years | 0 (0.0%) | 0 (0.0%) |
| 6 to 11 Years | 0 (0.0%) | 0 (0.0%) |
| 12 to 14 Years | 0 (0.0%) | 0 (0.0%) |
| 15 Years | 0 (0.0%) | 30 (75.0%) |
| 16 and 17 Years | 0 (0.0%) | 0 (0.0%) |
| 18 to 24 Years | 19 (7.7%) | 33 (28.9%) |
| 25 to 34 Years | 42 (45.7%) | 0 (0.0%) |
| 35 to 44 Years | 0 (0.0%) | 39 (14.3%) |
| 45 to 54 Years | 0 (0.0%) | 0 (0.0%) |
| 55 to 64 Years | 5 (1.9%) | 11 (6.0%) |
| 65 to 74 Years | 39 (22.3%) | 4 (2.1%) |
| 75 Years and over | 0 (0.0%) | 17 (17.9%) |
| Total | 105 (7.2%) | 214 (13.6%) |
Income Above Poverty by Sex and Age in Reno city Parker and Tarrant Counties
According to the poverty statistics in Reno city Parker and Tarrant Counties, males aged under 5 years and females aged 6 to 11 years are the age groups that are most secure financially, with 100.0% of males and 100.0% of females in these age groups living above the poverty line.
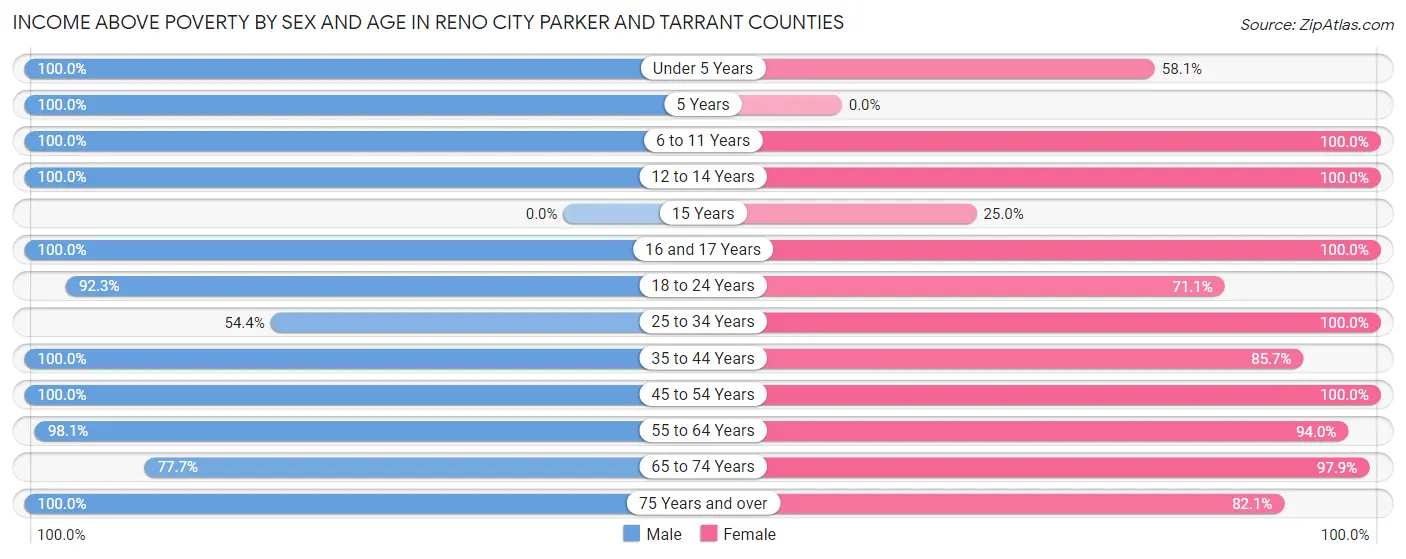
| Age Bracket | Male | Female |
| Under 5 Years | 56 (100.0%) | 111 (58.1%) |
| 5 Years | 40 (100.0%) | 0 (0.0%) |
| 6 to 11 Years | 39 (100.0%) | 101 (100.0%) |
| 12 to 14 Years | 72 (100.0%) | 17 (100.0%) |
| 15 Years | 0 (0.0%) | 10 (25.0%) |
| 16 and 17 Years | 50 (100.0%) | 111 (100.0%) |
| 18 to 24 Years | 228 (92.3%) | 81 (71.1%) |
| 25 to 34 Years | 50 (54.3%) | 157 (100.0%) |
| 35 to 44 Years | 141 (100.0%) | 233 (85.7%) |
| 45 to 54 Years | 197 (100.0%) | 109 (100.0%) |
| 55 to 64 Years | 256 (98.1%) | 172 (94.0%) |
| 65 to 74 Years | 136 (77.7%) | 184 (97.9%) |
| 75 Years and over | 81 (100.0%) | 78 (82.1%) |
| Total | 1,346 (92.8%) | 1,364 (86.4%) |
Income Below Poverty Among Married-Couple Families in Reno city Parker and Tarrant Counties
The poverty statistics for married-couple families in Reno city Parker and Tarrant Counties show that 3.3% or 18 of the total 545 families live below the poverty line. Families with 3 or 4 children have the highest poverty rate of 21.4%, comprising of 18 families. On the other hand, families with no children have the lowest poverty rate of 0.0%, which includes 0 families.
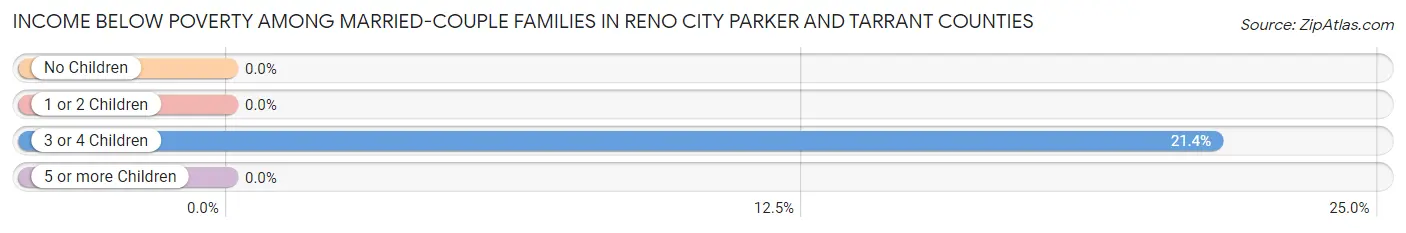
| Children | Above Poverty | Below Poverty |
| No Children | 319 (100.0%) | 0 (0.0%) |
| 1 or 2 Children | 134 (100.0%) | 0 (0.0%) |
| 3 or 4 Children | 66 (78.6%) | 18 (21.4%) |
| 5 or more Children | 8 (100.0%) | 0 (0.0%) |
| Total | 527 (96.7%) | 18 (3.3%) |
Income Below Poverty Among Single-Parent Households in Reno city Parker and Tarrant Counties
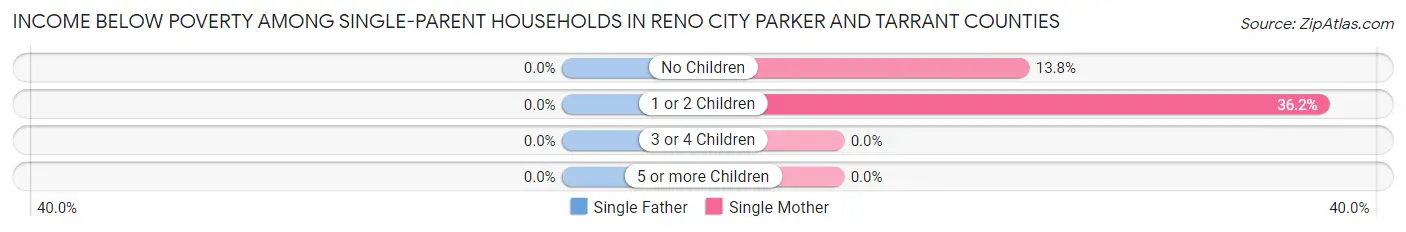
| Children | Single Father | Single Mother |
| No Children | 0 (0.0%) | 8 (13.8%) |
| 1 or 2 Children | 0 (0.0%) | 38 (36.2%) |
| 3 or 4 Children | 0 (0.0%) | 0 (0.0%) |
| 5 or more Children | 0 (0.0%) | 0 (0.0%) |
| Total | 0 (0.0%) | 46 (28.2%) |
Income Below Poverty Among Married-Couple vs Single-Parent Households in Reno city Parker and Tarrant Counties
The poverty data for Reno city Parker and Tarrant Counties shows that 18 of the married-couple family households (3.3%) and 46 of the single-parent households (16.3%) are living below the poverty level. Within the married-couple family households, those with 3 or 4 children have the highest poverty rate, with 18 households (21.4%) falling below the poverty line. Among the single-parent households, those with 1 or 2 children have the highest poverty rate, with 38 household (24.2%) living below poverty.
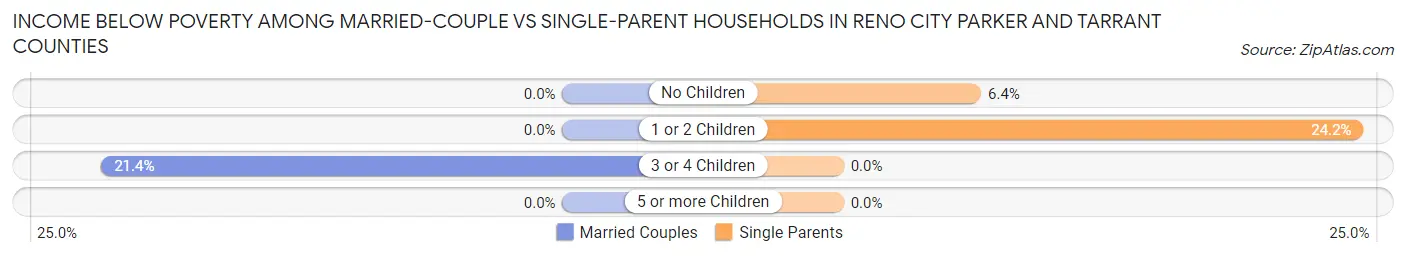
| Children | Married-Couple Families | Single-Parent Households |
| No Children | 0 (0.0%) | 8 (6.4%) |
| 1 or 2 Children | 0 (0.0%) | 38 (24.2%) |
| 3 or 4 Children | 18 (21.4%) | 0 (0.0%) |
| 5 or more Children | 0 (0.0%) | 0 (0.0%) |
| Total | 18 (3.3%) | 46 (16.3%) |
Race in Reno city Parker and Tarrant Counties
The most populous races in Reno city Parker and Tarrant Counties are White / Caucasian (2,676 | 88.2%), Hispanic or Latino (378 | 12.5%), and Two or more Races (264 | 8.7%).
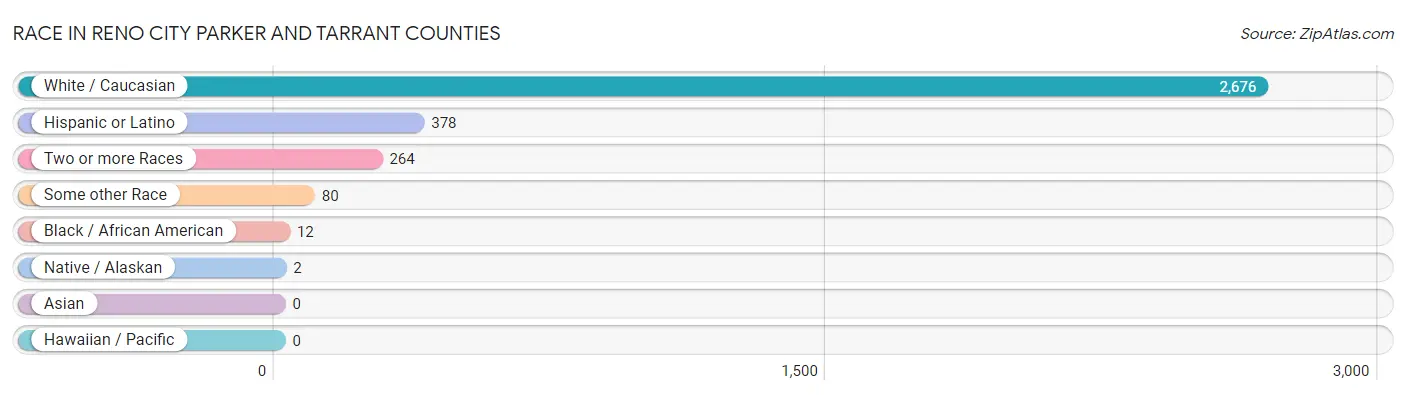
| Race | # Population | % Population |
| Asian | 0 | 0.0% |
| Black / African American | 12 | 0.4% |
| Hawaiian / Pacific | 0 | 0.0% |
| Hispanic or Latino | 378 | 12.5% |
| Native / Alaskan | 2 | 0.1% |
| White / Caucasian | 2,676 | 88.2% |
| Two or more Races | 264 | 8.7% |
| Some other Race | 80 | 2.6% |
| Total | 3,034 | 100.0% |
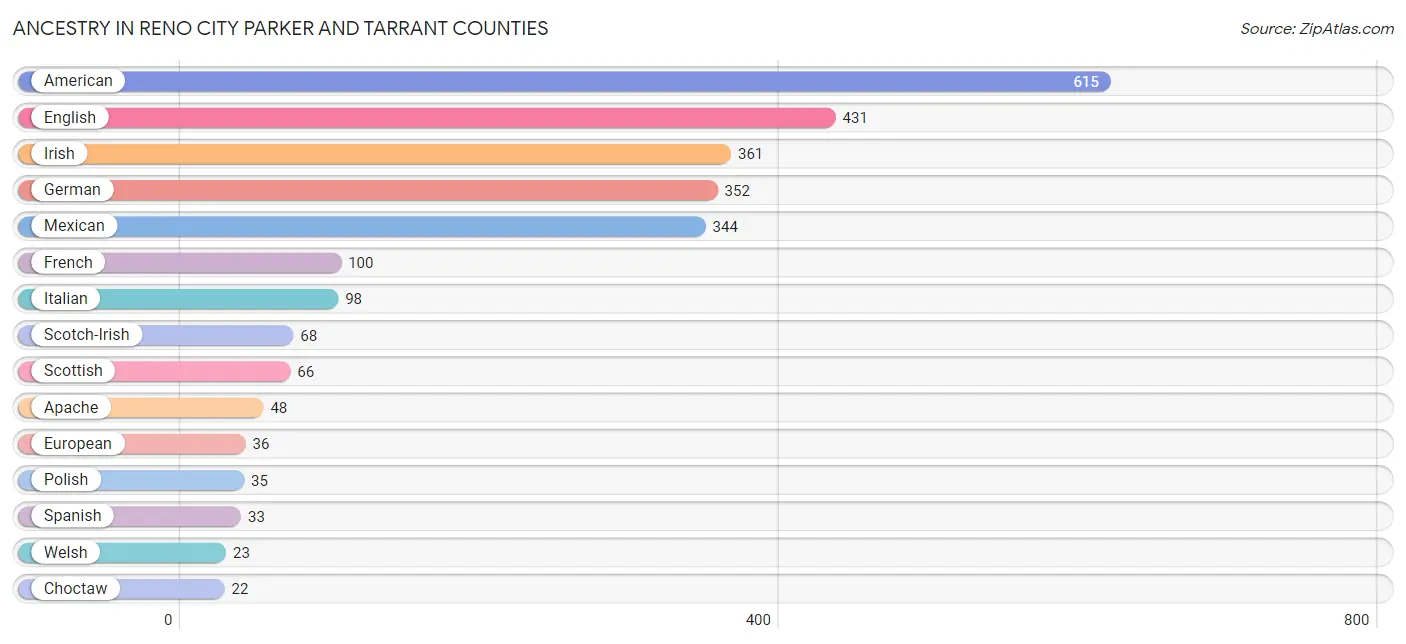
Ancestry in Reno city Parker and Tarrant Counties
The most populous ancestries reported in Reno city Parker and Tarrant Counties are American (615 | 20.3%), English (431 | 14.2%), Irish (361 | 11.9%), German (352 | 11.6%), and Mexican (344 | 11.3%), together accounting for 69.3% of all Reno city Parker and Tarrant Counties residents.
| Ancestry | # Population | % Population |
| African | 4 | 0.1% |
| American | 615 | 20.3% |
| Apache | 48 | 1.6% |
| Australian | 6 | 0.2% |
| Cherokee | 11 | 0.4% |
| Choctaw | 22 | 0.7% |
| Colombian | 1 | 0.0% |
| Comanche | 2 | 0.1% |
| Croatian | 12 | 0.4% |
| Dutch | 18 | 0.6% |
| English | 431 | 14.2% |
| European | 36 | 1.2% |
| French | 100 | 3.3% |
| German | 352 | 11.6% |
| Greek | 7 | 0.2% |
| Irish | 361 | 11.9% |
| Italian | 98 | 3.2% |
| Mexican | 344 | 11.3% |
| Northern European | 13 | 0.4% |
| Polish | 35 | 1.1% |
| Portuguese | 15 | 0.5% |
| Scotch-Irish | 68 | 2.2% |
| Scottish | 66 | 2.2% |
| Slavic | 12 | 0.4% |
| South American | 1 | 0.0% |
| Spanish | 33 | 1.1% |
| Subsaharan African | 4 | 0.1% |
| Swedish | 11 | 0.4% |
| Ukrainian | 4 | 0.1% |
| Welsh | 23 | 0.8% | View All 30 Rows |
Immigrants in Reno city Parker and Tarrant Counties
The most numerous immigrant groups reported in Reno city Parker and Tarrant Counties came from Latin America (103 | 3.4%), Central America (102 | 3.4%), Mexico (102 | 3.4%), Colombia (1 | 0.0%), and South America (1 | 0.0%), together accounting for 10.2% of all Reno city Parker and Tarrant Counties residents.
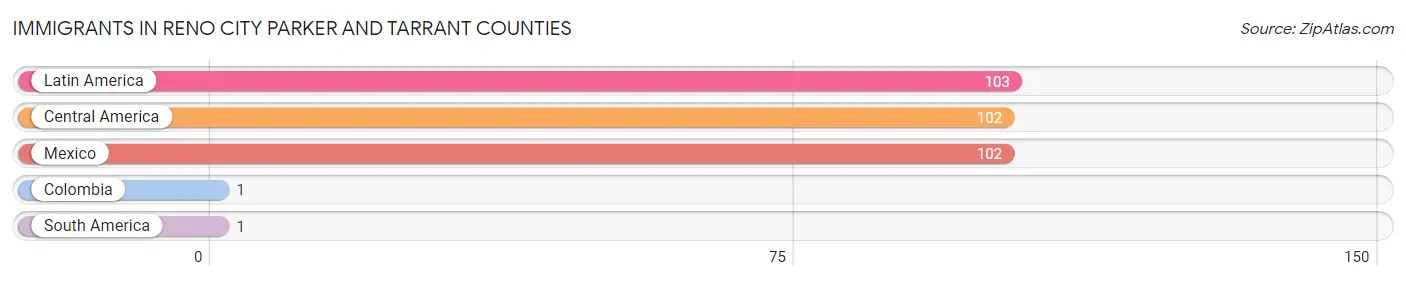
| Immigration Origin | # Population | % Population |
| Central America | 102 | 3.4% |
| Colombia | 1 | 0.0% |
| Latin America | 103 | 3.4% |
| Mexico | 102 | 3.4% |
| South America | 1 | 0.0% | View All 5 Rows |
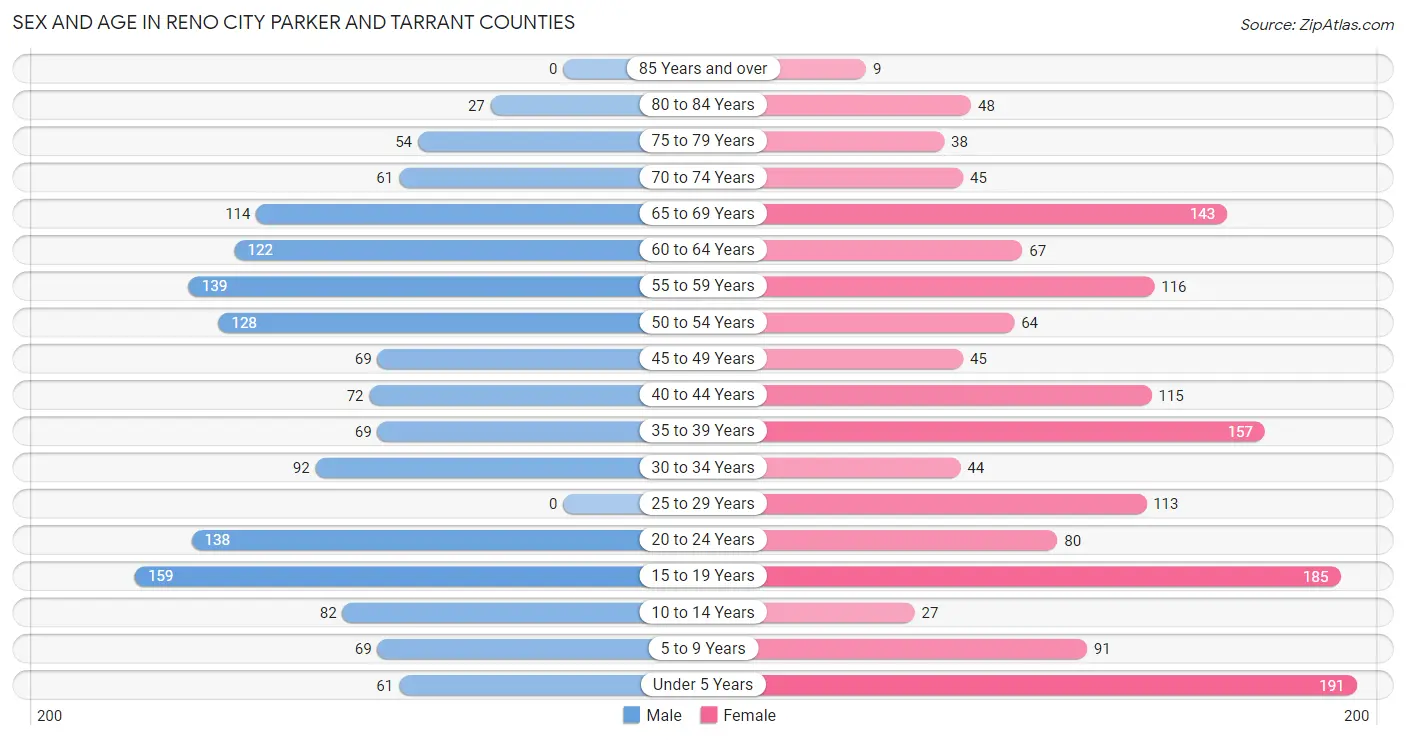
Sex and Age in Reno city Parker and Tarrant Counties
Sex and Age in Reno city Parker and Tarrant Counties
The most populous age groups in Reno city Parker and Tarrant Counties are 15 to 19 Years (159 | 10.9%) for men and Under 5 Years (191 | 12.1%) for women.
| Age Bracket | Male | Female |
| Under 5 Years | 61 (4.2%) | 191 (12.1%) |
| 5 to 9 Years | 69 (4.7%) | 91 (5.8%) |
| 10 to 14 Years | 82 (5.6%) | 27 (1.7%) |
| 15 to 19 Years | 159 (10.9%) | 185 (11.7%) |
| 20 to 24 Years | 138 (9.5%) | 80 (5.1%) |
| 25 to 29 Years | 0 (0.0%) | 113 (7.2%) |
| 30 to 34 Years | 92 (6.3%) | 44 (2.8%) |
| 35 to 39 Years | 69 (4.7%) | 157 (10.0%) |
| 40 to 44 Years | 72 (5.0%) | 115 (7.3%) |
| 45 to 49 Years | 69 (4.7%) | 45 (2.9%) |
| 50 to 54 Years | 128 (8.8%) | 64 (4.1%) |
| 55 to 59 Years | 139 (9.6%) | 116 (7.3%) |
| 60 to 64 Years | 122 (8.4%) | 67 (4.3%) |
| 65 to 69 Years | 114 (7.8%) | 143 (9.1%) |
| 70 to 74 Years | 61 (4.2%) | 45 (2.9%) |
| 75 to 79 Years | 54 (3.7%) | 38 (2.4%) |
| 80 to 84 Years | 27 (1.8%) | 48 (3.0%) |
| 85 Years and over | 0 (0.0%) | 9 (0.6%) |
| Total | 1,456 (100.0%) | 1,578 (100.0%) |
Families and Households in Reno city Parker and Tarrant Counties
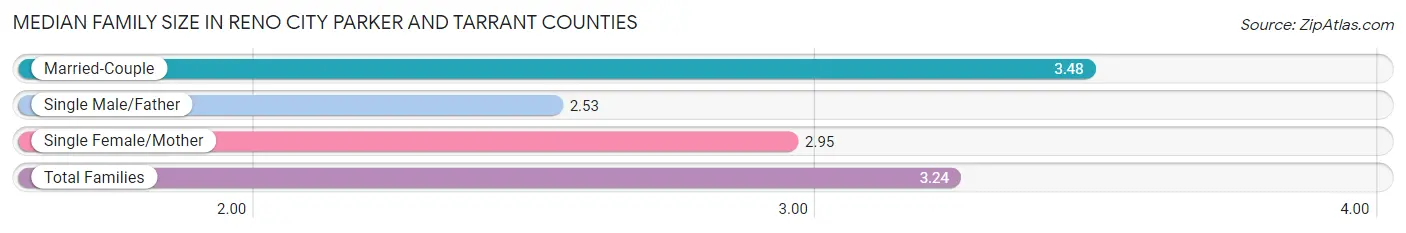
Median Family Size in Reno city Parker and Tarrant Counties
The median family size in Reno city Parker and Tarrant Counties is 3.24 persons per family, with married-couple families (545 | 65.9%) accounting for the largest median family size of 3.48 persons per family. On the other hand, single male/father families (119 | 14.4%) represent the smallest median family size with 2.53 persons per family.
| Family Type | # Families | Family Size |
| Married-Couple | 545 (65.9%) | 3.48 |
| Single Male/Father | 119 (14.4%) | 2.53 |
| Single Female/Mother | 163 (19.7%) | 2.95 |
| Total Families | 827 (100.0%) | 3.24 |
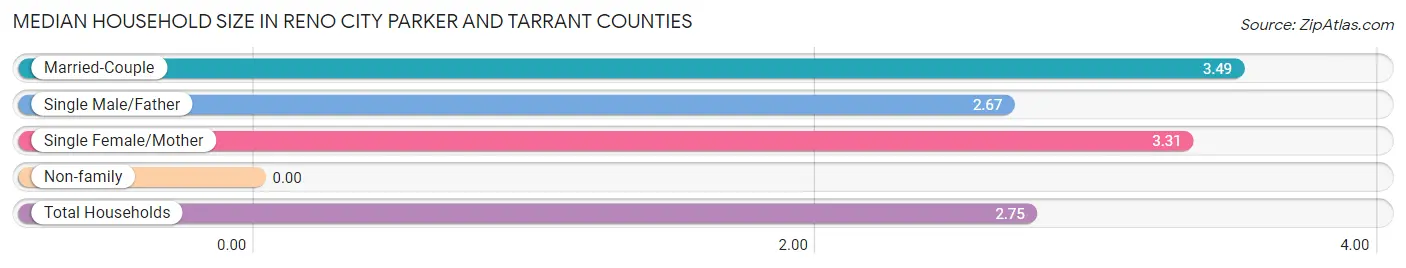
Median Household Size in Reno city Parker and Tarrant Counties
| Household Type | # Households | Household Size |
| Married-Couple | 545 (49.4%) | 3.49 |
| Single Male/Father | 119 (10.8%) | 2.67 |
| Single Female/Mother | 163 (14.8%) | 3.31 |
| Non-family | 276 (25.0%) | - |
| Total Households | 1,103 (100.0%) | 2.75 |
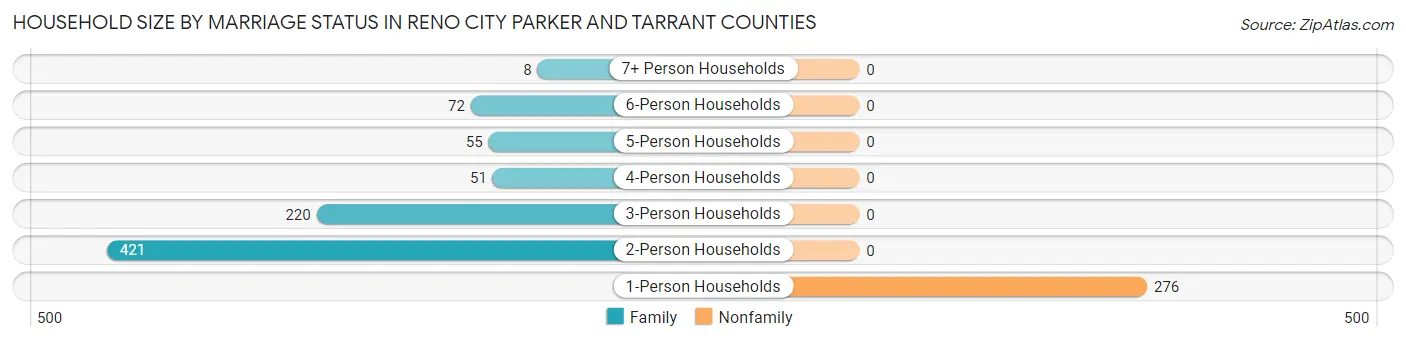
Household Size by Marriage Status in Reno city Parker and Tarrant Counties
Out of a total of 1,103 households in Reno city Parker and Tarrant Counties, 827 (75.0%) are family households, while 276 (25.0%) are nonfamily households. The most numerous type of family households are 2-person households, comprising 421, and the most common type of nonfamily households are 1-person households, comprising 276.
| Household Size | Family Households | Nonfamily Households |
| 1-Person Households | - | 276 (25.0%) |
| 2-Person Households | 421 (38.2%) | 0 (0.0%) |
| 3-Person Households | 220 (20.0%) | 0 (0.0%) |
| 4-Person Households | 51 (4.6%) | 0 (0.0%) |
| 5-Person Households | 55 (5.0%) | 0 (0.0%) |
| 6-Person Households | 72 (6.5%) | 0 (0.0%) |
| 7+ Person Households | 8 (0.7%) | 0 (0.0%) |
| Total | 827 (75.0%) | 276 (25.0%) |
Female Fertility in Reno city Parker and Tarrant Counties
Fertility by Age in Reno city Parker and Tarrant Counties
Average fertility rate in Reno city Parker and Tarrant Counties is 112.0 births per 1,000 women. Women in the age bracket of 20 to 34 years have the highest fertility rate with 190.0 births per 1,000 women. Women in the age bracket of 20 to 34 years acount for 54.2% of all women with births.
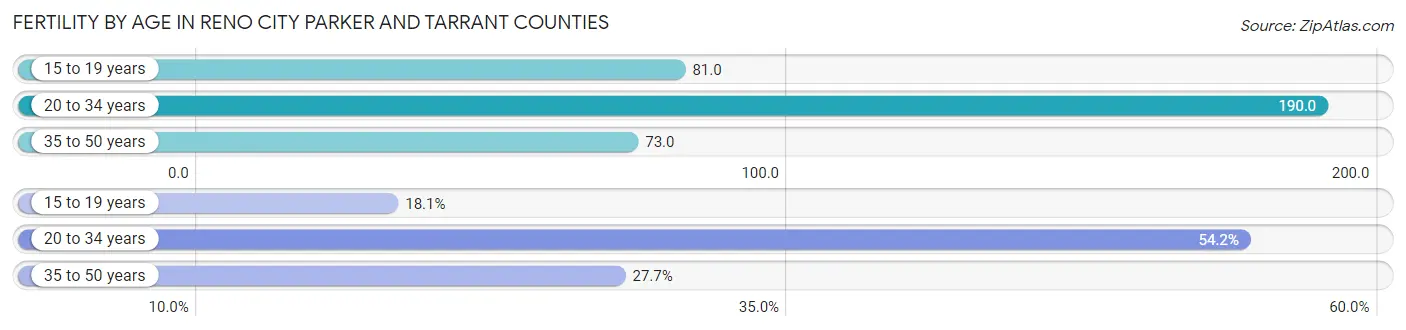
| Age Bracket | Women with Births | Births / 1,000 Women |
| 15 to 19 years | 15 (18.1%) | 81.0 |
| 20 to 34 years | 45 (54.2%) | 190.0 |
| 35 to 50 years | 23 (27.7%) | 73.0 |
| Total | 83 (100.0%) | 112.0 |
Fertility by Age by Marriage Status in Reno city Parker and Tarrant Counties
32.5% of women with births (83) in Reno city Parker and Tarrant Counties are married. The highest percentage of unmarried women with births falls into 15 to 19 years age bracket with 100.0% of them unmarried at the time of birth, while the lowest percentage of unmarried women with births belong to 20 to 34 years age bracket with 40.0% of them unmarried.
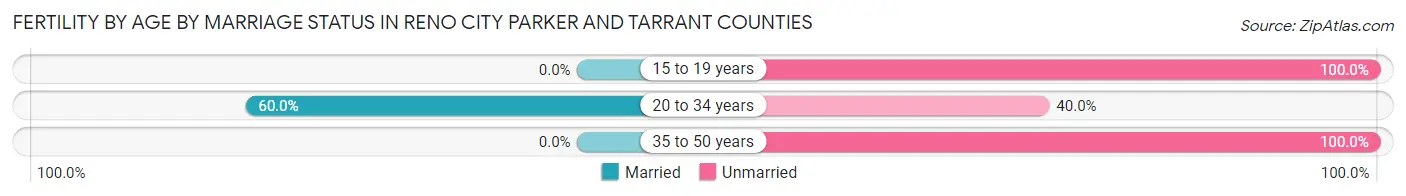
| Age Bracket | Married | Unmarried |
| 15 to 19 years | 0 (0.0%) | 15 (100.0%) |
| 20 to 34 years | 27 (60.0%) | 18 (40.0%) |
| 35 to 50 years | 0 (0.0%) | 23 (100.0%) |
| Total | 27 (32.5%) | 56 (67.5%) |
Fertility by Education in Reno city Parker and Tarrant Counties
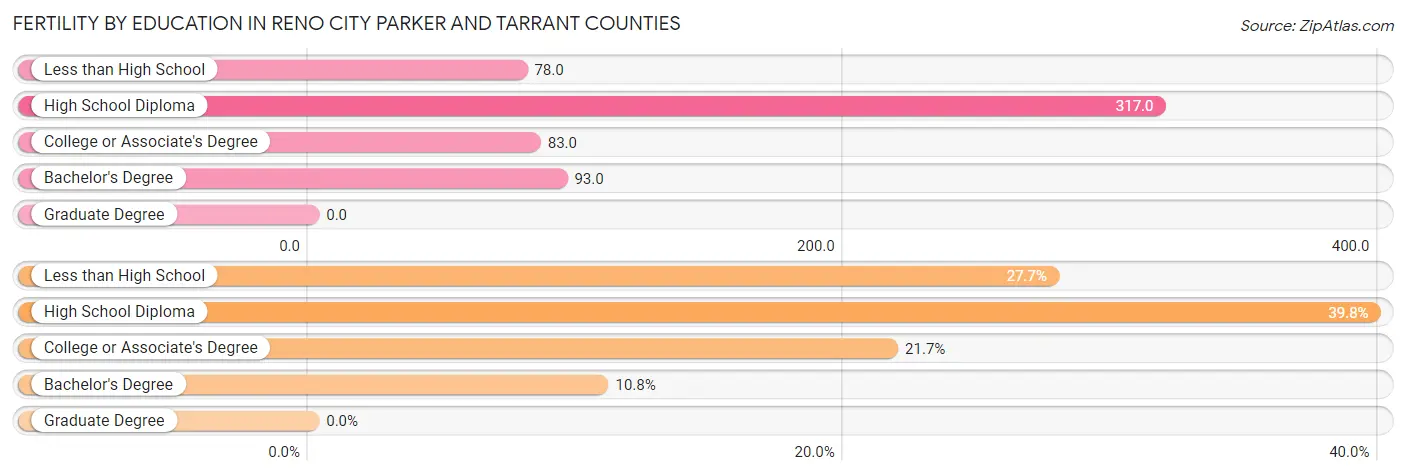
| Educational Attainment | Women with Births | Births / 1,000 Women |
| Less than High School | 23 (27.7%) | 78.0 |
| High School Diploma | 33 (39.8%) | 317.0 |
| College or Associate's Degree | 18 (21.7%) | 83.0 |
| Bachelor's Degree | 9 (10.8%) | 93.0 |
| Graduate Degree | 0 (0.0%) | 0.0 |
| Total | 83 (100.0%) | 112.0 |
Fertility by Education by Marriage Status in Reno city Parker and Tarrant Counties
67.5% of women with births in Reno city Parker and Tarrant Counties are unmarried. Women with the educational attainment of bachelor's degree are most likely to be married with 100.0% of them married at childbirth, while women with the educational attainment of less than high school are least likely to be married with 100.0% of them unmarried at childbirth.
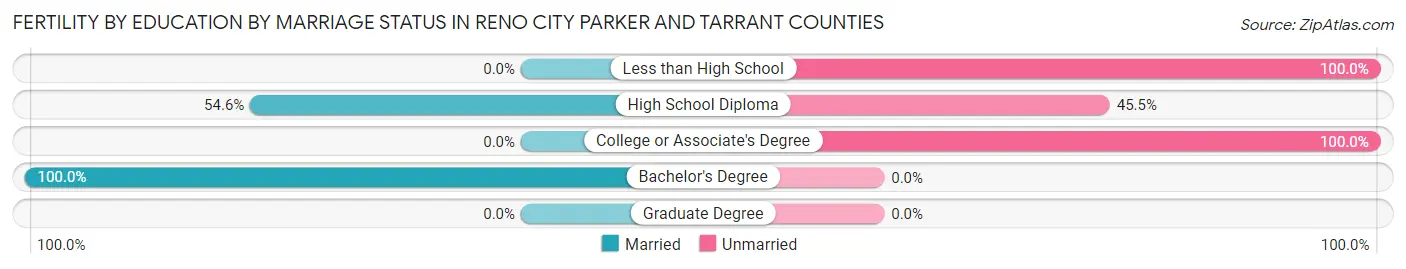
| Educational Attainment | Married | Unmarried |
| Less than High School | 0 (0.0%) | 23 (100.0%) |
| High School Diploma | 18 (54.5%) | 15 (45.5%) |
| College or Associate's Degree | 0 (0.0%) | 18 (100.0%) |
| Bachelor's Degree | 9 (100.0%) | 0 (0.0%) |
| Graduate Degree | 0 (0.0%) | 0 (0.0%) |
| Total | 27 (32.5%) | 56 (67.5%) |
Employment Characteristics in Reno city Parker and Tarrant Counties
Employment by Class of Employer in Reno city Parker and Tarrant Counties
Among the 1,337 employed individuals in Reno city Parker and Tarrant Counties, private company employees (947 | 70.8%), self-employed (not incorporated) (119 | 8.9%), and local government employees (106 | 7.9%) make up the most common classes of employment.
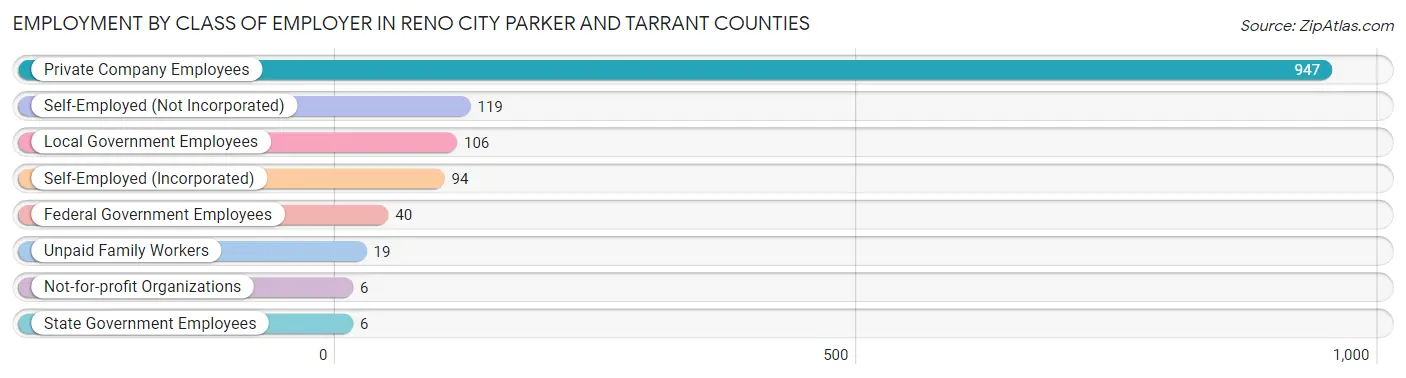
| Employer Class | # Employees | % Employees |
| Private Company Employees | 947 | 70.8% |
| Self-Employed (Incorporated) | 94 | 7.0% |
| Self-Employed (Not Incorporated) | 119 | 8.9% |
| Not-for-profit Organizations | 6 | 0.4% |
| Local Government Employees | 106 | 7.9% |
| State Government Employees | 6 | 0.4% |
| Federal Government Employees | 40 | 3.0% |
| Unpaid Family Workers | 19 | 1.4% |
| Total | 1,337 | 100.0% |
Employment Status by Age in Reno city Parker and Tarrant Counties
According to the labor force statistics for Reno city Parker and Tarrant Counties, out of the total population over 16 years of age (2,473), 58.2% or 1,439 individuals are in the labor force, with 5.3% or 76 of them unemployed. The age group with the highest labor force participation rate is 25 to 29 years, with 100.0% or 113 individuals in the labor force. Within the labor force, the 30 to 34 years age range has the highest percentage of unemployed individuals, with 13.8% or 15 of them being unemployed.
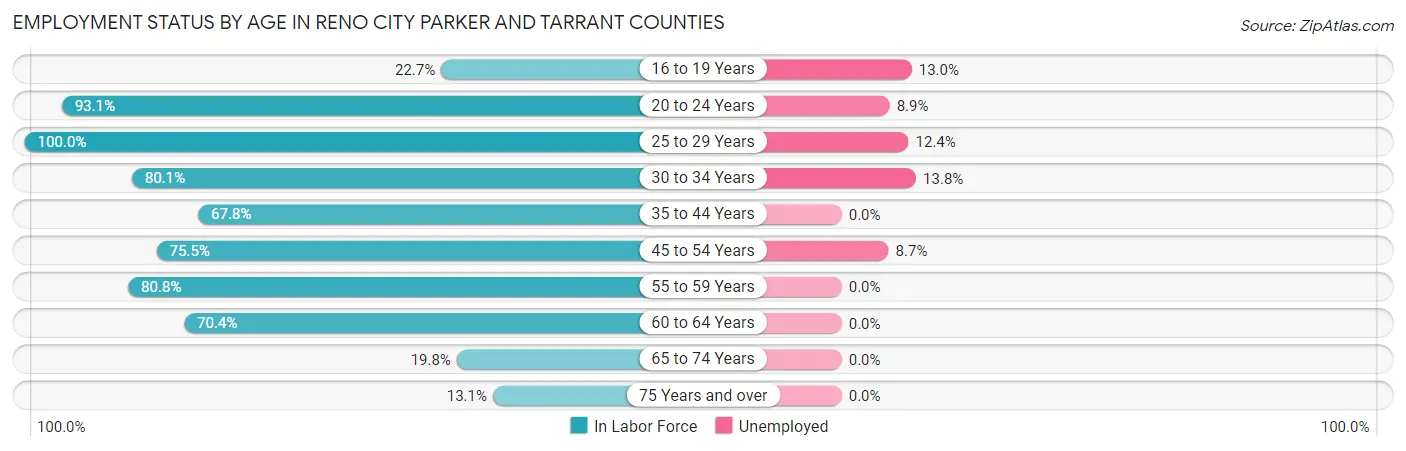
| Age Bracket | In Labor Force | Unemployed |
| 16 to 19 Years | 69 (22.7%) | 9 (13.0%) |
| 20 to 24 Years | 203 (93.1%) | 18 (8.9%) |
| 25 to 29 Years | 113 (100.0%) | 14 (12.4%) |
| 30 to 34 Years | 109 (80.1%) | 15 (13.8%) |
| 35 to 44 Years | 280 (67.8%) | 0 (0.0%) |
| 45 to 54 Years | 231 (75.5%) | 20 (8.7%) |
| 55 to 59 Years | 206 (80.8%) | 0 (0.0%) |
| 60 to 64 Years | 133 (70.4%) | 0 (0.0%) |
| 65 to 74 Years | 72 (19.8%) | 0 (0.0%) |
| 75 Years and over | 23 (13.1%) | 0 (0.0%) |
| Total | 1,439 (58.2%) | 76 (5.3%) |
Employment Status by Educational Attainment in Reno city Parker and Tarrant Counties
According to labor force statistics for Reno city Parker and Tarrant Counties, 75.9% of individuals (1,072) out of the total population between 25 and 64 years of age (1,412) are in the labor force, with 4.6% or 49 of them being unemployed. The group with the highest labor force participation rate are those with the educational attainment of bachelor's degree or higher, with 100.0% or 157 individuals in the labor force. Within the labor force, individuals with bachelor's degree or higher education have the highest percentage of unemployment, with 12.7% or 20 of them being unemployed.
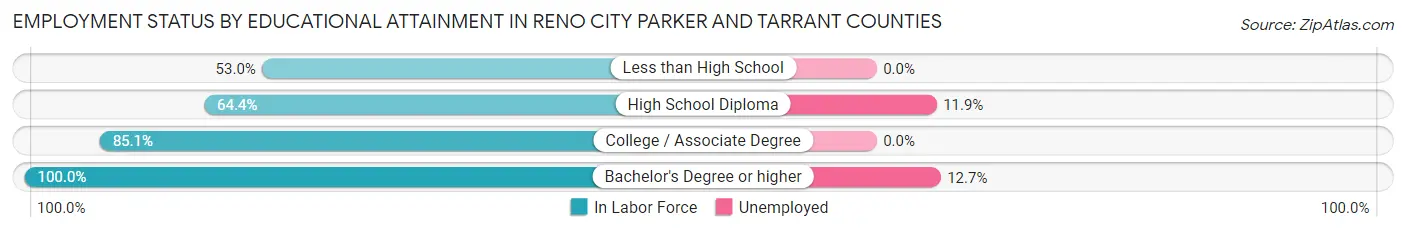
| Educational Attainment | In Labor Force | Unemployed |
| Less than High School | 123 (53.0%) | 0 (0.0%) |
| High School Diploma | 244 (64.4%) | 45 (11.9%) |
| College / Associate Degree | 548 (85.1%) | 0 (0.0%) |
| Bachelor's Degree or higher | 157 (100.0%) | 20 (12.7%) |
| Total | 1,072 (75.9%) | 65 (4.6%) |
Employment Occupations by Sex in Reno city Parker and Tarrant Counties
Management, Business, Science and Arts Occupations
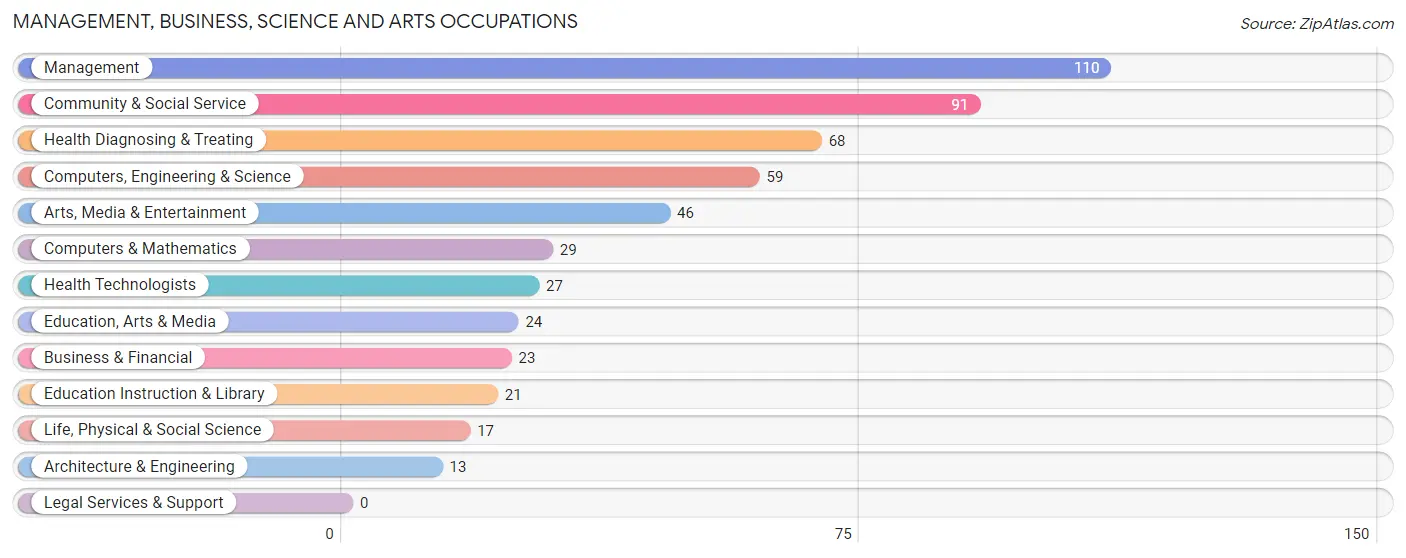
The most common Management, Business, Science and Arts occupations in Reno city Parker and Tarrant Counties are Management (110 | 8.1%), Community & Social Service (91 | 6.7%), Health Diagnosing & Treating (68 | 5.0%), Computers, Engineering & Science (59 | 4.3%), and Arts, Media & Entertainment (46 | 3.4%).
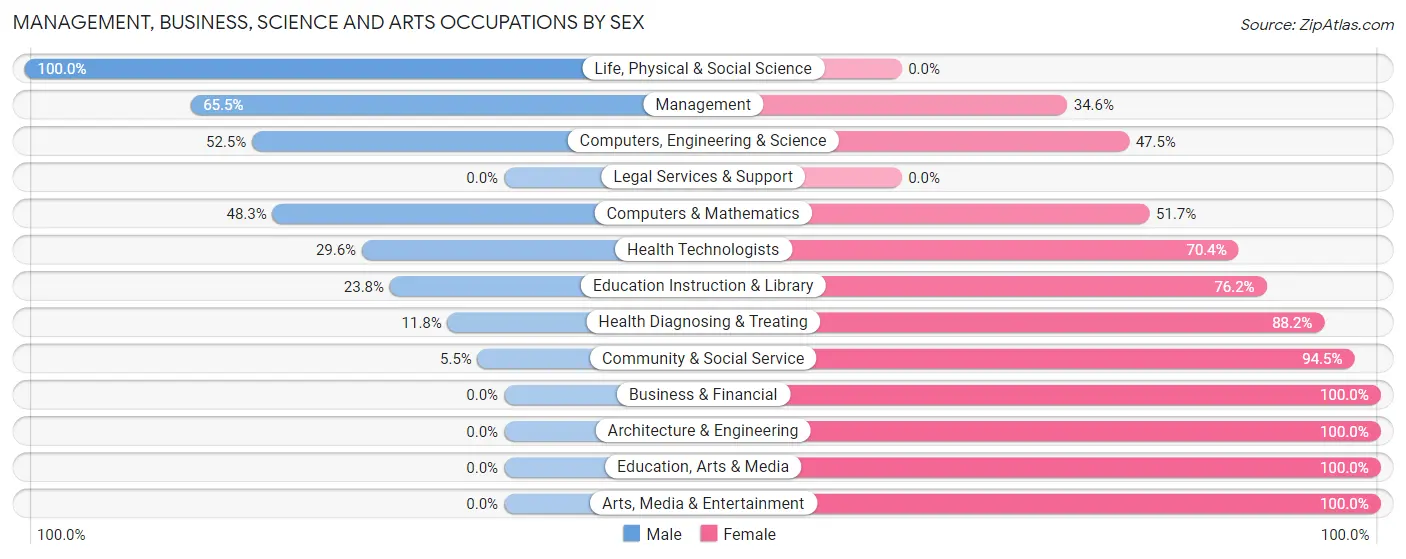
Management, Business, Science and Arts Occupations by Sex
Within the Management, Business, Science and Arts occupations in Reno city Parker and Tarrant Counties, the most male-oriented occupations are Life, Physical & Social Science (100.0%), Management (65.4%), and Computers, Engineering & Science (52.5%), while the most female-oriented occupations are Business & Financial (100.0%), Architecture & Engineering (100.0%), and Education, Arts & Media (100.0%).
| Occupation | Male | Female |
| Management | 72 (65.4%) | 38 (34.5%) |
| Business & Financial | 0 (0.0%) | 23 (100.0%) |
| Computers, Engineering & Science | 31 (52.5%) | 28 (47.5%) |
| Computers & Mathematics | 14 (48.3%) | 15 (51.7%) |
| Architecture & Engineering | 0 (0.0%) | 13 (100.0%) |
| Life, Physical & Social Science | 17 (100.0%) | 0 (0.0%) |
| Community & Social Service | 5 (5.5%) | 86 (94.5%) |
| Education, Arts & Media | 0 (0.0%) | 24 (100.0%) |
| Legal Services & Support | 0 (0.0%) | 0 (0.0%) |
| Education Instruction & Library | 5 (23.8%) | 16 (76.2%) |
| Arts, Media & Entertainment | 0 (0.0%) | 46 (100.0%) |
| Health Diagnosing & Treating | 8 (11.8%) | 60 (88.2%) |
| Health Technologists | 8 (29.6%) | 19 (70.4%) |
| Total (Category) | 116 (33.1%) | 235 (66.9%) |
| Total (Overall) | 768 (56.4%) | 595 (43.6%) |
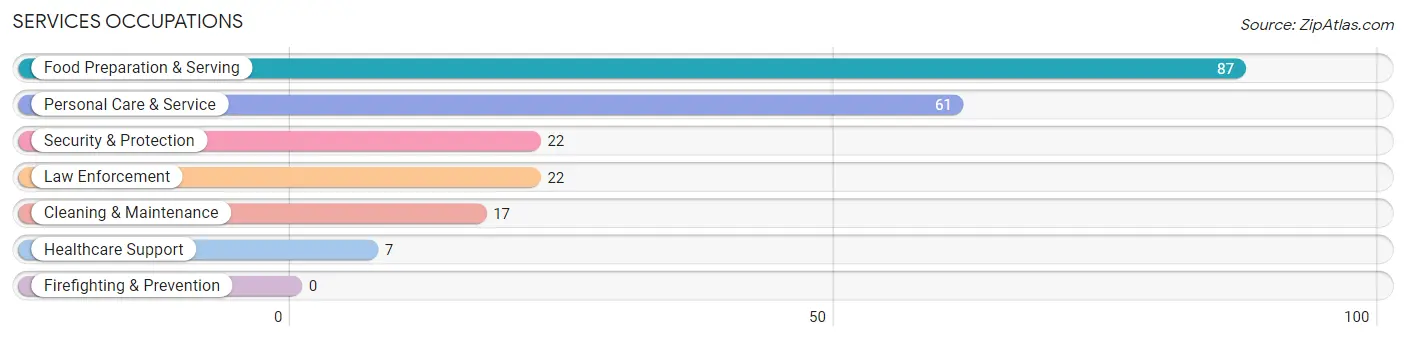
Services Occupations
The most common Services occupations in Reno city Parker and Tarrant Counties are Food Preparation & Serving (87 | 6.4%), Personal Care & Service (61 | 4.5%), Security & Protection (22 | 1.6%), Law Enforcement (22 | 1.6%), and Cleaning & Maintenance (17 | 1.3%).
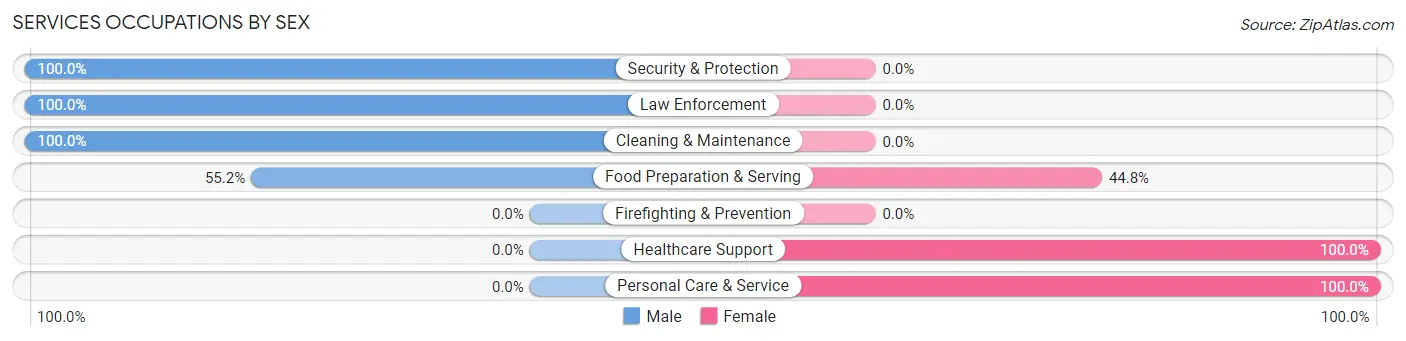
Services Occupations by Sex
Within the Services occupations in Reno city Parker and Tarrant Counties, the most male-oriented occupations are Security & Protection (100.0%), Law Enforcement (100.0%), and Cleaning & Maintenance (100.0%), while the most female-oriented occupations are Healthcare Support (100.0%), Personal Care & Service (100.0%), and Food Preparation & Serving (44.8%).
| Occupation | Male | Female |
| Healthcare Support | 0 (0.0%) | 7 (100.0%) |
| Security & Protection | 22 (100.0%) | 0 (0.0%) |
| Firefighting & Prevention | 0 (0.0%) | 0 (0.0%) |
| Law Enforcement | 22 (100.0%) | 0 (0.0%) |
| Food Preparation & Serving | 48 (55.2%) | 39 (44.8%) |
| Cleaning & Maintenance | 17 (100.0%) | 0 (0.0%) |
| Personal Care & Service | 0 (0.0%) | 61 (100.0%) |
| Total (Category) | 87 (44.9%) | 107 (55.1%) |
| Total (Overall) | 768 (56.4%) | 595 (43.6%) |
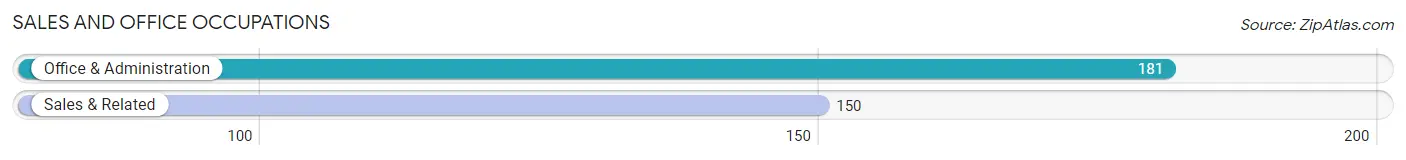
Sales and Office Occupations
The most common Sales and Office occupations in Reno city Parker and Tarrant Counties are Office & Administration (181 | 13.3%), and Sales & Related (150 | 11.0%).
Sales and Office Occupations by Sex
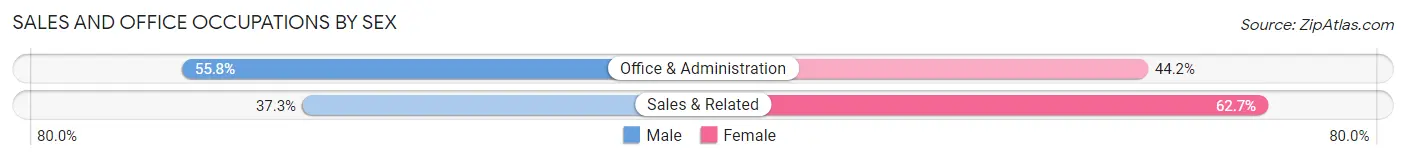
| Occupation | Male | Female |
| Sales & Related | 56 (37.3%) | 94 (62.7%) |
| Office & Administration | 101 (55.8%) | 80 (44.2%) |
| Total (Category) | 157 (47.4%) | 174 (52.6%) |
| Total (Overall) | 768 (56.4%) | 595 (43.6%) |
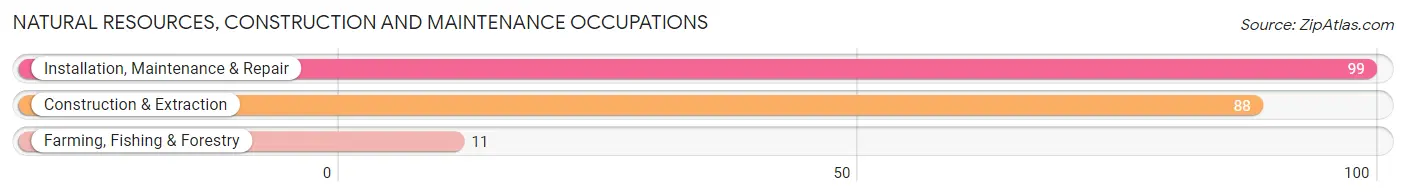
Natural Resources, Construction and Maintenance Occupations
The most common Natural Resources, Construction and Maintenance occupations in Reno city Parker and Tarrant Counties are Installation, Maintenance & Repair (99 | 7.3%), Construction & Extraction (88 | 6.5%), and Farming, Fishing & Forestry (11 | 0.8%).
Natural Resources, Construction and Maintenance Occupations by Sex
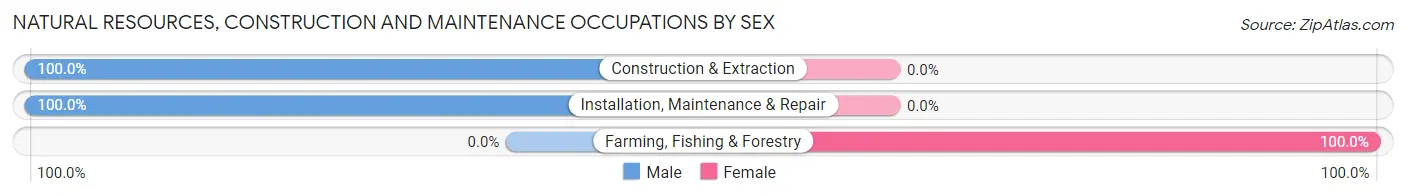
| Occupation | Male | Female |
| Farming, Fishing & Forestry | 0 (0.0%) | 11 (100.0%) |
| Construction & Extraction | 88 (100.0%) | 0 (0.0%) |
| Installation, Maintenance & Repair | 99 (100.0%) | 0 (0.0%) |
| Total (Category) | 187 (94.4%) | 11 (5.6%) |
| Total (Overall) | 768 (56.4%) | 595 (43.6%) |
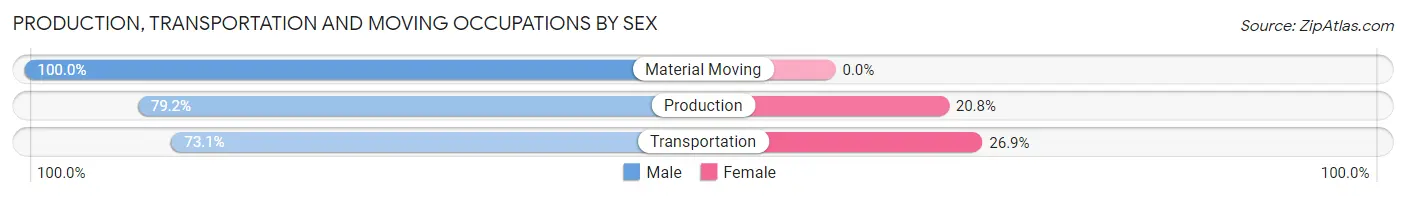
Production, Transportation and Moving Occupations
The most common Production, Transportation and Moving occupations in Reno city Parker and Tarrant Counties are Transportation (193 | 14.2%), Production (77 | 5.7%), and Material Moving (19 | 1.4%).
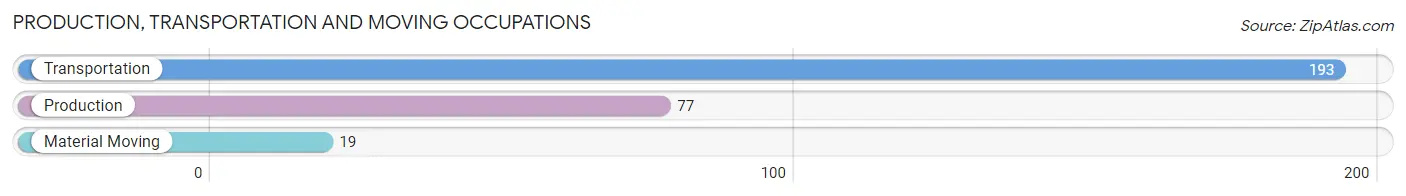
Production, Transportation and Moving Occupations by Sex
| Occupation | Male | Female |
| Production | 61 (79.2%) | 16 (20.8%) |
| Transportation | 141 (73.1%) | 52 (26.9%) |
| Material Moving | 19 (100.0%) | 0 (0.0%) |
| Total (Category) | 221 (76.5%) | 68 (23.5%) |
| Total (Overall) | 768 (56.4%) | 595 (43.6%) |
Employment Industries by Sex in Reno city Parker and Tarrant Counties
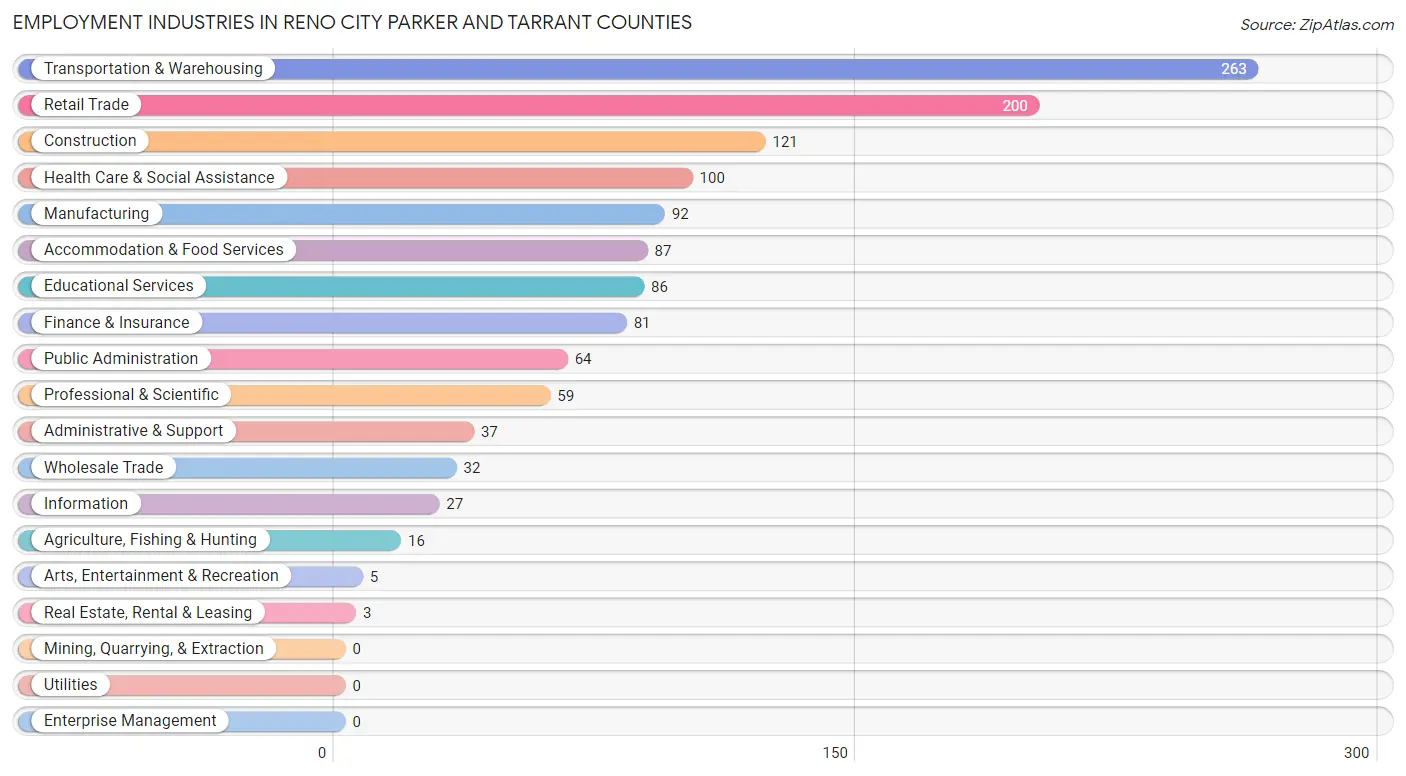
Employment Industries in Reno city Parker and Tarrant Counties
The major employment industries in Reno city Parker and Tarrant Counties include Transportation & Warehousing (263 | 19.3%), Retail Trade (200 | 14.7%), Construction (121 | 8.9%), Health Care & Social Assistance (100 | 7.3%), and Manufacturing (92 | 6.8%).
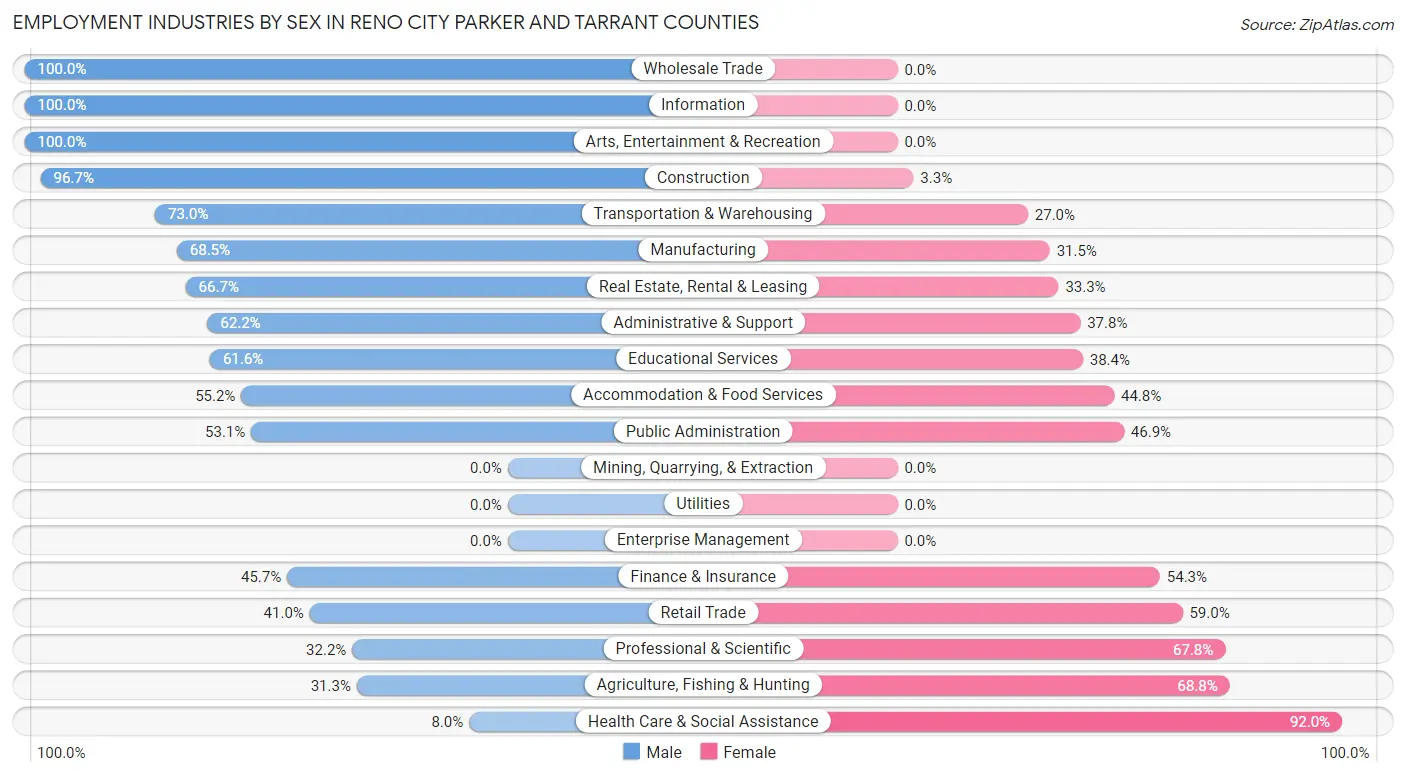
Employment Industries by Sex in Reno city Parker and Tarrant Counties
The Reno city Parker and Tarrant Counties industries that see more men than women are Wholesale Trade (100.0%), Information (100.0%), and Arts, Entertainment & Recreation (100.0%), whereas the industries that tend to have a higher number of women are Health Care & Social Assistance (92.0%), Agriculture, Fishing & Hunting (68.8%), and Professional & Scientific (67.8%).
| Industry | Male | Female |
| Agriculture, Fishing & Hunting | 5 (31.2%) | 11 (68.8%) |
| Mining, Quarrying, & Extraction | 0 (0.0%) | 0 (0.0%) |
| Construction | 117 (96.7%) | 4 (3.3%) |
| Manufacturing | 63 (68.5%) | 29 (31.5%) |
| Wholesale Trade | 32 (100.0%) | 0 (0.0%) |
| Retail Trade | 82 (41.0%) | 118 (59.0%) |
| Transportation & Warehousing | 192 (73.0%) | 71 (27.0%) |
| Utilities | 0 (0.0%) | 0 (0.0%) |
| Information | 27 (100.0%) | 0 (0.0%) |
| Finance & Insurance | 37 (45.7%) | 44 (54.3%) |
| Real Estate, Rental & Leasing | 2 (66.7%) | 1 (33.3%) |
| Professional & Scientific | 19 (32.2%) | 40 (67.8%) |
| Enterprise Management | 0 (0.0%) | 0 (0.0%) |
| Administrative & Support | 23 (62.2%) | 14 (37.8%) |
| Educational Services | 53 (61.6%) | 33 (38.4%) |
| Health Care & Social Assistance | 8 (8.0%) | 92 (92.0%) |
| Arts, Entertainment & Recreation | 5 (100.0%) | 0 (0.0%) |
| Accommodation & Food Services | 48 (55.2%) | 39 (44.8%) |
| Public Administration | 34 (53.1%) | 30 (46.9%) |
| Total | 768 (56.4%) | 595 (43.6%) |
Education in Reno city Parker and Tarrant Counties
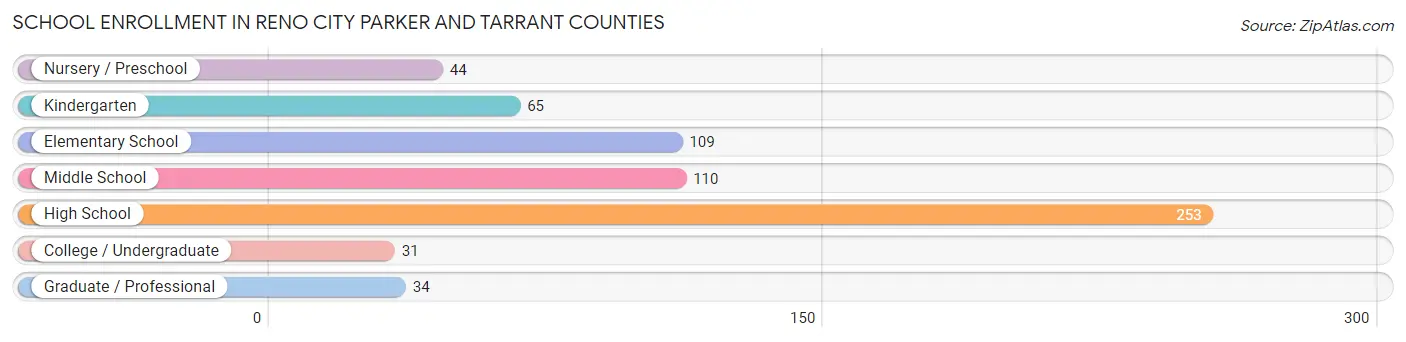
School Enrollment in Reno city Parker and Tarrant Counties
The most common levels of schooling among the 646 students in Reno city Parker and Tarrant Counties are high school (253 | 39.2%), middle school (110 | 17.0%), and elementary school (109 | 16.9%).
| School Level | # Students | % Students |
| Nursery / Preschool | 44 | 6.8% |
| Kindergarten | 65 | 10.1% |
| Elementary School | 109 | 16.9% |
| Middle School | 110 | 17.0% |
| High School | 253 | 39.2% |
| College / Undergraduate | 31 | 4.8% |
| Graduate / Professional | 34 | 5.3% |
| Total | 646 | 100.0% |
School Enrollment by Age by Funding Source in Reno city Parker and Tarrant Counties
Out of a total of 646 students who are enrolled in schools in Reno city Parker and Tarrant Counties, 29 (4.5%) attend a private institution, while the remaining 617 (95.5%) are enrolled in public schools. The age group of 15 to 17 year olds has the highest likelihood of being enrolled in private schools, with 21 (11.1% in the age bracket) enrolled. Conversely, the age group of 3 to 4 year olds has the lowest likelihood of being enrolled in a private school, with 48 (100.0% in the age bracket) attending a public institution.
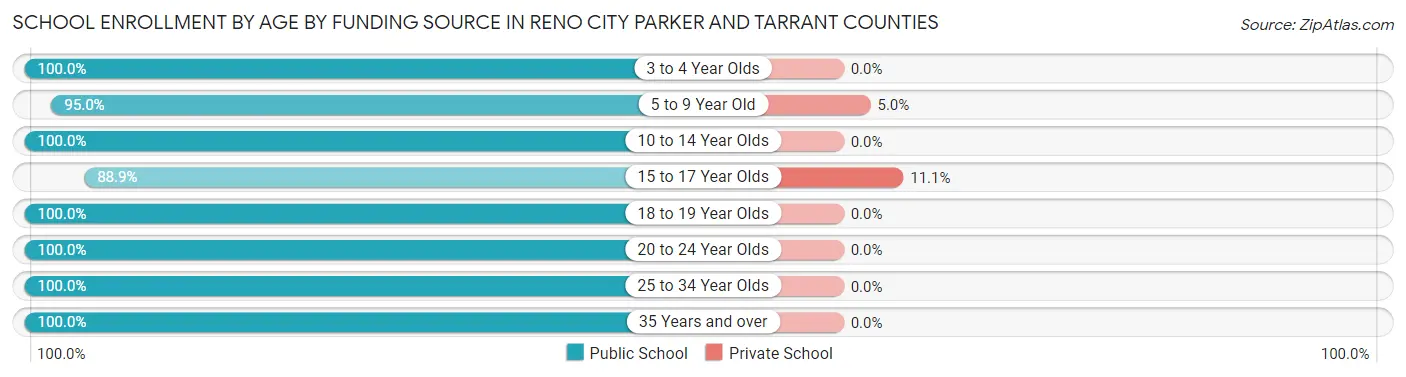
| Age Bracket | Public School | Private School |
| 3 to 4 Year Olds | 48 (100.0%) | 0 (0.0%) |
| 5 to 9 Year Old | 152 (95.0%) | 8 (5.0%) |
| 10 to 14 Year Olds | 109 (100.0%) | 0 (0.0%) |
| 15 to 17 Year Olds | 168 (88.9%) | 21 (11.1%) |
| 18 to 19 Year Olds | 75 (100.0%) | 0 (0.0%) |
| 20 to 24 Year Olds | 45 (100.0%) | 0 (0.0%) |
| 25 to 34 Year Olds | 13 (100.0%) | 0 (0.0%) |
| 35 Years and over | 7 (100.0%) | 0 (0.0%) |
| Total | 617 (95.5%) | 29 (4.5%) |
Educational Attainment by Field of Study in Reno city Parker and Tarrant Counties
Bio, nature & agricultural (65 | 25.6%), business (53 | 20.9%), social sciences (45 | 17.7%), education (25 | 9.8%), and psychology (24 | 9.5%) are the most common fields of study among 254 individuals in Reno city Parker and Tarrant Counties who have obtained a bachelor's degree or higher.
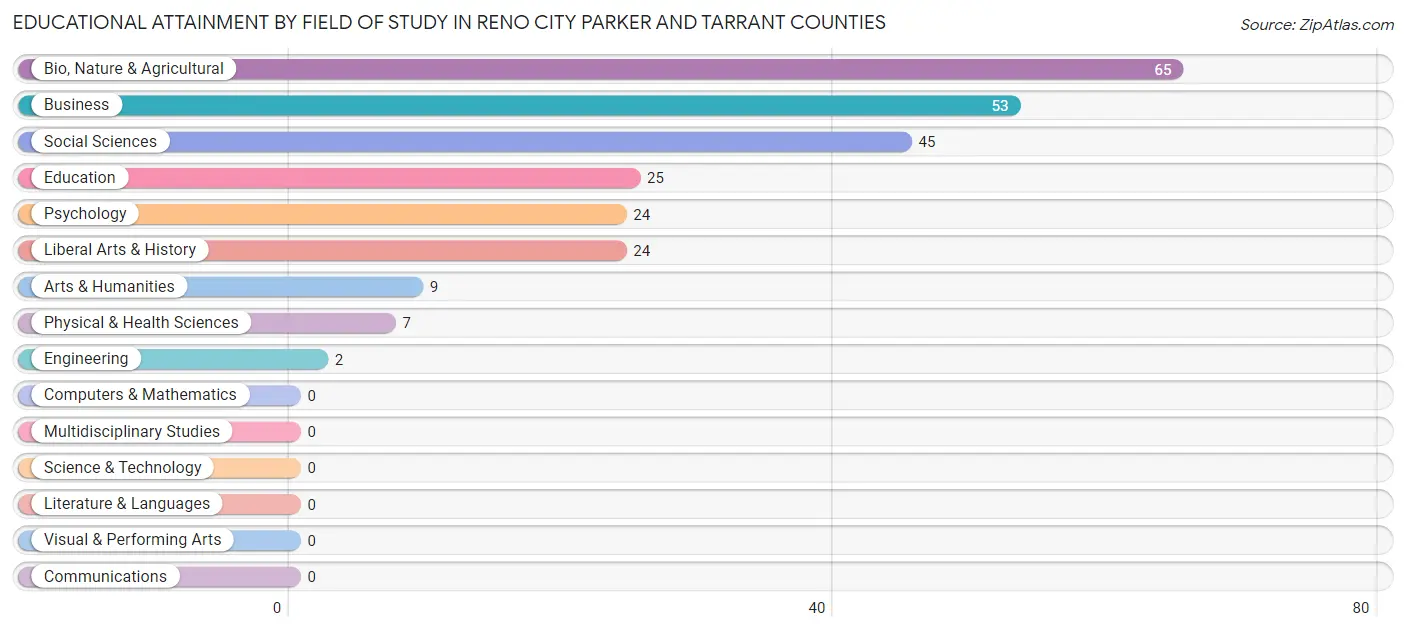
| Field of Study | # Graduates | % Graduates |
| Computers & Mathematics | 0 | 0.0% |
| Bio, Nature & Agricultural | 65 | 25.6% |
| Physical & Health Sciences | 7 | 2.8% |
| Psychology | 24 | 9.5% |
| Social Sciences | 45 | 17.7% |
| Engineering | 2 | 0.8% |
| Multidisciplinary Studies | 0 | 0.0% |
| Science & Technology | 0 | 0.0% |
| Business | 53 | 20.9% |
| Education | 25 | 9.8% |
| Literature & Languages | 0 | 0.0% |
| Liberal Arts & History | 24 | 9.5% |
| Visual & Performing Arts | 0 | 0.0% |
| Communications | 0 | 0.0% |
| Arts & Humanities | 9 | 3.5% |
| Total | 254 | 100.0% |
Transportation & Commute in Reno city Parker and Tarrant Counties
Vehicle Availability by Sex in Reno city Parker and Tarrant Counties
The most prevalent vehicle ownership categories in Reno city Parker and Tarrant Counties are males with 2 vehicles (391, accounting for 50.9%) and females with 2 vehicles (208, making up 68.7%).
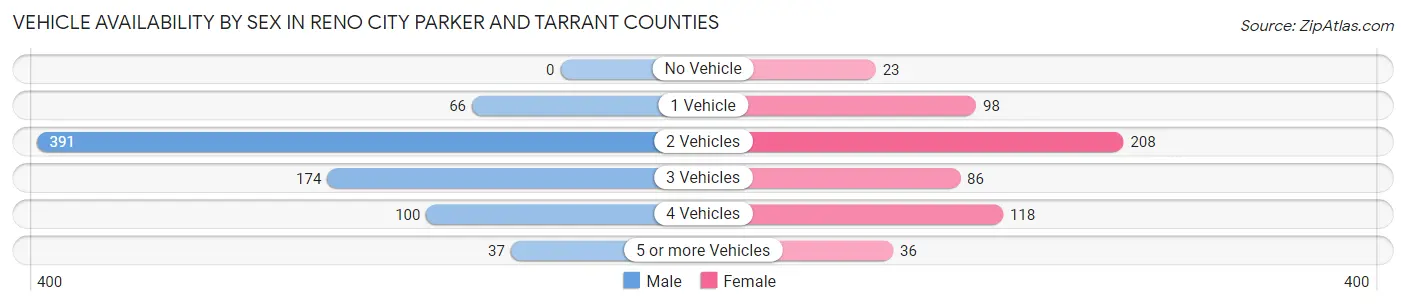
| Vehicles Available | Male | Female |
| No Vehicle | 0 (0.0%) | 23 (4.0%) |
| 1 Vehicle | 66 (8.6%) | 98 (17.2%) |
| 2 Vehicles | 391 (50.9%) | 208 (36.6%) |
| 3 Vehicles | 174 (22.7%) | 86 (15.1%) |
| 4 Vehicles | 100 (13.0%) | 118 (20.7%) |
| 5 or more Vehicles | 37 (4.8%) | 36 (6.3%) |
| Total | 768 (100.0%) | 569 (100.0%) |
Commute Time in Reno city Parker and Tarrant Counties
The most frequently occuring commute durations in Reno city Parker and Tarrant Counties are 45 to 59 minutes (227 commuters, 18.3%), 30 to 34 minutes (145 commuters, 11.7%), and 40 to 44 minutes (144 commuters, 11.6%).
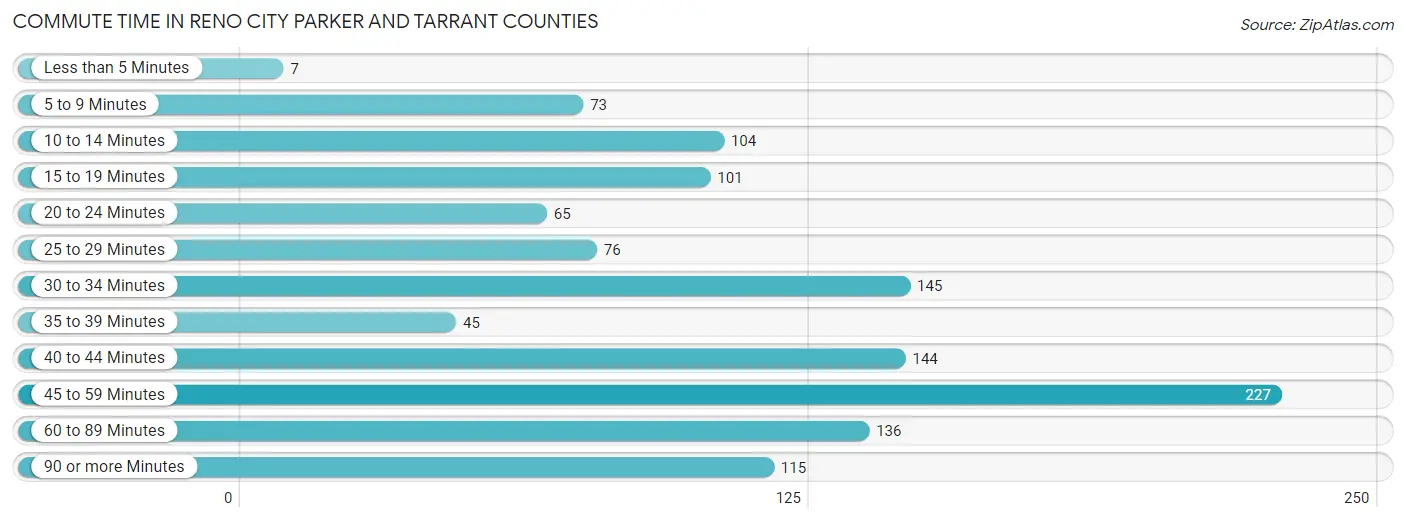
| Commute Time | # Commuters | % Commuters |
| Less than 5 Minutes | 7 | 0.6% |
| 5 to 9 Minutes | 73 | 5.9% |
| 10 to 14 Minutes | 104 | 8.4% |
| 15 to 19 Minutes | 101 | 8.2% |
| 20 to 24 Minutes | 65 | 5.2% |
| 25 to 29 Minutes | 76 | 6.1% |
| 30 to 34 Minutes | 145 | 11.7% |
| 35 to 39 Minutes | 45 | 3.6% |
| 40 to 44 Minutes | 144 | 11.6% |
| 45 to 59 Minutes | 227 | 18.3% |
| 60 to 89 Minutes | 136 | 11.0% |
| 90 or more Minutes | 115 | 9.3% |
Commute Time by Sex in Reno city Parker and Tarrant Counties
The most common commute times in Reno city Parker and Tarrant Counties are 45 to 59 minutes (133 commuters, 17.7%) for males and 45 to 59 minutes (94 commuters, 19.4%) for females.
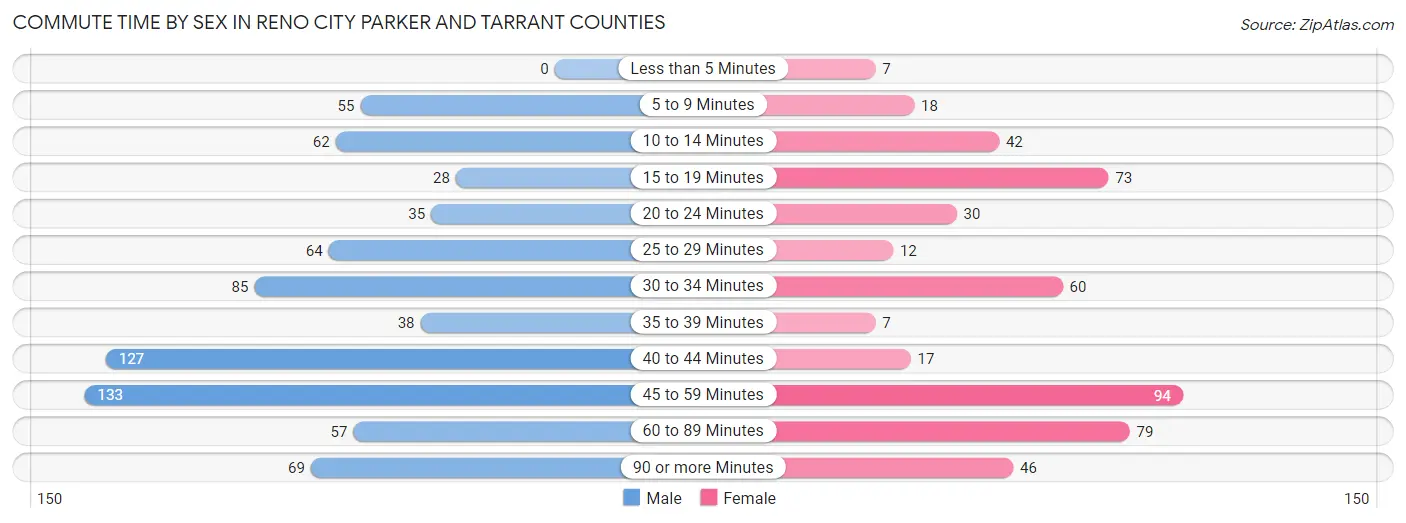
| Commute Time | Male | Female |
| Less than 5 Minutes | 0 (0.0%) | 7 (1.4%) |
| 5 to 9 Minutes | 55 (7.3%) | 18 (3.7%) |
| 10 to 14 Minutes | 62 (8.2%) | 42 (8.7%) |
| 15 to 19 Minutes | 28 (3.7%) | 73 (15.0%) |
| 20 to 24 Minutes | 35 (4.6%) | 30 (6.2%) |
| 25 to 29 Minutes | 64 (8.5%) | 12 (2.5%) |
| 30 to 34 Minutes | 85 (11.3%) | 60 (12.4%) |
| 35 to 39 Minutes | 38 (5.1%) | 7 (1.4%) |
| 40 to 44 Minutes | 127 (16.9%) | 17 (3.5%) |
| 45 to 59 Minutes | 133 (17.7%) | 94 (19.4%) |
| 60 to 89 Minutes | 57 (7.6%) | 79 (16.3%) |
| 90 or more Minutes | 69 (9.2%) | 46 (9.5%) |
Time of Departure to Work by Sex in Reno city Parker and Tarrant Counties
The most frequent times of departure to work in Reno city Parker and Tarrant Counties are 6:00 AM to 6:29 AM (119, 15.8%) for males and 7:00 AM to 7:29 AM (147, 30.3%) for females.
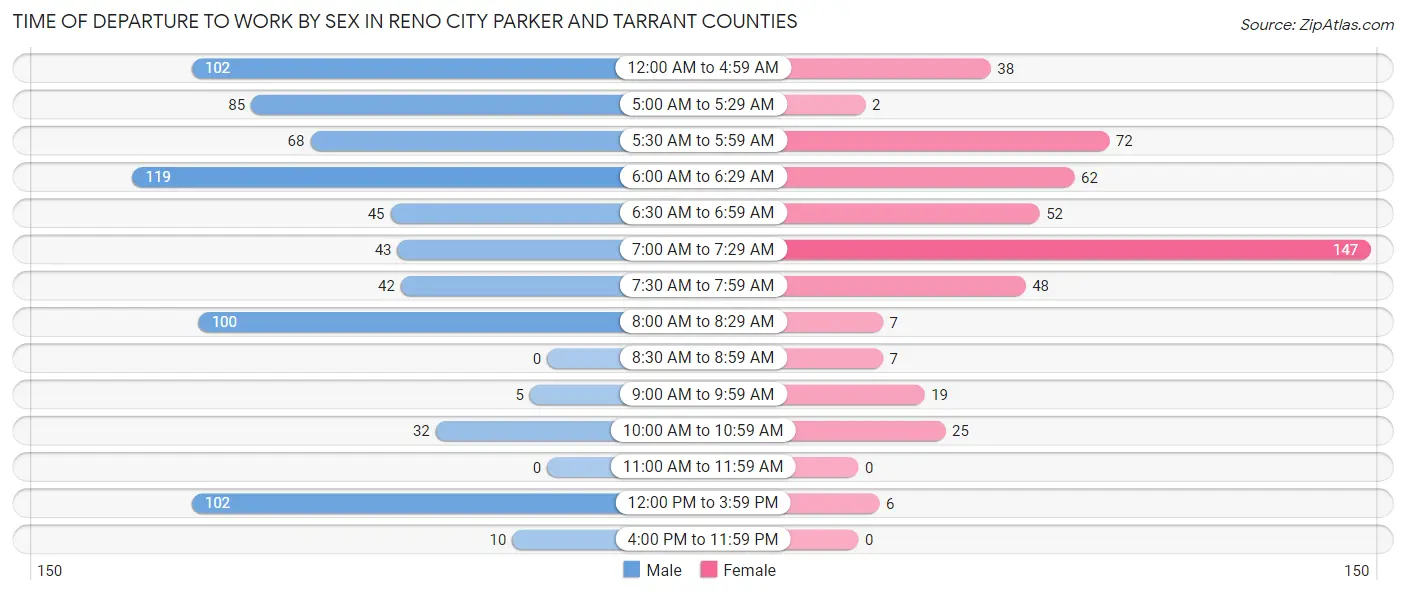
| Time of Departure | Male | Female |
| 12:00 AM to 4:59 AM | 102 (13.6%) | 38 (7.8%) |
| 5:00 AM to 5:29 AM | 85 (11.3%) | 2 (0.4%) |
| 5:30 AM to 5:59 AM | 68 (9.0%) | 72 (14.8%) |
| 6:00 AM to 6:29 AM | 119 (15.8%) | 62 (12.8%) |
| 6:30 AM to 6:59 AM | 45 (6.0%) | 52 (10.7%) |
| 7:00 AM to 7:29 AM | 43 (5.7%) | 147 (30.3%) |
| 7:30 AM to 7:59 AM | 42 (5.6%) | 48 (9.9%) |
| 8:00 AM to 8:29 AM | 100 (13.3%) | 7 (1.4%) |
| 8:30 AM to 8:59 AM | 0 (0.0%) | 7 (1.4%) |
| 9:00 AM to 9:59 AM | 5 (0.7%) | 19 (3.9%) |
| 10:00 AM to 10:59 AM | 32 (4.3%) | 25 (5.1%) |
| 11:00 AM to 11:59 AM | 0 (0.0%) | 0 (0.0%) |
| 12:00 PM to 3:59 PM | 102 (13.6%) | 6 (1.2%) |
| 4:00 PM to 11:59 PM | 10 (1.3%) | 0 (0.0%) |
| Total | 753 (100.0%) | 485 (100.0%) |
Housing Occupancy in Reno city Parker and Tarrant Counties
Occupancy by Ownership in Reno city Parker and Tarrant Counties
Of the total 1,103 dwellings in Reno city Parker and Tarrant Counties, owner-occupied units account for 893 (81.0%), while renter-occupied units make up 210 (19.0%).
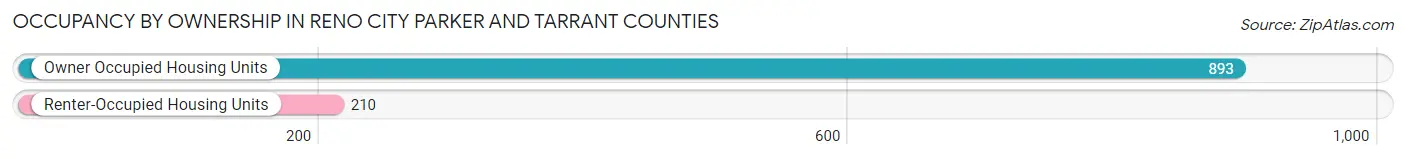
| Occupancy | # Housing Units | % Housing Units |
| Owner Occupied Housing Units | 893 | 81.0% |
| Renter-Occupied Housing Units | 210 | 19.0% |
| Total Occupied Housing Units | 1,103 | 100.0% |
Occupancy by Household Size in Reno city Parker and Tarrant Counties
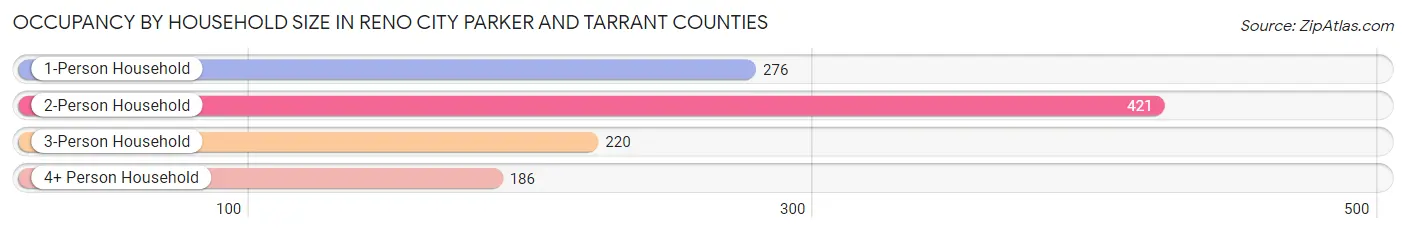
| Household Size | # Housing Units | % Housing Units |
| 1-Person Household | 276 | 25.0% |
| 2-Person Household | 421 | 38.2% |
| 3-Person Household | 220 | 20.0% |
| 4+ Person Household | 186 | 16.9% |
| Total Housing Units | 1,103 | 100.0% |
Occupancy by Ownership by Household Size in Reno city Parker and Tarrant Counties
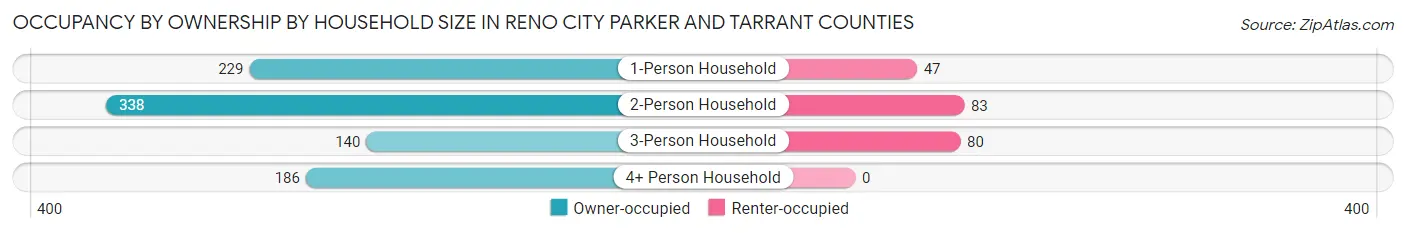
| Household Size | Owner-occupied | Renter-occupied |
| 1-Person Household | 229 (83.0%) | 47 (17.0%) |
| 2-Person Household | 338 (80.3%) | 83 (19.7%) |
| 3-Person Household | 140 (63.6%) | 80 (36.4%) |
| 4+ Person Household | 186 (100.0%) | 0 (0.0%) |
| Total Housing Units | 893 (81.0%) | 210 (19.0%) |
Occupancy by Educational Attainment in Reno city Parker and Tarrant Counties
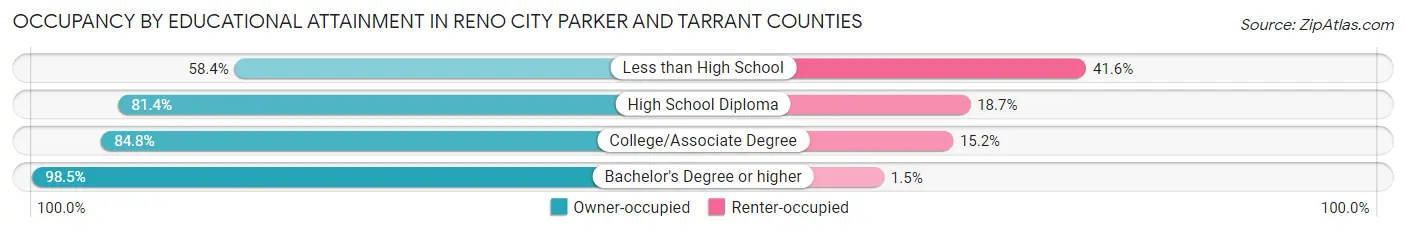
| Household Size | Owner-occupied | Renter-occupied |
| Less than High School | 108 (58.4%) | 77 (41.6%) |
| High School Diploma | 266 (81.4%) | 61 (18.6%) |
| College/Associate Degree | 390 (84.8%) | 70 (15.2%) |
| Bachelor's Degree or higher | 129 (98.5%) | 2 (1.5%) |
Occupancy by Age of Householder in Reno city Parker and Tarrant Counties
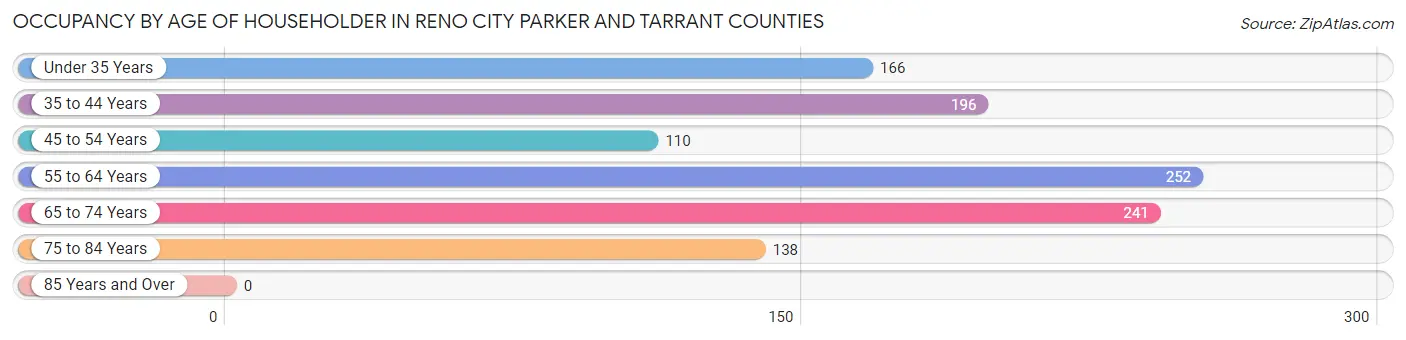
| Age Bracket | # Households | % Households |
| Under 35 Years | 166 | 15.0% |
| 35 to 44 Years | 196 | 17.8% |
| 45 to 54 Years | 110 | 10.0% |
| 55 to 64 Years | 252 | 22.9% |
| 65 to 74 Years | 241 | 21.8% |
| 75 to 84 Years | 138 | 12.5% |
| 85 Years and Over | 0 | 0.0% |
| Total | 1,103 | 100.0% |
Housing Finances in Reno city Parker and Tarrant Counties
Median Income by Occupancy in Reno city Parker and Tarrant Counties
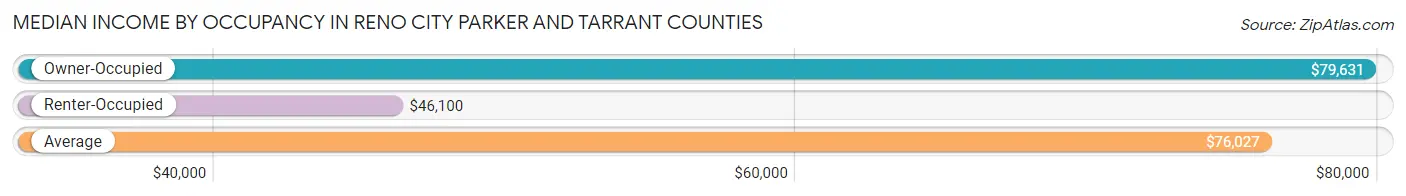
| Occupancy Type | # Households | Median Income |
| Owner-Occupied | 893 (81.0%) | $79,631 |
| Renter-Occupied | 210 (19.0%) | $46,100 |
| Average | 1,103 (100.0%) | $76,027 |
Occupancy by Householder Income Bracket in Reno city Parker and Tarrant Counties
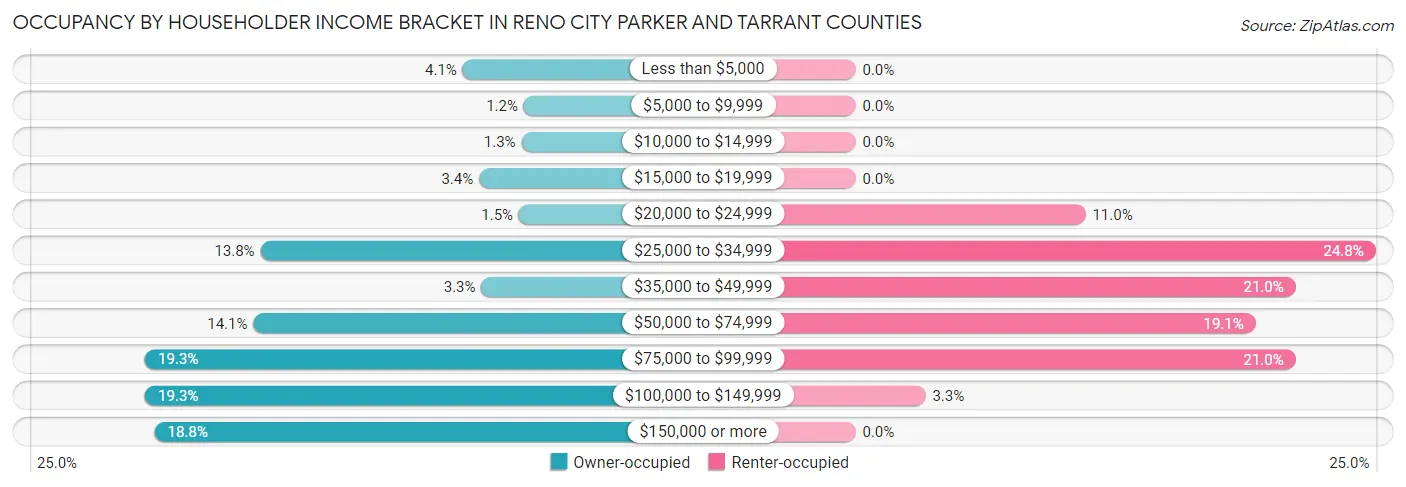
| Income Bracket | Owner-occupied | Renter-occupied |
| Less than $5,000 | 37 (4.1%) | 0 (0.0%) |
| $5,000 to $9,999 | 11 (1.2%) | 0 (0.0%) |
| $10,000 to $14,999 | 12 (1.3%) | 0 (0.0%) |
| $15,000 to $19,999 | 30 (3.4%) | 0 (0.0%) |
| $20,000 to $24,999 | 13 (1.5%) | 23 (11.0%) |
| $25,000 to $34,999 | 123 (13.8%) | 52 (24.8%) |
| $35,000 to $49,999 | 29 (3.3%) | 44 (20.9%) |
| $50,000 to $74,999 | 126 (14.1%) | 40 (19.1%) |
| $75,000 to $99,999 | 172 (19.3%) | 44 (20.9%) |
| $100,000 to $149,999 | 172 (19.3%) | 7 (3.3%) |
| $150,000 or more | 168 (18.8%) | 0 (0.0%) |
| Total | 893 (100.0%) | 210 (100.0%) |
Monthly Housing Cost Tiers in Reno city Parker and Tarrant Counties
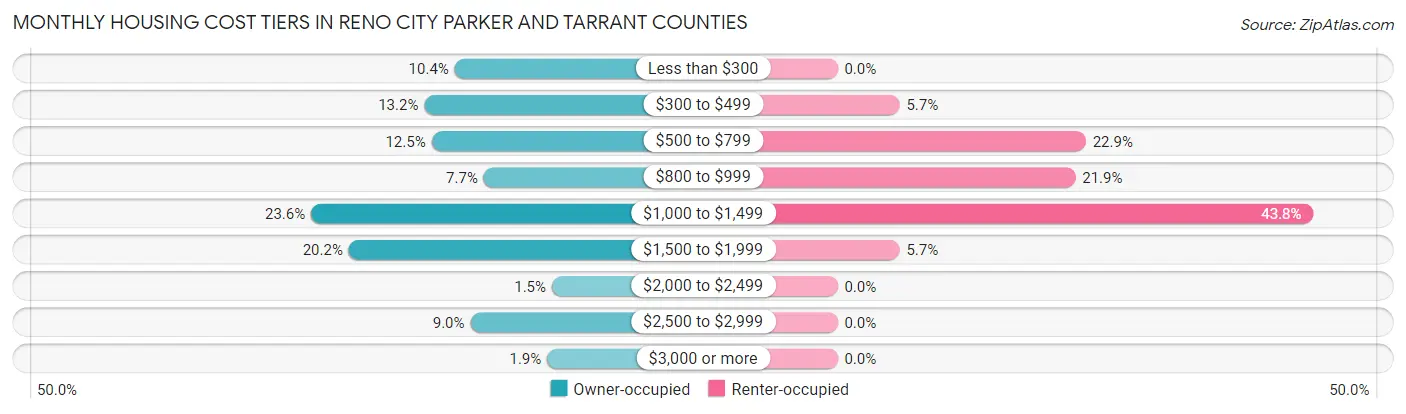
| Monthly Cost | Owner-occupied | Renter-occupied |
| Less than $300 | 93 (10.4%) | 0 (0.0%) |
| $300 to $499 | 118 (13.2%) | 12 (5.7%) |
| $500 to $799 | 112 (12.5%) | 48 (22.9%) |
| $800 to $999 | 69 (7.7%) | 46 (21.9%) |
| $1,000 to $1,499 | 211 (23.6%) | 92 (43.8%) |
| $1,500 to $1,999 | 180 (20.2%) | 12 (5.7%) |
| $2,000 to $2,499 | 13 (1.5%) | 0 (0.0%) |
| $2,500 to $2,999 | 80 (9.0%) | 0 (0.0%) |
| $3,000 or more | 17 (1.9%) | 0 (0.0%) |
| Total | 893 (100.0%) | 210 (100.0%) |
Physical Housing Characteristics in Reno city Parker and Tarrant Counties
Housing Structures in Reno city Parker and Tarrant Counties
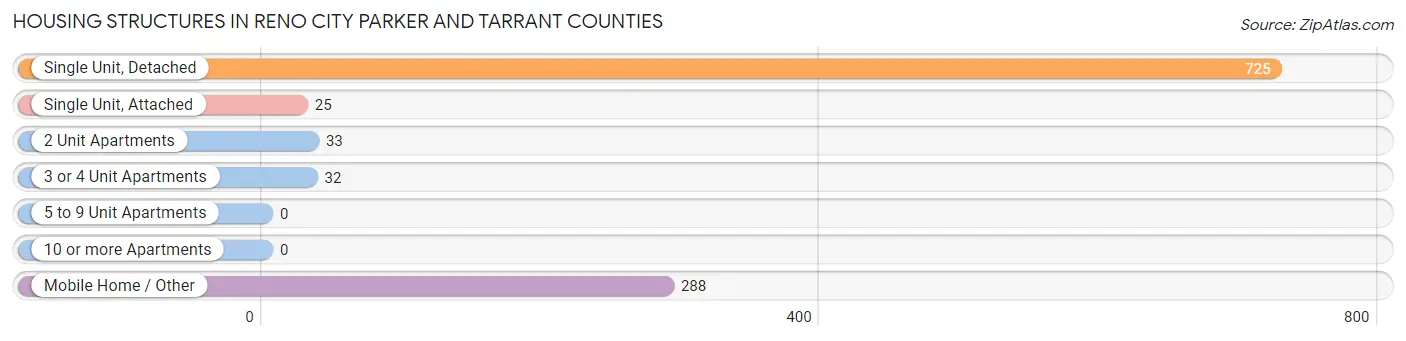
| Structure Type | # Housing Units | % Housing Units |
| Single Unit, Detached | 725 | 65.7% |
| Single Unit, Attached | 25 | 2.3% |
| 2 Unit Apartments | 33 | 3.0% |
| 3 or 4 Unit Apartments | 32 | 2.9% |
| 5 to 9 Unit Apartments | 0 | 0.0% |
| 10 or more Apartments | 0 | 0.0% |
| Mobile Home / Other | 288 | 26.1% |
| Total | 1,103 | 100.0% |
Housing Structures by Occupancy in Reno city Parker and Tarrant Counties
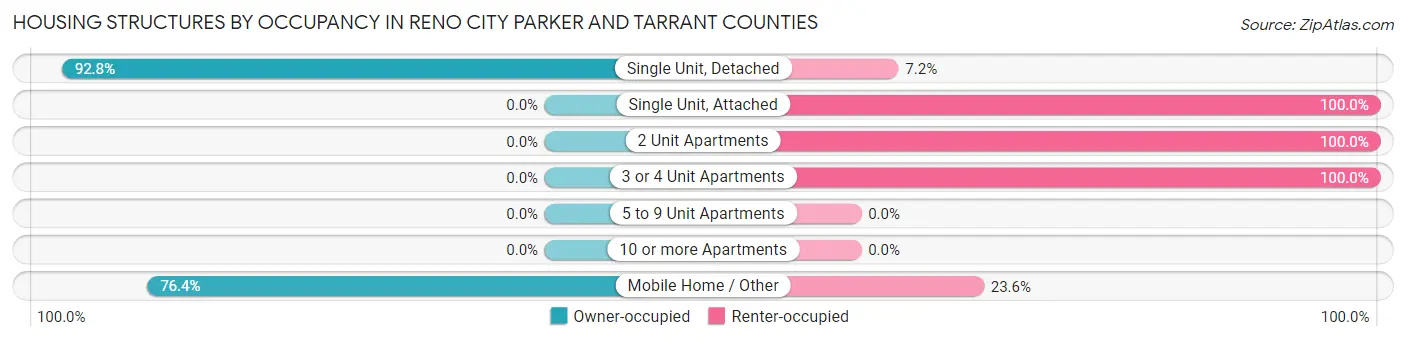
| Structure Type | Owner-occupied | Renter-occupied |
| Single Unit, Detached | 673 (92.8%) | 52 (7.2%) |
| Single Unit, Attached | 0 (0.0%) | 25 (100.0%) |
| 2 Unit Apartments | 0 (0.0%) | 33 (100.0%) |
| 3 or 4 Unit Apartments | 0 (0.0%) | 32 (100.0%) |
| 5 to 9 Unit Apartments | 0 (0.0%) | 0 (0.0%) |
| 10 or more Apartments | 0 (0.0%) | 0 (0.0%) |
| Mobile Home / Other | 220 (76.4%) | 68 (23.6%) |
| Total | 893 (81.0%) | 210 (19.0%) |
Housing Structures by Number of Rooms in Reno city Parker and Tarrant Counties
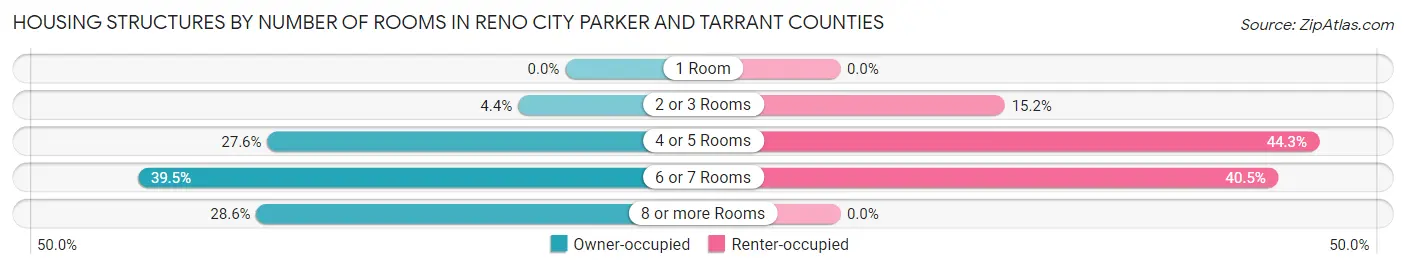
| Number of Rooms | Owner-occupied | Renter-occupied |
| 1 Room | 0 (0.0%) | 0 (0.0%) |
| 2 or 3 Rooms | 39 (4.4%) | 32 (15.2%) |
| 4 or 5 Rooms | 246 (27.6%) | 93 (44.3%) |
| 6 or 7 Rooms | 353 (39.5%) | 85 (40.5%) |
| 8 or more Rooms | 255 (28.6%) | 0 (0.0%) |
| Total | 893 (100.0%) | 210 (100.0%) |
Housing Structure by Heating Type in Reno city Parker and Tarrant Counties
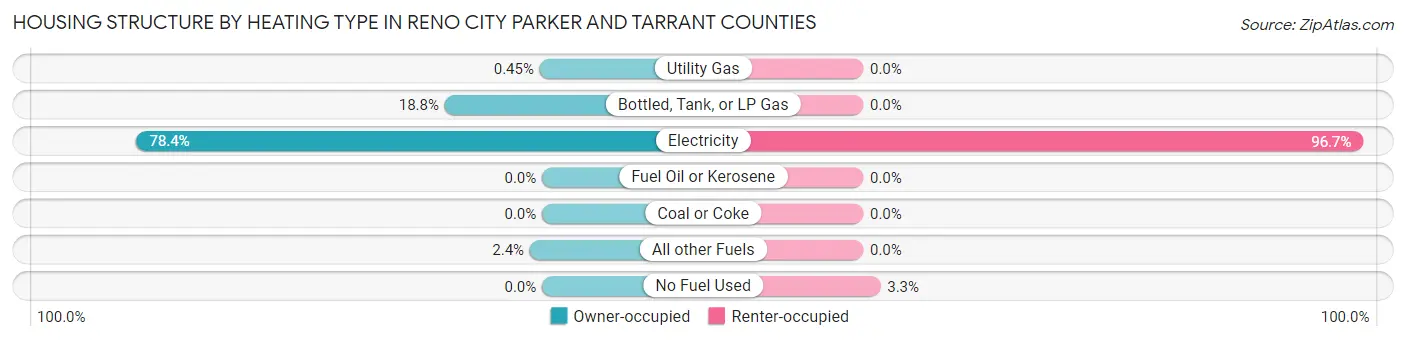
| Heating Type | Owner-occupied | Renter-occupied |
| Utility Gas | 4 (0.4%) | 0 (0.0%) |
| Bottled, Tank, or LP Gas | 168 (18.8%) | 0 (0.0%) |
| Electricity | 700 (78.4%) | 203 (96.7%) |
| Fuel Oil or Kerosene | 0 (0.0%) | 0 (0.0%) |
| Coal or Coke | 0 (0.0%) | 0 (0.0%) |
| All other Fuels | 21 (2.4%) | 0 (0.0%) |
| No Fuel Used | 0 (0.0%) | 7 (3.3%) |
| Total | 893 (100.0%) | 210 (100.0%) |
Household Vehicle Usage in Reno city Parker and Tarrant Counties
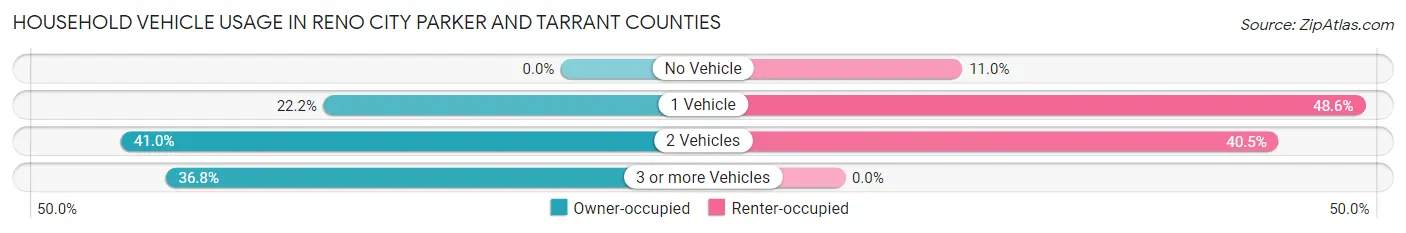
| Vehicles per Household | Owner-occupied | Renter-occupied |
| No Vehicle | 0 (0.0%) | 23 (11.0%) |
| 1 Vehicle | 198 (22.2%) | 102 (48.6%) |
| 2 Vehicles | 366 (41.0%) | 85 (40.5%) |
| 3 or more Vehicles | 329 (36.8%) | 0 (0.0%) |
| Total | 893 (100.0%) | 210 (100.0%) |
Real Estate & Mortgages in Reno city Parker and Tarrant Counties
Real Estate and Mortgage Overview in Reno city Parker and Tarrant Counties
| Characteristic | Without Mortgage | With Mortgage |
| Housing Units | 415 | 478 |
| Median Property Value | $120,800 | $278,800 |
| Median Household Income | $31,375 | $135 |
| Monthly Housing Costs | $514 | $17 |
| Real Estate Taxes | $1,328 | $0 |
Property Value by Mortgage Status in Reno city Parker and Tarrant Counties
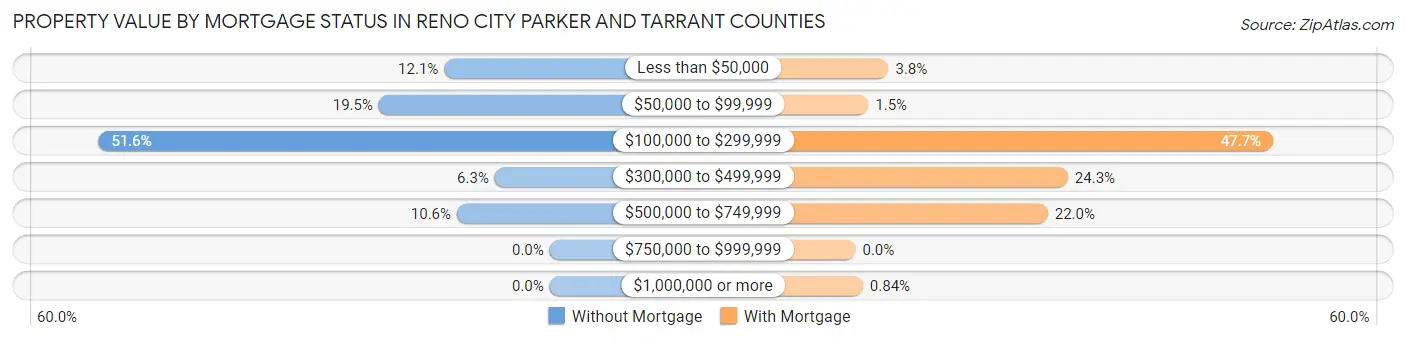
| Property Value | Without Mortgage | With Mortgage |
| Less than $50,000 | 50 (12.0%) | 18 (3.8%) |
| $50,000 to $99,999 | 81 (19.5%) | 7 (1.5%) |
| $100,000 to $299,999 | 214 (51.6%) | 228 (47.7%) |
| $300,000 to $499,999 | 26 (6.3%) | 116 (24.3%) |
| $500,000 to $749,999 | 44 (10.6%) | 105 (22.0%) |
| $750,000 to $999,999 | 0 (0.0%) | 0 (0.0%) |
| $1,000,000 or more | 0 (0.0%) | 4 (0.8%) |
| Total | 415 (100.0%) | 478 (100.0%) |
Household Income by Mortgage Status in Reno city Parker and Tarrant Counties
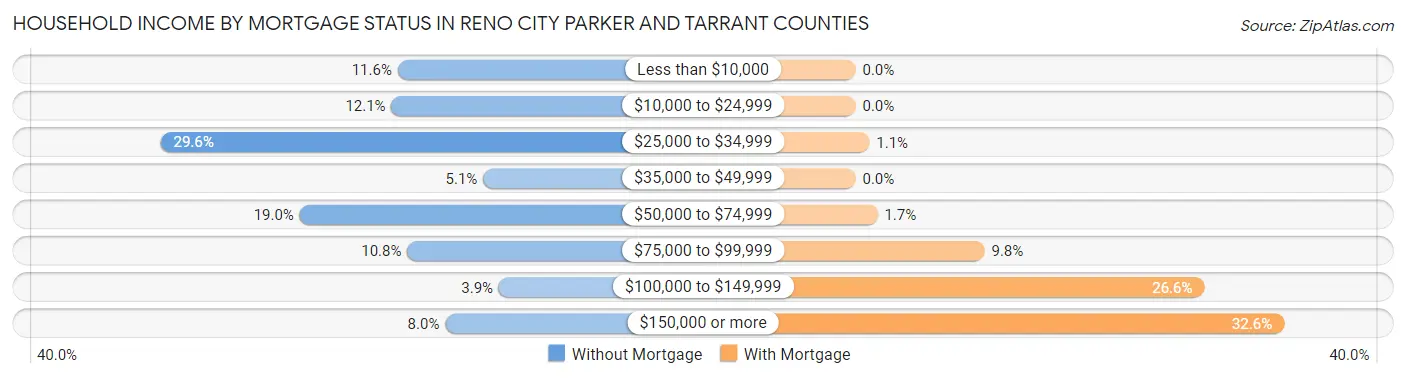
| Household Income | Without Mortgage | With Mortgage |
| Less than $10,000 | 48 (11.6%) | 0 (0.0%) |
| $10,000 to $24,999 | 50 (12.0%) | 0 (0.0%) |
| $25,000 to $34,999 | 123 (29.6%) | 5 (1.1%) |
| $35,000 to $49,999 | 21 (5.1%) | 0 (0.0%) |
| $50,000 to $74,999 | 79 (19.0%) | 8 (1.7%) |
| $75,000 to $99,999 | 45 (10.8%) | 47 (9.8%) |
| $100,000 to $149,999 | 16 (3.9%) | 127 (26.6%) |
| $150,000 or more | 33 (8.0%) | 156 (32.6%) |
| Total | 415 (100.0%) | 478 (100.0%) |
Property Value to Household Income Ratio in Reno city Parker and Tarrant Counties
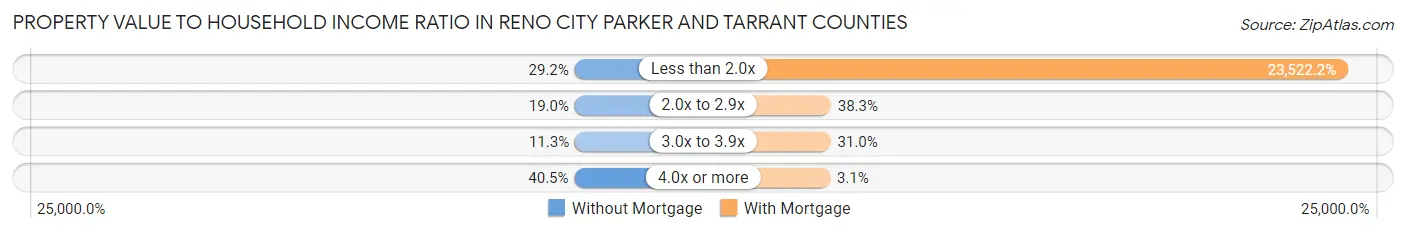
| Value-to-Income Ratio | Without Mortgage | With Mortgage |
| Less than 2.0x | 121 (29.2%) | 112,436 (23,522.2%) |
| 2.0x to 2.9x | 79 (19.0%) | 183 (38.3%) |
| 3.0x to 3.9x | 47 (11.3%) | 148 (31.0%) |
| 4.0x or more | 168 (40.5%) | 15 (3.1%) |
| Total | 415 (100.0%) | 478 (100.0%) |
Real Estate Taxes by Mortgage Status in Reno city Parker and Tarrant Counties
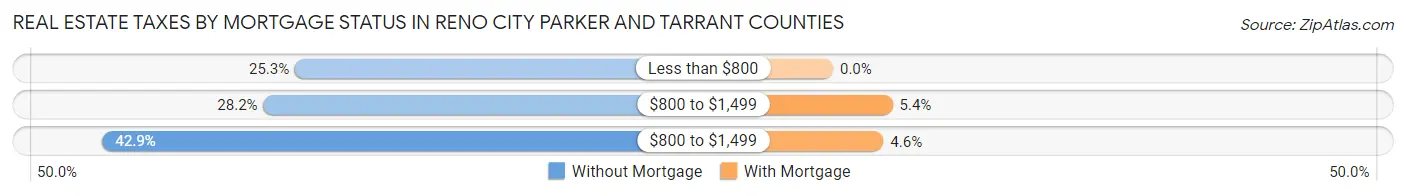
| Property Taxes | Without Mortgage | With Mortgage |
| Less than $800 | 105 (25.3%) | 0 (0.0%) |
| $800 to $1,499 | 117 (28.2%) | 26 (5.4%) |
| $800 to $1,499 | 178 (42.9%) | 22 (4.6%) |
| Total | 415 (100.0%) | 478 (100.0%) |
Health & Disability in Reno city Parker and Tarrant Counties
Health Insurance Coverage by Age in Reno city Parker and Tarrant Counties
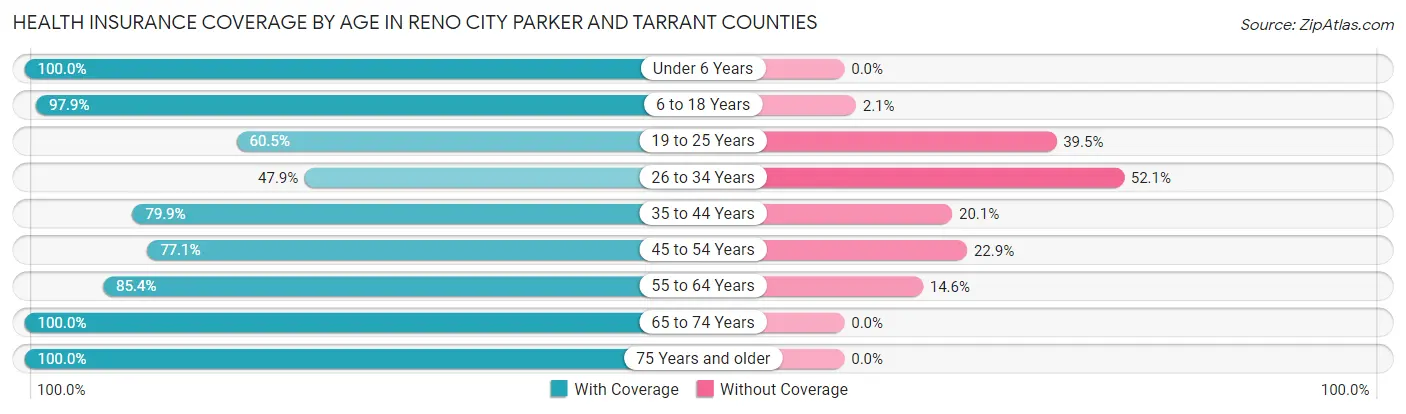
| Age Bracket | With Coverage | Without Coverage |
| Under 6 Years | 292 (100.0%) | 0 (0.0%) |
| 6 to 18 Years | 502 (97.9%) | 11 (2.1%) |
| 19 to 25 Years | 176 (60.5%) | 115 (39.5%) |
| 26 to 34 Years | 113 (47.9%) | 123 (52.1%) |
| 35 to 44 Years | 330 (79.9%) | 83 (20.1%) |
| 45 to 54 Years | 236 (77.1%) | 70 (22.9%) |
| 55 to 64 Years | 379 (85.4%) | 65 (14.6%) |
| 65 to 74 Years | 363 (100.0%) | 0 (0.0%) |
| 75 Years and older | 176 (100.0%) | 0 (0.0%) |
| Total | 2,567 (84.6%) | 467 (15.4%) |
Health Insurance Coverage by Citizenship Status in Reno city Parker and Tarrant Counties
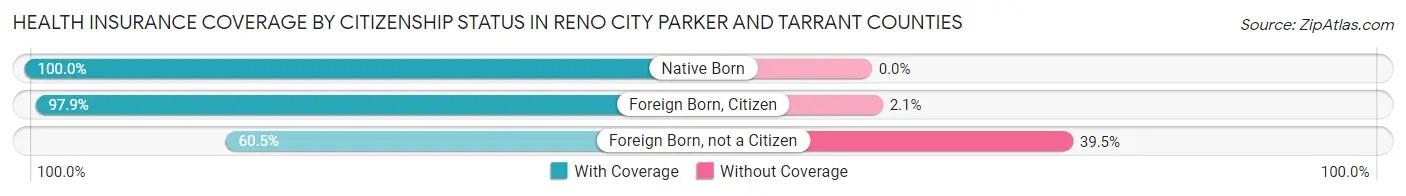
| Citizenship Status | With Coverage | Without Coverage |
| Native Born | 292 (100.0%) | 0 (0.0%) |
| Foreign Born, Citizen | 502 (97.9%) | 11 (2.1%) |
| Foreign Born, not a Citizen | 176 (60.5%) | 115 (39.5%) |
Health Insurance Coverage by Household Income in Reno city Parker and Tarrant Counties
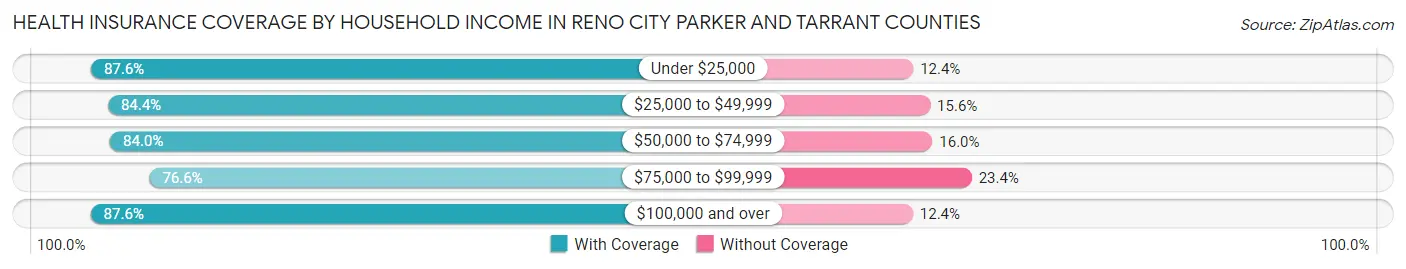
| Household Income | With Coverage | Without Coverage |
| Under $25,000 | 190 (87.6%) | 27 (12.4%) |
| $25,000 to $49,999 | 443 (84.4%) | 82 (15.6%) |
| $50,000 to $74,999 | 398 (84.0%) | 76 (16.0%) |
| $75,000 to $99,999 | 396 (76.6%) | 121 (23.4%) |
| $100,000 and over | 1,140 (87.6%) | 161 (12.4%) |
Public vs Private Health Insurance Coverage by Age in Reno city Parker and Tarrant Counties
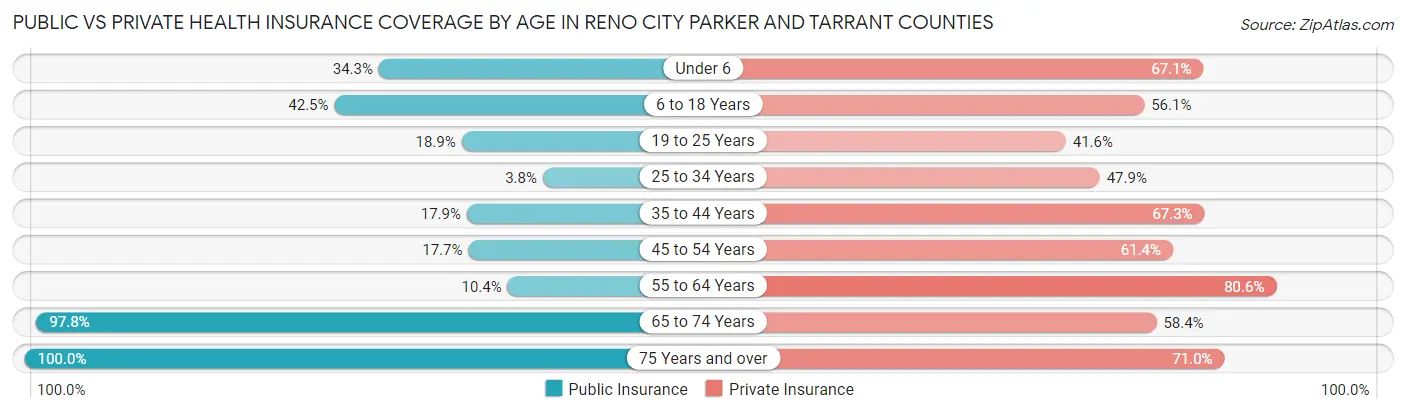
| Age Bracket | Public Insurance | Private Insurance |
| Under 6 | 100 (34.3%) | 196 (67.1%) |
| 6 to 18 Years | 218 (42.5%) | 288 (56.1%) |
| 19 to 25 Years | 55 (18.9%) | 121 (41.6%) |
| 25 to 34 Years | 9 (3.8%) | 113 (47.9%) |
| 35 to 44 Years | 74 (17.9%) | 278 (67.3%) |
| 45 to 54 Years | 54 (17.6%) | 188 (61.4%) |
| 55 to 64 Years | 46 (10.4%) | 358 (80.6%) |
| 65 to 74 Years | 355 (97.8%) | 212 (58.4%) |
| 75 Years and over | 176 (100.0%) | 125 (71.0%) |
| Total | 1,087 (35.8%) | 1,879 (61.9%) |
Disability Status by Sex by Age in Reno city Parker and Tarrant Counties
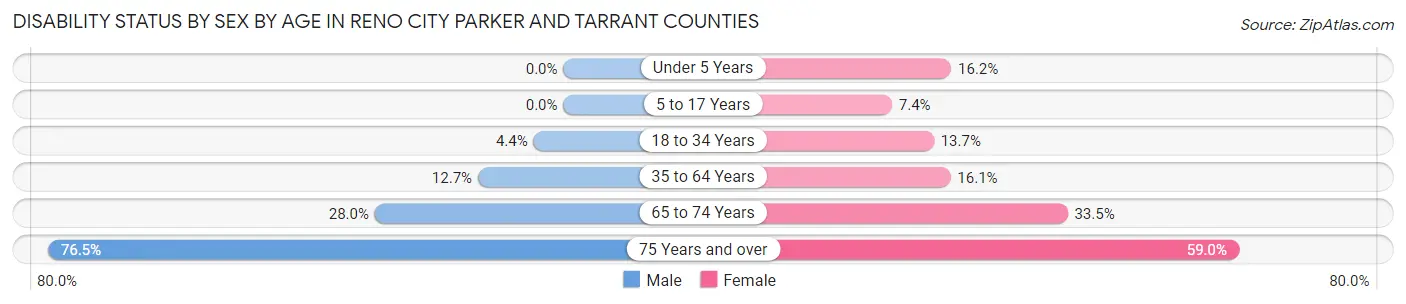
| Age Bracket | Male | Female |
| Under 5 Years | 0 (0.0%) | 31 (16.2%) |
| 5 to 17 Years | 0 (0.0%) | 20 (7.4%) |
| 18 to 34 Years | 15 (4.4%) | 37 (13.7%) |
| 35 to 64 Years | 76 (12.7%) | 91 (16.1%) |
| 65 to 74 Years | 49 (28.0%) | 63 (33.5%) |
| 75 Years and over | 62 (76.5%) | 56 (59.0%) |
Disability Class by Sex by Age in Reno city Parker and Tarrant Counties
Disability Class: Hearing Difficulty
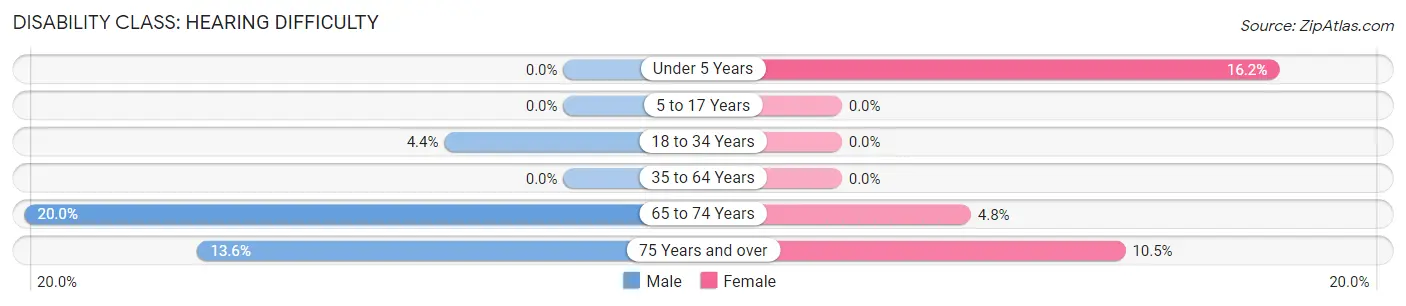
| Age Bracket | Male | Female |
| Under 5 Years | 0 (0.0%) | 31 (16.2%) |
| 5 to 17 Years | 0 (0.0%) | 0 (0.0%) |
| 18 to 34 Years | 15 (4.4%) | 0 (0.0%) |
| 35 to 64 Years | 0 (0.0%) | 0 (0.0%) |
| 65 to 74 Years | 35 (20.0%) | 9 (4.8%) |
| 75 Years and over | 11 (13.6%) | 10 (10.5%) |
Disability Class: Vision Difficulty
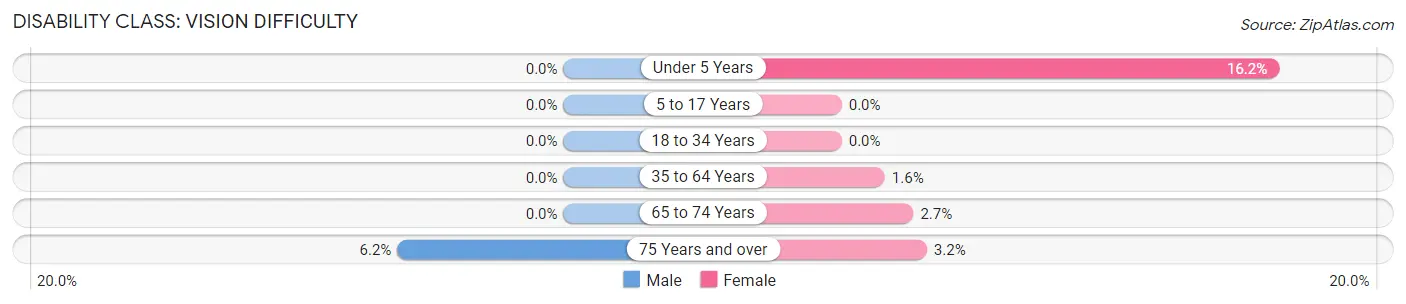
| Age Bracket | Male | Female |
| Under 5 Years | 0 (0.0%) | 31 (16.2%) |
| 5 to 17 Years | 0 (0.0%) | 0 (0.0%) |
| 18 to 34 Years | 0 (0.0%) | 0 (0.0%) |
| 35 to 64 Years | 0 (0.0%) | 9 (1.6%) |
| 65 to 74 Years | 0 (0.0%) | 5 (2.7%) |
| 75 Years and over | 5 (6.2%) | 3 (3.2%) |
Disability Class: Cognitive Difficulty
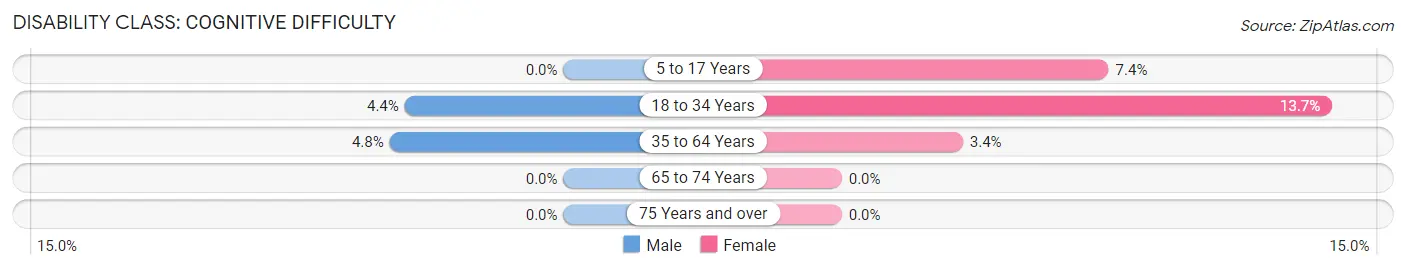
| Age Bracket | Male | Female |
| 5 to 17 Years | 0 (0.0%) | 20 (7.4%) |
| 18 to 34 Years | 15 (4.4%) | 37 (13.7%) |
| 35 to 64 Years | 29 (4.8%) | 19 (3.4%) |
| 65 to 74 Years | 0 (0.0%) | 0 (0.0%) |
| 75 Years and over | 0 (0.0%) | 0 (0.0%) |
Disability Class: Ambulatory Difficulty
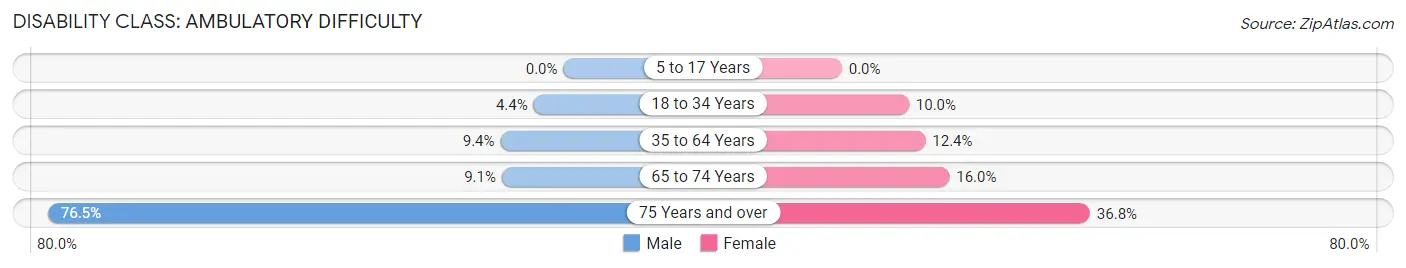
| Age Bracket | Male | Female |
| 5 to 17 Years | 0 (0.0%) | 0 (0.0%) |
| 18 to 34 Years | 15 (4.4%) | 27 (10.0%) |
| 35 to 64 Years | 56 (9.3%) | 70 (12.4%) |
| 65 to 74 Years | 16 (9.1%) | 30 (16.0%) |
| 75 Years and over | 62 (76.5%) | 35 (36.8%) |
Disability Class: Self-Care Difficulty
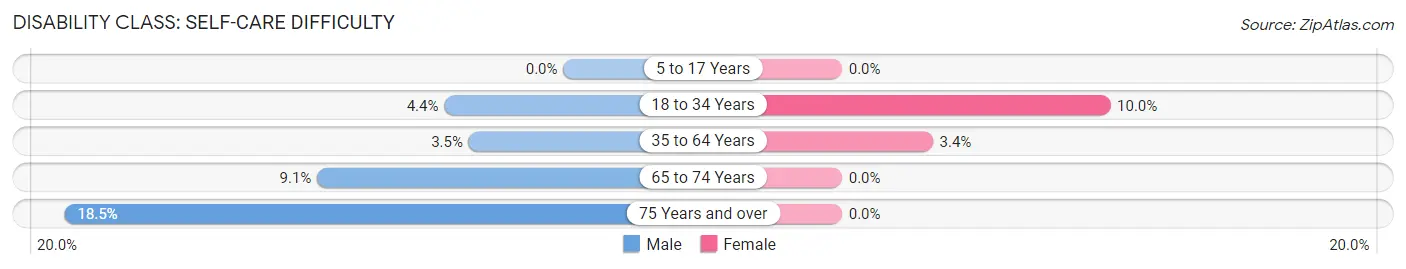
| Age Bracket | Male | Female |
| 5 to 17 Years | 0 (0.0%) | 0 (0.0%) |
| 18 to 34 Years | 15 (4.4%) | 27 (10.0%) |
| 35 to 64 Years | 21 (3.5%) | 19 (3.4%) |
| 65 to 74 Years | 16 (9.1%) | 0 (0.0%) |
| 75 Years and over | 15 (18.5%) | 0 (0.0%) |
Technology Access in Reno city Parker and Tarrant Counties
Computing Device Access in Reno city Parker and Tarrant Counties
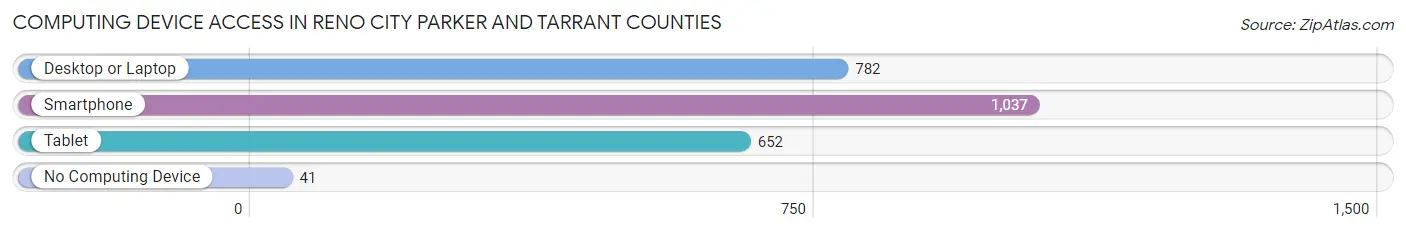
| Device Type | # Households | % Households |
| Desktop or Laptop | 782 | 70.9% |
| Smartphone | 1,037 | 94.0% |
| Tablet | 652 | 59.1% |
| No Computing Device | 41 | 3.7% |
| Total | 1,103 | 100.0% |
Internet Access in Reno city Parker and Tarrant Counties
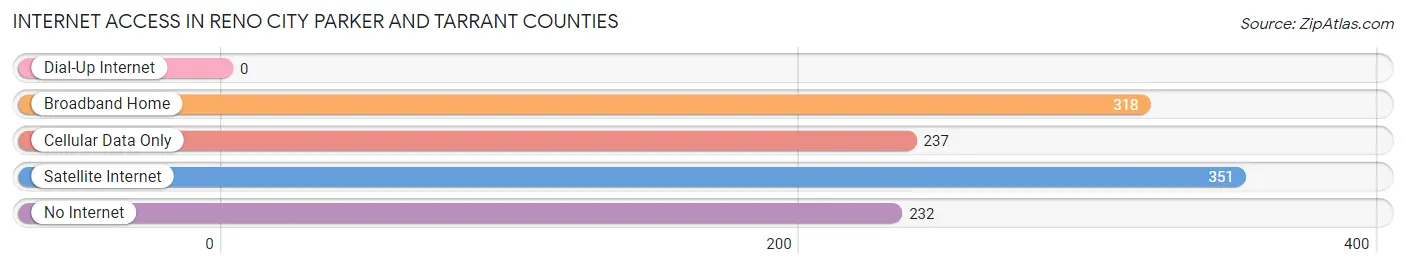
| Internet Type | # Households | % Households |
| Dial-Up Internet | 0 | 0.0% |
| Broadband Home | 318 | 28.8% |
| Cellular Data Only | 237 | 21.5% |
| Satellite Internet | 351 | 31.8% |
| No Internet | 232 | 21.0% |
| Total | 1,103 | 100.0% |
Reno city Parker and Tarrant Counties Summary
Reno City Parker and Tarrant Counties, Texas, are two counties located in the north-central part of the state. The two counties are part of the Dallas-Fort Worth-Arlington metropolitan area, and together they form a large and diverse region. This region is home to a variety of industries, including manufacturing, retail, and healthcare, and is a major hub for transportation and logistics.
Geography
Reno City Parker and Tarrant Counties are located in the north-central part of Texas, and are part of the Dallas-Fort Worth-Arlington metropolitan area. The two counties are bordered by Collin County to the north, Dallas County to the east, Ellis County to the south, and Johnson County to the west. The two counties have a combined area of 1,845 square miles, and are home to a population of over 2.5 million people.
The terrain of the two counties is mostly flat, with some rolling hills in the western part of the region. The climate is generally hot and humid in the summer months, and mild in the winter months. The average annual precipitation is around 35 inches, and the average annual temperature is around 70 degrees Fahrenheit.
Economy
Reno City Parker and Tarrant Counties have a diverse economy, with a variety of industries represented. The two counties are home to a number of large corporations, including American Airlines, AT&T, and Lockheed Martin. The region is also home to a number of smaller businesses, including retail stores, restaurants, and healthcare providers.
The two counties are a major hub for transportation and logistics, with a number of major highways and railroads running through the region. The region is also home to Dallas/Fort Worth International Airport, one of the busiest airports in the world.
Demographics
Reno City Parker and Tarrant Counties have a population of over 2.5 million people, with a population density of 1,400 people per square mile. The population is fairly diverse, with a mix of races and ethnicities represented. The largest racial group is White, making up around 60% of the population, followed by Hispanic or Latino (20%), African American (15%), and Asian (5%).
The median household income in the two counties is around $60,000, and the median home value is around $200,000. The unemployment rate is around 4%, and the poverty rate is around 11%.
Conclusion
Reno City Parker and Tarrant Counties, Texas, are two counties located in the north-central part of the state. The two counties are part of the Dallas-Fort Worth-Arlington metropolitan area, and together they form a large and diverse region. The two counties have a diverse economy, with a variety of industries represented, and are a major hub for transportation and logistics. The population of the two counties is over 2.5 million people, with a mix of races and ethnicities represented. The median household income is around $60,000, and the median home value is around $200,000.
Common Questions
What is Per Capita Income in Reno city Parker and Tarrant Counties?
Per Capita income in Reno city Parker and Tarrant Counties is $32,790.
What is the Median Family Income in Reno city Parker and Tarrant Counties?
Median Family Income in Reno city Parker and Tarrant Counties is $81,549.
What is the Median Household income in Reno city Parker and Tarrant Counties?
Median Household Income in Reno city Parker and Tarrant Counties is $76,027.
What is Income or Wage Gap in Reno city Parker and Tarrant Counties?
Income or Wage Gap in Reno city Parker and Tarrant Counties is 43.8%.
Women in Reno city Parker and Tarrant Counties earn 56.2 cents for every dollar earned by a man.
What is Inequality or Gini Index in Reno city Parker and Tarrant Counties?
Inequality or Gini Index in Reno city Parker and Tarrant Counties is 0.40.
What is the Total Population of Reno city Parker and Tarrant Counties?
Total Population of Reno city Parker and Tarrant Counties is 3,034.
What is the Total Male Population of Reno city Parker and Tarrant Counties?
Total Male Population of Reno city Parker and Tarrant Counties is 1,456.
What is the Total Female Population of Reno city Parker and Tarrant Counties?
Total Female Population of Reno city Parker and Tarrant Counties is 1,578.
What is the Ratio of Males per 100 Females in Reno city Parker and Tarrant Counties?
There are 92.27 Males per 100 Females in Reno city Parker and Tarrant Counties.
What is the Ratio of Females per 100 Males in Reno city Parker and Tarrant Counties?
There are 108.38 Females per 100 Males in Reno city Parker and Tarrant Counties.
What is the Median Population Age in Reno city Parker and Tarrant Counties?
Median Population Age in Reno city Parker and Tarrant Counties is 38.0 Years.
What is the Average Family Size in Reno city Parker and Tarrant Counties
Average Family Size in Reno city Parker and Tarrant Counties is 3.2 People.
What is the Average Household Size in Reno city Parker and Tarrant Counties
Average Household Size in Reno city Parker and Tarrant Counties is 2.8 People.
How Large is the Labor Force in Reno city Parker and Tarrant Counties?
There are 1,439 People in the Labor Forcein in Reno city Parker and Tarrant Counties.
What is the Percentage of People in the Labor Force in Reno city Parker and Tarrant Counties?
58.2% of People are in the Labor Force in Reno city Parker and Tarrant Counties.
What is the Unemployment Rate in Reno city Parker and Tarrant Counties?
Unemployment Rate in Reno city Parker and Tarrant Counties is 5.3%.