Moore Station, TX Map & Demographics
Moore Station Map
Moore Station Overview
$26,553
PER CAPITA INCOME
$57,250
AVG FAMILY INCOME
$47,500
AVG HOUSEHOLD INCOME
39.5%
WAGE / INCOME GAP [ % ]
60.5¢/ $1
WAGE / INCOME GAP [ $ ]
0.39
INEQUALITY / GINI INDEX
189
TOTAL POPULATION
101
MALE POPULATION
88
FEMALE POPULATION
114.77
MALES / 100 FEMALES
87.13
FEMALES / 100 MALES
54.1
MEDIAN AGE
2.8
AVG FAMILY SIZE
2.2
AVG HOUSEHOLD SIZE
69
LABOR FORCE [ PEOPLE ]
41.1%
PERCENT IN LABOR FORCE
1.4%
UNEMPLOYMENT RATE
Income in Moore Station
Income Overview in Moore Station
Per Capita Income in Moore Station is $26,553, while median incomes of families and households are $57,250 and $47,500 respectively.
| Characteristic | Number | Measure |
| Per Capita Income | 189 | $26,553 |
| Median Family Income | 57 | $57,250 |
| Mean Family Income | 57 | $65,719 |
| Median Household Income | 84 | $47,500 |
| Mean Household Income | 84 | $55,983 |
| Income Deficit | 57 | $0 |
| Wage / Income Gap (%) | 189 | 39.53% |
| Wage / Income Gap ($) | 189 | 60.47¢ per $1 |
| Gini / Inequality Index | 189 | 0.39 |
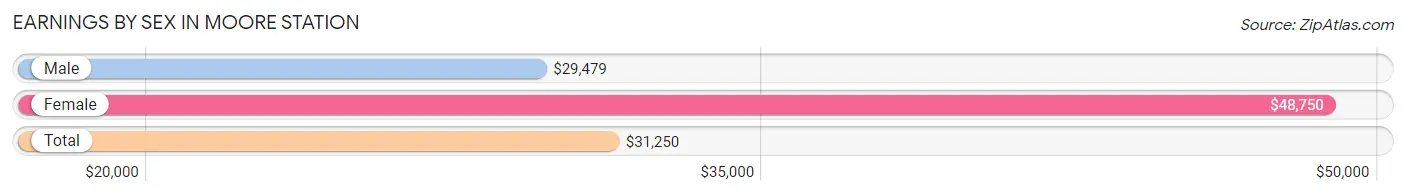
Earnings by Sex in Moore Station
Average Earnings in Moore Station are $31,250, $29,479 for men and $48,750 for women, a difference of 39.5%.
| Sex | Number | Average Earnings |
| Male | 55 (75.3%) | $29,479 |
| Female | 18 (24.7%) | $48,750 |
| Total | 73 (100.0%) | $31,250 |
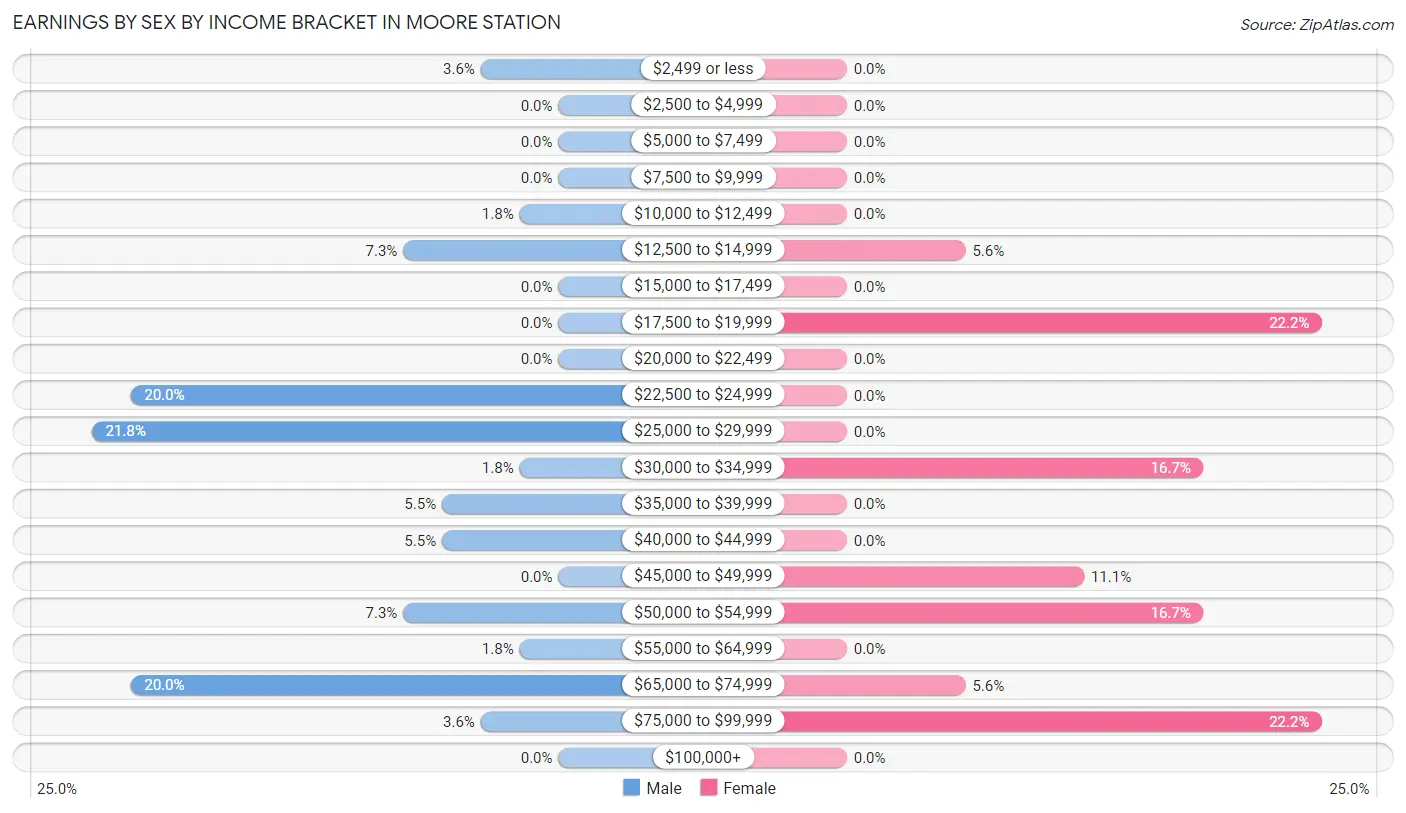
Earnings by Sex by Income Bracket in Moore Station
The most common earnings brackets in Moore Station are $25,000 to $29,999 for men (12 | 21.8%) and $17,500 to $19,999 for women (4 | 22.2%).
| Income | Male | Female |
| $2,499 or less | 2 (3.6%) | 0 (0.0%) |
| $2,500 to $4,999 | 0 (0.0%) | 0 (0.0%) |
| $5,000 to $7,499 | 0 (0.0%) | 0 (0.0%) |
| $7,500 to $9,999 | 0 (0.0%) | 0 (0.0%) |
| $10,000 to $12,499 | 1 (1.8%) | 0 (0.0%) |
| $12,500 to $14,999 | 4 (7.3%) | 1 (5.6%) |
| $15,000 to $17,499 | 0 (0.0%) | 0 (0.0%) |
| $17,500 to $19,999 | 0 (0.0%) | 4 (22.2%) |
| $20,000 to $22,499 | 0 (0.0%) | 0 (0.0%) |
| $22,500 to $24,999 | 11 (20.0%) | 0 (0.0%) |
| $25,000 to $29,999 | 12 (21.8%) | 0 (0.0%) |
| $30,000 to $34,999 | 1 (1.8%) | 3 (16.7%) |
| $35,000 to $39,999 | 3 (5.4%) | 0 (0.0%) |
| $40,000 to $44,999 | 3 (5.4%) | 0 (0.0%) |
| $45,000 to $49,999 | 0 (0.0%) | 2 (11.1%) |
| $50,000 to $54,999 | 4 (7.3%) | 3 (16.7%) |
| $55,000 to $64,999 | 1 (1.8%) | 0 (0.0%) |
| $65,000 to $74,999 | 11 (20.0%) | 1 (5.6%) |
| $75,000 to $99,999 | 2 (3.6%) | 4 (22.2%) |
| $100,000+ | 0 (0.0%) | 0 (0.0%) |
| Total | 55 (100.0%) | 18 (100.0%) |
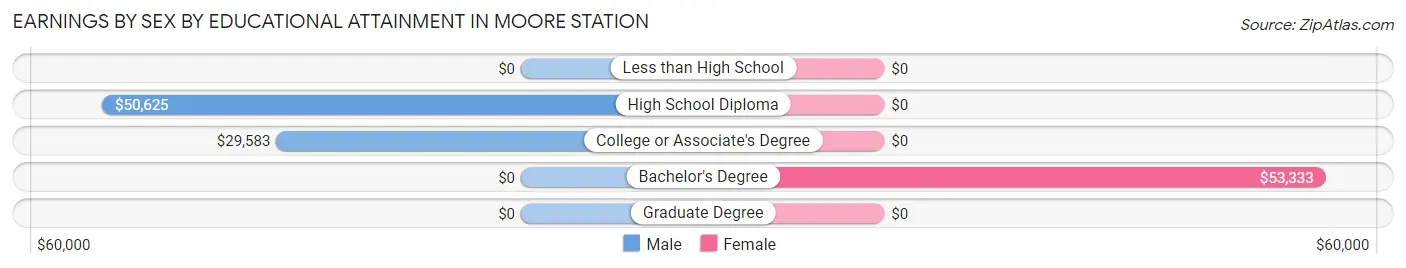
Earnings by Sex by Educational Attainment in Moore Station
Average earnings in Moore Station are $31,250 for men and $48,750 for women, a difference of 35.9%. Men with an educational attainment of high school diploma enjoy the highest average annual earnings of $50,625, while those with college or associate's degree education earn the least with $29,583. Women with an educational attainment of bachelor's degree earn the most with the average annual earnings of $53,333, while those with bachelor's degree education have the smallest earnings of $53,333.
| Educational Attainment | Male Income | Female Income |
| Less than High School | - | - |
| High School Diploma | $50,625 | $0 |
| College or Associate's Degree | $29,583 | $0 |
| Bachelor's Degree | - | - |
| Graduate Degree | - | - |
| Total | $31,250 | $48,750 |
Family Income in Moore Station
Family Income Brackets in Moore Station
According to the Moore Station family income data, there are 18 families falling into the $50,000 to $74,999 income range, which is the most common income bracket and makes up 31.6% of all families.
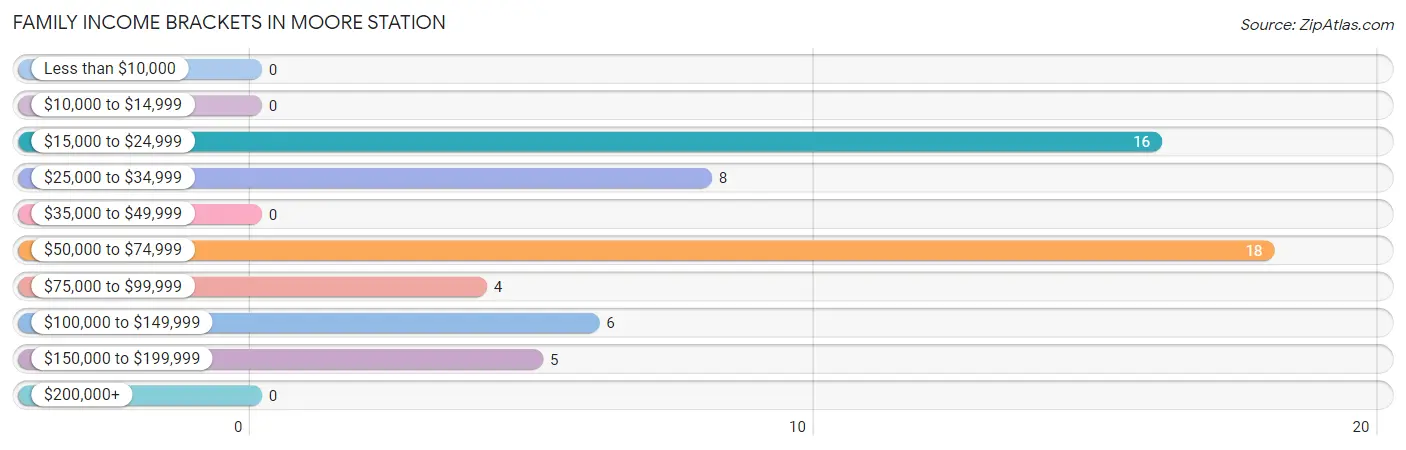
| Income Bracket | # Families | % Families |
| Less than $10,000 | 0 | 0.0% |
| $10,000 to $14,999 | 0 | 0.0% |
| $15,000 to $24,999 | 16 | 28.1% |
| $25,000 to $34,999 | 8 | 14.0% |
| $35,000 to $49,999 | 0 | 0.0% |
| $50,000 to $74,999 | 18 | 31.6% |
| $75,000 to $99,999 | 4 | 7.0% |
| $100,000 to $149,999 | 6 | 10.5% |
| $150,000 to $199,999 | 5 | 8.8% |
| $200,000+ | 0 | 0.0% |
Family Income by Famaliy Size in Moore Station
4-person families (6 | 10.5%) account for the highest median family income in Moore Station with $74,375 per family, while 4-person families (6 | 10.5%) have the highest median income of $18,594 per family member.
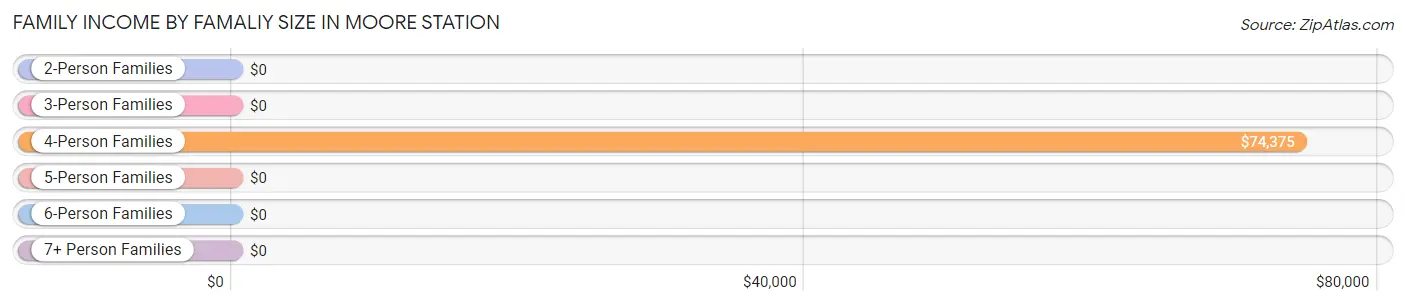
| Income Bracket | # Families | Median Income |
| 2-Person Families | 44 (77.2%) | $0 |
| 3-Person Families | 5 (8.8%) | $0 |
| 4-Person Families | 6 (10.5%) | $74,375 |
| 5-Person Families | 0 (0.0%) | $0 |
| 6-Person Families | 2 (3.5%) | $0 |
| 7+ Person Families | 0 (0.0%) | $0 |
| Total | 57 (100.0%) | $57,250 |
Family Income by Number of Earners in Moore Station
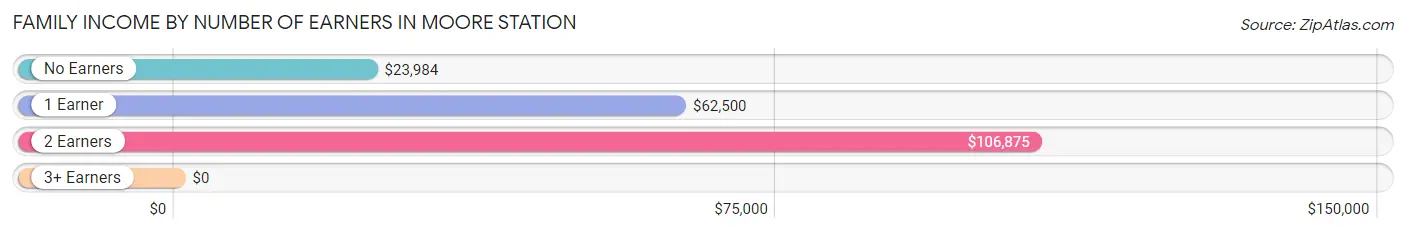
| Number of Earners | # Families | Median Income |
| No Earners | 19 (33.3%) | $23,984 |
| 1 Earner | 26 (45.6%) | $62,500 |
| 2 Earners | 9 (15.8%) | $106,875 |
| 3+ Earners | 3 (5.3%) | $0 |
| Total | 57 (100.0%) | $57,250 |
Household Income in Moore Station
Household Income Brackets in Moore Station
With 26 households falling in the category, the $50,000 to $74,999 income range is the most frequent in Moore Station, accounting for 30.9% of all households.
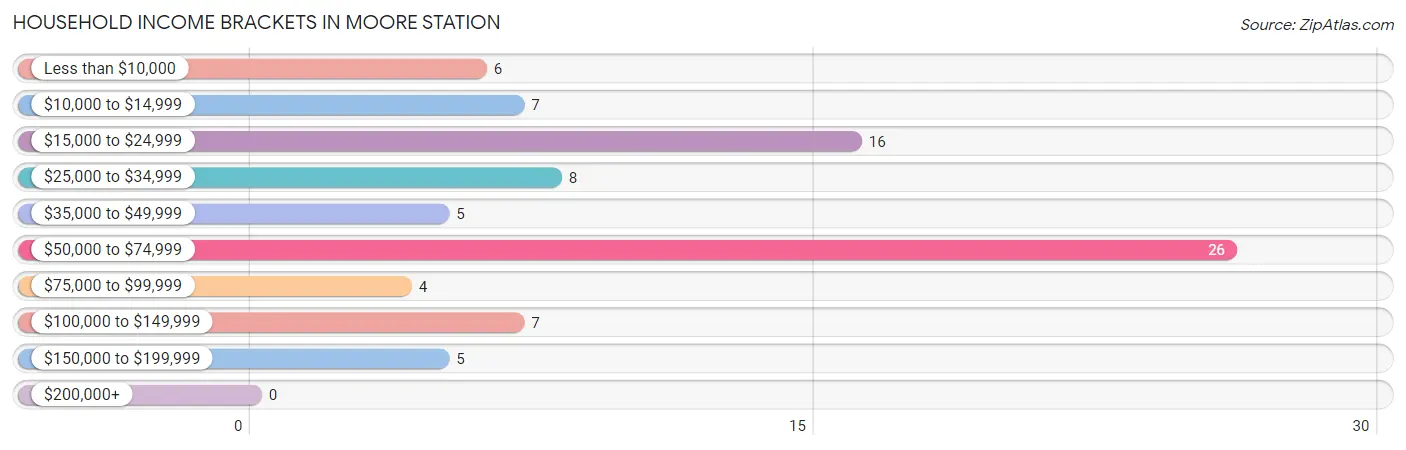
| Income Bracket | # Households | % Households |
| Less than $10,000 | 6 | 7.1% |
| $10,000 to $14,999 | 7 | 8.3% |
| $15,000 to $24,999 | 16 | 19.0% |
| $25,000 to $34,999 | 8 | 9.5% |
| $35,000 to $49,999 | 5 | 6.0% |
| $50,000 to $74,999 | 26 | 31.0% |
| $75,000 to $99,999 | 4 | 4.8% |
| $100,000 to $149,999 | 7 | 8.3% |
| $150,000 to $199,999 | 5 | 6.0% |
| $200,000+ | 0 | 0.0% |
Household Income by Householder Age in Moore Station
The median household income in Moore Station is $47,500, with the highest median household income of $65,938 found in the 25 to 44 years age bracket for the primary householder. A total of 14 households (16.7%) fall into this category.
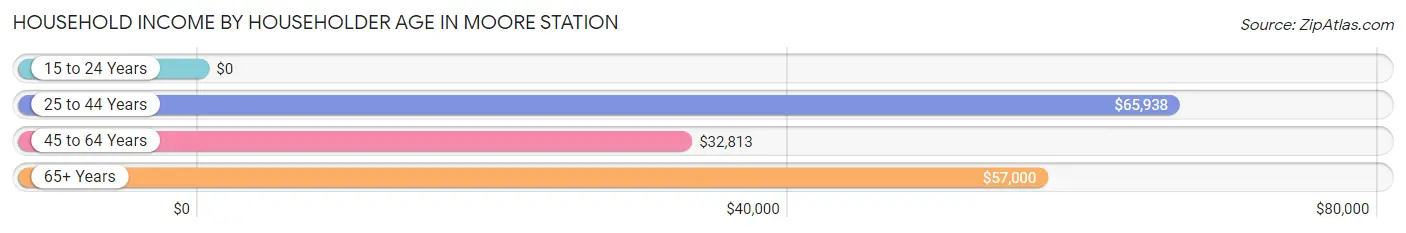
| Income Bracket | # Households | Median Income |
| 15 to 24 Years | 0 (0.0%) | $0 |
| 25 to 44 Years | 14 (16.7%) | $65,938 |
| 45 to 64 Years | 34 (40.5%) | $32,813 |
| 65+ Years | 36 (42.9%) | $57,000 |
| Total | 84 (100.0%) | $47,500 |
Poverty in Moore Station
Income Below Poverty by Sex and Age in Moore Station
With 5.9% poverty level for males and 9.1% for females among the residents of Moore Station, 75 year old and over males and 75 year old and over females are the most vulnerable to poverty, with 2 males (25.0%) and 7 females (46.7%) in their respective age groups living below the poverty level.
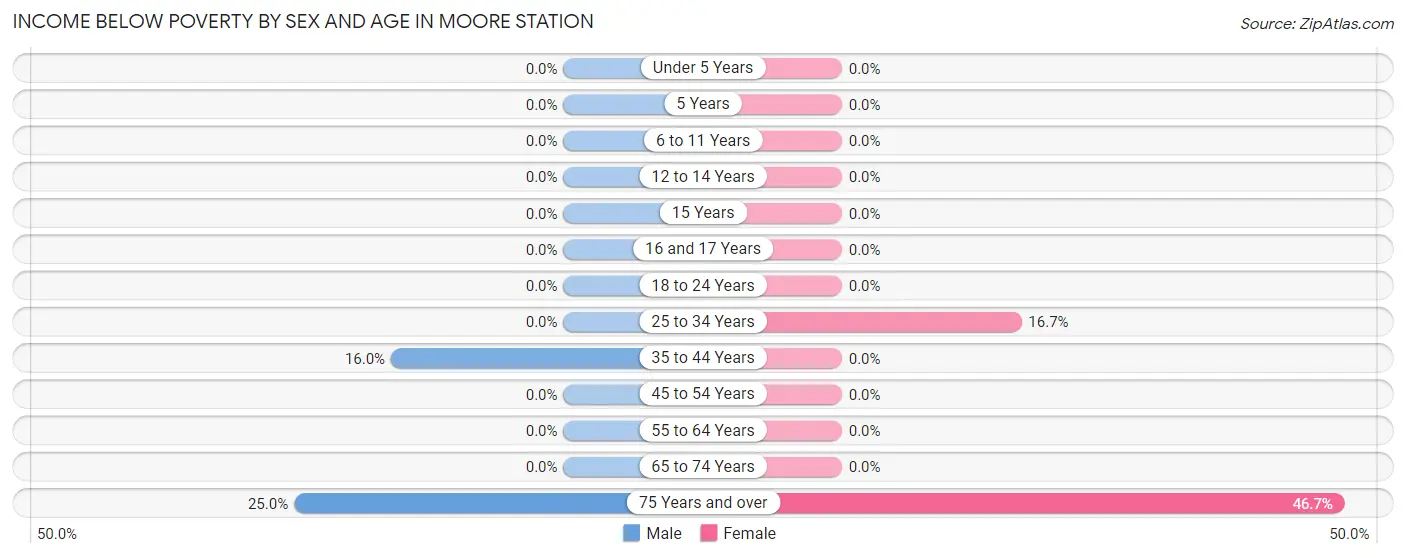
| Age Bracket | Male | Female |
| Under 5 Years | 0 (0.0%) | 0 (0.0%) |
| 5 Years | 0 (0.0%) | 0 (0.0%) |
| 6 to 11 Years | 0 (0.0%) | 0 (0.0%) |
| 12 to 14 Years | 0 (0.0%) | 0 (0.0%) |
| 15 Years | 0 (0.0%) | 0 (0.0%) |
| 16 and 17 Years | 0 (0.0%) | 0 (0.0%) |
| 18 to 24 Years | 0 (0.0%) | 0 (0.0%) |
| 25 to 34 Years | 0 (0.0%) | 1 (16.7%) |
| 35 to 44 Years | 4 (16.0%) | 0 (0.0%) |
| 45 to 54 Years | 0 (0.0%) | 0 (0.0%) |
| 55 to 64 Years | 0 (0.0%) | 0 (0.0%) |
| 65 to 74 Years | 0 (0.0%) | 0 (0.0%) |
| 75 Years and over | 2 (25.0%) | 7 (46.7%) |
| Total | 6 (5.9%) | 8 (9.1%) |
Income Above Poverty by Sex and Age in Moore Station
According to the poverty statistics in Moore Station, males aged 6 to 11 years and females aged under 5 years are the age groups that are most secure financially, with 100.0% of males and 100.0% of females in these age groups living above the poverty line.
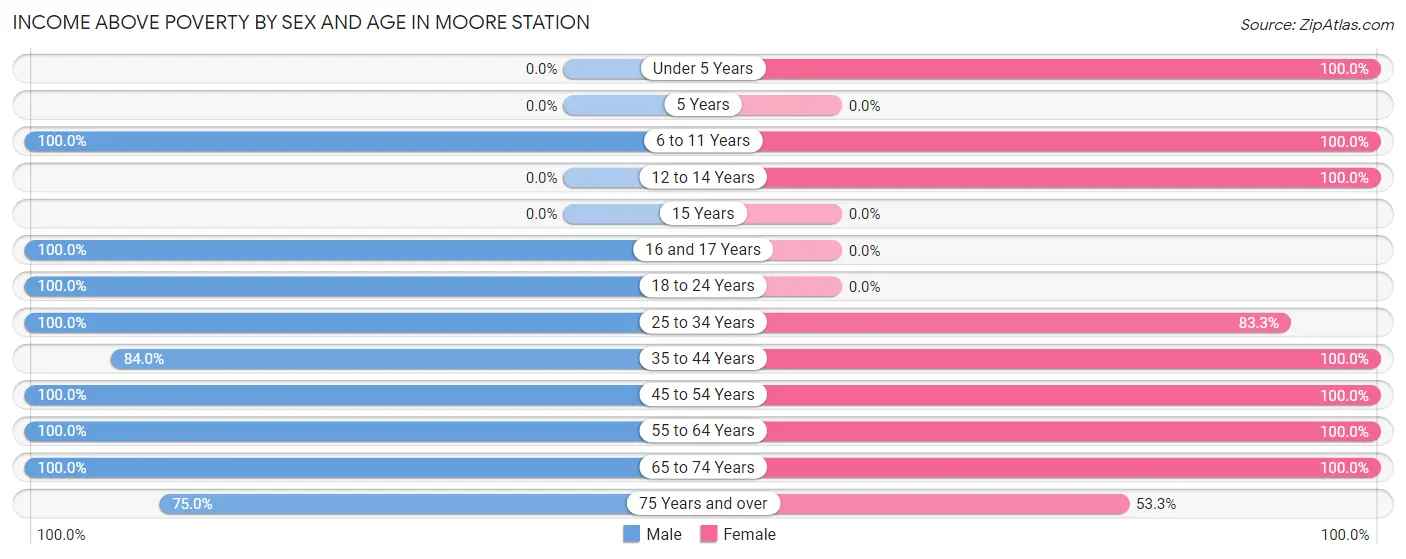
| Age Bracket | Male | Female |
| Under 5 Years | 0 (0.0%) | 11 (100.0%) |
| 5 Years | 0 (0.0%) | 0 (0.0%) |
| 6 to 11 Years | 6 (100.0%) | 2 (100.0%) |
| 12 to 14 Years | 0 (0.0%) | 2 (100.0%) |
| 15 Years | 0 (0.0%) | 0 (0.0%) |
| 16 and 17 Years | 2 (100.0%) | 0 (0.0%) |
| 18 to 24 Years | 4 (100.0%) | 0 (0.0%) |
| 25 to 34 Years | 18 (100.0%) | 5 (83.3%) |
| 35 to 44 Years | 21 (84.0%) | 1 (100.0%) |
| 45 to 54 Years | 12 (100.0%) | 10 (100.0%) |
| 55 to 64 Years | 9 (100.0%) | 29 (100.0%) |
| 65 to 74 Years | 17 (100.0%) | 12 (100.0%) |
| 75 Years and over | 6 (75.0%) | 8 (53.3%) |
| Total | 95 (94.1%) | 80 (90.9%) |
Income Below Poverty Among Married-Couple Families in Moore Station
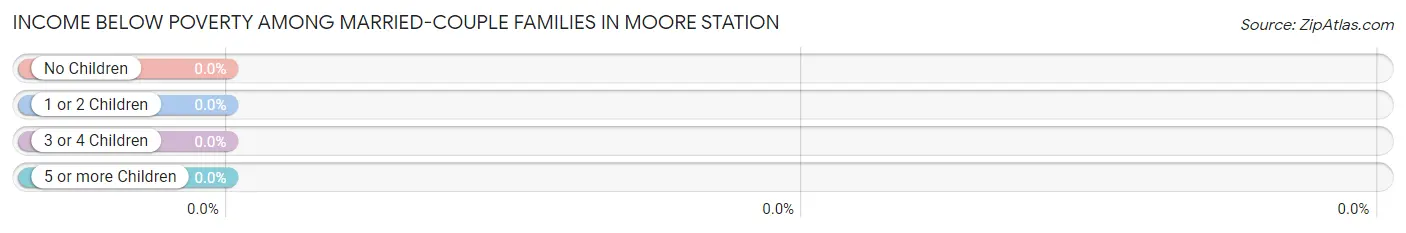
| Children | Above Poverty | Below Poverty |
| No Children | 31 (100.0%) | 0 (0.0%) |
| 1 or 2 Children | 11 (100.0%) | 0 (0.0%) |
| 3 or 4 Children | 0 (0.0%) | 0 (0.0%) |
| 5 or more Children | 0 (0.0%) | 0 (0.0%) |
| Total | 42 (100.0%) | 0 (0.0%) |
Income Below Poverty Among Single-Parent Households in Moore Station
| Children | Single Father | Single Mother |
| No Children | 0 (0.0%) | 0 (0.0%) |
| 1 or 2 Children | 0 (0.0%) | 0 (0.0%) |
| 3 or 4 Children | 0 (0.0%) | 0 (0.0%) |
| 5 or more Children | 0 (0.0%) | 0 (0.0%) |
| Total | 0 (0.0%) | 0 (0.0%) |
Income Below Poverty Among Married-Couple vs Single-Parent Households in Moore Station
| Children | Married-Couple Families | Single-Parent Households |
| No Children | 0 (0.0%) | 0 (0.0%) |
| 1 or 2 Children | 0 (0.0%) | 0 (0.0%) |
| 3 or 4 Children | 0 (0.0%) | 0 (0.0%) |
| 5 or more Children | 0 (0.0%) | 0 (0.0%) |
| Total | 0 (0.0%) | 0 (0.0%) |
Race in Moore Station
The most populous races in Moore Station are Black / African American (170 | 89.9%), and White / Caucasian (19 | 10.1%).
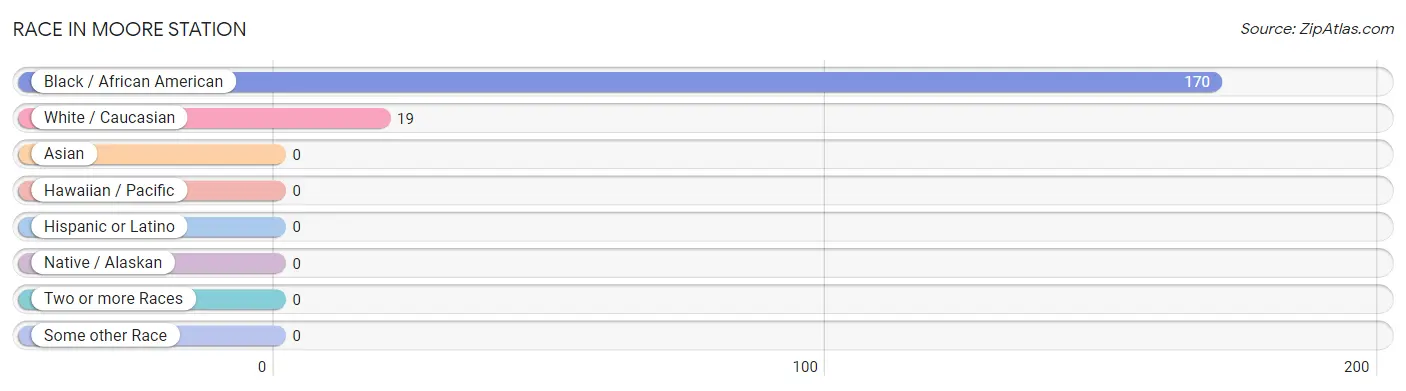
| Race | # Population | % Population |
| Asian | 0 | 0.0% |
| Black / African American | 170 | 89.9% |
| Hawaiian / Pacific | 0 | 0.0% |
| Hispanic or Latino | 0 | 0.0% |
| Native / Alaskan | 0 | 0.0% |
| White / Caucasian | 19 | 10.1% |
| Two or more Races | 0 | 0.0% |
| Some other Race | 0 | 0.0% |
| Total | 189 | 100.0% |
Ancestry in Moore Station
The most populous ancestries reported in Moore Station are American (25 | 13.2%), English (2 | 1.1%), German (2 | 1.1%), Northern European (2 | 1.1%), and British (1 | 0.5%), together accounting for 16.9% of all Moore Station residents.
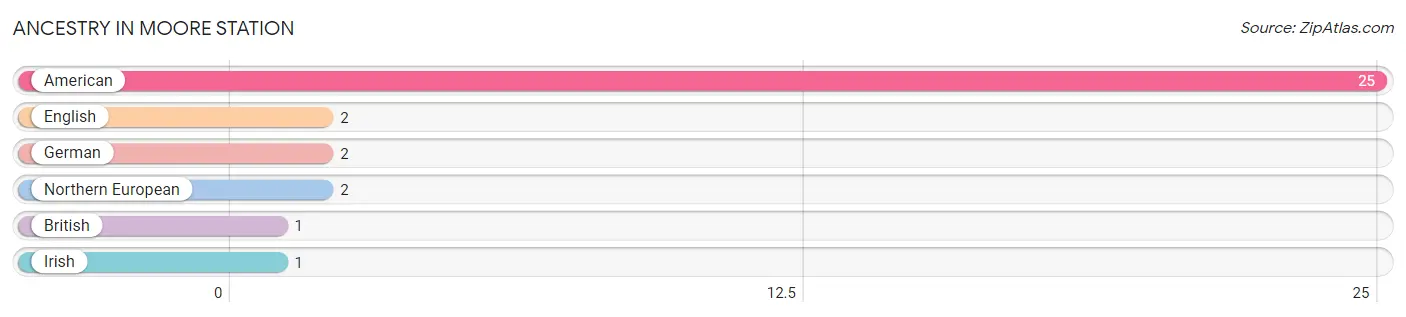
| Ancestry | # Population | % Population |
| American | 25 | 13.2% |
| British | 1 | 0.5% |
| English | 2 | 1.1% |
| German | 2 | 1.1% |
| Irish | 1 | 0.5% |
| Northern European | 2 | 1.1% | View All 6 Rows |
Immigrants in Moore Station

| Immigration Origin | # Population | % Population | View All 0 Rows |
Sex and Age in Moore Station
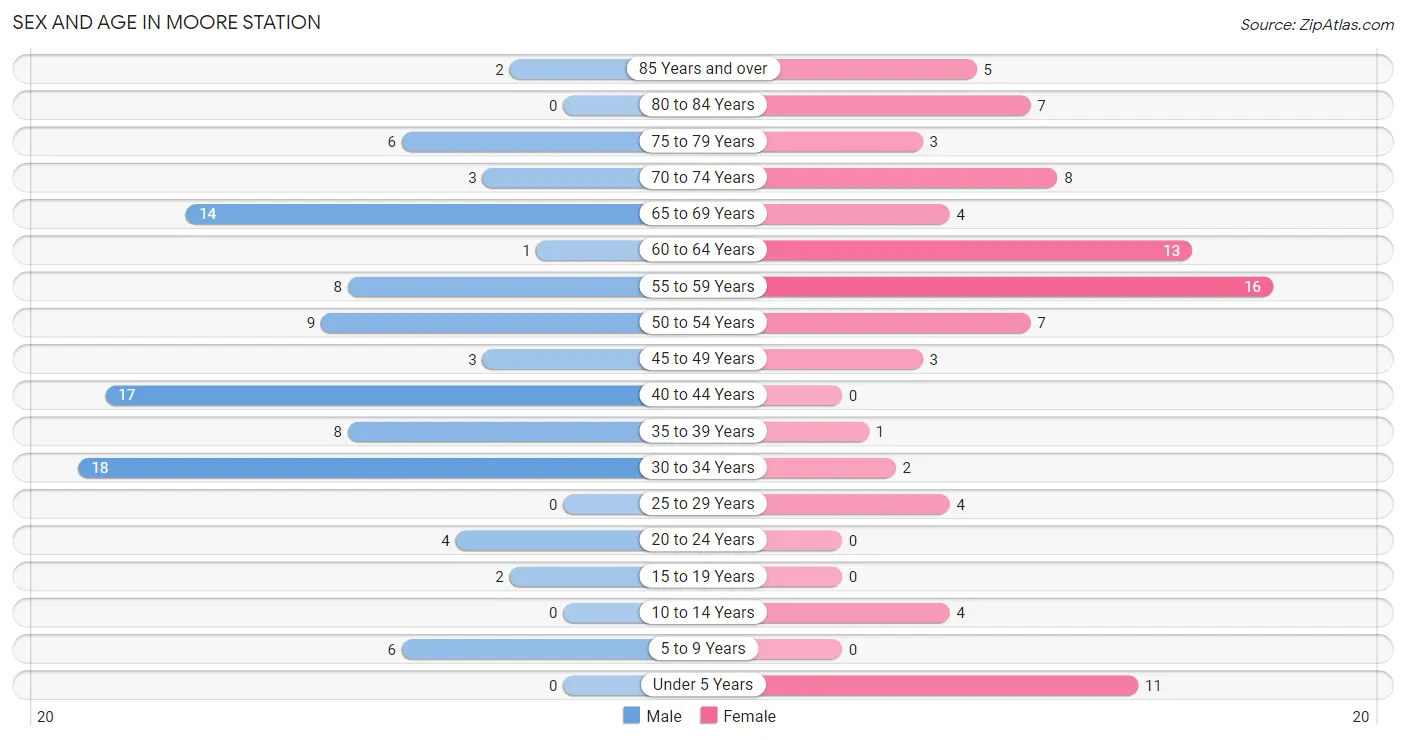
Sex and Age in Moore Station
The most populous age groups in Moore Station are 30 to 34 Years (18 | 17.8%) for men and 55 to 59 Years (16 | 18.2%) for women.
| Age Bracket | Male | Female |
| Under 5 Years | 0 (0.0%) | 11 (12.5%) |
| 5 to 9 Years | 6 (5.9%) | 0 (0.0%) |
| 10 to 14 Years | 0 (0.0%) | 4 (4.5%) |
| 15 to 19 Years | 2 (2.0%) | 0 (0.0%) |
| 20 to 24 Years | 4 (4.0%) | 0 (0.0%) |
| 25 to 29 Years | 0 (0.0%) | 4 (4.5%) |
| 30 to 34 Years | 18 (17.8%) | 2 (2.3%) |
| 35 to 39 Years | 8 (7.9%) | 1 (1.1%) |
| 40 to 44 Years | 17 (16.8%) | 0 (0.0%) |
| 45 to 49 Years | 3 (3.0%) | 3 (3.4%) |
| 50 to 54 Years | 9 (8.9%) | 7 (8.0%) |
| 55 to 59 Years | 8 (7.9%) | 16 (18.2%) |
| 60 to 64 Years | 1 (1.0%) | 13 (14.8%) |
| 65 to 69 Years | 14 (13.9%) | 4 (4.5%) |
| 70 to 74 Years | 3 (3.0%) | 8 (9.1%) |
| 75 to 79 Years | 6 (5.9%) | 3 (3.4%) |
| 80 to 84 Years | 0 (0.0%) | 7 (8.0%) |
| 85 Years and over | 2 (2.0%) | 5 (5.7%) |
| Total | 101 (100.0%) | 88 (100.0%) |
Families and Households in Moore Station
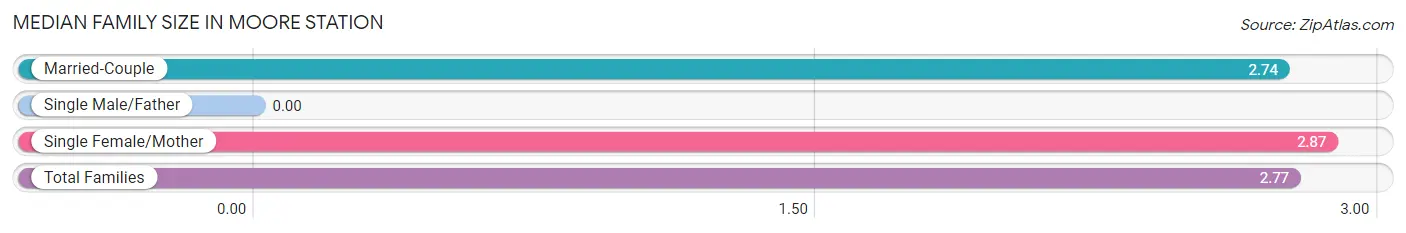
Median Family Size in Moore Station
| Family Type | # Families | Family Size |
| Married-Couple | 42 (73.7%) | 2.74 |
| Single Male/Father | 0 (0.0%) | - |
| Single Female/Mother | 15 (26.3%) | 2.87 |
| Total Families | 57 (100.0%) | 2.77 |
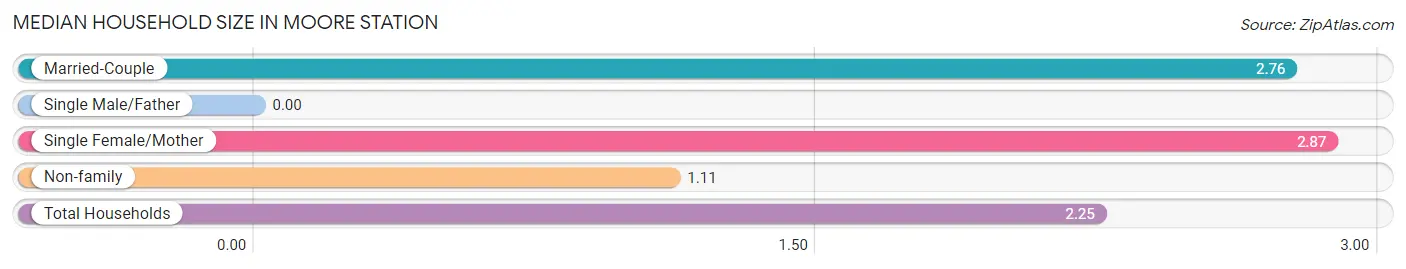
Median Household Size in Moore Station
| Household Type | # Households | Household Size |
| Married-Couple | 42 (50.0%) | 2.76 |
| Single Male/Father | 0 (0.0%) | - |
| Single Female/Mother | 15 (17.9%) | 2.87 |
| Non-family | 27 (32.1%) | 1.11 |
| Total Households | 84 (100.0%) | 2.25 |
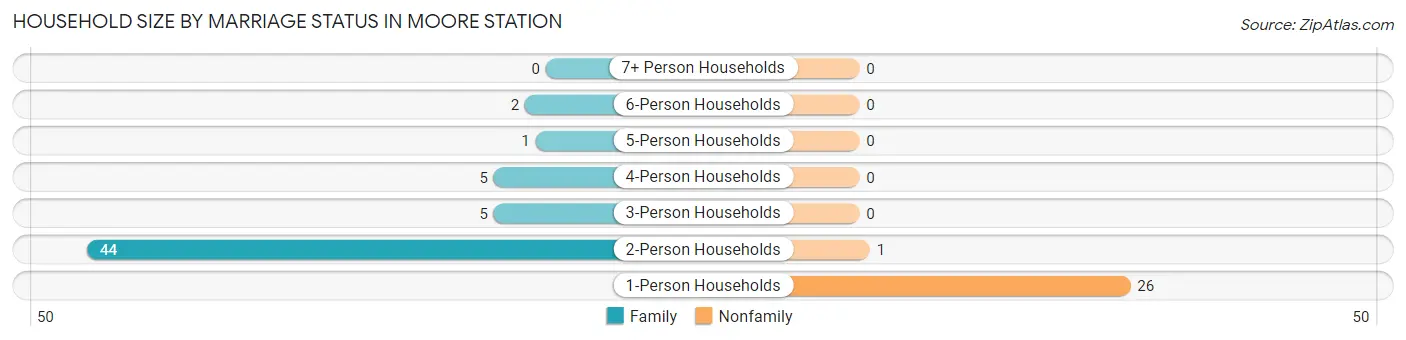
Household Size by Marriage Status in Moore Station
Out of a total of 84 households in Moore Station, 57 (67.9%) are family households, while 27 (32.1%) are nonfamily households. The most numerous type of family households are 2-person households, comprising 44, and the most common type of nonfamily households are 1-person households, comprising 26.
| Household Size | Family Households | Nonfamily Households |
| 1-Person Households | - | 26 (30.9%) |
| 2-Person Households | 44 (52.4%) | 1 (1.2%) |
| 3-Person Households | 5 (5.9%) | 0 (0.0%) |
| 4-Person Households | 5 (5.9%) | 0 (0.0%) |
| 5-Person Households | 1 (1.2%) | 0 (0.0%) |
| 6-Person Households | 2 (2.4%) | 0 (0.0%) |
| 7+ Person Households | 0 (0.0%) | 0 (0.0%) |
| Total | 57 (67.9%) | 27 (32.1%) |
Female Fertility in Moore Station
Fertility by Age in Moore Station
| Age Bracket | Women with Births | Births / 1,000 Women |
| 15 to 19 years | 0 (0.0%) | 0.0 |
| 20 to 34 years | 0 (0.0%) | 0.0 |
| 35 to 50 years | 0 (0.0%) | 0.0 |
| Total | 0 (0.0%) | 0.0 |
Fertility by Age by Marriage Status in Moore Station
| Age Bracket | Married | Unmarried |
| 15 to 19 years | 0 (0.0%) | 0 (0.0%) |
| 20 to 34 years | 0 (0.0%) | 0 (0.0%) |
| 35 to 50 years | 0 (0.0%) | 0 (0.0%) |
| Total | 0 (0.0%) | 0 (0.0%) |
Fertility by Education in Moore Station
| Educational Attainment | Women with Births | Births / 1,000 Women |
| Less than High School | 0 (0.0%) | 0.0 |
| High School Diploma | 0 (0.0%) | 0.0 |
| College or Associate's Degree | 0 (0.0%) | 0.0 |
| Bachelor's Degree | 0 (0.0%) | 0.0 |
| Graduate Degree | 0 (0.0%) | 0.0 |
| Total | 0 (0.0%) | 0.0 |
Fertility by Education by Marriage Status in Moore Station
| Educational Attainment | Married | Unmarried |
| Less than High School | 0 (0.0%) | 0 (0.0%) |
| High School Diploma | 0 (0.0%) | 0 (0.0%) |
| College or Associate's Degree | 0 (0.0%) | 0 (0.0%) |
| Bachelor's Degree | 0 (0.0%) | 0 (0.0%) |
| Graduate Degree | 0 (0.0%) | 0 (0.0%) |
| Total | 0 (0.0%) | 0 (0.0%) |
Employment Characteristics in Moore Station
Employment by Class of Employer in Moore Station
Among the 68 employed individuals in Moore Station, private company employees (48 | 70.6%), local government employees (11 | 16.2%), and not-for-profit organizations (4 | 5.9%) make up the most common classes of employment.
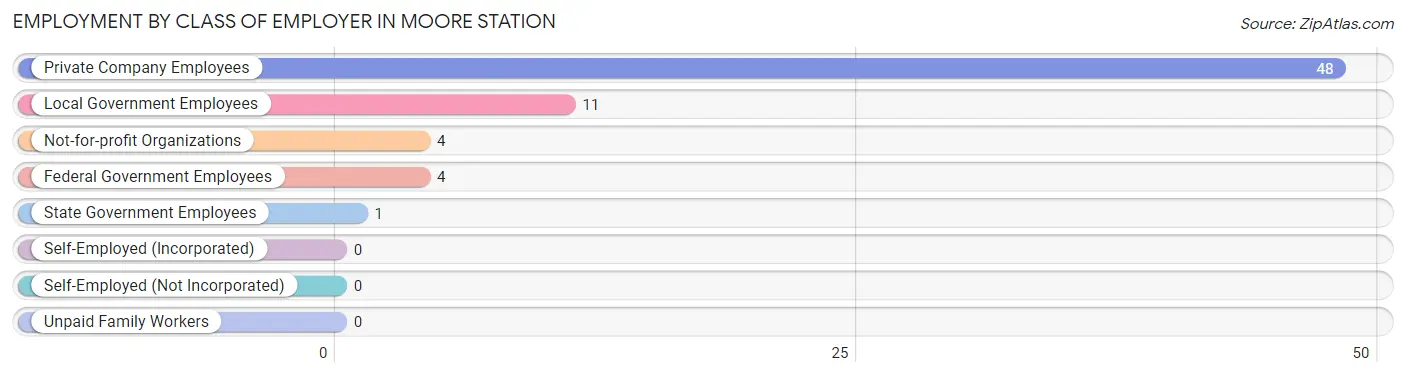
| Employer Class | # Employees | % Employees |
| Private Company Employees | 48 | 70.6% |
| Self-Employed (Incorporated) | 0 | 0.0% |
| Self-Employed (Not Incorporated) | 0 | 0.0% |
| Not-for-profit Organizations | 4 | 5.9% |
| Local Government Employees | 11 | 16.2% |
| State Government Employees | 1 | 1.5% |
| Federal Government Employees | 4 | 5.9% |
| Unpaid Family Workers | 0 | 0.0% |
| Total | 68 | 100.0% |
Employment Status by Age in Moore Station
According to the labor force statistics for Moore Station, out of the total population over 16 years of age (168), 41.1% or 69 individuals are in the labor force, with 1.4% or 1 of them unemployed. The age group with the highest labor force participation rate is 20 to 24 years, with 100.0% or 4 individuals in the labor force. Within the labor force, the 45 to 54 years age range has the highest percentage of unemployed individuals, with 5.0% or 1 of them being unemployed.
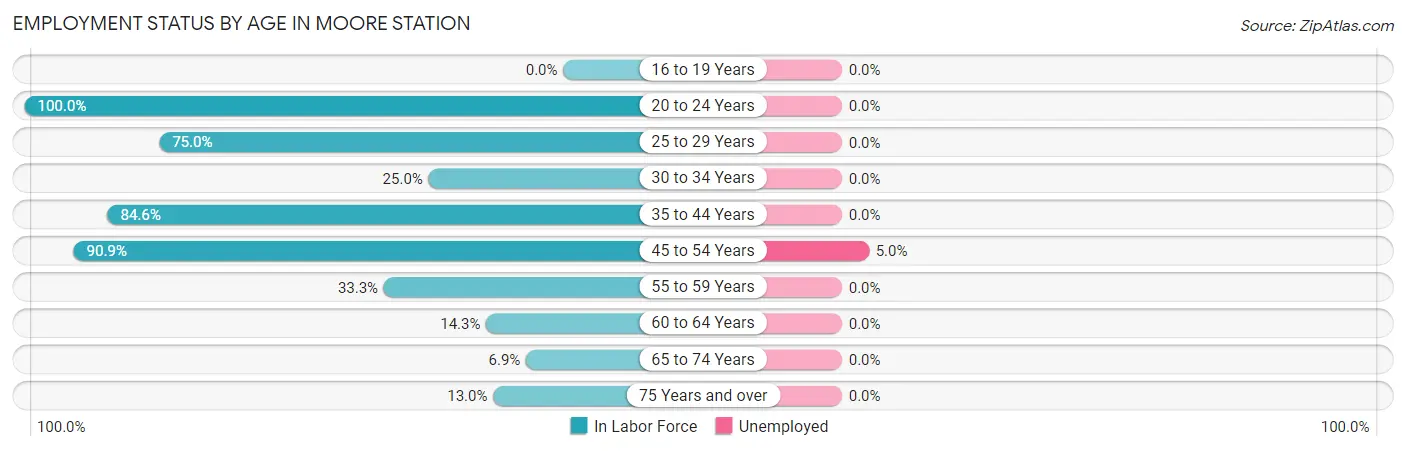
| Age Bracket | In Labor Force | Unemployed |
| 16 to 19 Years | 0 (0.0%) | 0 (0.0%) |
| 20 to 24 Years | 4 (100.0%) | 0 (0.0%) |
| 25 to 29 Years | 3 (75.0%) | 0 (0.0%) |
| 30 to 34 Years | 5 (25.0%) | 0 (0.0%) |
| 35 to 44 Years | 22 (84.6%) | 0 (0.0%) |
| 45 to 54 Years | 20 (90.9%) | 1 (5.0%) |
| 55 to 59 Years | 8 (33.3%) | 0 (0.0%) |
| 60 to 64 Years | 2 (14.3%) | 0 (0.0%) |
| 65 to 74 Years | 2 (6.9%) | 0 (0.0%) |
| 75 Years and over | 3 (13.0%) | 0 (0.0%) |
| Total | 69 (41.1%) | 1 (1.4%) |
Employment Status by Educational Attainment in Moore Station
According to labor force statistics for Moore Station, 54.5% of individuals (60) out of the total population between 25 and 64 years of age (110) are in the labor force, with 1.7% or 1 of them being unemployed. The group with the highest labor force participation rate are those with the educational attainment of bachelor's degree or higher, with 75.0% or 6 individuals in the labor force. Within the labor force, individuals with bachelor's degree or higher education have the highest percentage of unemployment, with 16.7% or 1 of them being unemployed.
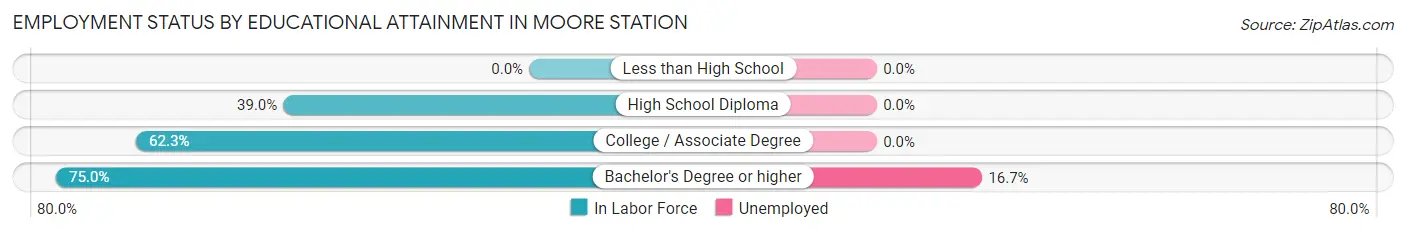
| Educational Attainment | In Labor Force | Unemployed |
| Less than High School | 0 (0.0%) | 0 (0.0%) |
| High School Diploma | 16 (39.0%) | 0 (0.0%) |
| College / Associate Degree | 38 (62.3%) | 0 (0.0%) |
| Bachelor's Degree or higher | 6 (75.0%) | 1 (16.7%) |
| Total | 60 (54.5%) | 2 (1.7%) |
Employment Occupations by Sex in Moore Station
Management, Business, Science and Arts Occupations
The most common Management, Business, Science and Arts occupations in Moore Station are Management (5 | 7.3%), Community & Social Service (4 | 5.9%), Education Instruction & Library (3 | 4.4%), Health Diagnosing & Treating (3 | 4.4%), and Arts, Media & Entertainment (1 | 1.5%).
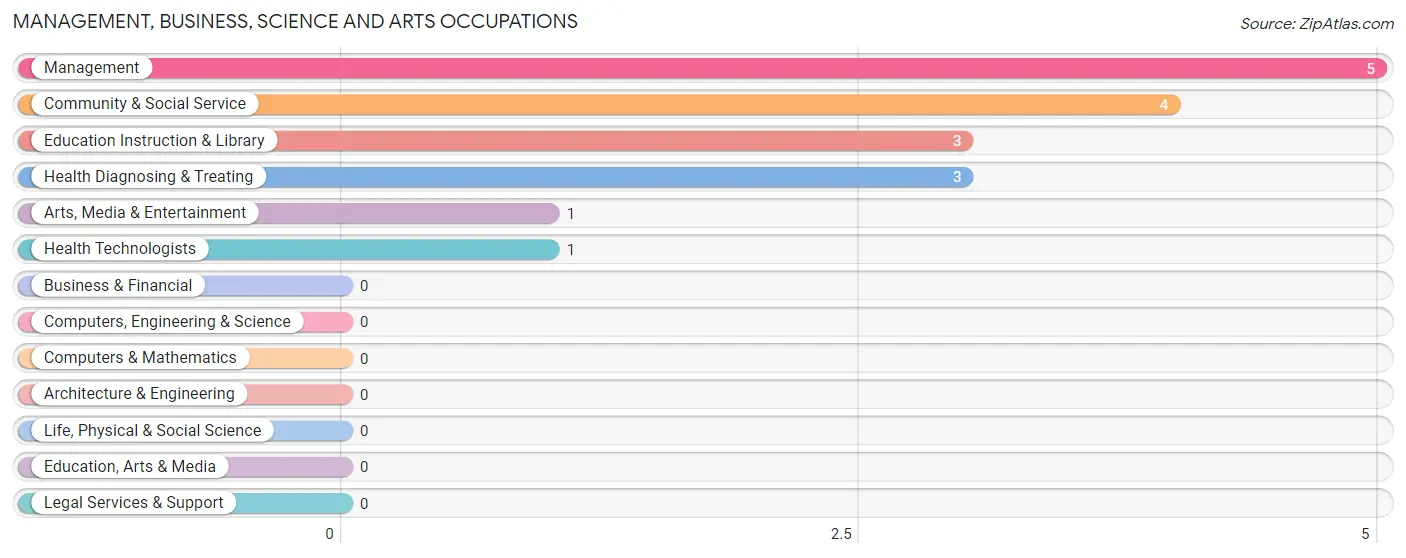
Management, Business, Science and Arts Occupations by Sex
Within the Management, Business, Science and Arts occupations in Moore Station, the most male-oriented occupations are Arts, Media & Entertainment (100.0%), Management (40.0%), and Community & Social Service (25.0%), while the most female-oriented occupations are Education Instruction & Library (100.0%), Health Diagnosing & Treating (100.0%), and Health Technologists (100.0%).
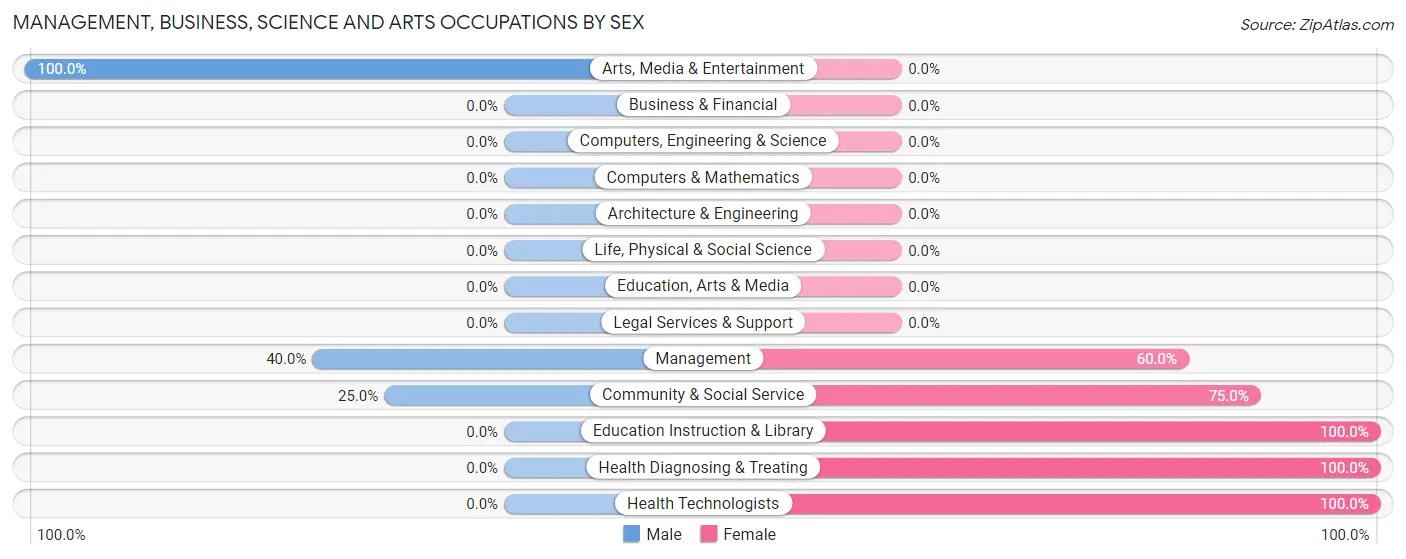
| Occupation | Male | Female |
| Management | 2 (40.0%) | 3 (60.0%) |
| Business & Financial | 0 (0.0%) | 0 (0.0%) |
| Computers, Engineering & Science | 0 (0.0%) | 0 (0.0%) |
| Computers & Mathematics | 0 (0.0%) | 0 (0.0%) |
| Architecture & Engineering | 0 (0.0%) | 0 (0.0%) |
| Life, Physical & Social Science | 0 (0.0%) | 0 (0.0%) |
| Community & Social Service | 1 (25.0%) | 3 (75.0%) |
| Education, Arts & Media | 0 (0.0%) | 0 (0.0%) |
| Legal Services & Support | 0 (0.0%) | 0 (0.0%) |
| Education Instruction & Library | 0 (0.0%) | 3 (100.0%) |
| Arts, Media & Entertainment | 1 (100.0%) | 0 (0.0%) |
| Health Diagnosing & Treating | 0 (0.0%) | 3 (100.0%) |
| Health Technologists | 0 (0.0%) | 1 (100.0%) |
| Total (Category) | 3 (25.0%) | 9 (75.0%) |
| Total (Overall) | 52 (76.5%) | 16 (23.5%) |
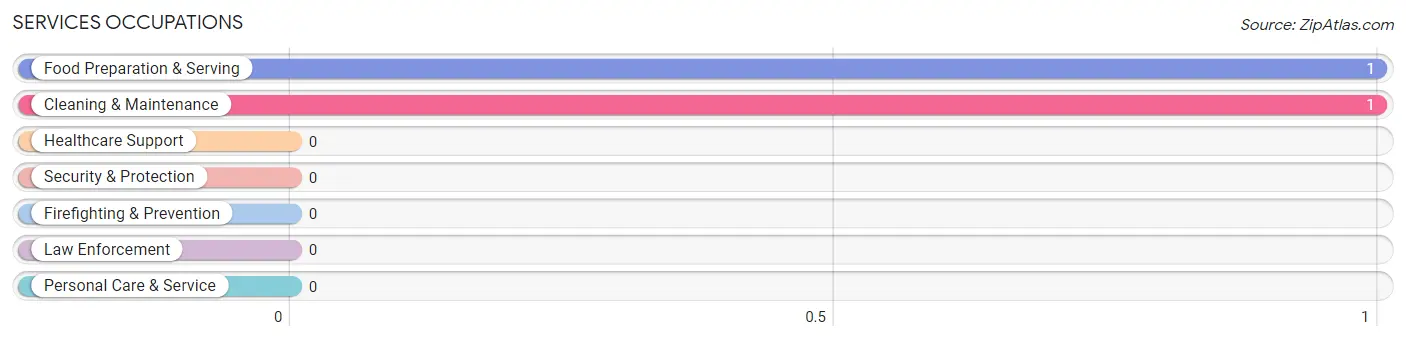
Services Occupations
The most common Services occupations in Moore Station are Food Preparation & Serving (1 | 1.5%), and Cleaning & Maintenance (1 | 1.5%).
Services Occupations by Sex
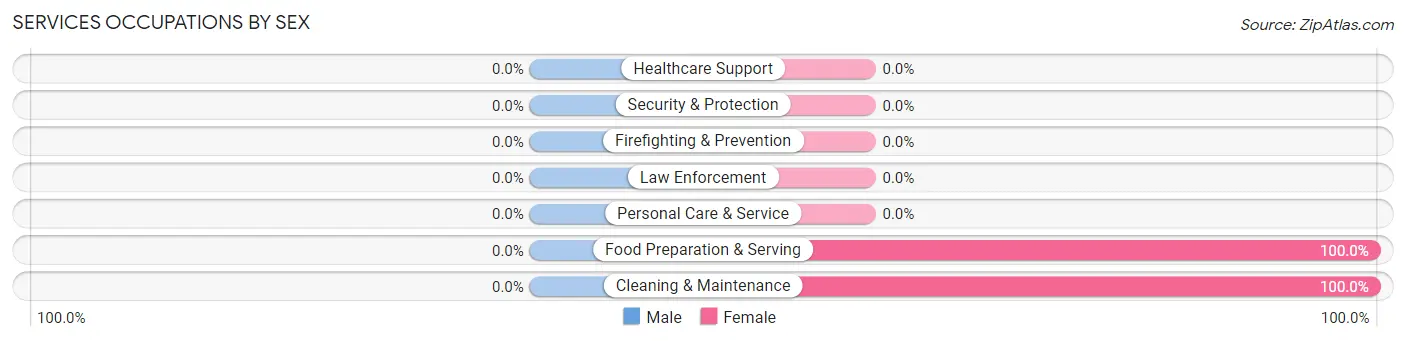
| Occupation | Male | Female |
| Healthcare Support | 0 (0.0%) | 0 (0.0%) |
| Security & Protection | 0 (0.0%) | 0 (0.0%) |
| Firefighting & Prevention | 0 (0.0%) | 0 (0.0%) |
| Law Enforcement | 0 (0.0%) | 0 (0.0%) |
| Food Preparation & Serving | 0 (0.0%) | 1 (100.0%) |
| Cleaning & Maintenance | 0 (0.0%) | 1 (100.0%) |
| Personal Care & Service | 0 (0.0%) | 0 (0.0%) |
| Total (Category) | 0 (0.0%) | 2 (100.0%) |
| Total (Overall) | 52 (76.5%) | 16 (23.5%) |
Sales and Office Occupations
The most common Sales and Office occupations in Moore Station are Office & Administration (6 | 8.8%), and Sales & Related (3 | 4.4%).

Sales and Office Occupations by Sex

| Occupation | Male | Female |
| Sales & Related | 0 (0.0%) | 3 (100.0%) |
| Office & Administration | 5 (83.3%) | 1 (16.7%) |
| Total (Category) | 5 (55.6%) | 4 (44.4%) |
| Total (Overall) | 52 (76.5%) | 16 (23.5%) |
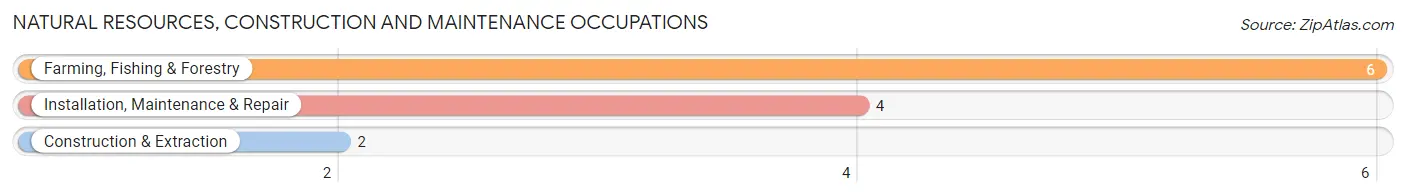
Natural Resources, Construction and Maintenance Occupations
The most common Natural Resources, Construction and Maintenance occupations in Moore Station are Farming, Fishing & Forestry (6 | 8.8%), Installation, Maintenance & Repair (4 | 5.9%), and Construction & Extraction (2 | 2.9%).
Natural Resources, Construction and Maintenance Occupations by Sex
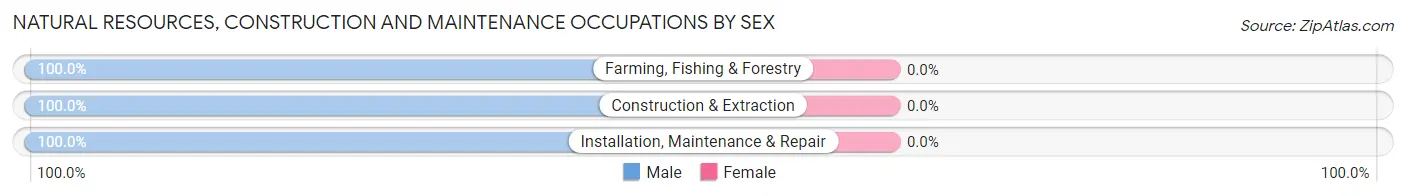
| Occupation | Male | Female |
| Farming, Fishing & Forestry | 6 (100.0%) | 0 (0.0%) |
| Construction & Extraction | 2 (100.0%) | 0 (0.0%) |
| Installation, Maintenance & Repair | 4 (100.0%) | 0 (0.0%) |
| Total (Category) | 12 (100.0%) | 0 (0.0%) |
| Total (Overall) | 52 (76.5%) | 16 (23.5%) |
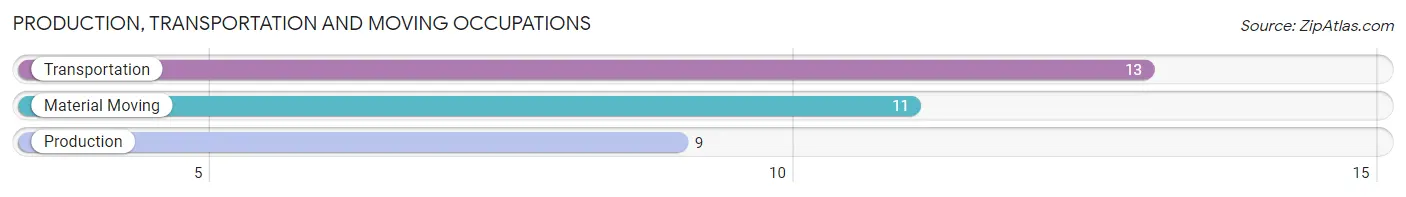
Production, Transportation and Moving Occupations
The most common Production, Transportation and Moving occupations in Moore Station are Transportation (13 | 19.1%), Material Moving (11 | 16.2%), and Production (9 | 13.2%).
Production, Transportation and Moving Occupations by Sex
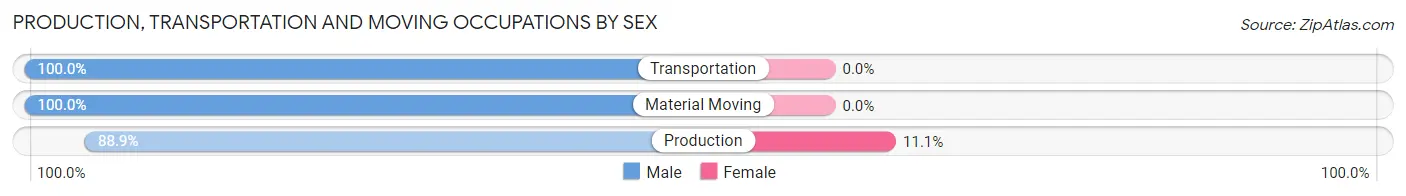
| Occupation | Male | Female |
| Production | 8 (88.9%) | 1 (11.1%) |
| Transportation | 13 (100.0%) | 0 (0.0%) |
| Material Moving | 11 (100.0%) | 0 (0.0%) |
| Total (Category) | 32 (97.0%) | 1 (3.0%) |
| Total (Overall) | 52 (76.5%) | 16 (23.5%) |
Employment Industries by Sex in Moore Station
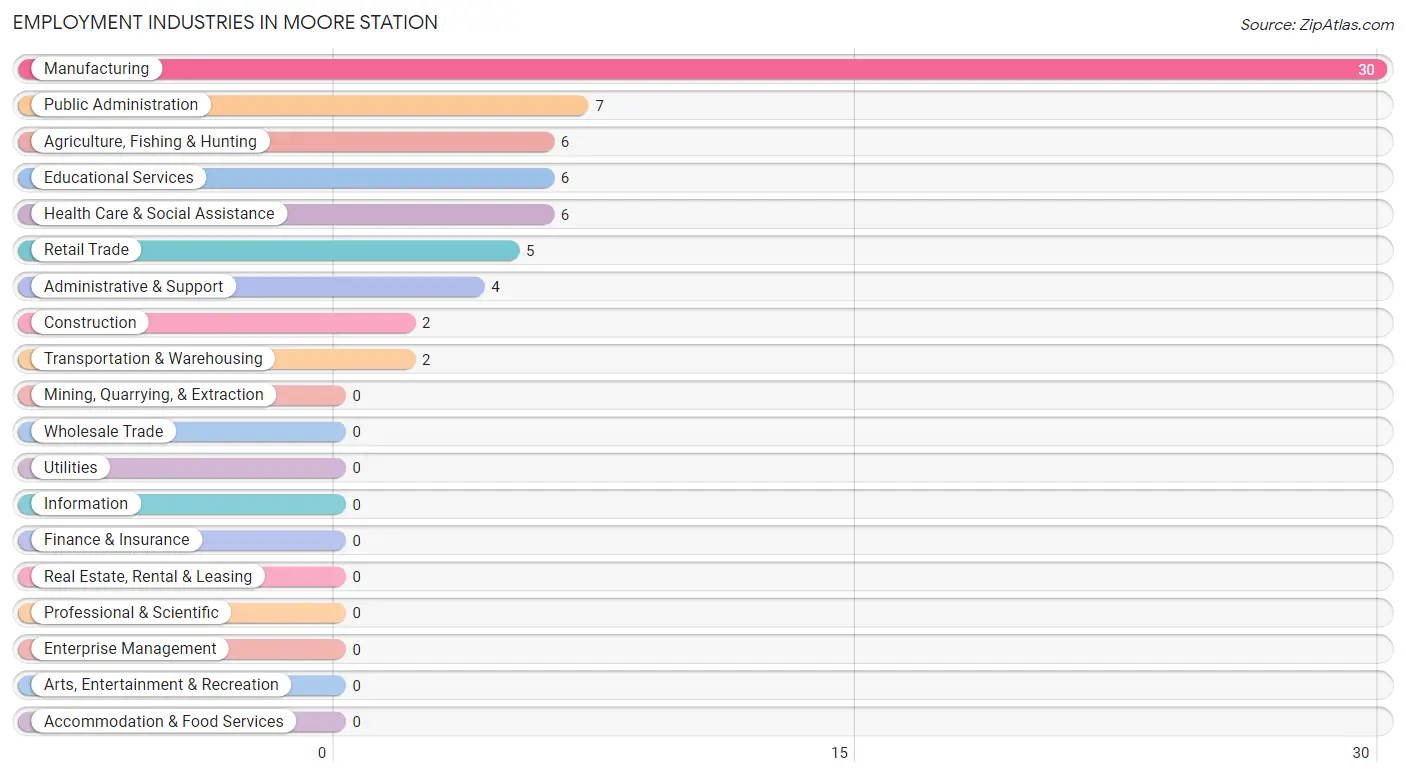
Employment Industries in Moore Station
The major employment industries in Moore Station include Manufacturing (30 | 44.1%), Public Administration (7 | 10.3%), Agriculture, Fishing & Hunting (6 | 8.8%), Educational Services (6 | 8.8%), and Health Care & Social Assistance (6 | 8.8%).
Employment Industries by Sex in Moore Station
The Moore Station industries that see more men than women are Agriculture, Fishing & Hunting (100.0%), Construction (100.0%), and Transportation & Warehousing (100.0%), whereas the industries that tend to have a higher number of women are Educational Services (83.3%), Retail Trade (60.0%), and Health Care & Social Assistance (50.0%).
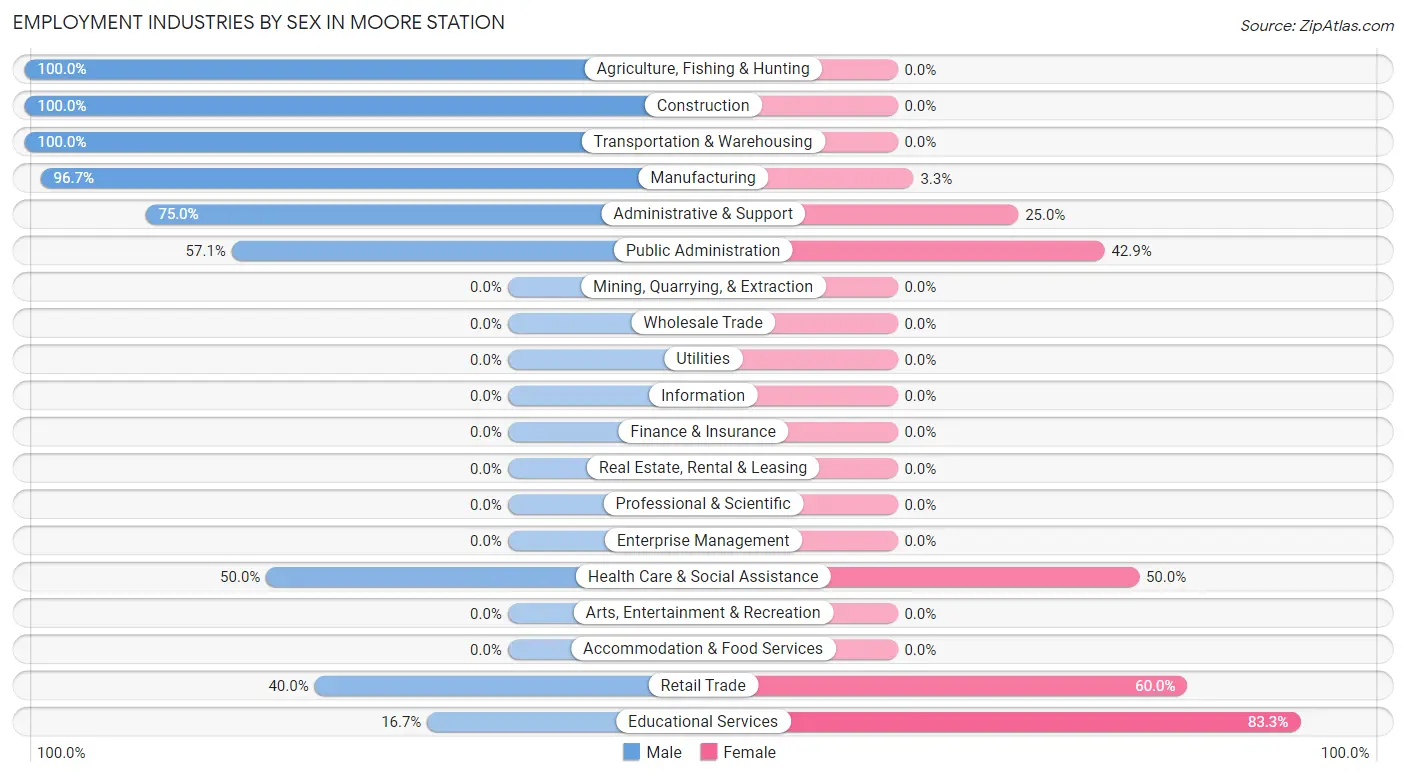
| Industry | Male | Female |
| Agriculture, Fishing & Hunting | 6 (100.0%) | 0 (0.0%) |
| Mining, Quarrying, & Extraction | 0 (0.0%) | 0 (0.0%) |
| Construction | 2 (100.0%) | 0 (0.0%) |
| Manufacturing | 29 (96.7%) | 1 (3.3%) |
| Wholesale Trade | 0 (0.0%) | 0 (0.0%) |
| Retail Trade | 2 (40.0%) | 3 (60.0%) |
| Transportation & Warehousing | 2 (100.0%) | 0 (0.0%) |
| Utilities | 0 (0.0%) | 0 (0.0%) |
| Information | 0 (0.0%) | 0 (0.0%) |
| Finance & Insurance | 0 (0.0%) | 0 (0.0%) |
| Real Estate, Rental & Leasing | 0 (0.0%) | 0 (0.0%) |
| Professional & Scientific | 0 (0.0%) | 0 (0.0%) |
| Enterprise Management | 0 (0.0%) | 0 (0.0%) |
| Administrative & Support | 3 (75.0%) | 1 (25.0%) |
| Educational Services | 1 (16.7%) | 5 (83.3%) |
| Health Care & Social Assistance | 3 (50.0%) | 3 (50.0%) |
| Arts, Entertainment & Recreation | 0 (0.0%) | 0 (0.0%) |
| Accommodation & Food Services | 0 (0.0%) | 0 (0.0%) |
| Public Administration | 4 (57.1%) | 3 (42.9%) |
| Total | 52 (76.5%) | 16 (23.5%) |
Education in Moore Station
School Enrollment in Moore Station
The most common levels of schooling among the 21 students in Moore Station are high school (9 | 42.9%), elementary school (6 | 28.6%), and middle school (4 | 19.1%).
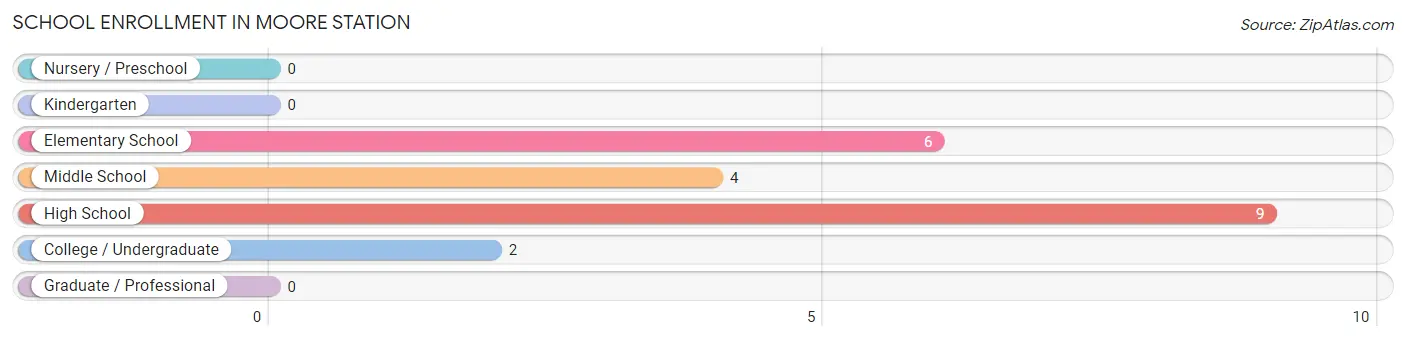
| School Level | # Students | % Students |
| Nursery / Preschool | 0 | 0.0% |
| Kindergarten | 0 | 0.0% |
| Elementary School | 6 | 28.6% |
| Middle School | 4 | 19.1% |
| High School | 9 | 42.9% |
| College / Undergraduate | 2 | 9.5% |
| Graduate / Professional | 0 | 0.0% |
| Total | 21 | 100.0% |
School Enrollment by Age by Funding Source in Moore Station
Out of a total of 21 students who are enrolled in schools in Moore Station, 7 (33.3%) attend a private institution, while the remaining 14 (66.7%) are enrolled in public schools. The age group of 20 to 24 year olds has the highest likelihood of being enrolled in private schools, with 4 (100.0% in the age bracket) enrolled. Conversely, the age group of 5 to 9 year old has the lowest likelihood of being enrolled in a private school, with 6 (100.0% in the age bracket) attending a public institution.
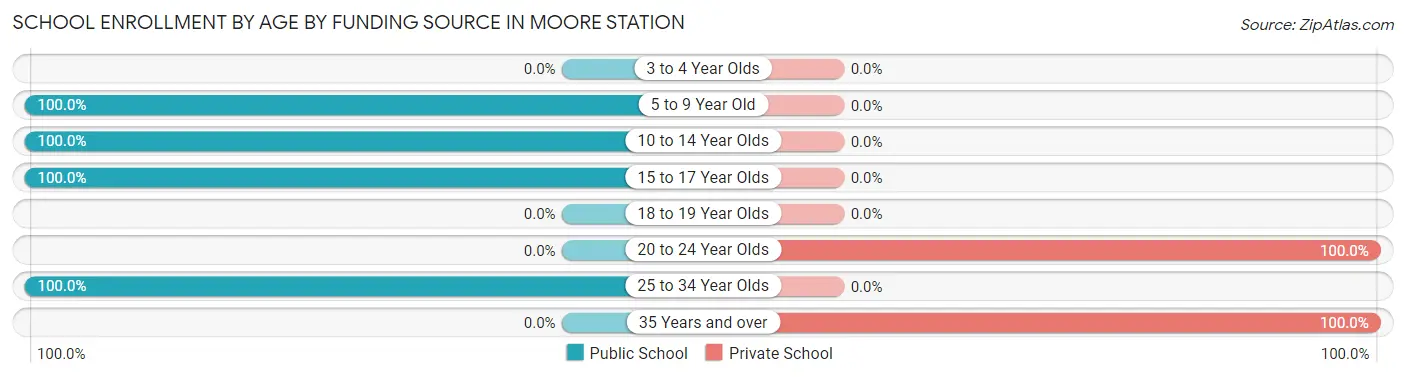
| Age Bracket | Public School | Private School |
| 3 to 4 Year Olds | 0 (0.0%) | 0 (0.0%) |
| 5 to 9 Year Old | 6 (100.0%) | 0 (0.0%) |
| 10 to 14 Year Olds | 4 (100.0%) | 0 (0.0%) |
| 15 to 17 Year Olds | 2 (100.0%) | 0 (0.0%) |
| 18 to 19 Year Olds | 0 (0.0%) | 0 (0.0%) |
| 20 to 24 Year Olds | 0 (0.0%) | 4 (100.0%) |
| 25 to 34 Year Olds | 2 (100.0%) | 0 (0.0%) |
| 35 Years and over | 0 (0.0%) | 3 (100.0%) |
| Total | 14 (66.7%) | 7 (33.3%) |
Educational Attainment by Field of Study in Moore Station
Education (5 | 27.8%), literature & languages (5 | 27.8%), psychology (2 | 11.1%), business (2 | 11.1%), and arts & humanities (2 | 11.1%) are the most common fields of study among 18 individuals in Moore Station who have obtained a bachelor's degree or higher.
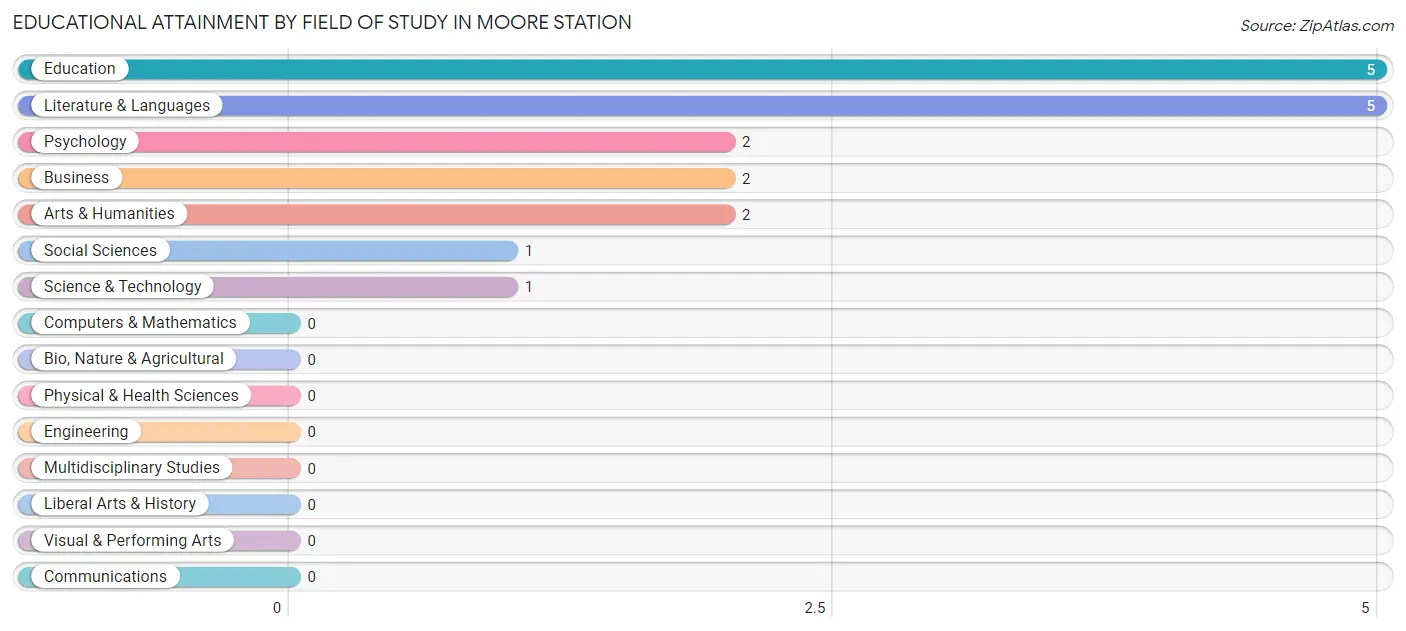
| Field of Study | # Graduates | % Graduates |
| Computers & Mathematics | 0 | 0.0% |
| Bio, Nature & Agricultural | 0 | 0.0% |
| Physical & Health Sciences | 0 | 0.0% |
| Psychology | 2 | 11.1% |
| Social Sciences | 1 | 5.6% |
| Engineering | 0 | 0.0% |
| Multidisciplinary Studies | 0 | 0.0% |
| Science & Technology | 1 | 5.6% |
| Business | 2 | 11.1% |
| Education | 5 | 27.8% |
| Literature & Languages | 5 | 27.8% |
| Liberal Arts & History | 0 | 0.0% |
| Visual & Performing Arts | 0 | 0.0% |
| Communications | 0 | 0.0% |
| Arts & Humanities | 2 | 11.1% |
| Total | 18 | 100.0% |
Transportation & Commute in Moore Station
Vehicle Availability by Sex in Moore Station
The most prevalent vehicle ownership categories in Moore Station are males with 2 vehicles (33, accounting for 63.5%) and females with 2 vehicles (10, making up 206.2%).
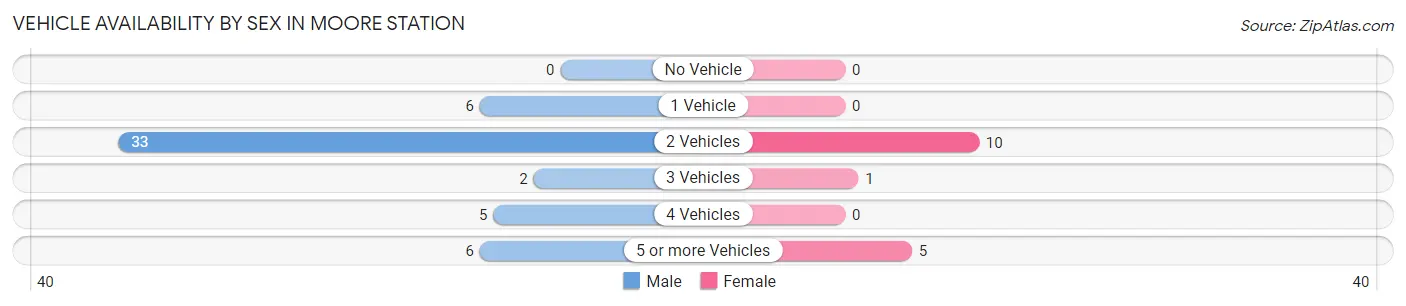
| Vehicles Available | Male | Female |
| No Vehicle | 0 (0.0%) | 0 (0.0%) |
| 1 Vehicle | 6 (11.5%) | 0 (0.0%) |
| 2 Vehicles | 33 (63.5%) | 10 (62.5%) |
| 3 Vehicles | 2 (3.8%) | 1 (6.2%) |
| 4 Vehicles | 5 (9.6%) | 0 (0.0%) |
| 5 or more Vehicles | 6 (11.5%) | 5 (31.2%) |
| Total | 52 (100.0%) | 16 (100.0%) |
Commute Time in Moore Station
The most frequently occuring commute durations in Moore Station are 30 to 34 minutes (18 commuters, 26.5%), 25 to 29 minutes (17 commuters, 25.0%), and 45 to 59 minutes (9 commuters, 13.2%).
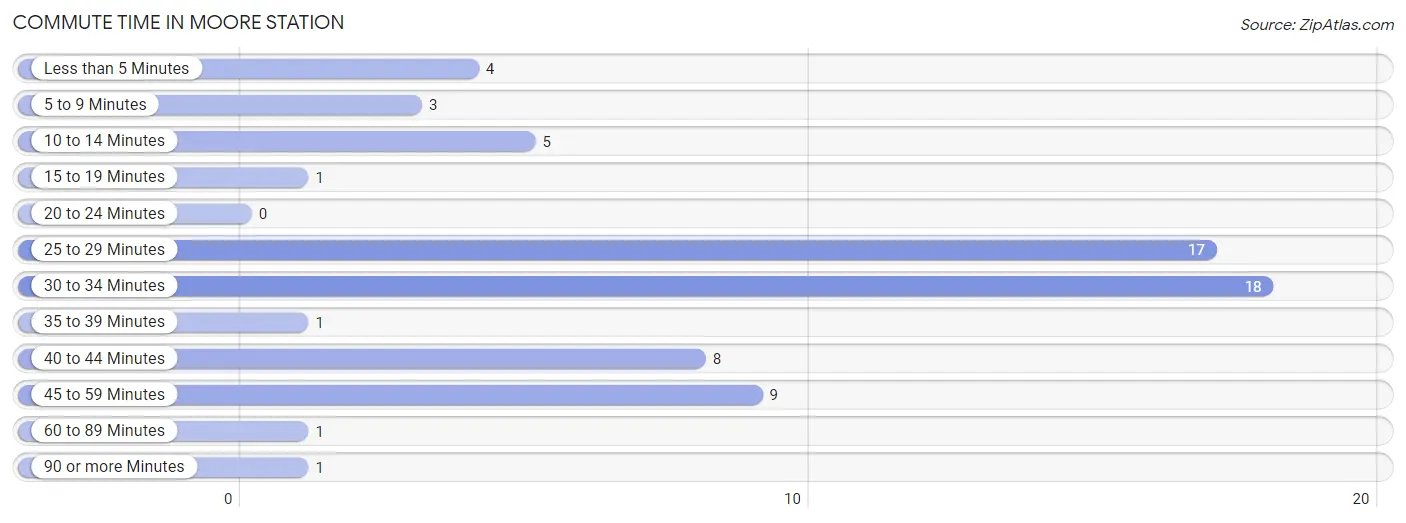
| Commute Time | # Commuters | % Commuters |
| Less than 5 Minutes | 4 | 5.9% |
| 5 to 9 Minutes | 3 | 4.4% |
| 10 to 14 Minutes | 5 | 7.3% |
| 15 to 19 Minutes | 1 | 1.5% |
| 20 to 24 Minutes | 0 | 0.0% |
| 25 to 29 Minutes | 17 | 25.0% |
| 30 to 34 Minutes | 18 | 26.5% |
| 35 to 39 Minutes | 1 | 1.5% |
| 40 to 44 Minutes | 8 | 11.8% |
| 45 to 59 Minutes | 9 | 13.2% |
| 60 to 89 Minutes | 1 | 1.5% |
| 90 or more Minutes | 1 | 1.5% |
Commute Time by Sex in Moore Station
The most common commute times in Moore Station are 25 to 29 minutes (16 commuters, 30.8%) for males and 30 to 34 minutes (9 commuters, 56.2%) for females.
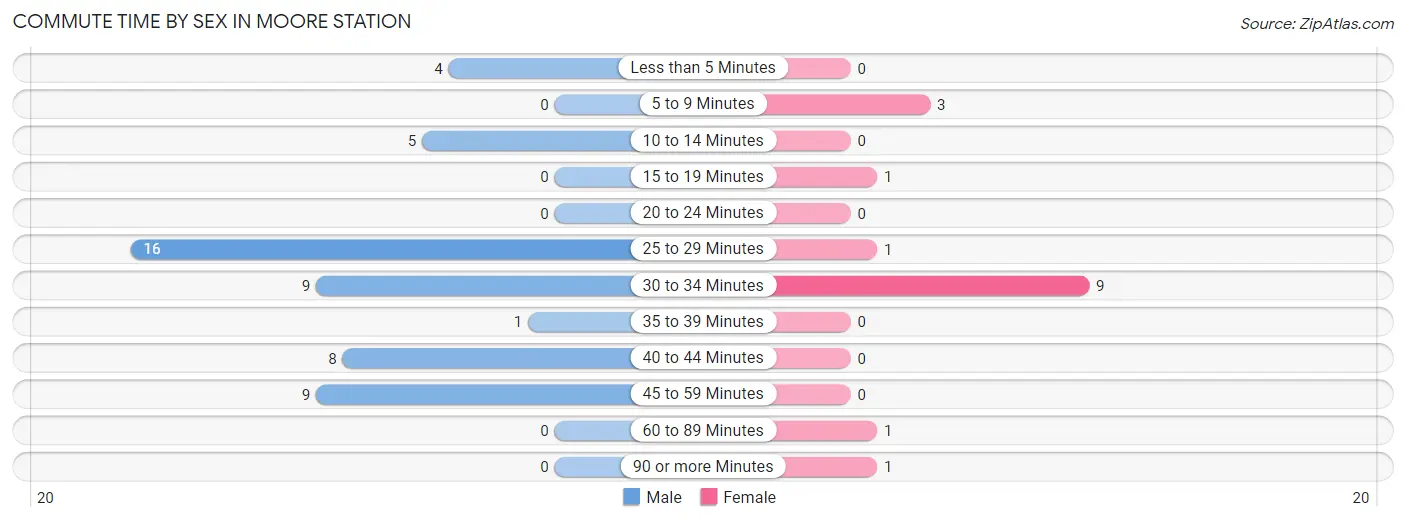
| Commute Time | Male | Female |
| Less than 5 Minutes | 4 (7.7%) | 0 (0.0%) |
| 5 to 9 Minutes | 0 (0.0%) | 3 (18.8%) |
| 10 to 14 Minutes | 5 (9.6%) | 0 (0.0%) |
| 15 to 19 Minutes | 0 (0.0%) | 1 (6.2%) |
| 20 to 24 Minutes | 0 (0.0%) | 0 (0.0%) |
| 25 to 29 Minutes | 16 (30.8%) | 1 (6.2%) |
| 30 to 34 Minutes | 9 (17.3%) | 9 (56.2%) |
| 35 to 39 Minutes | 1 (1.9%) | 0 (0.0%) |
| 40 to 44 Minutes | 8 (15.4%) | 0 (0.0%) |
| 45 to 59 Minutes | 9 (17.3%) | 0 (0.0%) |
| 60 to 89 Minutes | 0 (0.0%) | 1 (6.2%) |
| 90 or more Minutes | 0 (0.0%) | 1 (6.2%) |
Time of Departure to Work by Sex in Moore Station
The most frequent times of departure to work in Moore Station are 6:00 AM to 6:29 AM (25, 48.1%) for males and 6:30 AM to 6:59 AM (6, 37.5%) for females.
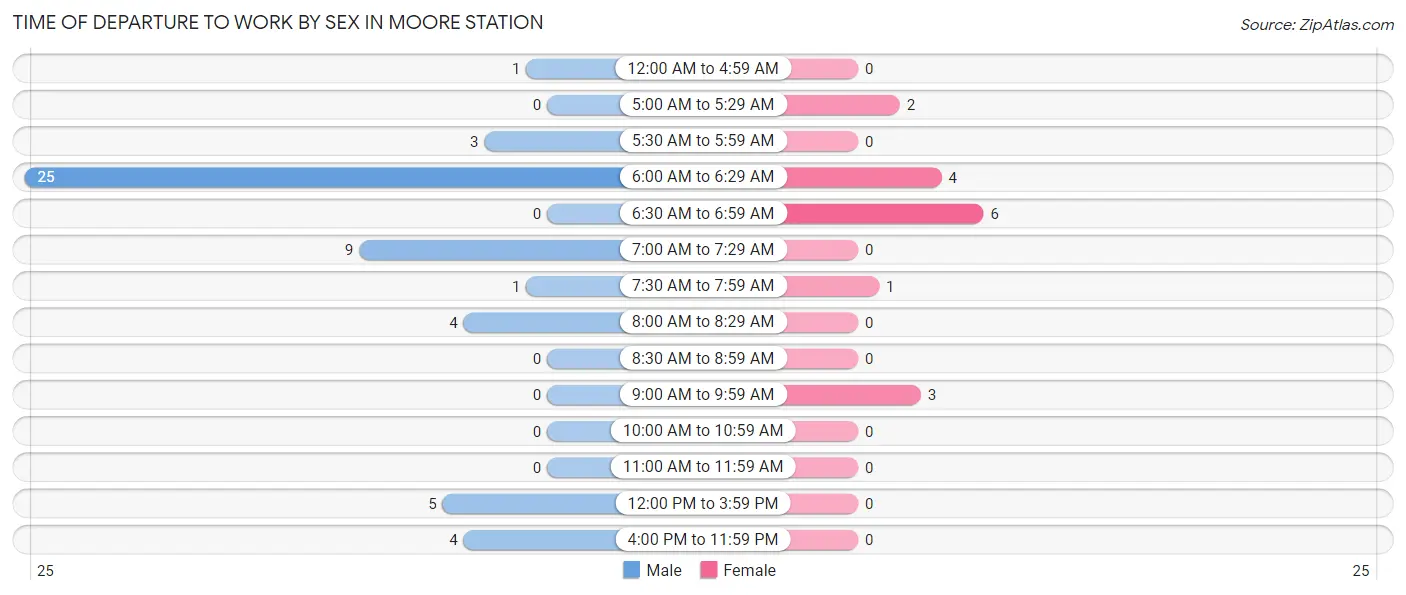
| Time of Departure | Male | Female |
| 12:00 AM to 4:59 AM | 1 (1.9%) | 0 (0.0%) |
| 5:00 AM to 5:29 AM | 0 (0.0%) | 2 (12.5%) |
| 5:30 AM to 5:59 AM | 3 (5.8%) | 0 (0.0%) |
| 6:00 AM to 6:29 AM | 25 (48.1%) | 4 (25.0%) |
| 6:30 AM to 6:59 AM | 0 (0.0%) | 6 (37.5%) |
| 7:00 AM to 7:29 AM | 9 (17.3%) | 0 (0.0%) |
| 7:30 AM to 7:59 AM | 1 (1.9%) | 1 (6.2%) |
| 8:00 AM to 8:29 AM | 4 (7.7%) | 0 (0.0%) |
| 8:30 AM to 8:59 AM | 0 (0.0%) | 0 (0.0%) |
| 9:00 AM to 9:59 AM | 0 (0.0%) | 3 (18.8%) |
| 10:00 AM to 10:59 AM | 0 (0.0%) | 0 (0.0%) |
| 11:00 AM to 11:59 AM | 0 (0.0%) | 0 (0.0%) |
| 12:00 PM to 3:59 PM | 5 (9.6%) | 0 (0.0%) |
| 4:00 PM to 11:59 PM | 4 (7.7%) | 0 (0.0%) |
| Total | 52 (100.0%) | 16 (100.0%) |
Housing Occupancy in Moore Station
Occupancy by Ownership in Moore Station
Of the total 84 dwellings in Moore Station, owner-occupied units account for 76 (90.5%), while renter-occupied units make up 8 (9.5%).
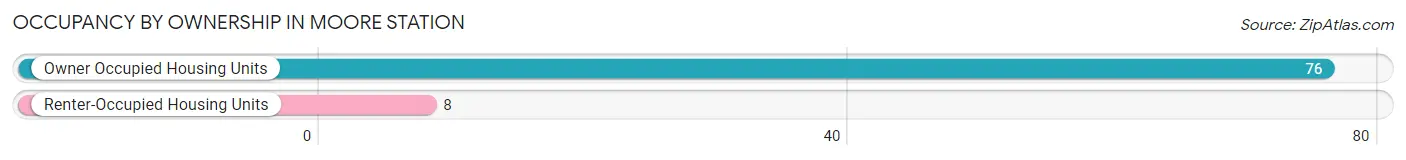
| Occupancy | # Housing Units | % Housing Units |
| Owner Occupied Housing Units | 76 | 90.5% |
| Renter-Occupied Housing Units | 8 | 9.5% |
| Total Occupied Housing Units | 84 | 100.0% |
Occupancy by Household Size in Moore Station
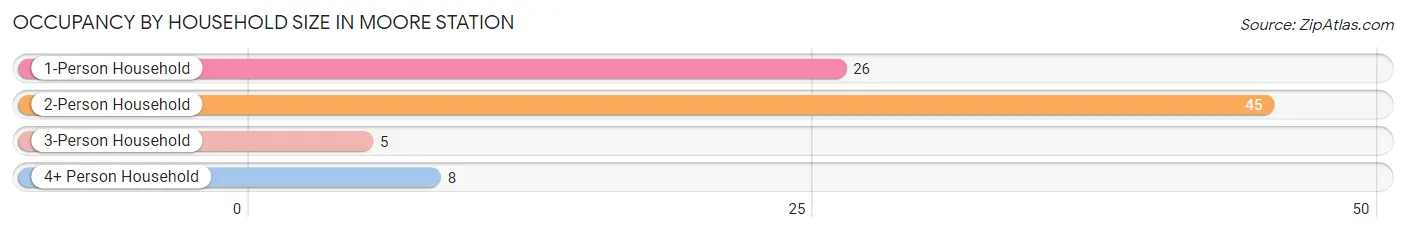
| Household Size | # Housing Units | % Housing Units |
| 1-Person Household | 26 | 30.9% |
| 2-Person Household | 45 | 53.6% |
| 3-Person Household | 5 | 5.9% |
| 4+ Person Household | 8 | 9.5% |
| Total Housing Units | 84 | 100.0% |
Occupancy by Ownership by Household Size in Moore Station
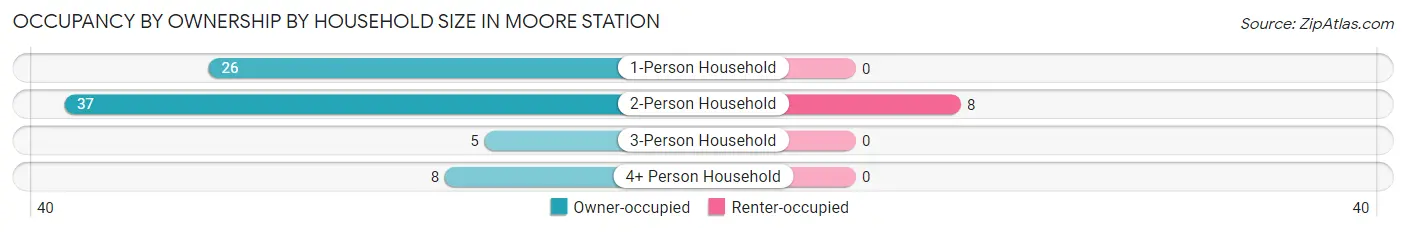
| Household Size | Owner-occupied | Renter-occupied |
| 1-Person Household | 26 (100.0%) | 0 (0.0%) |
| 2-Person Household | 37 (82.2%) | 8 (17.8%) |
| 3-Person Household | 5 (100.0%) | 0 (0.0%) |
| 4+ Person Household | 8 (100.0%) | 0 (0.0%) |
| Total Housing Units | 76 (90.5%) | 8 (9.5%) |
Occupancy by Educational Attainment in Moore Station
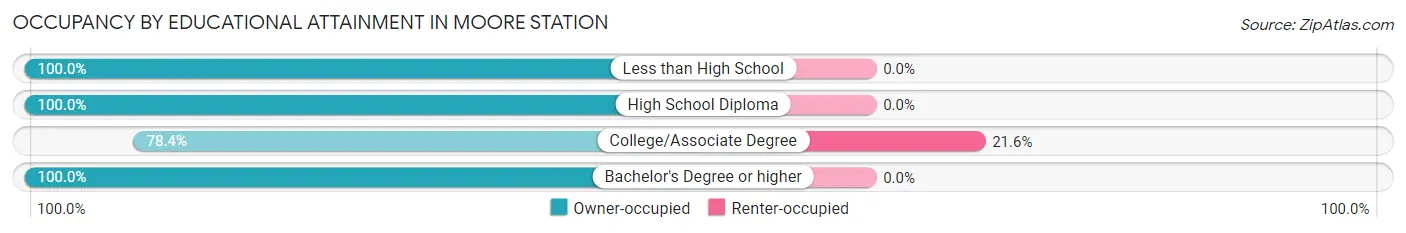
| Household Size | Owner-occupied | Renter-occupied |
| Less than High School | 10 (100.0%) | 0 (0.0%) |
| High School Diploma | 26 (100.0%) | 0 (0.0%) |
| College/Associate Degree | 29 (78.4%) | 8 (21.6%) |
| Bachelor's Degree or higher | 11 (100.0%) | 0 (0.0%) |
Occupancy by Age of Householder in Moore Station
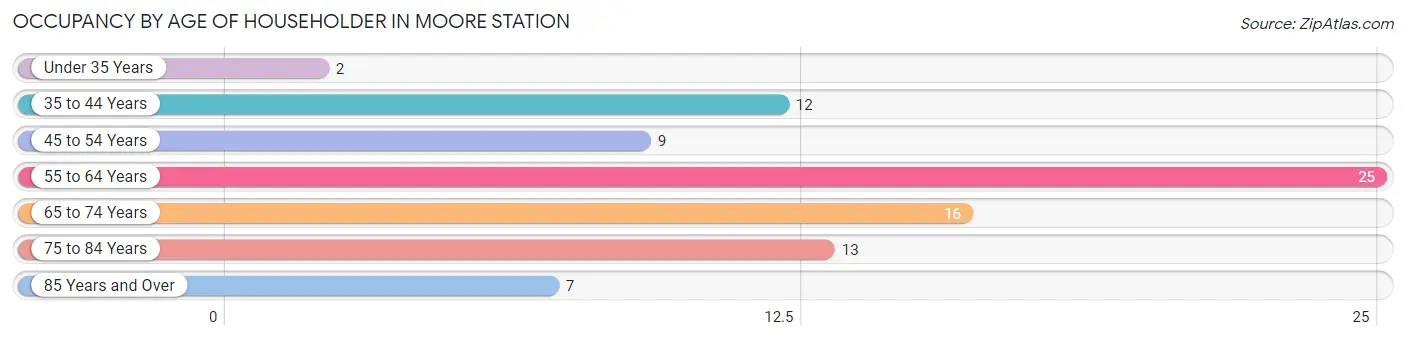
| Age Bracket | # Households | % Households |
| Under 35 Years | 2 | 2.4% |
| 35 to 44 Years | 12 | 14.3% |
| 45 to 54 Years | 9 | 10.7% |
| 55 to 64 Years | 25 | 29.8% |
| 65 to 74 Years | 16 | 19.1% |
| 75 to 84 Years | 13 | 15.5% |
| 85 Years and Over | 7 | 8.3% |
| Total | 84 | 100.0% |
Housing Finances in Moore Station
Median Income by Occupancy in Moore Station
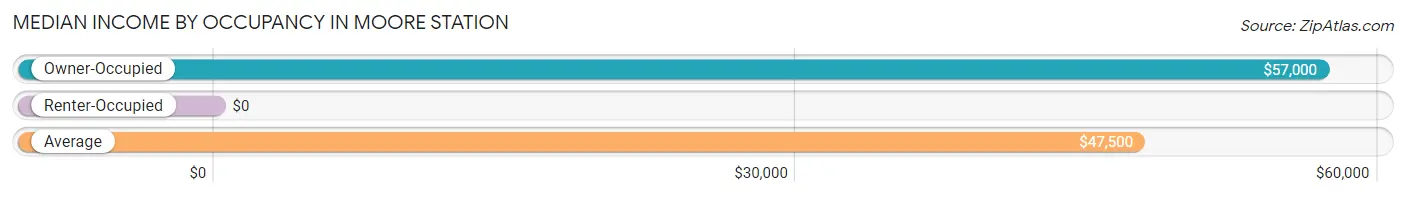
| Occupancy Type | # Households | Median Income |
| Owner-Occupied | 76 (90.5%) | $57,000 |
| Renter-Occupied | 8 (9.5%) | $0 |
| Average | 84 (100.0%) | $47,500 |
Occupancy by Householder Income Bracket in Moore Station
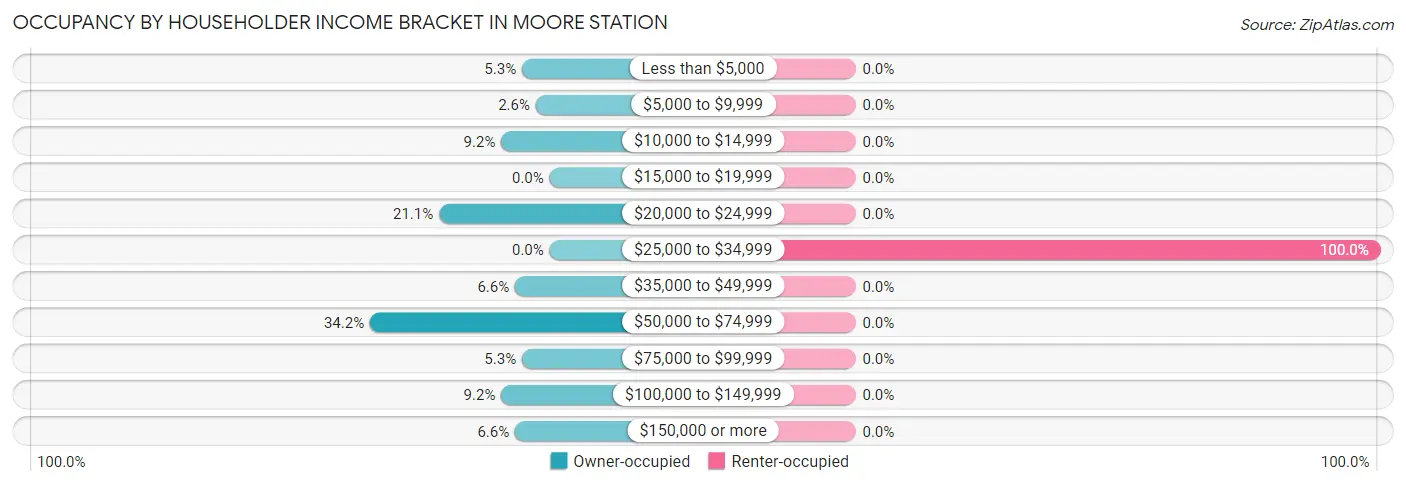
| Income Bracket | Owner-occupied | Renter-occupied |
| Less than $5,000 | 4 (5.3%) | 0 (0.0%) |
| $5,000 to $9,999 | 2 (2.6%) | 0 (0.0%) |
| $10,000 to $14,999 | 7 (9.2%) | 0 (0.0%) |
| $15,000 to $19,999 | 0 (0.0%) | 0 (0.0%) |
| $20,000 to $24,999 | 16 (21.0%) | 0 (0.0%) |
| $25,000 to $34,999 | 0 (0.0%) | 8 (100.0%) |
| $35,000 to $49,999 | 5 (6.6%) | 0 (0.0%) |
| $50,000 to $74,999 | 26 (34.2%) | 0 (0.0%) |
| $75,000 to $99,999 | 4 (5.3%) | 0 (0.0%) |
| $100,000 to $149,999 | 7 (9.2%) | 0 (0.0%) |
| $150,000 or more | 5 (6.6%) | 0 (0.0%) |
| Total | 76 (100.0%) | 8 (100.0%) |
Monthly Housing Cost Tiers in Moore Station
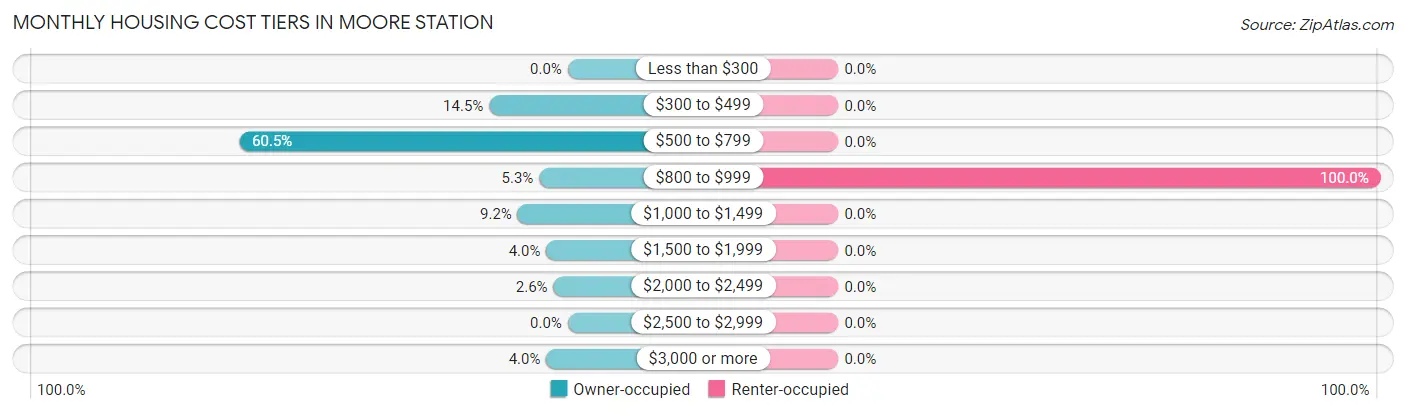
| Monthly Cost | Owner-occupied | Renter-occupied |
| Less than $300 | 0 (0.0%) | 0 (0.0%) |
| $300 to $499 | 11 (14.5%) | 0 (0.0%) |
| $500 to $799 | 46 (60.5%) | 0 (0.0%) |
| $800 to $999 | 4 (5.3%) | 8 (100.0%) |
| $1,000 to $1,499 | 7 (9.2%) | 0 (0.0%) |
| $1,500 to $1,999 | 3 (4.0%) | 0 (0.0%) |
| $2,000 to $2,499 | 2 (2.6%) | 0 (0.0%) |
| $2,500 to $2,999 | 0 (0.0%) | 0 (0.0%) |
| $3,000 or more | 3 (4.0%) | 0 (0.0%) |
| Total | 76 (100.0%) | 8 (100.0%) |
Physical Housing Characteristics in Moore Station
Housing Structures in Moore Station
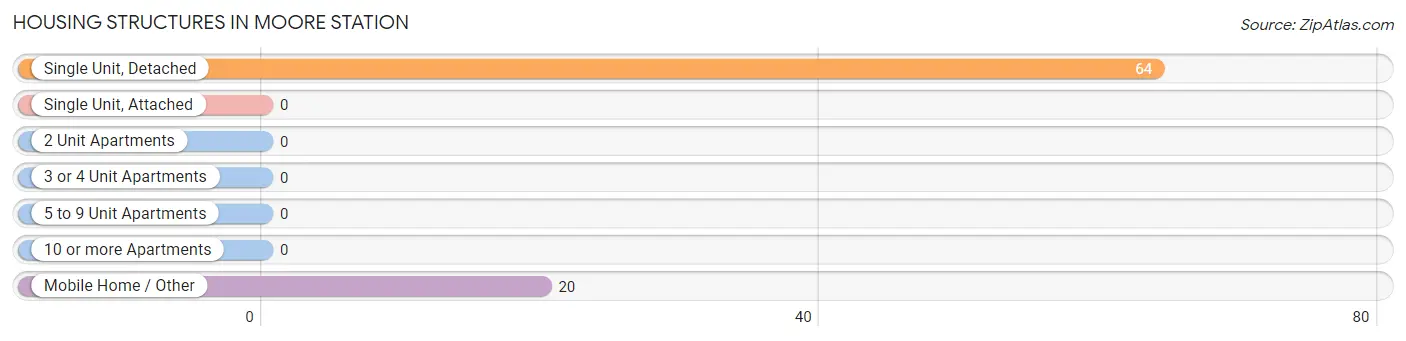
| Structure Type | # Housing Units | % Housing Units |
| Single Unit, Detached | 64 | 76.2% |
| Single Unit, Attached | 0 | 0.0% |
| 2 Unit Apartments | 0 | 0.0% |
| 3 or 4 Unit Apartments | 0 | 0.0% |
| 5 to 9 Unit Apartments | 0 | 0.0% |
| 10 or more Apartments | 0 | 0.0% |
| Mobile Home / Other | 20 | 23.8% |
| Total | 84 | 100.0% |
Housing Structures by Occupancy in Moore Station
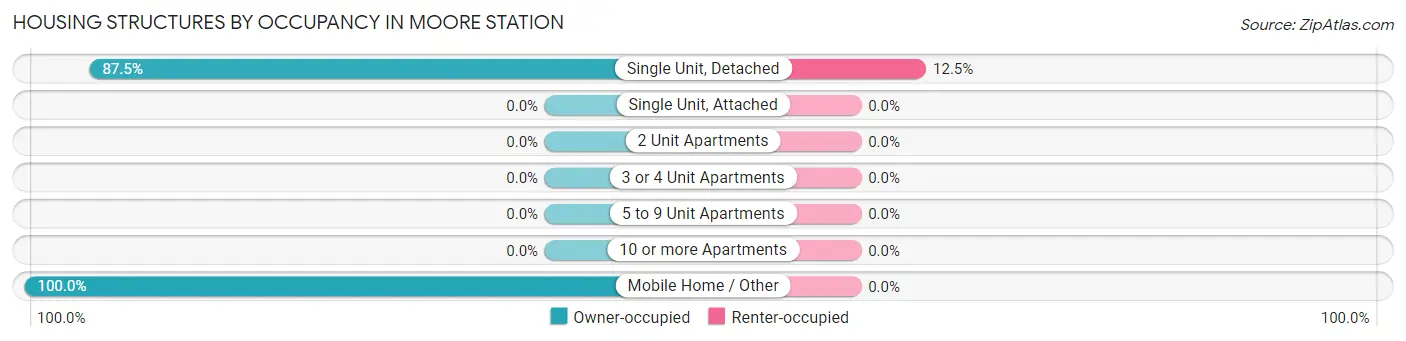
| Structure Type | Owner-occupied | Renter-occupied |
| Single Unit, Detached | 56 (87.5%) | 8 (12.5%) |
| Single Unit, Attached | 0 (0.0%) | 0 (0.0%) |
| 2 Unit Apartments | 0 (0.0%) | 0 (0.0%) |
| 3 or 4 Unit Apartments | 0 (0.0%) | 0 (0.0%) |
| 5 to 9 Unit Apartments | 0 (0.0%) | 0 (0.0%) |
| 10 or more Apartments | 0 (0.0%) | 0 (0.0%) |
| Mobile Home / Other | 20 (100.0%) | 0 (0.0%) |
| Total | 76 (90.5%) | 8 (9.5%) |
Housing Structures by Number of Rooms in Moore Station
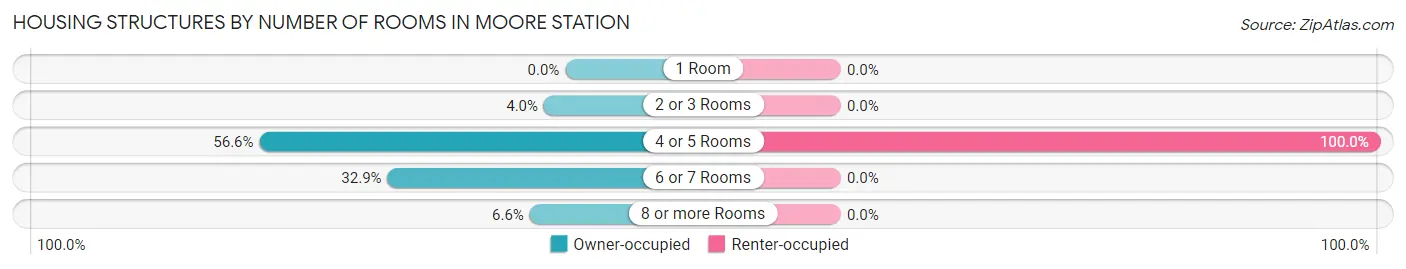
| Number of Rooms | Owner-occupied | Renter-occupied |
| 1 Room | 0 (0.0%) | 0 (0.0%) |
| 2 or 3 Rooms | 3 (4.0%) | 0 (0.0%) |
| 4 or 5 Rooms | 43 (56.6%) | 8 (100.0%) |
| 6 or 7 Rooms | 25 (32.9%) | 0 (0.0%) |
| 8 or more Rooms | 5 (6.6%) | 0 (0.0%) |
| Total | 76 (100.0%) | 8 (100.0%) |
Housing Structure by Heating Type in Moore Station
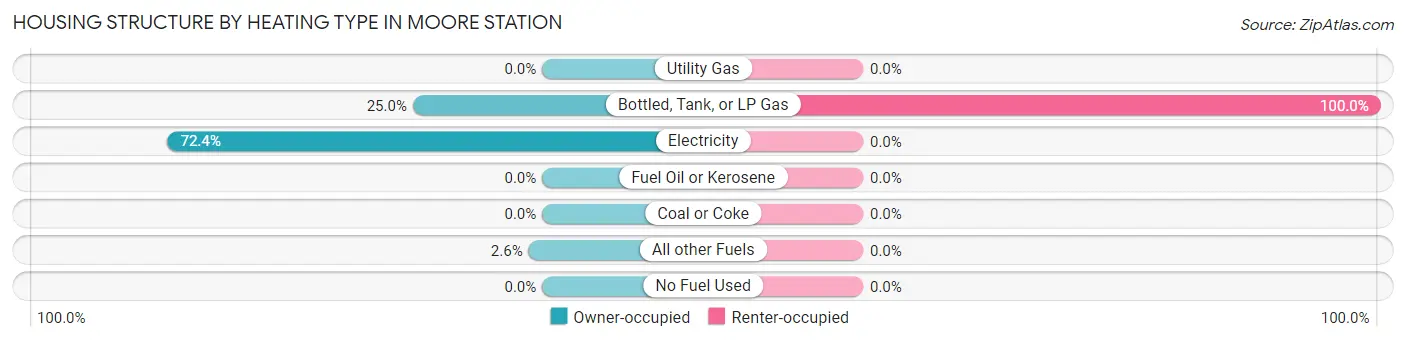
| Heating Type | Owner-occupied | Renter-occupied |
| Utility Gas | 0 (0.0%) | 0 (0.0%) |
| Bottled, Tank, or LP Gas | 19 (25.0%) | 8 (100.0%) |
| Electricity | 55 (72.4%) | 0 (0.0%) |
| Fuel Oil or Kerosene | 0 (0.0%) | 0 (0.0%) |
| Coal or Coke | 0 (0.0%) | 0 (0.0%) |
| All other Fuels | 2 (2.6%) | 0 (0.0%) |
| No Fuel Used | 0 (0.0%) | 0 (0.0%) |
| Total | 76 (100.0%) | 8 (100.0%) |
Household Vehicle Usage in Moore Station
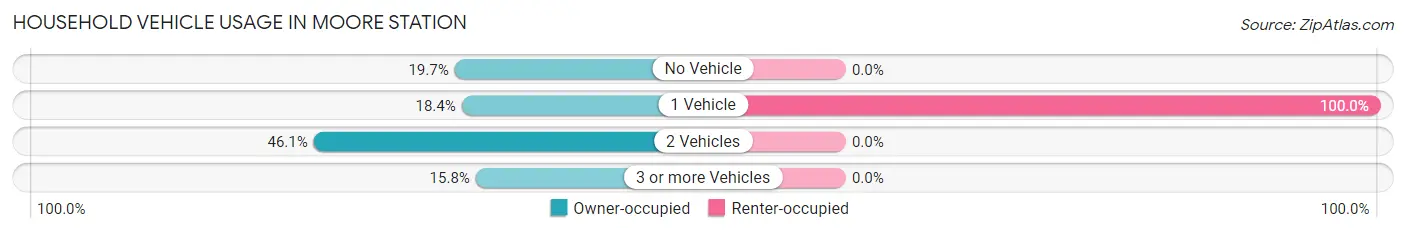
| Vehicles per Household | Owner-occupied | Renter-occupied |
| No Vehicle | 15 (19.7%) | 0 (0.0%) |
| 1 Vehicle | 14 (18.4%) | 8 (100.0%) |
| 2 Vehicles | 35 (46.1%) | 0 (0.0%) |
| 3 or more Vehicles | 12 (15.8%) | 0 (0.0%) |
| Total | 76 (100.0%) | 8 (100.0%) |
Real Estate & Mortgages in Moore Station
Real Estate and Mortgage Overview in Moore Station
| Characteristic | Without Mortgage | With Mortgage |
| Housing Units | 63 | 13 |
| Median Property Value | $151,300 | $0 |
| Median Household Income | $38,750 | $5 |
| Monthly Housing Costs | $606 | $3 |
| Real Estate Taxes | $1,694 | $0 |
Property Value by Mortgage Status in Moore Station
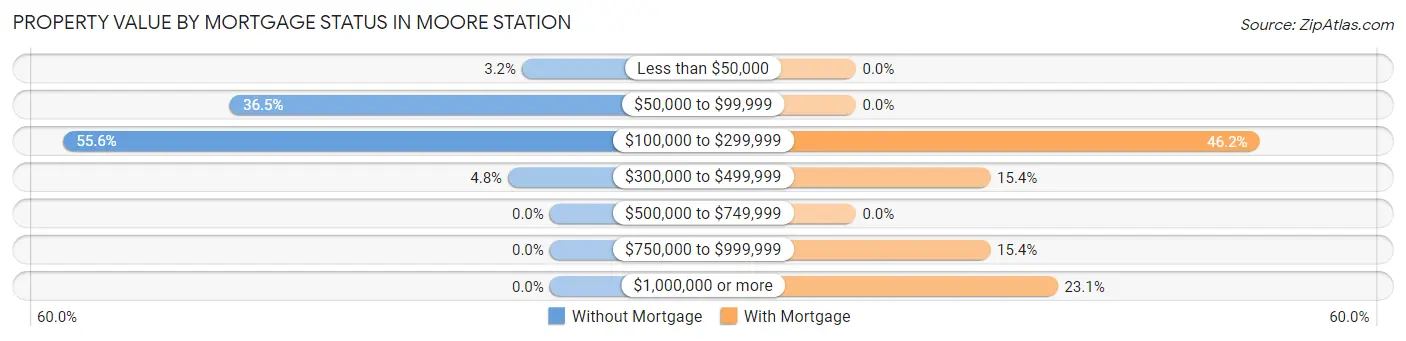
| Property Value | Without Mortgage | With Mortgage |
| Less than $50,000 | 2 (3.2%) | 0 (0.0%) |
| $50,000 to $99,999 | 23 (36.5%) | 0 (0.0%) |
| $100,000 to $299,999 | 35 (55.6%) | 6 (46.2%) |
| $300,000 to $499,999 | 3 (4.8%) | 2 (15.4%) |
| $500,000 to $749,999 | 0 (0.0%) | 0 (0.0%) |
| $750,000 to $999,999 | 0 (0.0%) | 2 (15.4%) |
| $1,000,000 or more | 0 (0.0%) | 3 (23.1%) |
| Total | 63 (100.0%) | 13 (100.0%) |
Household Income by Mortgage Status in Moore Station
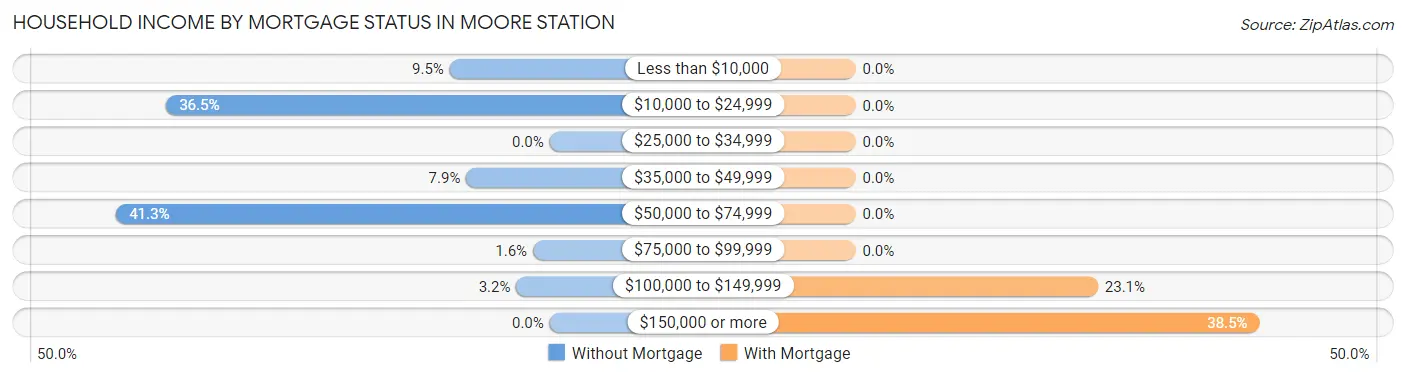
| Household Income | Without Mortgage | With Mortgage |
| Less than $10,000 | 6 (9.5%) | 0 (0.0%) |
| $10,000 to $24,999 | 23 (36.5%) | 0 (0.0%) |
| $25,000 to $34,999 | 0 (0.0%) | 0 (0.0%) |
| $35,000 to $49,999 | 5 (7.9%) | 0 (0.0%) |
| $50,000 to $74,999 | 26 (41.3%) | 0 (0.0%) |
| $75,000 to $99,999 | 1 (1.6%) | 0 (0.0%) |
| $100,000 to $149,999 | 2 (3.2%) | 3 (23.1%) |
| $150,000 or more | 0 (0.0%) | 5 (38.5%) |
| Total | 63 (100.0%) | 13 (100.0%) |
Property Value to Household Income Ratio in Moore Station
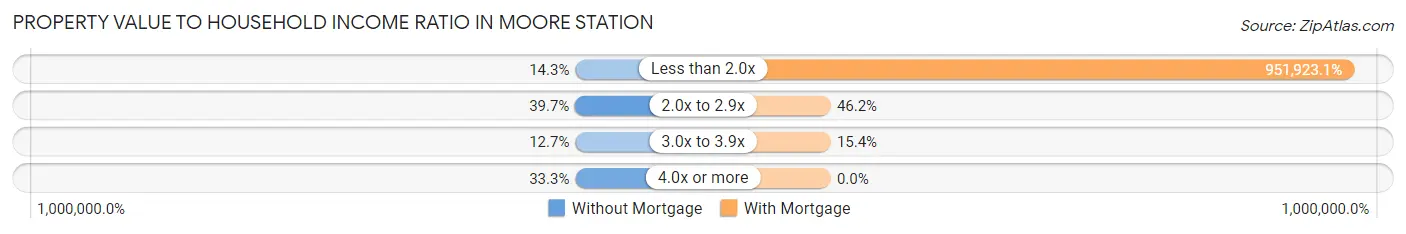
| Value-to-Income Ratio | Without Mortgage | With Mortgage |
| Less than 2.0x | 9 (14.3%) | 123,750 (951,923.1%) |
| 2.0x to 2.9x | 25 (39.7%) | 6 (46.2%) |
| 3.0x to 3.9x | 8 (12.7%) | 2 (15.4%) |
| 4.0x or more | 21 (33.3%) | 0 (0.0%) |
| Total | 63 (100.0%) | 13 (100.0%) |
Real Estate Taxes by Mortgage Status in Moore Station
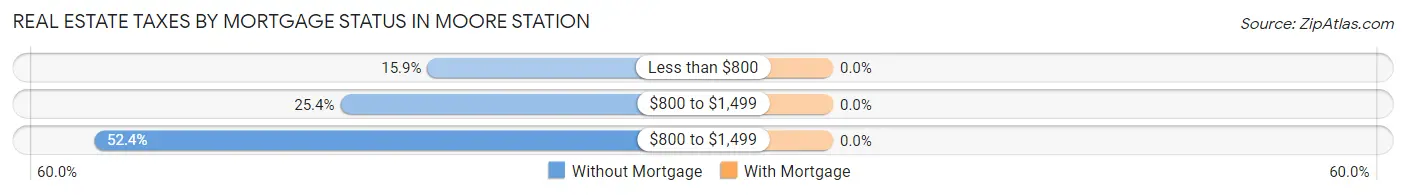
| Property Taxes | Without Mortgage | With Mortgage |
| Less than $800 | 10 (15.9%) | 0 (0.0%) |
| $800 to $1,499 | 16 (25.4%) | 0 (0.0%) |
| $800 to $1,499 | 33 (52.4%) | 0 (0.0%) |
| Total | 63 (100.0%) | 13 (100.0%) |
Health & Disability in Moore Station
Health Insurance Coverage by Age in Moore Station
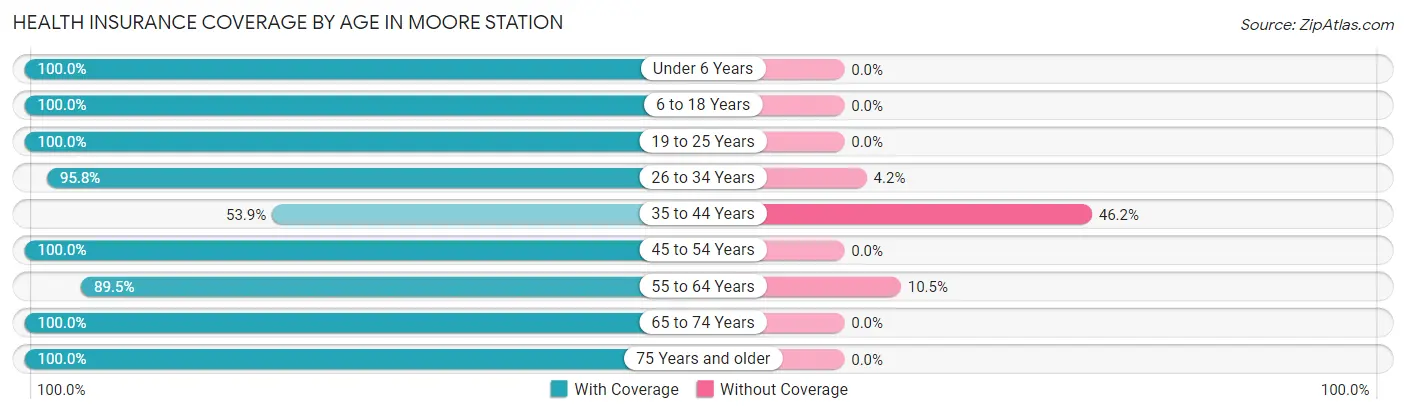
| Age Bracket | With Coverage | Without Coverage |
| Under 6 Years | 11 (100.0%) | 0 (0.0%) |
| 6 to 18 Years | 12 (100.0%) | 0 (0.0%) |
| 19 to 25 Years | 4 (100.0%) | 0 (0.0%) |
| 26 to 34 Years | 23 (95.8%) | 1 (4.2%) |
| 35 to 44 Years | 14 (53.8%) | 12 (46.2%) |
| 45 to 54 Years | 22 (100.0%) | 0 (0.0%) |
| 55 to 64 Years | 34 (89.5%) | 4 (10.5%) |
| 65 to 74 Years | 29 (100.0%) | 0 (0.0%) |
| 75 Years and older | 23 (100.0%) | 0 (0.0%) |
| Total | 172 (91.0%) | 17 (9.0%) |
Health Insurance Coverage by Citizenship Status in Moore Station
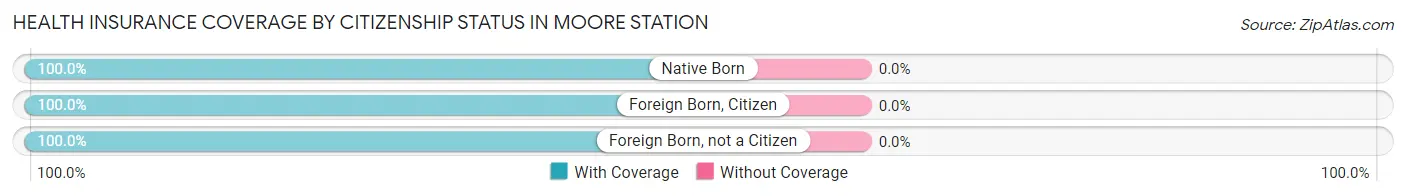
| Citizenship Status | With Coverage | Without Coverage |
| Native Born | 11 (100.0%) | 0 (0.0%) |
| Foreign Born, Citizen | 12 (100.0%) | 0 (0.0%) |
| Foreign Born, not a Citizen | 4 (100.0%) | 0 (0.0%) |
Health Insurance Coverage by Household Income in Moore Station
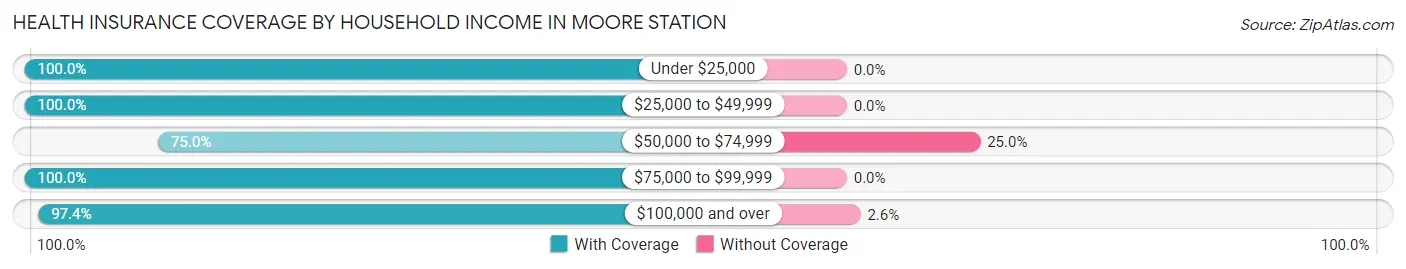
| Household Income | With Coverage | Without Coverage |
| Under $25,000 | 50 (100.0%) | 0 (0.0%) |
| $25,000 to $49,999 | 19 (100.0%) | 0 (0.0%) |
| $50,000 to $74,999 | 48 (75.0%) | 16 (25.0%) |
| $75,000 to $99,999 | 17 (100.0%) | 0 (0.0%) |
| $100,000 and over | 38 (97.4%) | 1 (2.6%) |
Public vs Private Health Insurance Coverage by Age in Moore Station
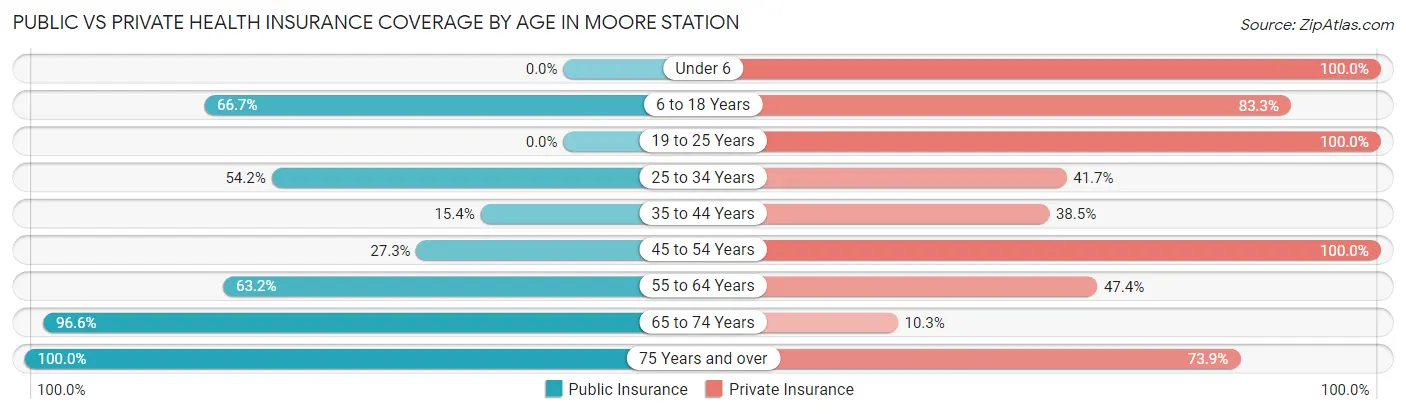
| Age Bracket | Public Insurance | Private Insurance |
| Under 6 | 0 (0.0%) | 11 (100.0%) |
| 6 to 18 Years | 8 (66.7%) | 10 (83.3%) |
| 19 to 25 Years | 0 (0.0%) | 4 (100.0%) |
| 25 to 34 Years | 13 (54.2%) | 10 (41.7%) |
| 35 to 44 Years | 4 (15.4%) | 10 (38.5%) |
| 45 to 54 Years | 6 (27.3%) | 22 (100.0%) |
| 55 to 64 Years | 24 (63.2%) | 18 (47.4%) |
| 65 to 74 Years | 28 (96.6%) | 3 (10.3%) |
| 75 Years and over | 23 (100.0%) | 17 (73.9%) |
| Total | 106 (56.1%) | 105 (55.6%) |
Disability Status by Sex by Age in Moore Station
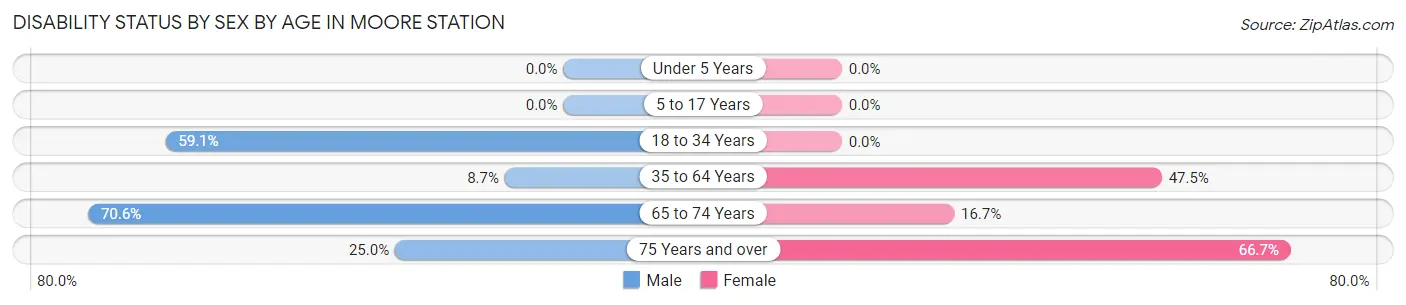
| Age Bracket | Male | Female |
| Under 5 Years | 0 (0.0%) | 0 (0.0%) |
| 5 to 17 Years | 0 (0.0%) | 0 (0.0%) |
| 18 to 34 Years | 13 (59.1%) | 0 (0.0%) |
| 35 to 64 Years | 4 (8.7%) | 19 (47.5%) |
| 65 to 74 Years | 12 (70.6%) | 2 (16.7%) |
| 75 Years and over | 2 (25.0%) | 10 (66.7%) |
Disability Class by Sex by Age in Moore Station
Disability Class: Hearing Difficulty
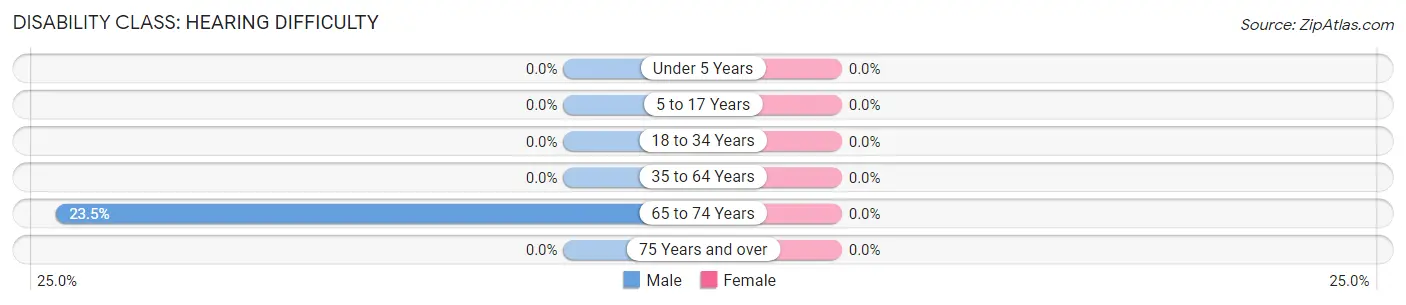
| Age Bracket | Male | Female |
| Under 5 Years | 0 (0.0%) | 0 (0.0%) |
| 5 to 17 Years | 0 (0.0%) | 0 (0.0%) |
| 18 to 34 Years | 0 (0.0%) | 0 (0.0%) |
| 35 to 64 Years | 0 (0.0%) | 0 (0.0%) |
| 65 to 74 Years | 4 (23.5%) | 0 (0.0%) |
| 75 Years and over | 0 (0.0%) | 0 (0.0%) |
Disability Class: Vision Difficulty
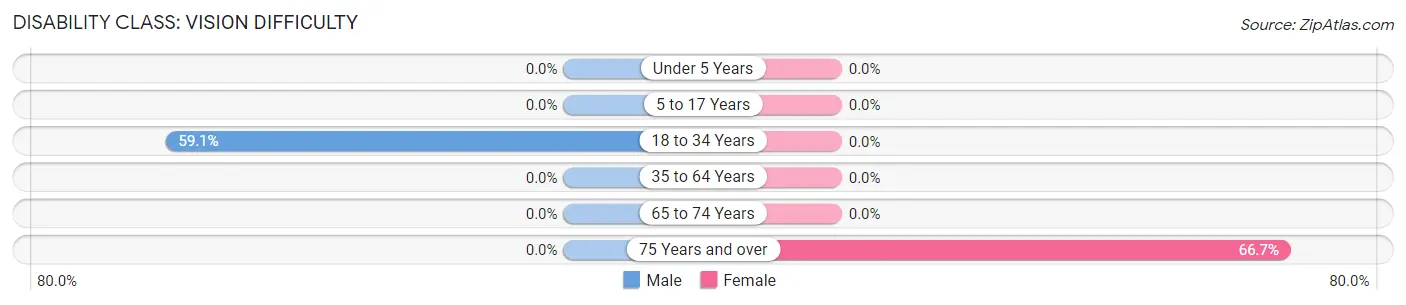
| Age Bracket | Male | Female |
| Under 5 Years | 0 (0.0%) | 0 (0.0%) |
| 5 to 17 Years | 0 (0.0%) | 0 (0.0%) |
| 18 to 34 Years | 13 (59.1%) | 0 (0.0%) |
| 35 to 64 Years | 0 (0.0%) | 0 (0.0%) |
| 65 to 74 Years | 0 (0.0%) | 0 (0.0%) |
| 75 Years and over | 0 (0.0%) | 10 (66.7%) |
Disability Class: Cognitive Difficulty
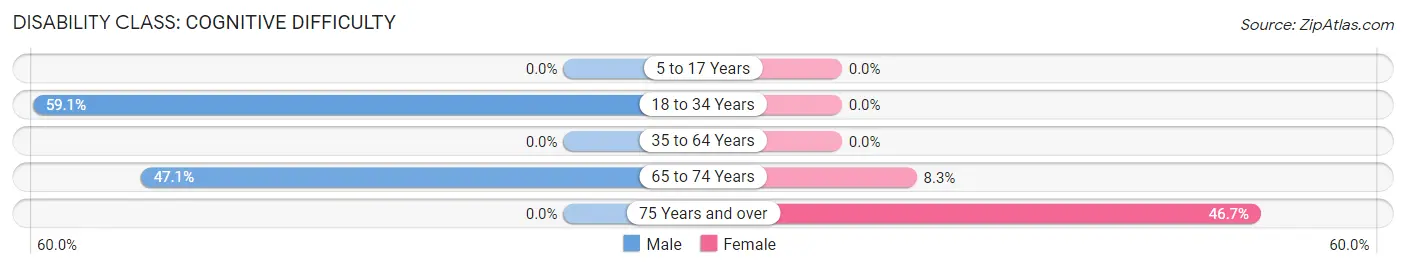
| Age Bracket | Male | Female |
| 5 to 17 Years | 0 (0.0%) | 0 (0.0%) |
| 18 to 34 Years | 13 (59.1%) | 0 (0.0%) |
| 35 to 64 Years | 0 (0.0%) | 0 (0.0%) |
| 65 to 74 Years | 8 (47.1%) | 1 (8.3%) |
| 75 Years and over | 0 (0.0%) | 7 (46.7%) |
Disability Class: Ambulatory Difficulty
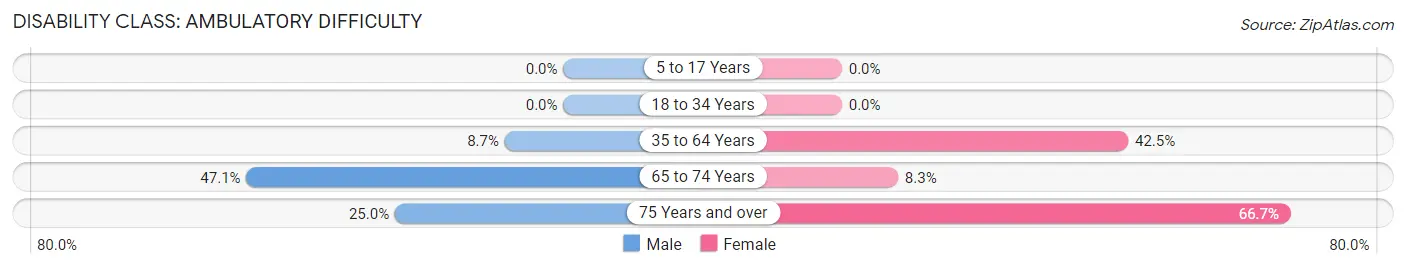
| Age Bracket | Male | Female |
| 5 to 17 Years | 0 (0.0%) | 0 (0.0%) |
| 18 to 34 Years | 0 (0.0%) | 0 (0.0%) |
| 35 to 64 Years | 4 (8.7%) | 17 (42.5%) |
| 65 to 74 Years | 8 (47.1%) | 1 (8.3%) |
| 75 Years and over | 2 (25.0%) | 10 (66.7%) |
Disability Class: Self-Care Difficulty
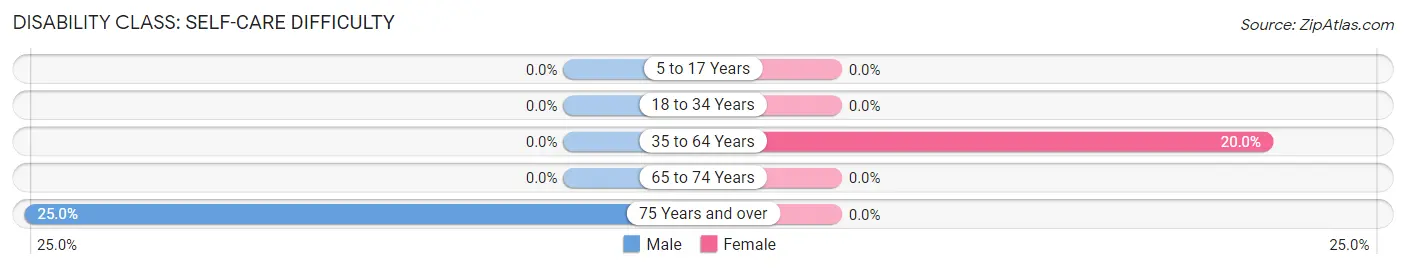
| Age Bracket | Male | Female |
| 5 to 17 Years | 0 (0.0%) | 0 (0.0%) |
| 18 to 34 Years | 0 (0.0%) | 0 (0.0%) |
| 35 to 64 Years | 0 (0.0%) | 8 (20.0%) |
| 65 to 74 Years | 0 (0.0%) | 0 (0.0%) |
| 75 Years and over | 2 (25.0%) | 0 (0.0%) |
Technology Access in Moore Station
Computing Device Access in Moore Station
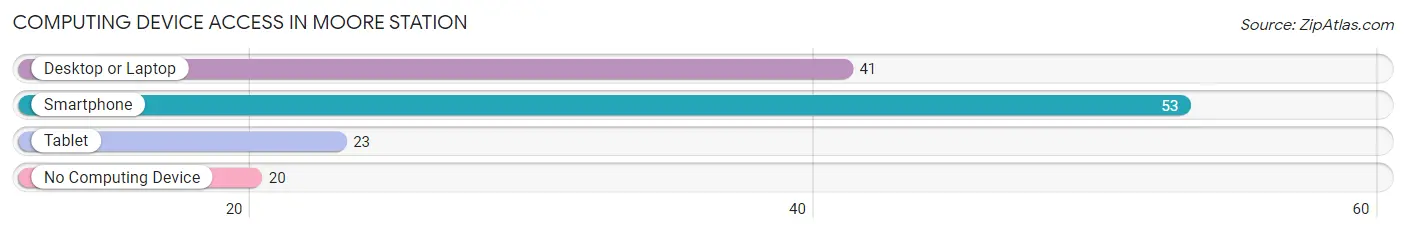
| Device Type | # Households | % Households |
| Desktop or Laptop | 41 | 48.8% |
| Smartphone | 53 | 63.1% |
| Tablet | 23 | 27.4% |
| No Computing Device | 20 | 23.8% |
| Total | 84 | 100.0% |
Internet Access in Moore Station
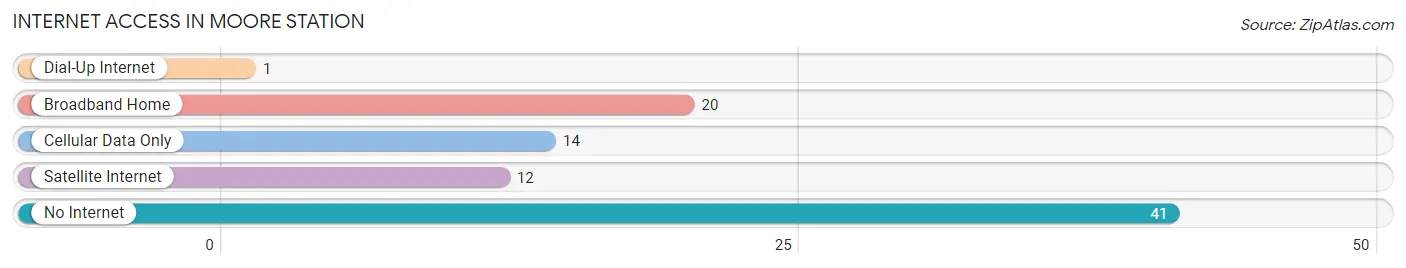
| Internet Type | # Households | % Households |
| Dial-Up Internet | 1 | 1.2% |
| Broadband Home | 20 | 23.8% |
| Cellular Data Only | 14 | 16.7% |
| Satellite Internet | 12 | 14.3% |
| No Internet | 41 | 48.8% |
| Total | 84 | 100.0% |
Moore Station Summary
Introduction
Moore Station is a small unincorporated community located in the southeastern corner of Texas, in the county of Brazoria. It is situated on the Gulf Coast, approximately 40 miles south of Houston. The community is home to a population of approximately 500 people, and is known for its rural charm and small-town atmosphere.
History
Moore Station was founded in 1854 by William Moore, a former slave who had been freed by his owner. Moore purchased a tract of land in the area and established a small farm. He also built a small store and post office, which served as the center of the community.
The community grew slowly over the years, and by the early 1900s, it had become a thriving agricultural center. Cotton, corn, and other crops were grown in the area, and the town was home to several businesses, including a general store, a blacksmith shop, and a cotton gin.
In the 1920s, the town began to decline as the local economy shifted away from agriculture. The Great Depression further weakened the town, and by the 1940s, most of the businesses had closed.
In the 1950s, the town began to experience a resurgence as the oil and gas industry began to boom in the area. The town was home to several oil and gas companies, and the population began to grow again.
Geography
Moore Station is located in the southeastern corner of Texas, in the county of Brazoria. It is situated on the Gulf Coast, approximately 40 miles south of Houston. The town is located on the banks of the San Bernard River, and is surrounded by a number of small lakes and ponds.
The town is located in a humid subtropical climate zone, and experiences hot, humid summers and mild winters. The average annual temperature is around 70 degrees Fahrenheit, and the average annual precipitation is around 50 inches.
Economy
Moore Station is a small, rural community, and the local economy is largely based on agriculture and oil and gas production. The town is home to several small farms, which produce a variety of crops, including cotton, corn, and soybeans.
The town is also home to several oil and gas companies, which produce oil and natural gas from the surrounding area. The town is also home to a number of small businesses, including restaurants, convenience stores, and auto repair shops.
Demographics
As of the 2010 census, the population of Moore Station was 498. The racial makeup of the town was 94.4% White, 2.2% African American, 0.2% Native American, 0.4% Asian, and 2.8% from other races. The median household income was $41,250, and the median family income was $48,750.
Conclusion
Moore Station is a small, rural community located in the southeastern corner of Texas. The town is home to a population of approximately 500 people, and is known for its rural charm and small-town atmosphere. The local economy is largely based on agriculture and oil and gas production, and the town is home to several small businesses. The population of Moore Station is largely white, with a small percentage of African Americans, Native Americans, and Asians.
Common Questions
What is Per Capita Income in Moore Station?
Per Capita income in Moore Station is $26,553.
What is the Median Family Income in Moore Station?
Median Family Income in Moore Station is $57,250.
What is the Median Household income in Moore Station?
Median Household Income in Moore Station is $47,500.
What is Income or Wage Gap in Moore Station?
Income or Wage Gap in Moore Station is 39.5%.
Women in Moore Station earn 60.5 cents for every dollar earned by a man.
What is Inequality or Gini Index in Moore Station?
Inequality or Gini Index in Moore Station is 0.39.
What is the Total Population of Moore Station?
Total Population of Moore Station is 189.
What is the Total Male Population of Moore Station?
Total Male Population of Moore Station is 101.
What is the Total Female Population of Moore Station?
Total Female Population of Moore Station is 88.
What is the Ratio of Males per 100 Females in Moore Station?
There are 114.77 Males per 100 Females in Moore Station.
What is the Ratio of Females per 100 Males in Moore Station?
There are 87.13 Females per 100 Males in Moore Station.
What is the Median Population Age in Moore Station?
Median Population Age in Moore Station is 54.1 Years.
What is the Average Family Size in Moore Station
Average Family Size in Moore Station is 2.8 People.
What is the Average Household Size in Moore Station
Average Household Size in Moore Station is 2.2 People.
How Large is the Labor Force in Moore Station?
There are 69 People in the Labor Forcein in Moore Station.
What is the Percentage of People in the Labor Force in Moore Station?
41.1% of People are in the Labor Force in Moore Station.
What is the Unemployment Rate in Moore Station?
Unemployment Rate in Moore Station is 1.4%.