Red Lick, TX Map & Demographics
Red Lick Map
Red Lick Overview
$42,621
PER CAPITA INCOME
$97,768
AVG FAMILY INCOME
$135,750
AVG HOUSEHOLD INCOME
35.4%
WAGE / INCOME GAP [ % ]
64.6¢/ $1
WAGE / INCOME GAP [ $ ]
0.31
INEQUALITY / GINI INDEX
1,586
TOTAL POPULATION
803
MALE POPULATION
783
FEMALE POPULATION
102.55
MALES / 100 FEMALES
97.51
FEMALES / 100 MALES
39.3
MEDIAN AGE
3.1
AVG FAMILY SIZE
2.9
AVG HOUSEHOLD SIZE
905
LABOR FORCE [ PEOPLE ]
74.7%
PERCENT IN LABOR FORCE
1.5%
UNEMPLOYMENT RATE
Income in Red Lick
Income Overview in Red Lick
Per Capita Income in Red Lick is $42,621, while median incomes of families and households are $97,768 and $135,750 respectively.
| Characteristic | Number | Measure |
| Per Capita Income | 1,586 | $42,621 |
| Median Family Income | 441 | $97,768 |
| Mean Family Income | 441 | $127,926 |
| Median Household Income | 555 | $135,750 |
| Mean Household Income | 555 | $130,085 |
| Income Deficit | 441 | $0 |
| Wage / Income Gap (%) | 1,586 | 35.40% |
| Wage / Income Gap ($) | 1,586 | 64.60¢ per $1 |
| Gini / Inequality Index | 1,586 | 0.31 |
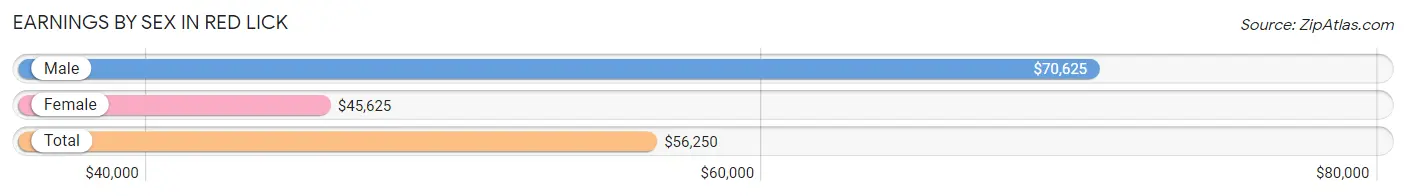
Earnings by Sex in Red Lick
Average Earnings in Red Lick are $56,250, $70,625 for men and $45,625 for women, a difference of 35.4%.
| Sex | Number | Average Earnings |
| Male | 472 (51.0%) | $70,625 |
| Female | 454 (49.0%) | $45,625 |
| Total | 926 (100.0%) | $56,250 |
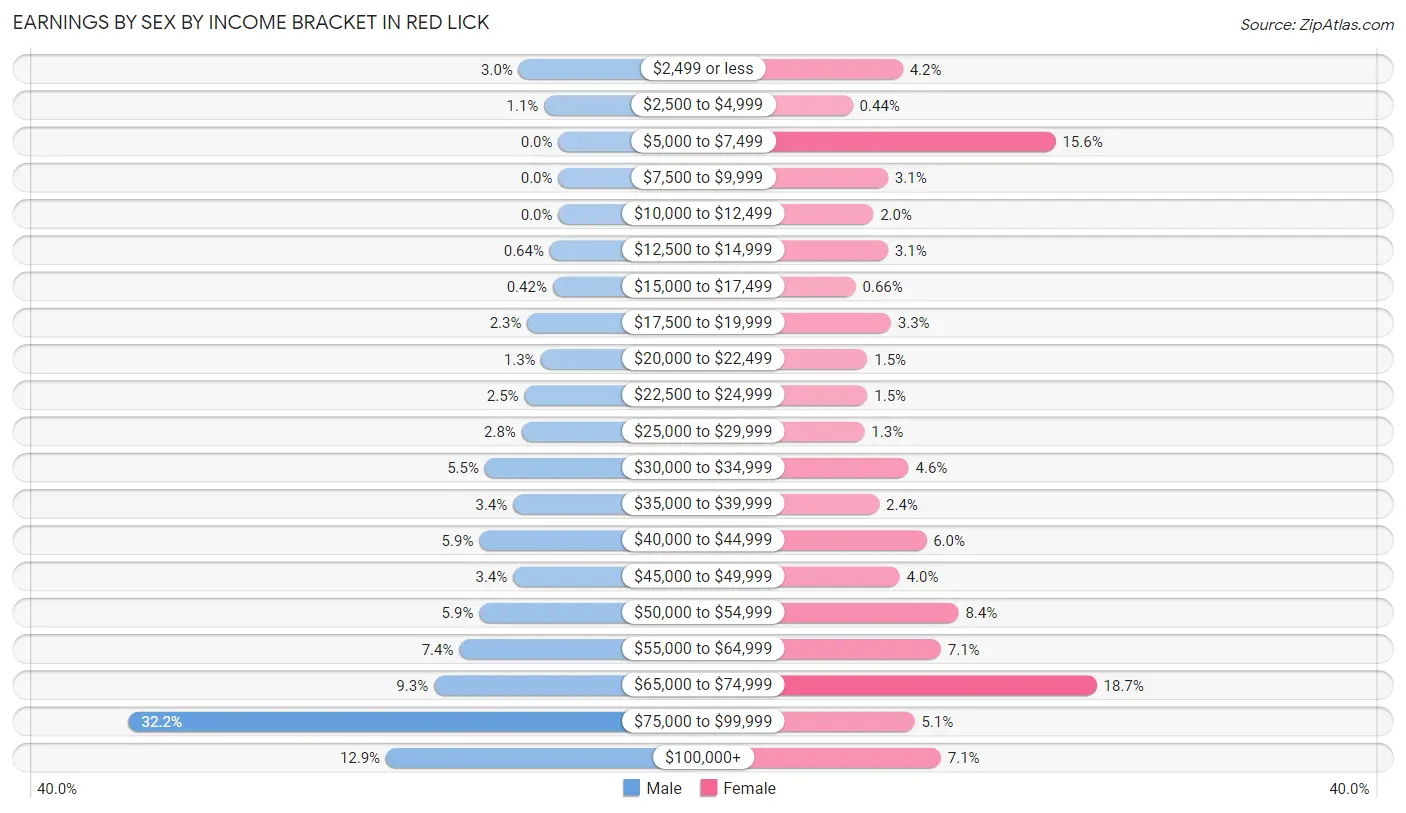
Earnings by Sex by Income Bracket in Red Lick
The most common earnings brackets in Red Lick are $75,000 to $99,999 for men (152 | 32.2%) and $65,000 to $74,999 for women (85 | 18.7%).
| Income | Male | Female |
| $2,499 or less | 14 (3.0%) | 19 (4.2%) |
| $2,500 to $4,999 | 5 (1.1%) | 2 (0.4%) |
| $5,000 to $7,499 | 0 (0.0%) | 71 (15.6%) |
| $7,500 to $9,999 | 0 (0.0%) | 14 (3.1%) |
| $10,000 to $12,499 | 0 (0.0%) | 9 (2.0%) |
| $12,500 to $14,999 | 3 (0.6%) | 14 (3.1%) |
| $15,000 to $17,499 | 2 (0.4%) | 3 (0.7%) |
| $17,500 to $19,999 | 11 (2.3%) | 15 (3.3%) |
| $20,000 to $22,499 | 6 (1.3%) | 7 (1.5%) |
| $22,500 to $24,999 | 12 (2.5%) | 7 (1.5%) |
| $25,000 to $29,999 | 13 (2.8%) | 6 (1.3%) |
| $30,000 to $34,999 | 26 (5.5%) | 21 (4.6%) |
| $35,000 to $39,999 | 16 (3.4%) | 11 (2.4%) |
| $40,000 to $44,999 | 28 (5.9%) | 27 (5.9%) |
| $45,000 to $49,999 | 16 (3.4%) | 18 (4.0%) |
| $50,000 to $54,999 | 28 (5.9%) | 38 (8.4%) |
| $55,000 to $64,999 | 35 (7.4%) | 32 (7.0%) |
| $65,000 to $74,999 | 44 (9.3%) | 85 (18.7%) |
| $75,000 to $99,999 | 152 (32.2%) | 23 (5.1%) |
| $100,000+ | 61 (12.9%) | 32 (7.0%) |
| Total | 472 (100.0%) | 454 (100.0%) |
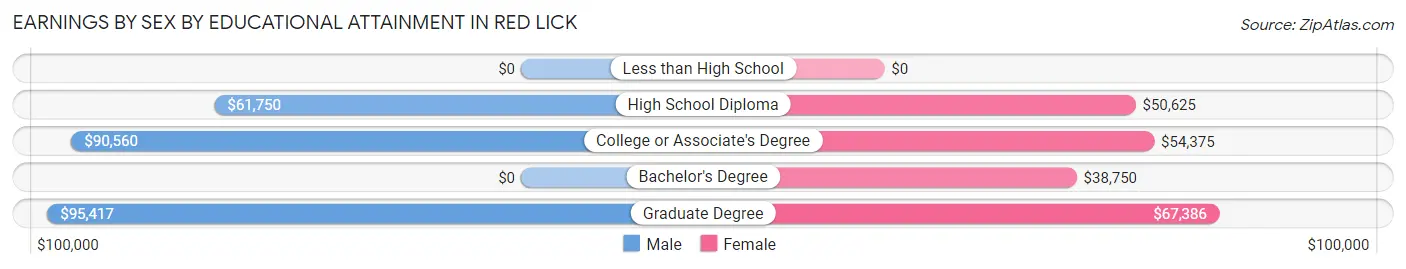
Earnings by Sex by Educational Attainment in Red Lick
Average earnings in Red Lick are $80,156 for men and $53,542 for women, a difference of 33.2%. Men with an educational attainment of graduate degree enjoy the highest average annual earnings of $95,417, while those with high school diploma education earn the least with $61,750. Women with an educational attainment of graduate degree earn the most with the average annual earnings of $67,386, while those with bachelor's degree education have the smallest earnings of $38,750.
| Educational Attainment | Male Income | Female Income |
| Less than High School | - | - |
| High School Diploma | $61,750 | $50,625 |
| College or Associate's Degree | $90,560 | $54,375 |
| Bachelor's Degree | - | - |
| Graduate Degree | $95,417 | $67,386 |
| Total | $80,156 | $53,542 |
Family Income in Red Lick
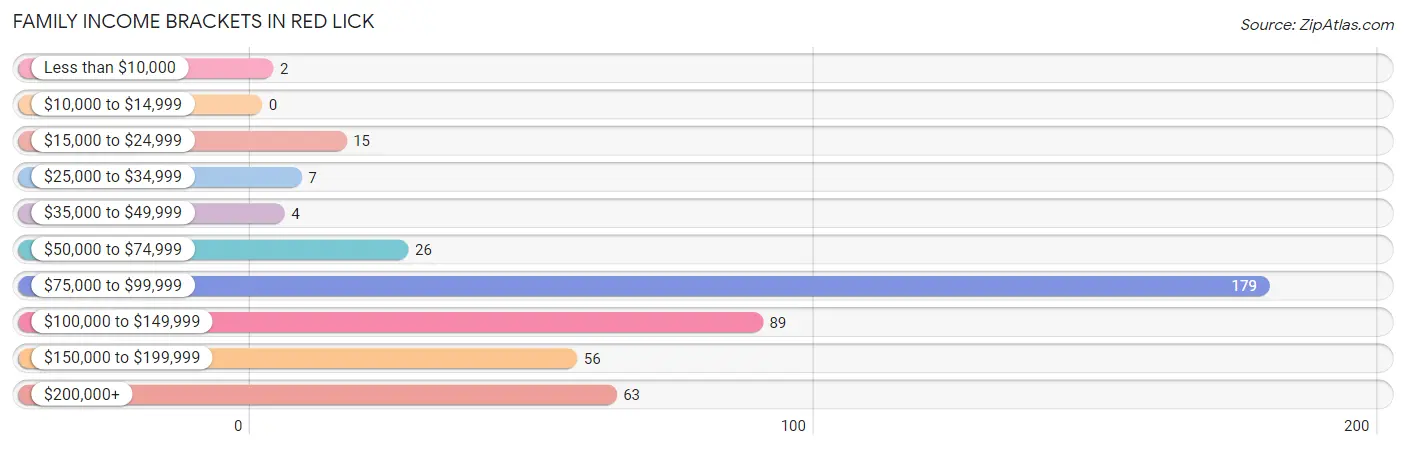
Family Income Brackets in Red Lick
According to the Red Lick family income data, there are 179 families falling into the $75,000 to $99,999 income range, which is the most common income bracket and makes up 40.6% of all families.
| Income Bracket | # Families | % Families |
| Less than $10,000 | 2 | 0.5% |
| $10,000 to $14,999 | 0 | 0.0% |
| $15,000 to $24,999 | 15 | 3.4% |
| $25,000 to $34,999 | 7 | 1.6% |
| $35,000 to $49,999 | 4 | 0.9% |
| $50,000 to $74,999 | 26 | 5.9% |
| $75,000 to $99,999 | 179 | 40.6% |
| $100,000 to $149,999 | 89 | 20.2% |
| $150,000 to $199,999 | 56 | 12.7% |
| $200,000+ | 63 | 14.3% |
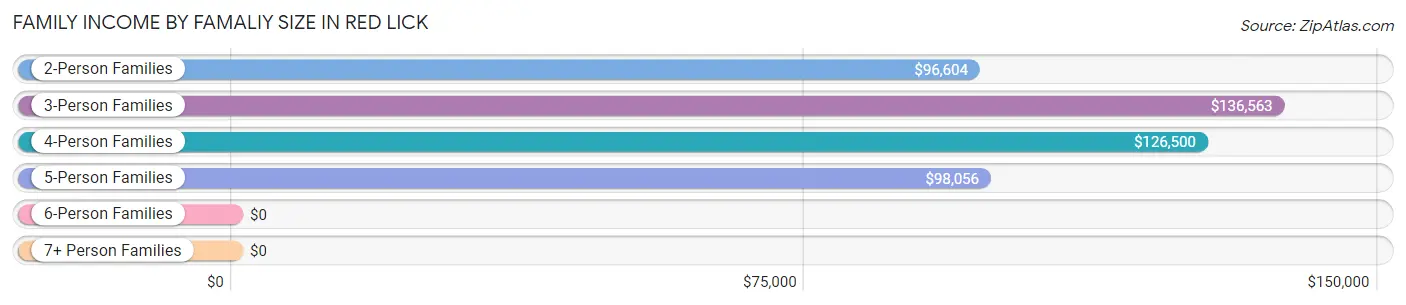
Family Income by Famaliy Size in Red Lick
3-person families (87 | 19.7%) account for the highest median family income in Red Lick with $136,563 per family, while 2-person families (206 | 46.7%) have the highest median income of $48,302 per family member.
| Income Bracket | # Families | Median Income |
| 2-Person Families | 206 (46.7%) | $96,604 |
| 3-Person Families | 87 (19.7%) | $136,563 |
| 4-Person Families | 108 (24.5%) | $126,500 |
| 5-Person Families | 34 (7.7%) | $98,056 |
| 6-Person Families | 5 (1.1%) | $0 |
| 7+ Person Families | 1 (0.2%) | $0 |
| Total | 441 (100.0%) | $97,768 |
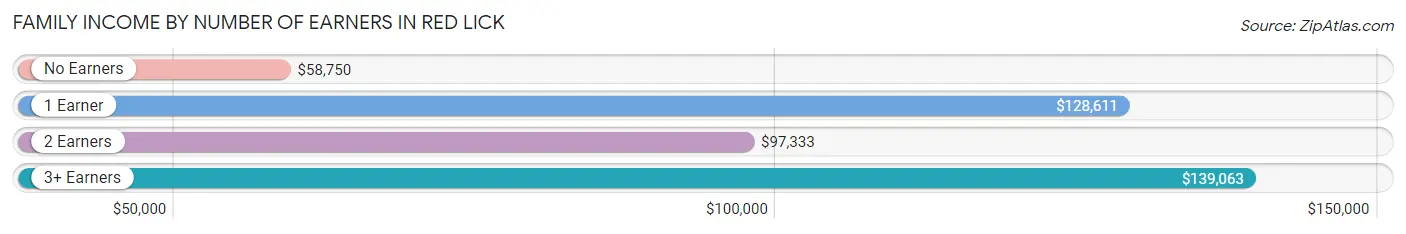
Family Income by Number of Earners in Red Lick
The median family income in Red Lick is $97,768, with families comprising 3+ earners (43) having the highest median family income of $139,063, while families with no earners (34) have the lowest median family income of $58,750, accounting for 9.8% and 7.7% of families, respectively.
| Number of Earners | # Families | Median Income |
| No Earners | 34 (7.7%) | $58,750 |
| 1 Earner | 54 (12.2%) | $128,611 |
| 2 Earners | 310 (70.3%) | $97,333 |
| 3+ Earners | 43 (9.8%) | $139,063 |
| Total | 441 (100.0%) | $97,768 |
Household Income in Red Lick
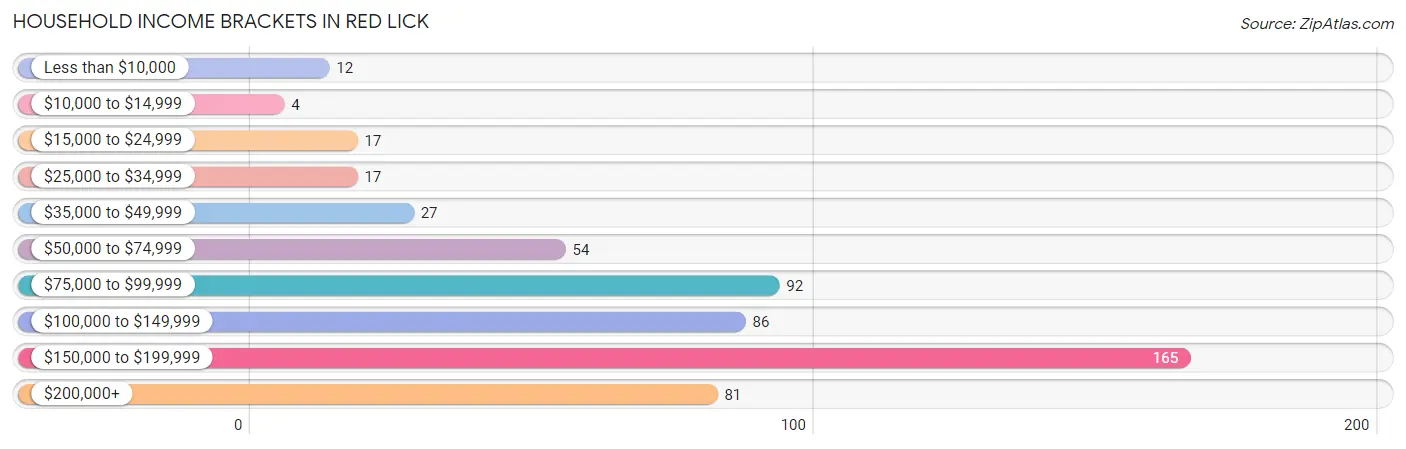
Household Income Brackets in Red Lick
With 165 households falling in the category, the $150,000 to $199,999 income range is the most frequent in Red Lick, accounting for 29.7% of all households. In contrast, only 4 households (0.7%) fall into the $10,000 to $14,999 income bracket, making it the least populous group.
| Income Bracket | # Households | % Households |
| Less than $10,000 | 12 | 2.2% |
| $10,000 to $14,999 | 4 | 0.7% |
| $15,000 to $24,999 | 17 | 3.1% |
| $25,000 to $34,999 | 17 | 3.1% |
| $35,000 to $49,999 | 27 | 4.9% |
| $50,000 to $74,999 | 54 | 9.7% |
| $75,000 to $99,999 | 92 | 16.6% |
| $100,000 to $149,999 | 86 | 15.5% |
| $150,000 to $199,999 | 165 | 29.7% |
| $200,000+ | 81 | 14.6% |
Household Income by Householder Age in Red Lick
The median household income in Red Lick is $135,750, with the highest median household income of $165,476 found in the 45 to 64 years age bracket for the primary householder. A total of 272 households (49.0%) fall into this category. Meanwhile, the 65+ years age bracket for the primary householder has the lowest median household income of $52,188, with 118 households (21.3%) in this group.
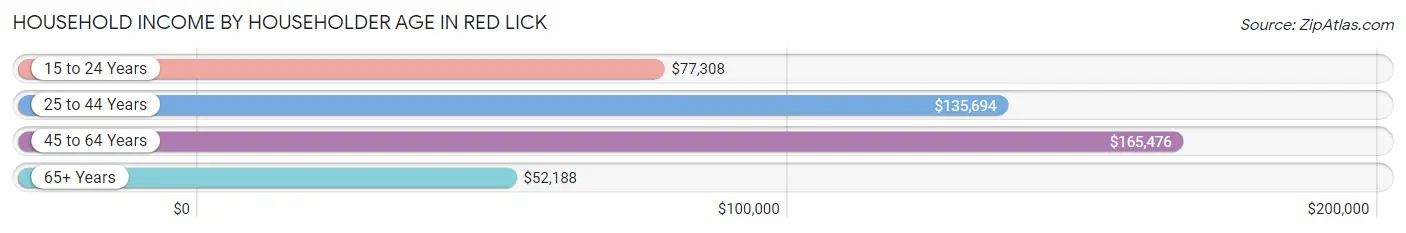
| Income Bracket | # Households | Median Income |
| 15 to 24 Years | 24 (4.3%) | $77,308 |
| 25 to 44 Years | 141 (25.4%) | $135,694 |
| 45 to 64 Years | 272 (49.0%) | $165,476 |
| 65+ Years | 118 (21.3%) | $52,188 |
| Total | 555 (100.0%) | $135,750 |
Poverty in Red Lick
Income Below Poverty by Sex and Age in Red Lick
With 1.4% poverty level for males and 5.6% for females among the residents of Red Lick, 16 and 17 year old males and under 5 year old females are the most vulnerable to poverty, with 7 males (12.3%) and 12 females (16.2%) in their respective age groups living below the poverty level.
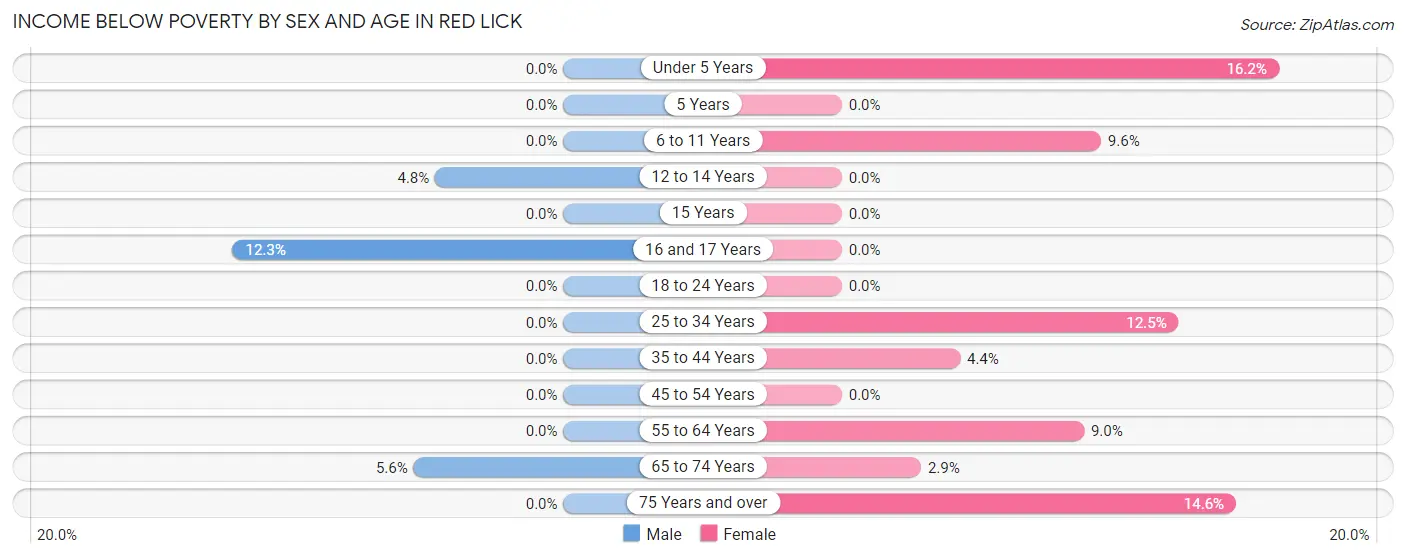
| Age Bracket | Male | Female |
| Under 5 Years | 0 (0.0%) | 12 (16.2%) |
| 5 Years | 0 (0.0%) | 0 (0.0%) |
| 6 to 11 Years | 0 (0.0%) | 5 (9.6%) |
| 12 to 14 Years | 2 (4.8%) | 0 (0.0%) |
| 15 Years | 0 (0.0%) | 0 (0.0%) |
| 16 and 17 Years | 7 (12.3%) | 0 (0.0%) |
| 18 to 24 Years | 0 (0.0%) | 0 (0.0%) |
| 25 to 34 Years | 0 (0.0%) | 6 (12.5%) |
| 35 to 44 Years | 0 (0.0%) | 5 (4.4%) |
| 45 to 54 Years | 0 (0.0%) | 0 (0.0%) |
| 55 to 64 Years | 0 (0.0%) | 8 (9.0%) |
| 65 to 74 Years | 2 (5.6%) | 2 (2.9%) |
| 75 Years and over | 0 (0.0%) | 6 (14.6%) |
| Total | 11 (1.4%) | 44 (5.6%) |
Income Above Poverty by Sex and Age in Red Lick
According to the poverty statistics in Red Lick, males aged under 5 years and females aged 12 to 14 years are the age groups that are most secure financially, with 100.0% of males and 100.0% of females in these age groups living above the poverty line.
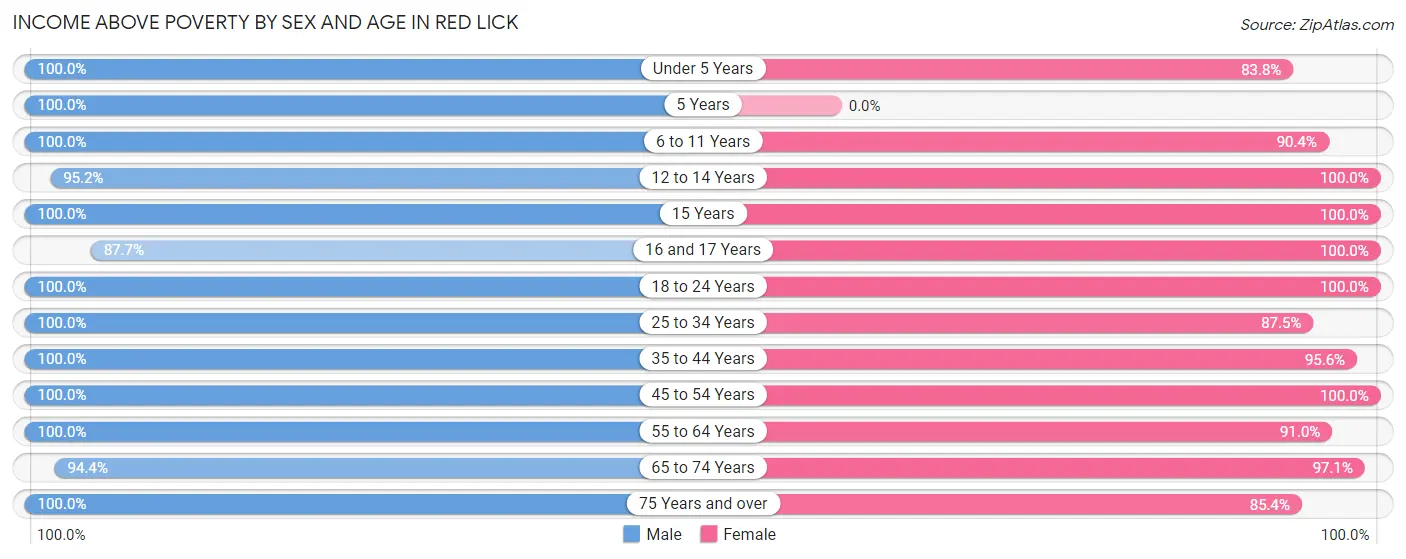
| Age Bracket | Male | Female |
| Under 5 Years | 13 (100.0%) | 62 (83.8%) |
| 5 Years | 24 (100.0%) | 0 (0.0%) |
| 6 to 11 Years | 92 (100.0%) | 47 (90.4%) |
| 12 to 14 Years | 40 (95.2%) | 46 (100.0%) |
| 15 Years | 16 (100.0%) | 12 (100.0%) |
| 16 and 17 Years | 50 (87.7%) | 16 (100.0%) |
| 18 to 24 Years | 57 (100.0%) | 107 (100.0%) |
| 25 to 34 Years | 26 (100.0%) | 42 (87.5%) |
| 35 to 44 Years | 140 (100.0%) | 109 (95.6%) |
| 45 to 54 Years | 218 (100.0%) | 113 (100.0%) |
| 55 to 64 Years | 54 (100.0%) | 81 (91.0%) |
| 65 to 74 Years | 34 (94.4%) | 66 (97.1%) |
| 75 Years and over | 28 (100.0%) | 35 (85.4%) |
| Total | 792 (98.6%) | 736 (94.4%) |
Income Below Poverty Among Married-Couple Families in Red Lick
The poverty statistics for married-couple families in Red Lick show that 0.7% or 2 of the total 304 families live below the poverty line. Families with no children have the highest poverty rate of 1.4%, comprising of 2 families. On the other hand, families with 1 or 2 children have the lowest poverty rate of 0.0%, which includes 0 families.
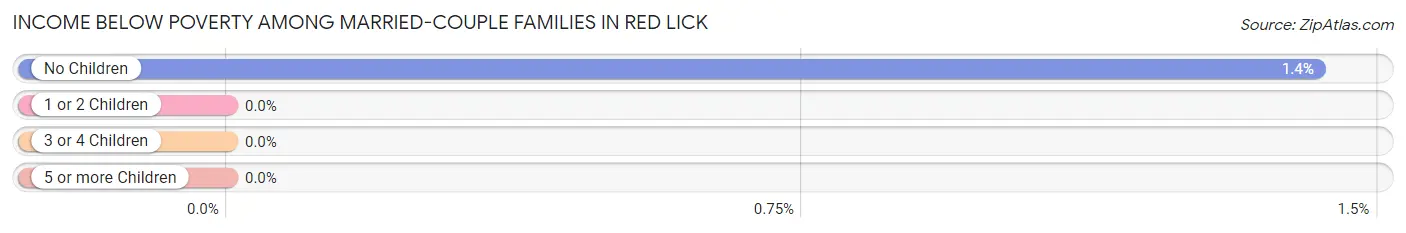
| Children | Above Poverty | Below Poverty |
| No Children | 139 (98.6%) | 2 (1.4%) |
| 1 or 2 Children | 132 (100.0%) | 0 (0.0%) |
| 3 or 4 Children | 30 (100.0%) | 0 (0.0%) |
| 5 or more Children | 1 (100.0%) | 0 (0.0%) |
| Total | 302 (99.3%) | 2 (0.7%) |
Income Below Poverty Among Single-Parent Households in Red Lick
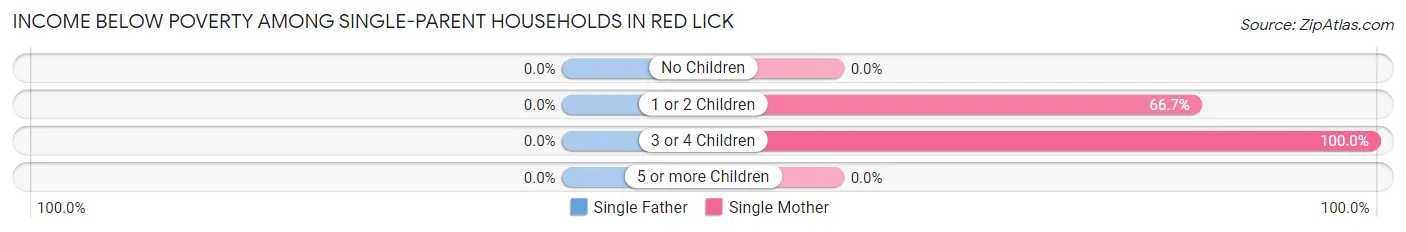
| Children | Single Father | Single Mother |
| No Children | 0 (0.0%) | 0 (0.0%) |
| 1 or 2 Children | 0 (0.0%) | 10 (66.7%) |
| 3 or 4 Children | 0 (0.0%) | 1 (100.0%) |
| 5 or more Children | 0 (0.0%) | 0 (0.0%) |
| Total | 0 (0.0%) | 11 (61.1%) |
Income Below Poverty Among Married-Couple vs Single-Parent Households in Red Lick
The poverty data for Red Lick shows that 2 of the married-couple family households (0.7%) and 11 of the single-parent households (8.0%) are living below the poverty level. Within the married-couple family households, those with no children have the highest poverty rate, with 2 households (1.4%) falling below the poverty line. Among the single-parent households, those with 3 or 4 children have the highest poverty rate, with 1 household (100.0%) living below poverty.
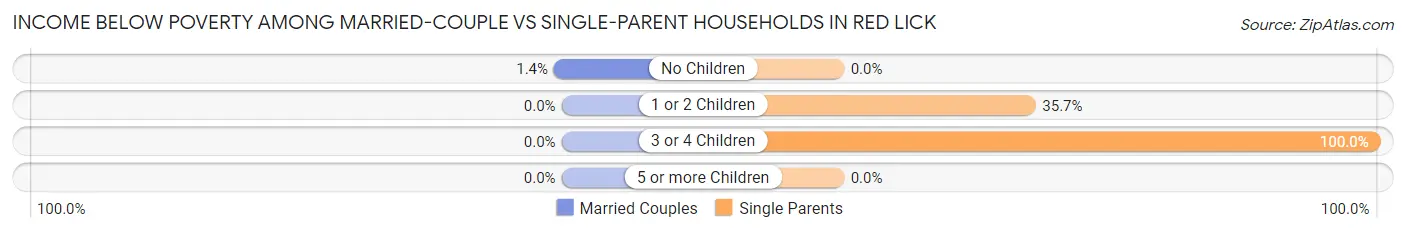
| Children | Married-Couple Families | Single-Parent Households |
| No Children | 2 (1.4%) | 0 (0.0%) |
| 1 or 2 Children | 0 (0.0%) | 10 (35.7%) |
| 3 or 4 Children | 0 (0.0%) | 1 (100.0%) |
| 5 or more Children | 0 (0.0%) | 0 (0.0%) |
| Total | 2 (0.7%) | 11 (8.0%) |
Race in Red Lick
The most populous races in Red Lick are White / Caucasian (1,350 | 85.1%), Black / African American (90 | 5.7%), and Two or more Races (74 | 4.7%).
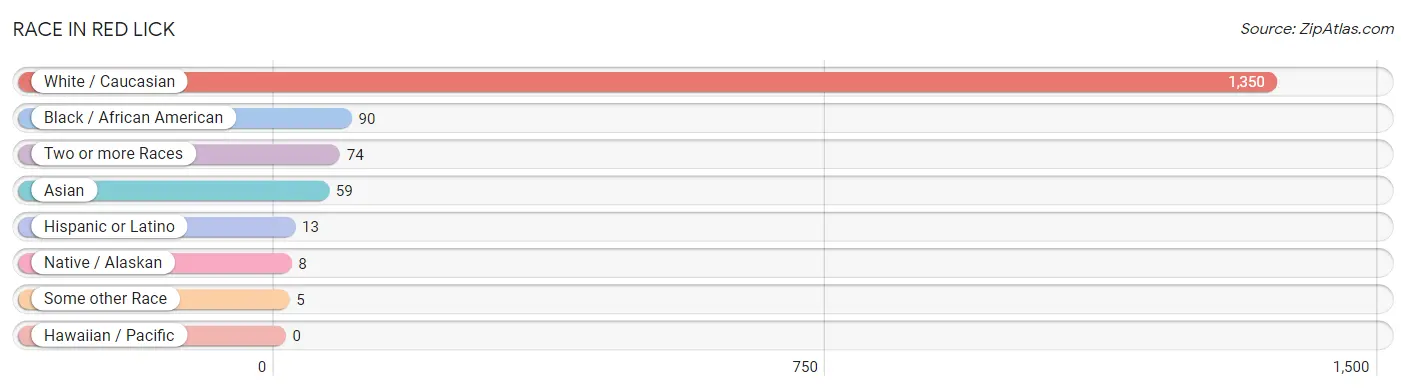
| Race | # Population | % Population |
| Asian | 59 | 3.7% |
| Black / African American | 90 | 5.7% |
| Hawaiian / Pacific | 0 | 0.0% |
| Hispanic or Latino | 13 | 0.8% |
| Native / Alaskan | 8 | 0.5% |
| White / Caucasian | 1,350 | 85.1% |
| Two or more Races | 74 | 4.7% |
| Some other Race | 5 | 0.3% |
| Total | 1,586 | 100.0% |
Ancestry in Red Lick
The most populous ancestries reported in Red Lick are American (697 | 44.0%), German (149 | 9.4%), English (105 | 6.6%), Irish (74 | 4.7%), and Sri Lankan (61 | 3.8%), together accounting for 68.5% of all Red Lick residents.
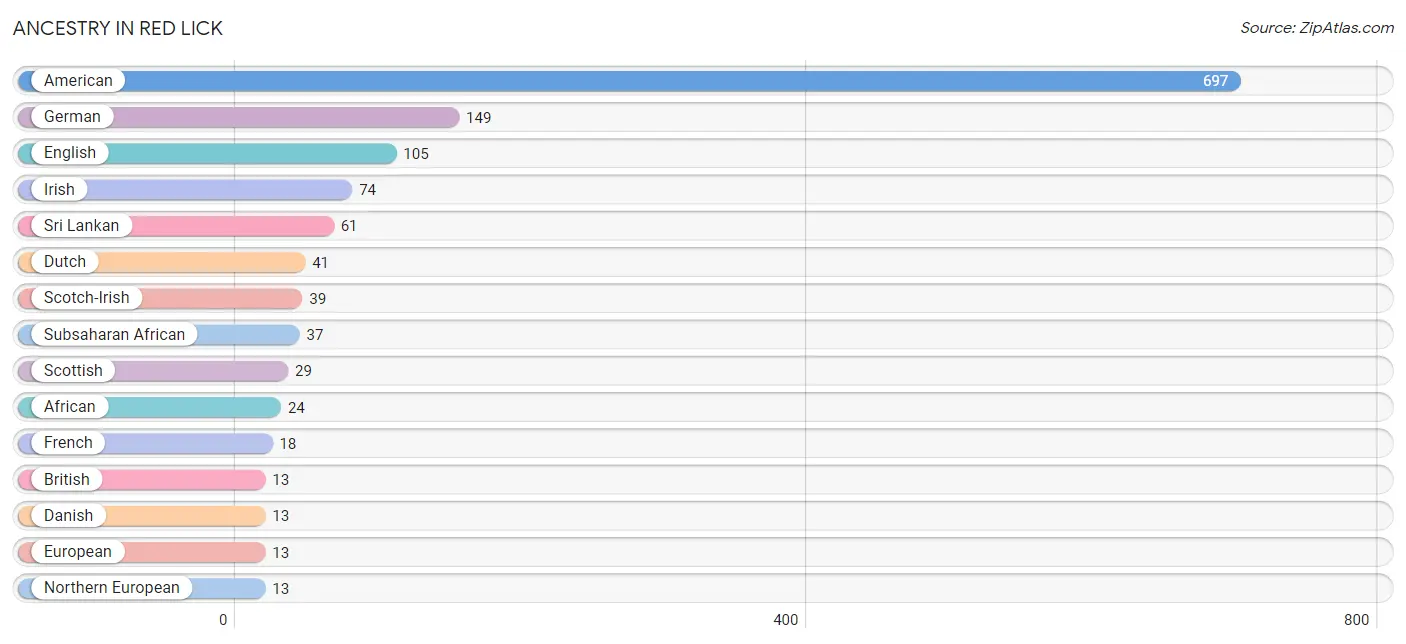
| Ancestry | # Population | % Population |
| African | 24 | 1.5% |
| American | 697 | 44.0% |
| Australian | 9 | 0.6% |
| Bhutanese | 10 | 0.6% |
| British | 13 | 0.8% |
| Cherokee | 10 | 0.6% |
| Danish | 13 | 0.8% |
| Dutch | 41 | 2.6% |
| Dutch West Indian | 4 | 0.3% |
| English | 105 | 6.6% |
| European | 13 | 0.8% |
| French | 18 | 1.1% |
| French Canadian | 11 | 0.7% |
| German | 149 | 9.4% |
| Indian (Asian) | 11 | 0.7% |
| Irish | 74 | 4.7% |
| Korean | 2 | 0.1% |
| Mexican | 9 | 0.6% |
| Navajo | 4 | 0.3% |
| Northern European | 13 | 0.8% |
| Osage | 2 | 0.1% |
| Polish | 4 | 0.3% |
| Russian | 4 | 0.3% |
| Scandinavian | 4 | 0.3% |
| Scotch-Irish | 39 | 2.5% |
| Scottish | 29 | 1.8% |
| South American | 4 | 0.3% |
| Sri Lankan | 61 | 3.8% |
| Subsaharan African | 37 | 2.3% |
| Swiss | 5 | 0.3% |
| Venezuelan | 4 | 0.3% |
| Welsh | 7 | 0.4% | View All 32 Rows |
Immigrants in Red Lick
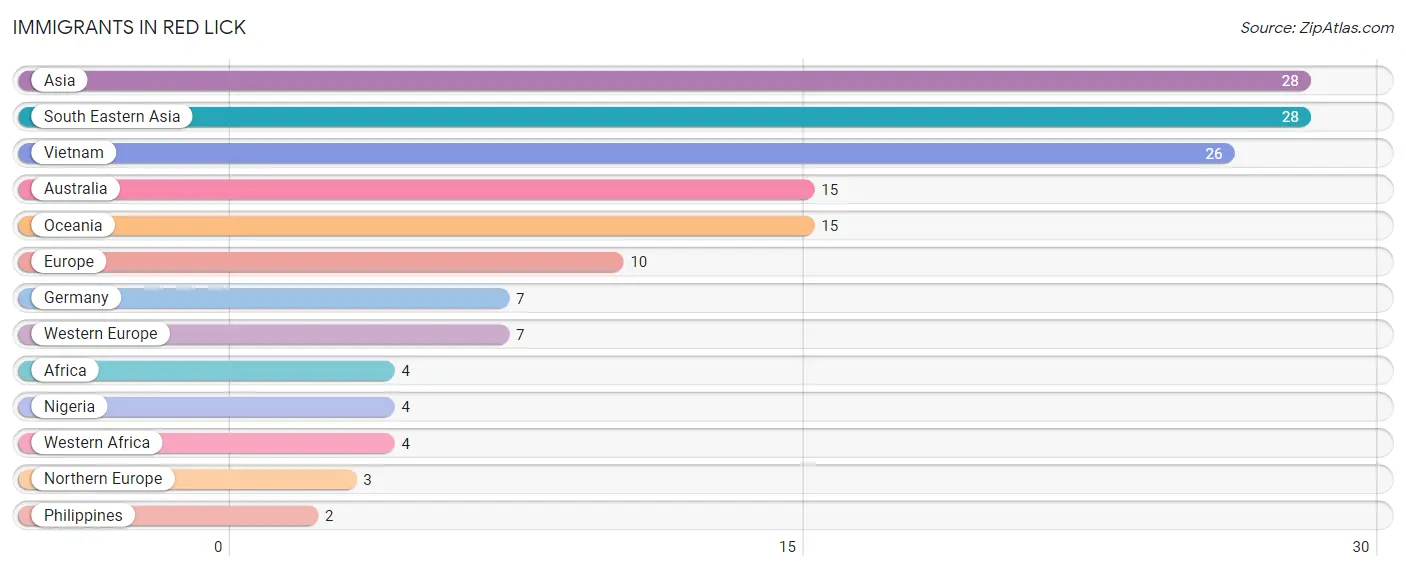
The most numerous immigrant groups reported in Red Lick came from Asia (28 | 1.8%), South Eastern Asia (28 | 1.8%), Vietnam (26 | 1.6%), Australia (15 | 0.9%), and Oceania (15 | 0.9%), together accounting for 7.1% of all Red Lick residents.
| Immigration Origin | # Population | % Population |
| Africa | 4 | 0.3% |
| Asia | 28 | 1.8% |
| Australia | 15 | 0.9% |
| Europe | 10 | 0.6% |
| Germany | 7 | 0.4% |
| Nigeria | 4 | 0.3% |
| Northern Europe | 3 | 0.2% |
| Oceania | 15 | 0.9% |
| Philippines | 2 | 0.1% |
| South Eastern Asia | 28 | 1.8% |
| Vietnam | 26 | 1.6% |
| Western Africa | 4 | 0.3% |
| Western Europe | 7 | 0.4% | View All 13 Rows |
Sex and Age in Red Lick
Sex and Age in Red Lick
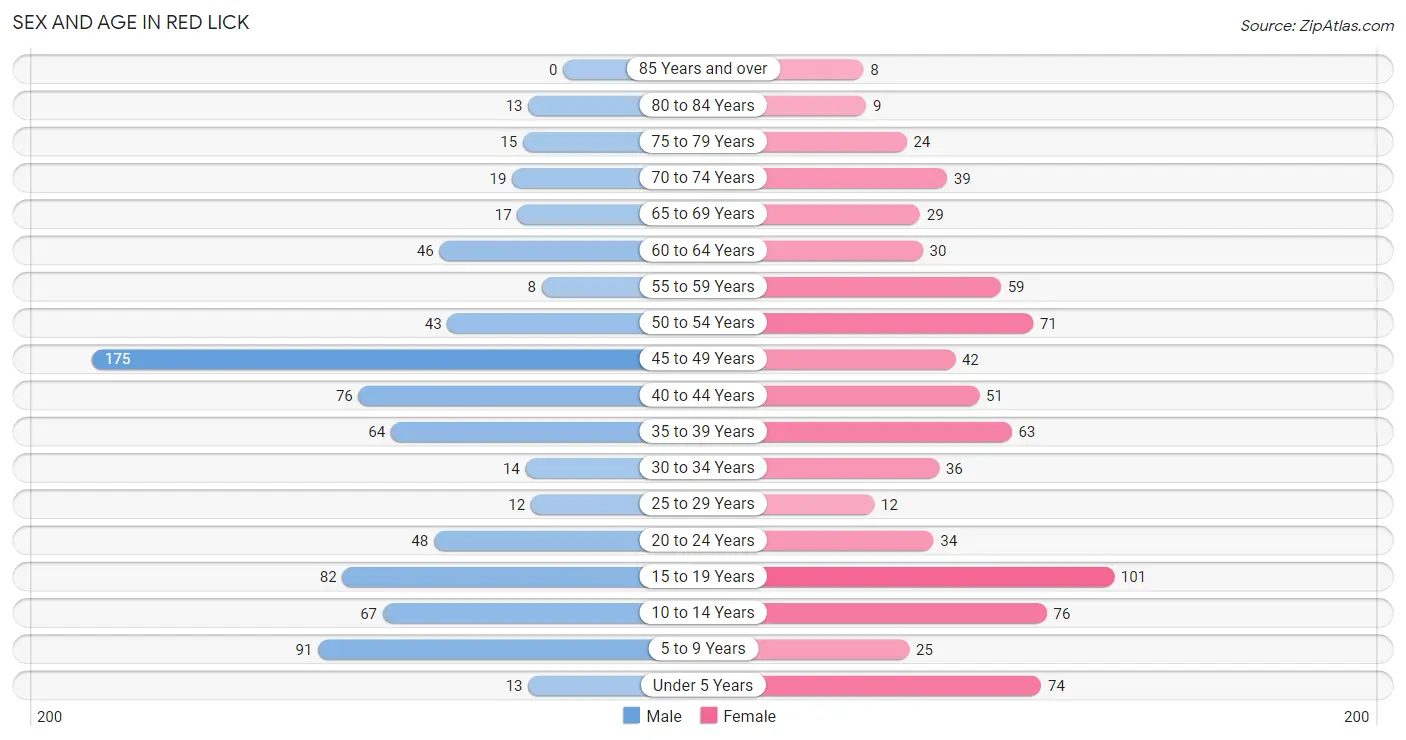
The most populous age groups in Red Lick are 45 to 49 Years (175 | 21.8%) for men and 15 to 19 Years (101 | 12.9%) for women.
| Age Bracket | Male | Female |
| Under 5 Years | 13 (1.6%) | 74 (9.5%) |
| 5 to 9 Years | 91 (11.3%) | 25 (3.2%) |
| 10 to 14 Years | 67 (8.3%) | 76 (9.7%) |
| 15 to 19 Years | 82 (10.2%) | 101 (12.9%) |
| 20 to 24 Years | 48 (6.0%) | 34 (4.3%) |
| 25 to 29 Years | 12 (1.5%) | 12 (1.5%) |
| 30 to 34 Years | 14 (1.7%) | 36 (4.6%) |
| 35 to 39 Years | 64 (8.0%) | 63 (8.1%) |
| 40 to 44 Years | 76 (9.5%) | 51 (6.5%) |
| 45 to 49 Years | 175 (21.8%) | 42 (5.4%) |
| 50 to 54 Years | 43 (5.3%) | 71 (9.1%) |
| 55 to 59 Years | 8 (1.0%) | 59 (7.5%) |
| 60 to 64 Years | 46 (5.7%) | 30 (3.8%) |
| 65 to 69 Years | 17 (2.1%) | 29 (3.7%) |
| 70 to 74 Years | 19 (2.4%) | 39 (5.0%) |
| 75 to 79 Years | 15 (1.9%) | 24 (3.1%) |
| 80 to 84 Years | 13 (1.6%) | 9 (1.1%) |
| 85 Years and over | 0 (0.0%) | 8 (1.0%) |
| Total | 803 (100.0%) | 783 (100.0%) |
Families and Households in Red Lick
Median Family Size in Red Lick
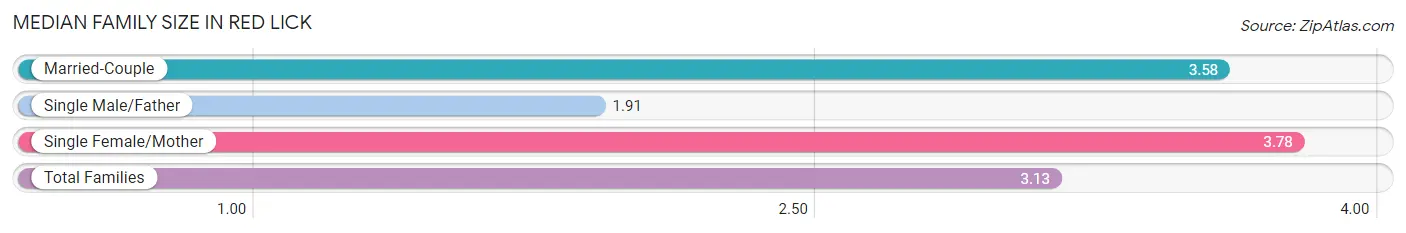
The median family size in Red Lick is 3.13 persons per family, with single female/mother families (18 | 4.1%) accounting for the largest median family size of 3.78 persons per family. On the other hand, single male/father families (119 | 27.0%) represent the smallest median family size with 1.91 persons per family.
| Family Type | # Families | Family Size |
| Married-Couple | 304 (68.9%) | 3.58 |
| Single Male/Father | 119 (27.0%) | 1.91 |
| Single Female/Mother | 18 (4.1%) | 3.78 |
| Total Families | 441 (100.0%) | 3.13 |
Median Household Size in Red Lick
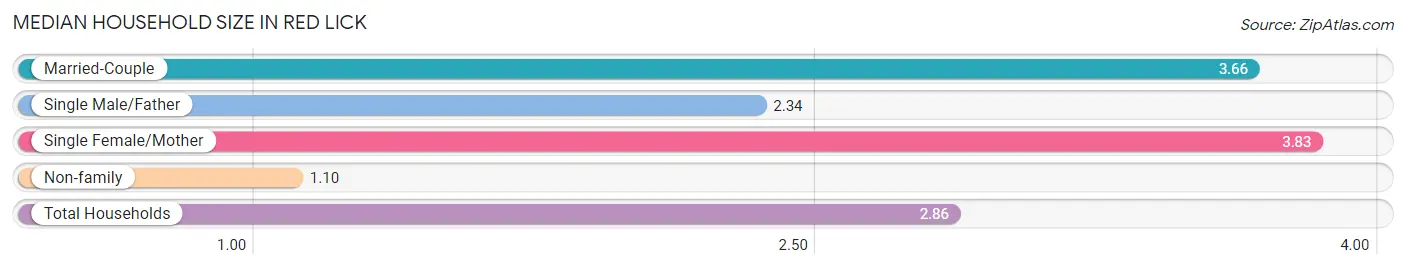
The median household size in Red Lick is 2.86 persons per household, with single female/mother households (18 | 3.2%) accounting for the largest median household size of 3.83 persons per household. non-family households (114 | 20.5%) represent the smallest median household size with 1.10 persons per household.
| Household Type | # Households | Household Size |
| Married-Couple | 304 (54.8%) | 3.66 |
| Single Male/Father | 119 (21.4%) | 2.34 |
| Single Female/Mother | 18 (3.2%) | 3.83 |
| Non-family | 114 (20.5%) | 1.10 |
| Total Households | 555 (100.0%) | 2.86 |
Household Size by Marriage Status in Red Lick
Out of a total of 555 households in Red Lick, 441 (79.5%) are family households, while 114 (20.5%) are nonfamily households. The most numerous type of family households are 3-person households, comprising 198, and the most common type of nonfamily households are 1-person households, comprising 105.
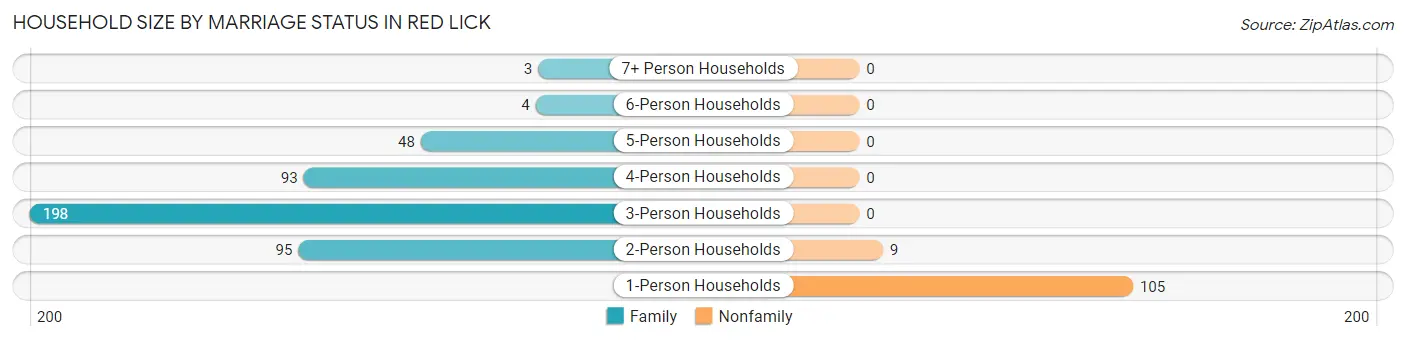
| Household Size | Family Households | Nonfamily Households |
| 1-Person Households | - | 105 (18.9%) |
| 2-Person Households | 95 (17.1%) | 9 (1.6%) |
| 3-Person Households | 198 (35.7%) | 0 (0.0%) |
| 4-Person Households | 93 (16.8%) | 0 (0.0%) |
| 5-Person Households | 48 (8.6%) | 0 (0.0%) |
| 6-Person Households | 4 (0.7%) | 0 (0.0%) |
| 7+ Person Households | 3 (0.5%) | 0 (0.0%) |
| Total | 441 (79.5%) | 114 (20.5%) |
Female Fertility in Red Lick
Fertility by Age in Red Lick
Average fertility rate in Red Lick is 15.0 births per 1,000 women. Women in the age bracket of 35 to 50 years have the highest fertility rate with 31.0 births per 1,000 women. Women in the age bracket of 35 to 50 years acount for 100.0% of all women with births.
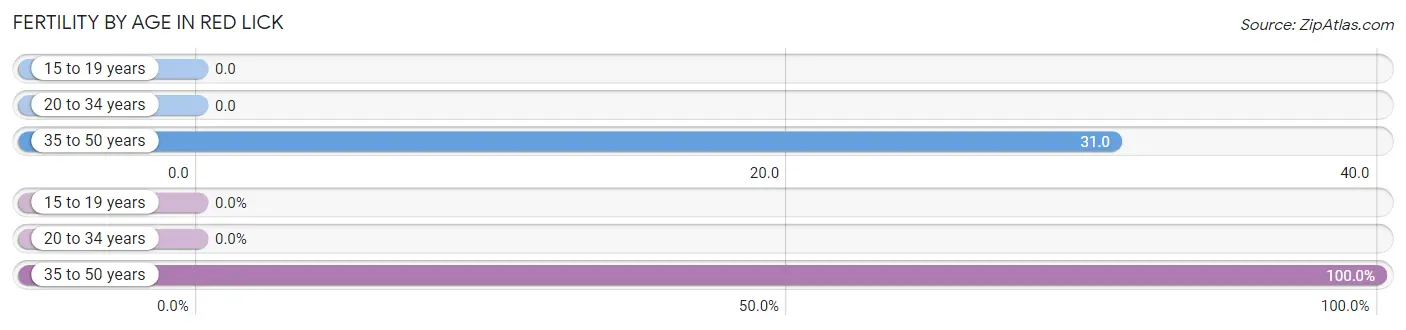
| Age Bracket | Women with Births | Births / 1,000 Women |
| 15 to 19 years | 0 (0.0%) | 0.0 |
| 20 to 34 years | 0 (0.0%) | 0.0 |
| 35 to 50 years | 5 (100.0%) | 31.0 |
| Total | 5 (100.0%) | 15.0 |
Fertility by Age by Marriage Status in Red Lick
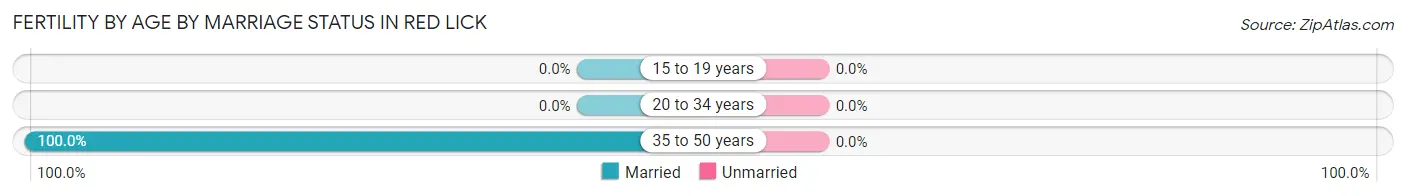
| Age Bracket | Married | Unmarried |
| 15 to 19 years | 0 (0.0%) | 0 (0.0%) |
| 20 to 34 years | 0 (0.0%) | 0 (0.0%) |
| 35 to 50 years | 5 (100.0%) | 0 (0.0%) |
| Total | 5 (100.0%) | 0 (0.0%) |
Fertility by Education in Red Lick
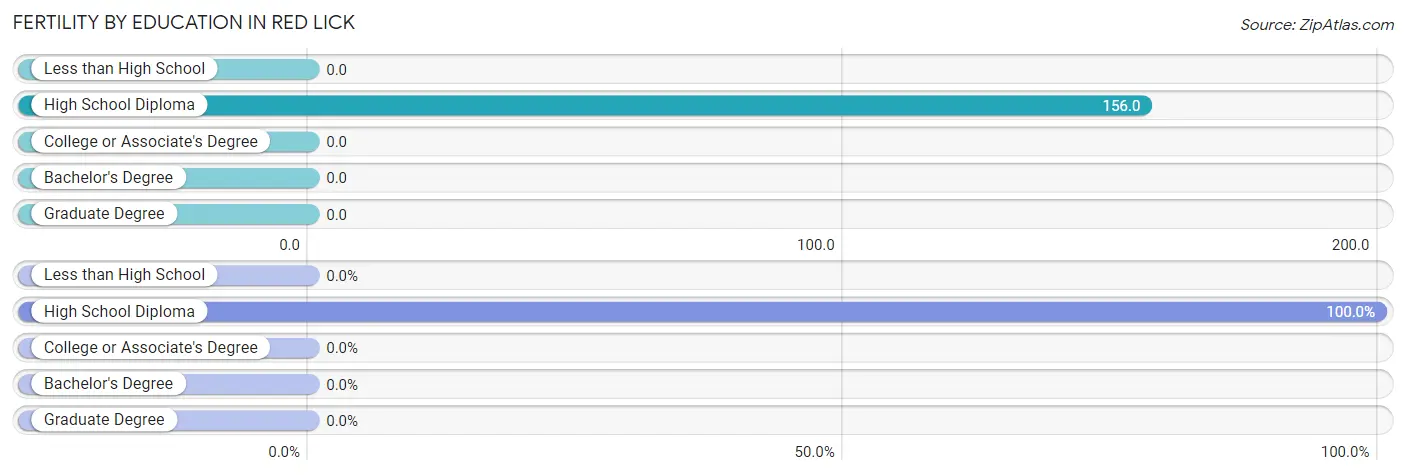
| Educational Attainment | Women with Births | Births / 1,000 Women |
| Less than High School | 0 (0.0%) | 0.0 |
| High School Diploma | 5 (100.0%) | 156.0 |
| College or Associate's Degree | 0 (0.0%) | 0.0 |
| Bachelor's Degree | 0 (0.0%) | 0.0 |
| Graduate Degree | 0 (0.0%) | 0.0 |
| Total | 5 (100.0%) | 15.0 |
Fertility by Education by Marriage Status in Red Lick
| Educational Attainment | Married | Unmarried |
| Less than High School | 0 (0.0%) | 0 (0.0%) |
| High School Diploma | 5 (100.0%) | 0 (0.0%) |
| College or Associate's Degree | 0 (0.0%) | 0 (0.0%) |
| Bachelor's Degree | 0 (0.0%) | 0 (0.0%) |
| Graduate Degree | 0 (0.0%) | 0 (0.0%) |
| Total | 5 (100.0%) | 0 (0.0%) |
Employment Characteristics in Red Lick
Employment by Class of Employer in Red Lick
Among the 891 employed individuals in Red Lick, private company employees (528 | 59.3%), federal government employees (102 | 11.5%), and not-for-profit organizations (78 | 8.7%) make up the most common classes of employment.
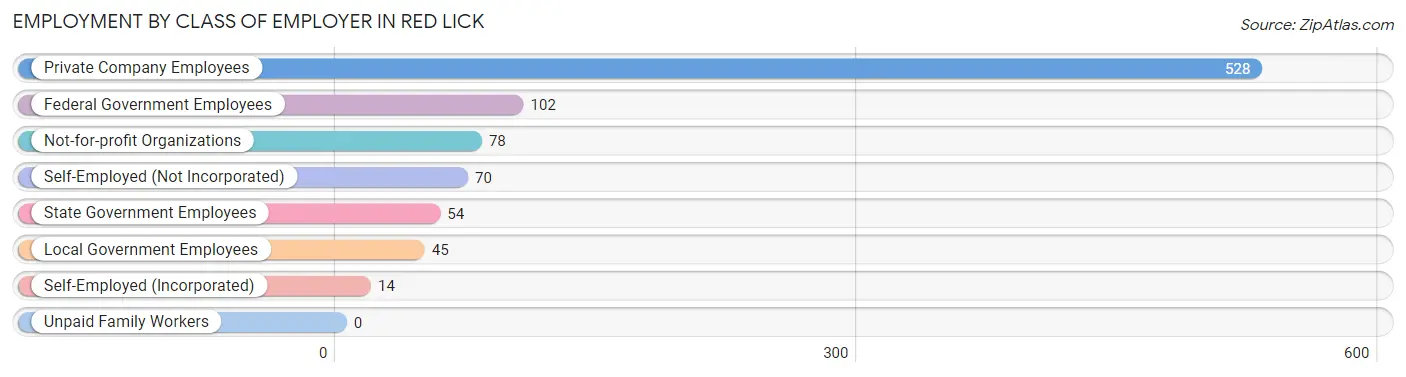
| Employer Class | # Employees | % Employees |
| Private Company Employees | 528 | 59.3% |
| Self-Employed (Incorporated) | 14 | 1.6% |
| Self-Employed (Not Incorporated) | 70 | 7.9% |
| Not-for-profit Organizations | 78 | 8.7% |
| Local Government Employees | 45 | 5.1% |
| State Government Employees | 54 | 6.1% |
| Federal Government Employees | 102 | 11.5% |
| Unpaid Family Workers | 0 | 0.0% |
| Total | 891 | 100.0% |
Employment Status by Age in Red Lick
According to the labor force statistics for Red Lick, out of the total population over 16 years of age (1,212), 74.7% or 905 individuals are in the labor force, with 1.5% or 14 of them unemployed. The age group with the highest labor force participation rate is 35 to 44 years, with 98.8% or 251 individuals in the labor force. Within the labor force, the 35 to 44 years age range has the highest percentage of unemployed individuals, with 4.4% or 11 of them being unemployed.
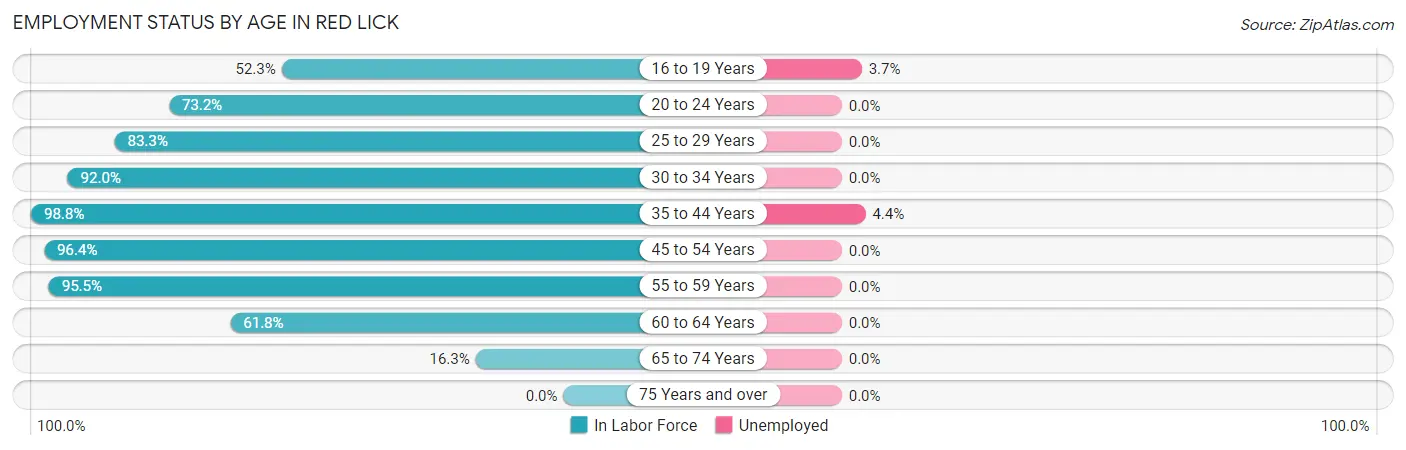
| Age Bracket | In Labor Force | Unemployed |
| 16 to 19 Years | 81 (52.3%) | 3 (3.7%) |
| 20 to 24 Years | 60 (73.2%) | 0 (0.0%) |
| 25 to 29 Years | 20 (83.3%) | 0 (0.0%) |
| 30 to 34 Years | 46 (92.0%) | 0 (0.0%) |
| 35 to 44 Years | 251 (98.8%) | 11 (4.4%) |
| 45 to 54 Years | 319 (96.4%) | 0 (0.0%) |
| 55 to 59 Years | 64 (95.5%) | 0 (0.0%) |
| 60 to 64 Years | 47 (61.8%) | 0 (0.0%) |
| 65 to 74 Years | 17 (16.3%) | 0 (0.0%) |
| 75 Years and over | 0 (0.0%) | 0 (0.0%) |
| Total | 905 (74.7%) | 14 (1.5%) |
Employment Status by Educational Attainment in Red Lick
According to labor force statistics for Red Lick, 93.1% of individuals (747) out of the total population between 25 and 64 years of age (802) are in the labor force, with 1.5% or 11 of them being unemployed. The group with the highest labor force participation rate are those with the educational attainment of bachelor's degree or higher, with 97.1% or 266 individuals in the labor force. Within the labor force, individuals with less than high school education have the highest percentage of unemployment, with 100.0% or 4 of them being unemployed.
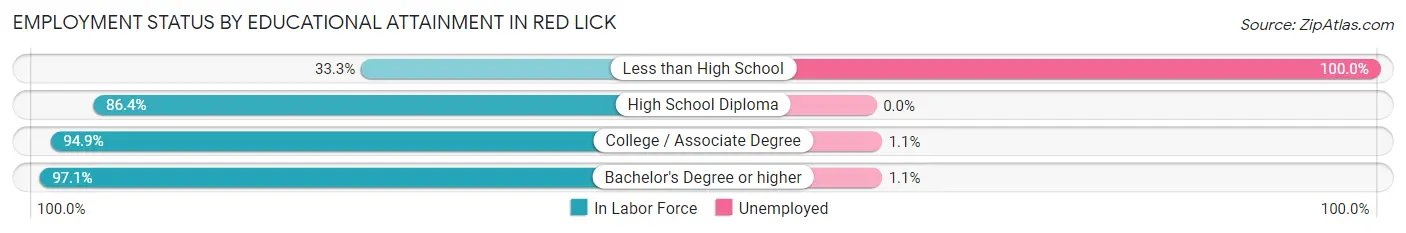
| Educational Attainment | In Labor Force | Unemployed |
| Less than High School | 4 (33.3%) | 12 (100.0%) |
| High School Diploma | 127 (86.4%) | 0 (0.0%) |
| College / Associate Degree | 350 (94.9%) | 4 (1.1%) |
| Bachelor's Degree or higher | 266 (97.1%) | 3 (1.1%) |
| Total | 747 (93.1%) | 12 (1.5%) |
Employment Occupations by Sex in Red Lick
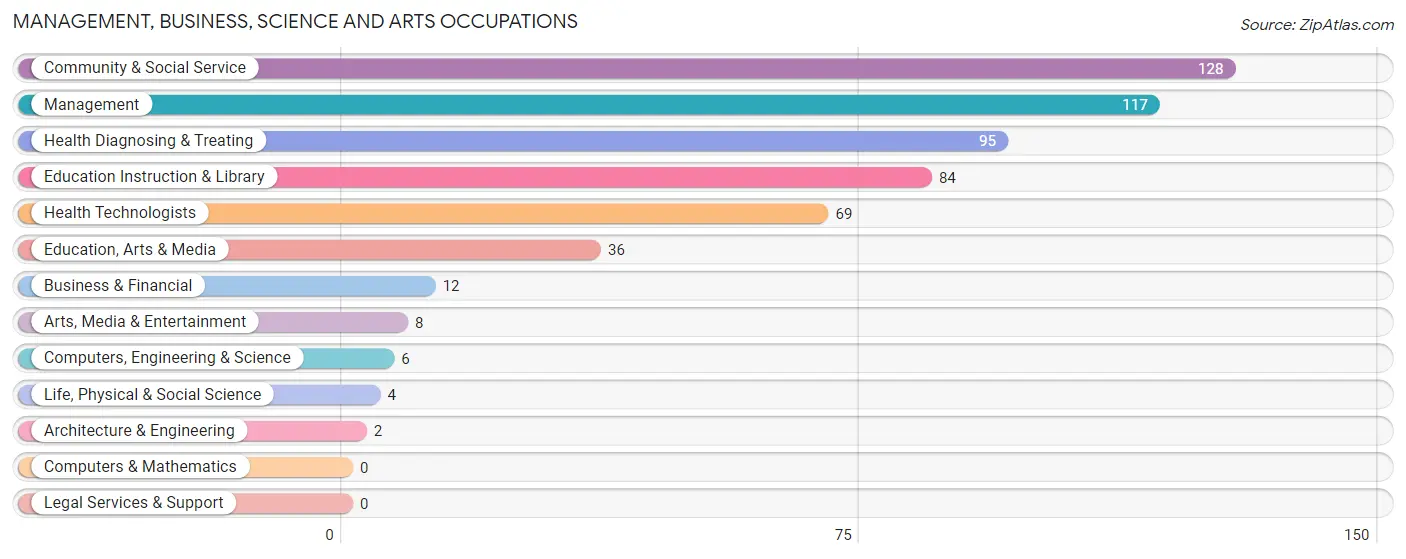
Management, Business, Science and Arts Occupations
The most common Management, Business, Science and Arts occupations in Red Lick are Community & Social Service (128 | 14.4%), Management (117 | 13.1%), Health Diagnosing & Treating (95 | 10.7%), Education Instruction & Library (84 | 9.4%), and Health Technologists (69 | 7.7%).
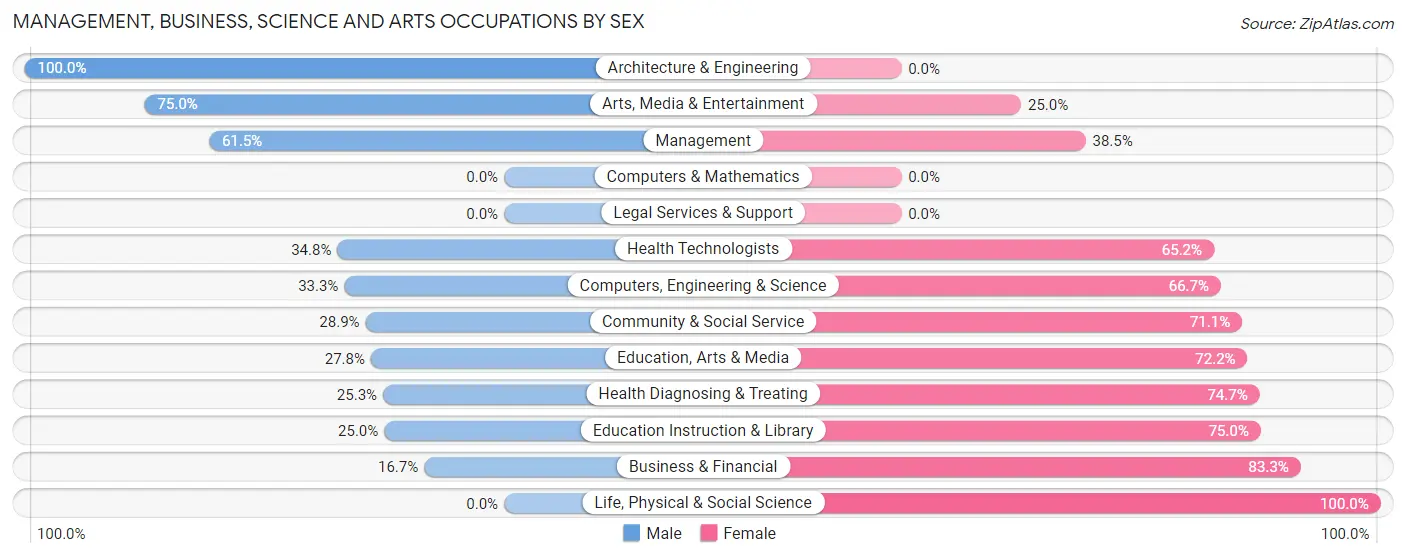
Management, Business, Science and Arts Occupations by Sex
Within the Management, Business, Science and Arts occupations in Red Lick, the most male-oriented occupations are Architecture & Engineering (100.0%), Arts, Media & Entertainment (75.0%), and Management (61.5%), while the most female-oriented occupations are Life, Physical & Social Science (100.0%), Business & Financial (83.3%), and Education Instruction & Library (75.0%).
| Occupation | Male | Female |
| Management | 72 (61.5%) | 45 (38.5%) |
| Business & Financial | 2 (16.7%) | 10 (83.3%) |
| Computers, Engineering & Science | 2 (33.3%) | 4 (66.7%) |
| Computers & Mathematics | 0 (0.0%) | 0 (0.0%) |
| Architecture & Engineering | 2 (100.0%) | 0 (0.0%) |
| Life, Physical & Social Science | 0 (0.0%) | 4 (100.0%) |
| Community & Social Service | 37 (28.9%) | 91 (71.1%) |
| Education, Arts & Media | 10 (27.8%) | 26 (72.2%) |
| Legal Services & Support | 0 (0.0%) | 0 (0.0%) |
| Education Instruction & Library | 21 (25.0%) | 63 (75.0%) |
| Arts, Media & Entertainment | 6 (75.0%) | 2 (25.0%) |
| Health Diagnosing & Treating | 24 (25.3%) | 71 (74.7%) |
| Health Technologists | 24 (34.8%) | 45 (65.2%) |
| Total (Category) | 137 (38.3%) | 221 (61.7%) |
| Total (Overall) | 450 (50.5%) | 441 (49.5%) |
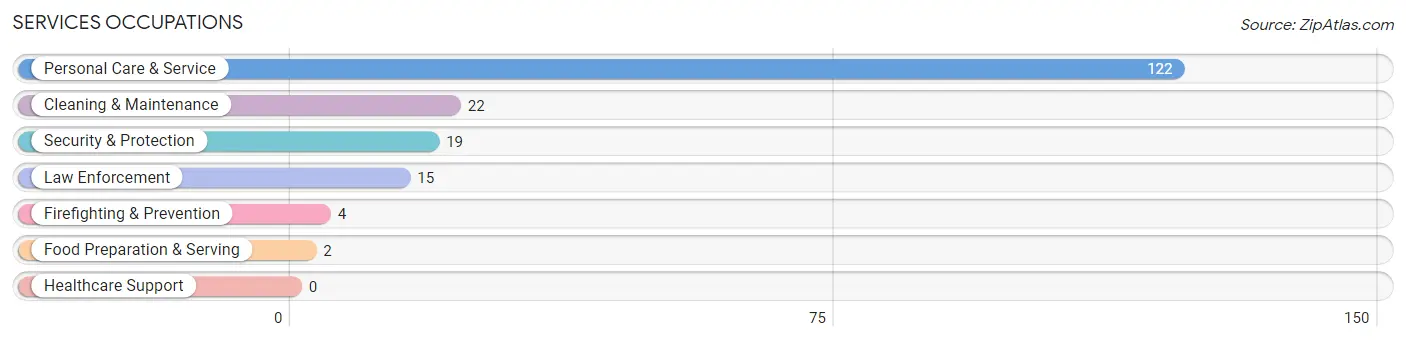
Services Occupations
The most common Services occupations in Red Lick are Personal Care & Service (122 | 13.7%), Cleaning & Maintenance (22 | 2.5%), Security & Protection (19 | 2.1%), Law Enforcement (15 | 1.7%), and Firefighting & Prevention (4 | 0.4%).
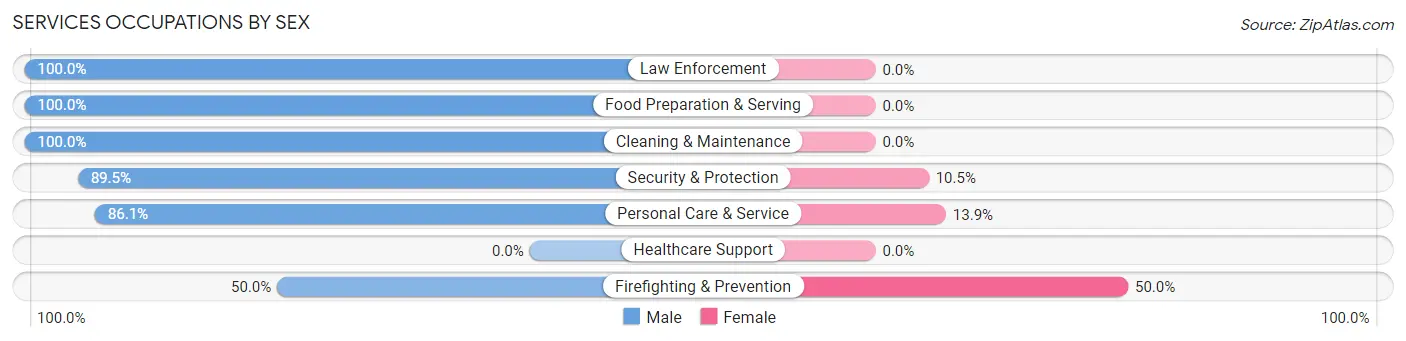
Services Occupations by Sex
Within the Services occupations in Red Lick, the most male-oriented occupations are Law Enforcement (100.0%), Food Preparation & Serving (100.0%), and Cleaning & Maintenance (100.0%), while the most female-oriented occupations are Firefighting & Prevention (50.0%), Personal Care & Service (13.9%), and Security & Protection (10.5%).
| Occupation | Male | Female |
| Healthcare Support | 0 (0.0%) | 0 (0.0%) |
| Security & Protection | 17 (89.5%) | 2 (10.5%) |
| Firefighting & Prevention | 2 (50.0%) | 2 (50.0%) |
| Law Enforcement | 15 (100.0%) | 0 (0.0%) |
| Food Preparation & Serving | 2 (100.0%) | 0 (0.0%) |
| Cleaning & Maintenance | 22 (100.0%) | 0 (0.0%) |
| Personal Care & Service | 105 (86.1%) | 17 (13.9%) |
| Total (Category) | 146 (88.5%) | 19 (11.5%) |
| Total (Overall) | 450 (50.5%) | 441 (49.5%) |
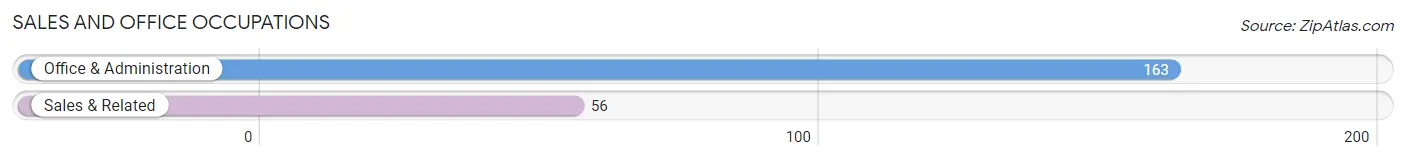
Sales and Office Occupations
The most common Sales and Office occupations in Red Lick are Office & Administration (163 | 18.3%), and Sales & Related (56 | 6.3%).
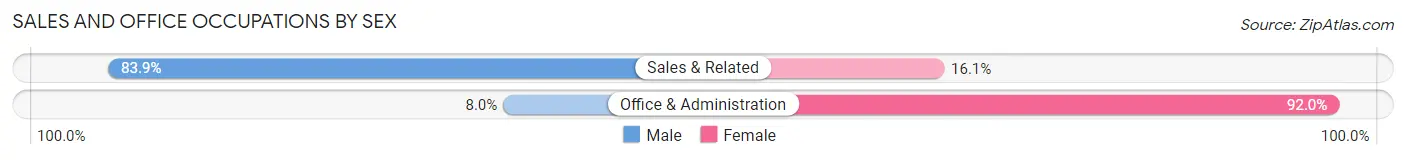
Sales and Office Occupations by Sex
| Occupation | Male | Female |
| Sales & Related | 47 (83.9%) | 9 (16.1%) |
| Office & Administration | 13 (8.0%) | 150 (92.0%) |
| Total (Category) | 60 (27.4%) | 159 (72.6%) |
| Total (Overall) | 450 (50.5%) | 441 (49.5%) |
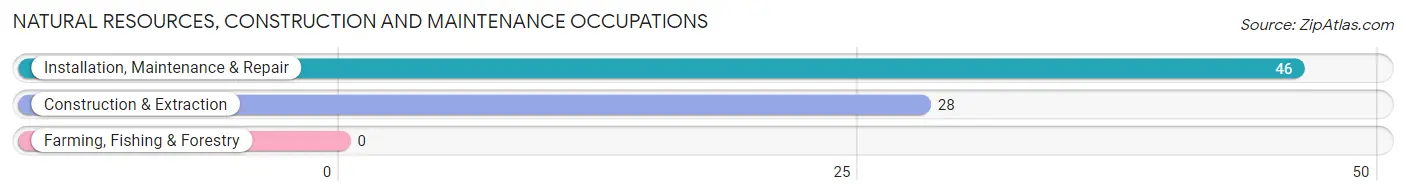
Natural Resources, Construction and Maintenance Occupations
The most common Natural Resources, Construction and Maintenance occupations in Red Lick are Installation, Maintenance & Repair (46 | 5.2%), and Construction & Extraction (28 | 3.1%).
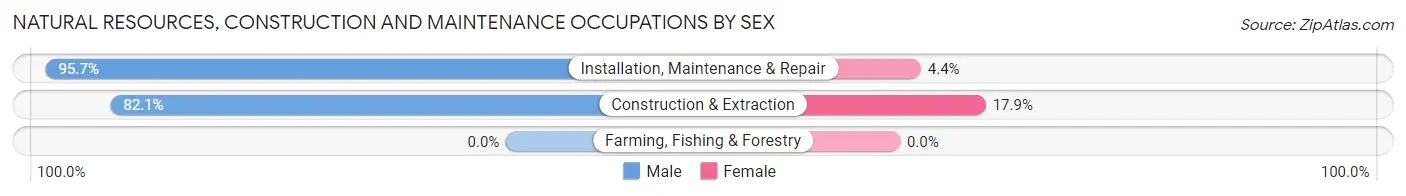
Natural Resources, Construction and Maintenance Occupations by Sex
| Occupation | Male | Female |
| Farming, Fishing & Forestry | 0 (0.0%) | 0 (0.0%) |
| Construction & Extraction | 23 (82.1%) | 5 (17.9%) |
| Installation, Maintenance & Repair | 44 (95.7%) | 2 (4.3%) |
| Total (Category) | 67 (90.5%) | 7 (9.5%) |
| Total (Overall) | 450 (50.5%) | 441 (49.5%) |
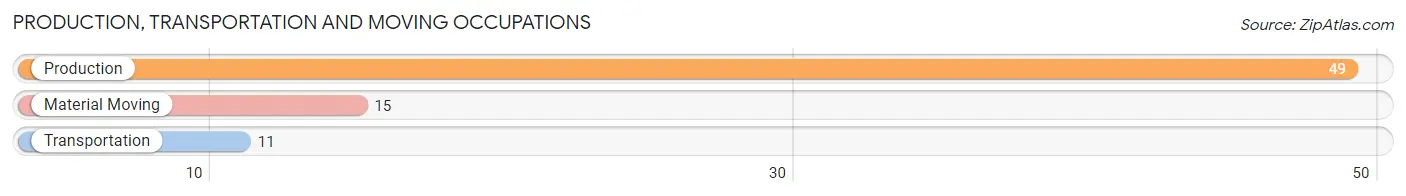
Production, Transportation and Moving Occupations
The most common Production, Transportation and Moving occupations in Red Lick are Production (49 | 5.5%), Material Moving (15 | 1.7%), and Transportation (11 | 1.2%).
Production, Transportation and Moving Occupations by Sex
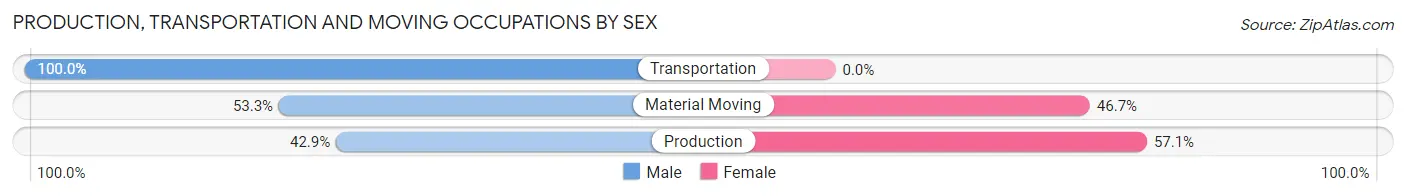
| Occupation | Male | Female |
| Production | 21 (42.9%) | 28 (57.1%) |
| Transportation | 11 (100.0%) | 0 (0.0%) |
| Material Moving | 8 (53.3%) | 7 (46.7%) |
| Total (Category) | 40 (53.3%) | 35 (46.7%) |
| Total (Overall) | 450 (50.5%) | 441 (49.5%) |
Employment Industries by Sex in Red Lick
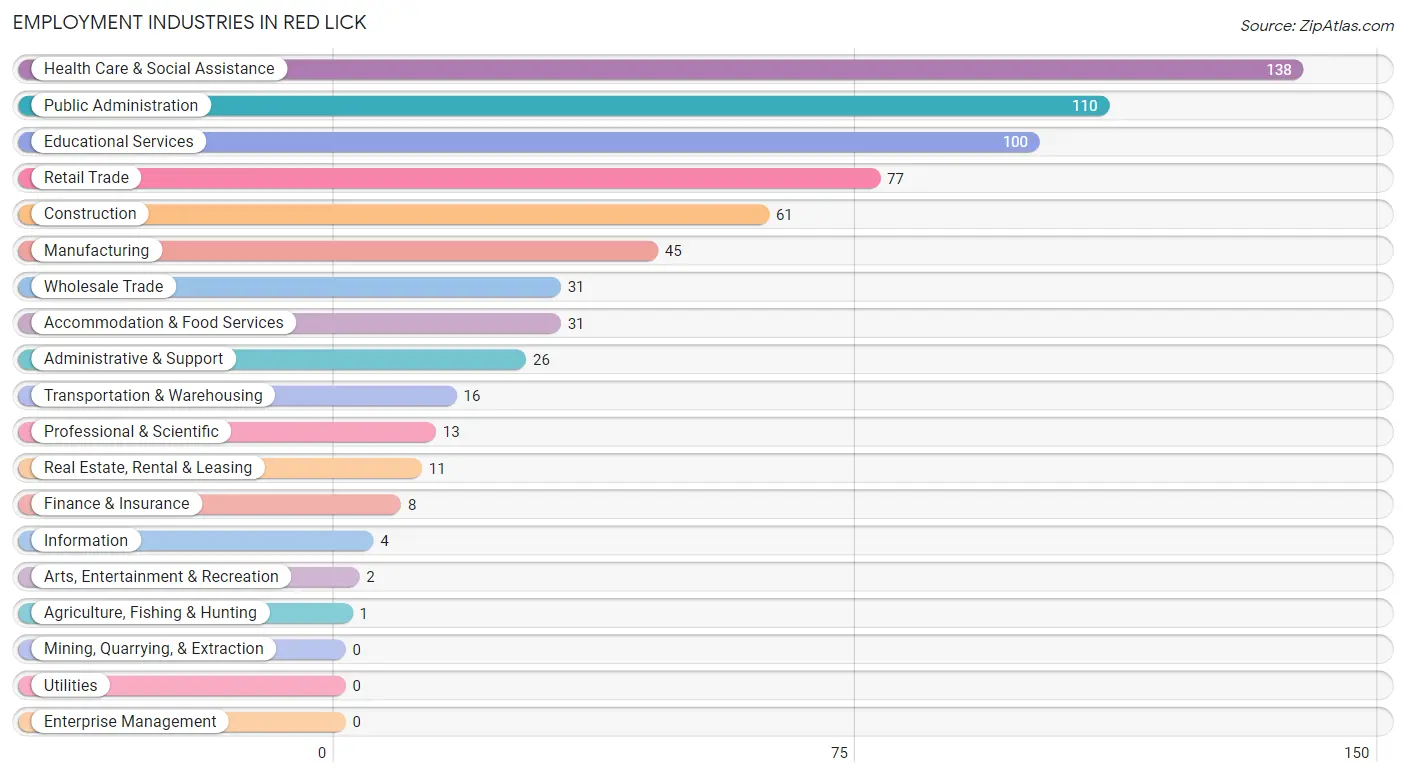
Employment Industries in Red Lick
The major employment industries in Red Lick include Health Care & Social Assistance (138 | 15.5%), Public Administration (110 | 12.3%), Educational Services (100 | 11.2%), Retail Trade (77 | 8.6%), and Construction (61 | 6.9%).
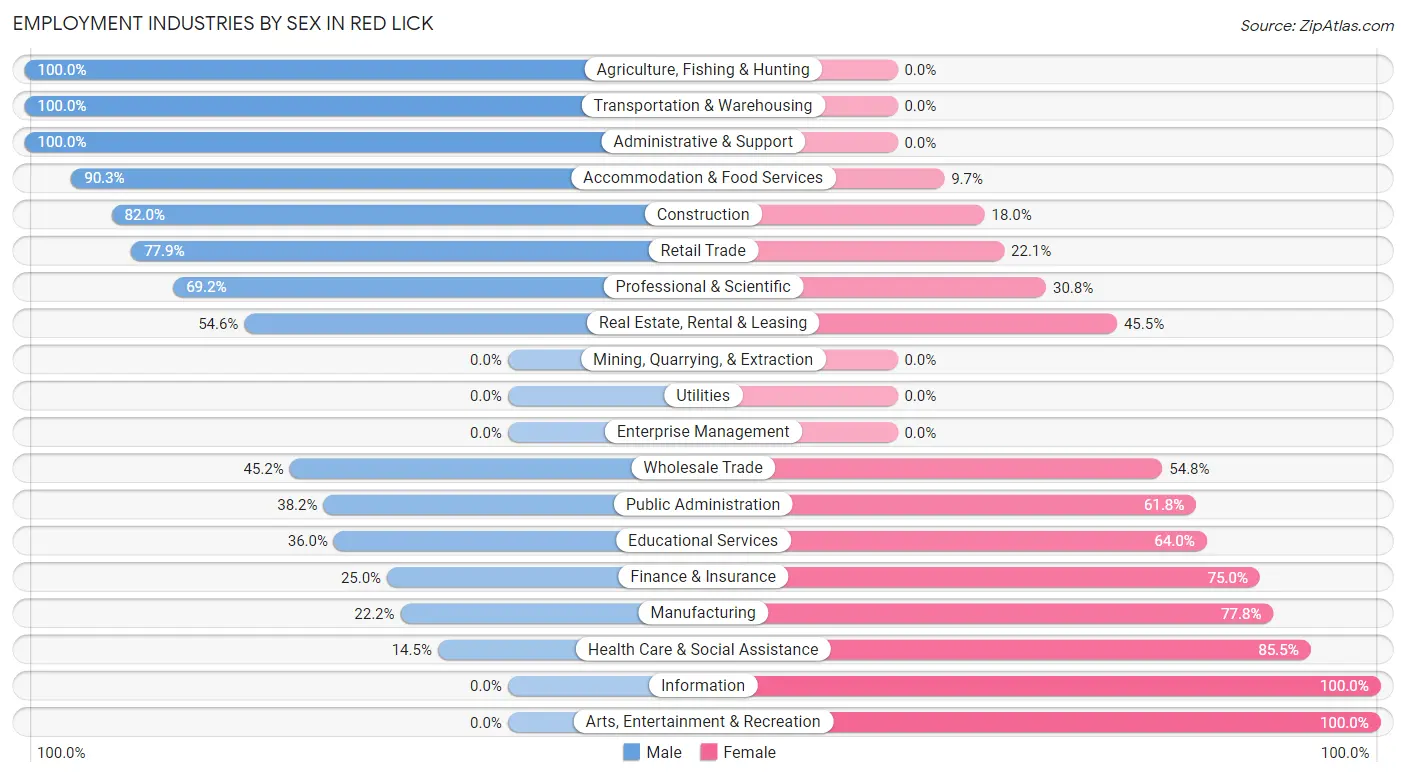
Employment Industries by Sex in Red Lick
The Red Lick industries that see more men than women are Agriculture, Fishing & Hunting (100.0%), Transportation & Warehousing (100.0%), and Administrative & Support (100.0%), whereas the industries that tend to have a higher number of women are Information (100.0%), Arts, Entertainment & Recreation (100.0%), and Health Care & Social Assistance (85.5%).
| Industry | Male | Female |
| Agriculture, Fishing & Hunting | 1 (100.0%) | 0 (0.0%) |
| Mining, Quarrying, & Extraction | 0 (0.0%) | 0 (0.0%) |
| Construction | 50 (82.0%) | 11 (18.0%) |
| Manufacturing | 10 (22.2%) | 35 (77.8%) |
| Wholesale Trade | 14 (45.2%) | 17 (54.8%) |
| Retail Trade | 60 (77.9%) | 17 (22.1%) |
| Transportation & Warehousing | 16 (100.0%) | 0 (0.0%) |
| Utilities | 0 (0.0%) | 0 (0.0%) |
| Information | 0 (0.0%) | 4 (100.0%) |
| Finance & Insurance | 2 (25.0%) | 6 (75.0%) |
| Real Estate, Rental & Leasing | 6 (54.5%) | 5 (45.5%) |
| Professional & Scientific | 9 (69.2%) | 4 (30.8%) |
| Enterprise Management | 0 (0.0%) | 0 (0.0%) |
| Administrative & Support | 26 (100.0%) | 0 (0.0%) |
| Educational Services | 36 (36.0%) | 64 (64.0%) |
| Health Care & Social Assistance | 20 (14.5%) | 118 (85.5%) |
| Arts, Entertainment & Recreation | 0 (0.0%) | 2 (100.0%) |
| Accommodation & Food Services | 28 (90.3%) | 3 (9.7%) |
| Public Administration | 42 (38.2%) | 68 (61.8%) |
| Total | 450 (50.5%) | 441 (49.5%) |
Education in Red Lick
School Enrollment in Red Lick
The most common levels of schooling among the 400 students in Red Lick are high school (124 | 31.0%), middle school (110 | 27.5%), and elementary school (98 | 24.5%).
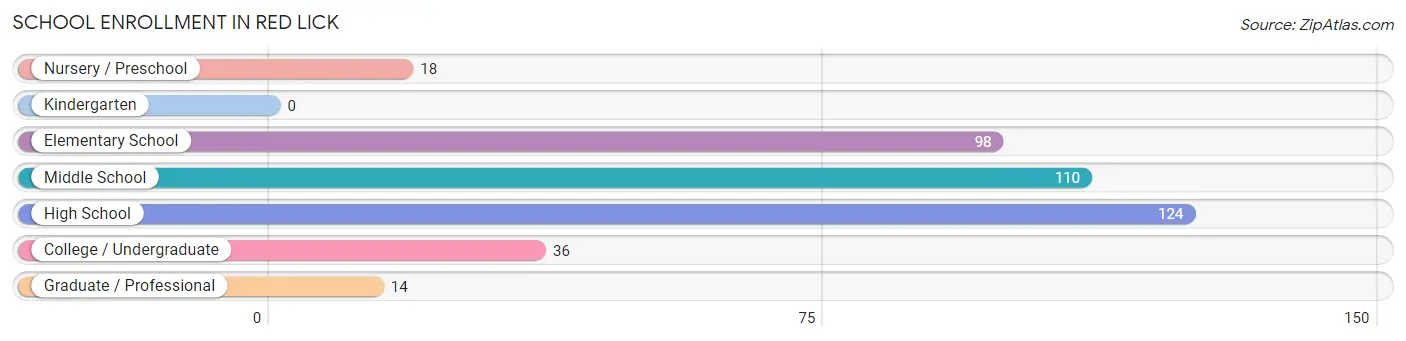
| School Level | # Students | % Students |
| Nursery / Preschool | 18 | 4.5% |
| Kindergarten | 0 | 0.0% |
| Elementary School | 98 | 24.5% |
| Middle School | 110 | 27.5% |
| High School | 124 | 31.0% |
| College / Undergraduate | 36 | 9.0% |
| Graduate / Professional | 14 | 3.5% |
| Total | 400 | 100.0% |
School Enrollment by Age by Funding Source in Red Lick
Out of a total of 400 students who are enrolled in schools in Red Lick, 50 (12.5%) attend a private institution, while the remaining 350 (87.5%) are enrolled in public schools. The age group of 3 to 4 year olds has the highest likelihood of being enrolled in private schools, with 14 (100.0% in the age bracket) enrolled. Conversely, the age group of 18 to 19 year olds has the lowest likelihood of being enrolled in a private school, with 5 (100.0% in the age bracket) attending a public institution.
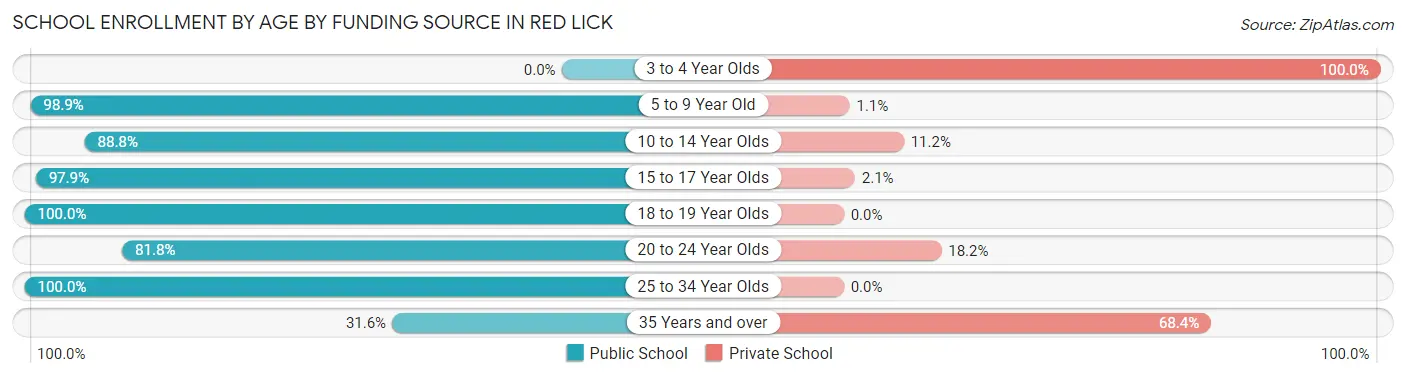
| Age Bracket | Public School | Private School |
| 3 to 4 Year Olds | 0 (0.0%) | 14 (100.0%) |
| 5 to 9 Year Old | 91 (98.9%) | 1 (1.1%) |
| 10 to 14 Year Olds | 127 (88.8%) | 16 (11.2%) |
| 15 to 17 Year Olds | 94 (97.9%) | 2 (2.1%) |
| 18 to 19 Year Olds | 5 (100.0%) | 0 (0.0%) |
| 20 to 24 Year Olds | 18 (81.8%) | 4 (18.2%) |
| 25 to 34 Year Olds | 9 (100.0%) | 0 (0.0%) |
| 35 Years and over | 6 (31.6%) | 13 (68.4%) |
| Total | 350 (87.5%) | 50 (12.5%) |
Educational Attainment by Field of Study in Red Lick
Education (77 | 22.5%), business (49 | 14.3%), science & technology (37 | 10.8%), arts & humanities (33 | 9.6%), and bio, nature & agricultural (26 | 7.6%) are the most common fields of study among 343 individuals in Red Lick who have obtained a bachelor's degree or higher.

| Field of Study | # Graduates | % Graduates |
| Computers & Mathematics | 14 | 4.1% |
| Bio, Nature & Agricultural | 26 | 7.6% |
| Physical & Health Sciences | 25 | 7.3% |
| Psychology | 16 | 4.7% |
| Social Sciences | 9 | 2.6% |
| Engineering | 17 | 5.0% |
| Multidisciplinary Studies | 7 | 2.0% |
| Science & Technology | 37 | 10.8% |
| Business | 49 | 14.3% |
| Education | 77 | 22.5% |
| Literature & Languages | 0 | 0.0% |
| Liberal Arts & History | 19 | 5.5% |
| Visual & Performing Arts | 14 | 4.1% |
| Communications | 0 | 0.0% |
| Arts & Humanities | 33 | 9.6% |
| Total | 343 | 100.0% |
Transportation & Commute in Red Lick
Vehicle Availability by Sex in Red Lick
The most prevalent vehicle ownership categories in Red Lick are males with 4 vehicles (148, accounting for 32.9%) and females with 4 vehicles (156, making up 33.6%).
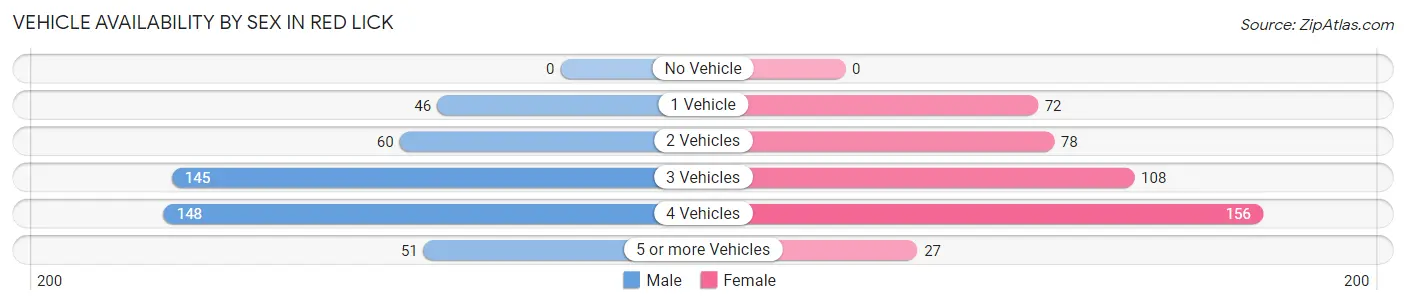
| Vehicles Available | Male | Female |
| No Vehicle | 0 (0.0%) | 0 (0.0%) |
| 1 Vehicle | 46 (10.2%) | 72 (16.3%) |
| 2 Vehicles | 60 (13.3%) | 78 (17.7%) |
| 3 Vehicles | 145 (32.2%) | 108 (24.5%) |
| 4 Vehicles | 148 (32.9%) | 156 (35.4%) |
| 5 or more Vehicles | 51 (11.3%) | 27 (6.1%) |
| Total | 450 (100.0%) | 441 (100.0%) |
Commute Time in Red Lick
The most frequently occuring commute durations in Red Lick are 10 to 14 minutes (285 commuters, 33.9%), 20 to 24 minutes (233 commuters, 27.7%), and 15 to 19 minutes (196 commuters, 23.3%).
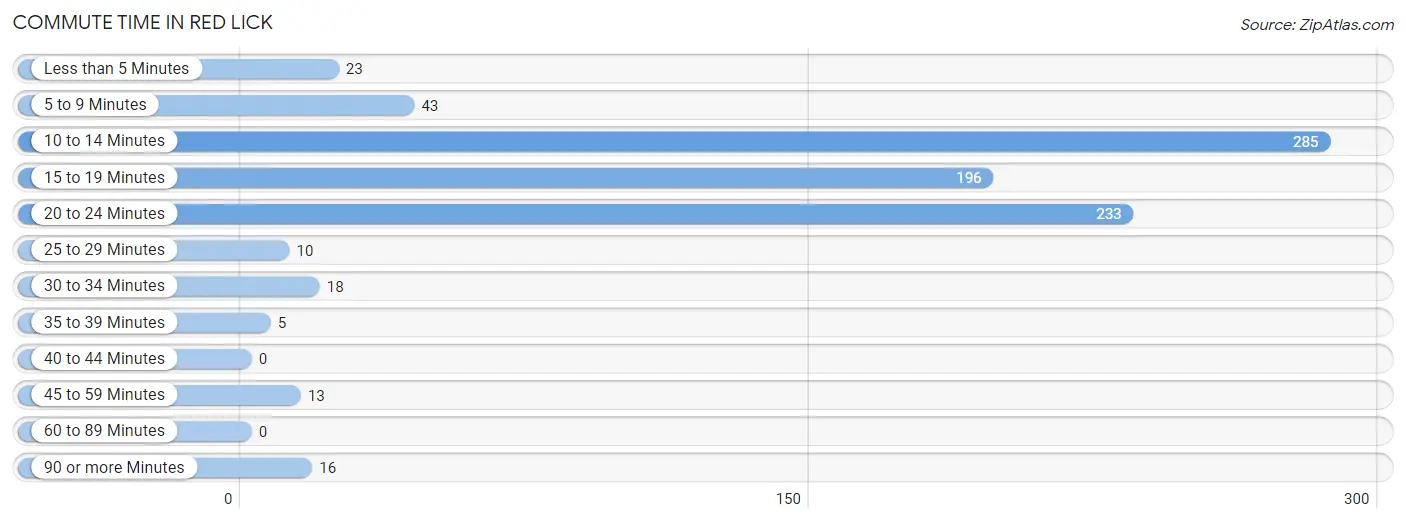
| Commute Time | # Commuters | % Commuters |
| Less than 5 Minutes | 23 | 2.7% |
| 5 to 9 Minutes | 43 | 5.1% |
| 10 to 14 Minutes | 285 | 33.9% |
| 15 to 19 Minutes | 196 | 23.3% |
| 20 to 24 Minutes | 233 | 27.7% |
| 25 to 29 Minutes | 10 | 1.2% |
| 30 to 34 Minutes | 18 | 2.1% |
| 35 to 39 Minutes | 5 | 0.6% |
| 40 to 44 Minutes | 0 | 0.0% |
| 45 to 59 Minutes | 13 | 1.5% |
| 60 to 89 Minutes | 0 | 0.0% |
| 90 or more Minutes | 16 | 1.9% |
Commute Time by Sex in Red Lick
The most common commute times in Red Lick are 10 to 14 minutes (179 commuters, 40.0%) for males and 15 to 19 minutes (126 commuters, 31.9%) for females.
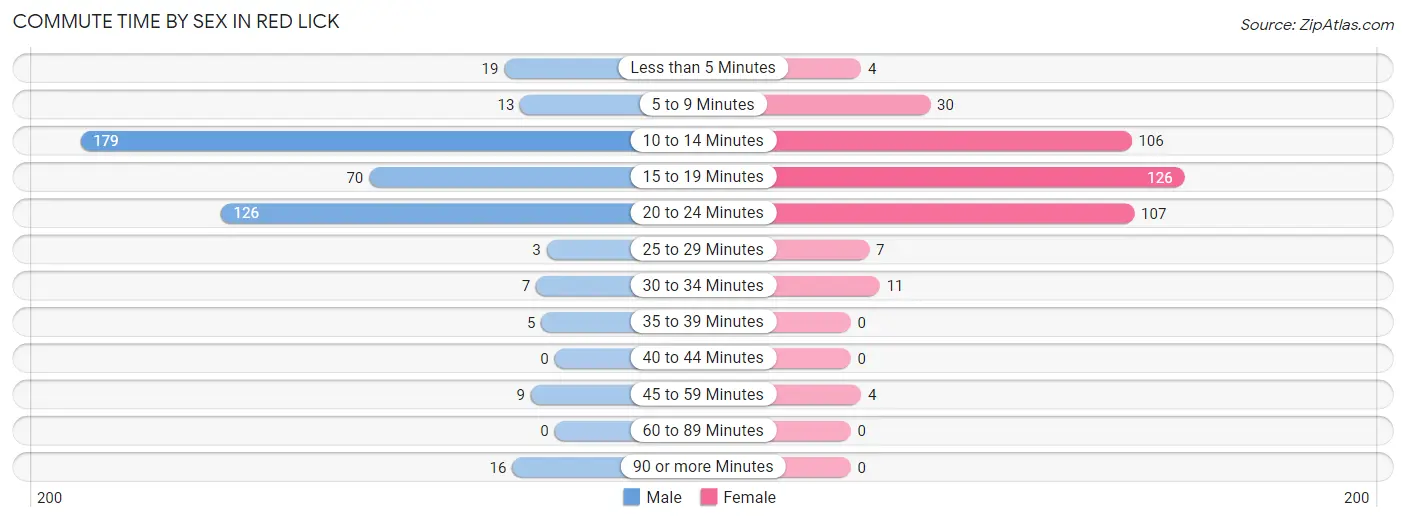
| Commute Time | Male | Female |
| Less than 5 Minutes | 19 (4.3%) | 4 (1.0%) |
| 5 to 9 Minutes | 13 (2.9%) | 30 (7.6%) |
| 10 to 14 Minutes | 179 (40.0%) | 106 (26.8%) |
| 15 to 19 Minutes | 70 (15.7%) | 126 (31.9%) |
| 20 to 24 Minutes | 126 (28.2%) | 107 (27.1%) |
| 25 to 29 Minutes | 3 (0.7%) | 7 (1.8%) |
| 30 to 34 Minutes | 7 (1.6%) | 11 (2.8%) |
| 35 to 39 Minutes | 5 (1.1%) | 0 (0.0%) |
| 40 to 44 Minutes | 0 (0.0%) | 0 (0.0%) |
| 45 to 59 Minutes | 9 (2.0%) | 4 (1.0%) |
| 60 to 89 Minutes | 0 (0.0%) | 0 (0.0%) |
| 90 or more Minutes | 16 (3.6%) | 0 (0.0%) |
Time of Departure to Work by Sex in Red Lick
The most frequent times of departure to work in Red Lick are 7:30 AM to 7:59 AM (162, 36.2%) for males and 5:00 AM to 5:29 AM (125, 31.7%) for females.
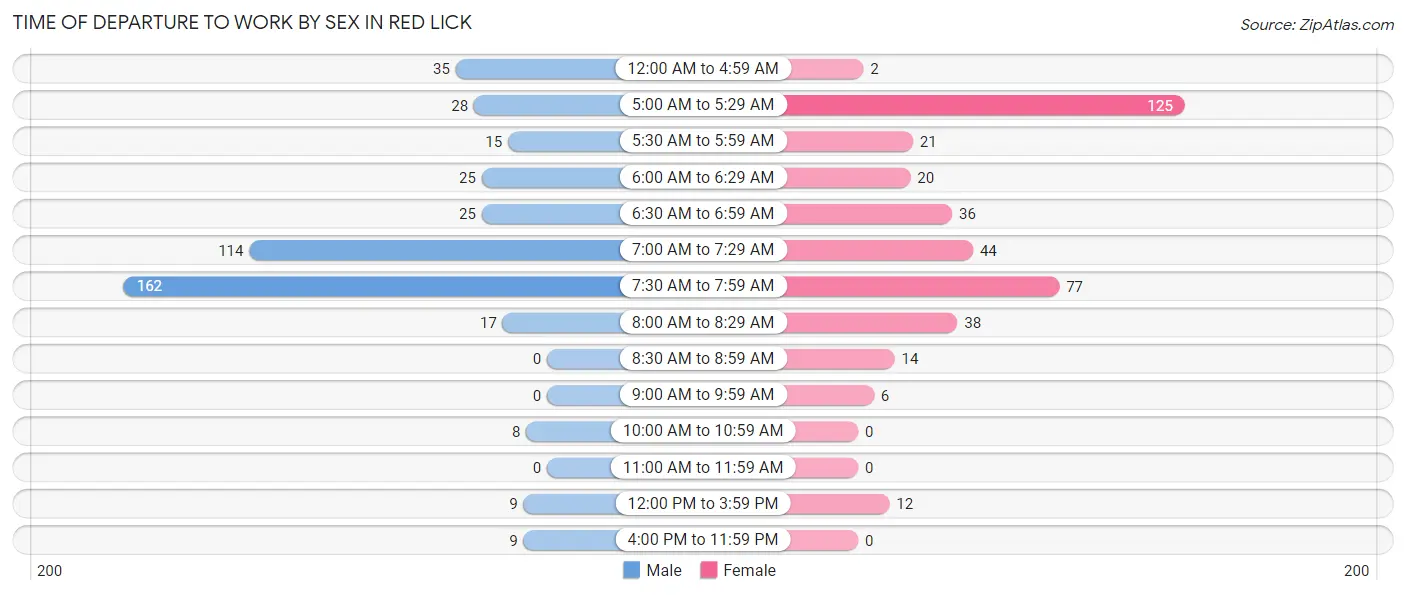
| Time of Departure | Male | Female |
| 12:00 AM to 4:59 AM | 35 (7.8%) | 2 (0.5%) |
| 5:00 AM to 5:29 AM | 28 (6.3%) | 125 (31.7%) |
| 5:30 AM to 5:59 AM | 15 (3.4%) | 21 (5.3%) |
| 6:00 AM to 6:29 AM | 25 (5.6%) | 20 (5.1%) |
| 6:30 AM to 6:59 AM | 25 (5.6%) | 36 (9.1%) |
| 7:00 AM to 7:29 AM | 114 (25.5%) | 44 (11.1%) |
| 7:30 AM to 7:59 AM | 162 (36.2%) | 77 (19.5%) |
| 8:00 AM to 8:29 AM | 17 (3.8%) | 38 (9.6%) |
| 8:30 AM to 8:59 AM | 0 (0.0%) | 14 (3.5%) |
| 9:00 AM to 9:59 AM | 0 (0.0%) | 6 (1.5%) |
| 10:00 AM to 10:59 AM | 8 (1.8%) | 0 (0.0%) |
| 11:00 AM to 11:59 AM | 0 (0.0%) | 0 (0.0%) |
| 12:00 PM to 3:59 PM | 9 (2.0%) | 12 (3.0%) |
| 4:00 PM to 11:59 PM | 9 (2.0%) | 0 (0.0%) |
| Total | 447 (100.0%) | 395 (100.0%) |
Housing Occupancy in Red Lick
Occupancy by Ownership in Red Lick
Of the total 555 dwellings in Red Lick, owner-occupied units account for 380 (68.5%), while renter-occupied units make up 175 (31.5%).
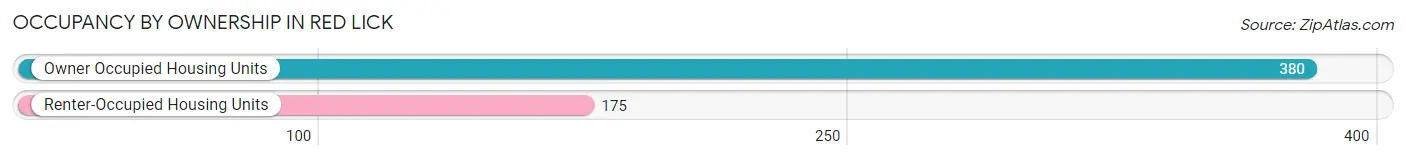
| Occupancy | # Housing Units | % Housing Units |
| Owner Occupied Housing Units | 380 | 68.5% |
| Renter-Occupied Housing Units | 175 | 31.5% |
| Total Occupied Housing Units | 555 | 100.0% |
Occupancy by Household Size in Red Lick
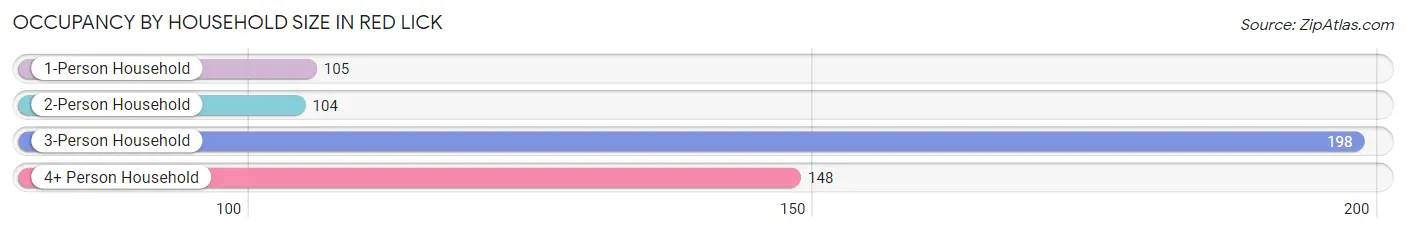
| Household Size | # Housing Units | % Housing Units |
| 1-Person Household | 105 | 18.9% |
| 2-Person Household | 104 | 18.7% |
| 3-Person Household | 198 | 35.7% |
| 4+ Person Household | 148 | 26.7% |
| Total Housing Units | 555 | 100.0% |
Occupancy by Ownership by Household Size in Red Lick
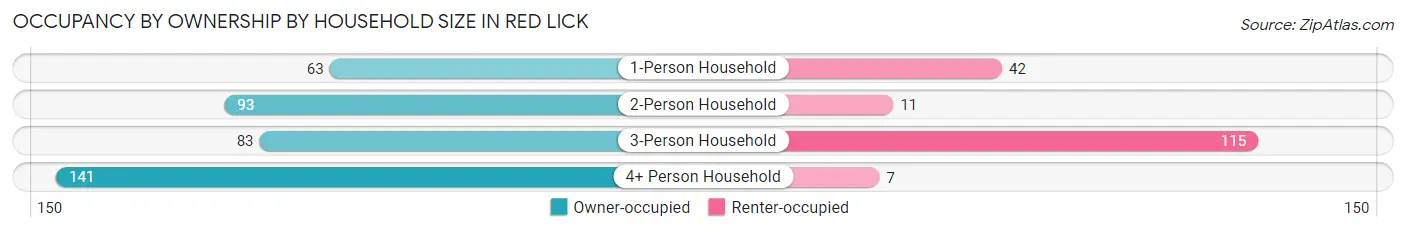
| Household Size | Owner-occupied | Renter-occupied |
| 1-Person Household | 63 (60.0%) | 42 (40.0%) |
| 2-Person Household | 93 (89.4%) | 11 (10.6%) |
| 3-Person Household | 83 (41.9%) | 115 (58.1%) |
| 4+ Person Household | 141 (95.3%) | 7 (4.7%) |
| Total Housing Units | 380 (68.5%) | 175 (31.5%) |
Occupancy by Educational Attainment in Red Lick
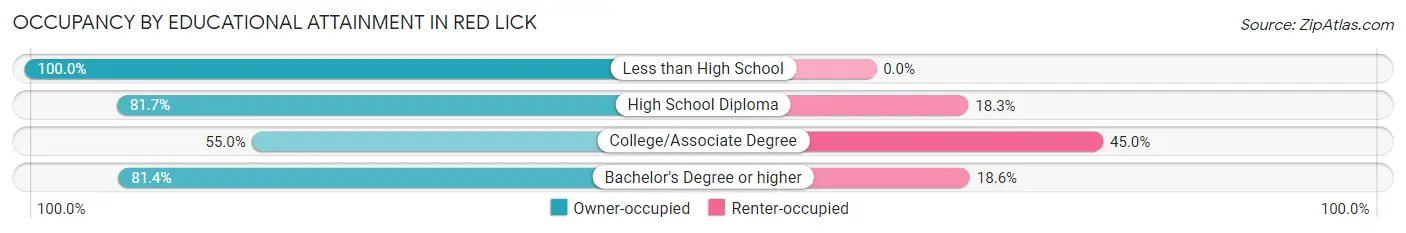
| Household Size | Owner-occupied | Renter-occupied |
| Less than High School | 10 (100.0%) | 0 (0.0%) |
| High School Diploma | 67 (81.7%) | 15 (18.3%) |
| College/Associate Degree | 154 (55.0%) | 126 (45.0%) |
| Bachelor's Degree or higher | 149 (81.4%) | 34 (18.6%) |
Occupancy by Age of Householder in Red Lick
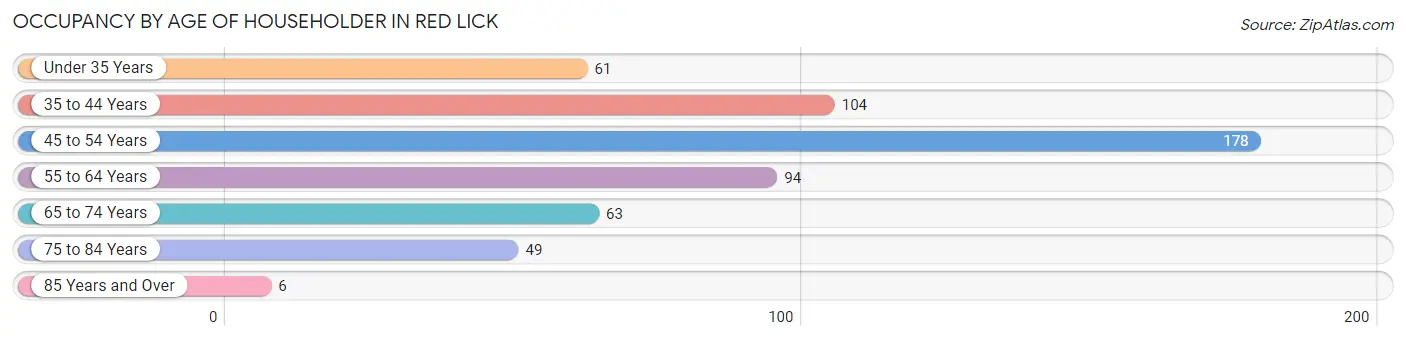
| Age Bracket | # Households | % Households |
| Under 35 Years | 61 | 11.0% |
| 35 to 44 Years | 104 | 18.7% |
| 45 to 54 Years | 178 | 32.1% |
| 55 to 64 Years | 94 | 16.9% |
| 65 to 74 Years | 63 | 11.4% |
| 75 to 84 Years | 49 | 8.8% |
| 85 Years and Over | 6 | 1.1% |
| Total | 555 | 100.0% |
Housing Finances in Red Lick
Median Income by Occupancy in Red Lick
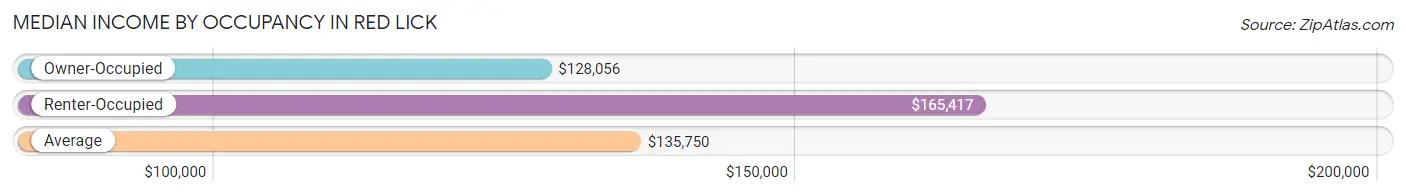
| Occupancy Type | # Households | Median Income |
| Owner-Occupied | 380 (68.5%) | $128,056 |
| Renter-Occupied | 175 (31.5%) | $165,417 |
| Average | 555 (100.0%) | $135,750 |
Occupancy by Householder Income Bracket in Red Lick
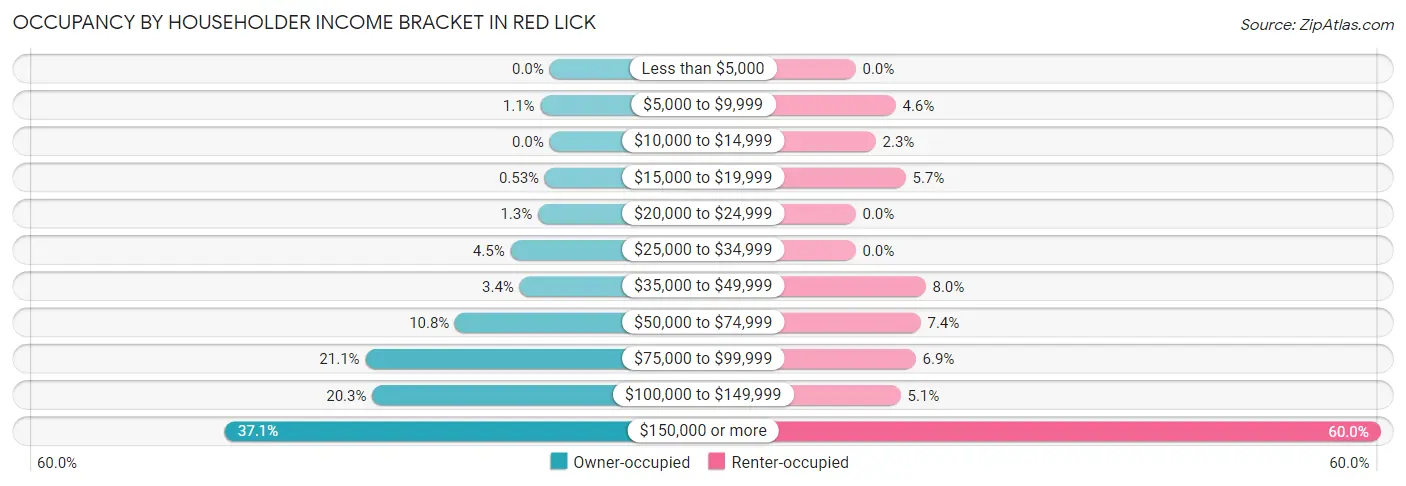
| Income Bracket | Owner-occupied | Renter-occupied |
| Less than $5,000 | 0 (0.0%) | 0 (0.0%) |
| $5,000 to $9,999 | 4 (1.1%) | 8 (4.6%) |
| $10,000 to $14,999 | 0 (0.0%) | 4 (2.3%) |
| $15,000 to $19,999 | 2 (0.5%) | 10 (5.7%) |
| $20,000 to $24,999 | 5 (1.3%) | 0 (0.0%) |
| $25,000 to $34,999 | 17 (4.5%) | 0 (0.0%) |
| $35,000 to $49,999 | 13 (3.4%) | 14 (8.0%) |
| $50,000 to $74,999 | 41 (10.8%) | 13 (7.4%) |
| $75,000 to $99,999 | 80 (21.0%) | 12 (6.9%) |
| $100,000 to $149,999 | 77 (20.3%) | 9 (5.1%) |
| $150,000 or more | 141 (37.1%) | 105 (60.0%) |
| Total | 380 (100.0%) | 175 (100.0%) |
Monthly Housing Cost Tiers in Red Lick
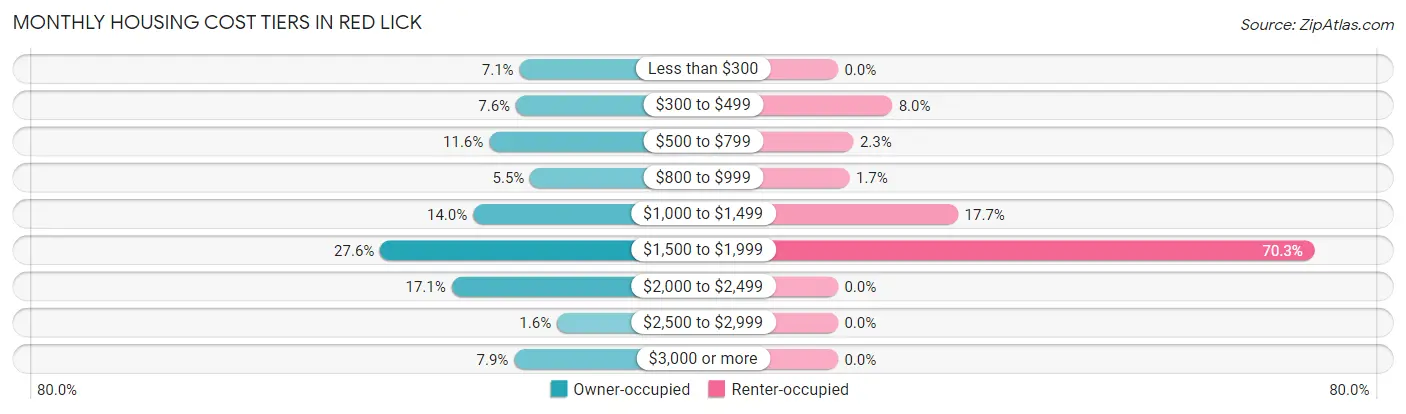
| Monthly Cost | Owner-occupied | Renter-occupied |
| Less than $300 | 27 (7.1%) | 0 (0.0%) |
| $300 to $499 | 29 (7.6%) | 14 (8.0%) |
| $500 to $799 | 44 (11.6%) | 4 (2.3%) |
| $800 to $999 | 21 (5.5%) | 3 (1.7%) |
| $1,000 to $1,499 | 53 (14.0%) | 31 (17.7%) |
| $1,500 to $1,999 | 105 (27.6%) | 123 (70.3%) |
| $2,000 to $2,499 | 65 (17.1%) | 0 (0.0%) |
| $2,500 to $2,999 | 6 (1.6%) | 0 (0.0%) |
| $3,000 or more | 30 (7.9%) | 0 (0.0%) |
| Total | 380 (100.0%) | 175 (100.0%) |
Physical Housing Characteristics in Red Lick
Housing Structures in Red Lick
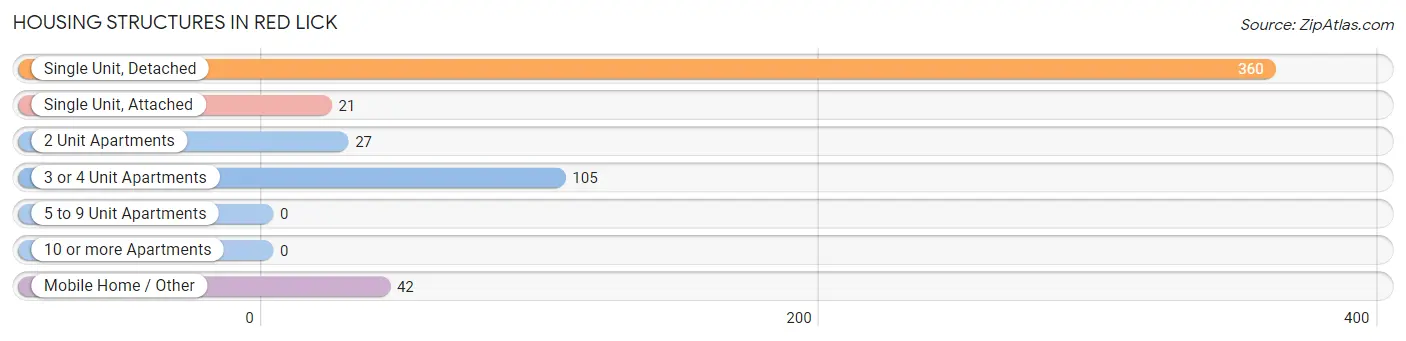
| Structure Type | # Housing Units | % Housing Units |
| Single Unit, Detached | 360 | 64.9% |
| Single Unit, Attached | 21 | 3.8% |
| 2 Unit Apartments | 27 | 4.9% |
| 3 or 4 Unit Apartments | 105 | 18.9% |
| 5 to 9 Unit Apartments | 0 | 0.0% |
| 10 or more Apartments | 0 | 0.0% |
| Mobile Home / Other | 42 | 7.6% |
| Total | 555 | 100.0% |
Housing Structures by Occupancy in Red Lick
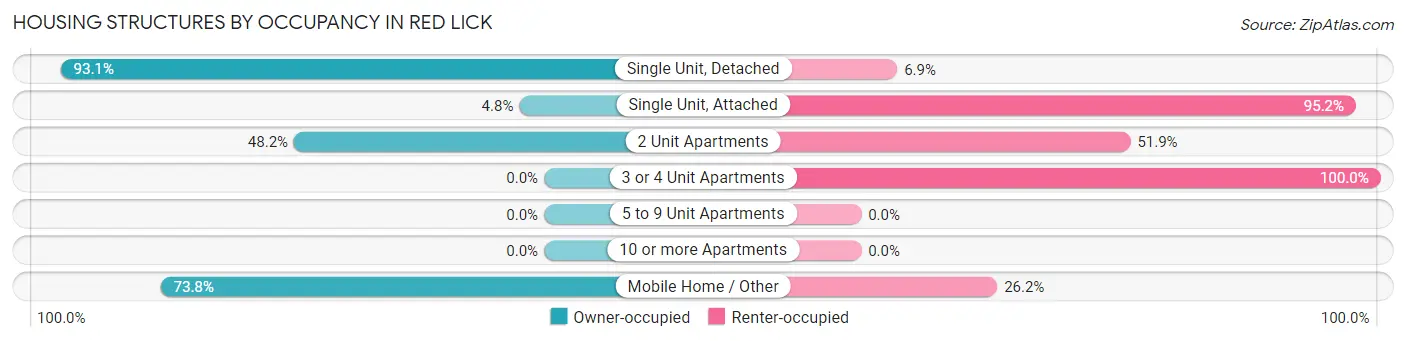
| Structure Type | Owner-occupied | Renter-occupied |
| Single Unit, Detached | 335 (93.1%) | 25 (6.9%) |
| Single Unit, Attached | 1 (4.8%) | 20 (95.2%) |
| 2 Unit Apartments | 13 (48.1%) | 14 (51.8%) |
| 3 or 4 Unit Apartments | 0 (0.0%) | 105 (100.0%) |
| 5 to 9 Unit Apartments | 0 (0.0%) | 0 (0.0%) |
| 10 or more Apartments | 0 (0.0%) | 0 (0.0%) |
| Mobile Home / Other | 31 (73.8%) | 11 (26.2%) |
| Total | 380 (68.5%) | 175 (31.5%) |
Housing Structures by Number of Rooms in Red Lick
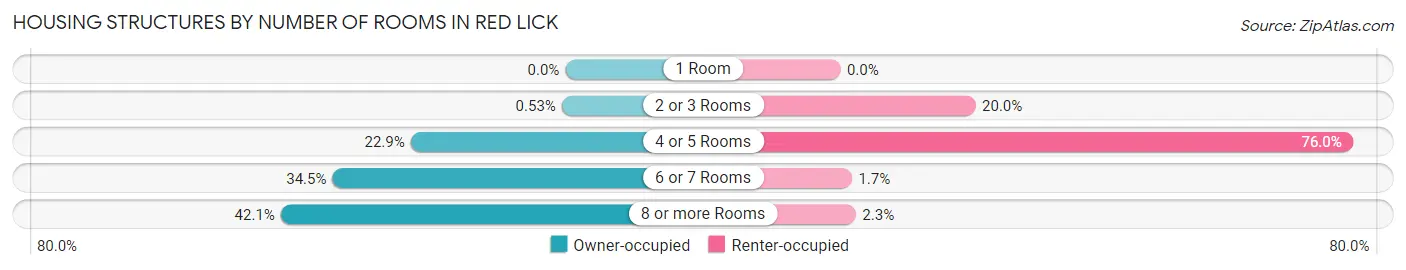
| Number of Rooms | Owner-occupied | Renter-occupied |
| 1 Room | 0 (0.0%) | 0 (0.0%) |
| 2 or 3 Rooms | 2 (0.5%) | 35 (20.0%) |
| 4 or 5 Rooms | 87 (22.9%) | 133 (76.0%) |
| 6 or 7 Rooms | 131 (34.5%) | 3 (1.7%) |
| 8 or more Rooms | 160 (42.1%) | 4 (2.3%) |
| Total | 380 (100.0%) | 175 (100.0%) |
Housing Structure by Heating Type in Red Lick
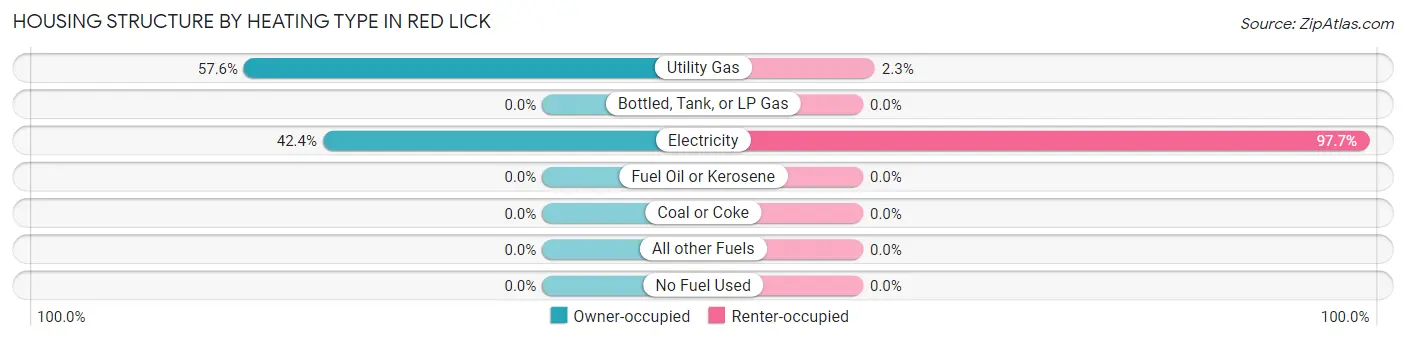
| Heating Type | Owner-occupied | Renter-occupied |
| Utility Gas | 219 (57.6%) | 4 (2.3%) |
| Bottled, Tank, or LP Gas | 0 (0.0%) | 0 (0.0%) |
| Electricity | 161 (42.4%) | 171 (97.7%) |
| Fuel Oil or Kerosene | 0 (0.0%) | 0 (0.0%) |
| Coal or Coke | 0 (0.0%) | 0 (0.0%) |
| All other Fuels | 0 (0.0%) | 0 (0.0%) |
| No Fuel Used | 0 (0.0%) | 0 (0.0%) |
| Total | 380 (100.0%) | 175 (100.0%) |
Household Vehicle Usage in Red Lick
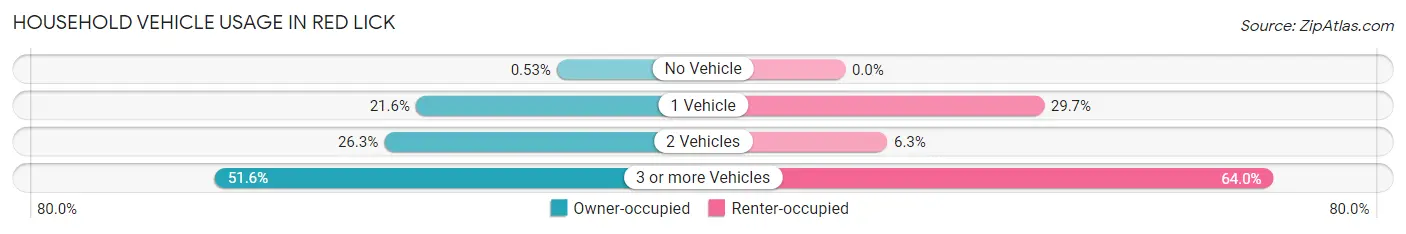
| Vehicles per Household | Owner-occupied | Renter-occupied |
| No Vehicle | 2 (0.5%) | 0 (0.0%) |
| 1 Vehicle | 82 (21.6%) | 52 (29.7%) |
| 2 Vehicles | 100 (26.3%) | 11 (6.3%) |
| 3 or more Vehicles | 196 (51.6%) | 112 (64.0%) |
| Total | 380 (100.0%) | 175 (100.0%) |
Real Estate & Mortgages in Red Lick
Real Estate and Mortgage Overview in Red Lick
| Characteristic | Without Mortgage | With Mortgage |
| Housing Units | 123 | 257 |
| Median Property Value | $181,300 | $314,000 |
| Median Household Income | $88,472 | $112 |
| Monthly Housing Costs | $635 | $30 |
| Real Estate Taxes | $3,000 | $4 |
Property Value by Mortgage Status in Red Lick
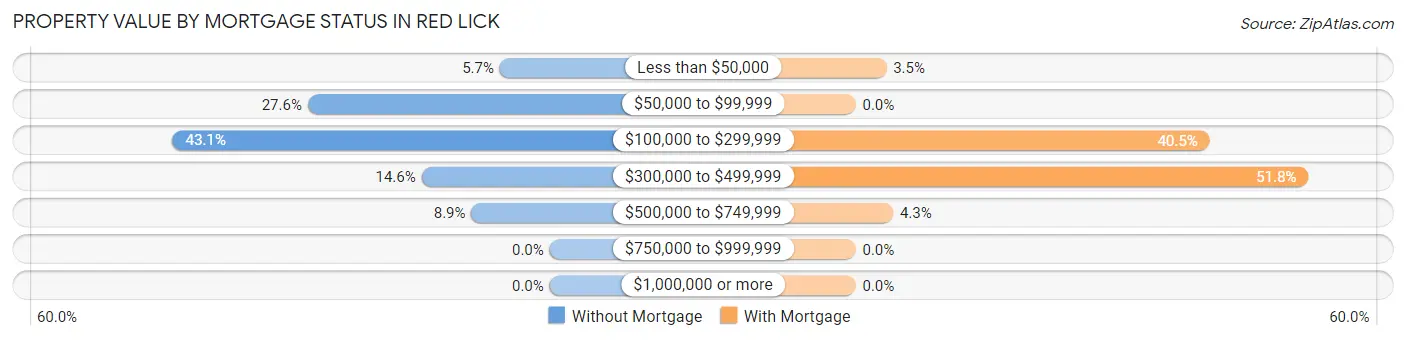
| Property Value | Without Mortgage | With Mortgage |
| Less than $50,000 | 7 (5.7%) | 9 (3.5%) |
| $50,000 to $99,999 | 34 (27.6%) | 0 (0.0%) |
| $100,000 to $299,999 | 53 (43.1%) | 104 (40.5%) |
| $300,000 to $499,999 | 18 (14.6%) | 133 (51.7%) |
| $500,000 to $749,999 | 11 (8.9%) | 11 (4.3%) |
| $750,000 to $999,999 | 0 (0.0%) | 0 (0.0%) |
| $1,000,000 or more | 0 (0.0%) | 0 (0.0%) |
| Total | 123 (100.0%) | 257 (100.0%) |
Household Income by Mortgage Status in Red Lick
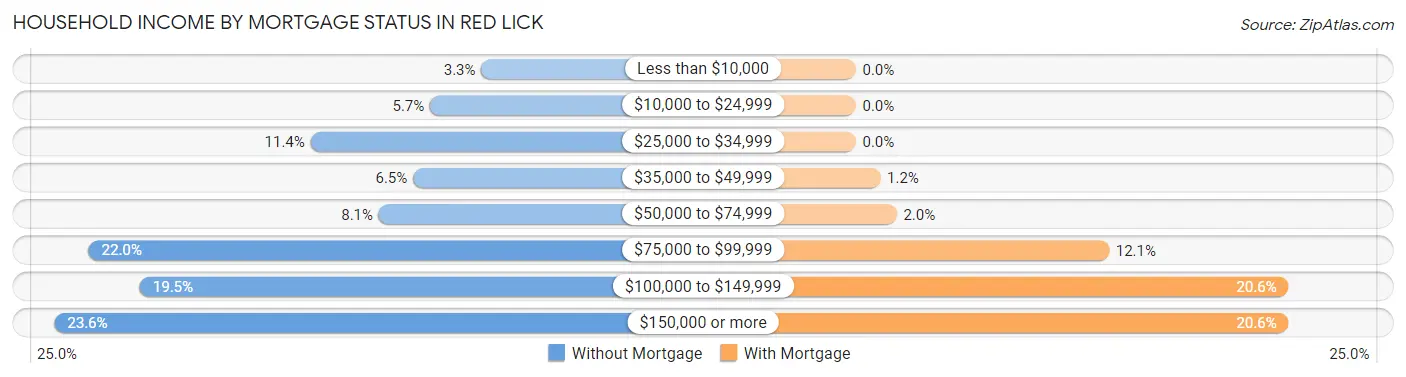
| Household Income | Without Mortgage | With Mortgage |
| Less than $10,000 | 4 (3.3%) | 0 (0.0%) |
| $10,000 to $24,999 | 7 (5.7%) | 0 (0.0%) |
| $25,000 to $34,999 | 14 (11.4%) | 0 (0.0%) |
| $35,000 to $49,999 | 8 (6.5%) | 3 (1.2%) |
| $50,000 to $74,999 | 10 (8.1%) | 5 (1.9%) |
| $75,000 to $99,999 | 27 (22.0%) | 31 (12.1%) |
| $100,000 to $149,999 | 24 (19.5%) | 53 (20.6%) |
| $150,000 or more | 29 (23.6%) | 53 (20.6%) |
| Total | 123 (100.0%) | 257 (100.0%) |
Property Value to Household Income Ratio in Red Lick
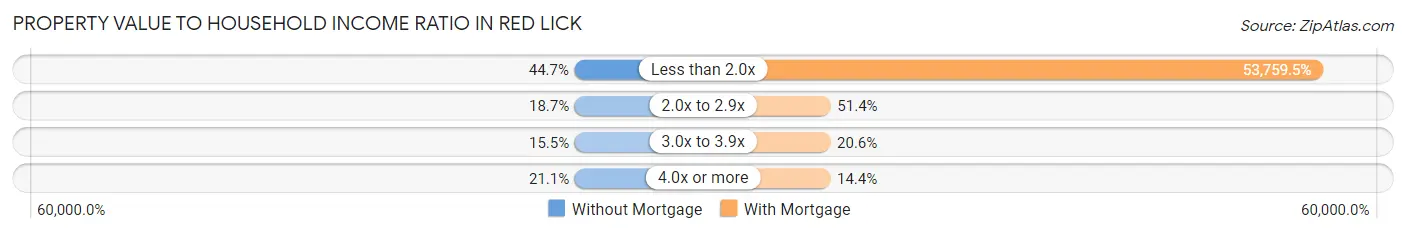
| Value-to-Income Ratio | Without Mortgage | With Mortgage |
| Less than 2.0x | 55 (44.7%) | 138,162 (53,759.5%) |
| 2.0x to 2.9x | 23 (18.7%) | 132 (51.4%) |
| 3.0x to 3.9x | 19 (15.4%) | 53 (20.6%) |
| 4.0x or more | 26 (21.1%) | 37 (14.4%) |
| Total | 123 (100.0%) | 257 (100.0%) |
Real Estate Taxes by Mortgage Status in Red Lick
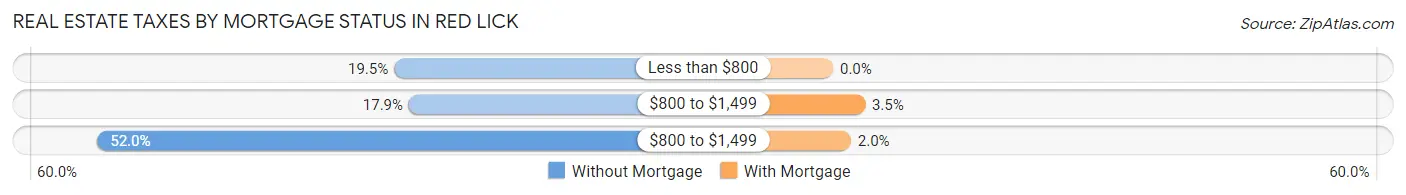
| Property Taxes | Without Mortgage | With Mortgage |
| Less than $800 | 24 (19.5%) | 0 (0.0%) |
| $800 to $1,499 | 22 (17.9%) | 9 (3.5%) |
| $800 to $1,499 | 64 (52.0%) | 5 (1.9%) |
| Total | 123 (100.0%) | 257 (100.0%) |
Health & Disability in Red Lick
Health Insurance Coverage by Age in Red Lick
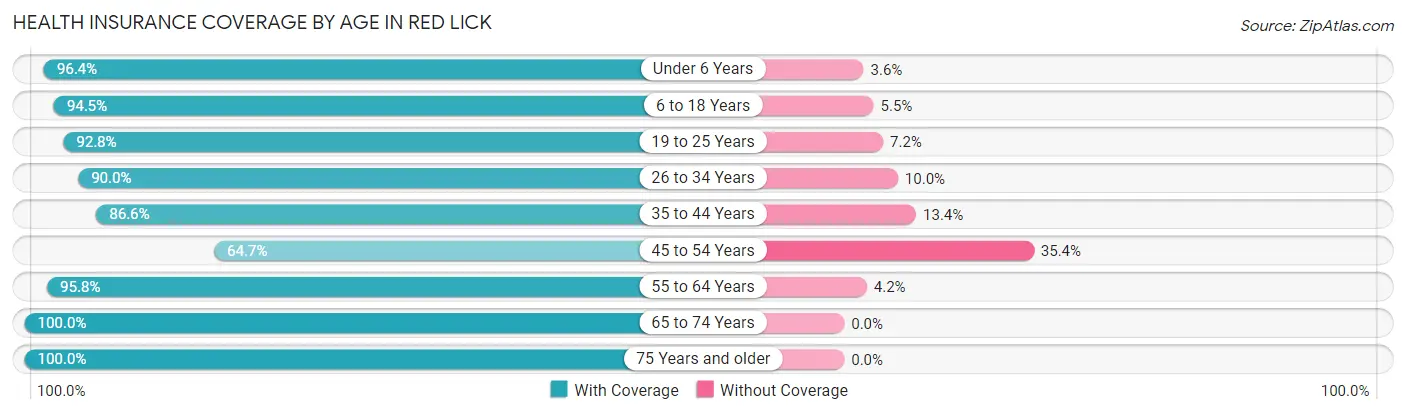
| Age Bracket | With Coverage | Without Coverage |
| Under 6 Years | 107 (96.4%) | 4 (3.6%) |
| 6 to 18 Years | 329 (94.5%) | 19 (5.5%) |
| 19 to 25 Years | 154 (92.8%) | 12 (7.2%) |
| 26 to 34 Years | 54 (90.0%) | 6 (10.0%) |
| 35 to 44 Years | 220 (86.6%) | 34 (13.4%) |
| 45 to 54 Years | 214 (64.6%) | 117 (35.3%) |
| 55 to 64 Years | 137 (95.8%) | 6 (4.2%) |
| 65 to 74 Years | 104 (100.0%) | 0 (0.0%) |
| 75 Years and older | 69 (100.0%) | 0 (0.0%) |
| Total | 1,388 (87.5%) | 198 (12.5%) |
Health Insurance Coverage by Citizenship Status in Red Lick
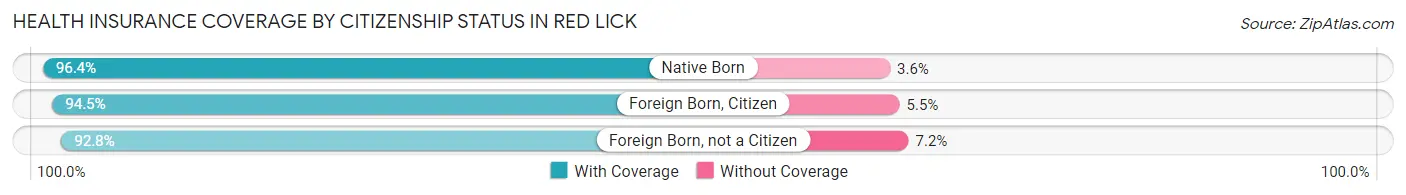
| Citizenship Status | With Coverage | Without Coverage |
| Native Born | 107 (96.4%) | 4 (3.6%) |
| Foreign Born, Citizen | 329 (94.5%) | 19 (5.5%) |
| Foreign Born, not a Citizen | 154 (92.8%) | 12 (7.2%) |
Health Insurance Coverage by Household Income in Red Lick
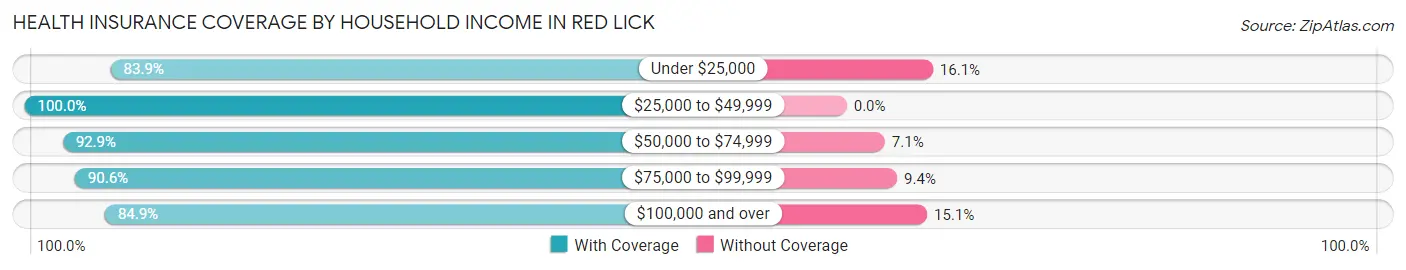
| Household Income | With Coverage | Without Coverage |
| Under $25,000 | 52 (83.9%) | 10 (16.1%) |
| $25,000 to $49,999 | 51 (100.0%) | 0 (0.0%) |
| $50,000 to $74,999 | 117 (92.9%) | 9 (7.1%) |
| $75,000 to $99,999 | 384 (90.6%) | 40 (9.4%) |
| $100,000 and over | 784 (84.9%) | 139 (15.1%) |
Public vs Private Health Insurance Coverage by Age in Red Lick
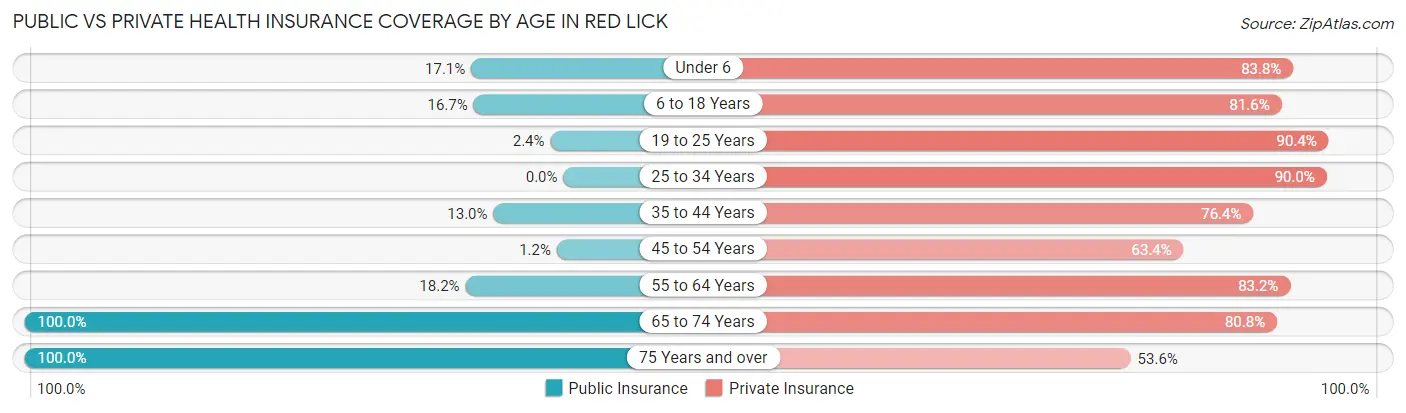
| Age Bracket | Public Insurance | Private Insurance |
| Under 6 | 19 (17.1%) | 93 (83.8%) |
| 6 to 18 Years | 58 (16.7%) | 284 (81.6%) |
| 19 to 25 Years | 4 (2.4%) | 150 (90.4%) |
| 25 to 34 Years | 0 (0.0%) | 54 (90.0%) |
| 35 to 44 Years | 33 (13.0%) | 194 (76.4%) |
| 45 to 54 Years | 4 (1.2%) | 210 (63.4%) |
| 55 to 64 Years | 26 (18.2%) | 119 (83.2%) |
| 65 to 74 Years | 104 (100.0%) | 84 (80.8%) |
| 75 Years and over | 69 (100.0%) | 37 (53.6%) |
| Total | 317 (20.0%) | 1,225 (77.2%) |
Disability Status by Sex by Age in Red Lick
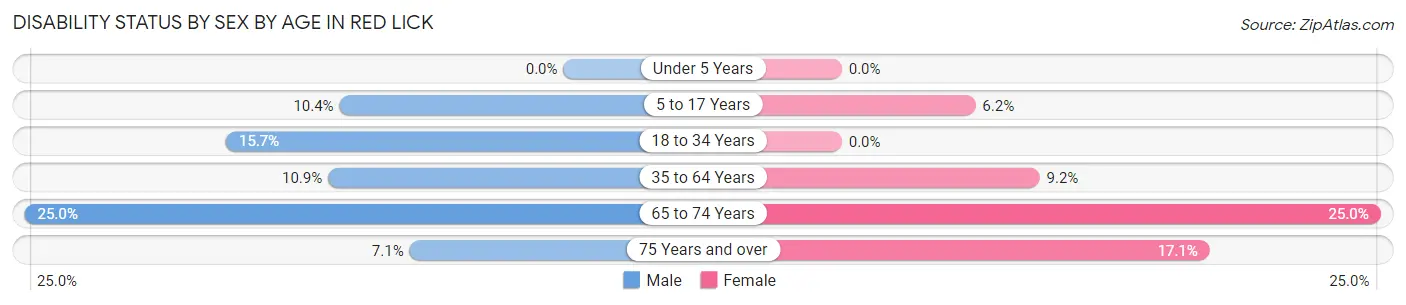
| Age Bracket | Male | Female |
| Under 5 Years | 0 (0.0%) | 0 (0.0%) |
| 5 to 17 Years | 24 (10.4%) | 8 (6.2%) |
| 18 to 34 Years | 13 (15.7%) | 0 (0.0%) |
| 35 to 64 Years | 45 (10.9%) | 29 (9.2%) |
| 65 to 74 Years | 9 (25.0%) | 17 (25.0%) |
| 75 Years and over | 2 (7.1%) | 7 (17.1%) |
Disability Class by Sex by Age in Red Lick
Disability Class: Hearing Difficulty
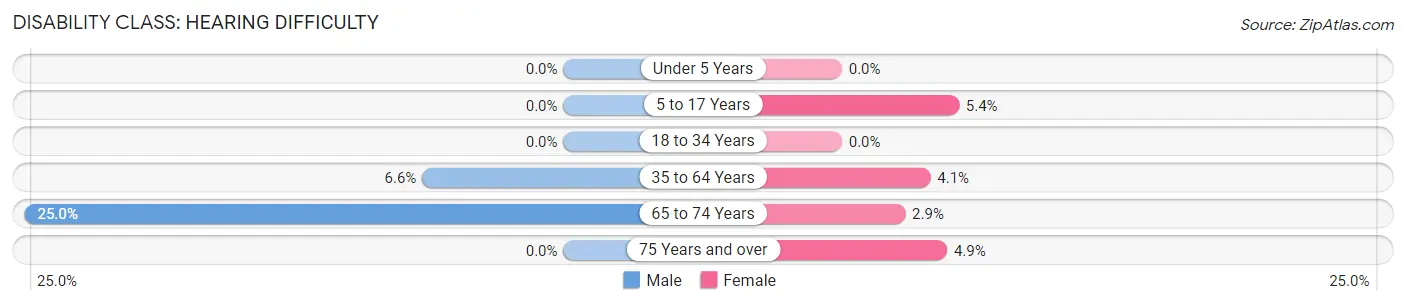
| Age Bracket | Male | Female |
| Under 5 Years | 0 (0.0%) | 0 (0.0%) |
| 5 to 17 Years | 0 (0.0%) | 7 (5.4%) |
| 18 to 34 Years | 0 (0.0%) | 0 (0.0%) |
| 35 to 64 Years | 27 (6.6%) | 13 (4.1%) |
| 65 to 74 Years | 9 (25.0%) | 2 (2.9%) |
| 75 Years and over | 0 (0.0%) | 2 (4.9%) |
Disability Class: Vision Difficulty
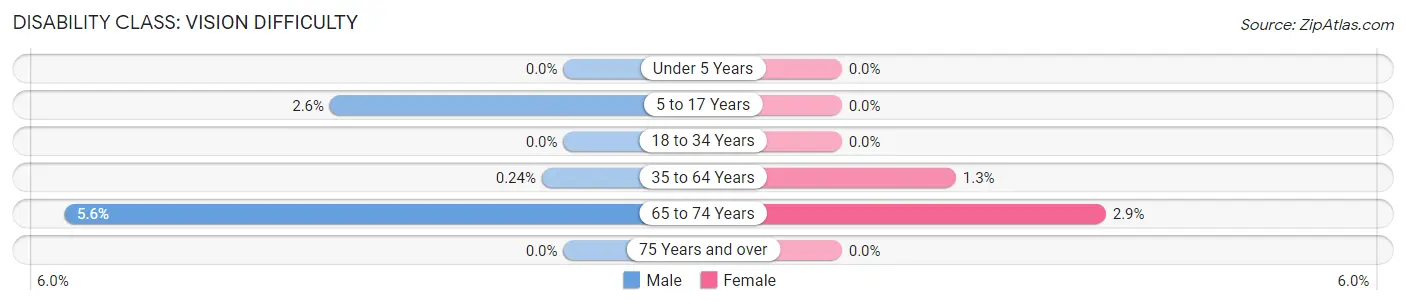
| Age Bracket | Male | Female |
| Under 5 Years | 0 (0.0%) | 0 (0.0%) |
| 5 to 17 Years | 6 (2.6%) | 0 (0.0%) |
| 18 to 34 Years | 0 (0.0%) | 0 (0.0%) |
| 35 to 64 Years | 1 (0.2%) | 4 (1.3%) |
| 65 to 74 Years | 2 (5.6%) | 2 (2.9%) |
| 75 Years and over | 0 (0.0%) | 0 (0.0%) |
Disability Class: Cognitive Difficulty
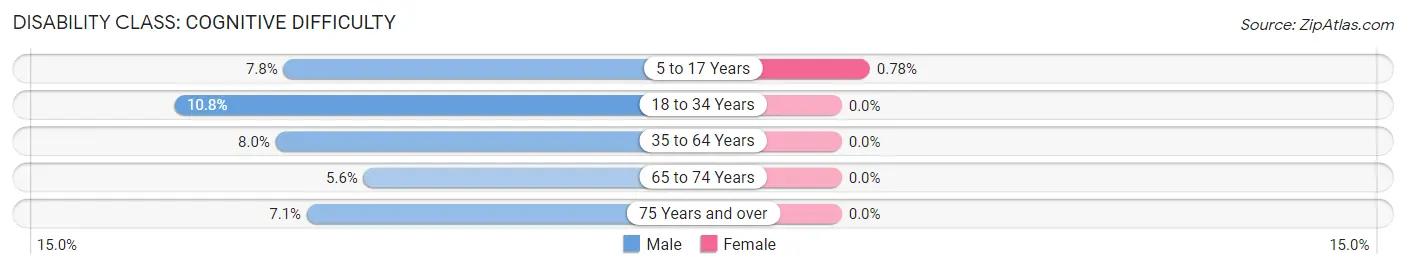
| Age Bracket | Male | Female |
| 5 to 17 Years | 18 (7.8%) | 1 (0.8%) |
| 18 to 34 Years | 9 (10.8%) | 0 (0.0%) |
| 35 to 64 Years | 33 (8.0%) | 0 (0.0%) |
| 65 to 74 Years | 2 (5.6%) | 0 (0.0%) |
| 75 Years and over | 2 (7.1%) | 0 (0.0%) |
Disability Class: Ambulatory Difficulty
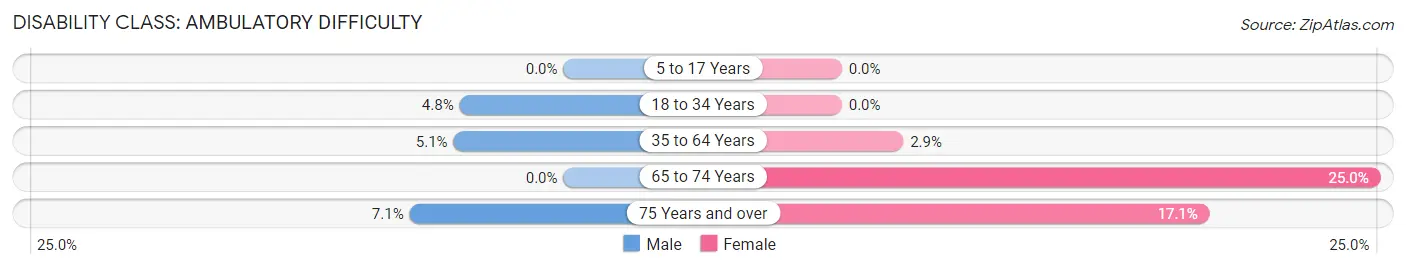
| Age Bracket | Male | Female |
| 5 to 17 Years | 0 (0.0%) | 0 (0.0%) |
| 18 to 34 Years | 4 (4.8%) | 0 (0.0%) |
| 35 to 64 Years | 21 (5.1%) | 9 (2.9%) |
| 65 to 74 Years | 0 (0.0%) | 17 (25.0%) |
| 75 Years and over | 2 (7.1%) | 7 (17.1%) |
Disability Class: Self-Care Difficulty
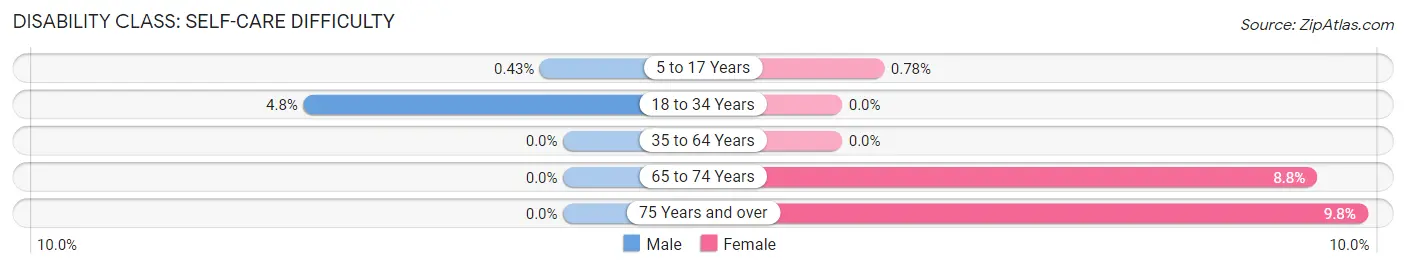
| Age Bracket | Male | Female |
| 5 to 17 Years | 1 (0.4%) | 1 (0.8%) |
| 18 to 34 Years | 4 (4.8%) | 0 (0.0%) |
| 35 to 64 Years | 0 (0.0%) | 0 (0.0%) |
| 65 to 74 Years | 0 (0.0%) | 6 (8.8%) |
| 75 Years and over | 0 (0.0%) | 4 (9.8%) |
Technology Access in Red Lick
Computing Device Access in Red Lick
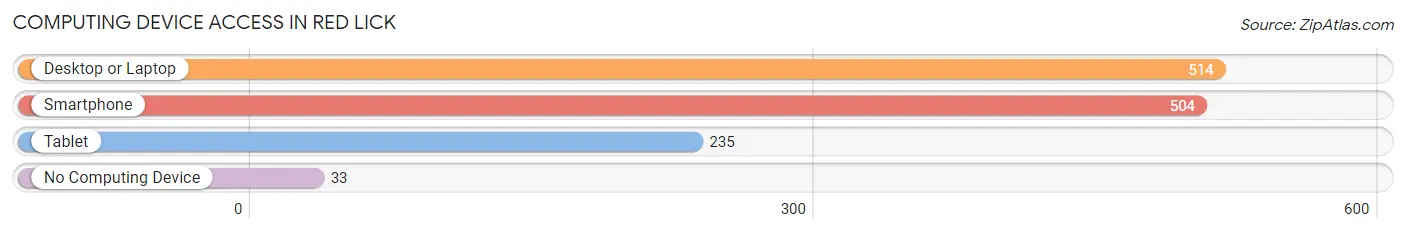
| Device Type | # Households | % Households |
| Desktop or Laptop | 514 | 92.6% |
| Smartphone | 504 | 90.8% |
| Tablet | 235 | 42.3% |
| No Computing Device | 33 | 5.9% |
| Total | 555 | 100.0% |
Internet Access in Red Lick
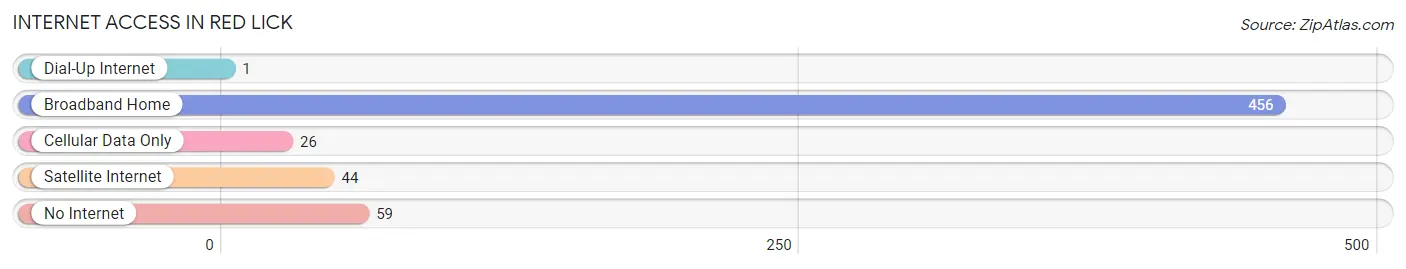
| Internet Type | # Households | % Households |
| Dial-Up Internet | 1 | 0.2% |
| Broadband Home | 456 | 82.2% |
| Cellular Data Only | 26 | 4.7% |
| Satellite Internet | 44 | 7.9% |
| No Internet | 59 | 10.6% |
| Total | 555 | 100.0% |
Red Lick Summary
Red Lick, Texas is a small unincorporated community located in the northeastern corner of Hardin County, Texas. It is situated on the banks of the Neches River, approximately 15 miles south of the city of Beaumont. The population of Red Lick was estimated to be around 200 people in 2020.
History
The area that is now Red Lick was first settled in the early 1800s by a group of settlers from the United States. The settlement was originally known as “Red Lick” due to the presence of a red clay deposit in the area. The settlers used the clay to make bricks, which were used to build homes and other structures in the area.
In 1836, the Republic of Texas was established and Red Lick was officially recognized as a town. The town was named after the red clay deposit and was the first settlement in Hardin County.
In the late 1800s, the town began to grow and prosper. The population increased and businesses began to open in the area. The town was home to a cotton gin, a sawmill, a blacksmith shop, and a general store.
In the early 1900s, the town began to decline due to the Great Depression and the Dust Bowl. Many of the businesses closed and the population decreased.
Geography
Red Lick is located in the northeastern corner of Hardin County, Texas. It is situated on the banks of the Neches River, approximately 15 miles south of the city of Beaumont. The town is surrounded by rolling hills and is located in a rural area.
The climate in Red Lick is humid subtropical, with hot summers and mild winters. The average temperature in the summer is around 90 degrees Fahrenheit and the average temperature in the winter is around 50 degrees Fahrenheit.
Economy
The economy of Red Lick is largely based on agriculture. The town is home to several farms that produce cotton, corn, soybeans, and other crops. The town also has a few small businesses, including a general store, a gas station, and a restaurant.
Demographics
The population of Red Lick was estimated to be around 200 people in 2020. The majority of the population is white (90%), followed by African American (7%), Hispanic (2%), and other (1%). The median household income in Red Lick is $35,000 and the median home value is $90,000.
Conclusion
Red Lick, Texas is a small unincorporated community located in the northeastern corner of Hardin County, Texas. It is situated on the banks of the Neches River, approximately 15 miles south of the city of Beaumont. The population of Red Lick was estimated to be around 200 people in 2020. The economy of Red Lick is largely based on agriculture and the town is home to several farms that produce cotton, corn, soybeans, and other crops. The majority of the population is white (90%), followed by African American (7%), Hispanic (2%), and other (1%). The median household income in Red Lick is $35,000 and the median home value is $90,000.
Common Questions
What is Per Capita Income in Red Lick?
Per Capita income in Red Lick is $42,621.
What is the Median Family Income in Red Lick?
Median Family Income in Red Lick is $97,768.
What is the Median Household income in Red Lick?
Median Household Income in Red Lick is $135,750.
What is Income or Wage Gap in Red Lick?
Income or Wage Gap in Red Lick is 35.4%.
Women in Red Lick earn 64.6 cents for every dollar earned by a man.
What is Inequality or Gini Index in Red Lick?
Inequality or Gini Index in Red Lick is 0.31.
What is the Total Population of Red Lick?
Total Population of Red Lick is 1,586.
What is the Total Male Population of Red Lick?
Total Male Population of Red Lick is 803.
What is the Total Female Population of Red Lick?
Total Female Population of Red Lick is 783.
What is the Ratio of Males per 100 Females in Red Lick?
There are 102.55 Males per 100 Females in Red Lick.
What is the Ratio of Females per 100 Males in Red Lick?
There are 97.51 Females per 100 Males in Red Lick.
What is the Median Population Age in Red Lick?
Median Population Age in Red Lick is 39.3 Years.
What is the Average Family Size in Red Lick
Average Family Size in Red Lick is 3.1 People.
What is the Average Household Size in Red Lick
Average Household Size in Red Lick is 2.9 People.
How Large is the Labor Force in Red Lick?
There are 905 People in the Labor Forcein in Red Lick.
What is the Percentage of People in the Labor Force in Red Lick?
74.7% of People are in the Labor Force in Red Lick.
What is the Unemployment Rate in Red Lick?
Unemployment Rate in Red Lick is 1.5%.