Port Isabel, TX Map & Demographics
Port Isabel Map
Port Isabel Overview
$24,100
PER CAPITA INCOME
$58,807
AVG FAMILY INCOME
$42,601
AVG HOUSEHOLD INCOME
37.0%
WAGE / INCOME GAP [ % ]
63.0¢/ $1
WAGE / INCOME GAP [ $ ]
$14,895
FAMILY INCOME DEFICIT
0.51
INEQUALITY / GINI INDEX
5,137
TOTAL POPULATION
2,636
MALE POPULATION
2,501
FEMALE POPULATION
105.40
MALES / 100 FEMALES
94.88
FEMALES / 100 MALES
39.7
MEDIAN AGE
3.6
AVG FAMILY SIZE
2.7
AVG HOUSEHOLD SIZE
2,120
LABOR FORCE [ PEOPLE ]
54.3%
PERCENT IN LABOR FORCE
2.0%
UNEMPLOYMENT RATE
Port Isabel Zip Codes
Port Isabel Area Codes
Income in Port Isabel
Income Overview in Port Isabel
Per Capita Income in Port Isabel is $24,100, while median incomes of families and households are $58,807 and $42,601 respectively.
| Characteristic | Number | Measure |
| Per Capita Income | 5,137 | $24,100 |
| Median Family Income | 1,233 | $58,807 |
| Mean Family Income | 1,233 | $68,092 |
| Median Household Income | 1,933 | $42,601 |
| Mean Household Income | 1,933 | $59,772 |
| Income Deficit | 1,233 | $14,895 |
| Wage / Income Gap (%) | 5,137 | 37.05% |
| Wage / Income Gap ($) | 5,137 | 62.95¢ per $1 |
| Gini / Inequality Index | 5,137 | 0.51 |
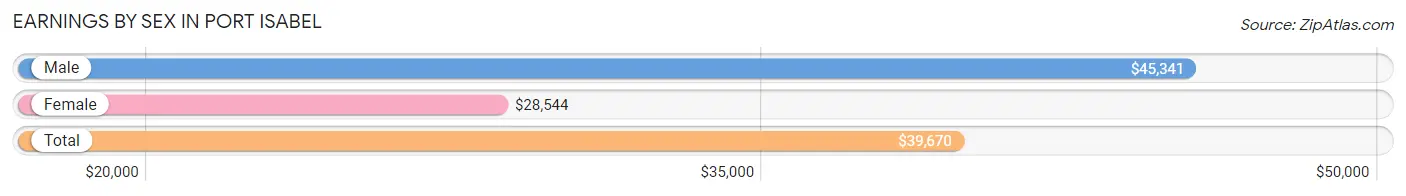
Earnings by Sex in Port Isabel
Average Earnings in Port Isabel are $39,670, $45,341 for men and $28,544 for women, a difference of 37.0%.
| Sex | Number | Average Earnings |
| Male | 1,214 (57.4%) | $45,341 |
| Female | 902 (42.6%) | $28,544 |
| Total | 2,116 (100.0%) | $39,670 |
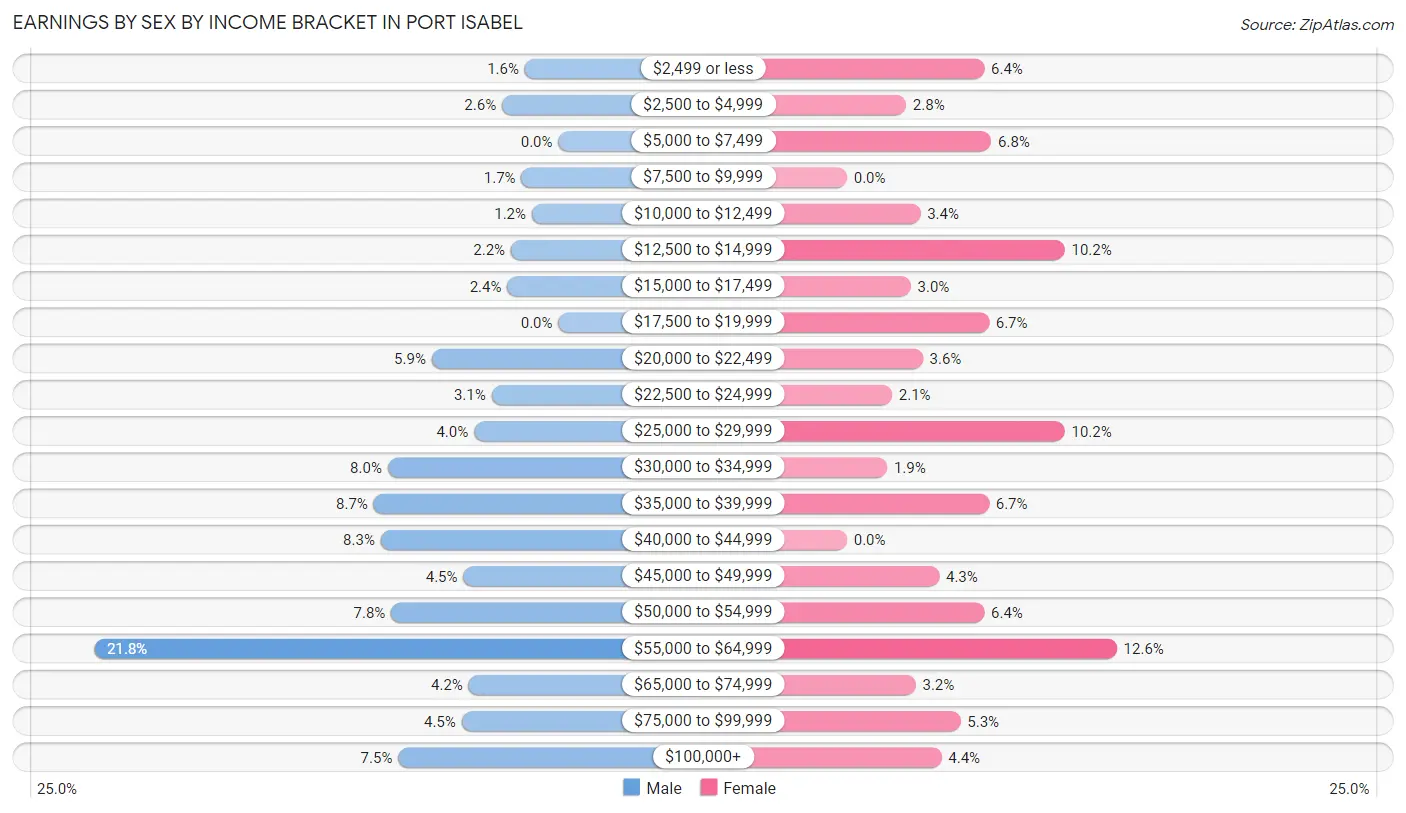
Earnings by Sex by Income Bracket in Port Isabel
The most common earnings brackets in Port Isabel are $55,000 to $64,999 for men (264 | 21.7%) and $55,000 to $64,999 for women (114 | 12.6%).
| Income | Male | Female |
| $2,499 or less | 19 (1.6%) | 58 (6.4%) |
| $2,500 to $4,999 | 32 (2.6%) | 25 (2.8%) |
| $5,000 to $7,499 | 0 (0.0%) | 61 (6.8%) |
| $7,500 to $9,999 | 21 (1.7%) | 0 (0.0%) |
| $10,000 to $12,499 | 15 (1.2%) | 31 (3.4%) |
| $12,500 to $14,999 | 27 (2.2%) | 92 (10.2%) |
| $15,000 to $17,499 | 29 (2.4%) | 27 (3.0%) |
| $17,500 to $19,999 | 0 (0.0%) | 60 (6.7%) |
| $20,000 to $22,499 | 72 (5.9%) | 32 (3.5%) |
| $22,500 to $24,999 | 38 (3.1%) | 19 (2.1%) |
| $25,000 to $29,999 | 48 (4.0%) | 92 (10.2%) |
| $30,000 to $34,999 | 97 (8.0%) | 17 (1.9%) |
| $35,000 to $39,999 | 105 (8.6%) | 60 (6.7%) |
| $40,000 to $44,999 | 101 (8.3%) | 0 (0.0%) |
| $45,000 to $49,999 | 54 (4.4%) | 39 (4.3%) |
| $50,000 to $54,999 | 95 (7.8%) | 58 (6.4%) |
| $55,000 to $64,999 | 264 (21.7%) | 114 (12.6%) |
| $65,000 to $74,999 | 51 (4.2%) | 29 (3.2%) |
| $75,000 to $99,999 | 55 (4.5%) | 48 (5.3%) |
| $100,000+ | 91 (7.5%) | 40 (4.4%) |
| Total | 1,214 (100.0%) | 902 (100.0%) |
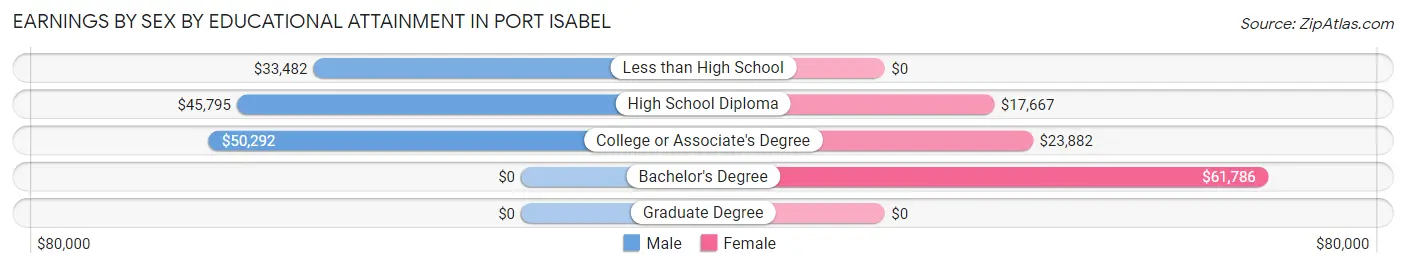
Earnings by Sex by Educational Attainment in Port Isabel
Average earnings in Port Isabel are $46,818 for men and $33,375 for women, a difference of 28.7%. Men with an educational attainment of college or associate's degree enjoy the highest average annual earnings of $50,292, while those with less than high school education earn the least with $33,482. Women with an educational attainment of bachelor's degree earn the most with the average annual earnings of $61,786, while those with high school diploma education have the smallest earnings of $17,667.
| Educational Attainment | Male Income | Female Income |
| Less than High School | $33,482 | $0 |
| High School Diploma | $45,795 | $17,667 |
| College or Associate's Degree | $50,292 | $23,882 |
| Bachelor's Degree | - | - |
| Graduate Degree | - | - |
| Total | $46,818 | $33,375 |
Family Income in Port Isabel
Family Income Brackets in Port Isabel
According to the Port Isabel family income data, there are 236 families falling into the $50,000 to $74,999 income range, which is the most common income bracket and makes up 19.1% of all families. Conversely, the $10,000 to $14,999 income bracket is the least frequent group with only 15 families (1.2%) belonging to this category.
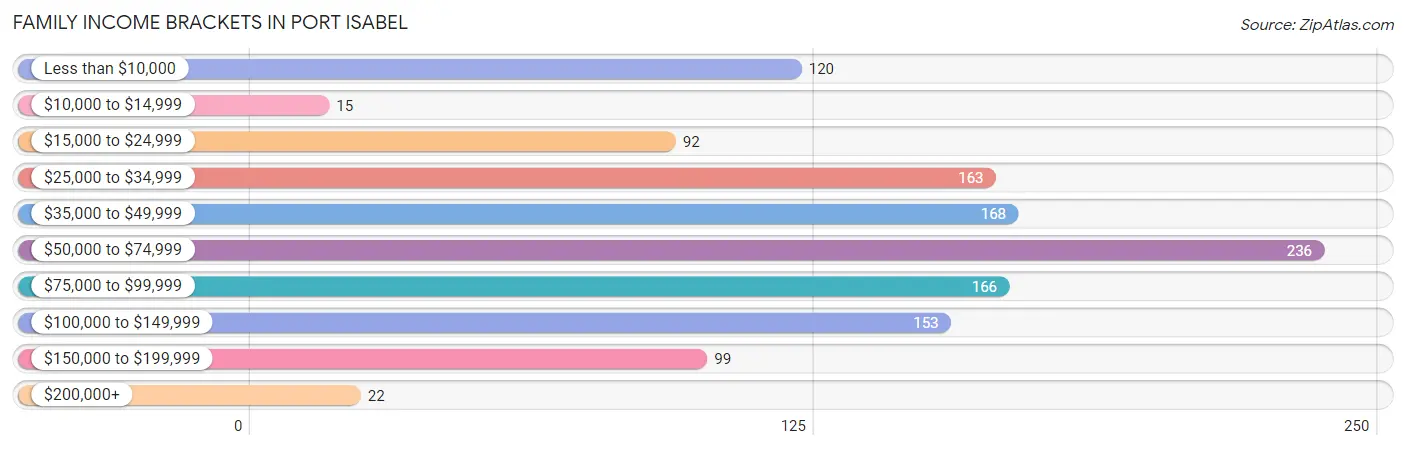
| Income Bracket | # Families | % Families |
| Less than $10,000 | 120 | 9.7% |
| $10,000 to $14,999 | 15 | 1.2% |
| $15,000 to $24,999 | 92 | 7.5% |
| $25,000 to $34,999 | 163 | 13.2% |
| $35,000 to $49,999 | 168 | 13.6% |
| $50,000 to $74,999 | 236 | 19.1% |
| $75,000 to $99,999 | 166 | 13.5% |
| $100,000 to $149,999 | 153 | 12.4% |
| $150,000 to $199,999 | 99 | 8.0% |
| $200,000+ | 22 | 1.8% |
Family Income by Famaliy Size in Port Isabel
3-person families (325 | 26.4%) account for the highest median family income in Port Isabel with $62,917 per family, while 2-person families (423 | 34.3%) have the highest median income of $28,949 per family member.
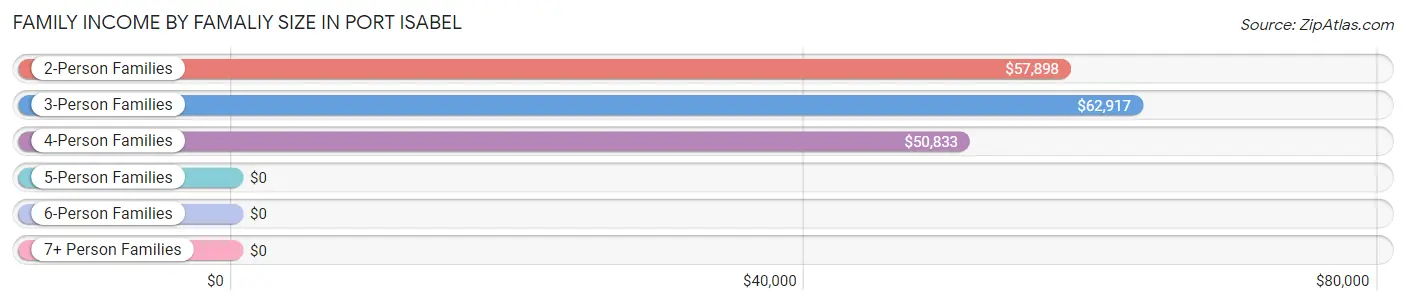
| Income Bracket | # Families | Median Income |
| 2-Person Families | 423 (34.3%) | $57,898 |
| 3-Person Families | 325 (26.4%) | $62,917 |
| 4-Person Families | 316 (25.6%) | $50,833 |
| 5-Person Families | 116 (9.4%) | $0 |
| 6-Person Families | 24 (1.9%) | $0 |
| 7+ Person Families | 29 (2.4%) | $0 |
| Total | 1,233 (100.0%) | $58,807 |
Family Income by Number of Earners in Port Isabel
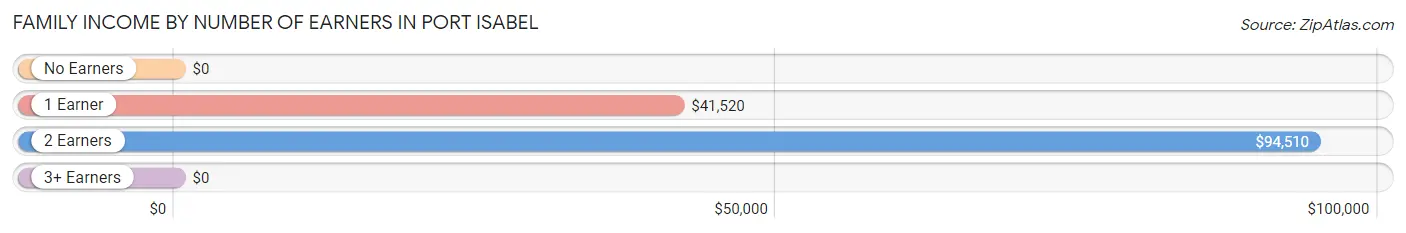
| Number of Earners | # Families | Median Income |
| No Earners | 264 (21.4%) | $0 |
| 1 Earner | 495 (40.2%) | $41,520 |
| 2 Earners | 412 (33.4%) | $94,510 |
| 3+ Earners | 62 (5.0%) | $0 |
| Total | 1,233 (100.0%) | $58,807 |
Household Income in Port Isabel
Household Income Brackets in Port Isabel
With 344 households falling in the category, the $50,000 to $74,999 income range is the most frequent in Port Isabel, accounting for 17.8% of all households. In contrast, only 62 households (3.2%) fall into the $200,000+ income bracket, making it the least populous group.
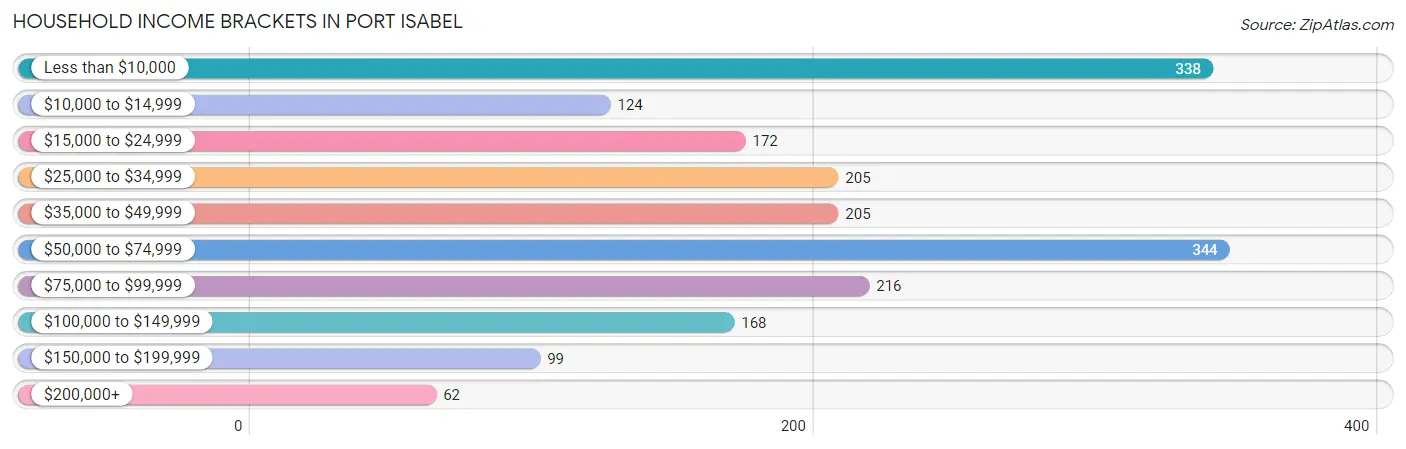
| Income Bracket | # Households | % Households |
| Less than $10,000 | 338 | 17.5% |
| $10,000 to $14,999 | 124 | 6.4% |
| $15,000 to $24,999 | 172 | 8.9% |
| $25,000 to $34,999 | 205 | 10.6% |
| $35,000 to $49,999 | 205 | 10.6% |
| $50,000 to $74,999 | 344 | 17.8% |
| $75,000 to $99,999 | 216 | 11.2% |
| $100,000 to $149,999 | 168 | 8.7% |
| $150,000 to $199,999 | 99 | 5.1% |
| $200,000+ | 62 | 3.2% |
Household Income by Householder Age in Port Isabel
The median household income in Port Isabel is $42,601, with the highest median household income of $47,723 found in the 65+ years age bracket for the primary householder. A total of 609 households (31.5%) fall into this category. Meanwhile, the 15 to 24 years age bracket for the primary householder has the lowest median household income of $0, with 93 households (4.8%) in this group.
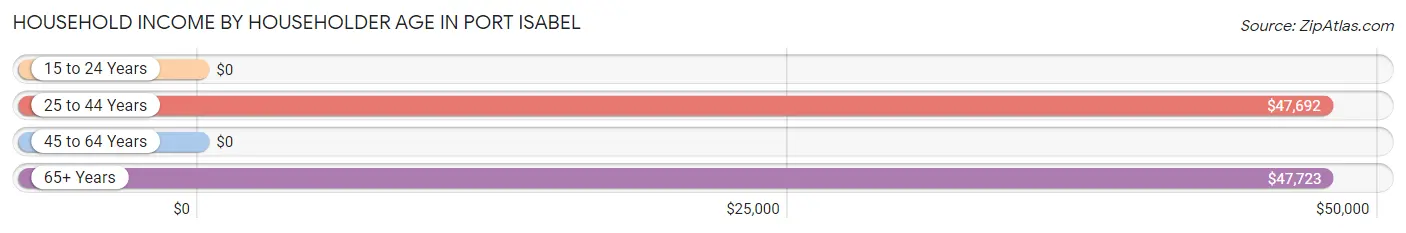
| Income Bracket | # Households | Median Income |
| 15 to 24 Years | 93 (4.8%) | $0 |
| 25 to 44 Years | 564 (29.2%) | $47,692 |
| 45 to 64 Years | 667 (34.5%) | $0 |
| 65+ Years | 609 (31.5%) | $47,723 |
| Total | 1,933 (100.0%) | $42,601 |
Poverty in Port Isabel
Income Below Poverty by Sex and Age in Port Isabel
With 21.3% poverty level for males and 31.4% for females among the residents of Port Isabel, 5 year old males and 6 to 11 year old females are the most vulnerable to poverty, with 33 males (70.2%) and 179 females (63.0%) in their respective age groups living below the poverty level.
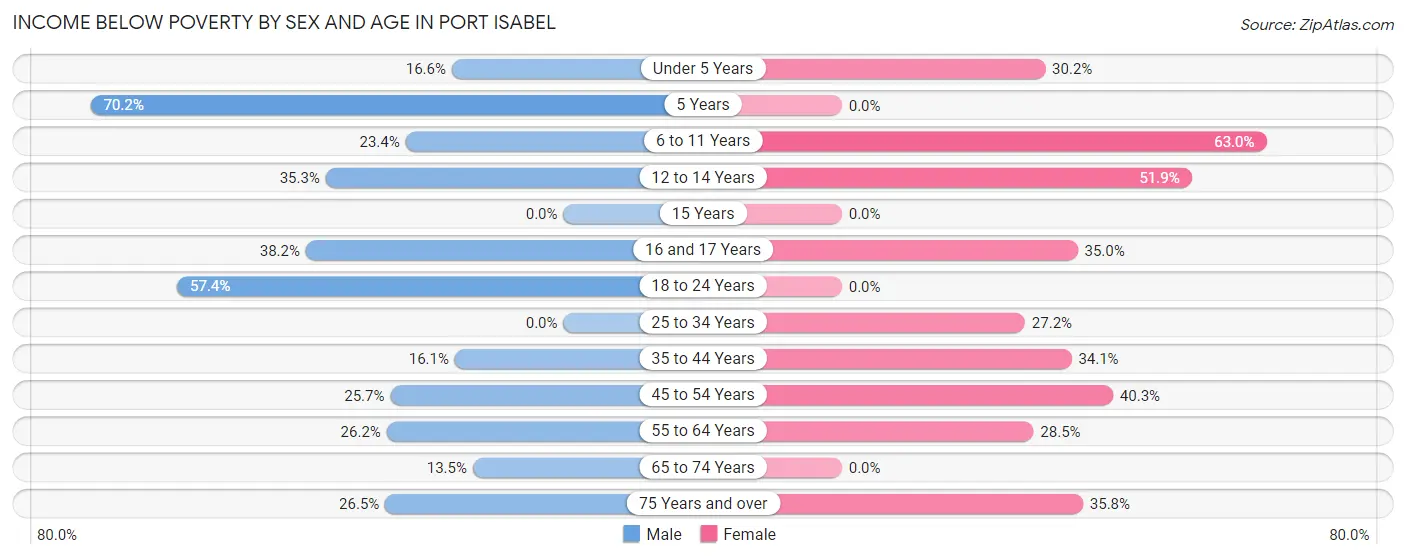
| Age Bracket | Male | Female |
| Under 5 Years | 29 (16.6%) | 45 (30.2%) |
| 5 Years | 33 (70.2%) | 0 (0.0%) |
| 6 to 11 Years | 56 (23.4%) | 179 (63.0%) |
| 12 to 14 Years | 54 (35.3%) | 54 (51.9%) |
| 15 Years | 0 (0.0%) | 0 (0.0%) |
| 16 and 17 Years | 26 (38.2%) | 14 (35.0%) |
| 18 to 24 Years | 74 (57.4%) | 0 (0.0%) |
| 25 to 34 Years | 0 (0.0%) | 62 (27.2%) |
| 35 to 44 Years | 69 (16.1%) | 119 (34.1%) |
| 45 to 54 Years | 64 (25.7%) | 93 (40.3%) |
| 55 to 64 Years | 74 (26.2%) | 103 (28.4%) |
| 65 to 74 Years | 32 (13.5%) | 0 (0.0%) |
| 75 Years and over | 50 (26.5%) | 116 (35.8%) |
| Total | 561 (21.3%) | 785 (31.4%) |
Income Above Poverty by Sex and Age in Port Isabel
According to the poverty statistics in Port Isabel, males aged 15 years and females aged 5 years are the age groups that are most secure financially, with 100.0% of males and 100.0% of females in these age groups living above the poverty line.
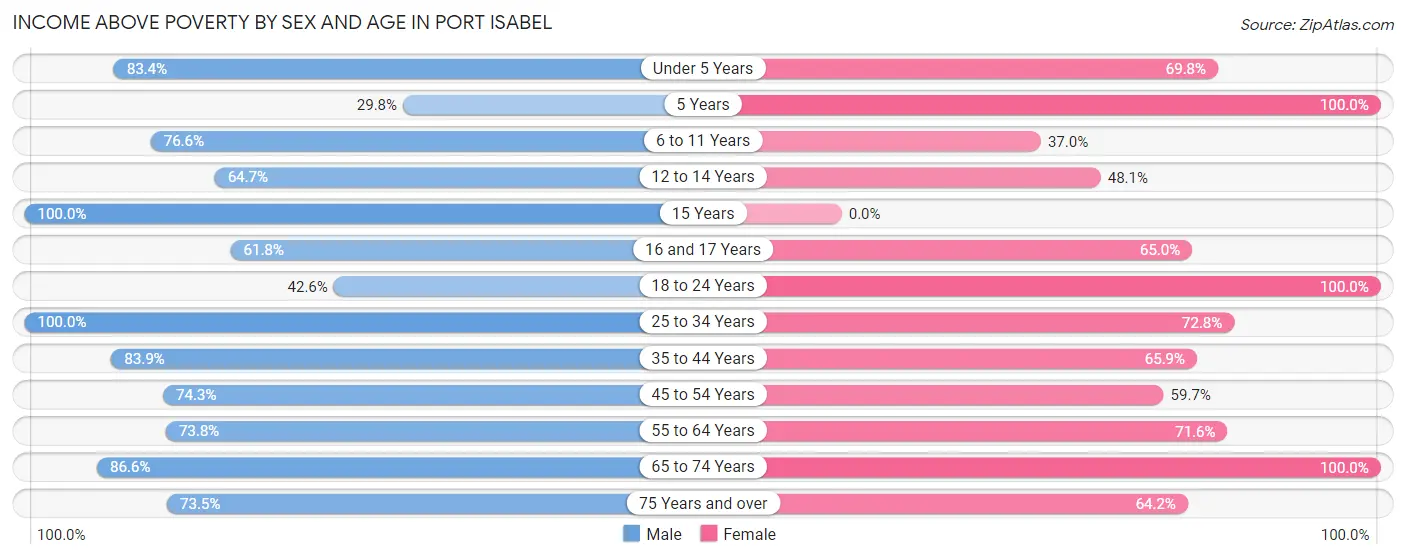
| Age Bracket | Male | Female |
| Under 5 Years | 146 (83.4%) | 104 (69.8%) |
| 5 Years | 14 (29.8%) | 52 (100.0%) |
| 6 to 11 Years | 183 (76.6%) | 105 (37.0%) |
| 12 to 14 Years | 99 (64.7%) | 50 (48.1%) |
| 15 Years | 30 (100.0%) | 0 (0.0%) |
| 16 and 17 Years | 42 (61.8%) | 26 (65.0%) |
| 18 to 24 Years | 55 (42.6%) | 113 (100.0%) |
| 25 to 34 Years | 409 (100.0%) | 166 (72.8%) |
| 35 to 44 Years | 359 (83.9%) | 230 (65.9%) |
| 45 to 54 Years | 185 (74.3%) | 138 (59.7%) |
| 55 to 64 Years | 208 (73.8%) | 259 (71.6%) |
| 65 to 74 Years | 206 (86.6%) | 265 (100.0%) |
| 75 Years and over | 139 (73.5%) | 208 (64.2%) |
| Total | 2,075 (78.7%) | 1,716 (68.6%) |
Income Below Poverty Among Married-Couple Families in Port Isabel
The poverty statistics for married-couple families in Port Isabel show that 15.4% or 130 of the total 843 families live below the poverty line. Families with 3 or 4 children have the highest poverty rate of 100.0%, comprising of 24 families. On the other hand, families with 5 or more children have the lowest poverty rate of 0.0%, which includes 0 families.
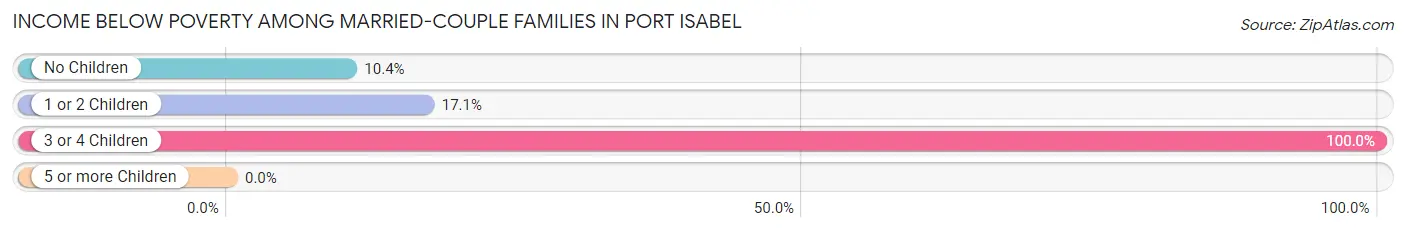
| Children | Above Poverty | Below Poverty |
| No Children | 440 (89.6%) | 51 (10.4%) |
| 1 or 2 Children | 266 (82.9%) | 55 (17.1%) |
| 3 or 4 Children | 0 (0.0%) | 24 (100.0%) |
| 5 or more Children | 7 (100.0%) | 0 (0.0%) |
| Total | 713 (84.6%) | 130 (15.4%) |
Income Below Poverty Among Single-Parent Households in Port Isabel
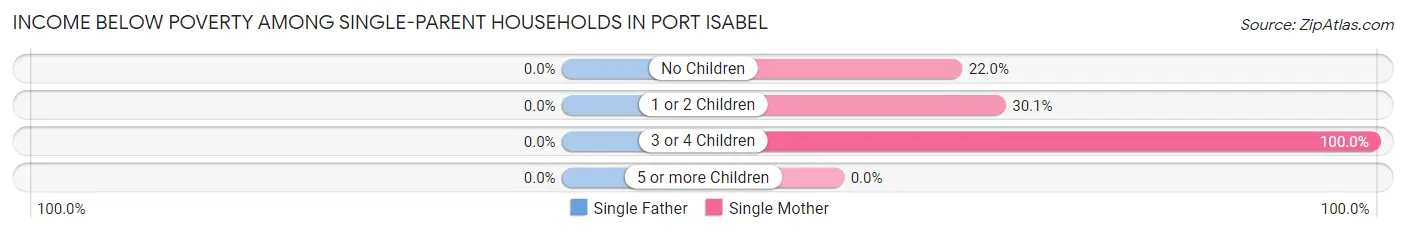
| Children | Single Father | Single Mother |
| No Children | 0 (0.0%) | 11 (22.0%) |
| 1 or 2 Children | 0 (0.0%) | 62 (30.1%) |
| 3 or 4 Children | 0 (0.0%) | 43 (100.0%) |
| 5 or more Children | 0 (0.0%) | 0 (0.0%) |
| Total | 0 (0.0%) | 116 (38.8%) |
Income Below Poverty Among Married-Couple vs Single-Parent Households in Port Isabel
The poverty data for Port Isabel shows that 130 of the married-couple family households (15.4%) and 116 of the single-parent households (29.7%) are living below the poverty level. Within the married-couple family households, those with 3 or 4 children have the highest poverty rate, with 24 households (100.0%) falling below the poverty line. Among the single-parent households, those with 3 or 4 children have the highest poverty rate, with 43 household (100.0%) living below poverty.
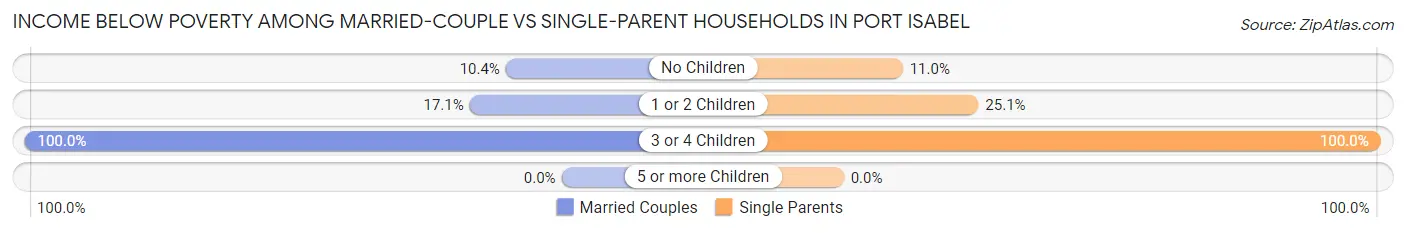
| Children | Married-Couple Families | Single-Parent Households |
| No Children | 51 (10.4%) | 11 (11.0%) |
| 1 or 2 Children | 55 (17.1%) | 62 (25.1%) |
| 3 or 4 Children | 24 (100.0%) | 43 (100.0%) |
| 5 or more Children | 0 (0.0%) | 0 (0.0%) |
| Total | 130 (15.4%) | 116 (29.7%) |
Race in Port Isabel
The most populous races in Port Isabel are Hispanic or Latino (4,331 | 84.3%), White / Caucasian (4,103 | 79.9%), and Two or more Races (744 | 14.5%).
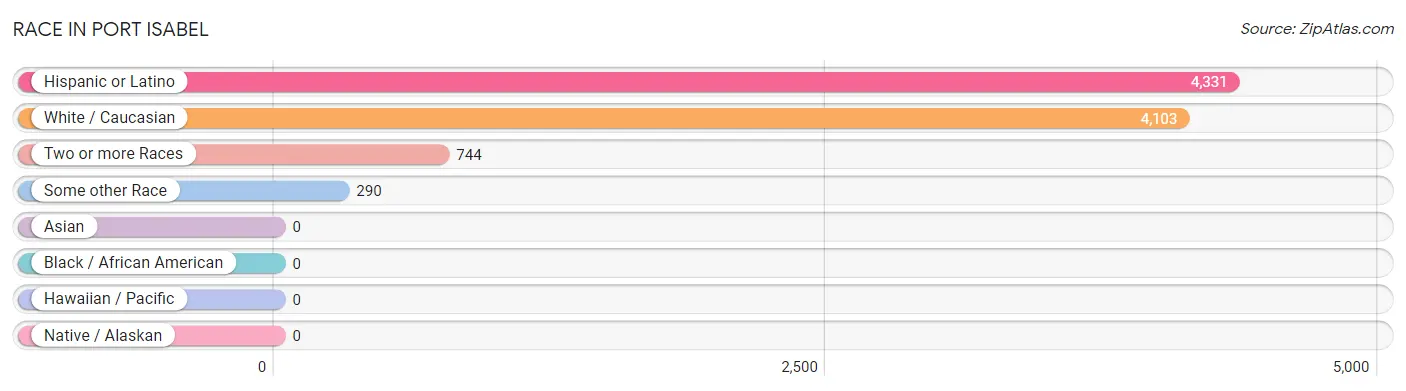
| Race | # Population | % Population |
| Asian | 0 | 0.0% |
| Black / African American | 0 | 0.0% |
| Hawaiian / Pacific | 0 | 0.0% |
| Hispanic or Latino | 4,331 | 84.3% |
| Native / Alaskan | 0 | 0.0% |
| White / Caucasian | 4,103 | 79.9% |
| Two or more Races | 744 | 14.5% |
| Some other Race | 290 | 5.7% |
| Total | 5,137 | 100.0% |
Ancestry in Port Isabel
The most populous ancestries reported in Port Isabel are Mexican (4,214 | 82.0%), English (271 | 5.3%), German (257 | 5.0%), Italian (106 | 2.1%), and Irish (72 | 1.4%), together accounting for 95.8% of all Port Isabel residents.
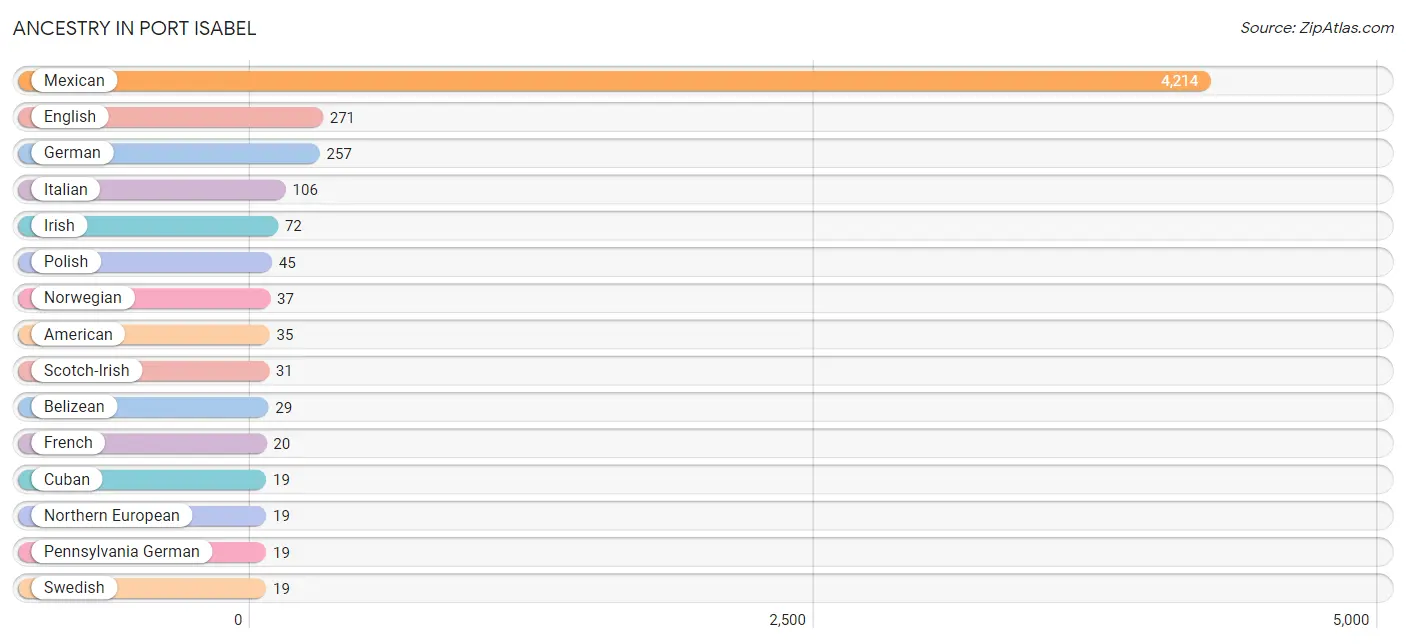
| Ancestry | # Population | % Population |
| American | 35 | 0.7% |
| Belizean | 29 | 0.6% |
| Central American Indian | 17 | 0.3% |
| Cuban | 19 | 0.4% |
| English | 271 | 5.3% |
| French | 20 | 0.4% |
| French Canadian | 14 | 0.3% |
| German | 257 | 5.0% |
| Irish | 72 | 1.4% |
| Italian | 106 | 2.1% |
| Mexican | 4,214 | 82.0% |
| Northern European | 19 | 0.4% |
| Norwegian | 37 | 0.7% |
| Pennsylvania German | 19 | 0.4% |
| Polish | 45 | 0.9% |
| Russian | 17 | 0.3% |
| Scotch-Irish | 31 | 0.6% |
| Scottish | 17 | 0.3% |
| Swedish | 19 | 0.4% |
| Welsh | 14 | 0.3% |
| Yugoslavian | 17 | 0.3% | View All 21 Rows |
Immigrants in Port Isabel
The most numerous immigrant groups reported in Port Isabel came from Latin America (1,196 | 23.3%), Central America (1,177 | 22.9%), Mexico (1,136 | 22.1%), Belize (29 | 0.6%), and Caribbean (19 | 0.4%), together accounting for 69.2% of all Port Isabel residents.
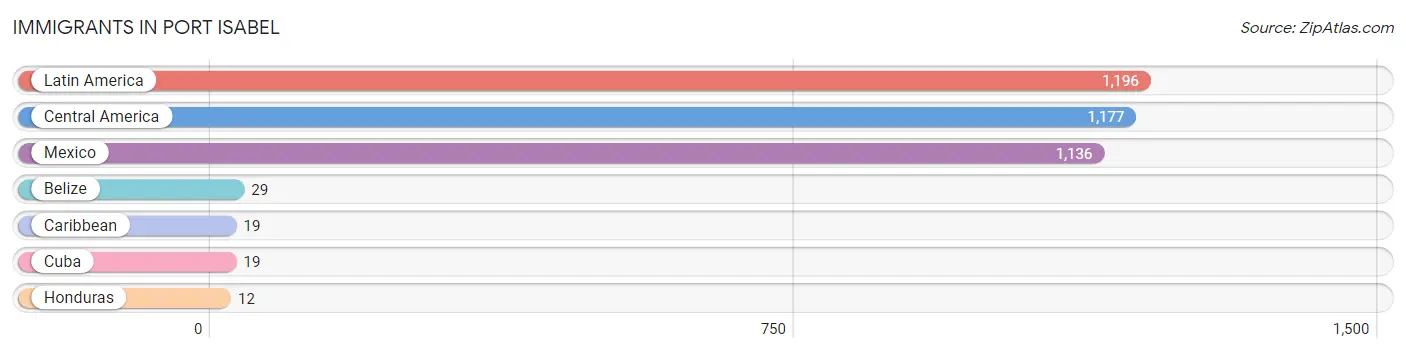
| Immigration Origin | # Population | % Population |
| Belize | 29 | 0.6% |
| Caribbean | 19 | 0.4% |
| Central America | 1,177 | 22.9% |
| Cuba | 19 | 0.4% |
| Honduras | 12 | 0.2% |
| Latin America | 1,196 | 23.3% |
| Mexico | 1,136 | 22.1% | View All 7 Rows |
Sex and Age in Port Isabel
Sex and Age in Port Isabel
The most populous age groups in Port Isabel are 10 to 14 Years (273 | 10.4%) for men and 60 to 64 Years (257 | 10.3%) for women.
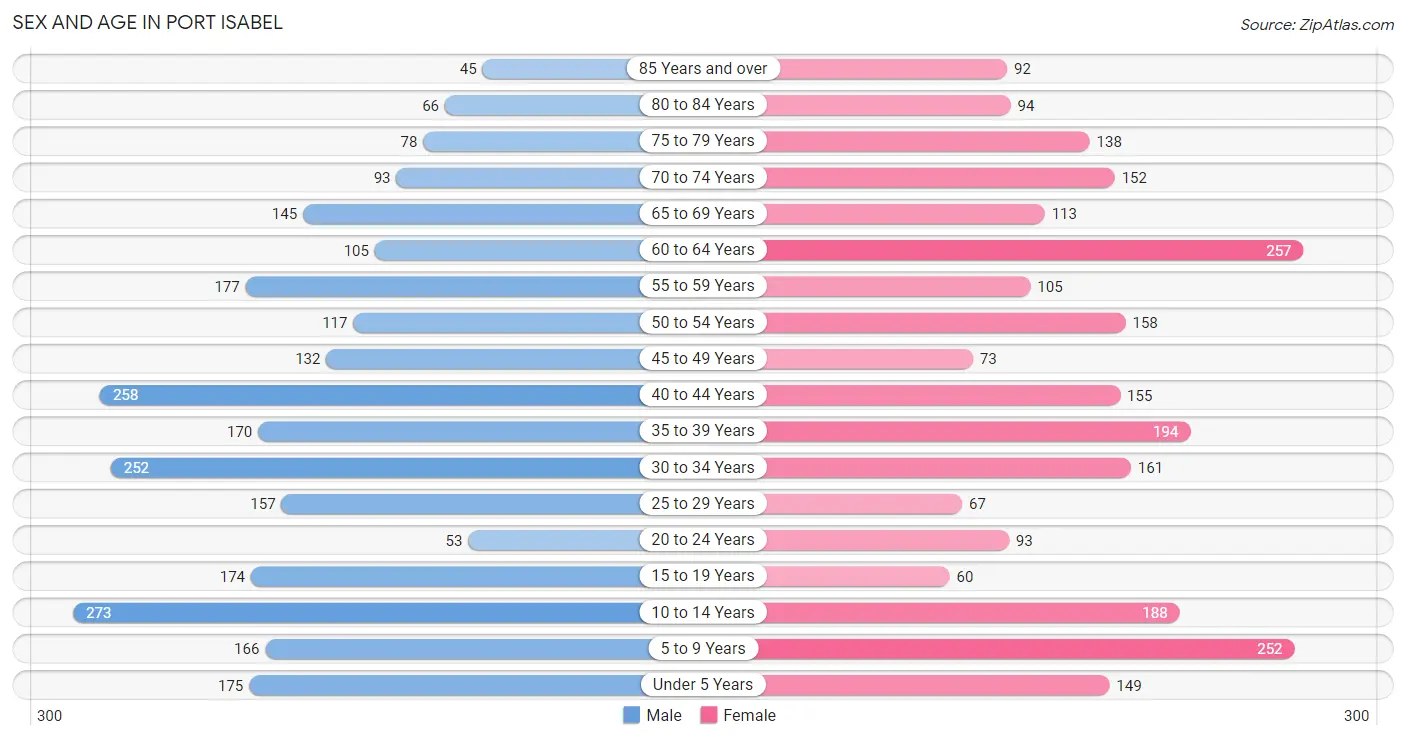
| Age Bracket | Male | Female |
| Under 5 Years | 175 (6.6%) | 149 (6.0%) |
| 5 to 9 Years | 166 (6.3%) | 252 (10.1%) |
| 10 to 14 Years | 273 (10.4%) | 188 (7.5%) |
| 15 to 19 Years | 174 (6.6%) | 60 (2.4%) |
| 20 to 24 Years | 53 (2.0%) | 93 (3.7%) |
| 25 to 29 Years | 157 (6.0%) | 67 (2.7%) |
| 30 to 34 Years | 252 (9.6%) | 161 (6.4%) |
| 35 to 39 Years | 170 (6.5%) | 194 (7.8%) |
| 40 to 44 Years | 258 (9.8%) | 155 (6.2%) |
| 45 to 49 Years | 132 (5.0%) | 73 (2.9%) |
| 50 to 54 Years | 117 (4.4%) | 158 (6.3%) |
| 55 to 59 Years | 177 (6.7%) | 105 (4.2%) |
| 60 to 64 Years | 105 (4.0%) | 257 (10.3%) |
| 65 to 69 Years | 145 (5.5%) | 113 (4.5%) |
| 70 to 74 Years | 93 (3.5%) | 152 (6.1%) |
| 75 to 79 Years | 78 (3.0%) | 138 (5.5%) |
| 80 to 84 Years | 66 (2.5%) | 94 (3.8%) |
| 85 Years and over | 45 (1.7%) | 92 (3.7%) |
| Total | 2,636 (100.0%) | 2,501 (100.0%) |
Families and Households in Port Isabel
Median Family Size in Port Isabel
The median family size in Port Isabel is 3.57 persons per family, with single male/father families (91 | 7.4%) accounting for the largest median family size of 3.67 persons per family. On the other hand, single female/mother families (299 | 24.2%) represent the smallest median family size with 3.52 persons per family.
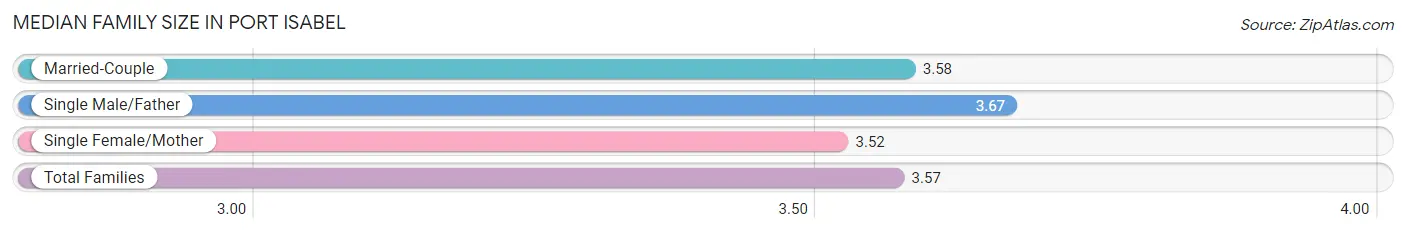
| Family Type | # Families | Family Size |
| Married-Couple | 843 (68.4%) | 3.58 |
| Single Male/Father | 91 (7.4%) | 3.67 |
| Single Female/Mother | 299 (24.2%) | 3.52 |
| Total Families | 1,233 (100.0%) | 3.57 |
Median Household Size in Port Isabel
The median household size in Port Isabel is 2.66 persons per household, with single male/father households (91 | 4.7%) accounting for the largest median household size of 3.81 persons per household. non-family households (700 | 36.2%) represent the smallest median household size with 1.03 persons per household.
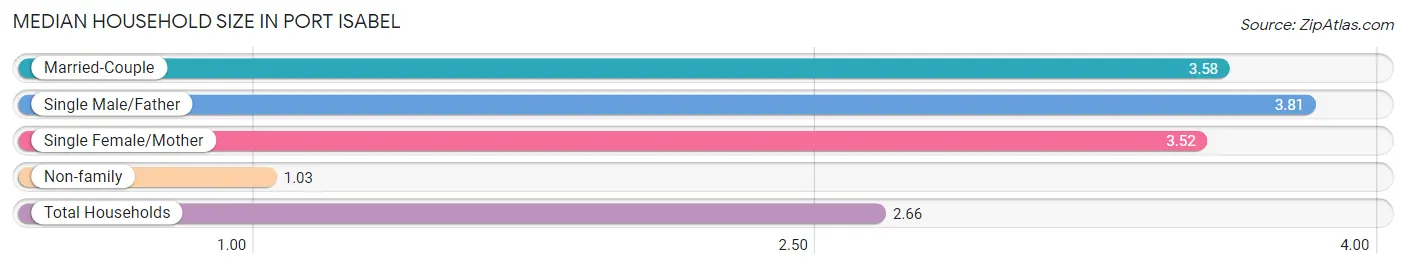
| Household Type | # Households | Household Size |
| Married-Couple | 843 (43.6%) | 3.58 |
| Single Male/Father | 91 (4.7%) | 3.81 |
| Single Female/Mother | 299 (15.5%) | 3.52 |
| Non-family | 700 (36.2%) | 1.03 |
| Total Households | 1,933 (100.0%) | 2.66 |
Household Size by Marriage Status in Port Isabel
Out of a total of 1,933 households in Port Isabel, 1,233 (63.8%) are family households, while 700 (36.2%) are nonfamily households. The most numerous type of family households are 2-person households, comprising 410, and the most common type of nonfamily households are 1-person households, comprising 682.
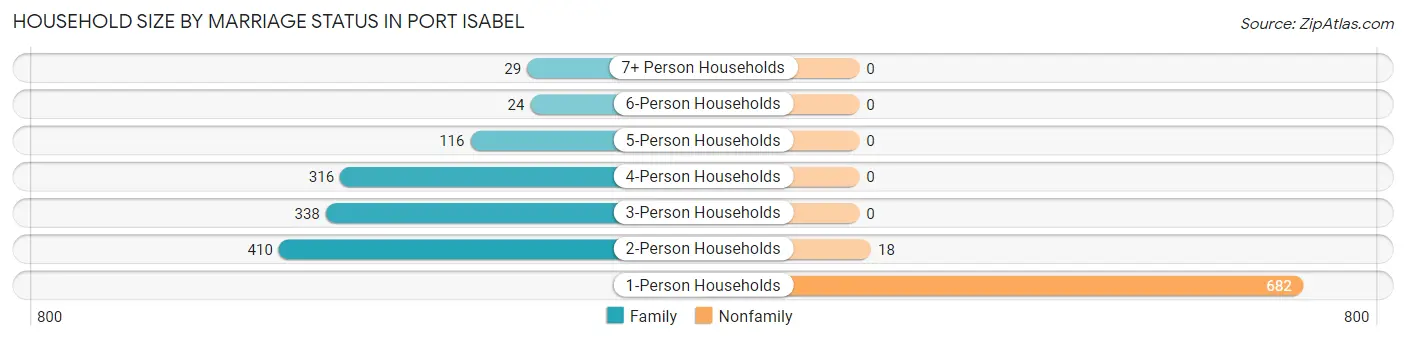
| Household Size | Family Households | Nonfamily Households |
| 1-Person Households | - | 682 (35.3%) |
| 2-Person Households | 410 (21.2%) | 18 (0.9%) |
| 3-Person Households | 338 (17.5%) | 0 (0.0%) |
| 4-Person Households | 316 (16.4%) | 0 (0.0%) |
| 5-Person Households | 116 (6.0%) | 0 (0.0%) |
| 6-Person Households | 24 (1.2%) | 0 (0.0%) |
| 7+ Person Households | 29 (1.5%) | 0 (0.0%) |
| Total | 1,233 (63.8%) | 700 (36.2%) |
Female Fertility in Port Isabel
Fertility by Age in Port Isabel
Average fertility rate in Port Isabel is 35.0 births per 1,000 women. Women in the age bracket of 15 to 19 years have the highest fertility rate with 167.0 births per 1,000 women. Women in the age bracket of 35 to 50 years acount for 64.3% of all women with births.
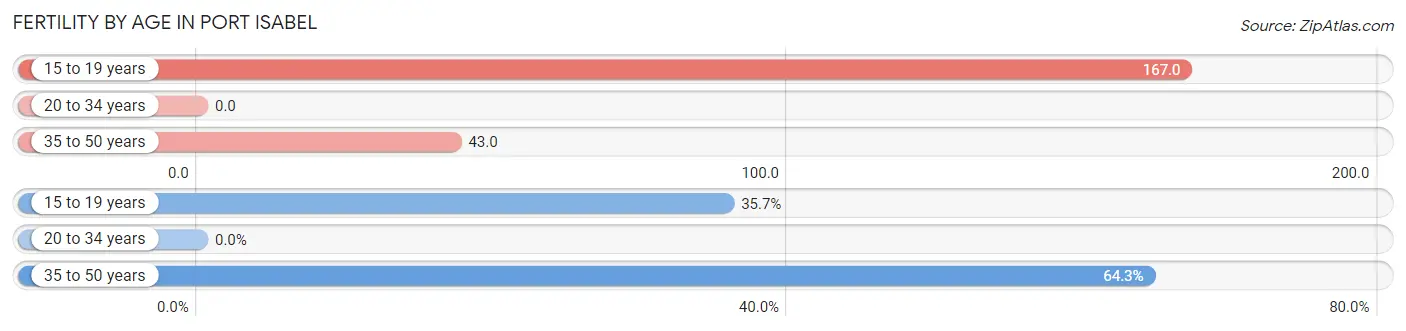
| Age Bracket | Women with Births | Births / 1,000 Women |
| 15 to 19 years | 10 (35.7%) | 167.0 |
| 20 to 34 years | 0 (0.0%) | 0.0 |
| 35 to 50 years | 18 (64.3%) | 43.0 |
| Total | 28 (100.0%) | 35.0 |
Fertility by Age by Marriage Status in Port Isabel
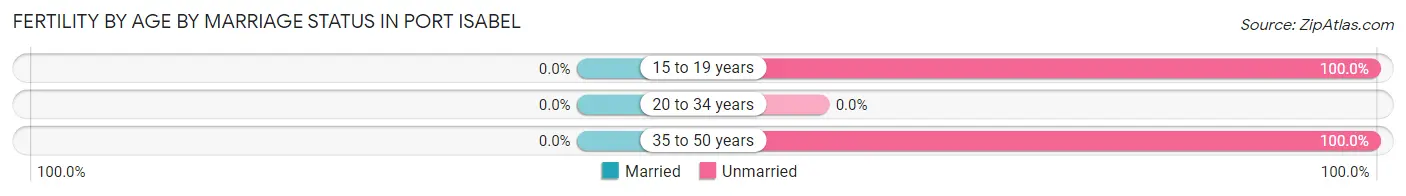
| Age Bracket | Married | Unmarried |
| 15 to 19 years | 0 (0.0%) | 10 (100.0%) |
| 20 to 34 years | 0 (0.0%) | 0 (0.0%) |
| 35 to 50 years | 0 (0.0%) | 18 (100.0%) |
| Total | 0 (0.0%) | 28 (100.0%) |
Fertility by Education in Port Isabel
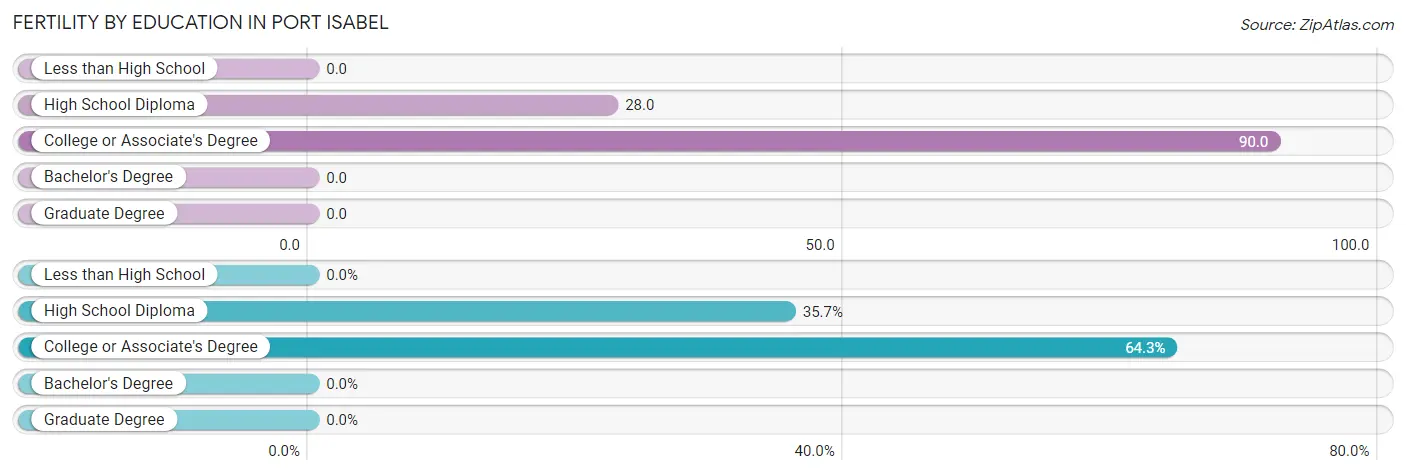
| Educational Attainment | Women with Births | Births / 1,000 Women |
| Less than High School | 0 (0.0%) | 0.0 |
| High School Diploma | 10 (35.7%) | 28.0 |
| College or Associate's Degree | 18 (64.3%) | 90.0 |
| Bachelor's Degree | 0 (0.0%) | 0.0 |
| Graduate Degree | 0 (0.0%) | 0.0 |
| Total | 28 (100.0%) | 35.0 |
Fertility by Education by Marriage Status in Port Isabel
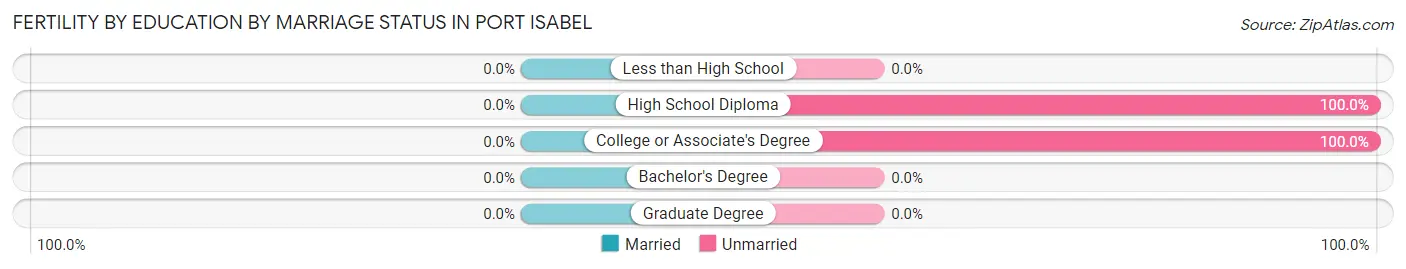
| Educational Attainment | Married | Unmarried |
| Less than High School | 0 (0.0%) | 0 (0.0%) |
| High School Diploma | 0 (0.0%) | 10 (100.0%) |
| College or Associate's Degree | 0 (0.0%) | 18 (100.0%) |
| Bachelor's Degree | 0 (0.0%) | 0 (0.0%) |
| Graduate Degree | 0 (0.0%) | 0 (0.0%) |
| Total | 0 (0.0%) | 28 (100.0%) |
Employment Characteristics in Port Isabel
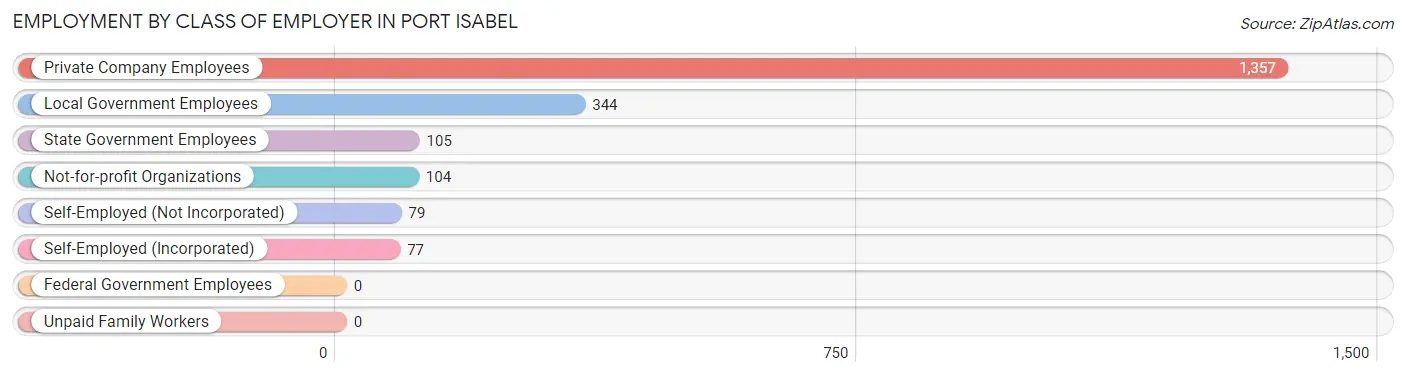
Employment by Class of Employer in Port Isabel
Among the 2,066 employed individuals in Port Isabel, private company employees (1,357 | 65.7%), local government employees (344 | 16.7%), and state government employees (105 | 5.1%) make up the most common classes of employment.
| Employer Class | # Employees | % Employees |
| Private Company Employees | 1,357 | 65.7% |
| Self-Employed (Incorporated) | 77 | 3.7% |
| Self-Employed (Not Incorporated) | 79 | 3.8% |
| Not-for-profit Organizations | 104 | 5.0% |
| Local Government Employees | 344 | 16.7% |
| State Government Employees | 105 | 5.1% |
| Federal Government Employees | 0 | 0.0% |
| Unpaid Family Workers | 0 | 0.0% |
| Total | 2,066 | 100.0% |
Employment Status by Age in Port Isabel
According to the labor force statistics for Port Isabel, out of the total population over 16 years of age (3,904), 54.3% or 2,120 individuals are in the labor force, with 2.0% or 42 of them unemployed. The age group with the highest labor force participation rate is 25 to 29 years, with 89.3% or 200 individuals in the labor force. Within the labor force, the 55 to 59 years age range has the highest percentage of unemployed individuals, with 11.2% or 22 of them being unemployed.
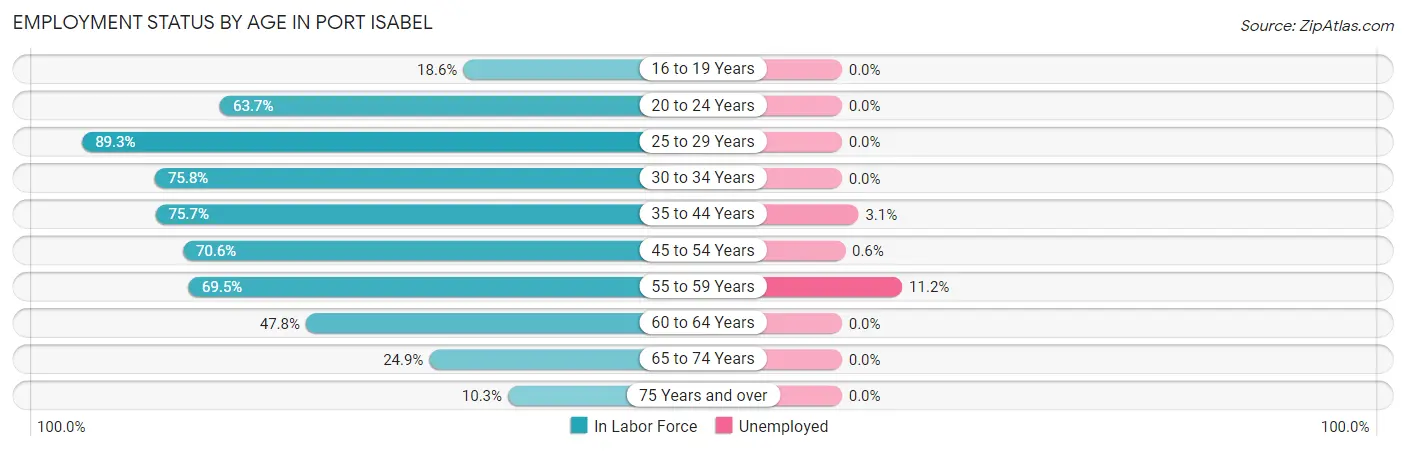
| Age Bracket | In Labor Force | Unemployed |
| 16 to 19 Years | 38 (18.6%) | 0 (0.0%) |
| 20 to 24 Years | 93 (63.7%) | 0 (0.0%) |
| 25 to 29 Years | 200 (89.3%) | 0 (0.0%) |
| 30 to 34 Years | 313 (75.8%) | 0 (0.0%) |
| 35 to 44 Years | 588 (75.7%) | 18 (3.1%) |
| 45 to 54 Years | 339 (70.6%) | 2 (0.6%) |
| 55 to 59 Years | 196 (69.5%) | 22 (11.2%) |
| 60 to 64 Years | 173 (47.8%) | 0 (0.0%) |
| 65 to 74 Years | 125 (24.9%) | 0 (0.0%) |
| 75 Years and over | 53 (10.3%) | 0 (0.0%) |
| Total | 2,120 (54.3%) | 42 (2.0%) |
Employment Status by Educational Attainment in Port Isabel
According to labor force statistics for Port Isabel, 71.3% of individuals (1,810) out of the total population between 25 and 64 years of age (2,538) are in the labor force, with 2.3% or 42 of them being unemployed. The group with the highest labor force participation rate are those with the educational attainment of bachelor's degree or higher, with 92.5% or 345 individuals in the labor force. Within the labor force, individuals with less than high school education have the highest percentage of unemployment, with 10.5% or 18 of them being unemployed.
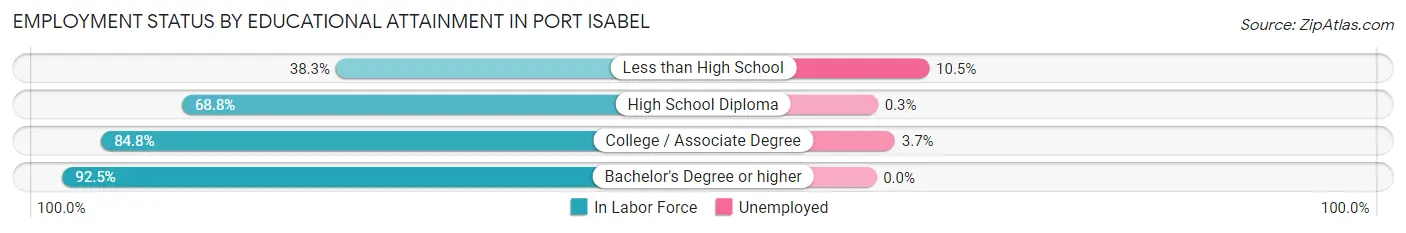
| Educational Attainment | In Labor Force | Unemployed |
| Less than High School | 171 (38.3%) | 47 (10.5%) |
| High School Diploma | 702 (68.8%) | 3 (0.3%) |
| College / Associate Degree | 591 (84.8%) | 26 (3.7%) |
| Bachelor's Degree or higher | 345 (92.5%) | 0 (0.0%) |
| Total | 1,810 (71.3%) | 58 (2.3%) |
Employment Occupations by Sex in Port Isabel
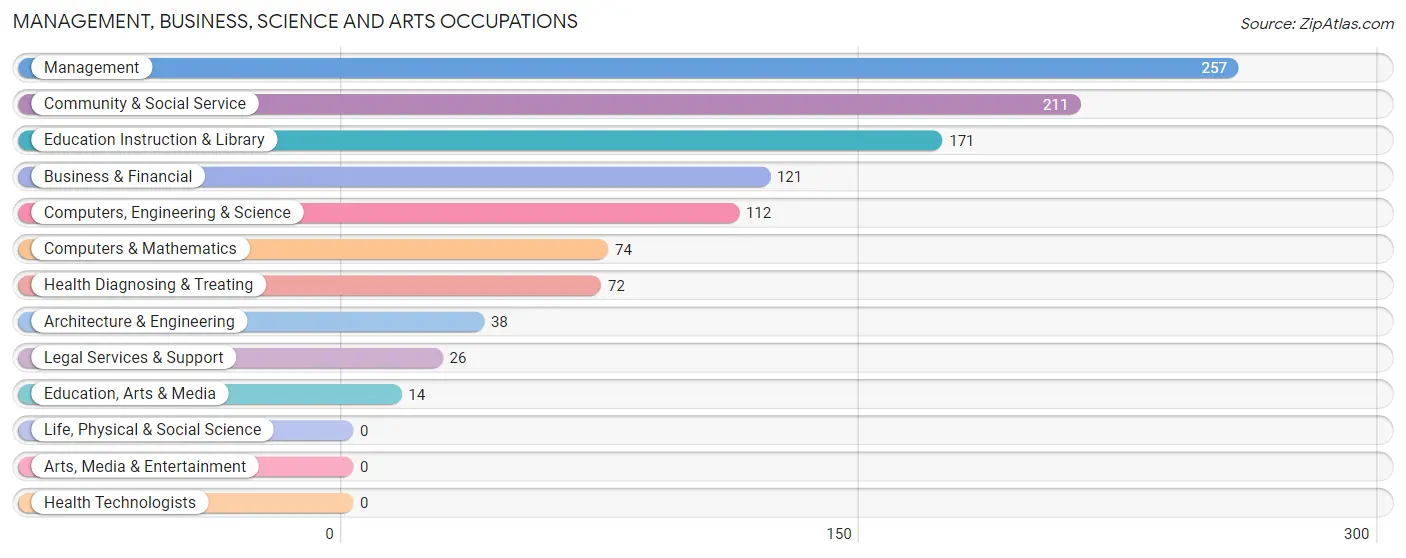
Management, Business, Science and Arts Occupations
The most common Management, Business, Science and Arts occupations in Port Isabel are Management (257 | 12.4%), Community & Social Service (211 | 10.2%), Education Instruction & Library (171 | 8.2%), Business & Financial (121 | 5.8%), and Computers, Engineering & Science (112 | 5.4%).
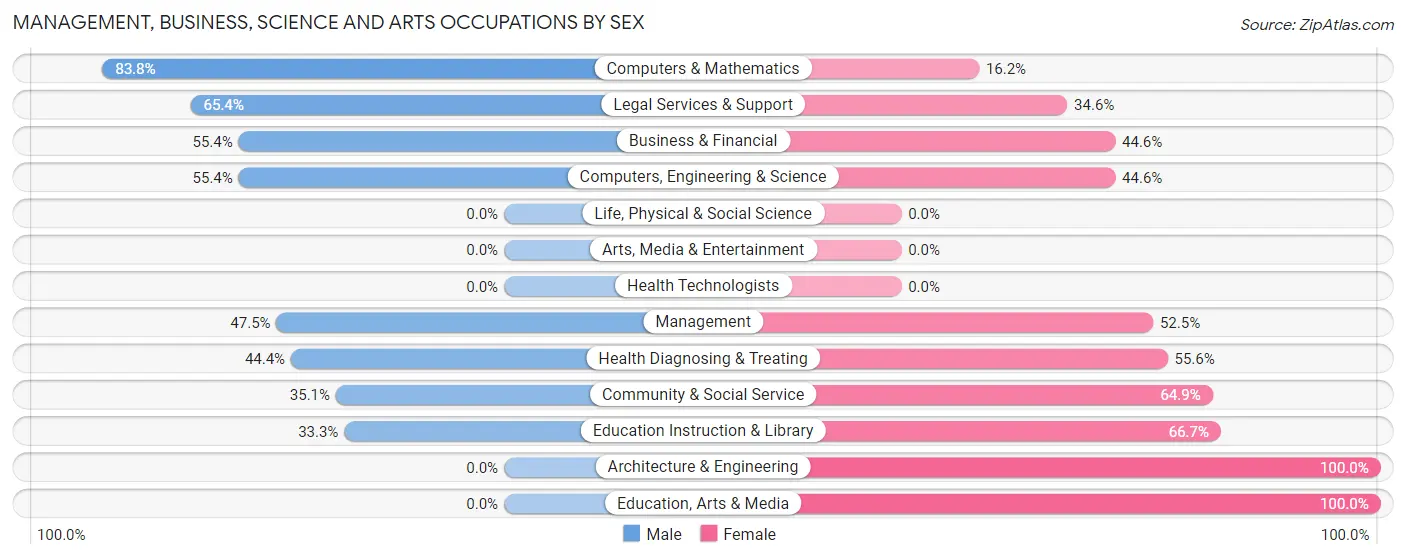
Management, Business, Science and Arts Occupations by Sex
Within the Management, Business, Science and Arts occupations in Port Isabel, the most male-oriented occupations are Computers & Mathematics (83.8%), Legal Services & Support (65.4%), and Business & Financial (55.4%), while the most female-oriented occupations are Architecture & Engineering (100.0%), Education, Arts & Media (100.0%), and Education Instruction & Library (66.7%).
| Occupation | Male | Female |
| Management | 122 (47.5%) | 135 (52.5%) |
| Business & Financial | 67 (55.4%) | 54 (44.6%) |
| Computers, Engineering & Science | 62 (55.4%) | 50 (44.6%) |
| Computers & Mathematics | 62 (83.8%) | 12 (16.2%) |
| Architecture & Engineering | 0 (0.0%) | 38 (100.0%) |
| Life, Physical & Social Science | 0 (0.0%) | 0 (0.0%) |
| Community & Social Service | 74 (35.1%) | 137 (64.9%) |
| Education, Arts & Media | 0 (0.0%) | 14 (100.0%) |
| Legal Services & Support | 17 (65.4%) | 9 (34.6%) |
| Education Instruction & Library | 57 (33.3%) | 114 (66.7%) |
| Arts, Media & Entertainment | 0 (0.0%) | 0 (0.0%) |
| Health Diagnosing & Treating | 32 (44.4%) | 40 (55.6%) |
| Health Technologists | 0 (0.0%) | 0 (0.0%) |
| Total (Category) | 357 (46.2%) | 416 (53.8%) |
| Total (Overall) | 1,174 (56.6%) | 902 (43.4%) |
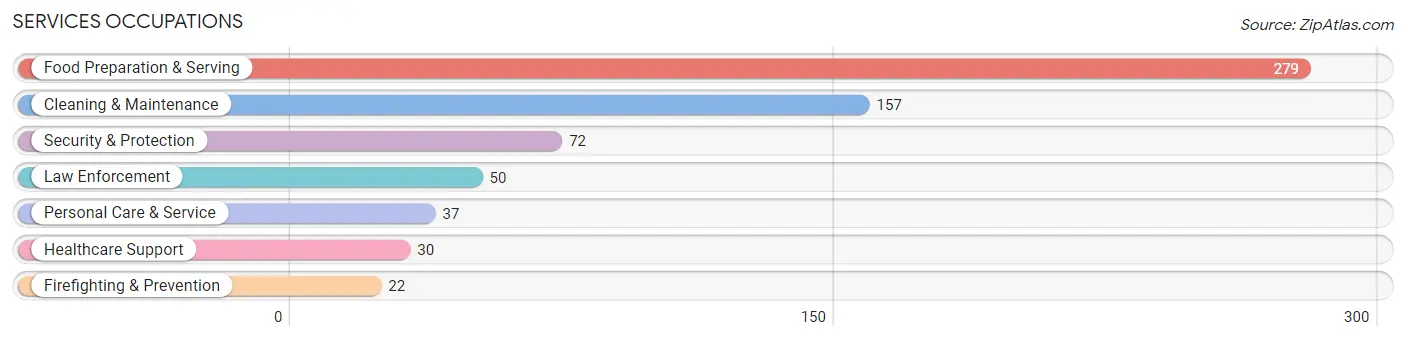
Services Occupations
The most common Services occupations in Port Isabel are Food Preparation & Serving (279 | 13.4%), Cleaning & Maintenance (157 | 7.6%), Security & Protection (72 | 3.5%), Law Enforcement (50 | 2.4%), and Personal Care & Service (37 | 1.8%).
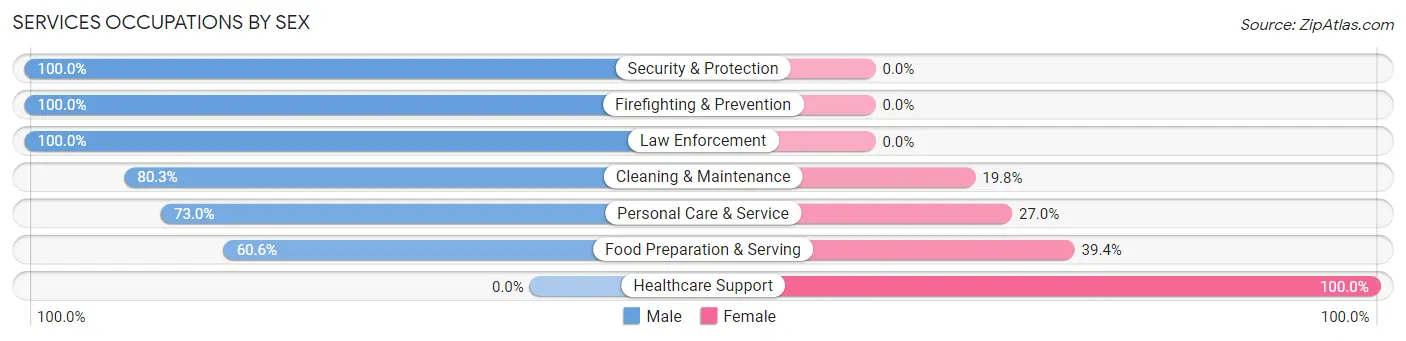
Services Occupations by Sex
Within the Services occupations in Port Isabel, the most male-oriented occupations are Security & Protection (100.0%), Firefighting & Prevention (100.0%), and Law Enforcement (100.0%), while the most female-oriented occupations are Healthcare Support (100.0%), Food Preparation & Serving (39.4%), and Personal Care & Service (27.0%).
| Occupation | Male | Female |
| Healthcare Support | 0 (0.0%) | 30 (100.0%) |
| Security & Protection | 72 (100.0%) | 0 (0.0%) |
| Firefighting & Prevention | 22 (100.0%) | 0 (0.0%) |
| Law Enforcement | 50 (100.0%) | 0 (0.0%) |
| Food Preparation & Serving | 169 (60.6%) | 110 (39.4%) |
| Cleaning & Maintenance | 126 (80.2%) | 31 (19.8%) |
| Personal Care & Service | 27 (73.0%) | 10 (27.0%) |
| Total (Category) | 394 (68.5%) | 181 (31.5%) |
| Total (Overall) | 1,174 (56.6%) | 902 (43.4%) |
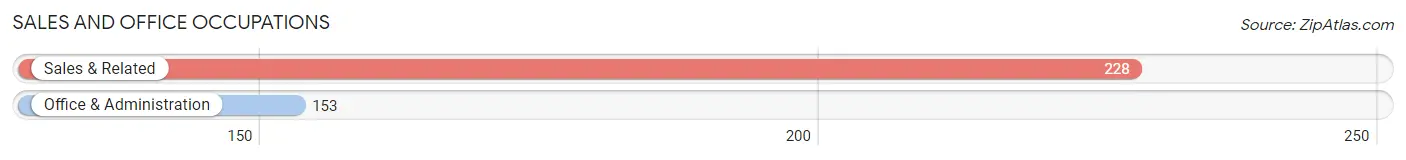
Sales and Office Occupations
The most common Sales and Office occupations in Port Isabel are Sales & Related (228 | 11.0%), and Office & Administration (153 | 7.4%).
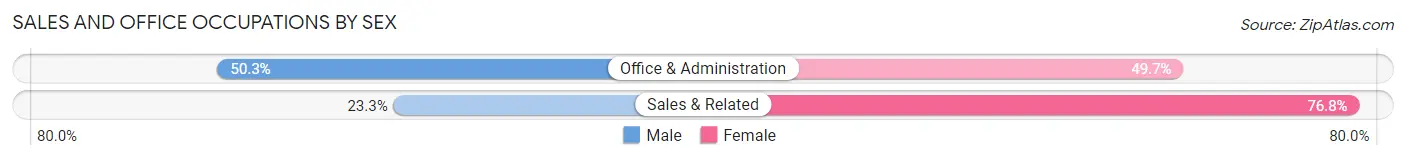
Sales and Office Occupations by Sex
| Occupation | Male | Female |
| Sales & Related | 53 (23.3%) | 175 (76.7%) |
| Office & Administration | 77 (50.3%) | 76 (49.7%) |
| Total (Category) | 130 (34.1%) | 251 (65.9%) |
| Total (Overall) | 1,174 (56.6%) | 902 (43.4%) |
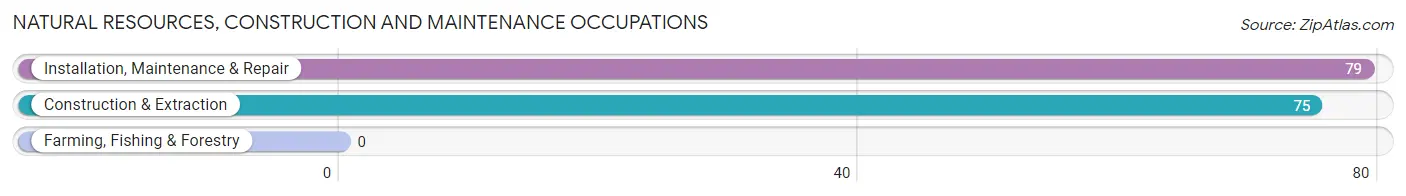
Natural Resources, Construction and Maintenance Occupations
The most common Natural Resources, Construction and Maintenance occupations in Port Isabel are Installation, Maintenance & Repair (79 | 3.8%), and Construction & Extraction (75 | 3.6%).
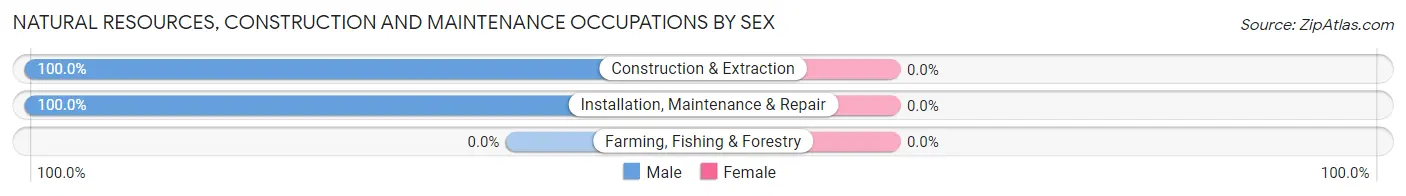
Natural Resources, Construction and Maintenance Occupations by Sex
| Occupation | Male | Female |
| Farming, Fishing & Forestry | 0 (0.0%) | 0 (0.0%) |
| Construction & Extraction | 75 (100.0%) | 0 (0.0%) |
| Installation, Maintenance & Repair | 79 (100.0%) | 0 (0.0%) |
| Total (Category) | 154 (100.0%) | 0 (0.0%) |
| Total (Overall) | 1,174 (56.6%) | 902 (43.4%) |
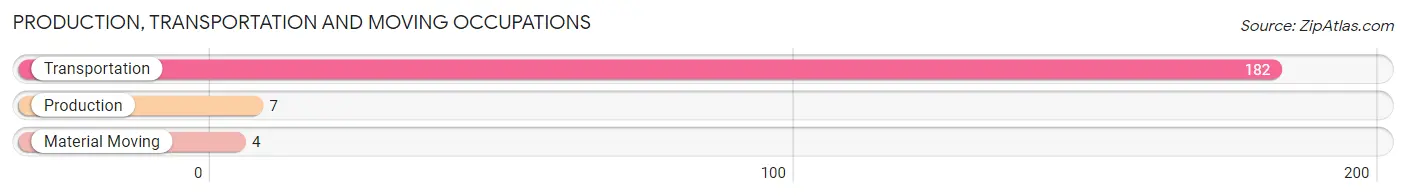
Production, Transportation and Moving Occupations
The most common Production, Transportation and Moving occupations in Port Isabel are Transportation (182 | 8.8%), Production (7 | 0.3%), and Material Moving (4 | 0.2%).
Production, Transportation and Moving Occupations by Sex
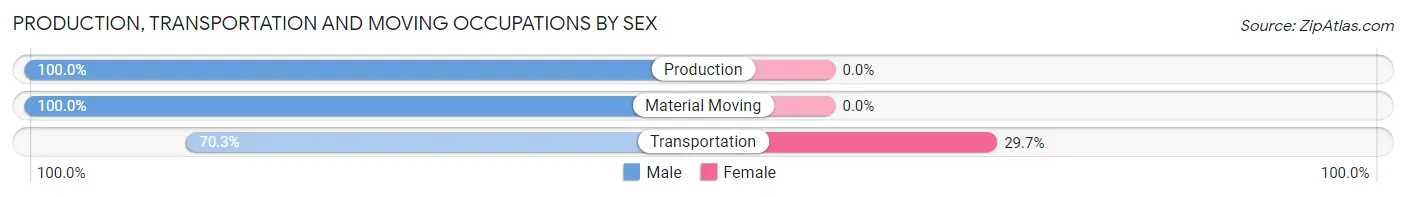
| Occupation | Male | Female |
| Production | 7 (100.0%) | 0 (0.0%) |
| Transportation | 128 (70.3%) | 54 (29.7%) |
| Material Moving | 4 (100.0%) | 0 (0.0%) |
| Total (Category) | 139 (72.0%) | 54 (28.0%) |
| Total (Overall) | 1,174 (56.6%) | 902 (43.4%) |
Employment Industries by Sex in Port Isabel
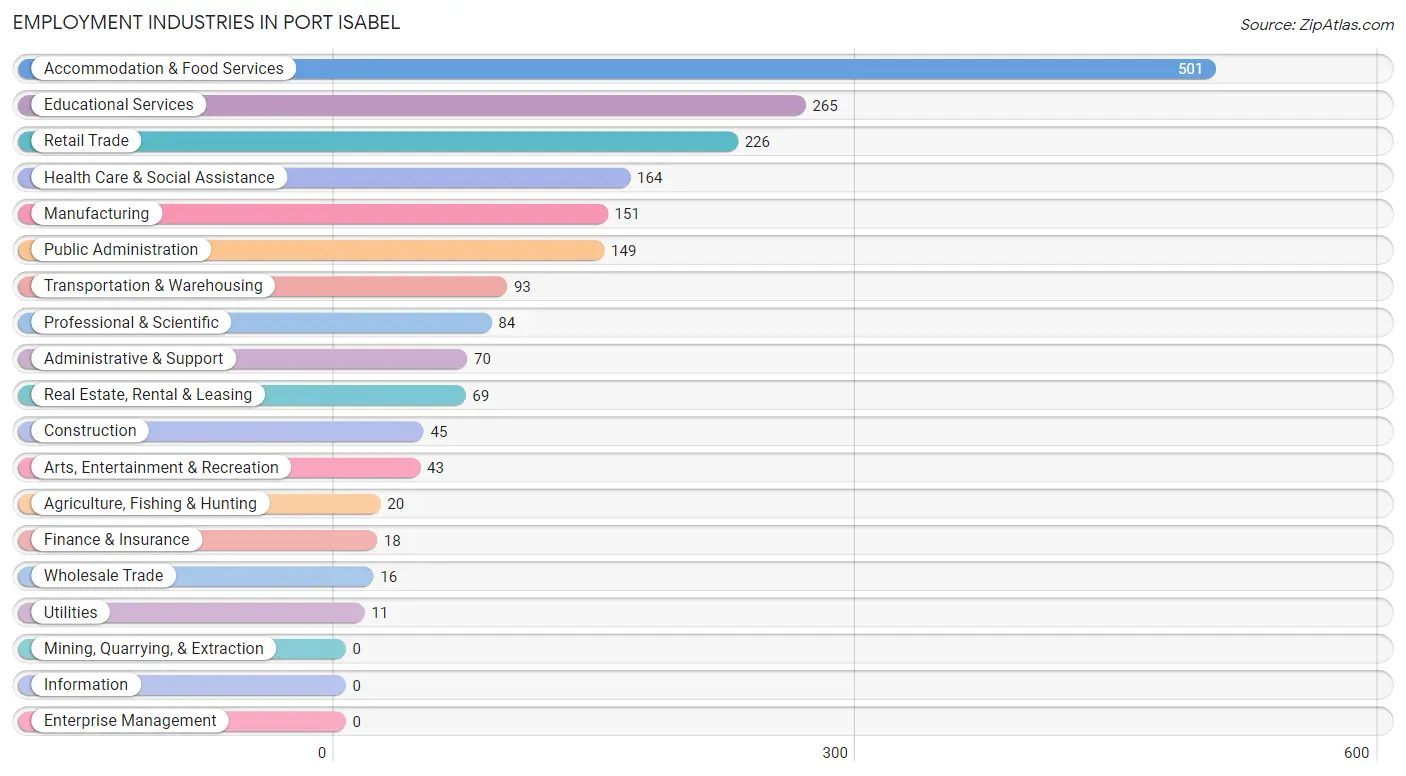
Employment Industries in Port Isabel
The major employment industries in Port Isabel include Accommodation & Food Services (501 | 24.1%), Educational Services (265 | 12.8%), Retail Trade (226 | 10.9%), Health Care & Social Assistance (164 | 7.9%), and Manufacturing (151 | 7.3%).
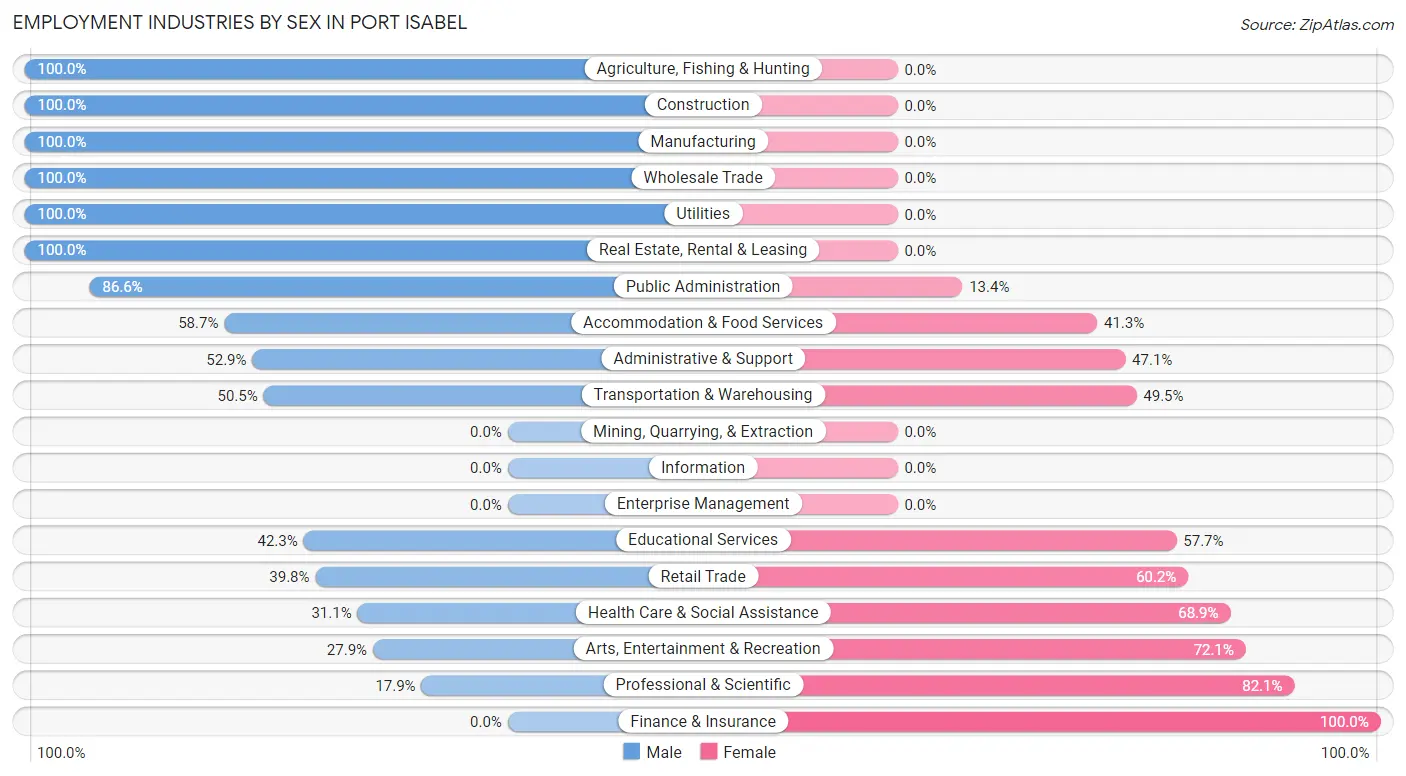
Employment Industries by Sex in Port Isabel
The Port Isabel industries that see more men than women are Agriculture, Fishing & Hunting (100.0%), Construction (100.0%), and Manufacturing (100.0%), whereas the industries that tend to have a higher number of women are Finance & Insurance (100.0%), Professional & Scientific (82.1%), and Arts, Entertainment & Recreation (72.1%).
| Industry | Male | Female |
| Agriculture, Fishing & Hunting | 20 (100.0%) | 0 (0.0%) |
| Mining, Quarrying, & Extraction | 0 (0.0%) | 0 (0.0%) |
| Construction | 45 (100.0%) | 0 (0.0%) |
| Manufacturing | 151 (100.0%) | 0 (0.0%) |
| Wholesale Trade | 16 (100.0%) | 0 (0.0%) |
| Retail Trade | 90 (39.8%) | 136 (60.2%) |
| Transportation & Warehousing | 47 (50.5%) | 46 (49.5%) |
| Utilities | 11 (100.0%) | 0 (0.0%) |
| Information | 0 (0.0%) | 0 (0.0%) |
| Finance & Insurance | 0 (0.0%) | 18 (100.0%) |
| Real Estate, Rental & Leasing | 69 (100.0%) | 0 (0.0%) |
| Professional & Scientific | 15 (17.9%) | 69 (82.1%) |
| Enterprise Management | 0 (0.0%) | 0 (0.0%) |
| Administrative & Support | 37 (52.9%) | 33 (47.1%) |
| Educational Services | 112 (42.3%) | 153 (57.7%) |
| Health Care & Social Assistance | 51 (31.1%) | 113 (68.9%) |
| Arts, Entertainment & Recreation | 12 (27.9%) | 31 (72.1%) |
| Accommodation & Food Services | 294 (58.7%) | 207 (41.3%) |
| Public Administration | 129 (86.6%) | 20 (13.4%) |
| Total | 1,174 (56.6%) | 902 (43.4%) |
Education in Port Isabel
School Enrollment in Port Isabel
The most common levels of schooling among the 1,211 students in Port Isabel are elementary school (384 | 31.7%), middle school (352 | 29.1%), and high school (243 | 20.1%).
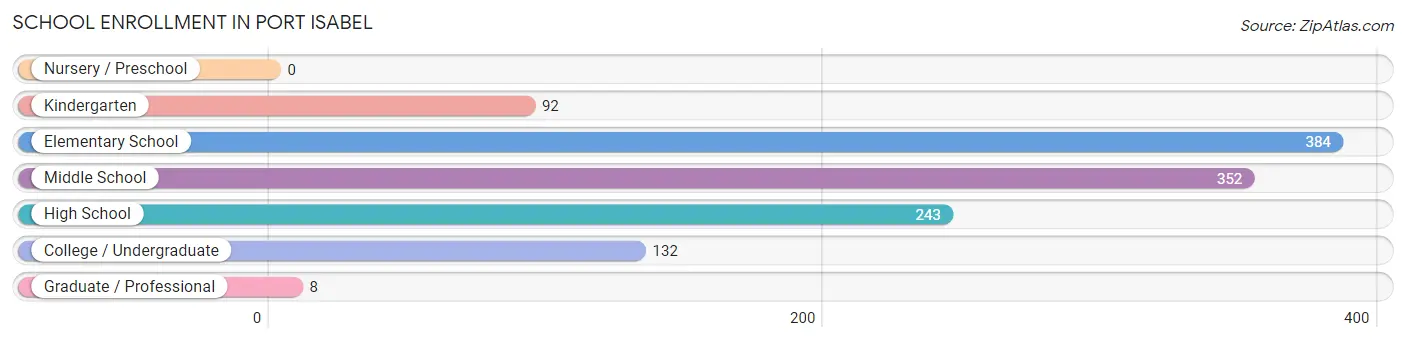
| School Level | # Students | % Students |
| Nursery / Preschool | 0 | 0.0% |
| Kindergarten | 92 | 7.6% |
| Elementary School | 384 | 31.7% |
| Middle School | 352 | 29.1% |
| High School | 243 | 20.1% |
| College / Undergraduate | 132 | 10.9% |
| Graduate / Professional | 8 | 0.7% |
| Total | 1,211 | 100.0% |
School Enrollment by Age by Funding Source in Port Isabel
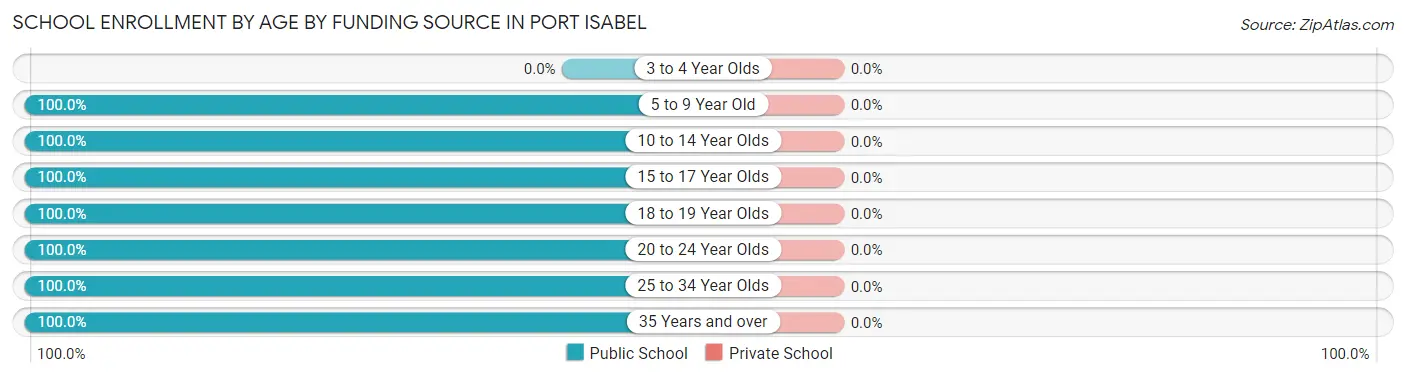
| Age Bracket | Public School | Private School |
| 3 to 4 Year Olds | 0 (0.0%) | 0 (0.0%) |
| 5 to 9 Year Old | 418 (100.0%) | 0 (0.0%) |
| 10 to 14 Year Olds | 461 (100.0%) | 0 (0.0%) |
| 15 to 17 Year Olds | 124 (100.0%) | 0 (0.0%) |
| 18 to 19 Year Olds | 86 (100.0%) | 0 (0.0%) |
| 20 to 24 Year Olds | 29 (100.0%) | 0 (0.0%) |
| 25 to 34 Year Olds | 19 (100.0%) | 0 (0.0%) |
| 35 Years and over | 74 (100.0%) | 0 (0.0%) |
| Total | 1,211 (100.0%) | 0 (0.0%) |
Educational Attainment by Field of Study in Port Isabel
Education (174 | 32.3%), social sciences (68 | 12.6%), science & technology (68 | 12.6%), visual & performing arts (48 | 8.9%), and liberal arts & history (43 | 8.0%) are the most common fields of study among 539 individuals in Port Isabel who have obtained a bachelor's degree or higher.
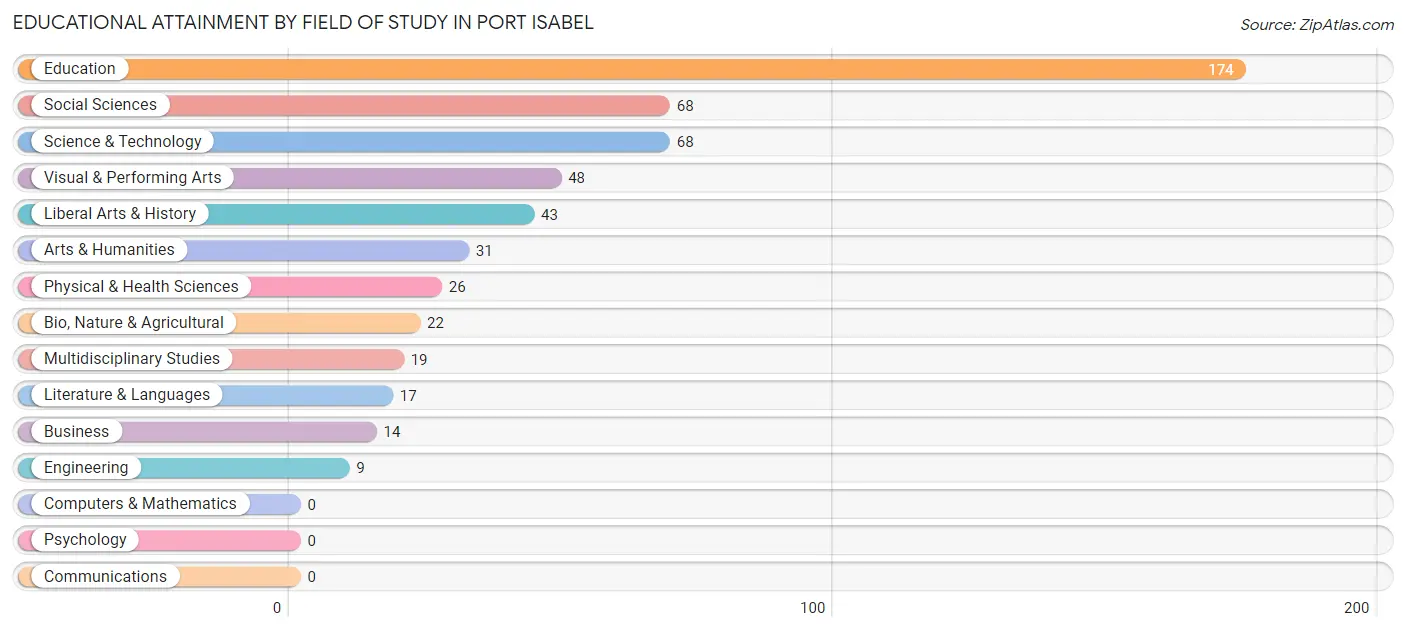
| Field of Study | # Graduates | % Graduates |
| Computers & Mathematics | 0 | 0.0% |
| Bio, Nature & Agricultural | 22 | 4.1% |
| Physical & Health Sciences | 26 | 4.8% |
| Psychology | 0 | 0.0% |
| Social Sciences | 68 | 12.6% |
| Engineering | 9 | 1.7% |
| Multidisciplinary Studies | 19 | 3.5% |
| Science & Technology | 68 | 12.6% |
| Business | 14 | 2.6% |
| Education | 174 | 32.3% |
| Literature & Languages | 17 | 3.2% |
| Liberal Arts & History | 43 | 8.0% |
| Visual & Performing Arts | 48 | 8.9% |
| Communications | 0 | 0.0% |
| Arts & Humanities | 31 | 5.8% |
| Total | 539 | 100.0% |
Transportation & Commute in Port Isabel
Vehicle Availability by Sex in Port Isabel
The most prevalent vehicle ownership categories in Port Isabel are males with 1 vehicle (551, accounting for 47.3%) and females with 1 vehicle (476, making up 61.1%).
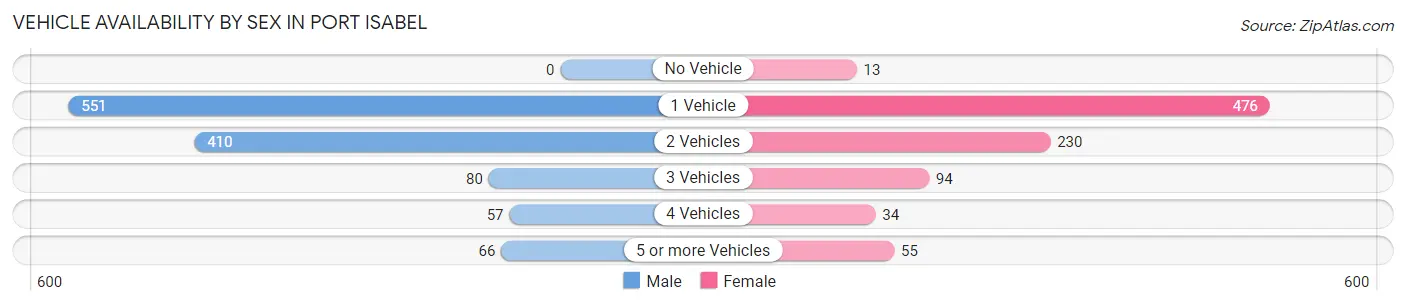
| Vehicles Available | Male | Female |
| No Vehicle | 0 (0.0%) | 13 (1.4%) |
| 1 Vehicle | 551 (47.3%) | 476 (52.8%) |
| 2 Vehicles | 410 (35.2%) | 230 (25.5%) |
| 3 Vehicles | 80 (6.9%) | 94 (10.4%) |
| 4 Vehicles | 57 (4.9%) | 34 (3.8%) |
| 5 or more Vehicles | 66 (5.7%) | 55 (6.1%) |
| Total | 1,164 (100.0%) | 902 (100.0%) |
Commute Time in Port Isabel
The most frequently occuring commute durations in Port Isabel are 10 to 14 minutes (762 commuters, 37.4%), 5 to 9 minutes (409 commuters, 20.1%), and 15 to 19 minutes (196 commuters, 9.6%).
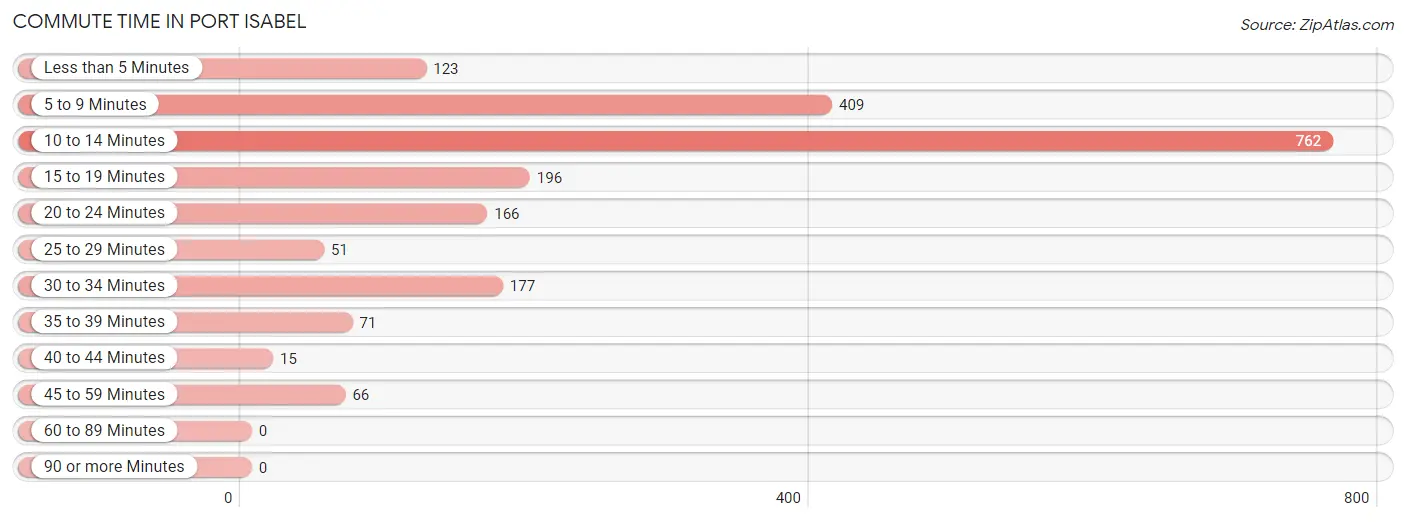
| Commute Time | # Commuters | % Commuters |
| Less than 5 Minutes | 123 | 6.0% |
| 5 to 9 Minutes | 409 | 20.1% |
| 10 to 14 Minutes | 762 | 37.4% |
| 15 to 19 Minutes | 196 | 9.6% |
| 20 to 24 Minutes | 166 | 8.2% |
| 25 to 29 Minutes | 51 | 2.5% |
| 30 to 34 Minutes | 177 | 8.7% |
| 35 to 39 Minutes | 71 | 3.5% |
| 40 to 44 Minutes | 15 | 0.7% |
| 45 to 59 Minutes | 66 | 3.2% |
| 60 to 89 Minutes | 0 | 0.0% |
| 90 or more Minutes | 0 | 0.0% |
Commute Time by Sex in Port Isabel
The most common commute times in Port Isabel are 10 to 14 minutes (409 commuters, 35.8%) for males and 10 to 14 minutes (353 commuters, 39.5%) for females.
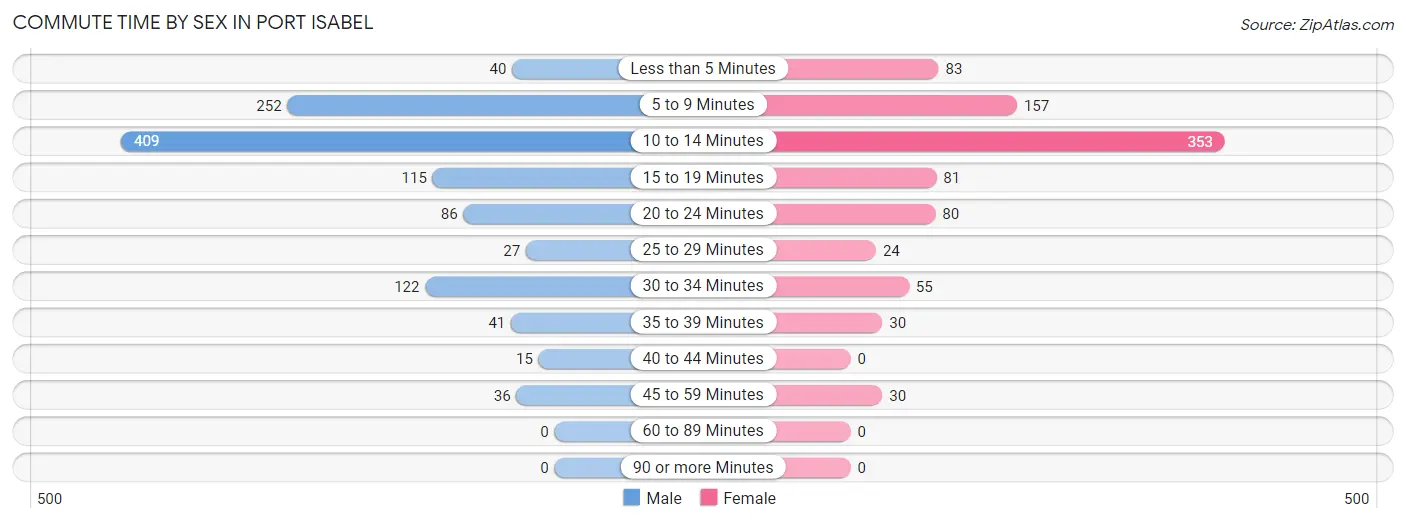
| Commute Time | Male | Female |
| Less than 5 Minutes | 40 (3.5%) | 83 (9.3%) |
| 5 to 9 Minutes | 252 (22.1%) | 157 (17.6%) |
| 10 to 14 Minutes | 409 (35.8%) | 353 (39.5%) |
| 15 to 19 Minutes | 115 (10.1%) | 81 (9.1%) |
| 20 to 24 Minutes | 86 (7.5%) | 80 (9.0%) |
| 25 to 29 Minutes | 27 (2.4%) | 24 (2.7%) |
| 30 to 34 Minutes | 122 (10.7%) | 55 (6.2%) |
| 35 to 39 Minutes | 41 (3.6%) | 30 (3.4%) |
| 40 to 44 Minutes | 15 (1.3%) | 0 (0.0%) |
| 45 to 59 Minutes | 36 (3.2%) | 30 (3.4%) |
| 60 to 89 Minutes | 0 (0.0%) | 0 (0.0%) |
| 90 or more Minutes | 0 (0.0%) | 0 (0.0%) |
Time of Departure to Work by Sex in Port Isabel
The most frequent times of departure to work in Port Isabel are 8:00 AM to 8:29 AM (288, 25.2%) for males and 8:00 AM to 8:29 AM (148, 16.6%) for females.
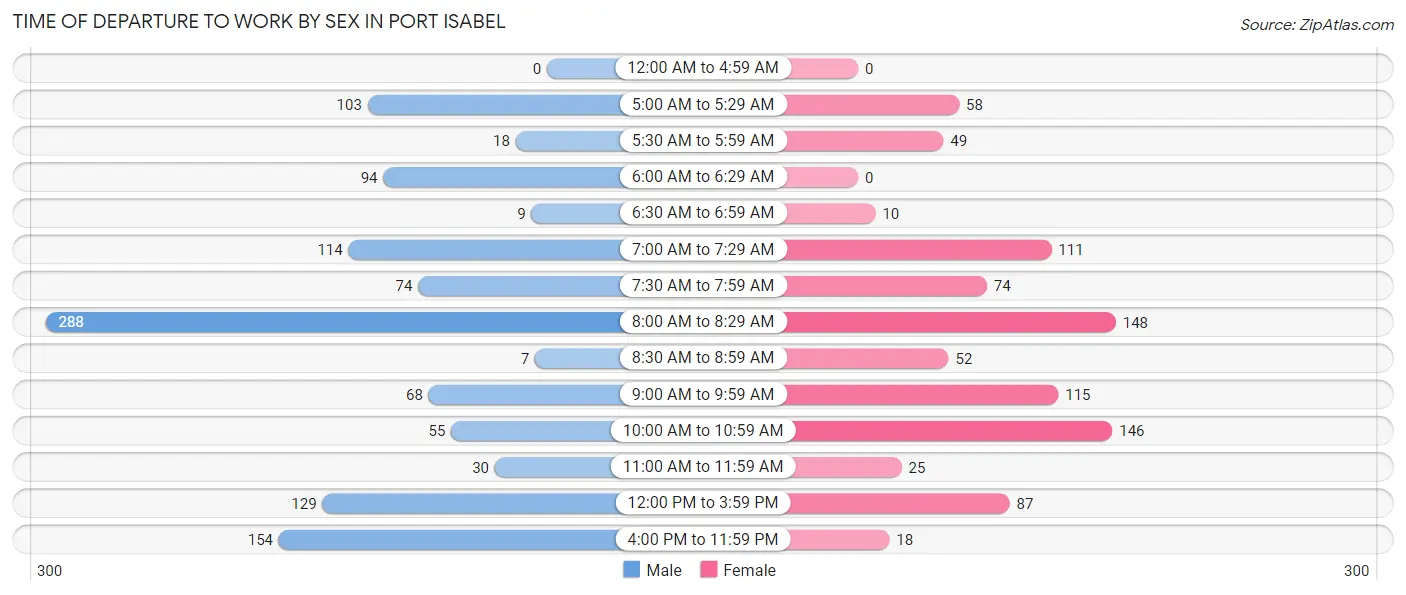
| Time of Departure | Male | Female |
| 12:00 AM to 4:59 AM | 0 (0.0%) | 0 (0.0%) |
| 5:00 AM to 5:29 AM | 103 (9.0%) | 58 (6.5%) |
| 5:30 AM to 5:59 AM | 18 (1.6%) | 49 (5.5%) |
| 6:00 AM to 6:29 AM | 94 (8.2%) | 0 (0.0%) |
| 6:30 AM to 6:59 AM | 9 (0.8%) | 10 (1.1%) |
| 7:00 AM to 7:29 AM | 114 (10.0%) | 111 (12.4%) |
| 7:30 AM to 7:59 AM | 74 (6.5%) | 74 (8.3%) |
| 8:00 AM to 8:29 AM | 288 (25.2%) | 148 (16.6%) |
| 8:30 AM to 8:59 AM | 7 (0.6%) | 52 (5.8%) |
| 9:00 AM to 9:59 AM | 68 (5.9%) | 115 (12.9%) |
| 10:00 AM to 10:59 AM | 55 (4.8%) | 146 (16.4%) |
| 11:00 AM to 11:59 AM | 30 (2.6%) | 25 (2.8%) |
| 12:00 PM to 3:59 PM | 129 (11.3%) | 87 (9.7%) |
| 4:00 PM to 11:59 PM | 154 (13.5%) | 18 (2.0%) |
| Total | 1,143 (100.0%) | 893 (100.0%) |
Housing Occupancy in Port Isabel
Occupancy by Ownership in Port Isabel
Of the total 1,933 dwellings in Port Isabel, owner-occupied units account for 1,173 (60.7%), while renter-occupied units make up 760 (39.3%).
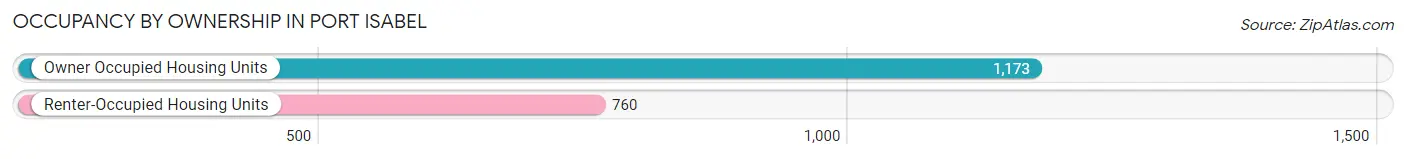
| Occupancy | # Housing Units | % Housing Units |
| Owner Occupied Housing Units | 1,173 | 60.7% |
| Renter-Occupied Housing Units | 760 | 39.3% |
| Total Occupied Housing Units | 1,933 | 100.0% |
Occupancy by Household Size in Port Isabel
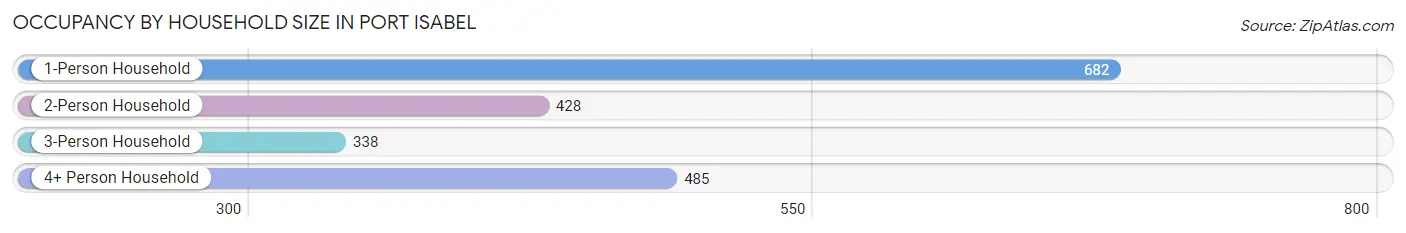
| Household Size | # Housing Units | % Housing Units |
| 1-Person Household | 682 | 35.3% |
| 2-Person Household | 428 | 22.1% |
| 3-Person Household | 338 | 17.5% |
| 4+ Person Household | 485 | 25.1% |
| Total Housing Units | 1,933 | 100.0% |
Occupancy by Ownership by Household Size in Port Isabel
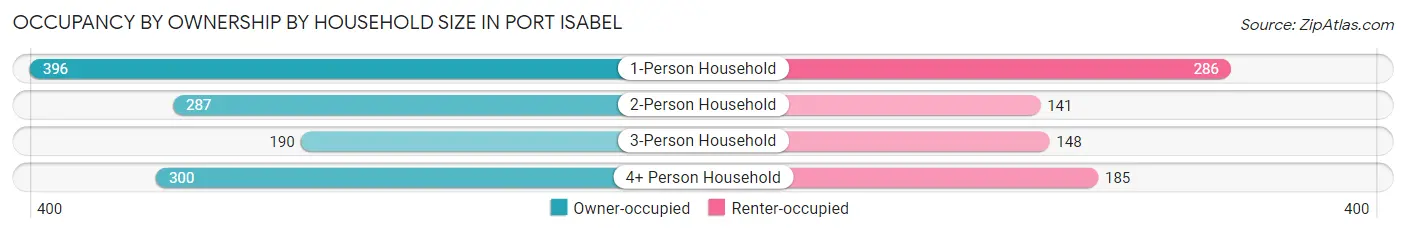
| Household Size | Owner-occupied | Renter-occupied |
| 1-Person Household | 396 (58.1%) | 286 (41.9%) |
| 2-Person Household | 287 (67.1%) | 141 (32.9%) |
| 3-Person Household | 190 (56.2%) | 148 (43.8%) |
| 4+ Person Household | 300 (61.9%) | 185 (38.1%) |
| Total Housing Units | 1,173 (60.7%) | 760 (39.3%) |
Occupancy by Educational Attainment in Port Isabel
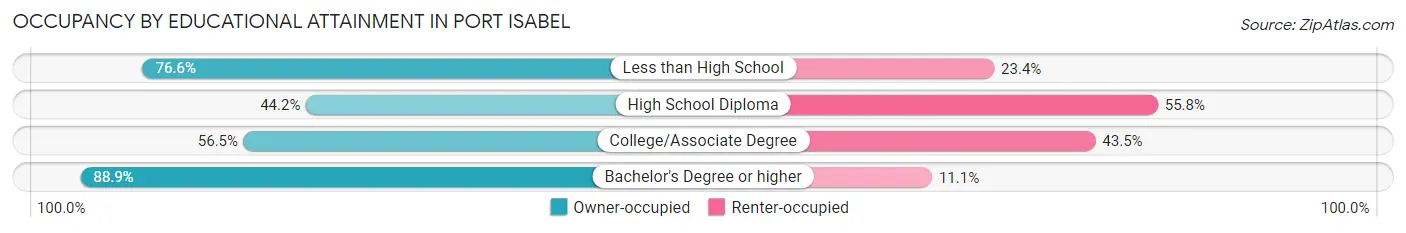
| Household Size | Owner-occupied | Renter-occupied |
| Less than High School | 334 (76.6%) | 102 (23.4%) |
| High School Diploma | 329 (44.2%) | 416 (55.8%) |
| College/Associate Degree | 277 (56.5%) | 213 (43.5%) |
| Bachelor's Degree or higher | 233 (88.9%) | 29 (11.1%) |
Occupancy by Age of Householder in Port Isabel
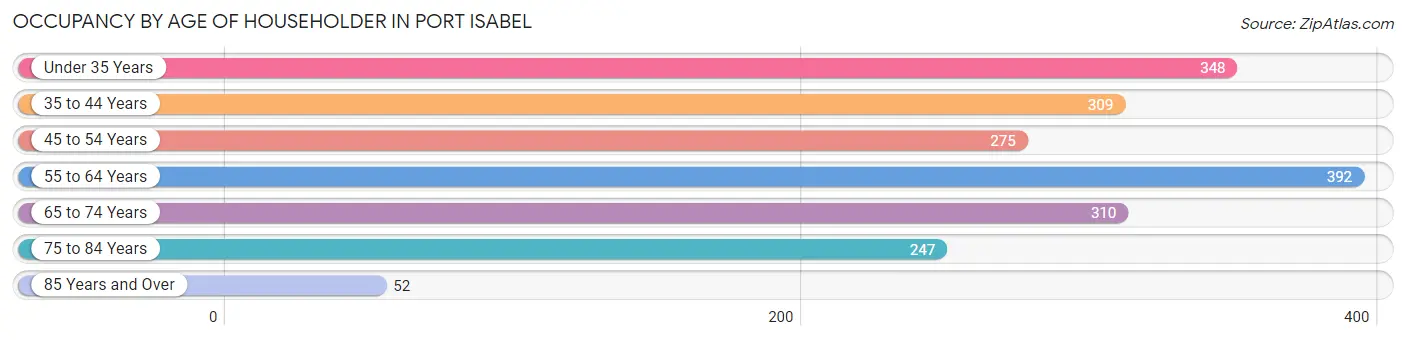
| Age Bracket | # Households | % Households |
| Under 35 Years | 348 | 18.0% |
| 35 to 44 Years | 309 | 16.0% |
| 45 to 54 Years | 275 | 14.2% |
| 55 to 64 Years | 392 | 20.3% |
| 65 to 74 Years | 310 | 16.0% |
| 75 to 84 Years | 247 | 12.8% |
| 85 Years and Over | 52 | 2.7% |
| Total | 1,933 | 100.0% |
Housing Finances in Port Isabel
Median Income by Occupancy in Port Isabel
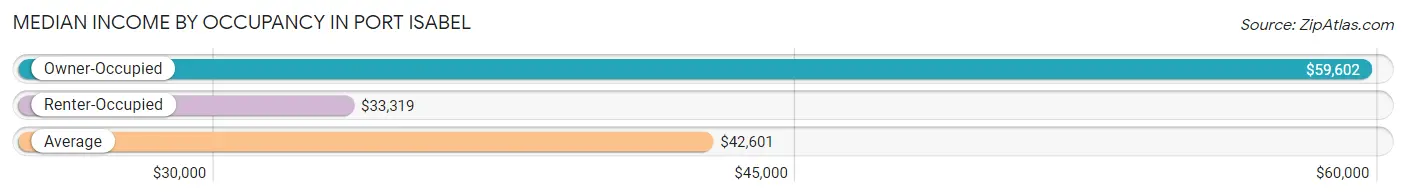
| Occupancy Type | # Households | Median Income |
| Owner-Occupied | 1,173 (60.7%) | $59,602 |
| Renter-Occupied | 760 (39.3%) | $33,319 |
| Average | 1,933 (100.0%) | $42,601 |
Occupancy by Householder Income Bracket in Port Isabel
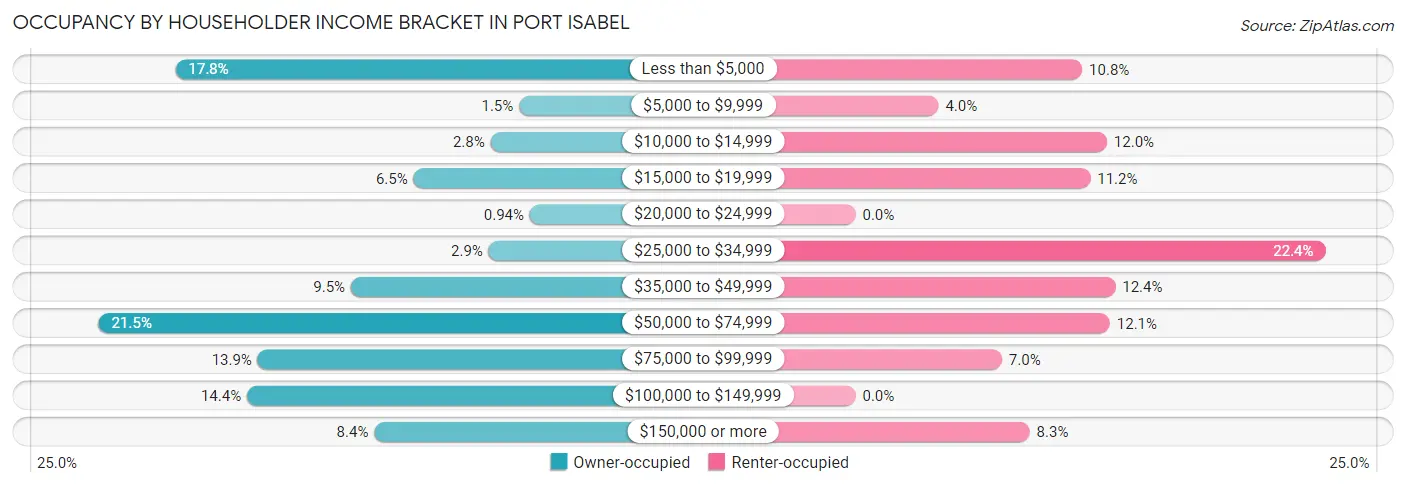
| Income Bracket | Owner-occupied | Renter-occupied |
| Less than $5,000 | 209 (17.8%) | 82 (10.8%) |
| $5,000 to $9,999 | 17 (1.5%) | 30 (4.0%) |
| $10,000 to $14,999 | 33 (2.8%) | 91 (12.0%) |
| $15,000 to $19,999 | 76 (6.5%) | 85 (11.2%) |
| $20,000 to $24,999 | 11 (0.9%) | 0 (0.0%) |
| $25,000 to $34,999 | 34 (2.9%) | 170 (22.4%) |
| $35,000 to $49,999 | 111 (9.5%) | 94 (12.4%) |
| $50,000 to $74,999 | 252 (21.5%) | 92 (12.1%) |
| $75,000 to $99,999 | 163 (13.9%) | 53 (7.0%) |
| $100,000 to $149,999 | 169 (14.4%) | 0 (0.0%) |
| $150,000 or more | 98 (8.4%) | 63 (8.3%) |
| Total | 1,173 (100.0%) | 760 (100.0%) |
Monthly Housing Cost Tiers in Port Isabel
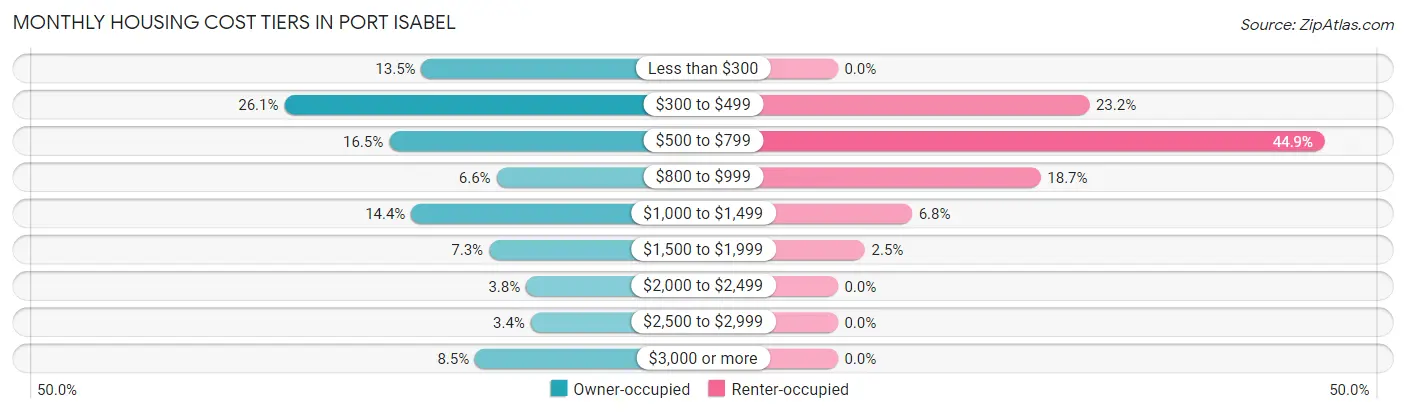
| Monthly Cost | Owner-occupied | Renter-occupied |
| Less than $300 | 158 (13.5%) | 0 (0.0%) |
| $300 to $499 | 306 (26.1%) | 176 (23.2%) |
| $500 to $799 | 193 (16.5%) | 341 (44.9%) |
| $800 to $999 | 77 (6.6%) | 142 (18.7%) |
| $1,000 to $1,499 | 169 (14.4%) | 52 (6.8%) |
| $1,500 to $1,999 | 85 (7.2%) | 19 (2.5%) |
| $2,000 to $2,499 | 45 (3.8%) | 0 (0.0%) |
| $2,500 to $2,999 | 40 (3.4%) | 0 (0.0%) |
| $3,000 or more | 100 (8.5%) | 0 (0.0%) |
| Total | 1,173 (100.0%) | 760 (100.0%) |
Physical Housing Characteristics in Port Isabel
Housing Structures in Port Isabel
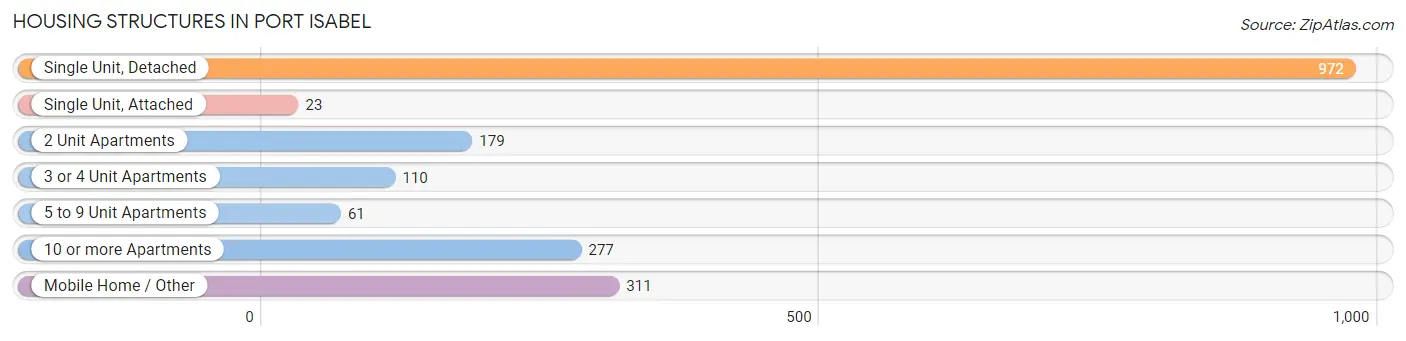
| Structure Type | # Housing Units | % Housing Units |
| Single Unit, Detached | 972 | 50.3% |
| Single Unit, Attached | 23 | 1.2% |
| 2 Unit Apartments | 179 | 9.3% |
| 3 or 4 Unit Apartments | 110 | 5.7% |
| 5 to 9 Unit Apartments | 61 | 3.2% |
| 10 or more Apartments | 277 | 14.3% |
| Mobile Home / Other | 311 | 16.1% |
| Total | 1,933 | 100.0% |
Housing Structures by Occupancy in Port Isabel
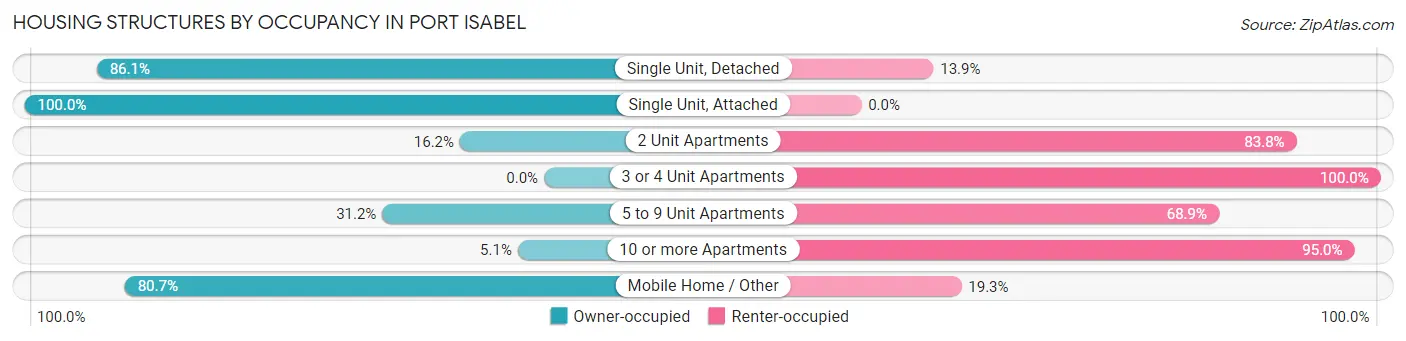
| Structure Type | Owner-occupied | Renter-occupied |
| Single Unit, Detached | 837 (86.1%) | 135 (13.9%) |
| Single Unit, Attached | 23 (100.0%) | 0 (0.0%) |
| 2 Unit Apartments | 29 (16.2%) | 150 (83.8%) |
| 3 or 4 Unit Apartments | 0 (0.0%) | 110 (100.0%) |
| 5 to 9 Unit Apartments | 19 (31.1%) | 42 (68.9%) |
| 10 or more Apartments | 14 (5.1%) | 263 (95.0%) |
| Mobile Home / Other | 251 (80.7%) | 60 (19.3%) |
| Total | 1,173 (60.7%) | 760 (39.3%) |
Housing Structures by Number of Rooms in Port Isabel
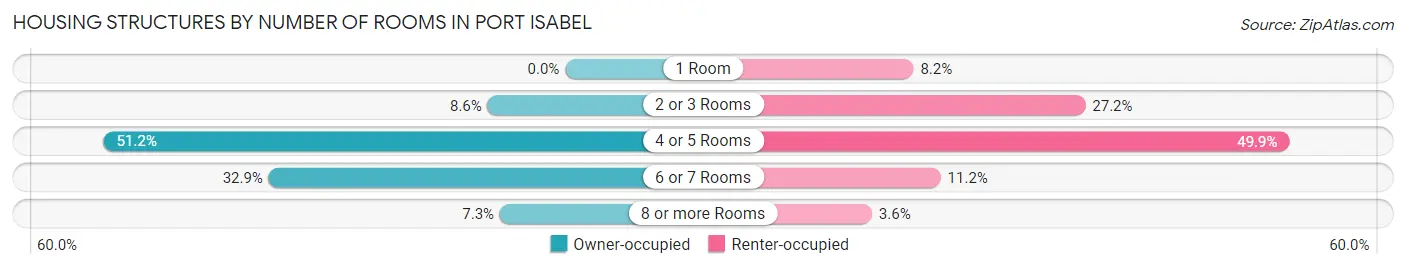
| Number of Rooms | Owner-occupied | Renter-occupied |
| 1 Room | 0 (0.0%) | 62 (8.2%) |
| 2 or 3 Rooms | 101 (8.6%) | 207 (27.2%) |
| 4 or 5 Rooms | 601 (51.2%) | 379 (49.9%) |
| 6 or 7 Rooms | 386 (32.9%) | 85 (11.2%) |
| 8 or more Rooms | 85 (7.2%) | 27 (3.5%) |
| Total | 1,173 (100.0%) | 760 (100.0%) |
Housing Structure by Heating Type in Port Isabel
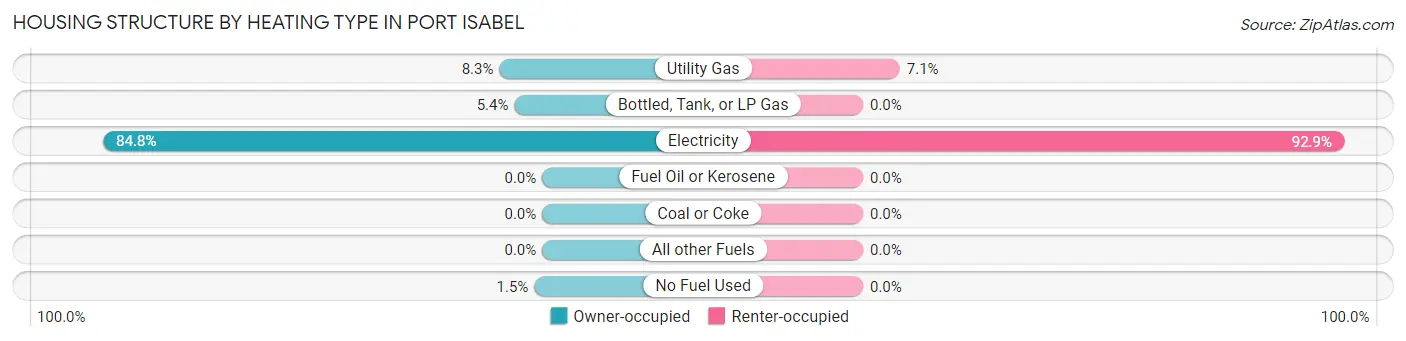
| Heating Type | Owner-occupied | Renter-occupied |
| Utility Gas | 97 (8.3%) | 54 (7.1%) |
| Bottled, Tank, or LP Gas | 63 (5.4%) | 0 (0.0%) |
| Electricity | 995 (84.8%) | 706 (92.9%) |
| Fuel Oil or Kerosene | 0 (0.0%) | 0 (0.0%) |
| Coal or Coke | 0 (0.0%) | 0 (0.0%) |
| All other Fuels | 0 (0.0%) | 0 (0.0%) |
| No Fuel Used | 18 (1.5%) | 0 (0.0%) |
| Total | 1,173 (100.0%) | 760 (100.0%) |
Household Vehicle Usage in Port Isabel
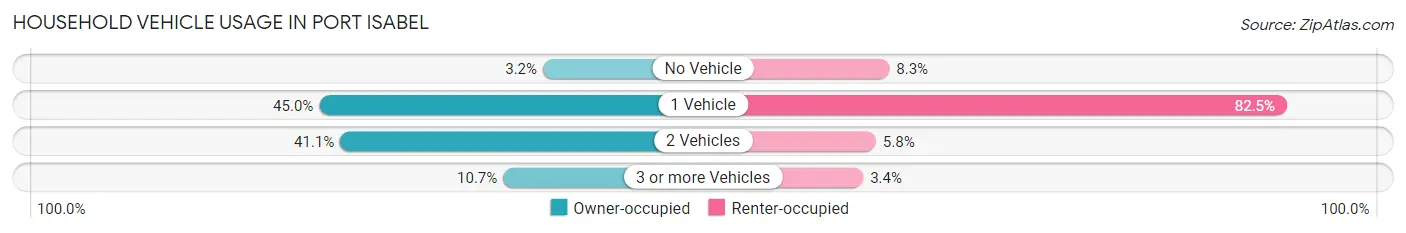
| Vehicles per Household | Owner-occupied | Renter-occupied |
| No Vehicle | 38 (3.2%) | 63 (8.3%) |
| 1 Vehicle | 528 (45.0%) | 627 (82.5%) |
| 2 Vehicles | 482 (41.1%) | 44 (5.8%) |
| 3 or more Vehicles | 125 (10.7%) | 26 (3.4%) |
| Total | 1,173 (100.0%) | 760 (100.0%) |
Real Estate & Mortgages in Port Isabel
Real Estate and Mortgage Overview in Port Isabel
| Characteristic | Without Mortgage | With Mortgage |
| Housing Units | 763 | 410 |
| Median Property Value | $122,200 | $188,800 |
| Median Household Income | $50,865 | $45 |
| Monthly Housing Costs | $463 | $66 |
| Real Estate Taxes | $1,900 | $24 |
Property Value by Mortgage Status in Port Isabel
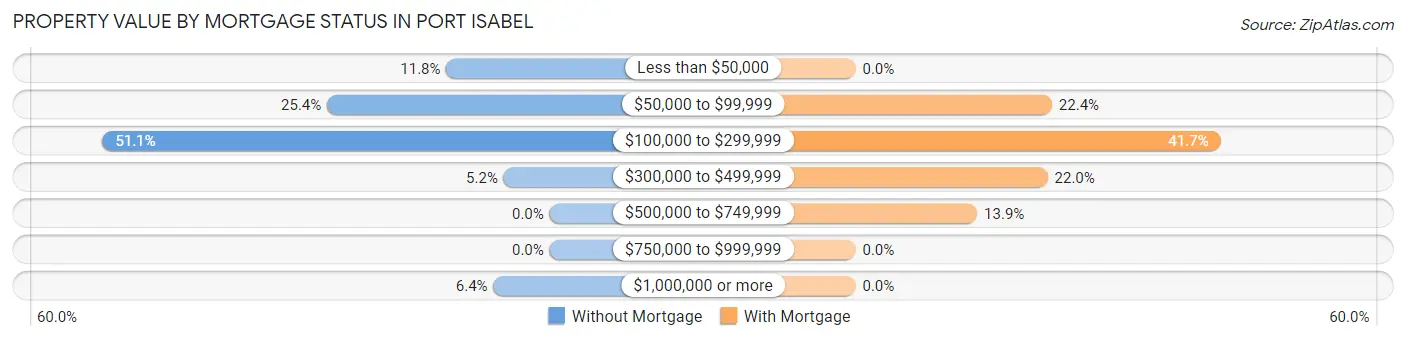
| Property Value | Without Mortgage | With Mortgage |
| Less than $50,000 | 90 (11.8%) | 0 (0.0%) |
| $50,000 to $99,999 | 194 (25.4%) | 92 (22.4%) |
| $100,000 to $299,999 | 390 (51.1%) | 171 (41.7%) |
| $300,000 to $499,999 | 40 (5.2%) | 90 (22.0%) |
| $500,000 to $749,999 | 0 (0.0%) | 57 (13.9%) |
| $750,000 to $999,999 | 0 (0.0%) | 0 (0.0%) |
| $1,000,000 or more | 49 (6.4%) | 0 (0.0%) |
| Total | 763 (100.0%) | 410 (100.0%) |
Household Income by Mortgage Status in Port Isabel
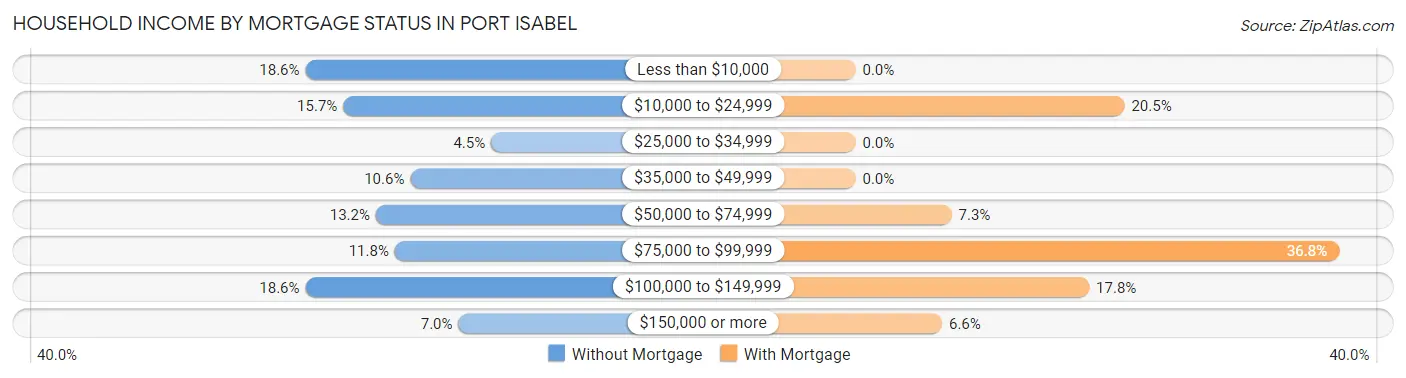
| Household Income | Without Mortgage | With Mortgage |
| Less than $10,000 | 142 (18.6%) | 0 (0.0%) |
| $10,000 to $24,999 | 120 (15.7%) | 84 (20.5%) |
| $25,000 to $34,999 | 34 (4.5%) | 0 (0.0%) |
| $35,000 to $49,999 | 81 (10.6%) | 0 (0.0%) |
| $50,000 to $74,999 | 101 (13.2%) | 30 (7.3%) |
| $75,000 to $99,999 | 90 (11.8%) | 151 (36.8%) |
| $100,000 to $149,999 | 142 (18.6%) | 73 (17.8%) |
| $150,000 or more | 53 (7.0%) | 27 (6.6%) |
| Total | 763 (100.0%) | 410 (100.0%) |
Property Value to Household Income Ratio in Port Isabel
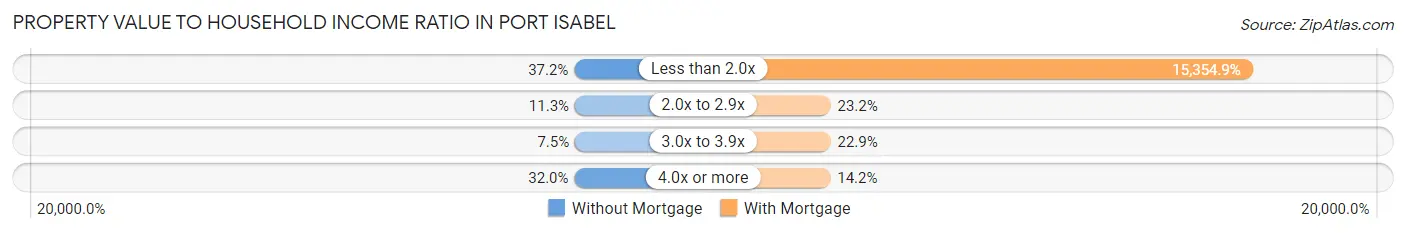
| Value-to-Income Ratio | Without Mortgage | With Mortgage |
| Less than 2.0x | 284 (37.2%) | 62,955 (15,354.9%) |
| 2.0x to 2.9x | 86 (11.3%) | 95 (23.2%) |
| 3.0x to 3.9x | 57 (7.5%) | 94 (22.9%) |
| 4.0x or more | 244 (32.0%) | 58 (14.1%) |
| Total | 763 (100.0%) | 410 (100.0%) |
Real Estate Taxes by Mortgage Status in Port Isabel
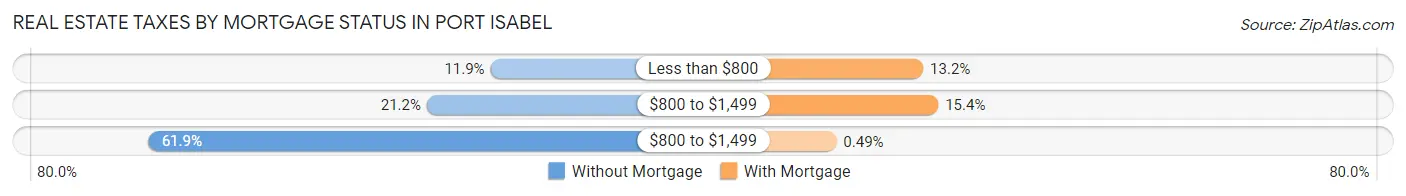
| Property Taxes | Without Mortgage | With Mortgage |
| Less than $800 | 91 (11.9%) | 54 (13.2%) |
| $800 to $1,499 | 162 (21.2%) | 63 (15.4%) |
| $800 to $1,499 | 472 (61.9%) | 2 (0.5%) |
| Total | 763 (100.0%) | 410 (100.0%) |
Health & Disability in Port Isabel
Health Insurance Coverage by Age in Port Isabel
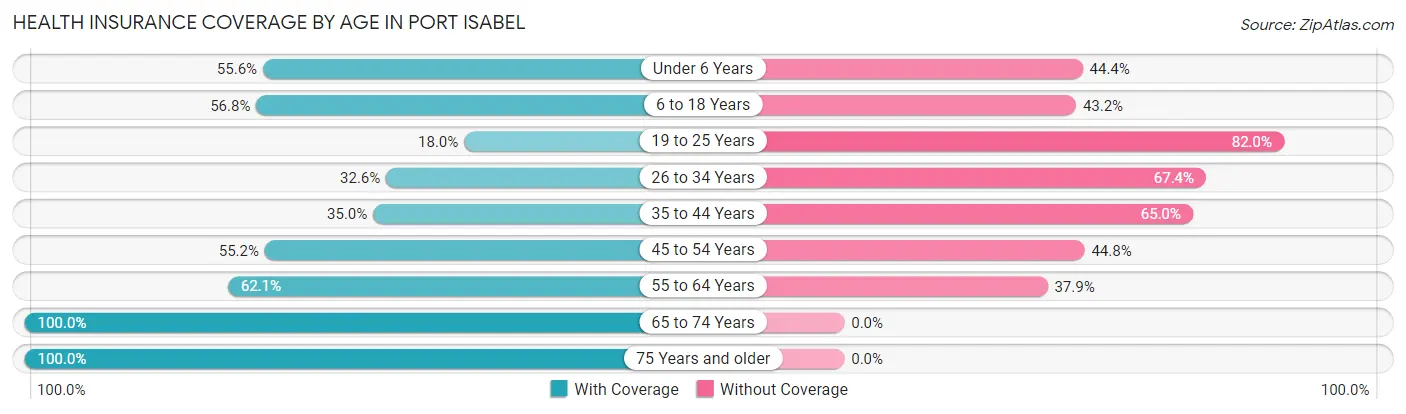
| Age Bracket | With Coverage | Without Coverage |
| Under 6 Years | 235 (55.6%) | 188 (44.4%) |
| 6 to 18 Years | 560 (56.8%) | 426 (43.2%) |
| 19 to 25 Years | 35 (18.0%) | 159 (82.0%) |
| 26 to 34 Years | 201 (32.6%) | 416 (67.4%) |
| 35 to 44 Years | 272 (35.0%) | 505 (65.0%) |
| 45 to 54 Years | 265 (55.2%) | 215 (44.8%) |
| 55 to 64 Years | 400 (62.1%) | 244 (37.9%) |
| 65 to 74 Years | 503 (100.0%) | 0 (0.0%) |
| 75 Years and older | 513 (100.0%) | 0 (0.0%) |
| Total | 2,984 (58.1%) | 2,153 (41.9%) |
Health Insurance Coverage by Citizenship Status in Port Isabel
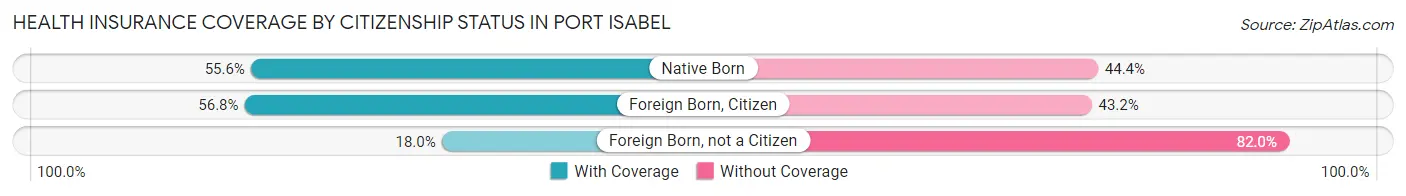
| Citizenship Status | With Coverage | Without Coverage |
| Native Born | 235 (55.6%) | 188 (44.4%) |
| Foreign Born, Citizen | 560 (56.8%) | 426 (43.2%) |
| Foreign Born, not a Citizen | 35 (18.0%) | 159 (82.0%) |
Health Insurance Coverage by Household Income in Port Isabel
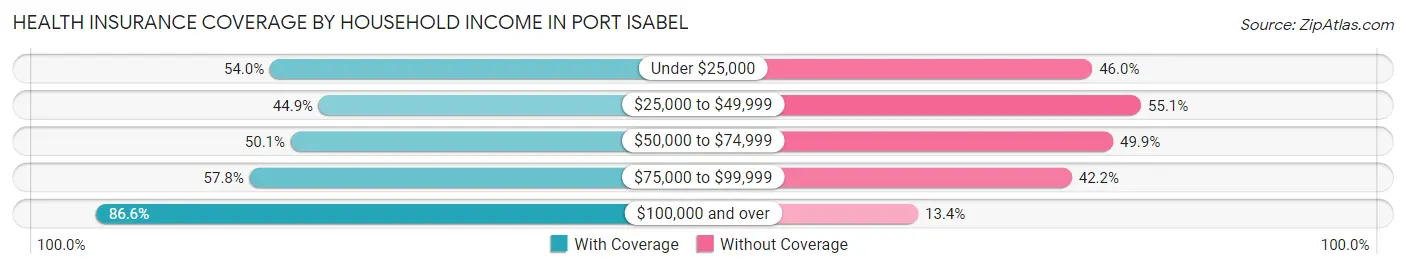
| Household Income | With Coverage | Without Coverage |
| Under $25,000 | 672 (54.0%) | 572 (46.0%) |
| $25,000 to $49,999 | 519 (44.9%) | 638 (55.1%) |
| $50,000 to $74,999 | 452 (50.1%) | 450 (49.9%) |
| $75,000 to $99,999 | 498 (57.8%) | 363 (42.2%) |
| $100,000 and over | 843 (86.6%) | 130 (13.4%) |
Public vs Private Health Insurance Coverage by Age in Port Isabel
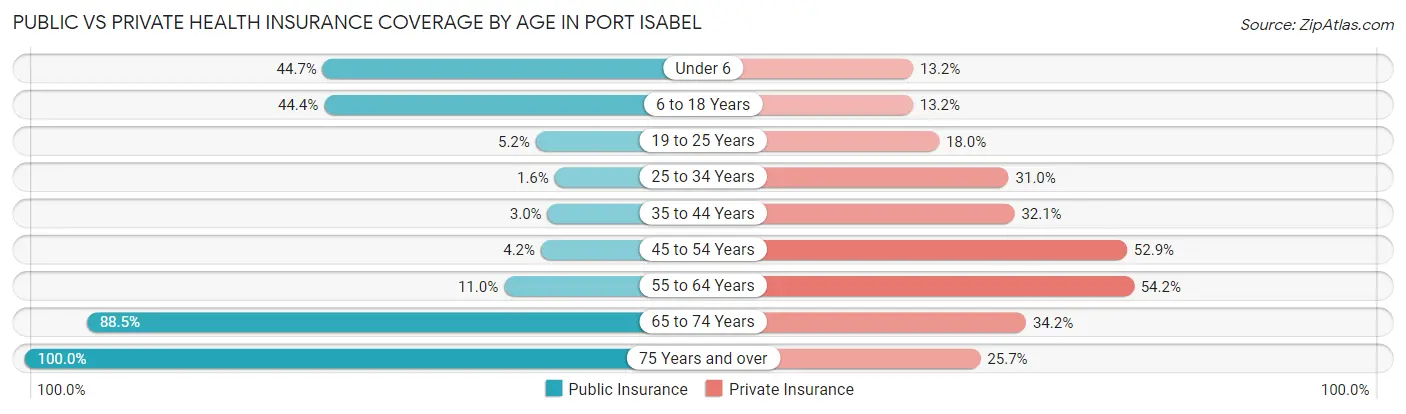
| Age Bracket | Public Insurance | Private Insurance |
| Under 6 | 189 (44.7%) | 56 (13.2%) |
| 6 to 18 Years | 438 (44.4%) | 130 (13.2%) |
| 19 to 25 Years | 10 (5.1%) | 35 (18.0%) |
| 25 to 34 Years | 10 (1.6%) | 191 (31.0%) |
| 35 to 44 Years | 23 (3.0%) | 249 (32.1%) |
| 45 to 54 Years | 20 (4.2%) | 254 (52.9%) |
| 55 to 64 Years | 71 (11.0%) | 349 (54.2%) |
| 65 to 74 Years | 445 (88.5%) | 172 (34.2%) |
| 75 Years and over | 513 (100.0%) | 132 (25.7%) |
| Total | 1,719 (33.5%) | 1,568 (30.5%) |
Disability Status by Sex by Age in Port Isabel
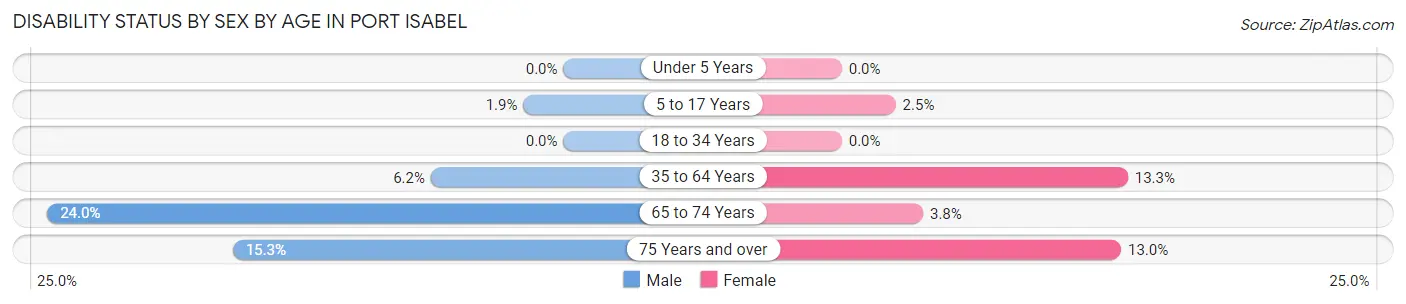
| Age Bracket | Male | Female |
| Under 5 Years | 0 (0.0%) | 0 (0.0%) |
| 5 to 17 Years | 10 (1.9%) | 12 (2.5%) |
| 18 to 34 Years | 0 (0.0%) | 0 (0.0%) |
| 35 to 64 Years | 59 (6.1%) | 125 (13.3%) |
| 65 to 74 Years | 57 (23.9%) | 10 (3.8%) |
| 75 Years and over | 29 (15.3%) | 42 (13.0%) |
Disability Class by Sex by Age in Port Isabel
Disability Class: Hearing Difficulty
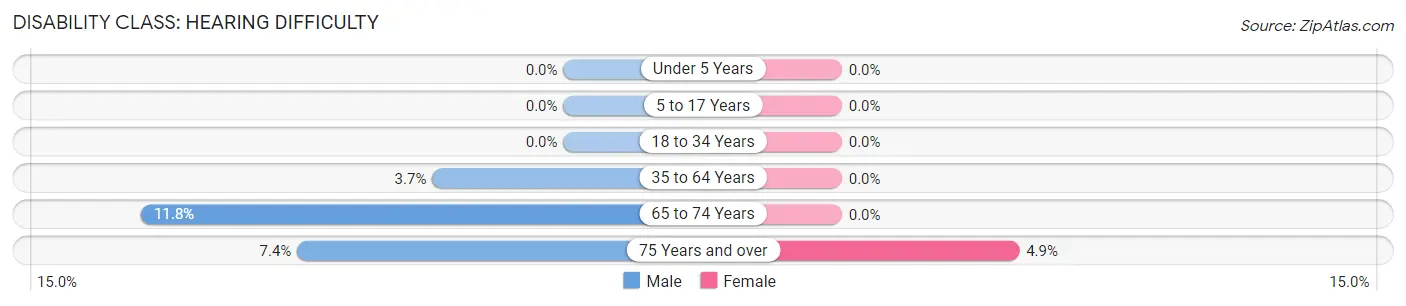
| Age Bracket | Male | Female |
| Under 5 Years | 0 (0.0%) | 0 (0.0%) |
| 5 to 17 Years | 0 (0.0%) | 0 (0.0%) |
| 18 to 34 Years | 0 (0.0%) | 0 (0.0%) |
| 35 to 64 Years | 35 (3.6%) | 0 (0.0%) |
| 65 to 74 Years | 28 (11.8%) | 0 (0.0%) |
| 75 Years and over | 14 (7.4%) | 16 (4.9%) |
Disability Class: Vision Difficulty
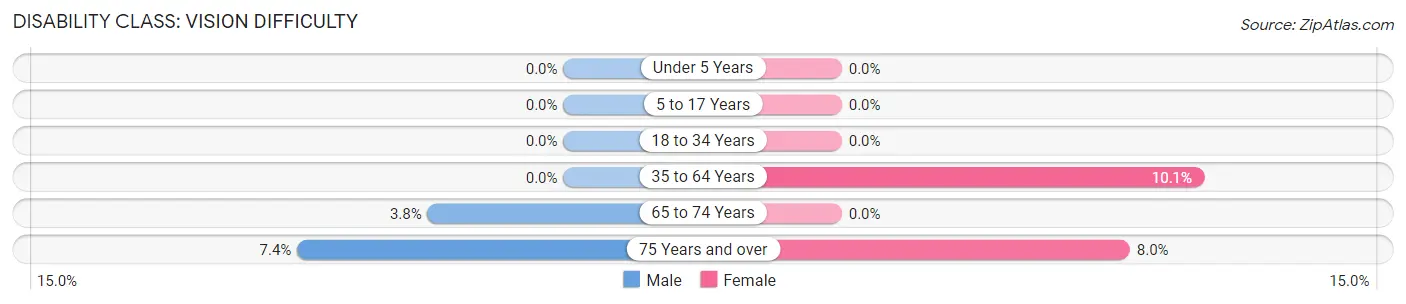
| Age Bracket | Male | Female |
| Under 5 Years | 0 (0.0%) | 0 (0.0%) |
| 5 to 17 Years | 0 (0.0%) | 0 (0.0%) |
| 18 to 34 Years | 0 (0.0%) | 0 (0.0%) |
| 35 to 64 Years | 0 (0.0%) | 95 (10.1%) |
| 65 to 74 Years | 9 (3.8%) | 0 (0.0%) |
| 75 Years and over | 14 (7.4%) | 26 (8.0%) |
Disability Class: Cognitive Difficulty
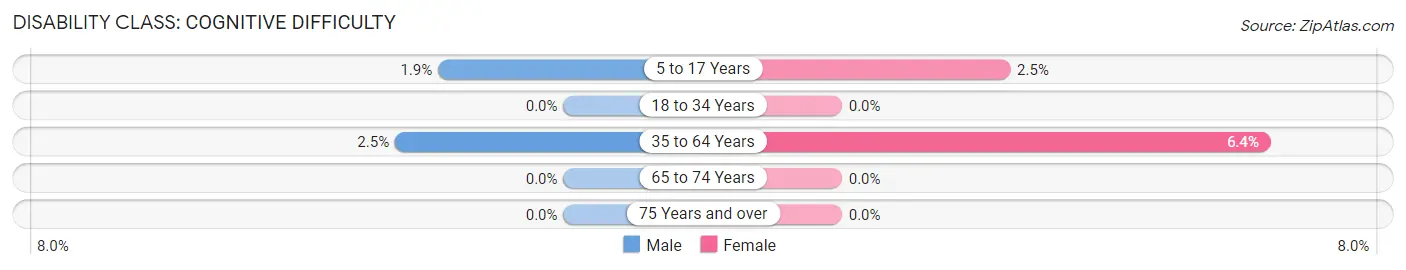
| Age Bracket | Male | Female |
| 5 to 17 Years | 10 (1.9%) | 12 (2.5%) |
| 18 to 34 Years | 0 (0.0%) | 0 (0.0%) |
| 35 to 64 Years | 24 (2.5%) | 60 (6.4%) |
| 65 to 74 Years | 0 (0.0%) | 0 (0.0%) |
| 75 Years and over | 0 (0.0%) | 0 (0.0%) |
Disability Class: Ambulatory Difficulty
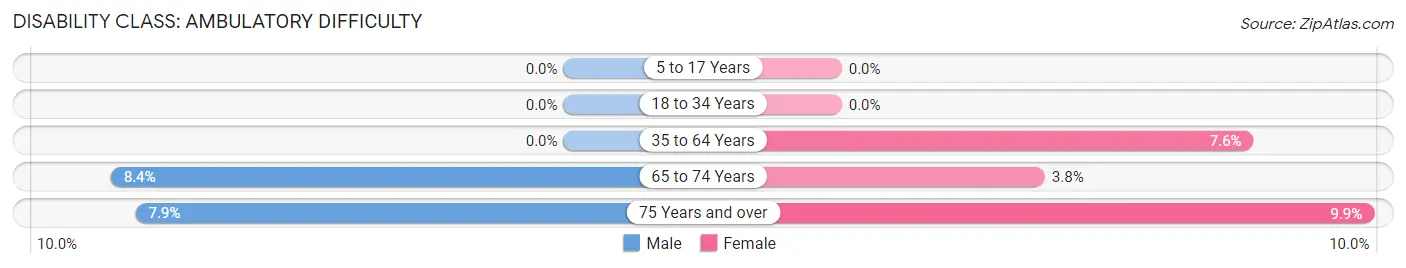
| Age Bracket | Male | Female |
| 5 to 17 Years | 0 (0.0%) | 0 (0.0%) |
| 18 to 34 Years | 0 (0.0%) | 0 (0.0%) |
| 35 to 64 Years | 0 (0.0%) | 72 (7.6%) |
| 65 to 74 Years | 20 (8.4%) | 10 (3.8%) |
| 75 Years and over | 15 (7.9%) | 32 (9.9%) |
Disability Class: Self-Care Difficulty
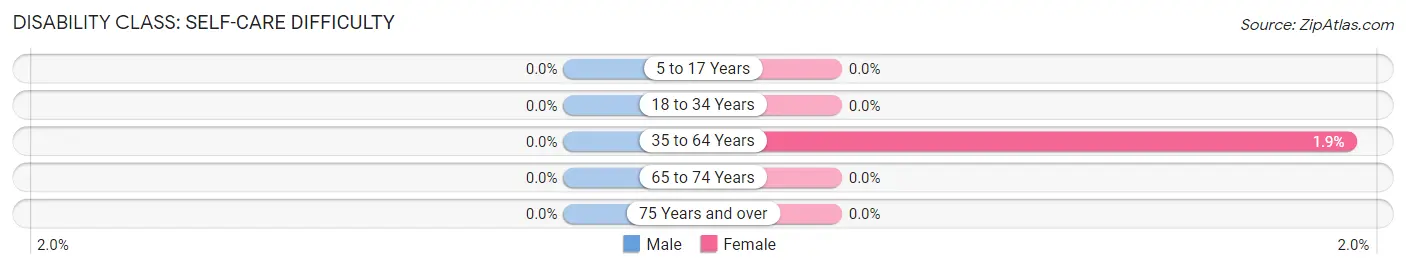
| Age Bracket | Male | Female |
| 5 to 17 Years | 0 (0.0%) | 0 (0.0%) |
| 18 to 34 Years | 0 (0.0%) | 0 (0.0%) |
| 35 to 64 Years | 0 (0.0%) | 18 (1.9%) |
| 65 to 74 Years | 0 (0.0%) | 0 (0.0%) |
| 75 Years and over | 0 (0.0%) | 0 (0.0%) |
Technology Access in Port Isabel
Computing Device Access in Port Isabel
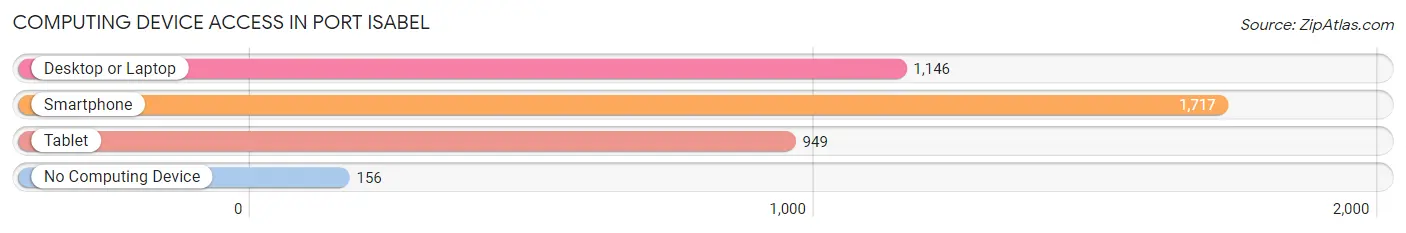
| Device Type | # Households | % Households |
| Desktop or Laptop | 1,146 | 59.3% |
| Smartphone | 1,717 | 88.8% |
| Tablet | 949 | 49.1% |
| No Computing Device | 156 | 8.1% |
| Total | 1,933 | 100.0% |
Internet Access in Port Isabel
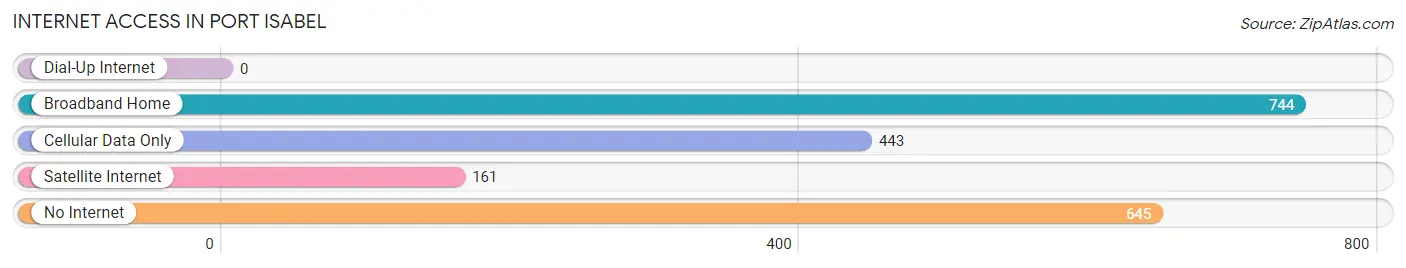
| Internet Type | # Households | % Households |
| Dial-Up Internet | 0 | 0.0% |
| Broadband Home | 744 | 38.5% |
| Cellular Data Only | 443 | 22.9% |
| Satellite Internet | 161 | 8.3% |
| No Internet | 645 | 33.4% |
| Total | 1,933 | 100.0% |
Port Isabel Summary
History
Port Isabel is a city located in Cameron County, Texas, United States. It is situated on the westernmost tip of the Laguna Madre, an inlet of the Gulf of Mexico. The city is named after Isabel I of Castile, the Spanish queen who sponsored the voyage of Christopher Columbus. The city was founded in 1853 by a group of settlers from the Mexican state of Tamaulipas. The city was originally known as Santa Isabel, but the name was changed to Port Isabel in 1858.
The city has a long and rich history. It was the site of the Battle of Palo Alto, the first battle of the Mexican-American War, in 1846. During the Civil War, the city was occupied by Confederate forces and served as a major port for blockade runners. In the late 19th century, the city was a popular tourist destination, with many visitors coming to fish and hunt in the area.
In the early 20th century, the city was a major port for the Texas oil industry. The city was also the site of the first offshore oil drilling platform in the United States, which was built in 1947.
Geography
Port Isabel is located at the westernmost tip of the Laguna Madre, an inlet of the Gulf of Mexico. The city is situated on a peninsula, with the Gulf of Mexico to the east and the Laguna Madre to the west. The city is bordered by the cities of South Padre Island to the south and Laguna Vista to the north.
The city has a total area of 4.2 square miles, of which 3.9 square miles is land and 0.3 square miles is water. The city is located at an elevation of 8 feet above sea level.
Economy
The economy of Port Isabel is largely based on tourism and fishing. The city is a popular destination for fishing, boating, and other water activities. The city is also home to several marinas, which provide services for recreational boaters.
The city is also home to several manufacturing companies, including a boat manufacturing plant and a seafood processing plant. The city is also home to a number of retail stores, restaurants, and other businesses.
Demographics
As of the 2010 census, the population of Port Isabel was 5,006. The racial makeup of the city was 79.2% White, 0.7% African American, 0.3% Native American, 0.3% Asian, 0.1% Pacific Islander, 16.7% from other races, and 2.7% from two or more races. Hispanic or Latino of any race were 81.2% of the population.
The median household income in the city was $30,938, and the median family income was $35,938. The per capita income for the city was $15,938. About 22.2% of the population was below the poverty line.
Common Questions
What is Per Capita Income in Port Isabel?
Per Capita income in Port Isabel is $24,100.
What is the Median Family Income in Port Isabel?
Median Family Income in Port Isabel is $58,807.
What is the Median Household income in Port Isabel?
Median Household Income in Port Isabel is $42,601.
What is Income or Wage Gap in Port Isabel?
Income or Wage Gap in Port Isabel is 37.0%.
Women in Port Isabel earn 63.0 cents for every dollar earned by a man.
What is Family Income Deficit in Port Isabel?
Family Income Deficit in Port Isabel is $14,895.
Families that are below poverty line in Port Isabel earn $14,895 less on average than the poverty threshold level.
What is Inequality or Gini Index in Port Isabel?
Inequality or Gini Index in Port Isabel is 0.51.
What is the Total Population of Port Isabel?
Total Population of Port Isabel is 5,137.
What is the Total Male Population of Port Isabel?
Total Male Population of Port Isabel is 2,636.
What is the Total Female Population of Port Isabel?
Total Female Population of Port Isabel is 2,501.
What is the Ratio of Males per 100 Females in Port Isabel?
There are 105.40 Males per 100 Females in Port Isabel.
What is the Ratio of Females per 100 Males in Port Isabel?
There are 94.88 Females per 100 Males in Port Isabel.
What is the Median Population Age in Port Isabel?
Median Population Age in Port Isabel is 39.7 Years.
What is the Average Family Size in Port Isabel
Average Family Size in Port Isabel is 3.6 People.
What is the Average Household Size in Port Isabel
Average Household Size in Port Isabel is 2.7 People.
How Large is the Labor Force in Port Isabel?
There are 2,120 People in the Labor Forcein in Port Isabel.
What is the Percentage of People in the Labor Force in Port Isabel?
54.3% of People are in the Labor Force in Port Isabel.
What is the Unemployment Rate in Port Isabel?
Unemployment Rate in Port Isabel is 2.0%.