Little River Academy, TX Map & Demographics
Little River Academy Map
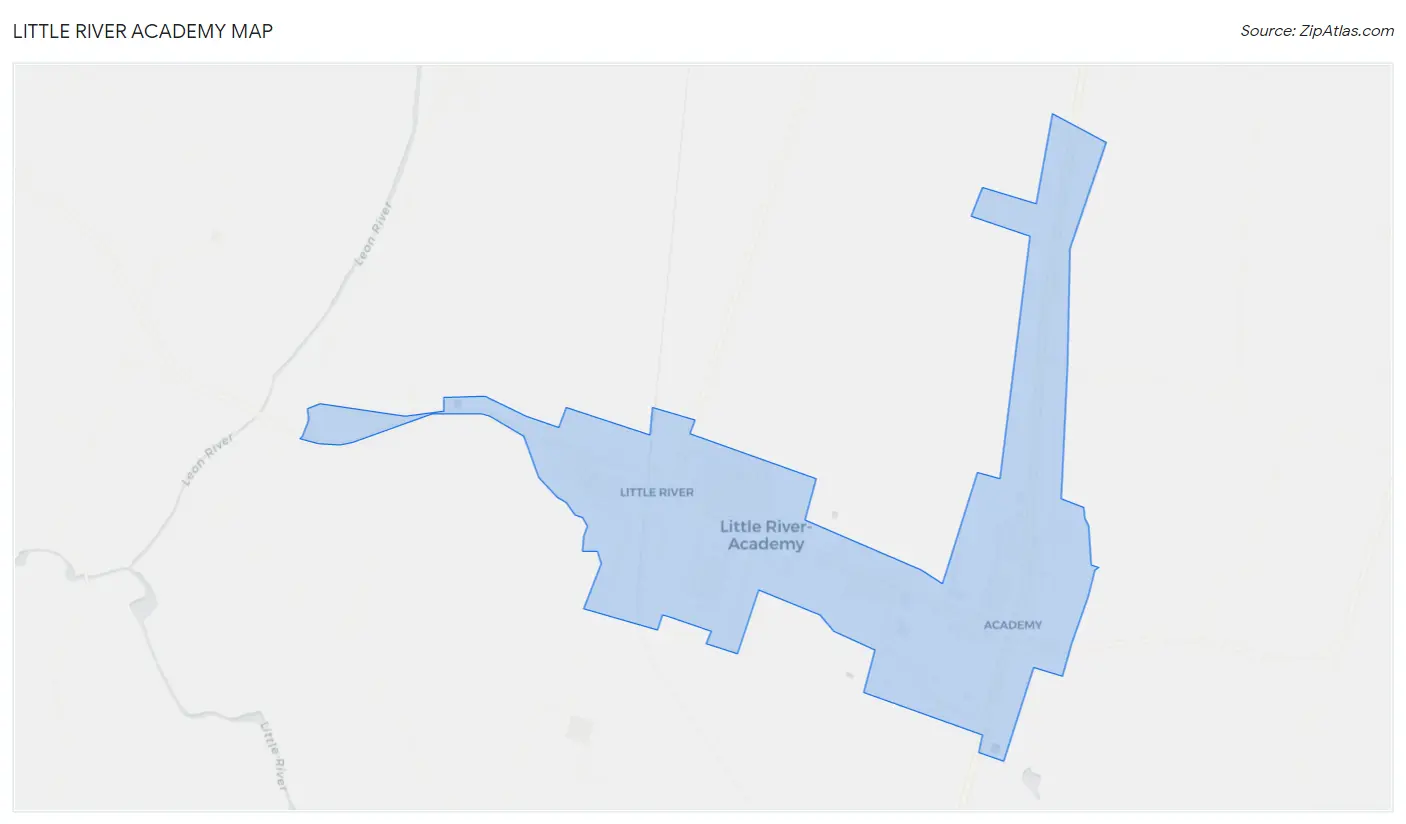
Little River Academy Overview
$27,698
PER CAPITA INCOME
$80,192
AVG FAMILY INCOME
$73,125
AVG HOUSEHOLD INCOME
12.0%
WAGE / INCOME GAP [ % ]
88.0¢/ $1
WAGE / INCOME GAP [ $ ]
0.33
INEQUALITY / GINI INDEX
2,374
TOTAL POPULATION
1,199
MALE POPULATION
1,175
FEMALE POPULATION
102.04
MALES / 100 FEMALES
98.00
FEMALES / 100 MALES
32.7
MEDIAN AGE
3.5
AVG FAMILY SIZE
3.1
AVG HOUSEHOLD SIZE
1,181
LABOR FORCE [ PEOPLE ]
72.4%
PERCENT IN LABOR FORCE
6.8%
UNEMPLOYMENT RATE
Little River Academy Zip Codes
Little River Academy Area Codes
Income in Little River Academy
Income Overview in Little River Academy
Per Capita Income in Little River Academy is $27,698, while median incomes of families and households are $80,192 and $73,125 respectively.
| Characteristic | Number | Measure |
| Per Capita Income | 2,374 | $27,698 |
| Median Family Income | 578 | $80,192 |
| Mean Family Income | 578 | $91,258 |
| Median Household Income | 768 | $73,125 |
| Mean Household Income | 768 | $83,925 |
| Income Deficit | 578 | $0 |
| Wage / Income Gap (%) | 2,374 | 12.04% |
| Wage / Income Gap ($) | 2,374 | 87.96¢ per $1 |
| Gini / Inequality Index | 2,374 | 0.33 |
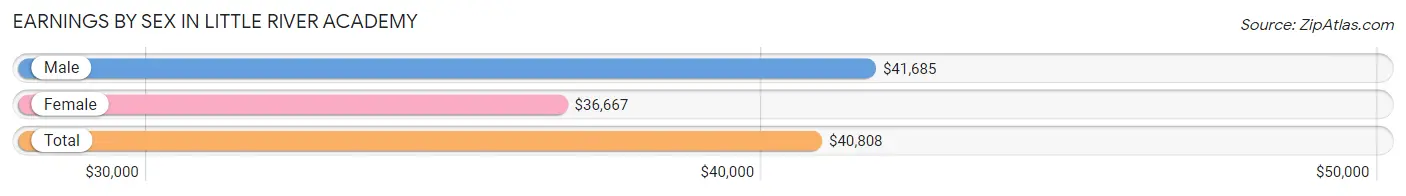
Earnings by Sex in Little River Academy
Average Earnings in Little River Academy are $40,808, $41,685 for men and $36,667 for women, a difference of 12.0%.
| Sex | Number | Average Earnings |
| Male | 667 (55.8%) | $41,685 |
| Female | 528 (44.2%) | $36,667 |
| Total | 1,195 (100.0%) | $40,808 |
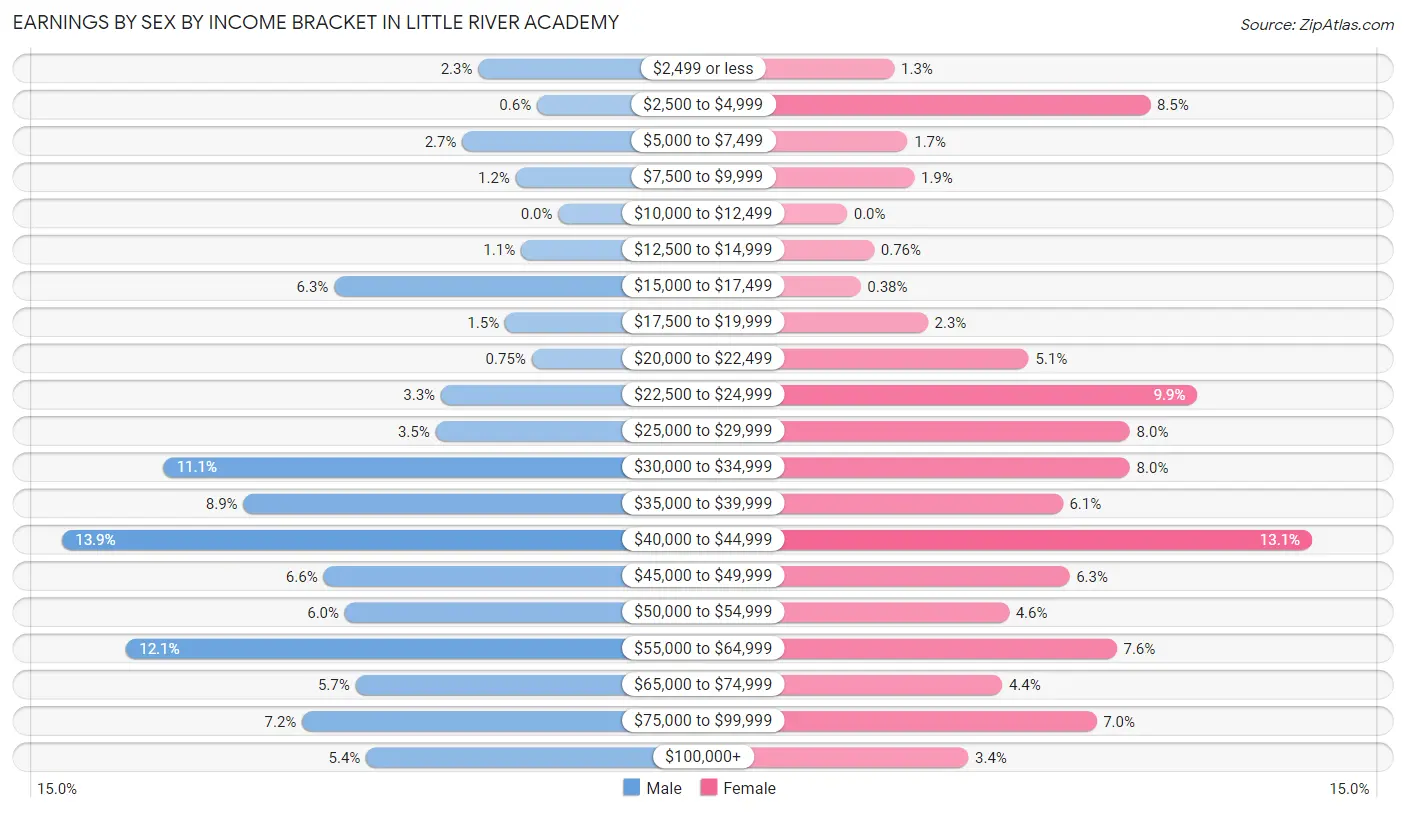
Earnings by Sex by Income Bracket in Little River Academy
The most common earnings brackets in Little River Academy are $40,000 to $44,999 for men (93 | 13.9%) and $40,000 to $44,999 for women (69 | 13.1%).
| Income | Male | Female |
| $2,499 or less | 15 (2.2%) | 7 (1.3%) |
| $2,500 to $4,999 | 4 (0.6%) | 45 (8.5%) |
| $5,000 to $7,499 | 18 (2.7%) | 9 (1.7%) |
| $7,500 to $9,999 | 8 (1.2%) | 10 (1.9%) |
| $10,000 to $12,499 | 0 (0.0%) | 0 (0.0%) |
| $12,500 to $14,999 | 7 (1.1%) | 4 (0.8%) |
| $15,000 to $17,499 | 42 (6.3%) | 2 (0.4%) |
| $17,500 to $19,999 | 10 (1.5%) | 12 (2.3%) |
| $20,000 to $22,499 | 5 (0.7%) | 27 (5.1%) |
| $22,500 to $24,999 | 22 (3.3%) | 52 (9.9%) |
| $25,000 to $29,999 | 23 (3.5%) | 42 (8.0%) |
| $30,000 to $34,999 | 74 (11.1%) | 42 (8.0%) |
| $35,000 to $39,999 | 59 (8.8%) | 32 (6.1%) |
| $40,000 to $44,999 | 93 (13.9%) | 69 (13.1%) |
| $45,000 to $49,999 | 44 (6.6%) | 33 (6.2%) |
| $50,000 to $54,999 | 40 (6.0%) | 24 (4.5%) |
| $55,000 to $64,999 | 81 (12.1%) | 40 (7.6%) |
| $65,000 to $74,999 | 38 (5.7%) | 23 (4.4%) |
| $75,000 to $99,999 | 48 (7.2%) | 37 (7.0%) |
| $100,000+ | 36 (5.4%) | 18 (3.4%) |
| Total | 667 (100.0%) | 528 (100.0%) |
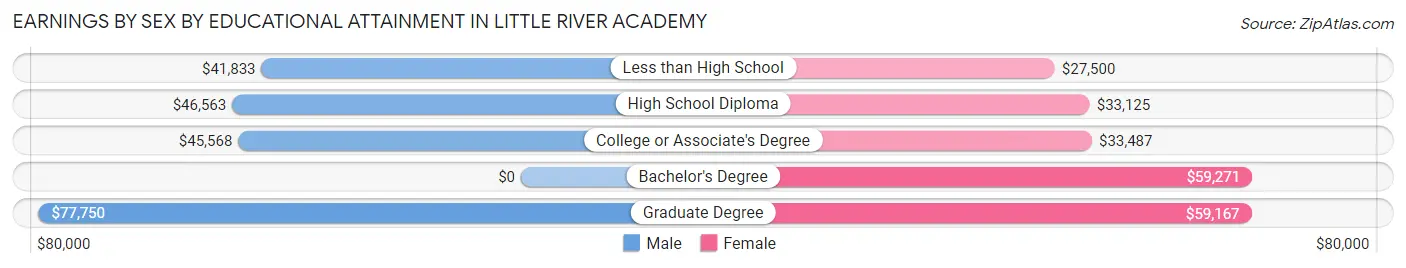
Earnings by Sex by Educational Attainment in Little River Academy
Average earnings in Little River Academy are $45,947 for men and $38,750 for women, a difference of 15.7%. Men with an educational attainment of graduate degree enjoy the highest average annual earnings of $77,750, while those with less than high school education earn the least with $41,833. Women with an educational attainment of bachelor's degree earn the most with the average annual earnings of $59,271, while those with less than high school education have the smallest earnings of $27,500.
| Educational Attainment | Male Income | Female Income |
| Less than High School | $41,833 | $27,500 |
| High School Diploma | $46,563 | $33,125 |
| College or Associate's Degree | $45,568 | $33,487 |
| Bachelor's Degree | - | - |
| Graduate Degree | $77,750 | $59,167 |
| Total | $45,947 | $38,750 |
Family Income in Little River Academy
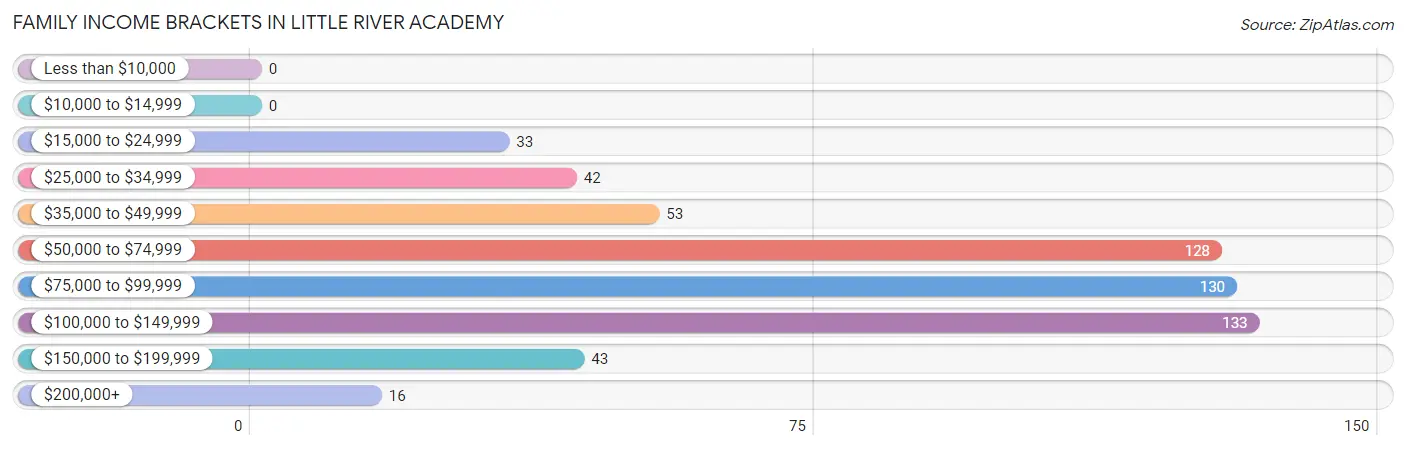
Family Income Brackets in Little River Academy
According to the Little River Academy family income data, there are 133 families falling into the $100,000 to $149,999 income range, which is the most common income bracket and makes up 23.0% of all families.
| Income Bracket | # Families | % Families |
| Less than $10,000 | 0 | 0.0% |
| $10,000 to $14,999 | 0 | 0.0% |
| $15,000 to $24,999 | 33 | 5.7% |
| $25,000 to $34,999 | 42 | 7.3% |
| $35,000 to $49,999 | 53 | 9.2% |
| $50,000 to $74,999 | 128 | 22.1% |
| $75,000 to $99,999 | 130 | 22.5% |
| $100,000 to $149,999 | 133 | 23.0% |
| $150,000 to $199,999 | 43 | 7.4% |
| $200,000+ | 16 | 2.8% |
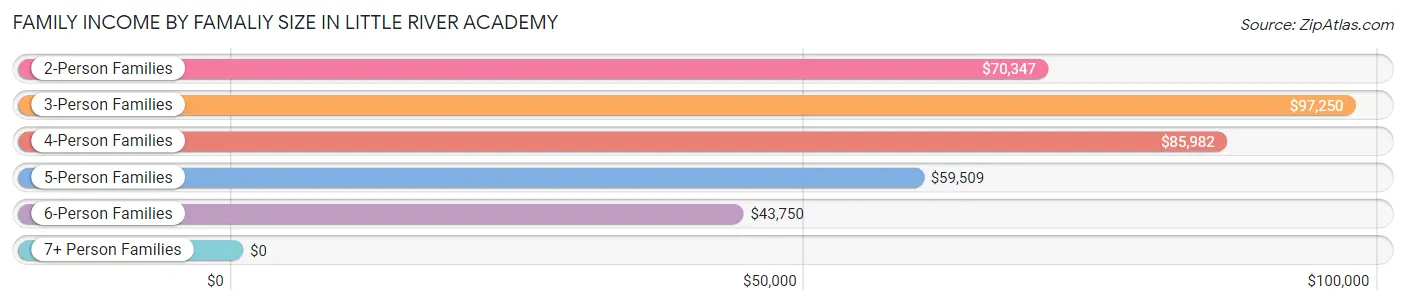
Family Income by Famaliy Size in Little River Academy
3-person families (154 | 26.6%) account for the highest median family income in Little River Academy with $97,250 per family, while 2-person families (185 | 32.0%) have the highest median income of $35,174 per family member.
| Income Bracket | # Families | Median Income |
| 2-Person Families | 185 (32.0%) | $70,347 |
| 3-Person Families | 154 (26.6%) | $97,250 |
| 4-Person Families | 143 (24.7%) | $85,982 |
| 5-Person Families | 69 (11.9%) | $59,509 |
| 6-Person Families | 19 (3.3%) | $43,750 |
| 7+ Person Families | 8 (1.4%) | $0 |
| Total | 578 (100.0%) | $80,192 |
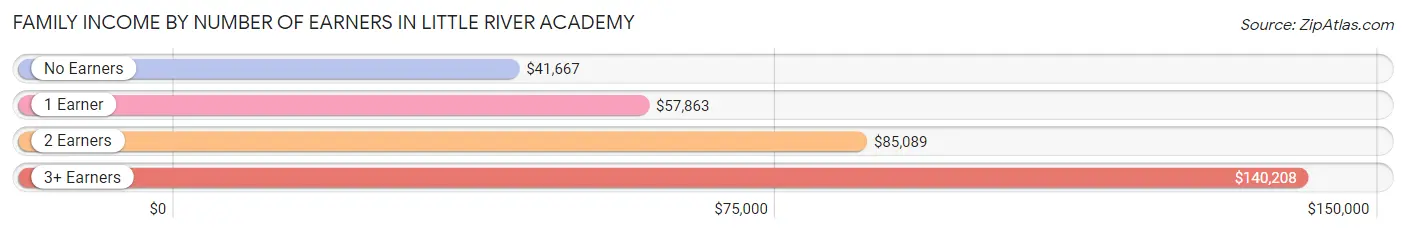
Family Income by Number of Earners in Little River Academy
The median family income in Little River Academy is $80,192, with families comprising 3+ earners (80) having the highest median family income of $140,208, while families with no earners (42) have the lowest median family income of $41,667, accounting for 13.8% and 7.3% of families, respectively.
| Number of Earners | # Families | Median Income |
| No Earners | 42 (7.3%) | $41,667 |
| 1 Earner | 199 (34.4%) | $57,863 |
| 2 Earners | 257 (44.5%) | $85,089 |
| 3+ Earners | 80 (13.8%) | $140,208 |
| Total | 578 (100.0%) | $80,192 |
Household Income in Little River Academy
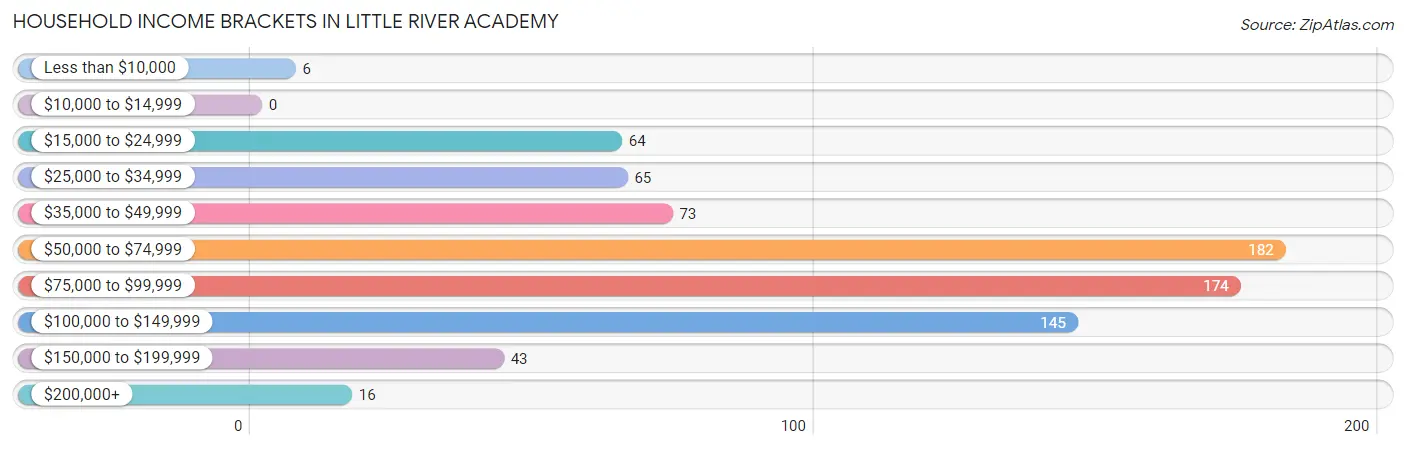
Household Income Brackets in Little River Academy
With 182 households falling in the category, the $50,000 to $74,999 income range is the most frequent in Little River Academy, accounting for 23.7% of all households.
| Income Bracket | # Households | % Households |
| Less than $10,000 | 6 | 0.8% |
| $10,000 to $14,999 | 0 | 0.0% |
| $15,000 to $24,999 | 64 | 8.3% |
| $25,000 to $34,999 | 65 | 8.5% |
| $35,000 to $49,999 | 73 | 9.5% |
| $50,000 to $74,999 | 182 | 23.7% |
| $75,000 to $99,999 | 174 | 22.7% |
| $100,000 to $149,999 | 145 | 18.9% |
| $150,000 to $199,999 | 43 | 5.6% |
| $200,000+ | 16 | 2.1% |
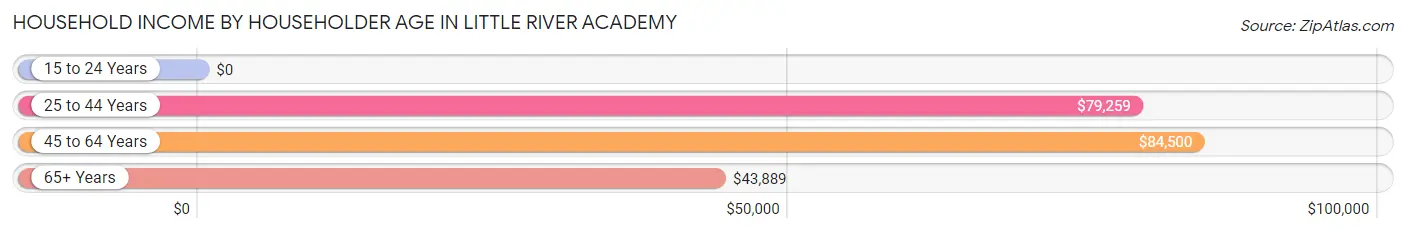
Household Income by Householder Age in Little River Academy
The median household income in Little River Academy is $73,125, with the highest median household income of $84,500 found in the 45 to 64 years age bracket for the primary householder. A total of 246 households (32.0%) fall into this category.
| Income Bracket | # Households | Median Income |
| 15 to 24 Years | 0 (0.0%) | $0 |
| 25 to 44 Years | 348 (45.3%) | $79,259 |
| 45 to 64 Years | 246 (32.0%) | $84,500 |
| 65+ Years | 174 (22.7%) | $43,889 |
| Total | 768 (100.0%) | $73,125 |
Poverty in Little River Academy
Income Below Poverty by Sex and Age in Little River Academy
With 3.7% poverty level for males and 8.7% for females among the residents of Little River Academy, 5 year old males and 6 to 11 year old females are the most vulnerable to poverty, with 9 males (100.0%) and 42 females (25.8%) in their respective age groups living below the poverty level.
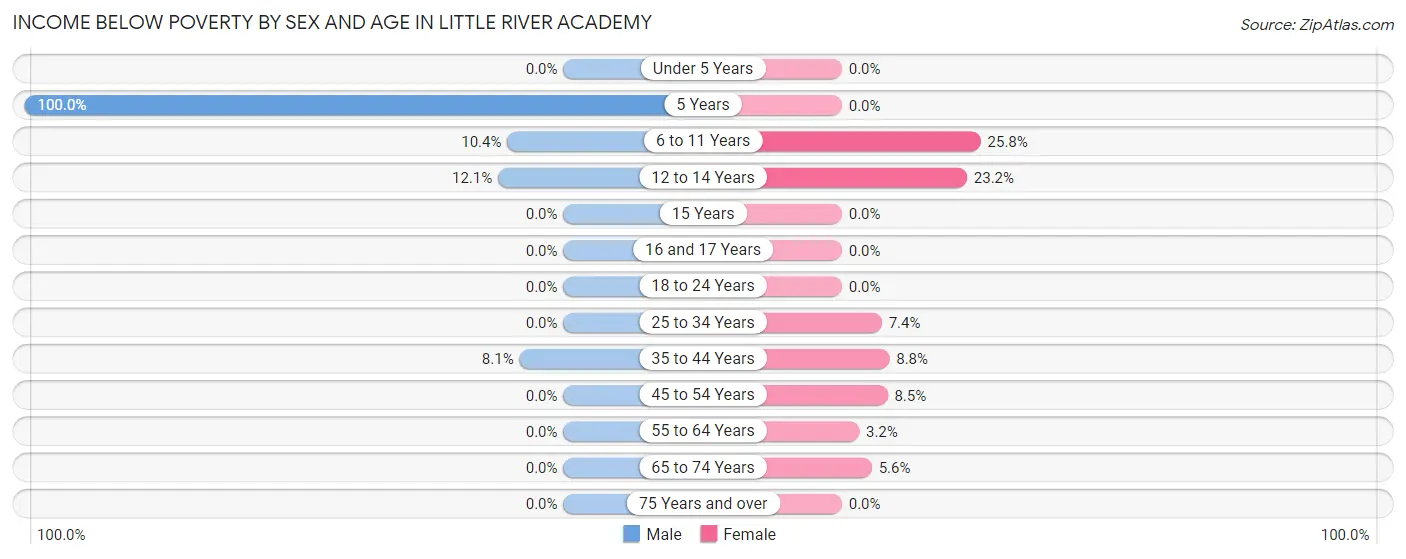
| Age Bracket | Male | Female |
| Under 5 Years | 0 (0.0%) | 0 (0.0%) |
| 5 Years | 9 (100.0%) | 0 (0.0%) |
| 6 to 11 Years | 13 (10.4%) | 42 (25.8%) |
| 12 to 14 Years | 8 (12.1%) | 13 (23.2%) |
| 15 Years | 0 (0.0%) | 0 (0.0%) |
| 16 and 17 Years | 0 (0.0%) | 0 (0.0%) |
| 18 to 24 Years | 0 (0.0%) | 0 (0.0%) |
| 25 to 34 Years | 0 (0.0%) | 16 (7.4%) |
| 35 to 44 Years | 14 (8.1%) | 14 (8.8%) |
| 45 to 54 Years | 0 (0.0%) | 10 (8.5%) |
| 55 to 64 Years | 0 (0.0%) | 4 (3.2%) |
| 65 to 74 Years | 0 (0.0%) | 3 (5.6%) |
| 75 Years and over | 0 (0.0%) | 0 (0.0%) |
| Total | 44 (3.7%) | 102 (8.7%) |
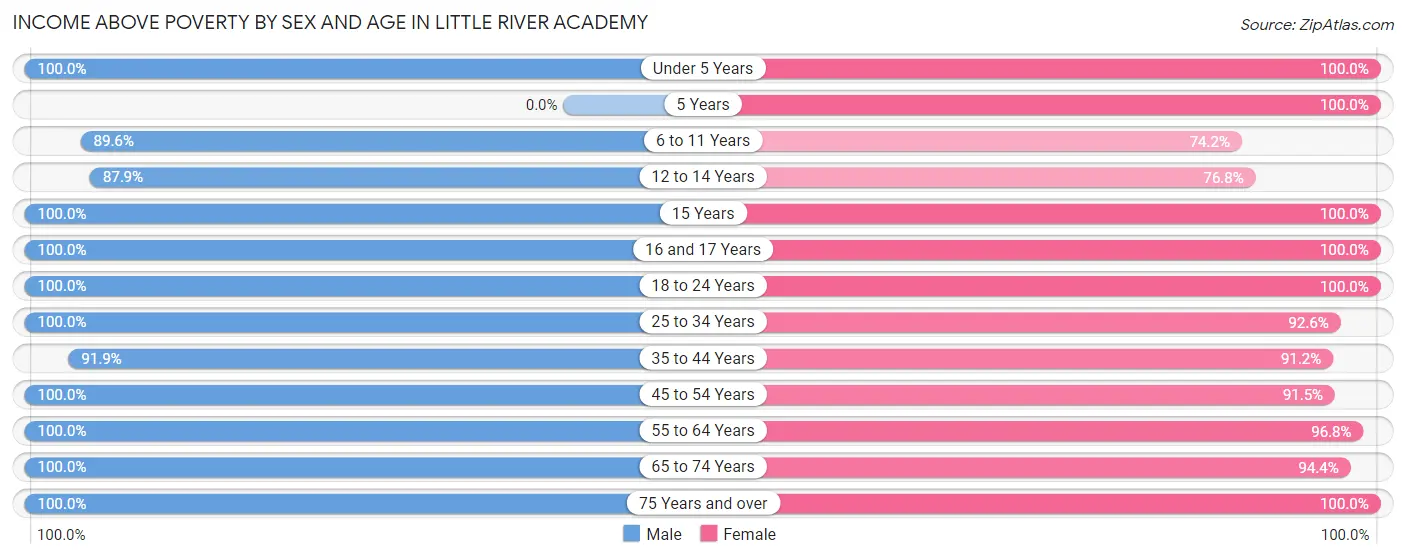
Income Above Poverty by Sex and Age in Little River Academy
According to the poverty statistics in Little River Academy, males aged under 5 years and females aged under 5 years are the age groups that are most secure financially, with 100.0% of males and 100.0% of females in these age groups living above the poverty line.
| Age Bracket | Male | Female |
| Under 5 Years | 142 (100.0%) | 115 (100.0%) |
| 5 Years | 0 (0.0%) | 24 (100.0%) |
| 6 to 11 Years | 112 (89.6%) | 121 (74.2%) |
| 12 to 14 Years | 58 (87.9%) | 43 (76.8%) |
| 15 Years | 11 (100.0%) | 17 (100.0%) |
| 16 and 17 Years | 19 (100.0%) | 13 (100.0%) |
| 18 to 24 Years | 151 (100.0%) | 26 (100.0%) |
| 25 to 34 Years | 167 (100.0%) | 200 (92.6%) |
| 35 to 44 Years | 158 (91.9%) | 145 (91.2%) |
| 45 to 54 Years | 97 (100.0%) | 108 (91.5%) |
| 55 to 64 Years | 105 (100.0%) | 121 (96.8%) |
| 65 to 74 Years | 73 (100.0%) | 51 (94.4%) |
| 75 Years and over | 54 (100.0%) | 82 (100.0%) |
| Total | 1,147 (96.3%) | 1,066 (91.3%) |
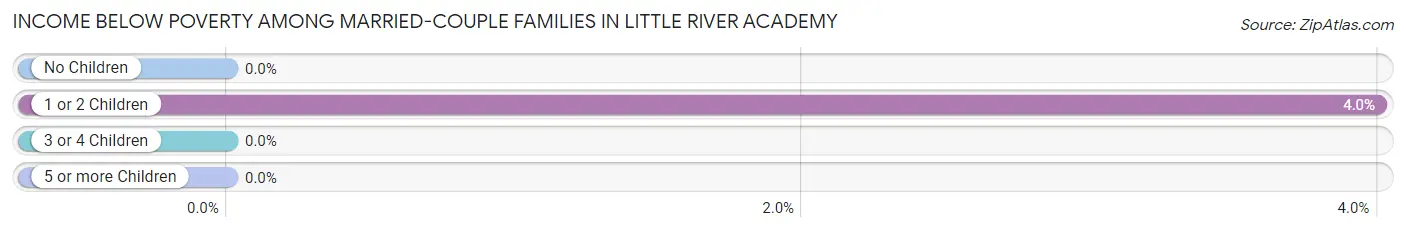
Income Below Poverty Among Married-Couple Families in Little River Academy
The poverty statistics for married-couple families in Little River Academy show that 1.8% or 7 of the total 380 families live below the poverty line. Families with 1 or 2 children have the highest poverty rate of 4.0%, comprising of 7 families. On the other hand, families with no children have the lowest poverty rate of 0.0%, which includes 0 families.
| Children | Above Poverty | Below Poverty |
| No Children | 167 (100.0%) | 0 (0.0%) |
| 1 or 2 Children | 168 (96.0%) | 7 (4.0%) |
| 3 or 4 Children | 38 (100.0%) | 0 (0.0%) |
| 5 or more Children | 0 (0.0%) | 0 (0.0%) |
| Total | 373 (98.2%) | 7 (1.8%) |
Income Below Poverty Among Single-Parent Households in Little River Academy
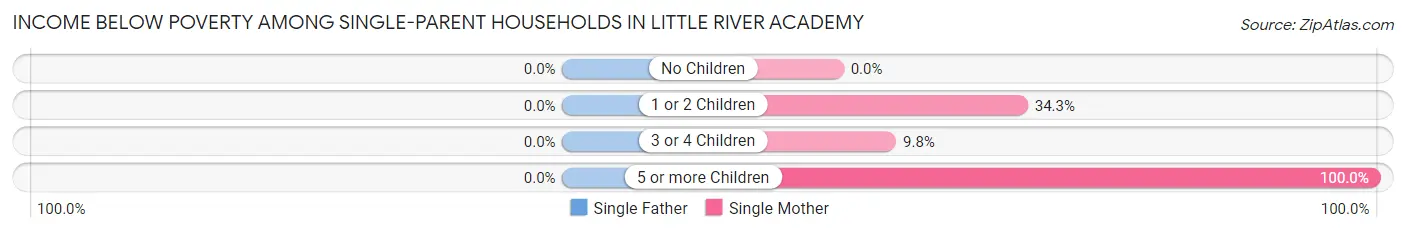
| Children | Single Father | Single Mother |
| No Children | 0 (0.0%) | 0 (0.0%) |
| 1 or 2 Children | 0 (0.0%) | 12 (34.3%) |
| 3 or 4 Children | 0 (0.0%) | 4 (9.8%) |
| 5 or more Children | 0 (0.0%) | 7 (100.0%) |
| Total | 0 (0.0%) | 23 (16.0%) |
Income Below Poverty Among Married-Couple vs Single-Parent Households in Little River Academy
The poverty data for Little River Academy shows that 7 of the married-couple family households (1.8%) and 23 of the single-parent households (11.6%) are living below the poverty level. Within the married-couple family households, those with 1 or 2 children have the highest poverty rate, with 7 households (4.0%) falling below the poverty line. Among the single-parent households, those with 5 or more children have the highest poverty rate, with 7 household (58.3%) living below poverty.
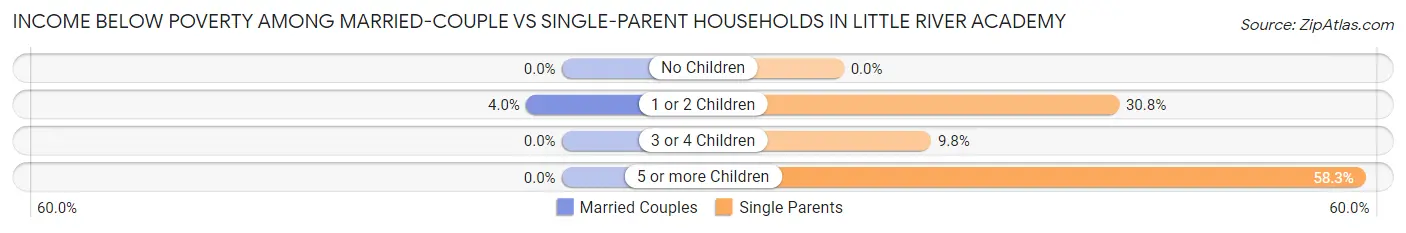
| Children | Married-Couple Families | Single-Parent Households |
| No Children | 0 (0.0%) | 0 (0.0%) |
| 1 or 2 Children | 7 (4.0%) | 12 (30.8%) |
| 3 or 4 Children | 0 (0.0%) | 4 (9.8%) |
| 5 or more Children | 0 (0.0%) | 7 (58.3%) |
| Total | 7 (1.8%) | 23 (11.6%) |
Race in Little River Academy
The most populous races in Little River Academy are White / Caucasian (1,689 | 71.2%), Hispanic or Latino (637 | 26.8%), and Two or more Races (323 | 13.6%).
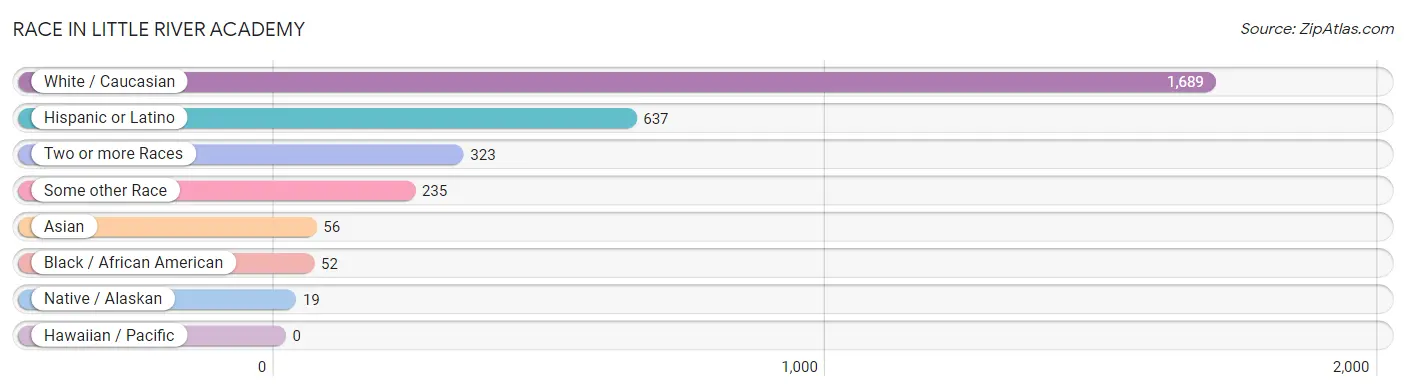
| Race | # Population | % Population |
| Asian | 56 | 2.4% |
| Black / African American | 52 | 2.2% |
| Hawaiian / Pacific | 0 | 0.0% |
| Hispanic or Latino | 637 | 26.8% |
| Native / Alaskan | 19 | 0.8% |
| White / Caucasian | 1,689 | 71.2% |
| Two or more Races | 323 | 13.6% |
| Some other Race | 235 | 9.9% |
| Total | 2,374 | 100.0% |
Ancestry in Little River Academy
The most populous ancestries reported in Little River Academy are Mexican (551 | 23.2%), German (375 | 15.8%), Irish (256 | 10.8%), American (231 | 9.7%), and Czech (198 | 8.3%), together accounting for 67.9% of all Little River Academy residents.
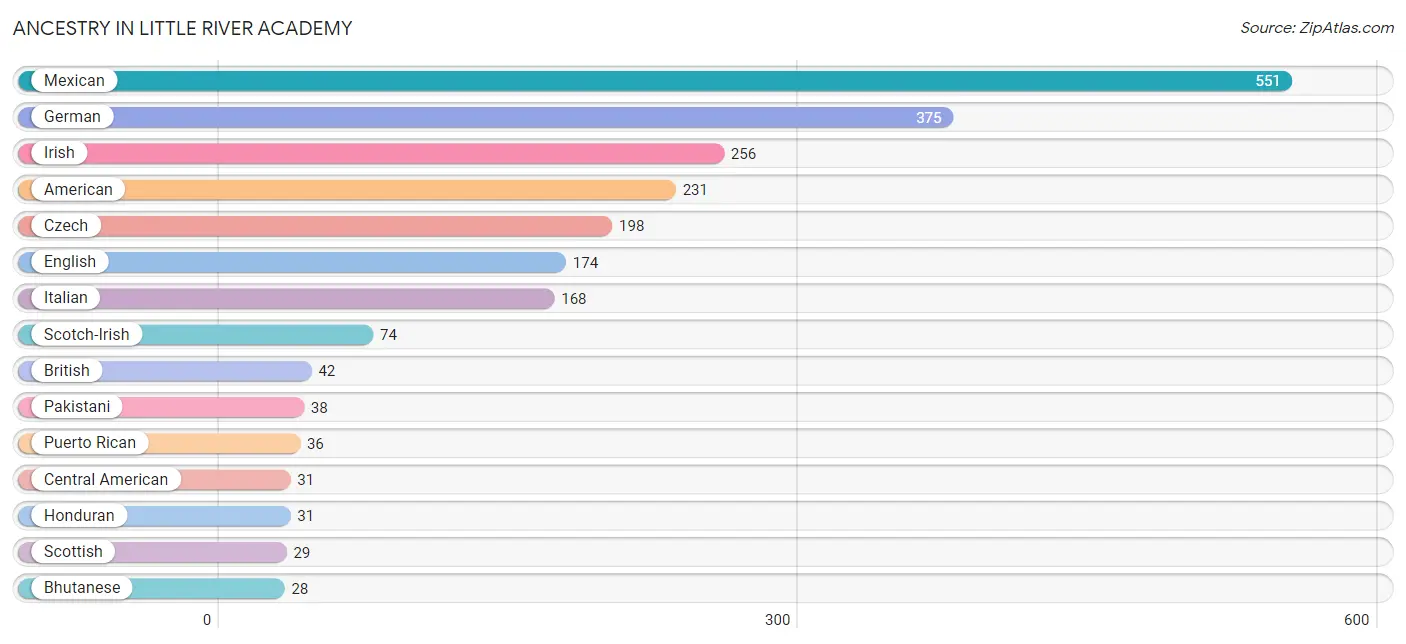
| Ancestry | # Population | % Population |
| American | 231 | 9.7% |
| Arab | 18 | 0.8% |
| Bhutanese | 28 | 1.2% |
| British | 42 | 1.8% |
| Burmese | 3 | 0.1% |
| Cajun | 13 | 0.5% |
| Central American | 31 | 1.3% |
| Cheyenne | 6 | 0.3% |
| Chickasaw | 8 | 0.3% |
| Choctaw | 6 | 0.3% |
| Czech | 198 | 8.3% |
| Danish | 24 | 1.0% |
| Dutch | 12 | 0.5% |
| Eastern European | 4 | 0.2% |
| English | 174 | 7.3% |
| European | 21 | 0.9% |
| French | 8 | 0.3% |
| French Canadian | 5 | 0.2% |
| German | 375 | 15.8% |
| Honduran | 31 | 1.3% |
| Hungarian | 6 | 0.3% |
| Irish | 256 | 10.8% |
| Italian | 168 | 7.1% |
| Jordanian | 4 | 0.2% |
| Lebanese | 11 | 0.5% |
| Mexican | 551 | 23.2% |
| Mexican American Indian | 19 | 0.8% |
| Norwegian | 21 | 0.9% |
| Pakistani | 38 | 1.6% |
| Polish | 13 | 0.5% |
| Puerto Rican | 36 | 1.5% |
| Scandinavian | 4 | 0.2% |
| Scotch-Irish | 74 | 3.1% |
| Scottish | 29 | 1.2% |
| Spaniard | 19 | 0.8% |
| Swedish | 11 | 0.5% |
| Thai | 15 | 0.6% |
| Welsh | 2 | 0.1% |
| Yugoslavian | 7 | 0.3% | View All 39 Rows |
Immigrants in Little River Academy
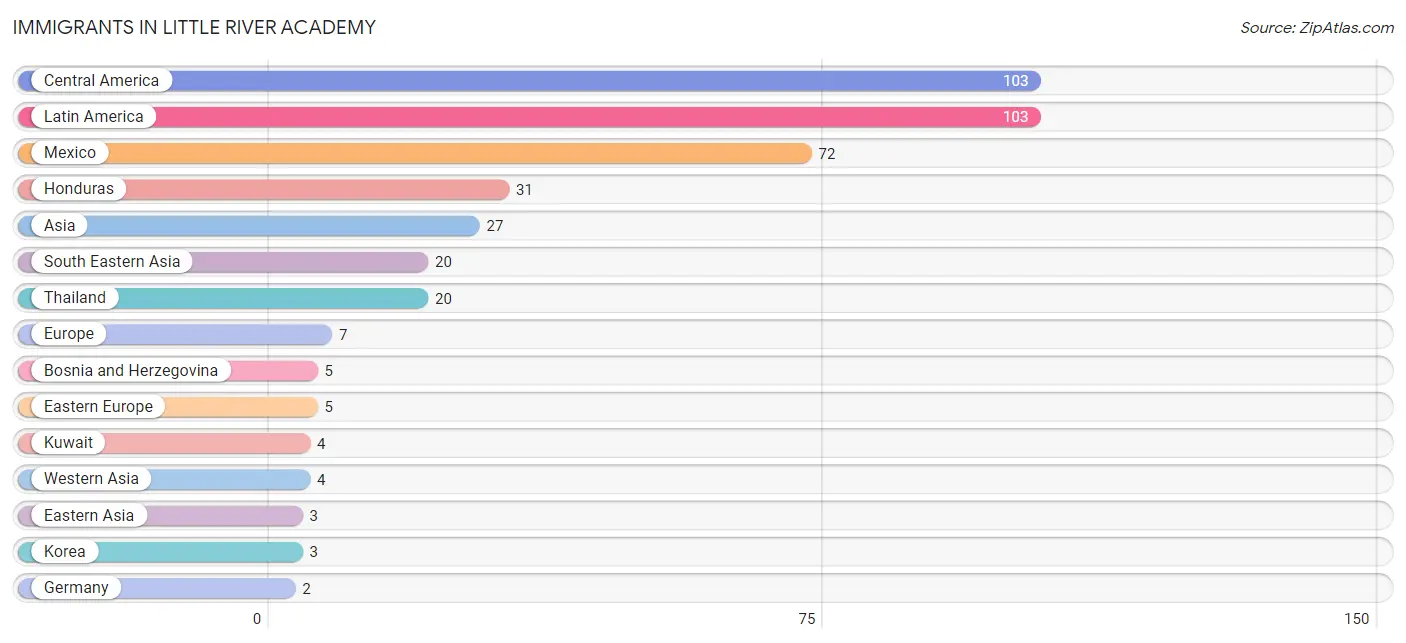
The most numerous immigrant groups reported in Little River Academy came from Central America (103 | 4.3%), Latin America (103 | 4.3%), Mexico (72 | 3.0%), Honduras (31 | 1.3%), and Asia (27 | 1.1%), together accounting for 14.2% of all Little River Academy residents.
| Immigration Origin | # Population | % Population |
| Asia | 27 | 1.1% |
| Bosnia and Herzegovina | 5 | 0.2% |
| Central America | 103 | 4.3% |
| Eastern Asia | 3 | 0.1% |
| Eastern Europe | 5 | 0.2% |
| Europe | 7 | 0.3% |
| Germany | 2 | 0.1% |
| Honduras | 31 | 1.3% |
| Korea | 3 | 0.1% |
| Kuwait | 4 | 0.2% |
| Latin America | 103 | 4.3% |
| Mexico | 72 | 3.0% |
| South Eastern Asia | 20 | 0.8% |
| Thailand | 20 | 0.8% |
| Western Asia | 4 | 0.2% |
| Western Europe | 2 | 0.1% | View All 16 Rows |
Sex and Age in Little River Academy
Sex and Age in Little River Academy
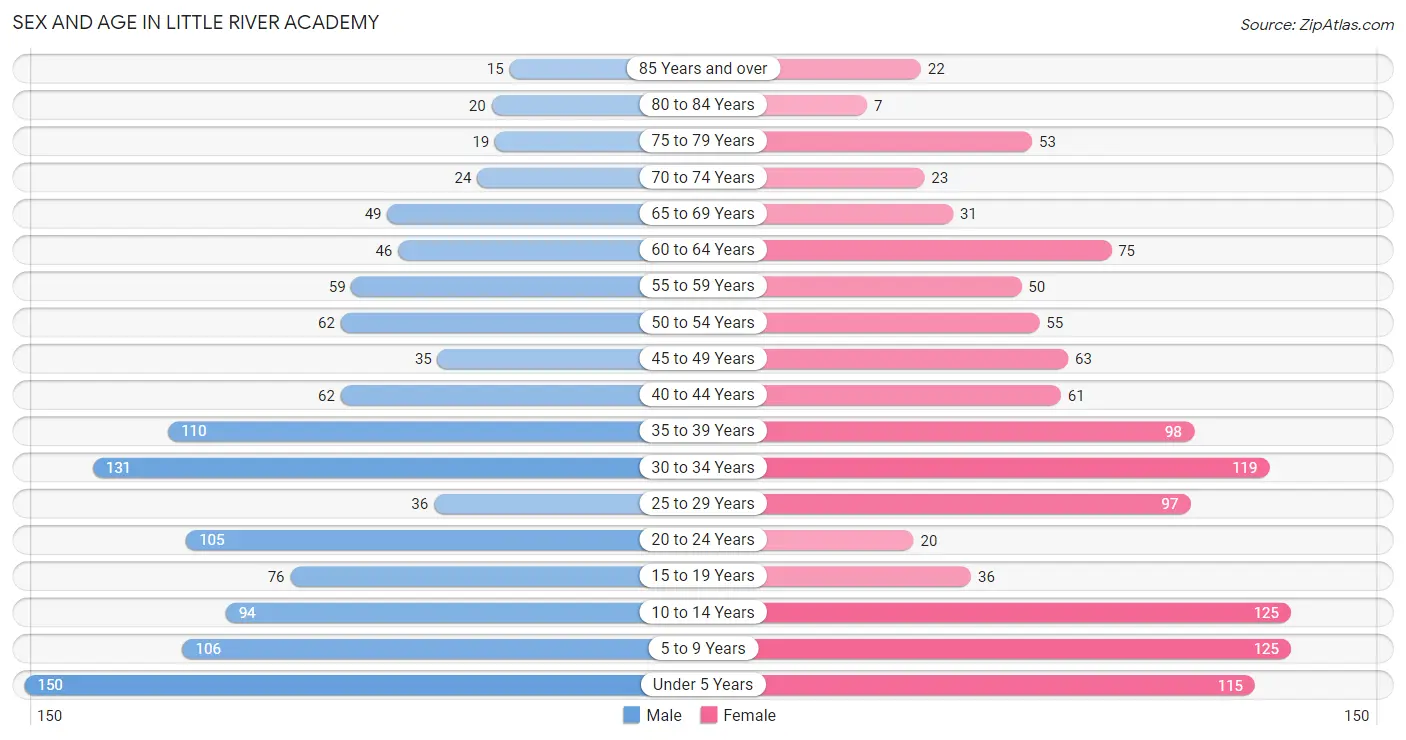
The most populous age groups in Little River Academy are Under 5 Years (150 | 12.5%) for men and 5 to 9 Years (125 | 10.6%) for women.
| Age Bracket | Male | Female |
| Under 5 Years | 150 (12.5%) | 115 (9.8%) |
| 5 to 9 Years | 106 (8.8%) | 125 (10.6%) |
| 10 to 14 Years | 94 (7.8%) | 125 (10.6%) |
| 15 to 19 Years | 76 (6.3%) | 36 (3.1%) |
| 20 to 24 Years | 105 (8.8%) | 20 (1.7%) |
| 25 to 29 Years | 36 (3.0%) | 97 (8.3%) |
| 30 to 34 Years | 131 (10.9%) | 119 (10.1%) |
| 35 to 39 Years | 110 (9.2%) | 98 (8.3%) |
| 40 to 44 Years | 62 (5.2%) | 61 (5.2%) |
| 45 to 49 Years | 35 (2.9%) | 63 (5.4%) |
| 50 to 54 Years | 62 (5.2%) | 55 (4.7%) |
| 55 to 59 Years | 59 (4.9%) | 50 (4.3%) |
| 60 to 64 Years | 46 (3.8%) | 75 (6.4%) |
| 65 to 69 Years | 49 (4.1%) | 31 (2.6%) |
| 70 to 74 Years | 24 (2.0%) | 23 (2.0%) |
| 75 to 79 Years | 19 (1.6%) | 53 (4.5%) |
| 80 to 84 Years | 20 (1.7%) | 7 (0.6%) |
| 85 Years and over | 15 (1.3%) | 22 (1.9%) |
| Total | 1,199 (100.0%) | 1,175 (100.0%) |
Families and Households in Little River Academy
Median Family Size in Little River Academy
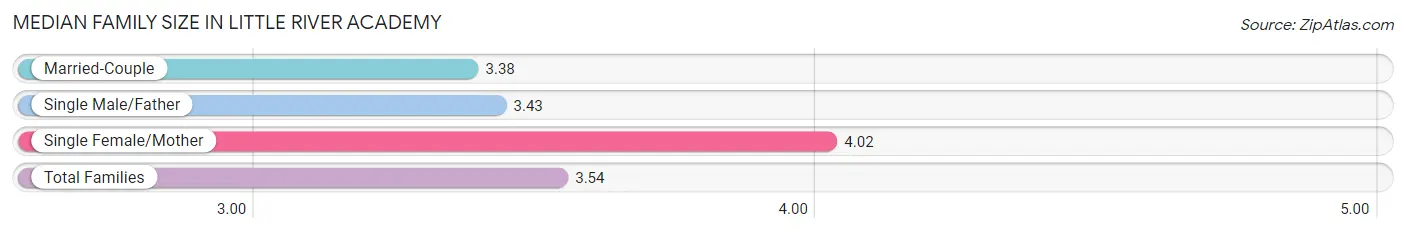
The median family size in Little River Academy is 3.54 persons per family, with single female/mother families (144 | 24.9%) accounting for the largest median family size of 4.02 persons per family. On the other hand, married-couple families (380 | 65.7%) represent the smallest median family size with 3.38 persons per family.
| Family Type | # Families | Family Size |
| Married-Couple | 380 (65.7%) | 3.38 |
| Single Male/Father | 54 (9.3%) | 3.43 |
| Single Female/Mother | 144 (24.9%) | 4.02 |
| Total Families | 578 (100.0%) | 3.54 |
Median Household Size in Little River Academy
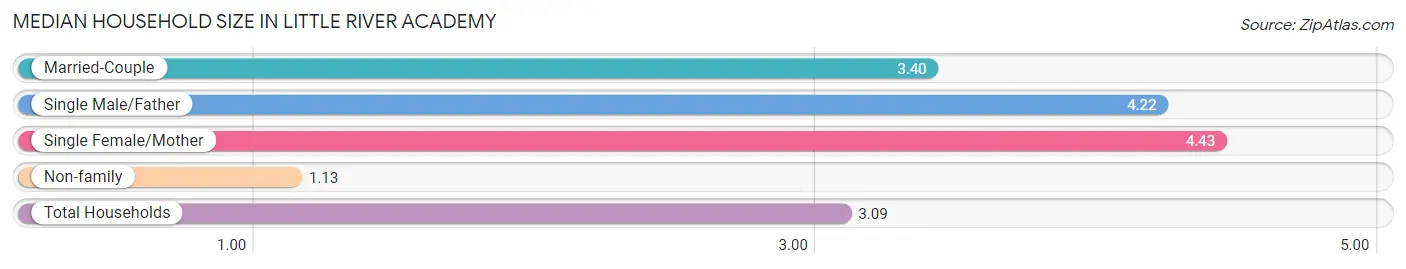
The median household size in Little River Academy is 3.09 persons per household, with single female/mother households (144 | 18.8%) accounting for the largest median household size of 4.43 persons per household. non-family households (190 | 24.7%) represent the smallest median household size with 1.13 persons per household.
| Household Type | # Households | Household Size |
| Married-Couple | 380 (49.5%) | 3.40 |
| Single Male/Father | 54 (7.0%) | 4.22 |
| Single Female/Mother | 144 (18.8%) | 4.43 |
| Non-family | 190 (24.7%) | 1.13 |
| Total Households | 768 (100.0%) | 3.09 |
Household Size by Marriage Status in Little River Academy
Out of a total of 768 households in Little River Academy, 578 (75.3%) are family households, while 190 (24.7%) are nonfamily households. The most numerous type of family households are 2-person households, comprising 176, and the most common type of nonfamily households are 1-person households, comprising 166.
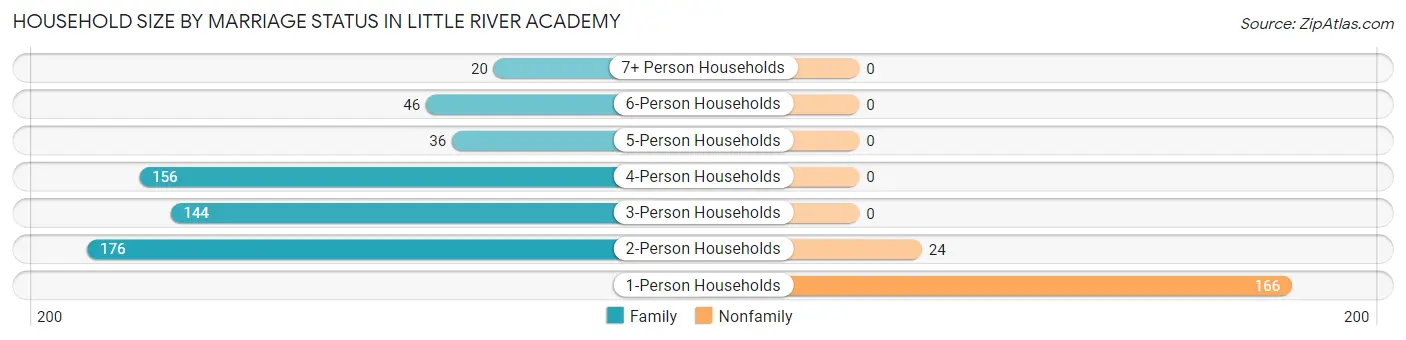
| Household Size | Family Households | Nonfamily Households |
| 1-Person Households | - | 166 (21.6%) |
| 2-Person Households | 176 (22.9%) | 24 (3.1%) |
| 3-Person Households | 144 (18.8%) | 0 (0.0%) |
| 4-Person Households | 156 (20.3%) | 0 (0.0%) |
| 5-Person Households | 36 (4.7%) | 0 (0.0%) |
| 6-Person Households | 46 (6.0%) | 0 (0.0%) |
| 7+ Person Households | 20 (2.6%) | 0 (0.0%) |
| Total | 578 (75.3%) | 190 (24.7%) |
Female Fertility in Little River Academy
Fertility by Age in Little River Academy
Average fertility rate in Little River Academy is 44.0 births per 1,000 women. Women in the age bracket of 20 to 34 years have the highest fertility rate with 85.0 births per 1,000 women. Women in the age bracket of 20 to 34 years acount for 90.9% of all women with births.
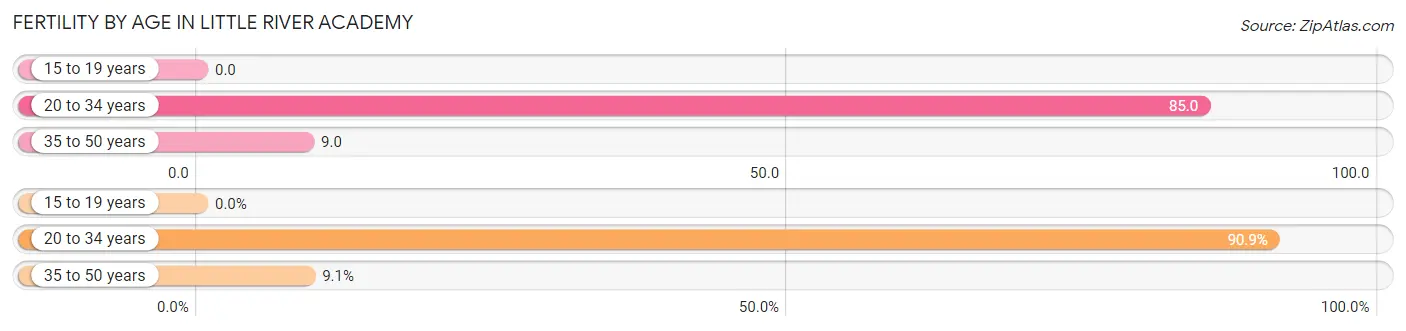
| Age Bracket | Women with Births | Births / 1,000 Women |
| 15 to 19 years | 0 (0.0%) | 0.0 |
| 20 to 34 years | 20 (90.9%) | 85.0 |
| 35 to 50 years | 2 (9.1%) | 9.0 |
| Total | 22 (100.0%) | 44.0 |
Fertility by Age by Marriage Status in Little River Academy
81.8% of women with births (22) in Little River Academy are married. The highest percentage of unmarried women with births falls into 20 to 34 years age bracket with 20.0% of them unmarried at the time of birth, while the lowest percentage of unmarried women with births belong to 35 to 50 years age bracket with 0.0% of them unmarried.
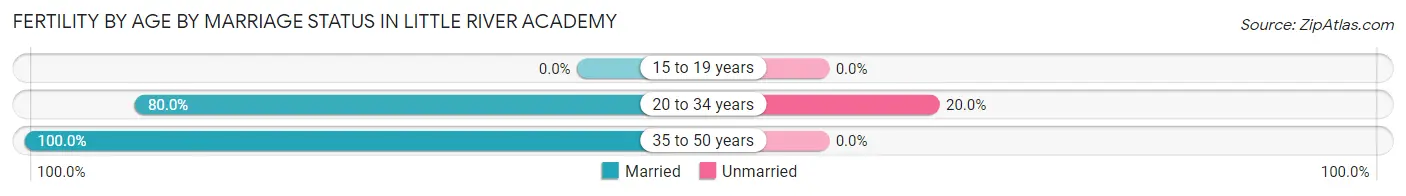
| Age Bracket | Married | Unmarried |
| 15 to 19 years | 0 (0.0%) | 0 (0.0%) |
| 20 to 34 years | 16 (80.0%) | 4 (20.0%) |
| 35 to 50 years | 2 (100.0%) | 0 (0.0%) |
| Total | 18 (81.8%) | 4 (18.2%) |
Fertility by Education in Little River Academy
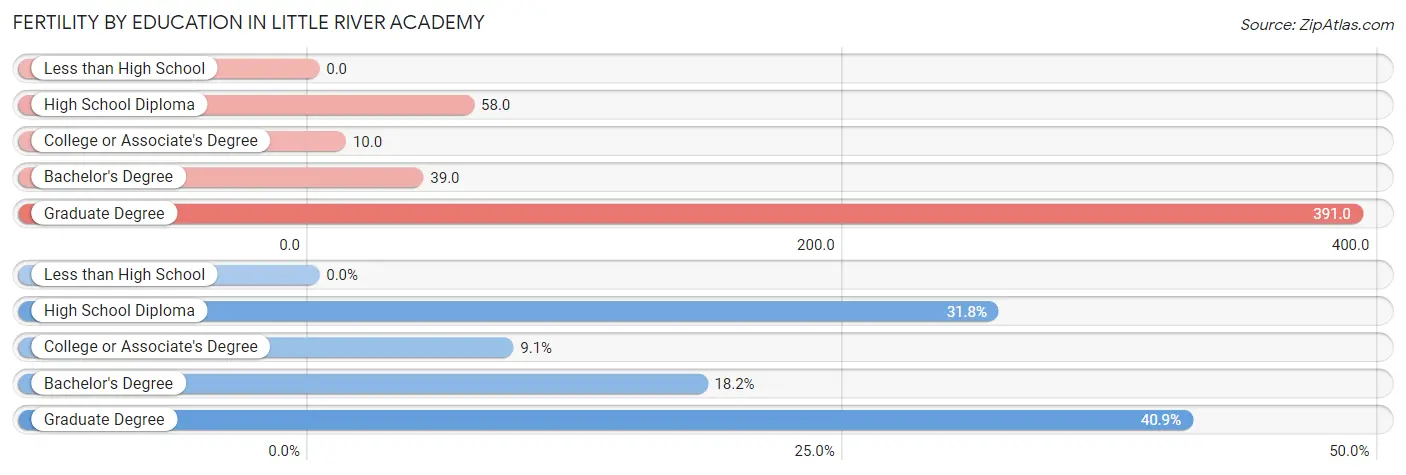
| Educational Attainment | Women with Births | Births / 1,000 Women |
| Less than High School | 0 (0.0%) | 0.0 |
| High School Diploma | 7 (31.8%) | 58.0 |
| College or Associate's Degree | 2 (9.1%) | 10.0 |
| Bachelor's Degree | 4 (18.2%) | 39.0 |
| Graduate Degree | 9 (40.9%) | 391.0 |
| Total | 22 (100.0%) | 44.0 |
Fertility by Education by Marriage Status in Little River Academy
18.2% of women with births in Little River Academy are unmarried. Women with the educational attainment of high school diploma are most likely to be married with 100.0% of them married at childbirth, while women with the educational attainment of bachelor's degree are least likely to be married with 100.0% of them unmarried at childbirth.
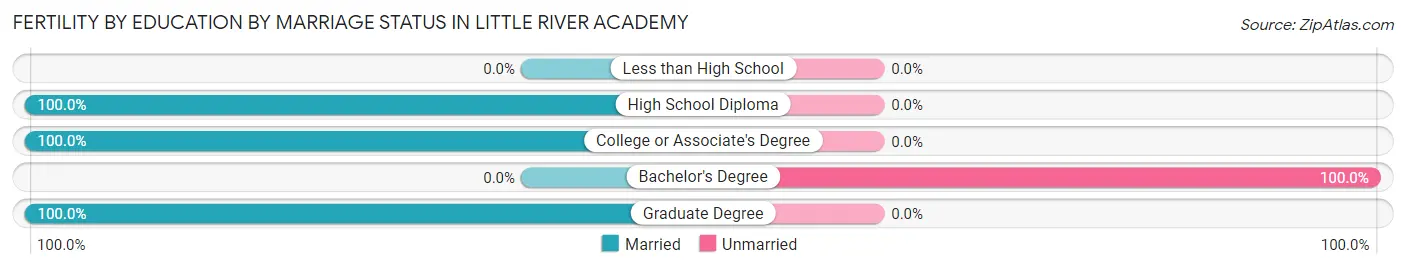
| Educational Attainment | Married | Unmarried |
| Less than High School | 0 (0.0%) | 0 (0.0%) |
| High School Diploma | 7 (100.0%) | 0 (0.0%) |
| College or Associate's Degree | 2 (100.0%) | 0 (0.0%) |
| Bachelor's Degree | 0 (0.0%) | 4 (100.0%) |
| Graduate Degree | 9 (100.0%) | 0 (0.0%) |
| Total | 18 (81.8%) | 4 (18.2%) |
Employment Characteristics in Little River Academy
Employment by Class of Employer in Little River Academy
Among the 1,098 employed individuals in Little River Academy, private company employees (643 | 58.6%), not-for-profit organizations (214 | 19.5%), and local government employees (78 | 7.1%) make up the most common classes of employment.
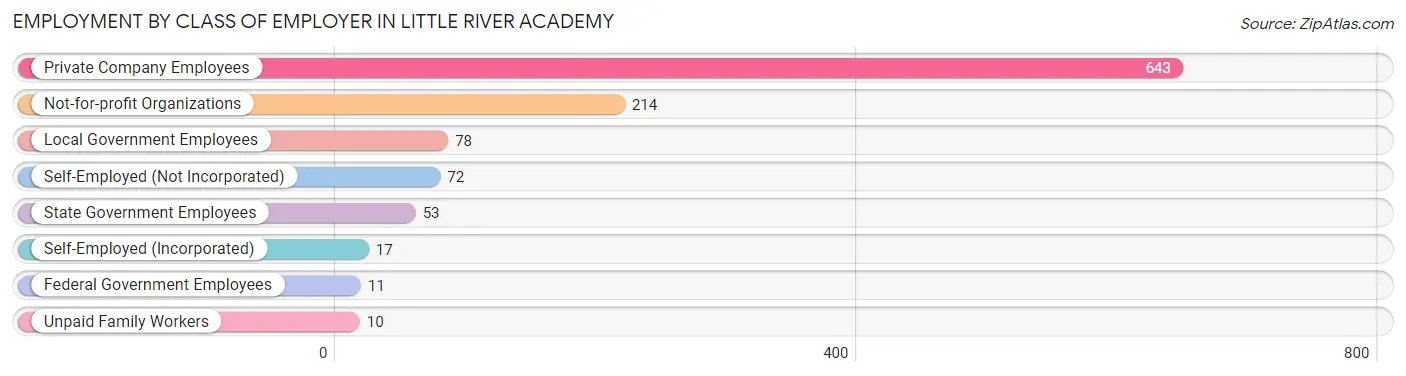
| Employer Class | # Employees | % Employees |
| Private Company Employees | 643 | 58.6% |
| Self-Employed (Incorporated) | 17 | 1.5% |
| Self-Employed (Not Incorporated) | 72 | 6.6% |
| Not-for-profit Organizations | 214 | 19.5% |
| Local Government Employees | 78 | 7.1% |
| State Government Employees | 53 | 4.8% |
| Federal Government Employees | 11 | 1.0% |
| Unpaid Family Workers | 10 | 0.9% |
| Total | 1,098 | 100.0% |
Employment Status by Age in Little River Academy
According to the labor force statistics for Little River Academy, out of the total population over 16 years of age (1,631), 72.4% or 1,181 individuals are in the labor force, with 6.8% or 80 of them unemployed. The age group with the highest labor force participation rate is 20 to 24 years, with 100.0% or 125 individuals in the labor force. Within the labor force, the 25 to 29 years age range has the highest percentage of unemployed individuals, with 24.4% or 30 of them being unemployed.
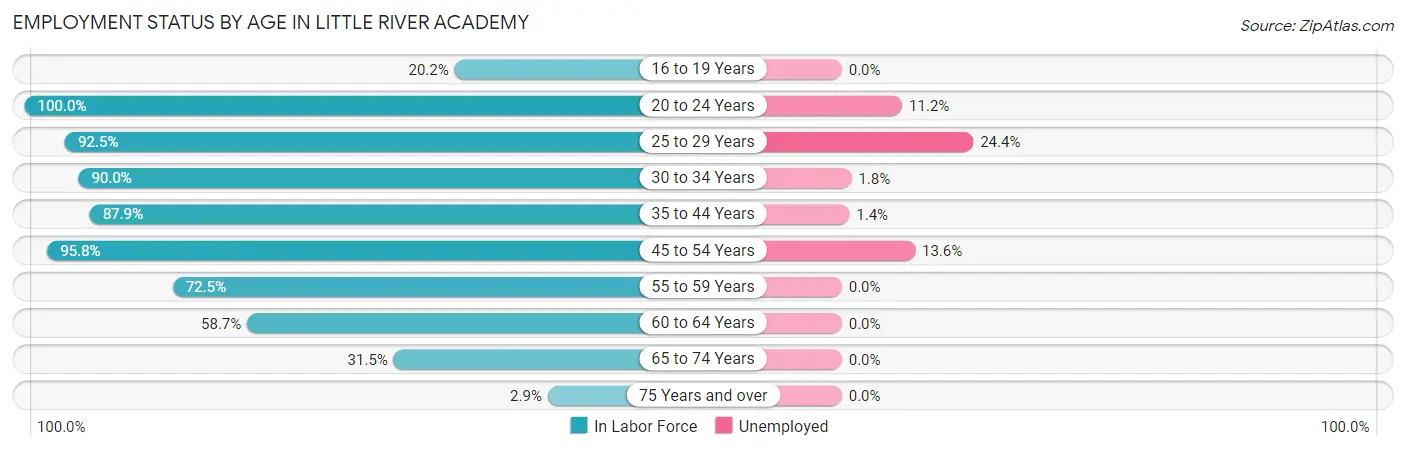
| Age Bracket | In Labor Force | Unemployed |
| 16 to 19 Years | 17 (20.2%) | 0 (0.0%) |
| 20 to 24 Years | 125 (100.0%) | 14 (11.2%) |
| 25 to 29 Years | 123 (92.5%) | 30 (24.4%) |
| 30 to 34 Years | 225 (90.0%) | 4 (1.8%) |
| 35 to 44 Years | 291 (87.9%) | 4 (1.4%) |
| 45 to 54 Years | 206 (95.8%) | 28 (13.6%) |
| 55 to 59 Years | 79 (72.5%) | 0 (0.0%) |
| 60 to 64 Years | 71 (58.7%) | 0 (0.0%) |
| 65 to 74 Years | 40 (31.5%) | 0 (0.0%) |
| 75 Years and over | 4 (2.9%) | 0 (0.0%) |
| Total | 1,181 (72.4%) | 80 (6.8%) |
Employment Status by Educational Attainment in Little River Academy
According to labor force statistics for Little River Academy, 85.8% of individuals (994) out of the total population between 25 and 64 years of age (1,159) are in the labor force, with 6.7% or 67 of them being unemployed. The group with the highest labor force participation rate are those with the educational attainment of bachelor's degree or higher, with 95.7% or 225 individuals in the labor force. Within the labor force, individuals with less than high school education have the highest percentage of unemployment, with 14.9% or 20 of them being unemployed.
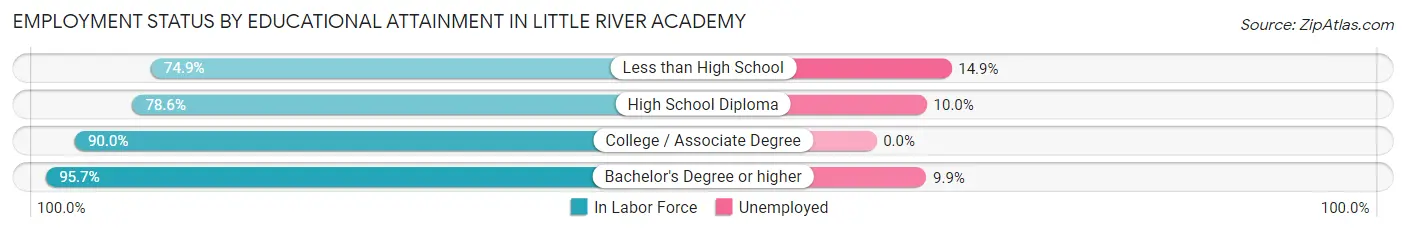
| Educational Attainment | In Labor Force | Unemployed |
| Less than High School | 134 (74.9%) | 27 (14.9%) |
| High School Diploma | 239 (78.6%) | 30 (10.0%) |
| College / Associate Degree | 397 (90.0%) | 0 (0.0%) |
| Bachelor's Degree or higher | 225 (95.7%) | 23 (9.9%) |
| Total | 994 (85.8%) | 78 (6.7%) |
Employment Occupations by Sex in Little River Academy
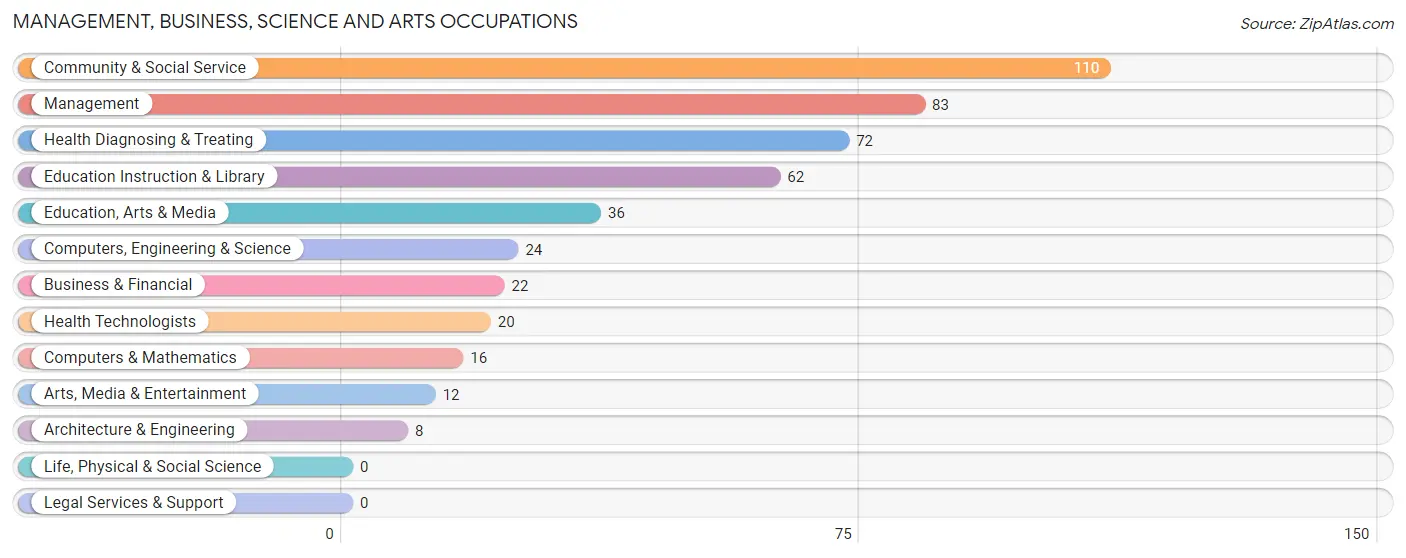
Management, Business, Science and Arts Occupations
The most common Management, Business, Science and Arts occupations in Little River Academy are Community & Social Service (110 | 10.0%), Management (83 | 7.6%), Health Diagnosing & Treating (72 | 6.6%), Education Instruction & Library (62 | 5.7%), and Education, Arts & Media (36 | 3.3%).
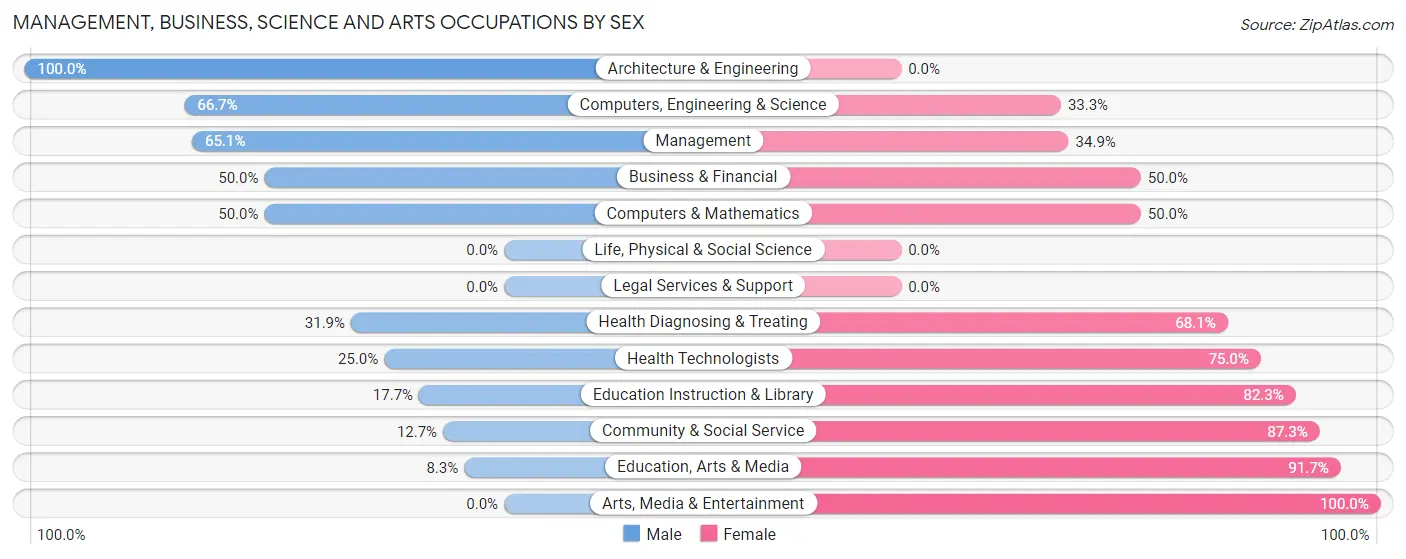
Management, Business, Science and Arts Occupations by Sex
Within the Management, Business, Science and Arts occupations in Little River Academy, the most male-oriented occupations are Architecture & Engineering (100.0%), Computers, Engineering & Science (66.7%), and Management (65.1%), while the most female-oriented occupations are Arts, Media & Entertainment (100.0%), Education, Arts & Media (91.7%), and Community & Social Service (87.3%).
| Occupation | Male | Female |
| Management | 54 (65.1%) | 29 (34.9%) |
| Business & Financial | 11 (50.0%) | 11 (50.0%) |
| Computers, Engineering & Science | 16 (66.7%) | 8 (33.3%) |
| Computers & Mathematics | 8 (50.0%) | 8 (50.0%) |
| Architecture & Engineering | 8 (100.0%) | 0 (0.0%) |
| Life, Physical & Social Science | 0 (0.0%) | 0 (0.0%) |
| Community & Social Service | 14 (12.7%) | 96 (87.3%) |
| Education, Arts & Media | 3 (8.3%) | 33 (91.7%) |
| Legal Services & Support | 0 (0.0%) | 0 (0.0%) |
| Education Instruction & Library | 11 (17.7%) | 51 (82.3%) |
| Arts, Media & Entertainment | 0 (0.0%) | 12 (100.0%) |
| Health Diagnosing & Treating | 23 (31.9%) | 49 (68.1%) |
| Health Technologists | 5 (25.0%) | 15 (75.0%) |
| Total (Category) | 118 (37.9%) | 193 (62.1%) |
| Total (Overall) | 611 (55.6%) | 487 (44.4%) |
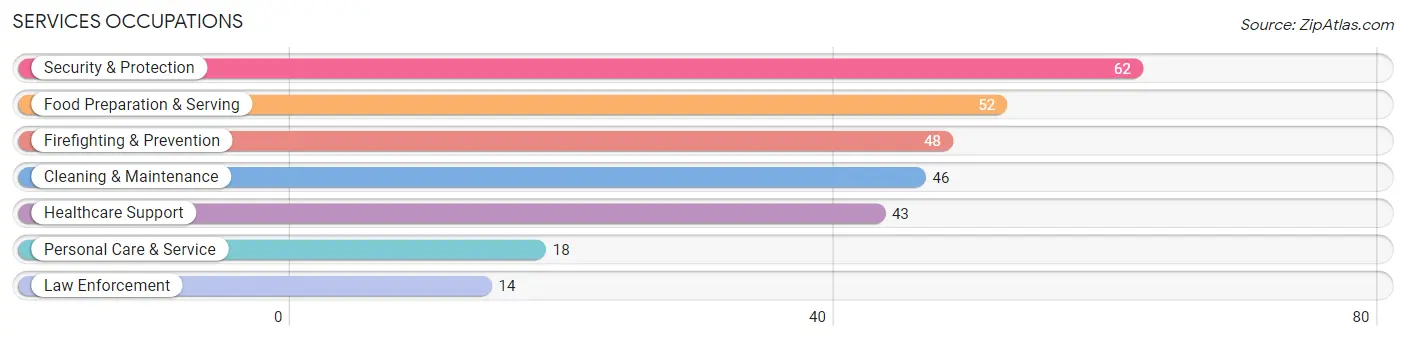
Services Occupations
The most common Services occupations in Little River Academy are Security & Protection (62 | 5.7%), Food Preparation & Serving (52 | 4.7%), Firefighting & Prevention (48 | 4.4%), Cleaning & Maintenance (46 | 4.2%), and Healthcare Support (43 | 3.9%).
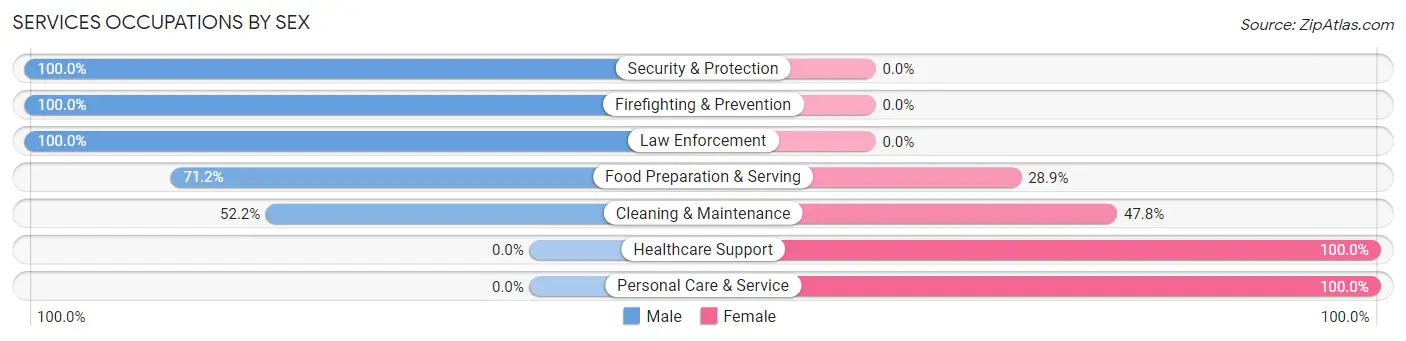
Services Occupations by Sex
Within the Services occupations in Little River Academy, the most male-oriented occupations are Security & Protection (100.0%), Firefighting & Prevention (100.0%), and Law Enforcement (100.0%), while the most female-oriented occupations are Healthcare Support (100.0%), Personal Care & Service (100.0%), and Cleaning & Maintenance (47.8%).
| Occupation | Male | Female |
| Healthcare Support | 0 (0.0%) | 43 (100.0%) |
| Security & Protection | 62 (100.0%) | 0 (0.0%) |
| Firefighting & Prevention | 48 (100.0%) | 0 (0.0%) |
| Law Enforcement | 14 (100.0%) | 0 (0.0%) |
| Food Preparation & Serving | 37 (71.2%) | 15 (28.8%) |
| Cleaning & Maintenance | 24 (52.2%) | 22 (47.8%) |
| Personal Care & Service | 0 (0.0%) | 18 (100.0%) |
| Total (Category) | 123 (55.7%) | 98 (44.3%) |
| Total (Overall) | 611 (55.6%) | 487 (44.4%) |
Sales and Office Occupations
The most common Sales and Office occupations in Little River Academy are Office & Administration (185 | 16.9%), and Sales & Related (108 | 9.8%).
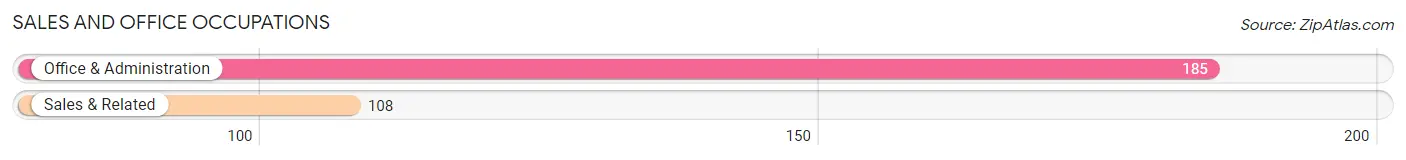
Sales and Office Occupations by Sex

| Occupation | Male | Female |
| Sales & Related | 76 (70.4%) | 32 (29.6%) |
| Office & Administration | 25 (13.5%) | 160 (86.5%) |
| Total (Category) | 101 (34.5%) | 192 (65.5%) |
| Total (Overall) | 611 (55.6%) | 487 (44.4%) |
Natural Resources, Construction and Maintenance Occupations
The most common Natural Resources, Construction and Maintenance occupations in Little River Academy are Installation, Maintenance & Repair (113 | 10.3%), Construction & Extraction (64 | 5.8%), and Farming, Fishing & Forestry (2 | 0.2%).
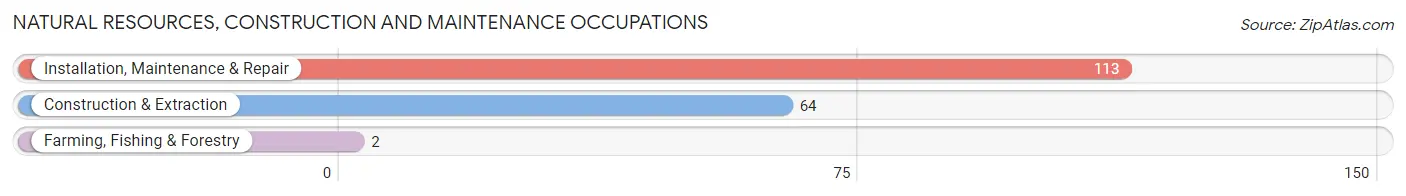
Natural Resources, Construction and Maintenance Occupations by Sex
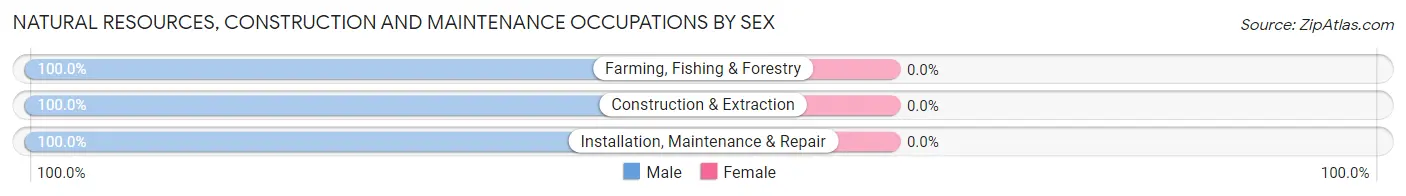
| Occupation | Male | Female |
| Farming, Fishing & Forestry | 2 (100.0%) | 0 (0.0%) |
| Construction & Extraction | 64 (100.0%) | 0 (0.0%) |
| Installation, Maintenance & Repair | 113 (100.0%) | 0 (0.0%) |
| Total (Category) | 179 (100.0%) | 0 (0.0%) |
| Total (Overall) | 611 (55.6%) | 487 (44.4%) |
Production, Transportation and Moving Occupations
The most common Production, Transportation and Moving occupations in Little River Academy are Production (35 | 3.2%), Material Moving (32 | 2.9%), and Transportation (27 | 2.5%).
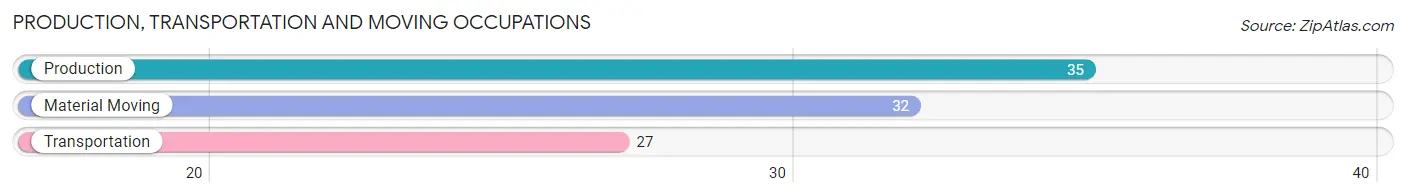
Production, Transportation and Moving Occupations by Sex
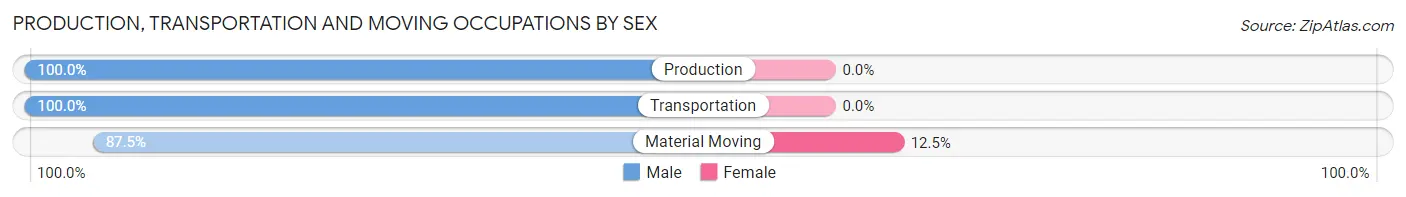
| Occupation | Male | Female |
| Production | 35 (100.0%) | 0 (0.0%) |
| Transportation | 27 (100.0%) | 0 (0.0%) |
| Material Moving | 28 (87.5%) | 4 (12.5%) |
| Total (Category) | 90 (95.7%) | 4 (4.3%) |
| Total (Overall) | 611 (55.6%) | 487 (44.4%) |
Employment Industries by Sex in Little River Academy
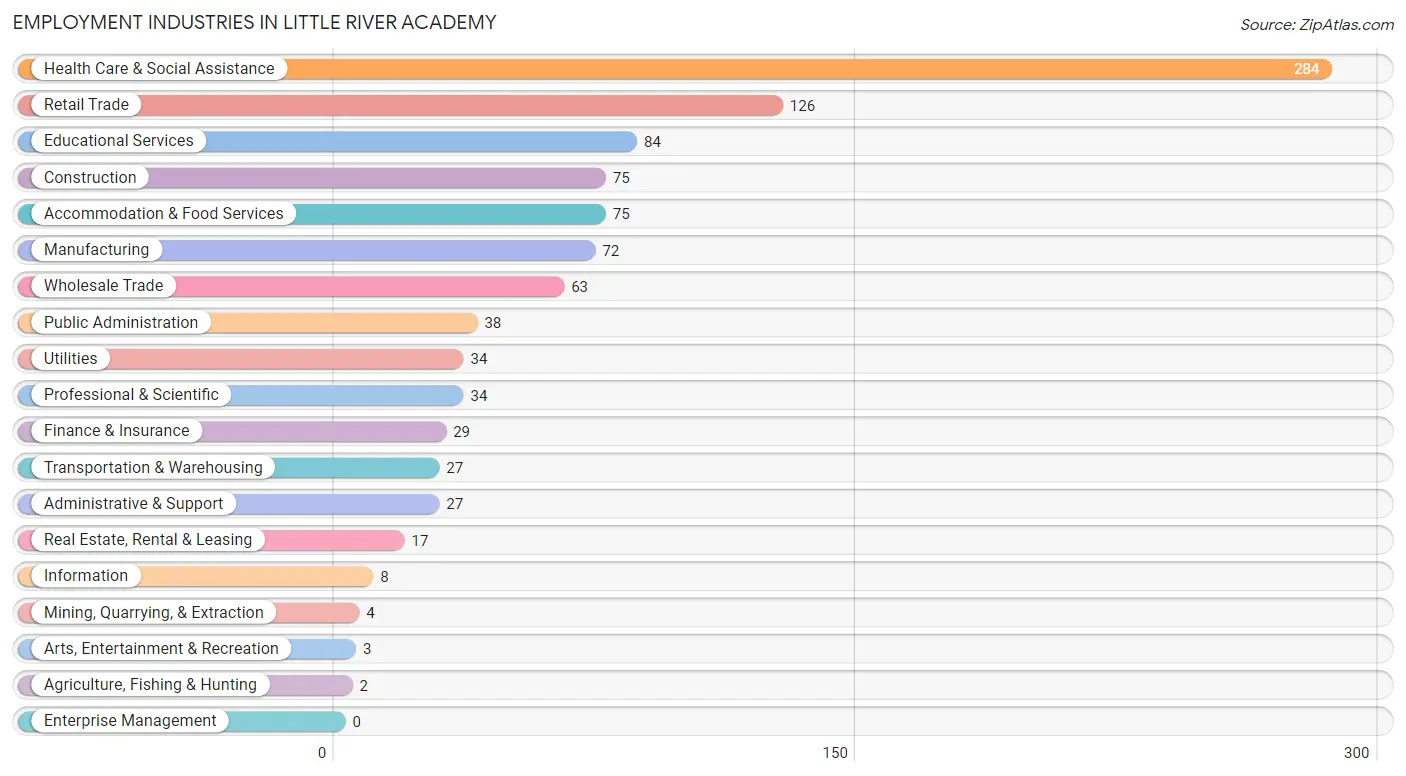
Employment Industries in Little River Academy
The major employment industries in Little River Academy include Health Care & Social Assistance (284 | 25.9%), Retail Trade (126 | 11.5%), Educational Services (84 | 7.6%), Construction (75 | 6.8%), and Accommodation & Food Services (75 | 6.8%).
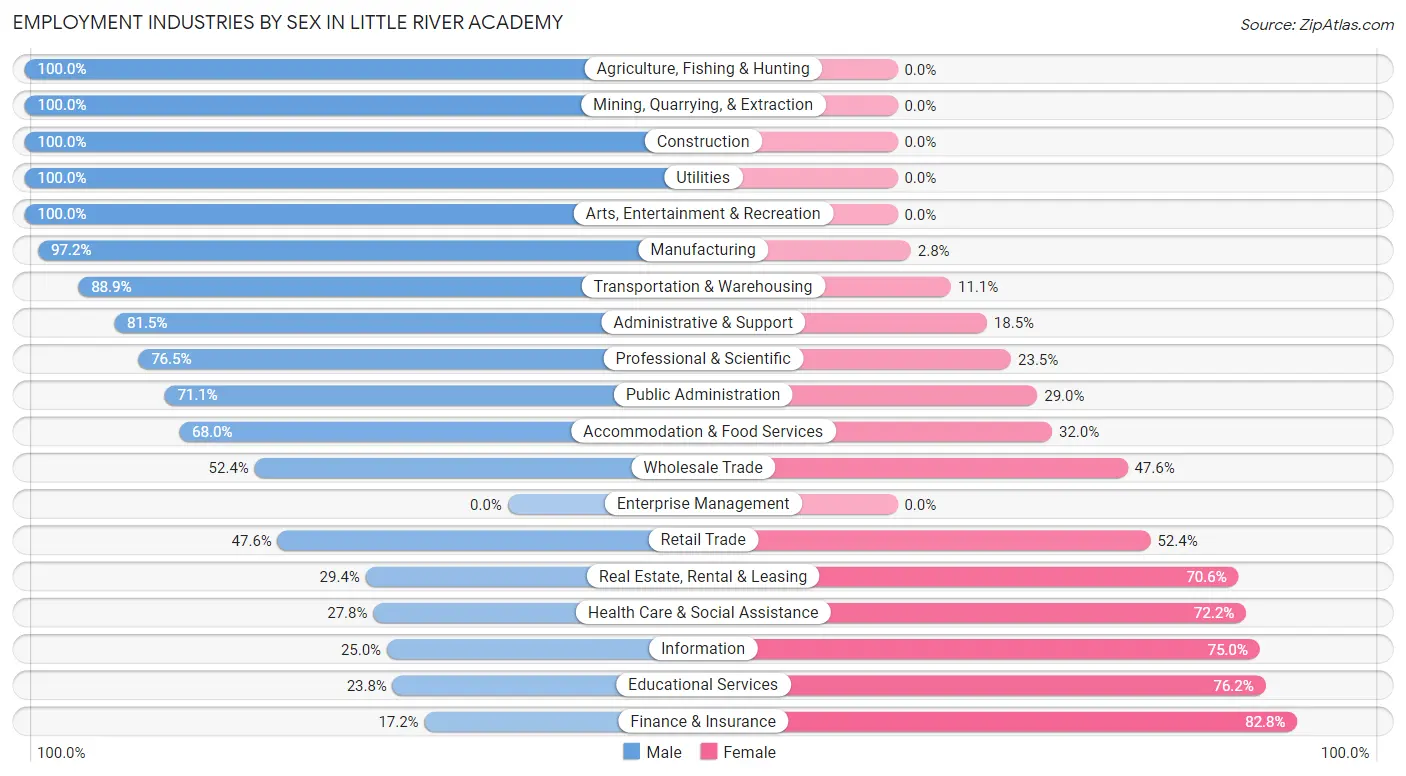
Employment Industries by Sex in Little River Academy
The Little River Academy industries that see more men than women are Agriculture, Fishing & Hunting (100.0%), Mining, Quarrying, & Extraction (100.0%), and Construction (100.0%), whereas the industries that tend to have a higher number of women are Finance & Insurance (82.8%), Educational Services (76.2%), and Information (75.0%).
| Industry | Male | Female |
| Agriculture, Fishing & Hunting | 2 (100.0%) | 0 (0.0%) |
| Mining, Quarrying, & Extraction | 4 (100.0%) | 0 (0.0%) |
| Construction | 75 (100.0%) | 0 (0.0%) |
| Manufacturing | 70 (97.2%) | 2 (2.8%) |
| Wholesale Trade | 33 (52.4%) | 30 (47.6%) |
| Retail Trade | 60 (47.6%) | 66 (52.4%) |
| Transportation & Warehousing | 24 (88.9%) | 3 (11.1%) |
| Utilities | 34 (100.0%) | 0 (0.0%) |
| Information | 2 (25.0%) | 6 (75.0%) |
| Finance & Insurance | 5 (17.2%) | 24 (82.8%) |
| Real Estate, Rental & Leasing | 5 (29.4%) | 12 (70.6%) |
| Professional & Scientific | 26 (76.5%) | 8 (23.5%) |
| Enterprise Management | 0 (0.0%) | 0 (0.0%) |
| Administrative & Support | 22 (81.5%) | 5 (18.5%) |
| Educational Services | 20 (23.8%) | 64 (76.2%) |
| Health Care & Social Assistance | 79 (27.8%) | 205 (72.2%) |
| Arts, Entertainment & Recreation | 3 (100.0%) | 0 (0.0%) |
| Accommodation & Food Services | 51 (68.0%) | 24 (32.0%) |
| Public Administration | 27 (71.1%) | 11 (28.9%) |
| Total | 611 (55.6%) | 487 (44.4%) |
Education in Little River Academy
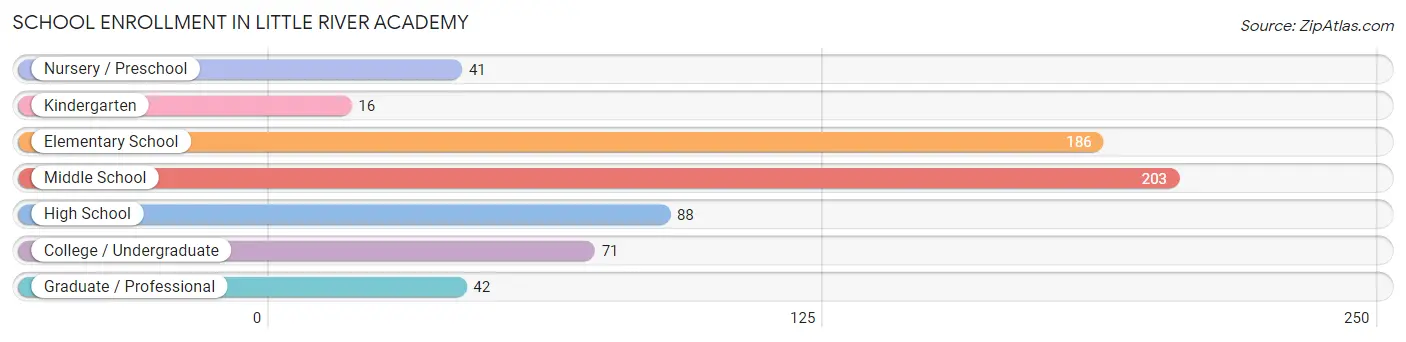
School Enrollment in Little River Academy
The most common levels of schooling among the 647 students in Little River Academy are middle school (203 | 31.4%), elementary school (186 | 28.7%), and high school (88 | 13.6%).
| School Level | # Students | % Students |
| Nursery / Preschool | 41 | 6.3% |
| Kindergarten | 16 | 2.5% |
| Elementary School | 186 | 28.7% |
| Middle School | 203 | 31.4% |
| High School | 88 | 13.6% |
| College / Undergraduate | 71 | 11.0% |
| Graduate / Professional | 42 | 6.5% |
| Total | 647 | 100.0% |
School Enrollment by Age by Funding Source in Little River Academy
Out of a total of 647 students who are enrolled in schools in Little River Academy, 85 (13.1%) attend a private institution, while the remaining 562 (86.9%) are enrolled in public schools. The age group of 3 to 4 year olds has the highest likelihood of being enrolled in private schools, with 12 (36.4% in the age bracket) enrolled. Conversely, the age group of 18 to 19 year olds has the lowest likelihood of being enrolled in a private school, with 24 (100.0% in the age bracket) attending a public institution.
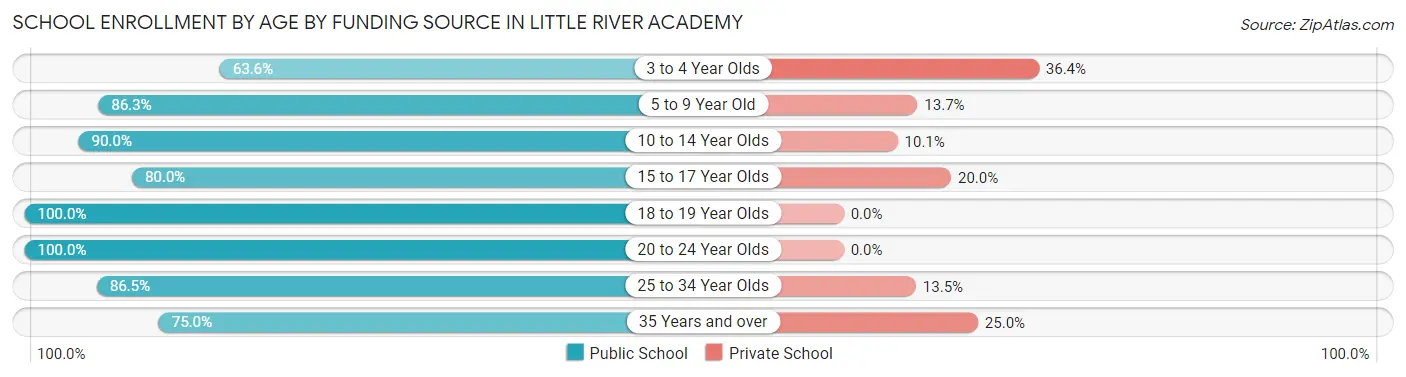
| Age Bracket | Public School | Private School |
| 3 to 4 Year Olds | 21 (63.6%) | 12 (36.4%) |
| 5 to 9 Year Old | 176 (86.3%) | 28 (13.7%) |
| 10 to 14 Year Olds | 197 (89.9%) | 22 (10.1%) |
| 15 to 17 Year Olds | 48 (80.0%) | 12 (20.0%) |
| 18 to 19 Year Olds | 24 (100.0%) | 0 (0.0%) |
| 20 to 24 Year Olds | 39 (100.0%) | 0 (0.0%) |
| 25 to 34 Year Olds | 45 (86.5%) | 7 (13.5%) |
| 35 Years and over | 12 (75.0%) | 4 (25.0%) |
| Total | 562 (86.9%) | 85 (13.1%) |
Educational Attainment by Field of Study in Little River Academy
Science & technology (67 | 21.6%), education (54 | 17.4%), business (50 | 16.1%), computers & mathematics (24 | 7.7%), and social sciences (21 | 6.8%) are the most common fields of study among 310 individuals in Little River Academy who have obtained a bachelor's degree or higher.
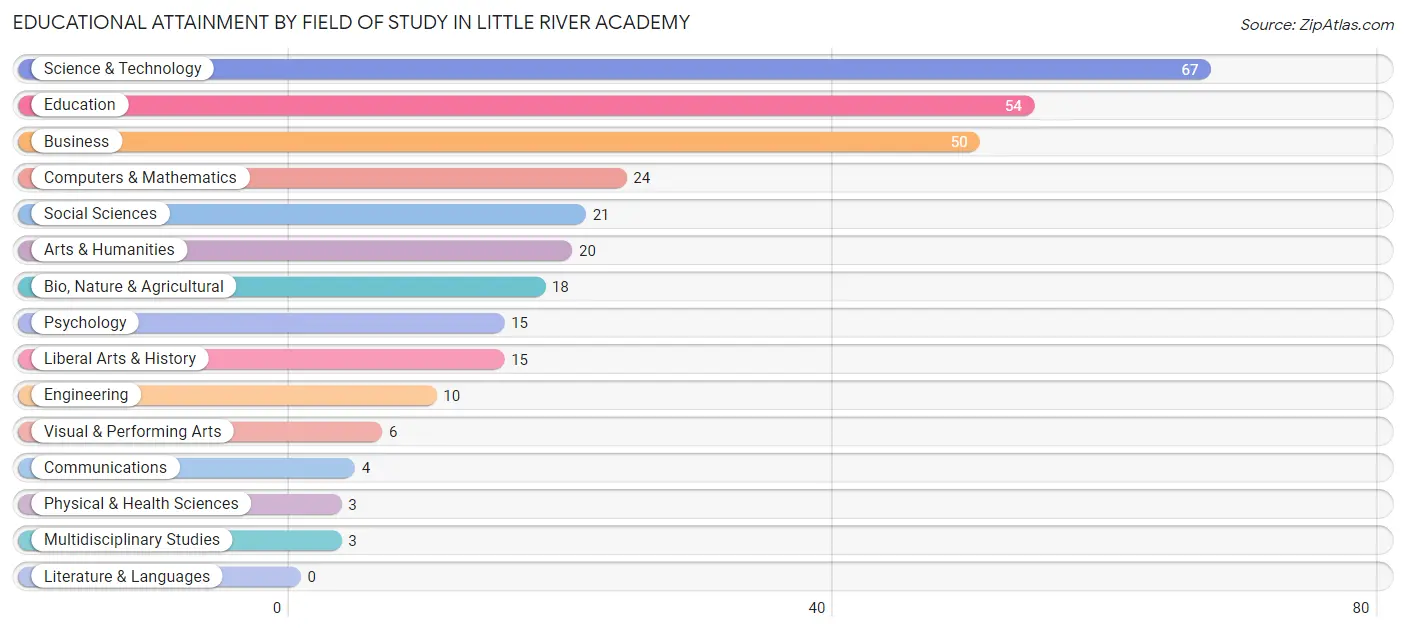
| Field of Study | # Graduates | % Graduates |
| Computers & Mathematics | 24 | 7.7% |
| Bio, Nature & Agricultural | 18 | 5.8% |
| Physical & Health Sciences | 3 | 1.0% |
| Psychology | 15 | 4.8% |
| Social Sciences | 21 | 6.8% |
| Engineering | 10 | 3.2% |
| Multidisciplinary Studies | 3 | 1.0% |
| Science & Technology | 67 | 21.6% |
| Business | 50 | 16.1% |
| Education | 54 | 17.4% |
| Literature & Languages | 0 | 0.0% |
| Liberal Arts & History | 15 | 4.8% |
| Visual & Performing Arts | 6 | 1.9% |
| Communications | 4 | 1.3% |
| Arts & Humanities | 20 | 6.5% |
| Total | 310 | 100.0% |
Transportation & Commute in Little River Academy
Vehicle Availability by Sex in Little River Academy
The most prevalent vehicle ownership categories in Little River Academy are males with 3 vehicles (203, accounting for 33.2%) and females with 3 vehicles (115, making up 41.7%).
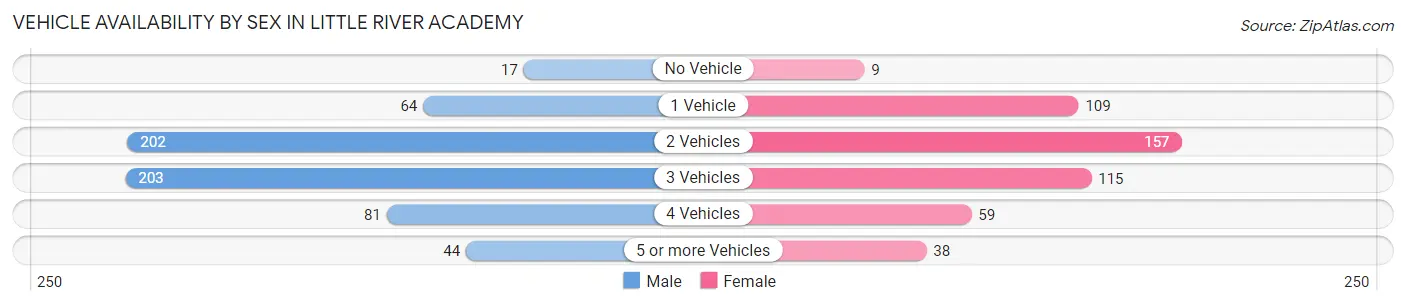
| Vehicles Available | Male | Female |
| No Vehicle | 17 (2.8%) | 9 (1.8%) |
| 1 Vehicle | 64 (10.5%) | 109 (22.4%) |
| 2 Vehicles | 202 (33.1%) | 157 (32.2%) |
| 3 Vehicles | 203 (33.2%) | 115 (23.6%) |
| 4 Vehicles | 81 (13.3%) | 59 (12.1%) |
| 5 or more Vehicles | 44 (7.2%) | 38 (7.8%) |
| Total | 611 (100.0%) | 487 (100.0%) |
Commute Time in Little River Academy
The most frequently occuring commute durations in Little River Academy are 15 to 19 minutes (334 commuters, 32.9%), 20 to 24 minutes (220 commuters, 21.7%), and 10 to 14 minutes (160 commuters, 15.8%).
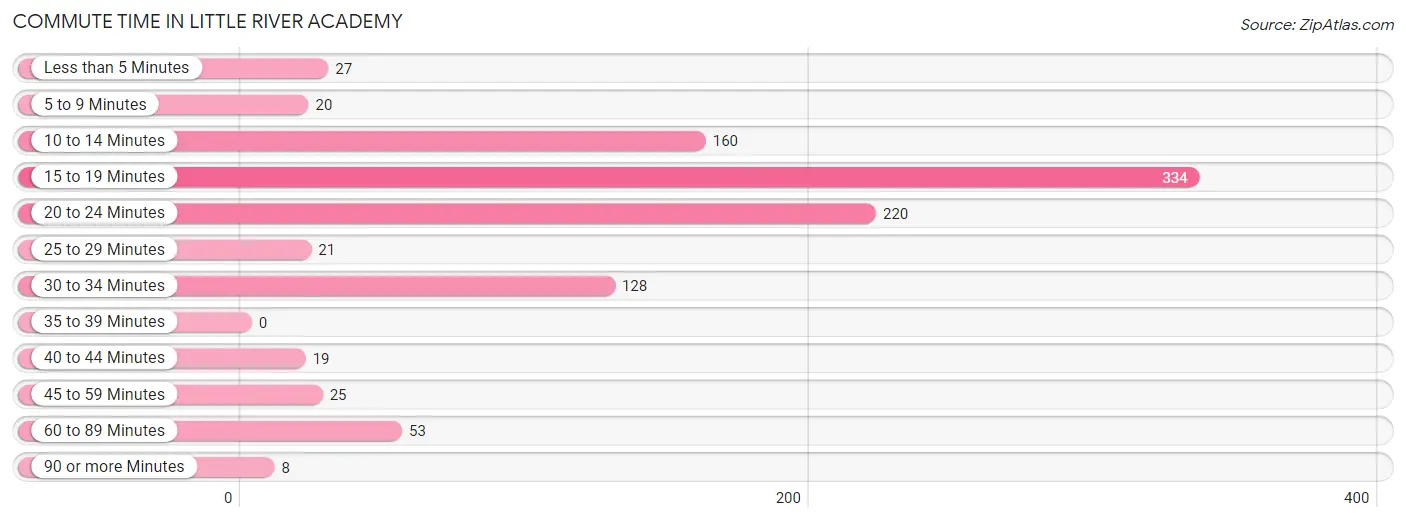
| Commute Time | # Commuters | % Commuters |
| Less than 5 Minutes | 27 | 2.7% |
| 5 to 9 Minutes | 20 | 2.0% |
| 10 to 14 Minutes | 160 | 15.8% |
| 15 to 19 Minutes | 334 | 32.9% |
| 20 to 24 Minutes | 220 | 21.7% |
| 25 to 29 Minutes | 21 | 2.1% |
| 30 to 34 Minutes | 128 | 12.6% |
| 35 to 39 Minutes | 0 | 0.0% |
| 40 to 44 Minutes | 19 | 1.9% |
| 45 to 59 Minutes | 25 | 2.5% |
| 60 to 89 Minutes | 53 | 5.2% |
| 90 or more Minutes | 8 | 0.8% |
Commute Time by Sex in Little River Academy
The most common commute times in Little River Academy are 15 to 19 minutes (174 commuters, 30.1%) for males and 15 to 19 minutes (160 commuters, 36.6%) for females.
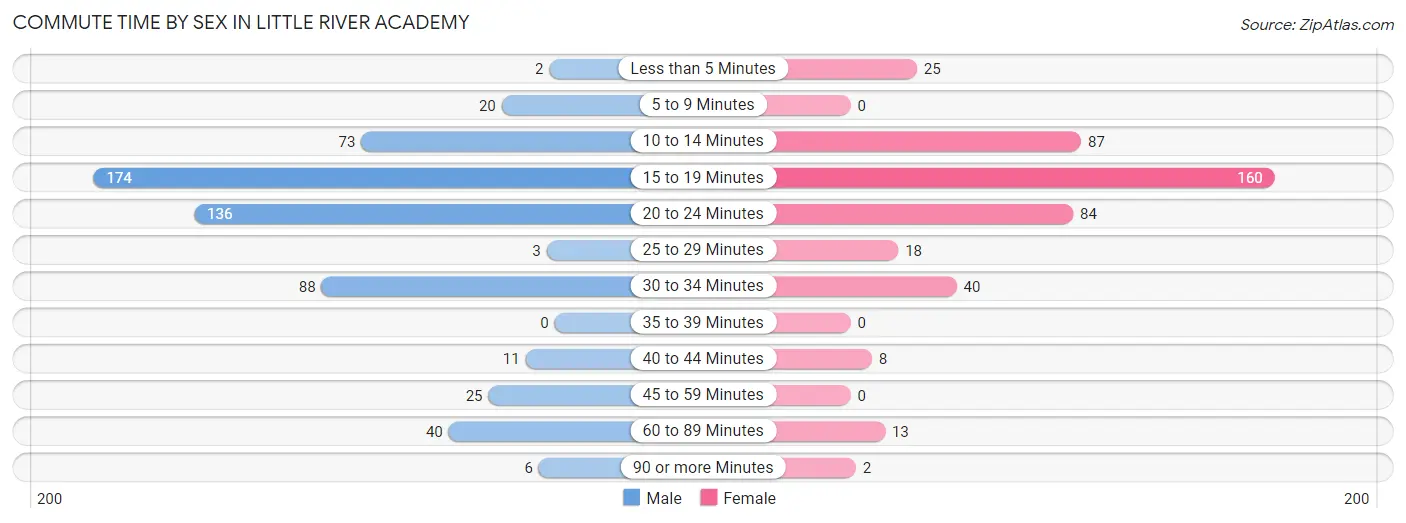
| Commute Time | Male | Female |
| Less than 5 Minutes | 2 (0.4%) | 25 (5.7%) |
| 5 to 9 Minutes | 20 (3.5%) | 0 (0.0%) |
| 10 to 14 Minutes | 73 (12.6%) | 87 (19.9%) |
| 15 to 19 Minutes | 174 (30.1%) | 160 (36.6%) |
| 20 to 24 Minutes | 136 (23.5%) | 84 (19.2%) |
| 25 to 29 Minutes | 3 (0.5%) | 18 (4.1%) |
| 30 to 34 Minutes | 88 (15.2%) | 40 (9.1%) |
| 35 to 39 Minutes | 0 (0.0%) | 0 (0.0%) |
| 40 to 44 Minutes | 11 (1.9%) | 8 (1.8%) |
| 45 to 59 Minutes | 25 (4.3%) | 0 (0.0%) |
| 60 to 89 Minutes | 40 (6.9%) | 13 (3.0%) |
| 90 or more Minutes | 6 (1.0%) | 2 (0.5%) |
Time of Departure to Work by Sex in Little River Academy
The most frequent times of departure to work in Little River Academy are 6:00 AM to 6:29 AM (108, 18.7%) for males and 7:30 AM to 7:59 AM (113, 25.9%) for females.
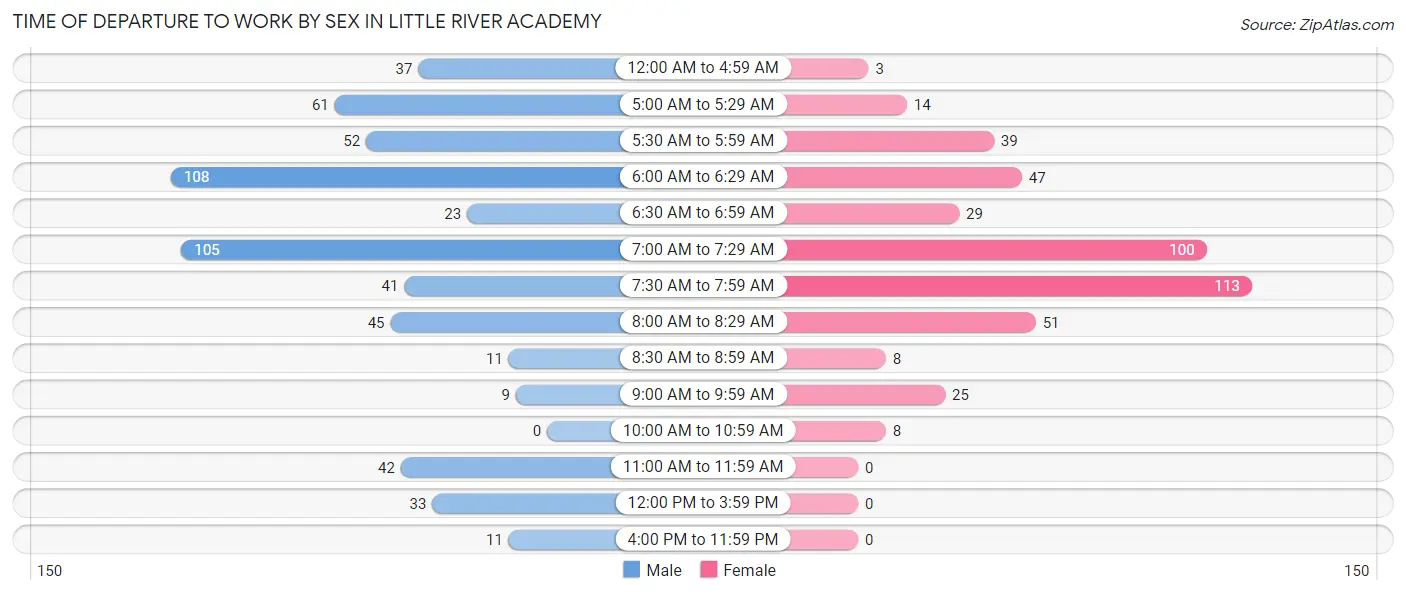
| Time of Departure | Male | Female |
| 12:00 AM to 4:59 AM | 37 (6.4%) | 3 (0.7%) |
| 5:00 AM to 5:29 AM | 61 (10.5%) | 14 (3.2%) |
| 5:30 AM to 5:59 AM | 52 (9.0%) | 39 (8.9%) |
| 6:00 AM to 6:29 AM | 108 (18.7%) | 47 (10.8%) |
| 6:30 AM to 6:59 AM | 23 (4.0%) | 29 (6.6%) |
| 7:00 AM to 7:29 AM | 105 (18.2%) | 100 (22.9%) |
| 7:30 AM to 7:59 AM | 41 (7.1%) | 113 (25.9%) |
| 8:00 AM to 8:29 AM | 45 (7.8%) | 51 (11.7%) |
| 8:30 AM to 8:59 AM | 11 (1.9%) | 8 (1.8%) |
| 9:00 AM to 9:59 AM | 9 (1.6%) | 25 (5.7%) |
| 10:00 AM to 10:59 AM | 0 (0.0%) | 8 (1.8%) |
| 11:00 AM to 11:59 AM | 42 (7.3%) | 0 (0.0%) |
| 12:00 PM to 3:59 PM | 33 (5.7%) | 0 (0.0%) |
| 4:00 PM to 11:59 PM | 11 (1.9%) | 0 (0.0%) |
| Total | 578 (100.0%) | 437 (100.0%) |
Housing Occupancy in Little River Academy
Occupancy by Ownership in Little River Academy
Of the total 768 dwellings in Little River Academy, owner-occupied units account for 598 (77.9%), while renter-occupied units make up 170 (22.1%).
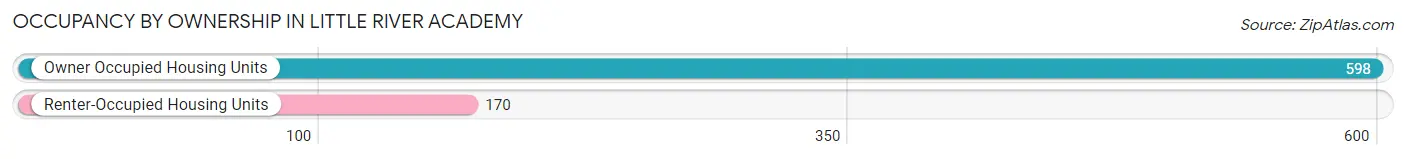
| Occupancy | # Housing Units | % Housing Units |
| Owner Occupied Housing Units | 598 | 77.9% |
| Renter-Occupied Housing Units | 170 | 22.1% |
| Total Occupied Housing Units | 768 | 100.0% |
Occupancy by Household Size in Little River Academy
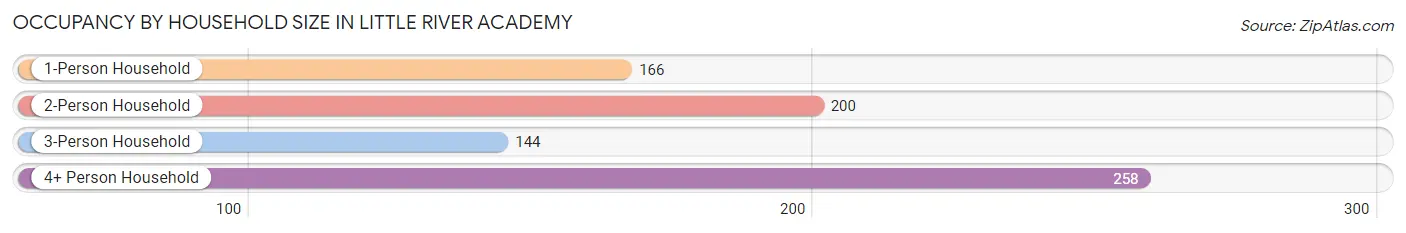
| Household Size | # Housing Units | % Housing Units |
| 1-Person Household | 166 | 21.6% |
| 2-Person Household | 200 | 26.0% |
| 3-Person Household | 144 | 18.8% |
| 4+ Person Household | 258 | 33.6% |
| Total Housing Units | 768 | 100.0% |
Occupancy by Ownership by Household Size in Little River Academy
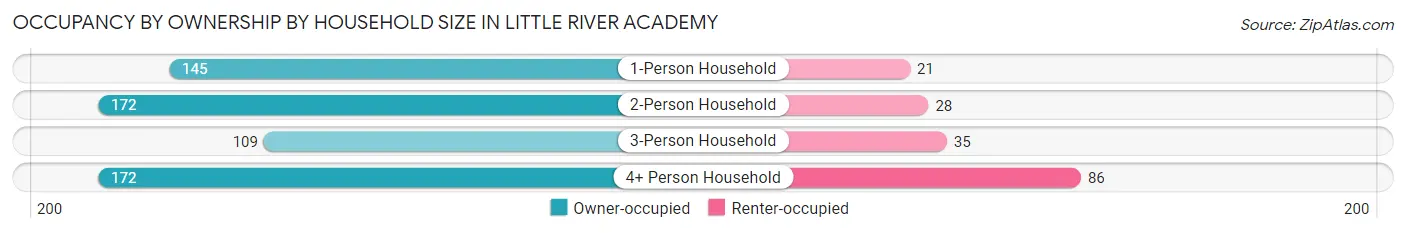
| Household Size | Owner-occupied | Renter-occupied |
| 1-Person Household | 145 (87.4%) | 21 (12.7%) |
| 2-Person Household | 172 (86.0%) | 28 (14.0%) |
| 3-Person Household | 109 (75.7%) | 35 (24.3%) |
| 4+ Person Household | 172 (66.7%) | 86 (33.3%) |
| Total Housing Units | 598 (77.9%) | 170 (22.1%) |
Occupancy by Educational Attainment in Little River Academy
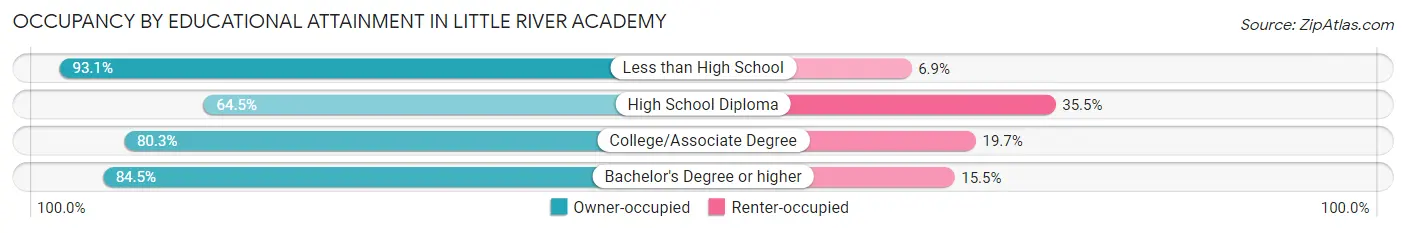
| Household Size | Owner-occupied | Renter-occupied |
| Less than High School | 67 (93.1%) | 5 (6.9%) |
| High School Diploma | 138 (64.5%) | 76 (35.5%) |
| College/Associate Degree | 273 (80.3%) | 67 (19.7%) |
| Bachelor's Degree or higher | 120 (84.5%) | 22 (15.5%) |
Occupancy by Age of Householder in Little River Academy
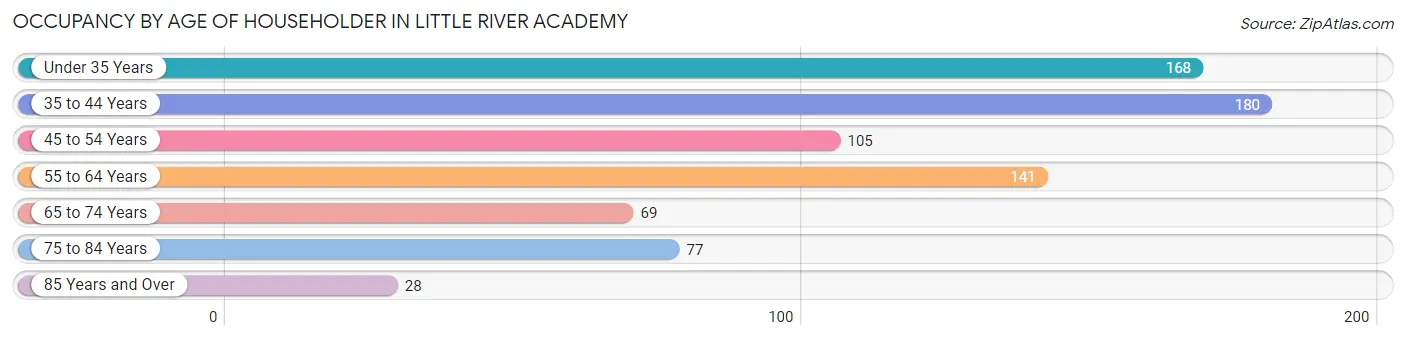
| Age Bracket | # Households | % Households |
| Under 35 Years | 168 | 21.9% |
| 35 to 44 Years | 180 | 23.4% |
| 45 to 54 Years | 105 | 13.7% |
| 55 to 64 Years | 141 | 18.4% |
| 65 to 74 Years | 69 | 9.0% |
| 75 to 84 Years | 77 | 10.0% |
| 85 Years and Over | 28 | 3.6% |
| Total | 768 | 100.0% |
Housing Finances in Little River Academy
Median Income by Occupancy in Little River Academy
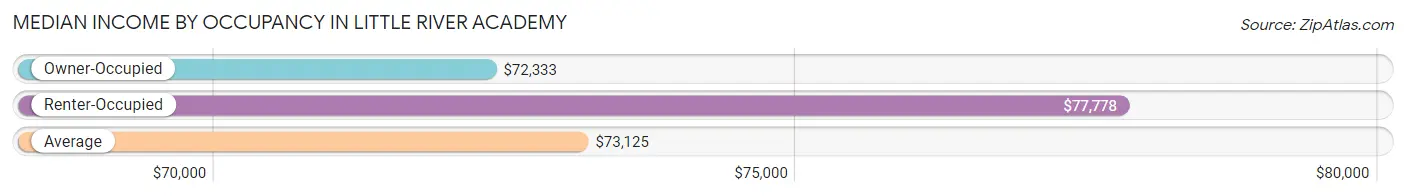
| Occupancy Type | # Households | Median Income |
| Owner-Occupied | 598 (77.9%) | $72,333 |
| Renter-Occupied | 170 (22.1%) | $77,778 |
| Average | 768 (100.0%) | $73,125 |
Occupancy by Householder Income Bracket in Little River Academy
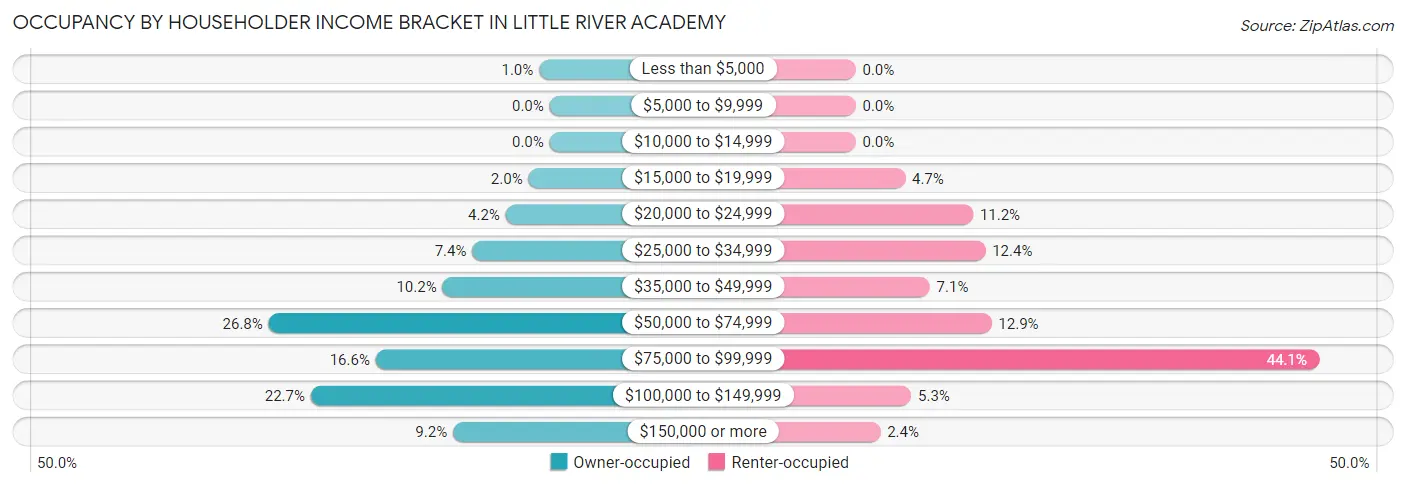
| Income Bracket | Owner-occupied | Renter-occupied |
| Less than $5,000 | 6 (1.0%) | 0 (0.0%) |
| $5,000 to $9,999 | 0 (0.0%) | 0 (0.0%) |
| $10,000 to $14,999 | 0 (0.0%) | 0 (0.0%) |
| $15,000 to $19,999 | 12 (2.0%) | 8 (4.7%) |
| $20,000 to $24,999 | 25 (4.2%) | 19 (11.2%) |
| $25,000 to $34,999 | 44 (7.4%) | 21 (12.3%) |
| $35,000 to $49,999 | 61 (10.2%) | 12 (7.1%) |
| $50,000 to $74,999 | 160 (26.8%) | 22 (12.9%) |
| $75,000 to $99,999 | 99 (16.6%) | 75 (44.1%) |
| $100,000 to $149,999 | 136 (22.7%) | 9 (5.3%) |
| $150,000 or more | 55 (9.2%) | 4 (2.4%) |
| Total | 598 (100.0%) | 170 (100.0%) |
Monthly Housing Cost Tiers in Little River Academy
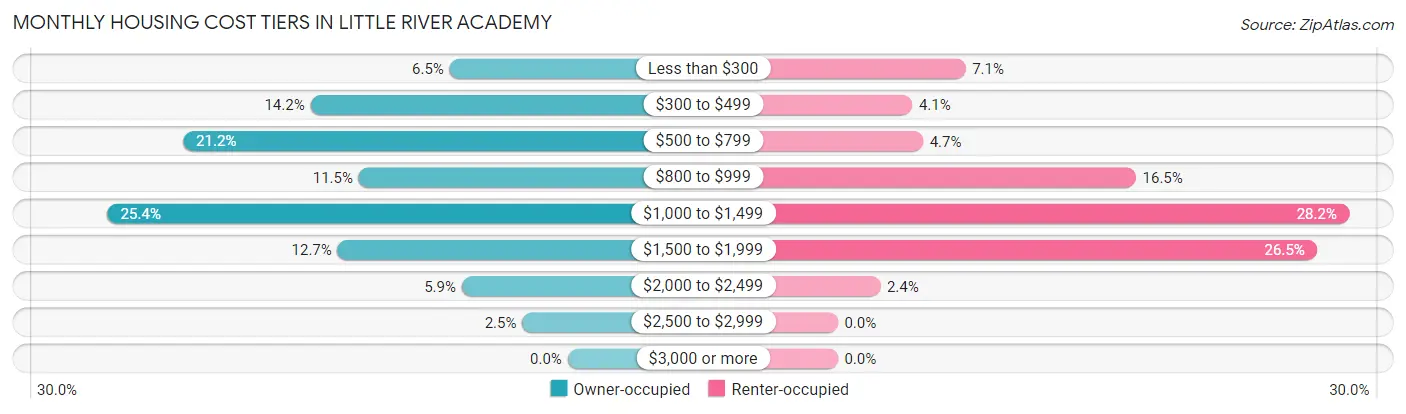
| Monthly Cost | Owner-occupied | Renter-occupied |
| Less than $300 | 39 (6.5%) | 12 (7.1%) |
| $300 to $499 | 85 (14.2%) | 7 (4.1%) |
| $500 to $799 | 127 (21.2%) | 8 (4.7%) |
| $800 to $999 | 69 (11.5%) | 28 (16.5%) |
| $1,000 to $1,499 | 152 (25.4%) | 48 (28.2%) |
| $1,500 to $1,999 | 76 (12.7%) | 45 (26.5%) |
| $2,000 to $2,499 | 35 (5.9%) | 4 (2.4%) |
| $2,500 to $2,999 | 15 (2.5%) | 0 (0.0%) |
| $3,000 or more | 0 (0.0%) | 0 (0.0%) |
| Total | 598 (100.0%) | 170 (100.0%) |
Physical Housing Characteristics in Little River Academy
Housing Structures in Little River Academy
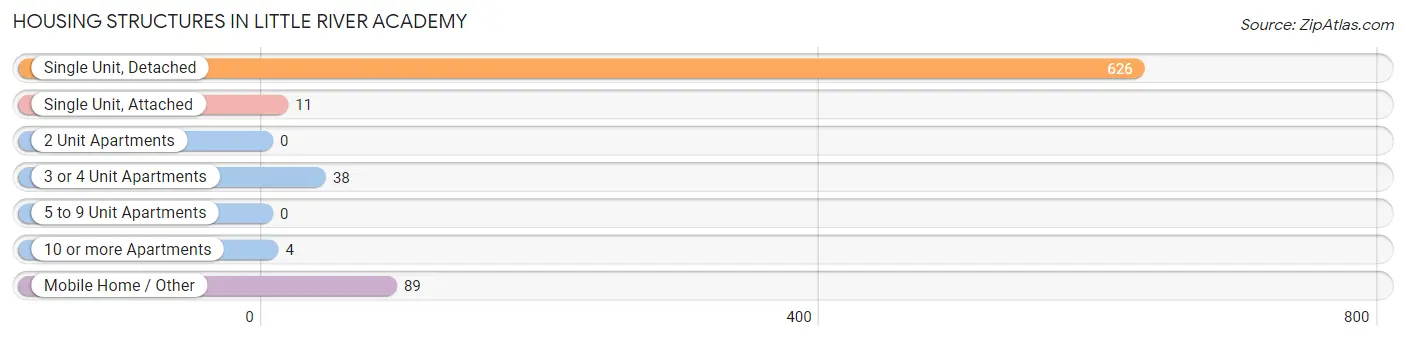
| Structure Type | # Housing Units | % Housing Units |
| Single Unit, Detached | 626 | 81.5% |
| Single Unit, Attached | 11 | 1.4% |
| 2 Unit Apartments | 0 | 0.0% |
| 3 or 4 Unit Apartments | 38 | 5.0% |
| 5 to 9 Unit Apartments | 0 | 0.0% |
| 10 or more Apartments | 4 | 0.5% |
| Mobile Home / Other | 89 | 11.6% |
| Total | 768 | 100.0% |
Housing Structures by Occupancy in Little River Academy
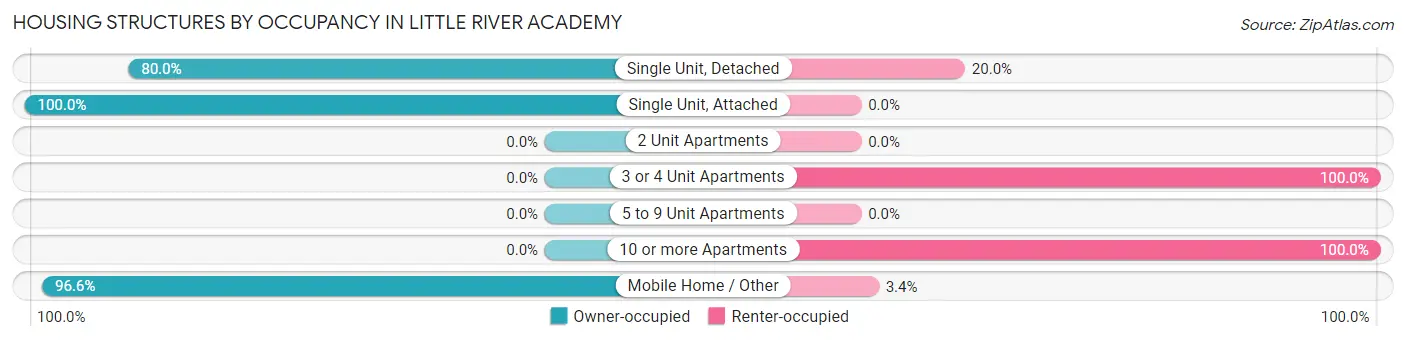
| Structure Type | Owner-occupied | Renter-occupied |
| Single Unit, Detached | 501 (80.0%) | 125 (20.0%) |
| Single Unit, Attached | 11 (100.0%) | 0 (0.0%) |
| 2 Unit Apartments | 0 (0.0%) | 0 (0.0%) |
| 3 or 4 Unit Apartments | 0 (0.0%) | 38 (100.0%) |
| 5 to 9 Unit Apartments | 0 (0.0%) | 0 (0.0%) |
| 10 or more Apartments | 0 (0.0%) | 4 (100.0%) |
| Mobile Home / Other | 86 (96.6%) | 3 (3.4%) |
| Total | 598 (77.9%) | 170 (22.1%) |
Housing Structures by Number of Rooms in Little River Academy
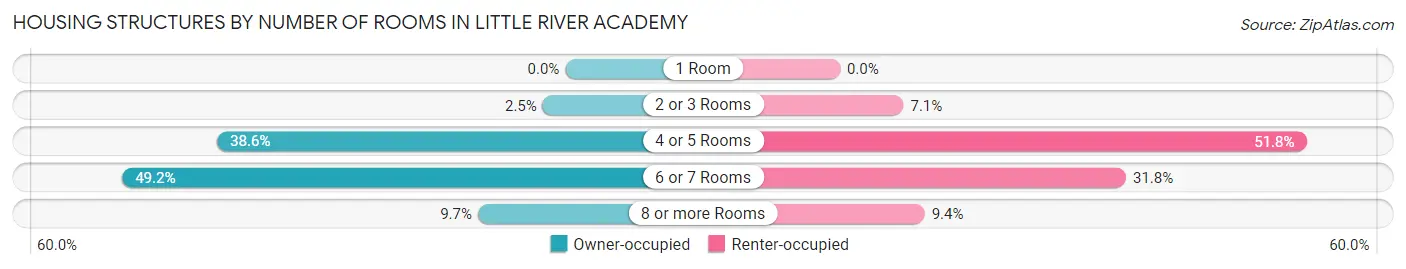
| Number of Rooms | Owner-occupied | Renter-occupied |
| 1 Room | 0 (0.0%) | 0 (0.0%) |
| 2 or 3 Rooms | 15 (2.5%) | 12 (7.1%) |
| 4 or 5 Rooms | 231 (38.6%) | 88 (51.8%) |
| 6 or 7 Rooms | 294 (49.2%) | 54 (31.8%) |
| 8 or more Rooms | 58 (9.7%) | 16 (9.4%) |
| Total | 598 (100.0%) | 170 (100.0%) |
Housing Structure by Heating Type in Little River Academy
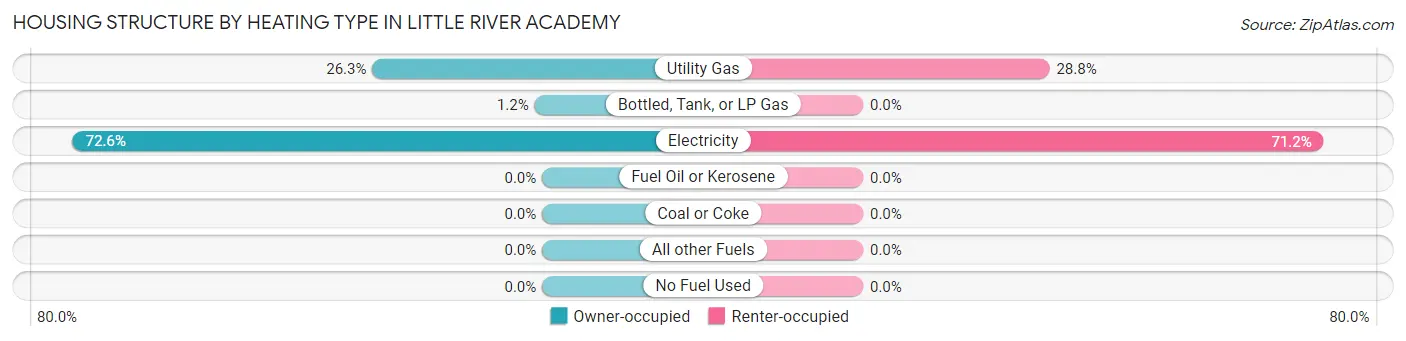
| Heating Type | Owner-occupied | Renter-occupied |
| Utility Gas | 157 (26.3%) | 49 (28.8%) |
| Bottled, Tank, or LP Gas | 7 (1.2%) | 0 (0.0%) |
| Electricity | 434 (72.6%) | 121 (71.2%) |
| Fuel Oil or Kerosene | 0 (0.0%) | 0 (0.0%) |
| Coal or Coke | 0 (0.0%) | 0 (0.0%) |
| All other Fuels | 0 (0.0%) | 0 (0.0%) |
| No Fuel Used | 0 (0.0%) | 0 (0.0%) |
| Total | 598 (100.0%) | 170 (100.0%) |
Household Vehicle Usage in Little River Academy
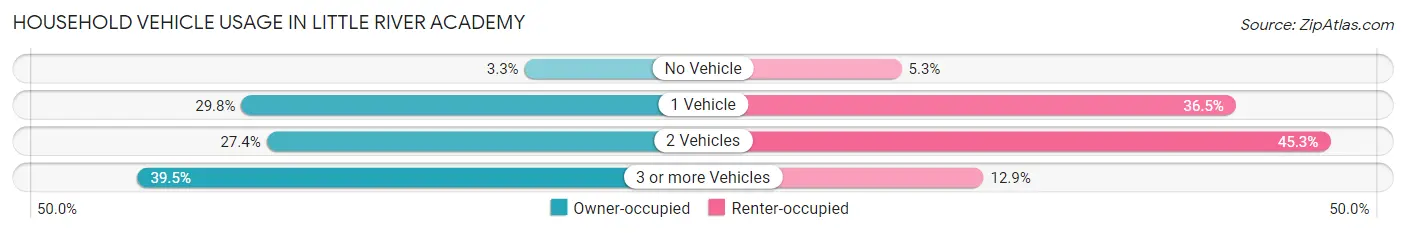
| Vehicles per Household | Owner-occupied | Renter-occupied |
| No Vehicle | 20 (3.3%) | 9 (5.3%) |
| 1 Vehicle | 178 (29.8%) | 62 (36.5%) |
| 2 Vehicles | 164 (27.4%) | 77 (45.3%) |
| 3 or more Vehicles | 236 (39.5%) | 22 (12.9%) |
| Total | 598 (100.0%) | 170 (100.0%) |
Real Estate & Mortgages in Little River Academy
Real Estate and Mortgage Overview in Little River Academy
| Characteristic | Without Mortgage | With Mortgage |
| Housing Units | 268 | 330 |
| Median Property Value | $138,500 | $167,300 |
| Median Household Income | $69,500 | $38 |
| Monthly Housing Costs | $520 | $0 |
| Real Estate Taxes | $1,481 | $8 |
Property Value by Mortgage Status in Little River Academy
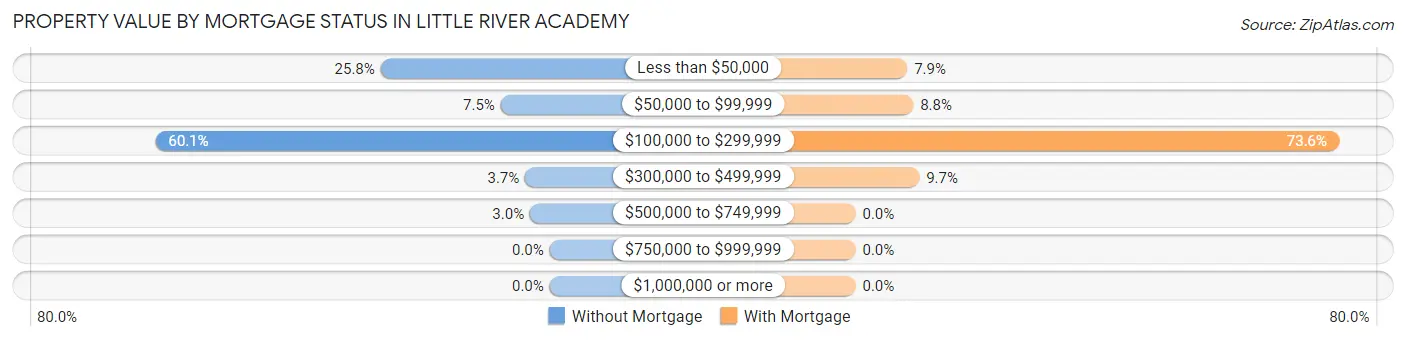
| Property Value | Without Mortgage | With Mortgage |
| Less than $50,000 | 69 (25.8%) | 26 (7.9%) |
| $50,000 to $99,999 | 20 (7.5%) | 29 (8.8%) |
| $100,000 to $299,999 | 161 (60.1%) | 243 (73.6%) |
| $300,000 to $499,999 | 10 (3.7%) | 32 (9.7%) |
| $500,000 to $749,999 | 8 (3.0%) | 0 (0.0%) |
| $750,000 to $999,999 | 0 (0.0%) | 0 (0.0%) |
| $1,000,000 or more | 0 (0.0%) | 0 (0.0%) |
| Total | 268 (100.0%) | 330 (100.0%) |
Household Income by Mortgage Status in Little River Academy
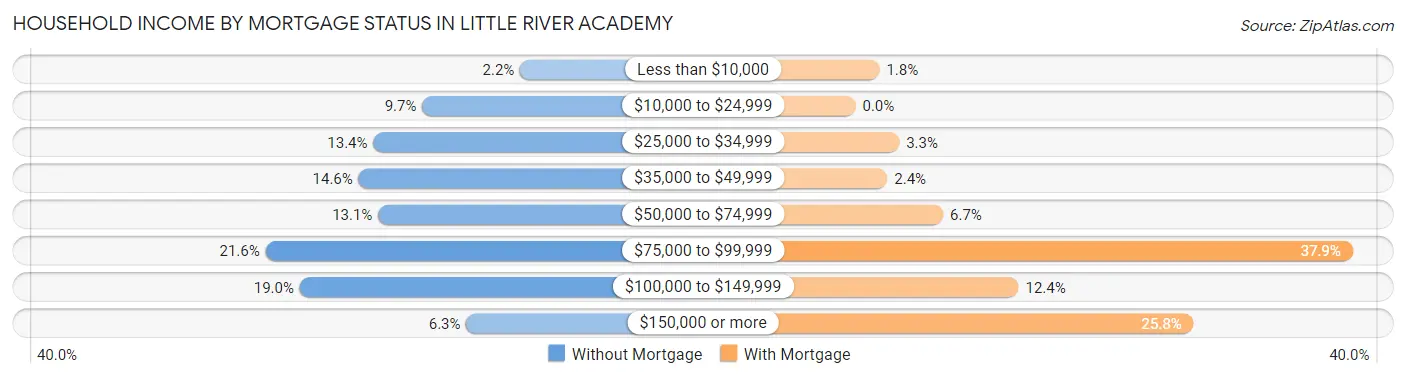
| Household Income | Without Mortgage | With Mortgage |
| Less than $10,000 | 6 (2.2%) | 6 (1.8%) |
| $10,000 to $24,999 | 26 (9.7%) | 0 (0.0%) |
| $25,000 to $34,999 | 36 (13.4%) | 11 (3.3%) |
| $35,000 to $49,999 | 39 (14.5%) | 8 (2.4%) |
| $50,000 to $74,999 | 35 (13.1%) | 22 (6.7%) |
| $75,000 to $99,999 | 58 (21.6%) | 125 (37.9%) |
| $100,000 to $149,999 | 51 (19.0%) | 41 (12.4%) |
| $150,000 or more | 17 (6.3%) | 85 (25.8%) |
| Total | 268 (100.0%) | 330 (100.0%) |
Property Value to Household Income Ratio in Little River Academy
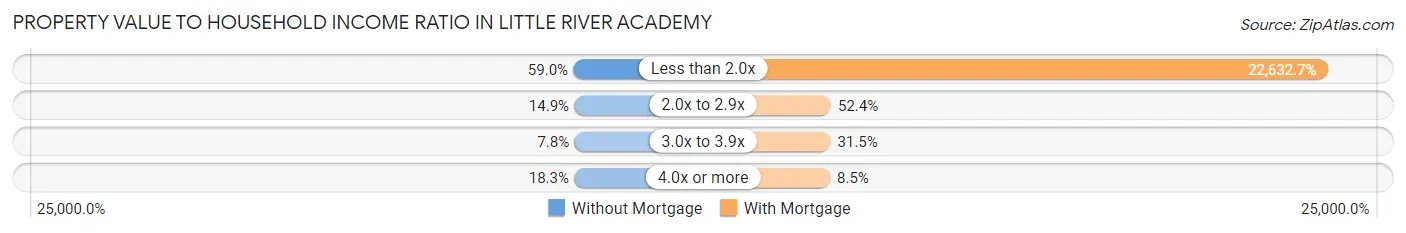
| Value-to-Income Ratio | Without Mortgage | With Mortgage |
| Less than 2.0x | 158 (59.0%) | 74,688 (22,632.7%) |
| 2.0x to 2.9x | 40 (14.9%) | 173 (52.4%) |
| 3.0x to 3.9x | 21 (7.8%) | 104 (31.5%) |
| 4.0x or more | 49 (18.3%) | 28 (8.5%) |
| Total | 268 (100.0%) | 330 (100.0%) |
Real Estate Taxes by Mortgage Status in Little River Academy
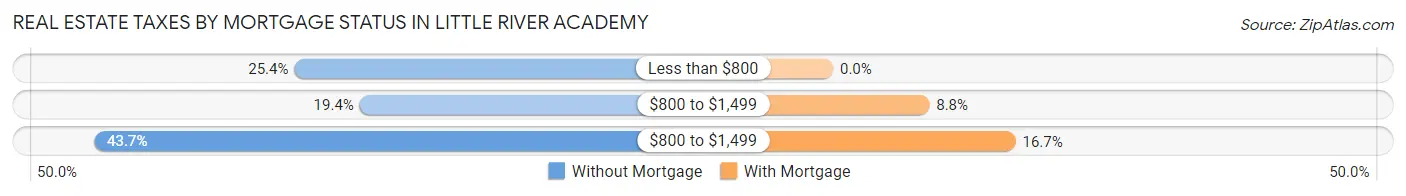
| Property Taxes | Without Mortgage | With Mortgage |
| Less than $800 | 68 (25.4%) | 0 (0.0%) |
| $800 to $1,499 | 52 (19.4%) | 29 (8.8%) |
| $800 to $1,499 | 117 (43.7%) | 55 (16.7%) |
| Total | 268 (100.0%) | 330 (100.0%) |
Health & Disability in Little River Academy
Health Insurance Coverage by Age in Little River Academy
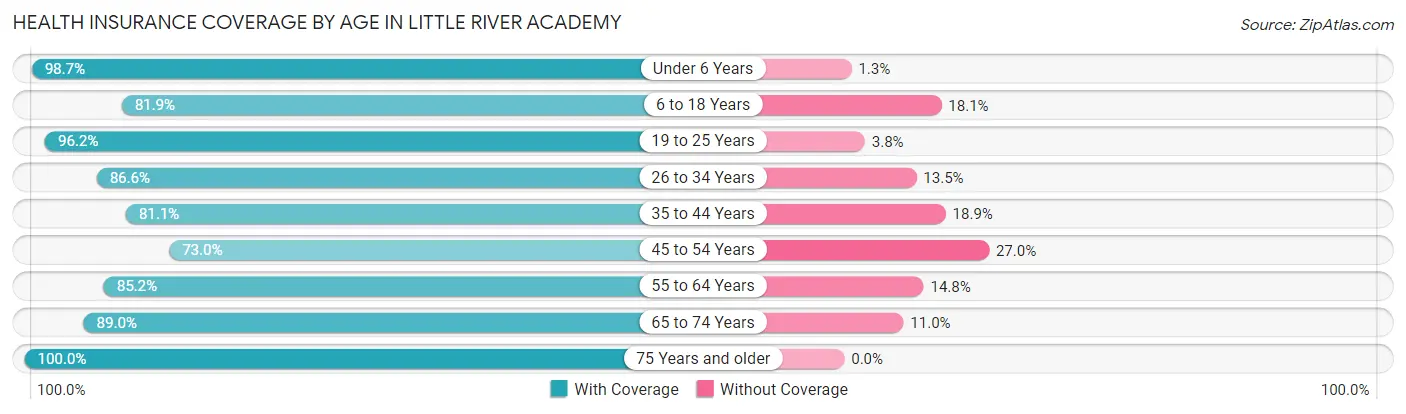
| Age Bracket | With Coverage | Without Coverage |
| Under 6 Years | 294 (98.7%) | 4 (1.3%) |
| 6 to 18 Years | 407 (81.9%) | 90 (18.1%) |
| 19 to 25 Years | 176 (96.2%) | 7 (3.8%) |
| 26 to 34 Years | 309 (86.6%) | 48 (13.5%) |
| 35 to 44 Years | 266 (81.1%) | 62 (18.9%) |
| 45 to 54 Years | 157 (73.0%) | 58 (27.0%) |
| 55 to 64 Years | 196 (85.2%) | 34 (14.8%) |
| 65 to 74 Years | 113 (89.0%) | 14 (11.0%) |
| 75 Years and older | 136 (100.0%) | 0 (0.0%) |
| Total | 2,054 (86.6%) | 317 (13.4%) |
Health Insurance Coverage by Citizenship Status in Little River Academy
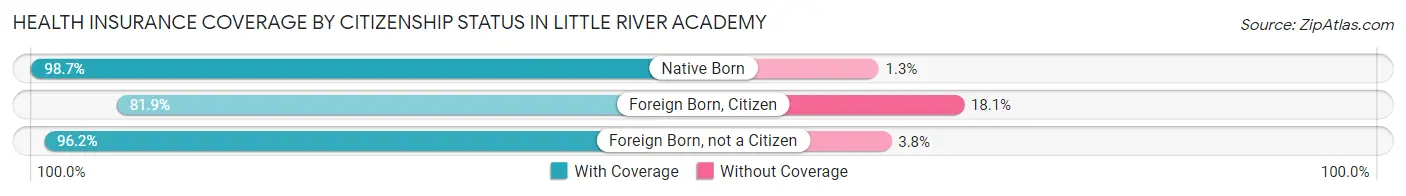
| Citizenship Status | With Coverage | Without Coverage |
| Native Born | 294 (98.7%) | 4 (1.3%) |
| Foreign Born, Citizen | 407 (81.9%) | 90 (18.1%) |
| Foreign Born, not a Citizen | 176 (96.2%) | 7 (3.8%) |
Health Insurance Coverage by Household Income in Little River Academy
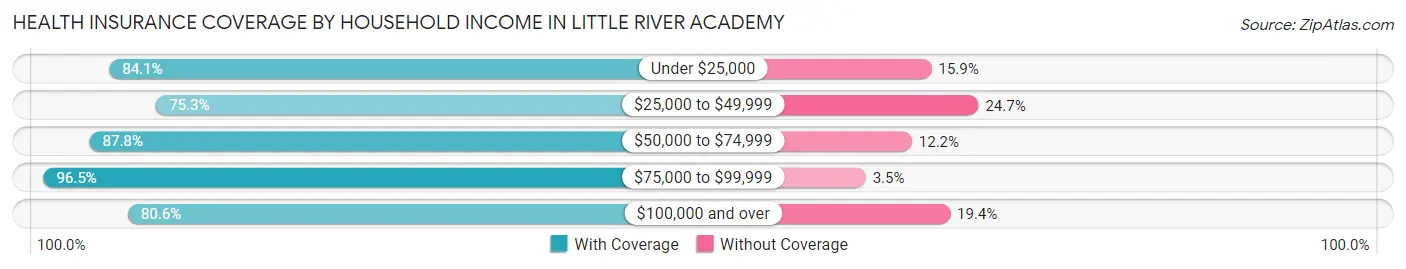
| Household Income | With Coverage | Without Coverage |
| Under $25,000 | 143 (84.1%) | 27 (15.9%) |
| $25,000 to $49,999 | 229 (75.3%) | 75 (24.7%) |
| $50,000 to $74,999 | 389 (87.8%) | 54 (12.2%) |
| $75,000 to $99,999 | 735 (96.5%) | 27 (3.5%) |
| $100,000 and over | 558 (80.6%) | 134 (19.4%) |
Public vs Private Health Insurance Coverage by Age in Little River Academy
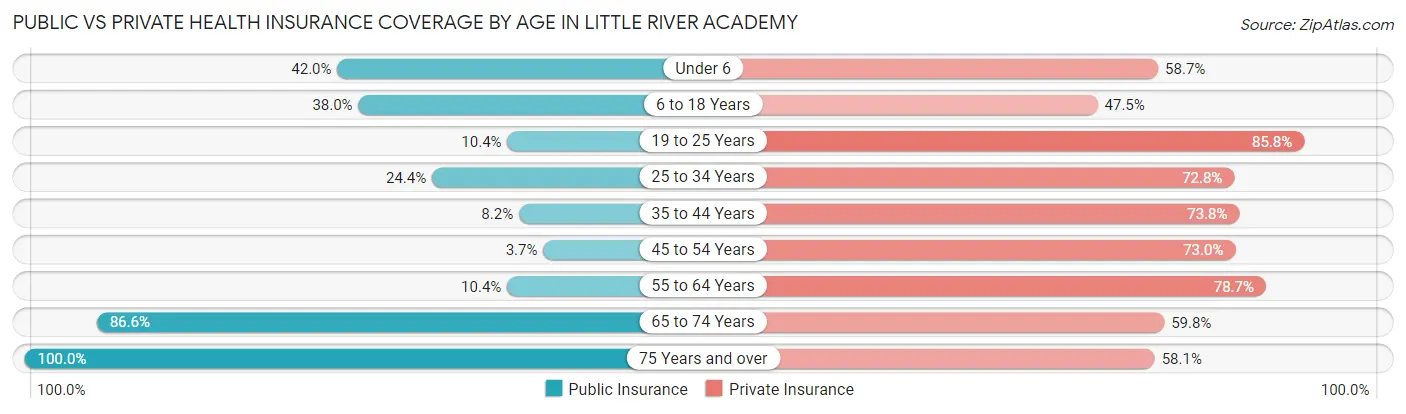
| Age Bracket | Public Insurance | Private Insurance |
| Under 6 | 125 (41.9%) | 175 (58.7%) |
| 6 to 18 Years | 189 (38.0%) | 236 (47.5%) |
| 19 to 25 Years | 19 (10.4%) | 157 (85.8%) |
| 25 to 34 Years | 87 (24.4%) | 260 (72.8%) |
| 35 to 44 Years | 27 (8.2%) | 242 (73.8%) |
| 45 to 54 Years | 8 (3.7%) | 157 (73.0%) |
| 55 to 64 Years | 24 (10.4%) | 181 (78.7%) |
| 65 to 74 Years | 110 (86.6%) | 76 (59.8%) |
| 75 Years and over | 136 (100.0%) | 79 (58.1%) |
| Total | 725 (30.6%) | 1,563 (65.9%) |
Disability Status by Sex by Age in Little River Academy
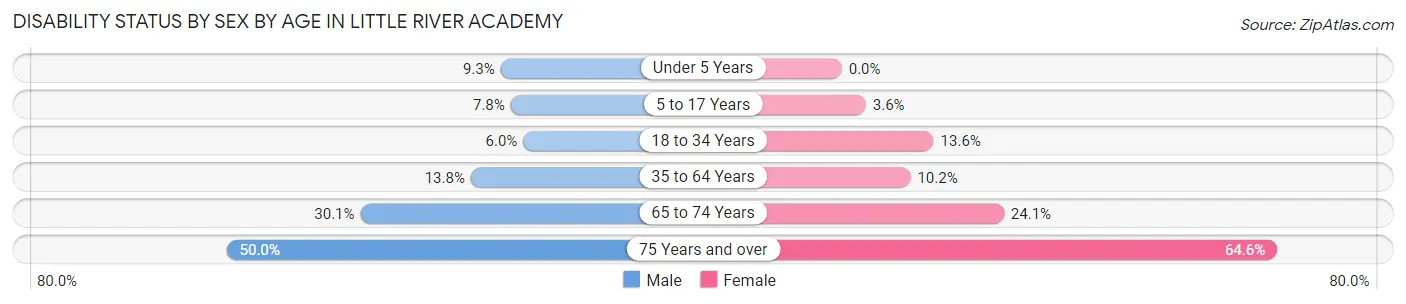
| Age Bracket | Male | Female |
| Under 5 Years | 14 (9.3%) | 0 (0.0%) |
| 5 to 17 Years | 18 (7.8%) | 10 (3.6%) |
| 18 to 34 Years | 19 (6.0%) | 33 (13.6%) |
| 35 to 64 Years | 51 (13.8%) | 41 (10.2%) |
| 65 to 74 Years | 22 (30.1%) | 13 (24.1%) |
| 75 Years and over | 27 (50.0%) | 53 (64.6%) |
Disability Class by Sex by Age in Little River Academy
Disability Class: Hearing Difficulty
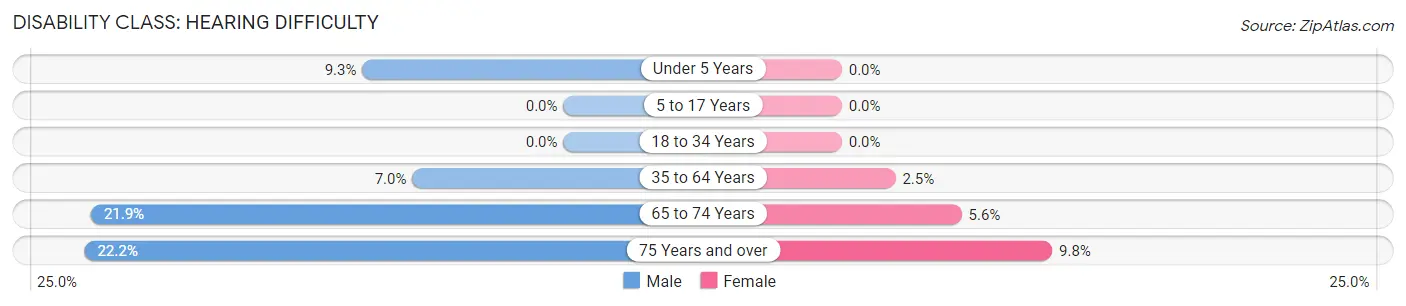
| Age Bracket | Male | Female |
| Under 5 Years | 14 (9.3%) | 0 (0.0%) |
| 5 to 17 Years | 0 (0.0%) | 0 (0.0%) |
| 18 to 34 Years | 0 (0.0%) | 0 (0.0%) |
| 35 to 64 Years | 26 (7.0%) | 10 (2.5%) |
| 65 to 74 Years | 16 (21.9%) | 3 (5.6%) |
| 75 Years and over | 12 (22.2%) | 8 (9.8%) |
Disability Class: Vision Difficulty
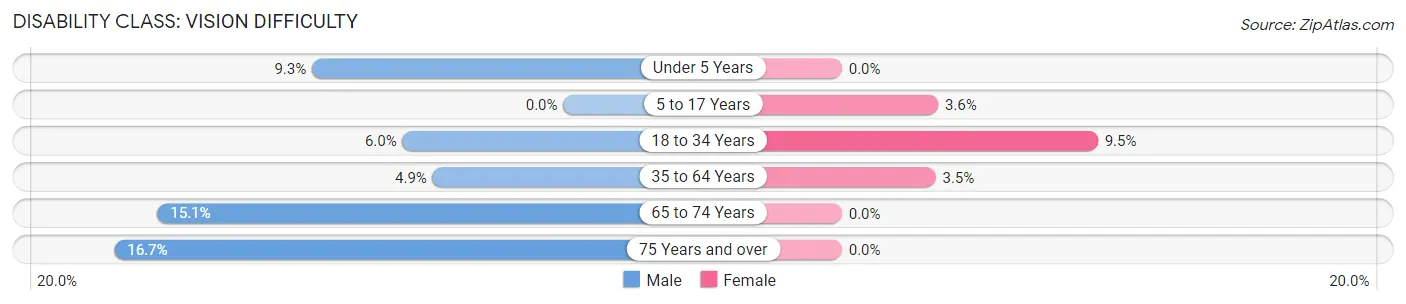
| Age Bracket | Male | Female |
| Under 5 Years | 14 (9.3%) | 0 (0.0%) |
| 5 to 17 Years | 0 (0.0%) | 10 (3.6%) |
| 18 to 34 Years | 19 (6.0%) | 23 (9.5%) |
| 35 to 64 Years | 18 (4.9%) | 14 (3.5%) |
| 65 to 74 Years | 11 (15.1%) | 0 (0.0%) |
| 75 Years and over | 9 (16.7%) | 0 (0.0%) |
Disability Class: Cognitive Difficulty
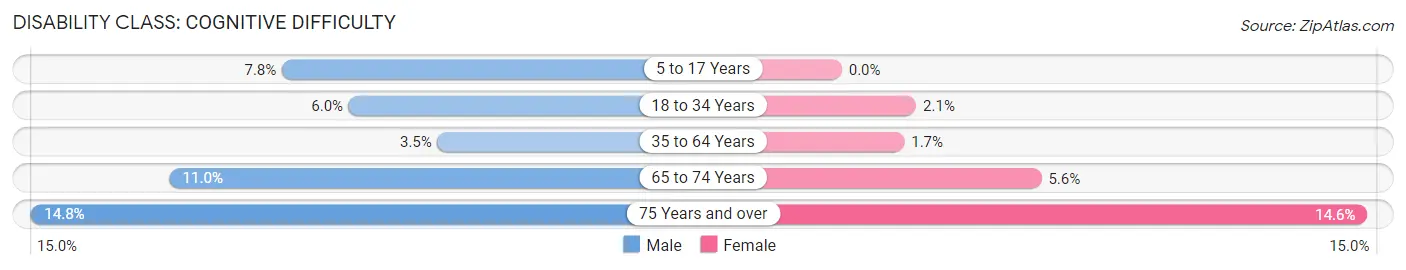
| Age Bracket | Male | Female |
| 5 to 17 Years | 18 (7.8%) | 0 (0.0%) |
| 18 to 34 Years | 19 (6.0%) | 5 (2.1%) |
| 35 to 64 Years | 13 (3.5%) | 7 (1.7%) |
| 65 to 74 Years | 8 (11.0%) | 3 (5.6%) |
| 75 Years and over | 8 (14.8%) | 12 (14.6%) |
Disability Class: Ambulatory Difficulty
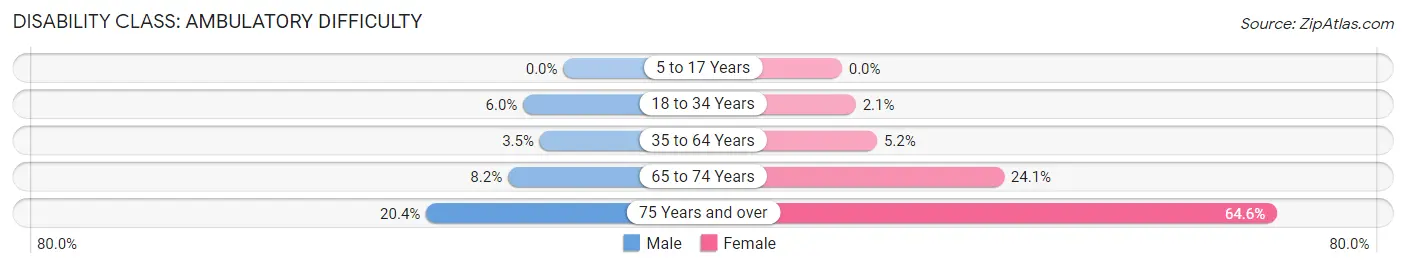
| Age Bracket | Male | Female |
| 5 to 17 Years | 0 (0.0%) | 0 (0.0%) |
| 18 to 34 Years | 19 (6.0%) | 5 (2.1%) |
| 35 to 64 Years | 13 (3.5%) | 21 (5.2%) |
| 65 to 74 Years | 6 (8.2%) | 13 (24.1%) |
| 75 Years and over | 11 (20.4%) | 53 (64.6%) |
Disability Class: Self-Care Difficulty
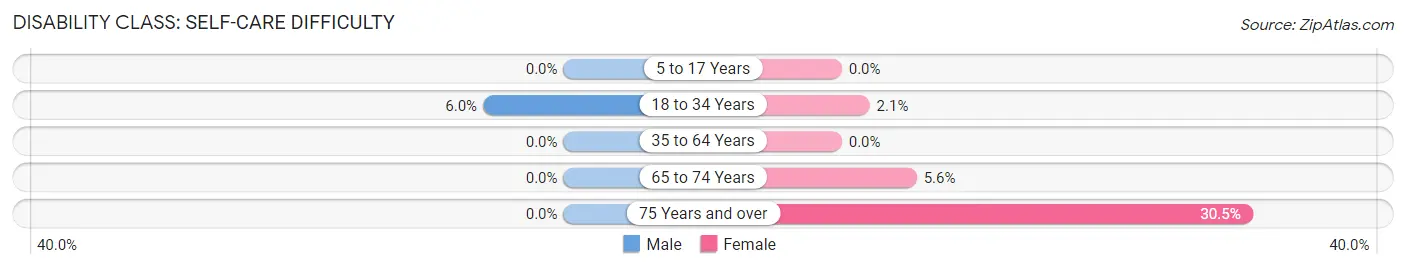
| Age Bracket | Male | Female |
| 5 to 17 Years | 0 (0.0%) | 0 (0.0%) |
| 18 to 34 Years | 19 (6.0%) | 5 (2.1%) |
| 35 to 64 Years | 0 (0.0%) | 0 (0.0%) |
| 65 to 74 Years | 0 (0.0%) | 3 (5.6%) |
| 75 Years and over | 0 (0.0%) | 25 (30.5%) |
Technology Access in Little River Academy
Computing Device Access in Little River Academy
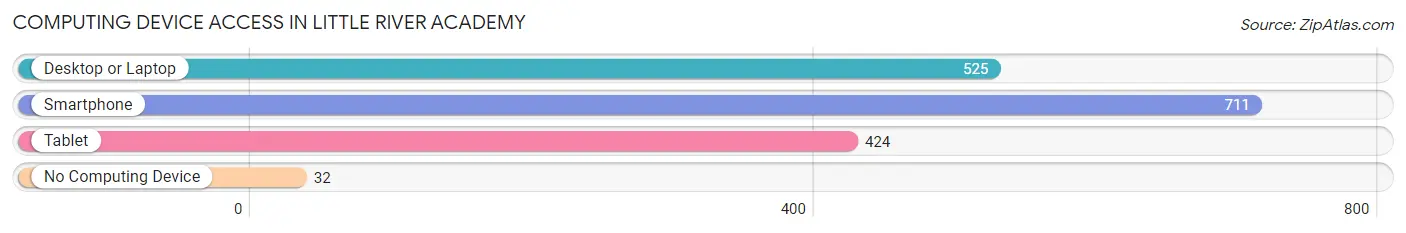
| Device Type | # Households | % Households |
| Desktop or Laptop | 525 | 68.4% |
| Smartphone | 711 | 92.6% |
| Tablet | 424 | 55.2% |
| No Computing Device | 32 | 4.2% |
| Total | 768 | 100.0% |
Internet Access in Little River Academy
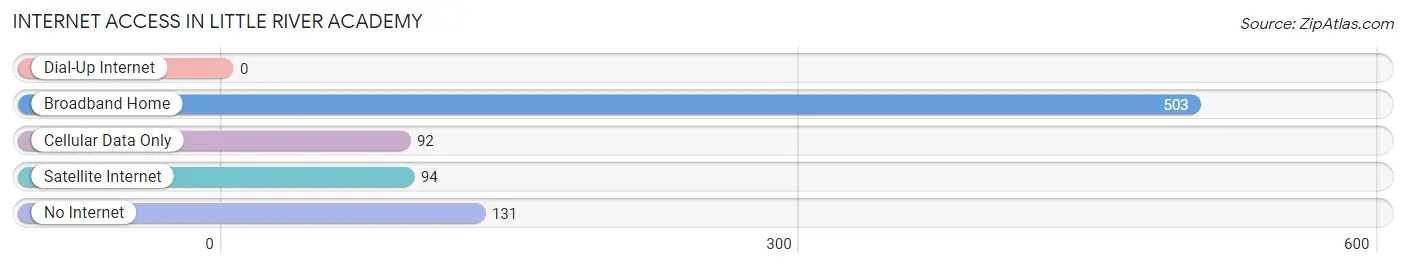
| Internet Type | # Households | % Households |
| Dial-Up Internet | 0 | 0.0% |
| Broadband Home | 503 | 65.5% |
| Cellular Data Only | 92 | 12.0% |
| Satellite Internet | 94 | 12.2% |
| No Internet | 131 | 17.1% |
| Total | 768 | 100.0% |
Little River Academy Summary
River Academy, TX is a small town located in Bell County, Texas. It is situated on the banks of the Little River, which is a tributary of the Brazos River. The town was founded in 1876 and is home to approximately 1,000 people.
Geography
Little River Academy is located in the Central Texas region of the state. It is situated on the banks of the Little River, which is a tributary of the Brazos River. The town is located in the rolling hills of Bell County, which is part of the Blackland Prairie region of Texas. The town is located approximately 25 miles south of Waco and is about an hour and a half drive from Austin.
The town is surrounded by farmland and is home to a variety of wildlife, including deer, wild turkeys, and other small game. The area is also home to a variety of birds, including cardinals, blue jays, and red-tailed hawks.
History
Little River Academy was founded in 1876 by a group of settlers from the nearby town of Belton. The town was named after the Little River, which runs through the area. The town was originally a farming community, but it soon became a center for trade and commerce.
In the early 1900s, the town began to grow and develop. The first school was built in 1910 and the first bank opened in 1912. The town also had a post office, a general store, and a blacksmith shop.
In the 1920s, the town began to experience a period of growth and prosperity. The population increased and the town began to attract new businesses. The town also became a popular destination for tourists, who came to enjoy the natural beauty of the area.
In the 1950s, the town began to decline. Many of the businesses closed and the population began to decline. In the 1970s, the town was revitalized and began to experience a period of growth and development.
Economy
The economy of Little River Academy is largely based on agriculture. The town is home to several farms, which produce a variety of crops, including cotton, corn, and wheat. The town also has a number of small businesses, including restaurants, convenience stores, and auto repair shops.
The town is also home to a number of manufacturing companies, which produce a variety of products, including furniture, clothing, and electronics. The town is also home to a number of service-based businesses, including medical offices, law firms, and accounting firms.
Demographics
As of the 2010 census, the population of Little River Academy was 1,000. The town is predominantly white, with approximately 90% of the population being white. The town also has a small Hispanic population, with approximately 5% of the population being Hispanic. The town also has a small African American population, with approximately 2% of the population being African American.
The median household income in Little River Academy is $45,000. The median home value is $125,000. The town has a low unemployment rate, with approximately 4% of the population being unemployed.
Conclusion
Little River Academy is a small town located in Bell County, Texas. It is situated on the banks of the Little River, which is a tributary of the Brazos River. The town was founded in 1876 and is home to approximately 1,000 people. The town is predominantly white, with approximately 90% of the population being white. The town is largely based on agriculture, with a number of small businesses and manufacturing companies. The median household income in Little River Academy is $45,000 and the median home value is $125,000. The town has a low unemployment rate, with approximately 4% of the population being unemployed.
Common Questions
What is Per Capita Income in Little River Academy?
Per Capita income in Little River Academy is $27,698.
What is the Median Family Income in Little River Academy?
Median Family Income in Little River Academy is $80,192.
What is the Median Household income in Little River Academy?
Median Household Income in Little River Academy is $73,125.
What is Income or Wage Gap in Little River Academy?
Income or Wage Gap in Little River Academy is 12.0%.
Women in Little River Academy earn 88.0 cents for every dollar earned by a man.
What is Inequality or Gini Index in Little River Academy?
Inequality or Gini Index in Little River Academy is 0.33.
What is the Total Population of Little River Academy?
Total Population of Little River Academy is 2,374.
What is the Total Male Population of Little River Academy?
Total Male Population of Little River Academy is 1,199.
What is the Total Female Population of Little River Academy?
Total Female Population of Little River Academy is 1,175.
What is the Ratio of Males per 100 Females in Little River Academy?
There are 102.04 Males per 100 Females in Little River Academy.
What is the Ratio of Females per 100 Males in Little River Academy?
There are 98.00 Females per 100 Males in Little River Academy.
What is the Median Population Age in Little River Academy?
Median Population Age in Little River Academy is 32.7 Years.
What is the Average Family Size in Little River Academy
Average Family Size in Little River Academy is 3.5 People.
What is the Average Household Size in Little River Academy
Average Household Size in Little River Academy is 3.1 People.
How Large is the Labor Force in Little River Academy?
There are 1,181 People in the Labor Forcein in Little River Academy.
What is the Percentage of People in the Labor Force in Little River Academy?
72.4% of People are in the Labor Force in Little River Academy.
What is the Unemployment Rate in Little River Academy?
Unemployment Rate in Little River Academy is 6.8%.