Edgecliff Village, TX Map & Demographics
Edgecliff Village Map
Edgecliff Village Overview
$35,939
PER CAPITA INCOME
$92,534
AVG FAMILY INCOME
$84,045
AVG HOUSEHOLD INCOME
37.1%
WAGE / INCOME GAP [ % ]
62.9¢/ $1
WAGE / INCOME GAP [ $ ]
0.35
INEQUALITY / GINI INDEX
3,715
TOTAL POPULATION
1,870
MALE POPULATION
1,845
FEMALE POPULATION
101.36
MALES / 100 FEMALES
98.66
FEMALES / 100 MALES
39.8
MEDIAN AGE
3.2
AVG FAMILY SIZE
2.9
AVG HOUSEHOLD SIZE
1,859
LABOR FORCE [ PEOPLE ]
63.5%
PERCENT IN LABOR FORCE
8.7%
UNEMPLOYMENT RATE
Edgecliff Village Area Codes
Income in Edgecliff Village
Income Overview in Edgecliff Village
Per Capita Income in Edgecliff Village is $35,939, while median incomes of families and households are $92,534 and $84,045 respectively.
| Characteristic | Number | Measure |
| Per Capita Income | 3,715 | $35,939 |
| Median Family Income | 1,021 | $92,534 |
| Mean Family Income | 1,021 | $110,048 |
| Median Household Income | 1,298 | $84,045 |
| Mean Household Income | 1,298 | $100,628 |
| Income Deficit | 1,021 | $0 |
| Wage / Income Gap (%) | 3,715 | 37.15% |
| Wage / Income Gap ($) | 3,715 | 62.85¢ per $1 |
| Gini / Inequality Index | 3,715 | 0.35 |
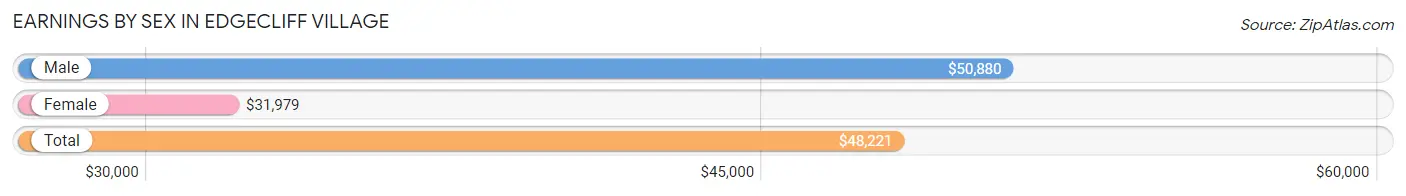
Earnings by Sex in Edgecliff Village
Average Earnings in Edgecliff Village are $48,221, $50,880 for men and $31,979 for women, a difference of 37.1%.
| Sex | Number | Average Earnings |
| Male | 1,102 (60.0%) | $50,880 |
| Female | 734 (40.0%) | $31,979 |
| Total | 1,836 (100.0%) | $48,221 |
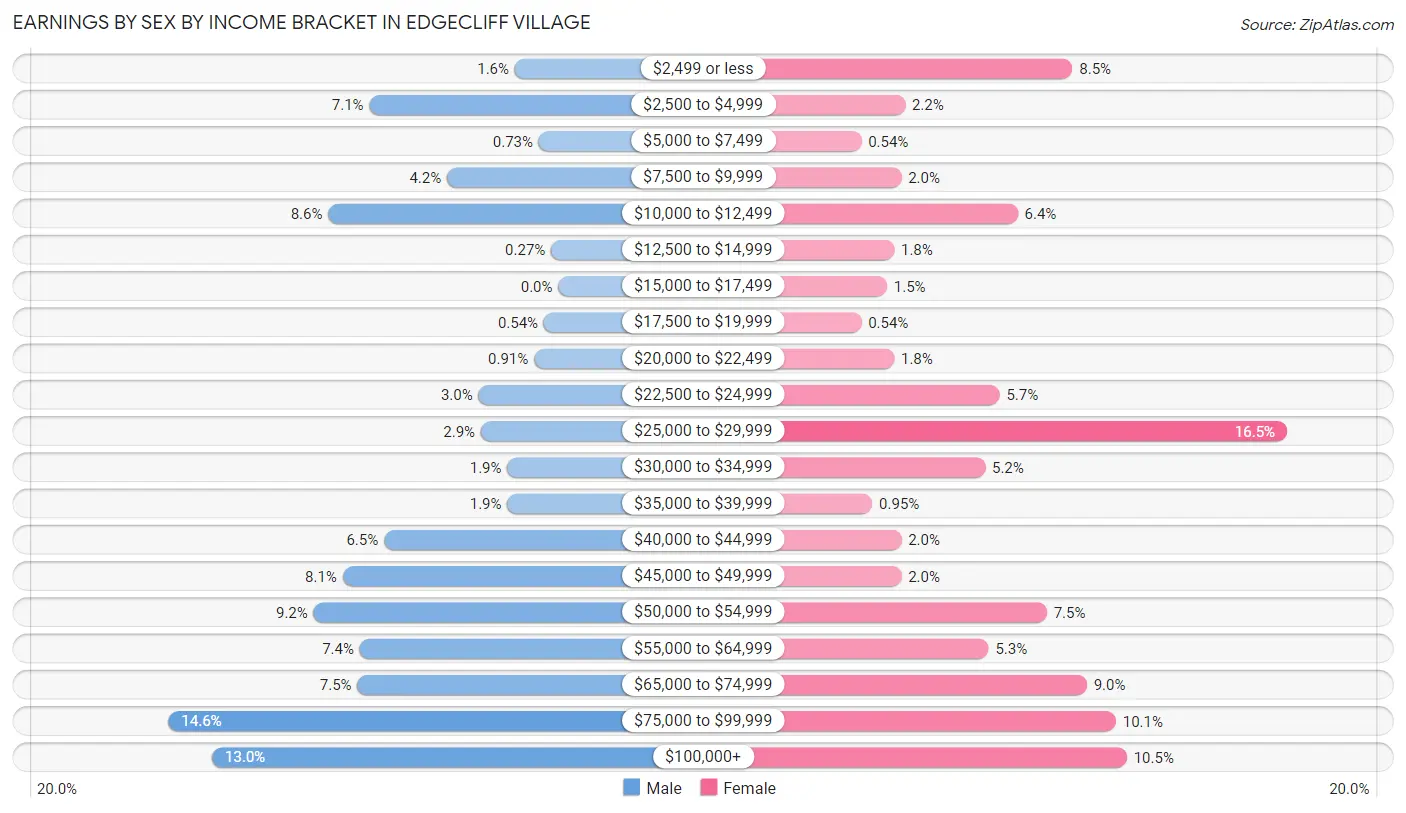
Earnings by Sex by Income Bracket in Edgecliff Village
The most common earnings brackets in Edgecliff Village are $75,000 to $99,999 for men (161 | 14.6%) and $25,000 to $29,999 for women (121 | 16.5%).
| Income | Male | Female |
| $2,499 or less | 18 (1.6%) | 62 (8.5%) |
| $2,500 to $4,999 | 78 (7.1%) | 16 (2.2%) |
| $5,000 to $7,499 | 8 (0.7%) | 4 (0.5%) |
| $7,500 to $9,999 | 46 (4.2%) | 15 (2.0%) |
| $10,000 to $12,499 | 95 (8.6%) | 47 (6.4%) |
| $12,500 to $14,999 | 3 (0.3%) | 13 (1.8%) |
| $15,000 to $17,499 | 0 (0.0%) | 11 (1.5%) |
| $17,500 to $19,999 | 6 (0.5%) | 4 (0.5%) |
| $20,000 to $22,499 | 10 (0.9%) | 13 (1.8%) |
| $22,500 to $24,999 | 33 (3.0%) | 42 (5.7%) |
| $25,000 to $29,999 | 32 (2.9%) | 121 (16.5%) |
| $30,000 to $34,999 | 21 (1.9%) | 38 (5.2%) |
| $35,000 to $39,999 | 21 (1.9%) | 7 (0.9%) |
| $40,000 to $44,999 | 72 (6.5%) | 15 (2.0%) |
| $45,000 to $49,999 | 89 (8.1%) | 15 (2.0%) |
| $50,000 to $54,999 | 101 (9.2%) | 55 (7.5%) |
| $55,000 to $64,999 | 82 (7.4%) | 39 (5.3%) |
| $65,000 to $74,999 | 83 (7.5%) | 66 (9.0%) |
| $75,000 to $99,999 | 161 (14.6%) | 74 (10.1%) |
| $100,000+ | 143 (13.0%) | 77 (10.5%) |
| Total | 1,102 (100.0%) | 734 (100.0%) |
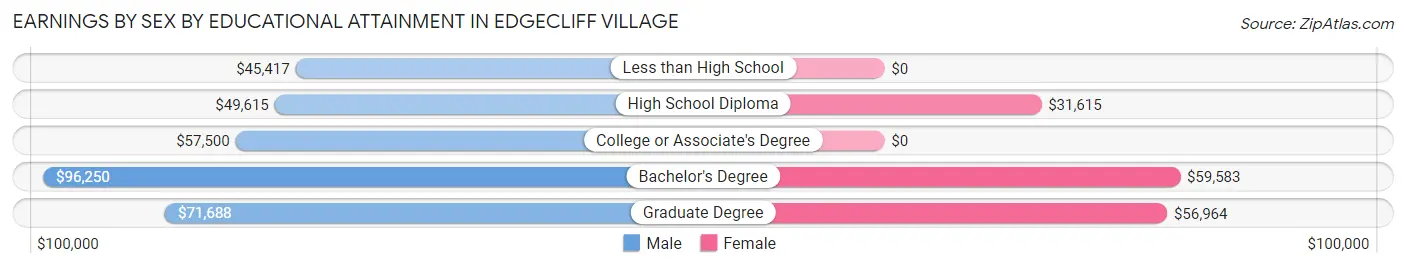
Earnings by Sex by Educational Attainment in Edgecliff Village
Average earnings in Edgecliff Village are $53,537 for men and $50,036 for women, a difference of 6.5%. Men with an educational attainment of bachelor's degree enjoy the highest average annual earnings of $96,250, while those with less than high school education earn the least with $45,417. Women with an educational attainment of bachelor's degree earn the most with the average annual earnings of $59,583, while those with high school diploma education have the smallest earnings of $31,615.
| Educational Attainment | Male Income | Female Income |
| Less than High School | $45,417 | $0 |
| High School Diploma | $49,615 | $31,615 |
| College or Associate's Degree | $57,500 | $0 |
| Bachelor's Degree | $96,250 | $59,583 |
| Graduate Degree | $71,688 | $56,964 |
| Total | $53,537 | $50,036 |
Family Income in Edgecliff Village
Family Income Brackets in Edgecliff Village
According to the Edgecliff Village family income data, there are 274 families falling into the $50,000 to $74,999 income range, which is the most common income bracket and makes up 26.8% of all families.
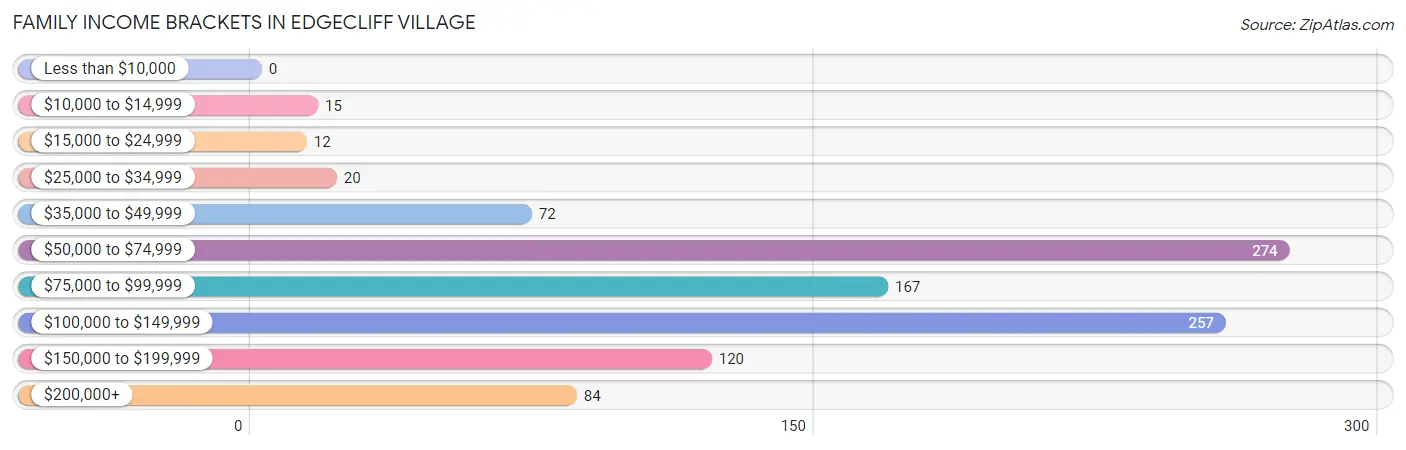
| Income Bracket | # Families | % Families |
| Less than $10,000 | 0 | 0.0% |
| $10,000 to $14,999 | 15 | 1.5% |
| $15,000 to $24,999 | 12 | 1.2% |
| $25,000 to $34,999 | 20 | 2.0% |
| $35,000 to $49,999 | 72 | 7.1% |
| $50,000 to $74,999 | 274 | 26.8% |
| $75,000 to $99,999 | 167 | 16.4% |
| $100,000 to $149,999 | 257 | 25.2% |
| $150,000 to $199,999 | 120 | 11.8% |
| $200,000+ | 84 | 8.2% |
Family Income by Famaliy Size in Edgecliff Village
6-person families (62 | 6.1%) account for the highest median family income in Edgecliff Village with $126,250 per family, while 2-person families (486 | 47.6%) have the highest median income of $46,470 per family member.
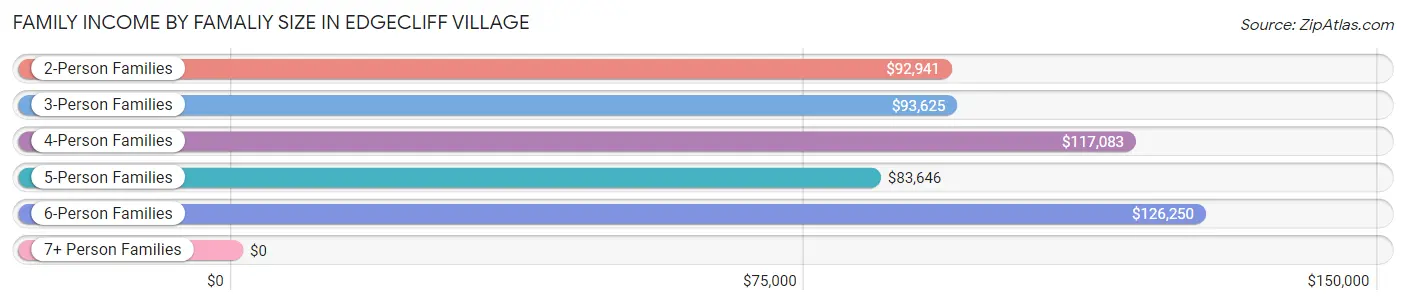
| Income Bracket | # Families | Median Income |
| 2-Person Families | 486 (47.6%) | $92,941 |
| 3-Person Families | 206 (20.2%) | $93,625 |
| 4-Person Families | 174 (17.0%) | $117,083 |
| 5-Person Families | 70 (6.9%) | $83,646 |
| 6-Person Families | 62 (6.1%) | $126,250 |
| 7+ Person Families | 23 (2.2%) | $0 |
| Total | 1,021 (100.0%) | $92,534 |
Family Income by Number of Earners in Edgecliff Village
The median family income in Edgecliff Village is $92,534, with families comprising 3+ earners (109) having the highest median family income of $135,169, while families with no earners (134) have the lowest median family income of $73,200, accounting for 10.7% and 13.1% of families, respectively.
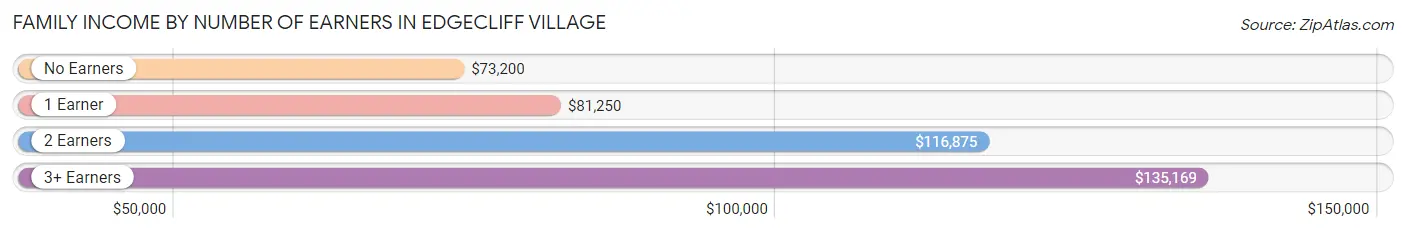
| Number of Earners | # Families | Median Income |
| No Earners | 134 (13.1%) | $73,200 |
| 1 Earner | 341 (33.4%) | $81,250 |
| 2 Earners | 437 (42.8%) | $116,875 |
| 3+ Earners | 109 (10.7%) | $135,169 |
| Total | 1,021 (100.0%) | $92,534 |
Household Income in Edgecliff Village
Household Income Brackets in Edgecliff Village
With 309 households falling in the category, the $50,000 to $74,999 income range is the most frequent in Edgecliff Village, accounting for 23.8% of all households. In contrast, only 8 households (0.6%) fall into the less than $10,000 income bracket, making it the least populous group.
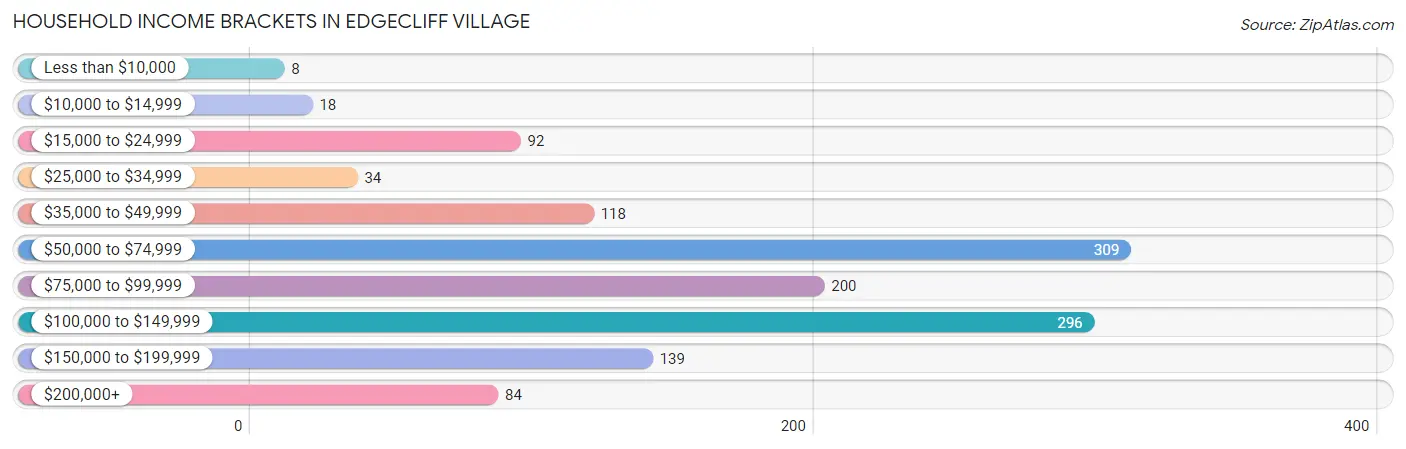
| Income Bracket | # Households | % Households |
| Less than $10,000 | 8 | 0.6% |
| $10,000 to $14,999 | 18 | 1.4% |
| $15,000 to $24,999 | 92 | 7.1% |
| $25,000 to $34,999 | 34 | 2.6% |
| $35,000 to $49,999 | 118 | 9.1% |
| $50,000 to $74,999 | 309 | 23.8% |
| $75,000 to $99,999 | 200 | 15.4% |
| $100,000 to $149,999 | 296 | 22.8% |
| $150,000 to $199,999 | 139 | 10.7% |
| $200,000+ | 84 | 6.5% |
Household Income by Householder Age in Edgecliff Village
The median household income in Edgecliff Village is $84,045, with the highest median household income of $114,773 found in the 25 to 44 years age bracket for the primary householder. A total of 352 households (27.1%) fall into this category. Meanwhile, the 15 to 24 years age bracket for the primary householder has the lowest median household income of $0, with 11 households (0.9%) in this group.
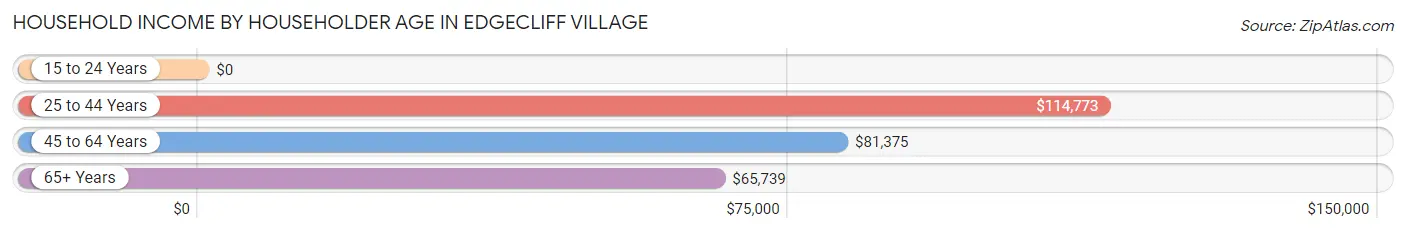
| Income Bracket | # Households | Median Income |
| 15 to 24 Years | 11 (0.9%) | $0 |
| 25 to 44 Years | 352 (27.1%) | $114,773 |
| 45 to 64 Years | 492 (37.9%) | $81,375 |
| 65+ Years | 443 (34.1%) | $65,739 |
| Total | 1,298 (100.0%) | $84,045 |
Poverty in Edgecliff Village
Income Below Poverty by Sex and Age in Edgecliff Village
With 6.4% poverty level for males and 3.2% for females among the residents of Edgecliff Village, 6 to 11 year old males and under 5 year old females are the most vulnerable to poverty, with 39 males (25.8%) and 40 females (18.6%) in their respective age groups living below the poverty level.
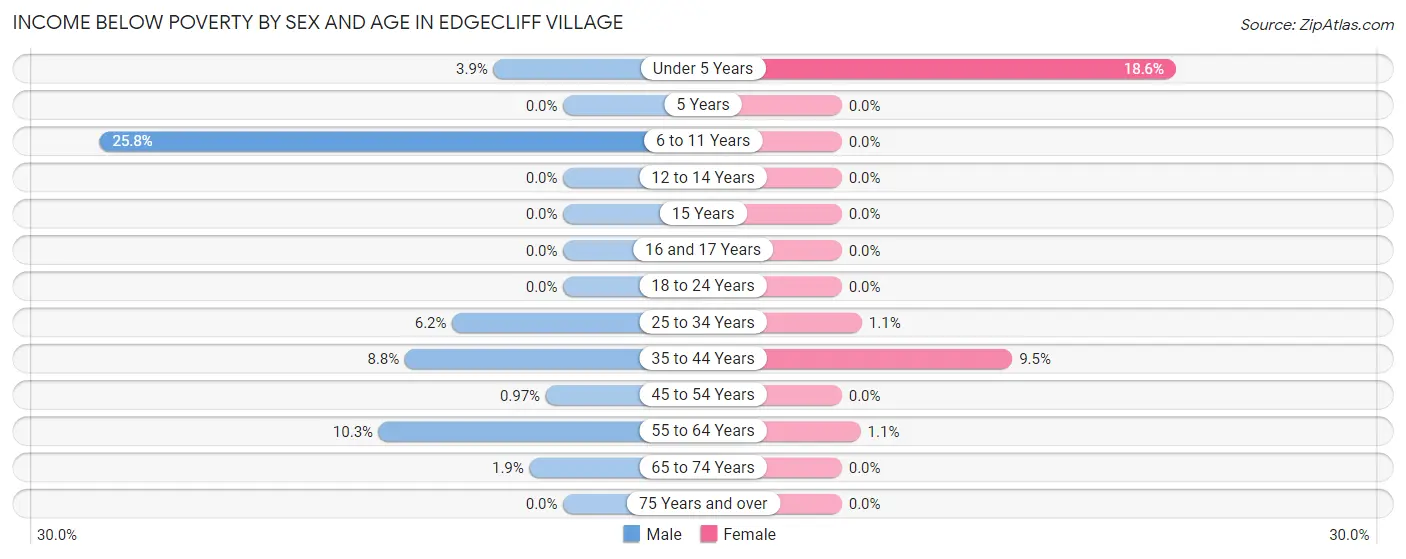
| Age Bracket | Male | Female |
| Under 5 Years | 5 (3.9%) | 40 (18.6%) |
| 5 Years | 0 (0.0%) | 0 (0.0%) |
| 6 to 11 Years | 39 (25.8%) | 0 (0.0%) |
| 12 to 14 Years | 0 (0.0%) | 0 (0.0%) |
| 15 Years | 0 (0.0%) | 0 (0.0%) |
| 16 and 17 Years | 0 (0.0%) | 0 (0.0%) |
| 18 to 24 Years | 0 (0.0%) | 0 (0.0%) |
| 25 to 34 Years | 16 (6.2%) | 3 (1.1%) |
| 35 to 44 Years | 20 (8.8%) | 13 (9.5%) |
| 45 to 54 Years | 2 (1.0%) | 0 (0.0%) |
| 55 to 64 Years | 34 (10.3%) | 3 (1.1%) |
| 65 to 74 Years | 4 (1.9%) | 0 (0.0%) |
| 75 Years and over | 0 (0.0%) | 0 (0.0%) |
| Total | 120 (6.4%) | 59 (3.2%) |
Income Above Poverty by Sex and Age in Edgecliff Village
According to the poverty statistics in Edgecliff Village, males aged 5 years and females aged 5 years are the age groups that are most secure financially, with 100.0% of males and 100.0% of females in these age groups living above the poverty line.
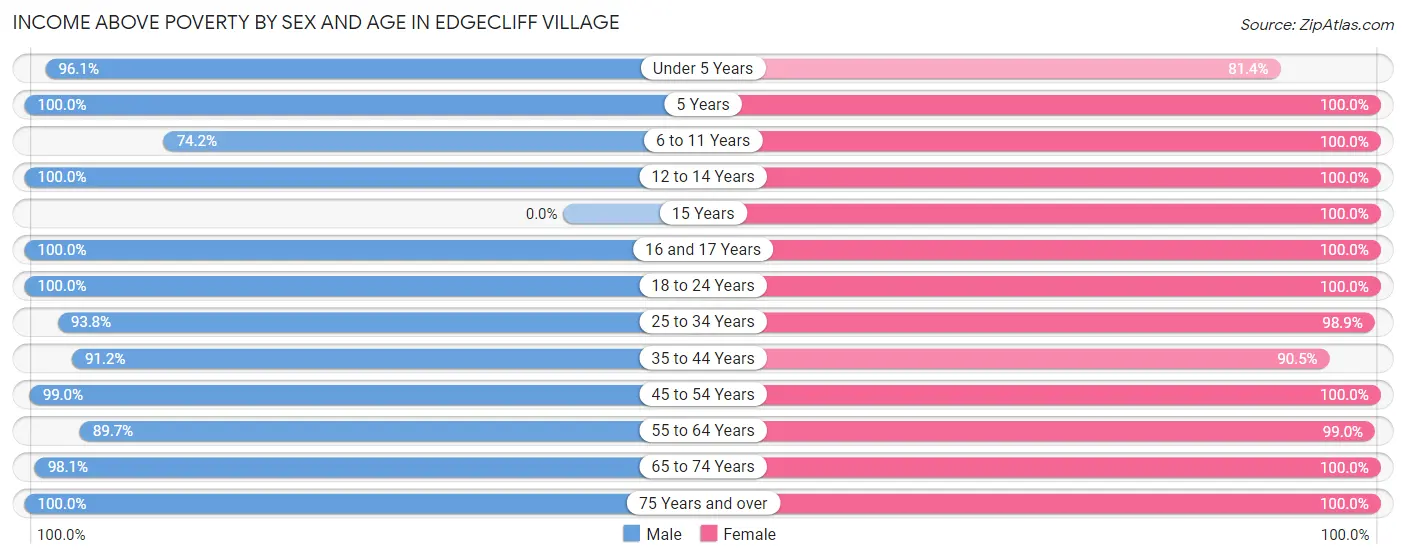
| Age Bracket | Male | Female |
| Under 5 Years | 124 (96.1%) | 175 (81.4%) |
| 5 Years | 41 (100.0%) | 15 (100.0%) |
| 6 to 11 Years | 112 (74.2%) | 115 (100.0%) |
| 12 to 14 Years | 58 (100.0%) | 21 (100.0%) |
| 15 Years | 0 (0.0%) | 43 (100.0%) |
| 16 and 17 Years | 10 (100.0%) | 59 (100.0%) |
| 18 to 24 Years | 153 (100.0%) | 129 (100.0%) |
| 25 to 34 Years | 243 (93.8%) | 266 (98.9%) |
| 35 to 44 Years | 207 (91.2%) | 124 (90.5%) |
| 45 to 54 Years | 204 (99.0%) | 201 (100.0%) |
| 55 to 64 Years | 297 (89.7%) | 282 (99.0%) |
| 65 to 74 Years | 209 (98.1%) | 184 (100.0%) |
| 75 Years and over | 92 (100.0%) | 172 (100.0%) |
| Total | 1,750 (93.6%) | 1,786 (96.8%) |
Income Below Poverty Among Married-Couple Families in Edgecliff Village
The poverty statistics for married-couple families in Edgecliff Village show that 2.3% or 19 of the total 828 families live below the poverty line. Families with 3 or 4 children have the highest poverty rate of 18.4%, comprising of 19 families. On the other hand, families with no children have the lowest poverty rate of 0.0%, which includes 0 families.
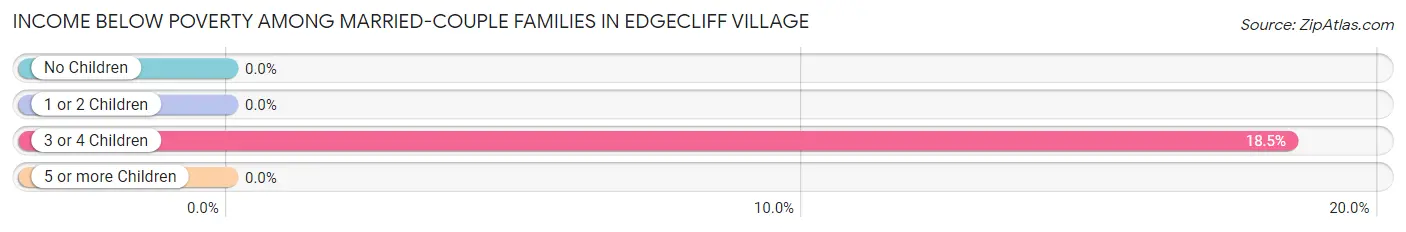
| Children | Above Poverty | Below Poverty |
| No Children | 479 (100.0%) | 0 (0.0%) |
| 1 or 2 Children | 246 (100.0%) | 0 (0.0%) |
| 3 or 4 Children | 84 (81.6%) | 19 (18.4%) |
| 5 or more Children | 0 (0.0%) | 0 (0.0%) |
| Total | 809 (97.7%) | 19 (2.3%) |
Income Below Poverty Among Single-Parent Households in Edgecliff Village
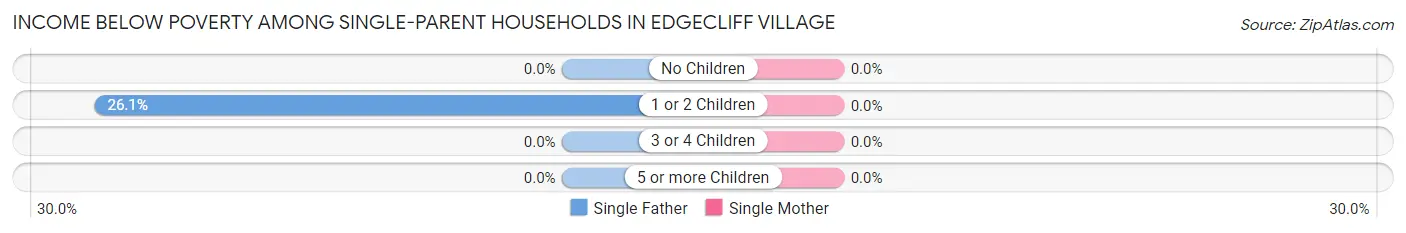
| Children | Single Father | Single Mother |
| No Children | 0 (0.0%) | 0 (0.0%) |
| 1 or 2 Children | 12 (26.1%) | 0 (0.0%) |
| 3 or 4 Children | 0 (0.0%) | 0 (0.0%) |
| 5 or more Children | 0 (0.0%) | 0 (0.0%) |
| Total | 12 (18.2%) | 0 (0.0%) |
Income Below Poverty Among Married-Couple vs Single-Parent Households in Edgecliff Village
The poverty data for Edgecliff Village shows that 19 of the married-couple family households (2.3%) and 12 of the single-parent households (6.2%) are living below the poverty level. Within the married-couple family households, those with 3 or 4 children have the highest poverty rate, with 19 households (18.4%) falling below the poverty line. Among the single-parent households, those with 1 or 2 children have the highest poverty rate, with 12 household (12.2%) living below poverty.
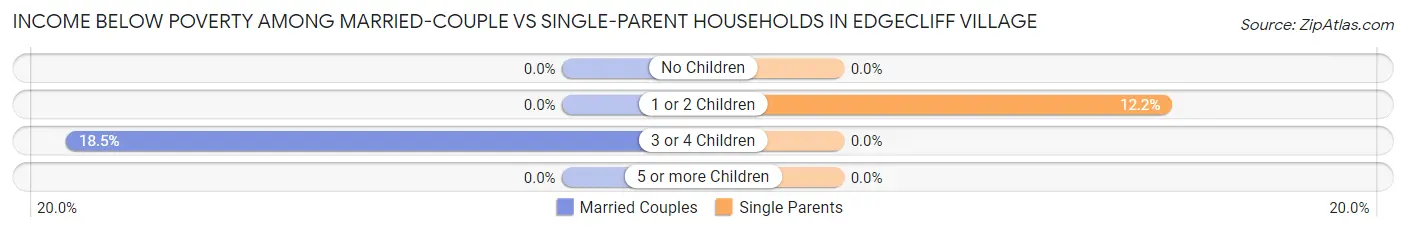
| Children | Married-Couple Families | Single-Parent Households |
| No Children | 0 (0.0%) | 0 (0.0%) |
| 1 or 2 Children | 0 (0.0%) | 12 (12.2%) |
| 3 or 4 Children | 19 (18.4%) | 0 (0.0%) |
| 5 or more Children | 0 (0.0%) | 0 (0.0%) |
| Total | 19 (2.3%) | 12 (6.2%) |
Race in Edgecliff Village
The most populous races in Edgecliff Village are White / Caucasian (2,285 | 61.5%), Hispanic or Latino (1,511 | 40.7%), and Two or more Races (607 | 16.3%).
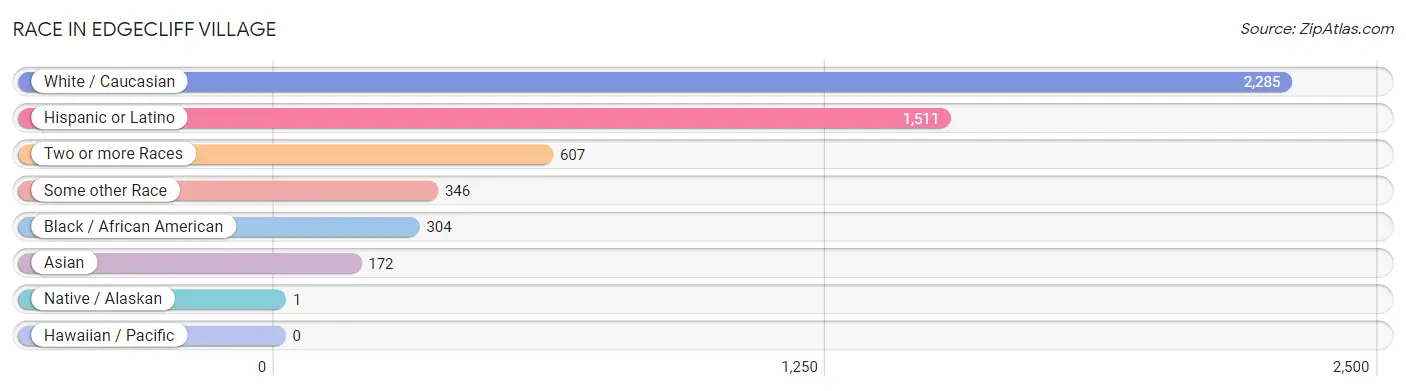
| Race | # Population | % Population |
| Asian | 172 | 4.6% |
| Black / African American | 304 | 8.2% |
| Hawaiian / Pacific | 0 | 0.0% |
| Hispanic or Latino | 1,511 | 40.7% |
| Native / Alaskan | 1 | 0.0% |
| White / Caucasian | 2,285 | 61.5% |
| Two or more Races | 607 | 16.3% |
| Some other Race | 346 | 9.3% |
| Total | 3,715 | 100.0% |
Ancestry in Edgecliff Village
The most populous ancestries reported in Edgecliff Village are Mexican (1,173 | 31.6%), English (446 | 12.0%), German (411 | 11.1%), Irish (261 | 7.0%), and Spaniard (198 | 5.3%), together accounting for 67.0% of all Edgecliff Village residents.
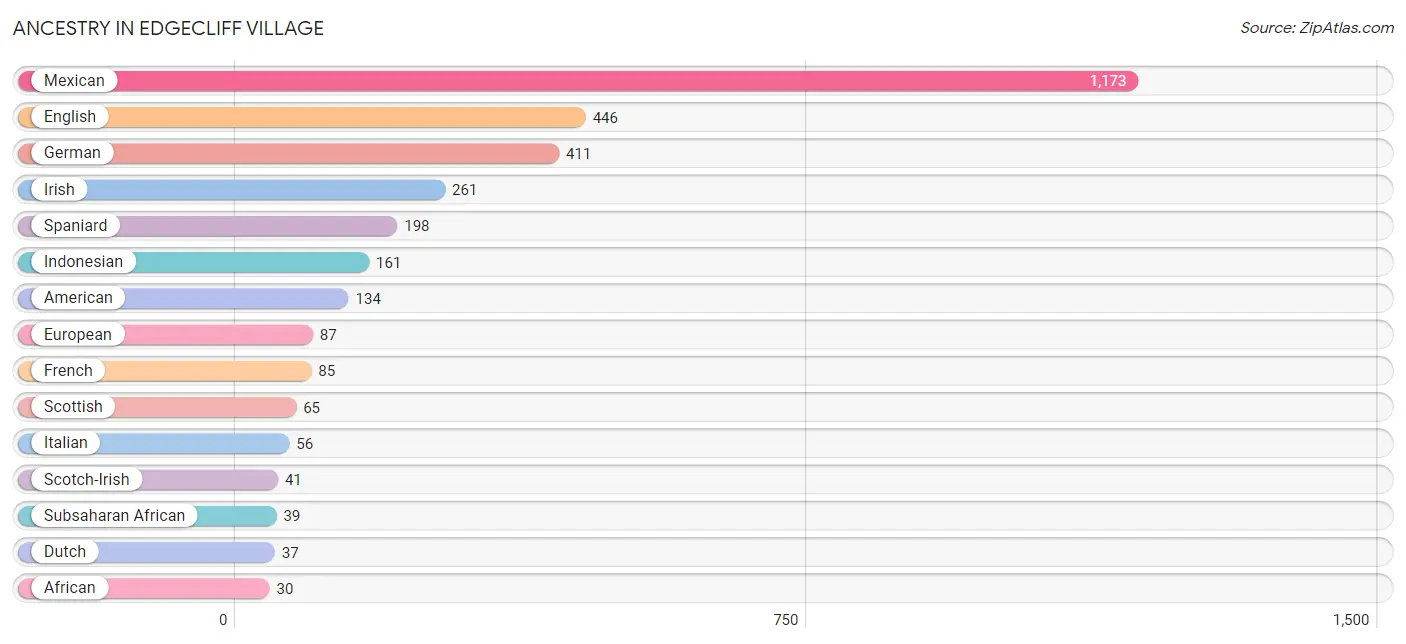
| Ancestry | # Population | % Population |
| African | 30 | 0.8% |
| Alaskan Athabascan | 25 | 0.7% |
| American | 134 | 3.6% |
| Austrian | 4 | 0.1% |
| British | 10 | 0.3% |
| Bulgarian | 12 | 0.3% |
| Central American | 24 | 0.6% |
| Colombian | 14 | 0.4% |
| Czech | 4 | 0.1% |
| Danish | 4 | 0.1% |
| Dutch | 37 | 1.0% |
| Eastern European | 3 | 0.1% |
| English | 446 | 12.0% |
| European | 87 | 2.3% |
| French | 85 | 2.3% |
| German | 411 | 11.1% |
| Greek | 3 | 0.1% |
| Guatemalan | 9 | 0.2% |
| Honduran | 15 | 0.4% |
| Hungarian | 3 | 0.1% |
| Indian (Asian) | 23 | 0.6% |
| Indonesian | 161 | 4.3% |
| Irish | 261 | 7.0% |
| Italian | 56 | 1.5% |
| Korean | 18 | 0.5% |
| Mexican | 1,173 | 31.6% |
| Mexican American Indian | 1 | 0.0% |
| Native Hawaiian | 18 | 0.5% |
| Norwegian | 21 | 0.6% |
| Polish | 15 | 0.4% |
| Portuguese | 4 | 0.1% |
| Puerto Rican | 14 | 0.4% |
| Russian | 7 | 0.2% |
| Scotch-Irish | 41 | 1.1% |
| Scottish | 65 | 1.8% |
| Serbian | 5 | 0.1% |
| South American | 14 | 0.4% |
| Spaniard | 198 | 5.3% |
| Subsaharan African | 39 | 1.1% |
| Swedish | 4 | 0.1% |
| Thai | 17 | 0.5% |
| Welsh | 13 | 0.4% | View All 42 Rows |
Immigrants in Edgecliff Village
The most numerous immigrant groups reported in Edgecliff Village came from Latin America (289 | 7.8%), Central America (275 | 7.4%), Mexico (275 | 7.4%), Asia (174 | 4.7%), and South Eastern Asia (139 | 3.7%), together accounting for 31.0% of all Edgecliff Village residents.
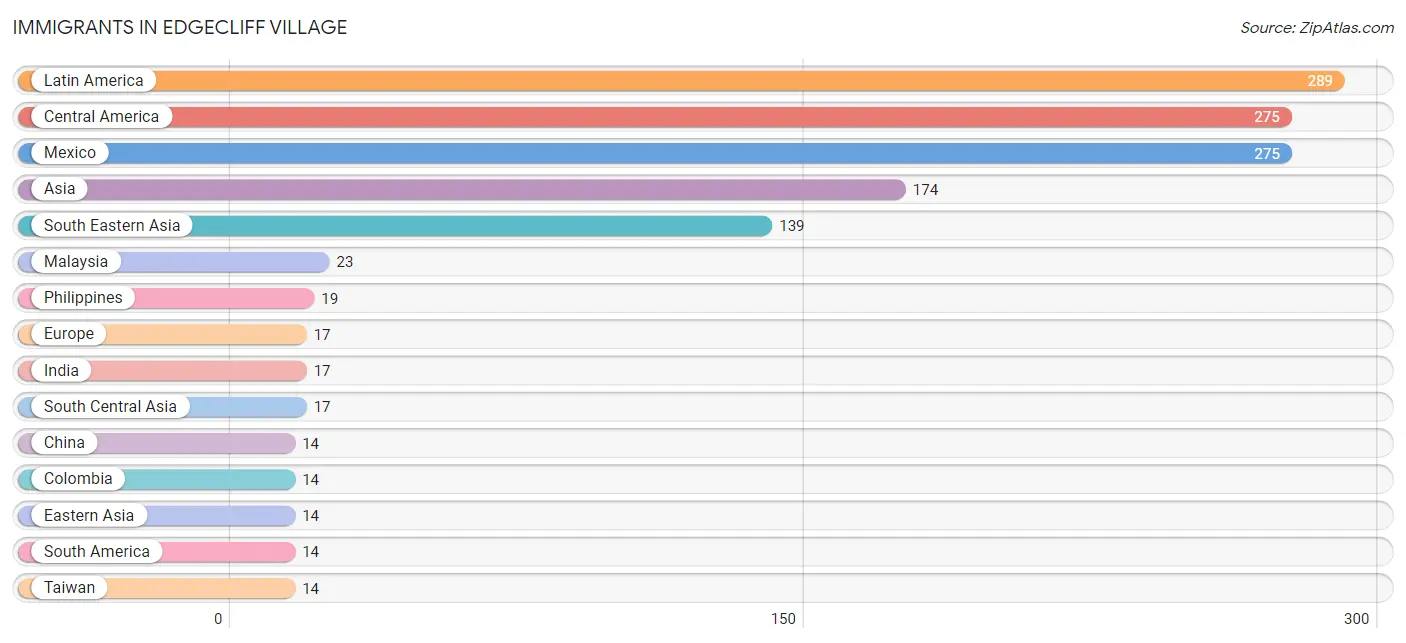
| Immigration Origin | # Population | % Population |
| Africa | 6 | 0.2% |
| Asia | 174 | 4.7% |
| Bulgaria | 5 | 0.1% |
| Central America | 275 | 7.4% |
| China | 14 | 0.4% |
| Colombia | 14 | 0.4% |
| Eastern Asia | 14 | 0.4% |
| Eastern Europe | 5 | 0.1% |
| Europe | 17 | 0.5% |
| Germany | 8 | 0.2% |
| India | 17 | 0.5% |
| Latin America | 289 | 7.8% |
| Malaysia | 23 | 0.6% |
| Mexico | 275 | 7.4% |
| Nigeria | 6 | 0.2% |
| Philippines | 19 | 0.5% |
| Portugal | 4 | 0.1% |
| South America | 14 | 0.4% |
| South Central Asia | 17 | 0.5% |
| South Eastern Asia | 139 | 3.7% |
| Southern Europe | 4 | 0.1% |
| Taiwan | 14 | 0.4% |
| Turkey | 4 | 0.1% |
| Western Africa | 6 | 0.2% |
| Western Asia | 4 | 0.1% |
| Western Europe | 8 | 0.2% | View All 26 Rows |
Sex and Age in Edgecliff Village
Sex and Age in Edgecliff Village
The most populous age groups in Edgecliff Village are 55 to 59 Years (239 | 12.8%) for men and Under 5 Years (215 | 11.7%) for women.
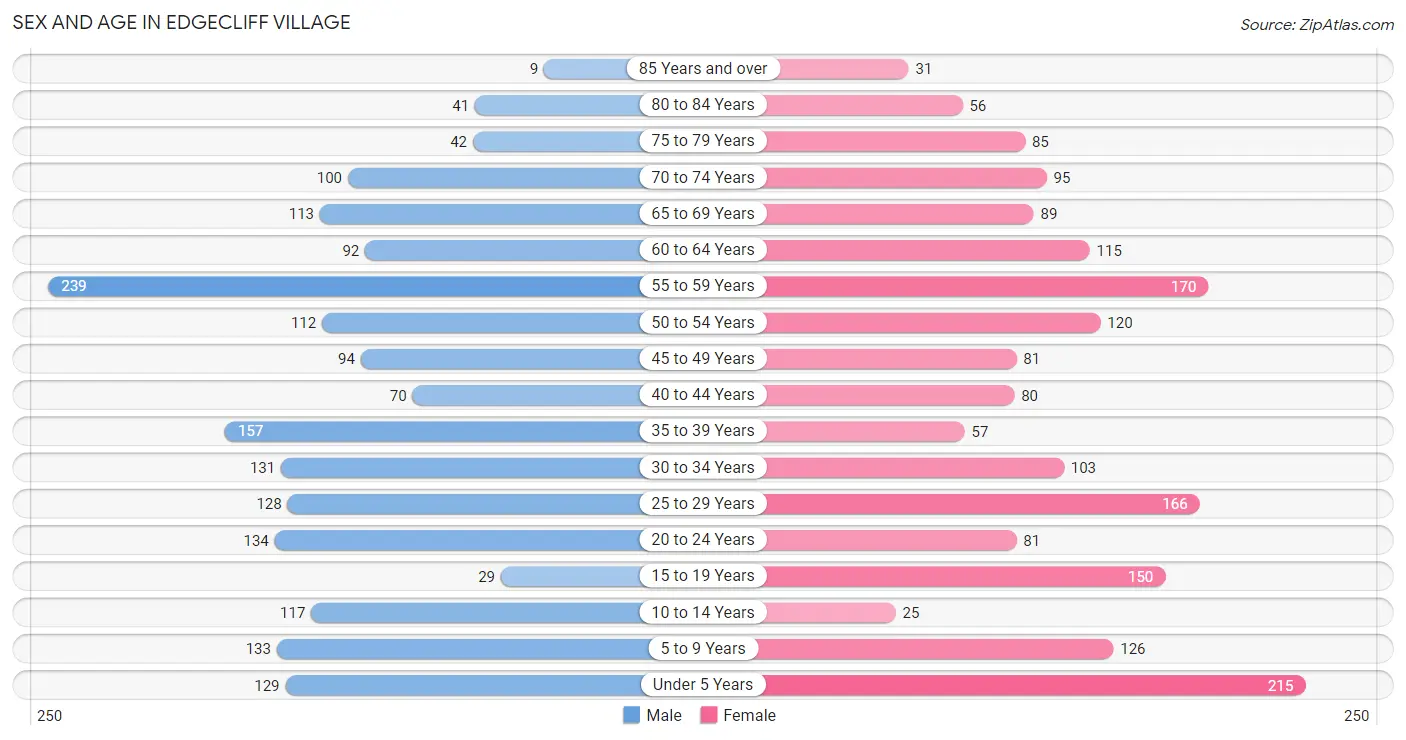
| Age Bracket | Male | Female |
| Under 5 Years | 129 (6.9%) | 215 (11.7%) |
| 5 to 9 Years | 133 (7.1%) | 126 (6.8%) |
| 10 to 14 Years | 117 (6.3%) | 25 (1.4%) |
| 15 to 19 Years | 29 (1.5%) | 150 (8.1%) |
| 20 to 24 Years | 134 (7.2%) | 81 (4.4%) |
| 25 to 29 Years | 128 (6.8%) | 166 (9.0%) |
| 30 to 34 Years | 131 (7.0%) | 103 (5.6%) |
| 35 to 39 Years | 157 (8.4%) | 57 (3.1%) |
| 40 to 44 Years | 70 (3.7%) | 80 (4.3%) |
| 45 to 49 Years | 94 (5.0%) | 81 (4.4%) |
| 50 to 54 Years | 112 (6.0%) | 120 (6.5%) |
| 55 to 59 Years | 239 (12.8%) | 170 (9.2%) |
| 60 to 64 Years | 92 (4.9%) | 115 (6.2%) |
| 65 to 69 Years | 113 (6.0%) | 89 (4.8%) |
| 70 to 74 Years | 100 (5.3%) | 95 (5.1%) |
| 75 to 79 Years | 42 (2.2%) | 85 (4.6%) |
| 80 to 84 Years | 41 (2.2%) | 56 (3.0%) |
| 85 Years and over | 9 (0.5%) | 31 (1.7%) |
| Total | 1,870 (100.0%) | 1,845 (100.0%) |
Families and Households in Edgecliff Village
Median Family Size in Edgecliff Village
The median family size in Edgecliff Village is 3.25 persons per family, with married-couple families (828 | 81.1%) accounting for the largest median family size of 3.4 persons per family. On the other hand, single female/mother families (127 | 12.4%) represent the smallest median family size with 2.56 persons per family.
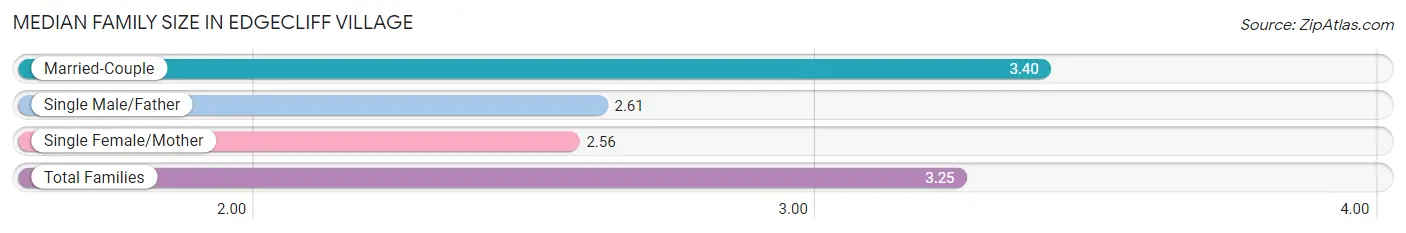
| Family Type | # Families | Family Size |
| Married-Couple | 828 (81.1%) | 3.40 |
| Single Male/Father | 66 (6.5%) | 2.61 |
| Single Female/Mother | 127 (12.4%) | 2.56 |
| Total Families | 1,021 (100.0%) | 3.25 |
Median Household Size in Edgecliff Village
The median household size in Edgecliff Village is 2.86 persons per household, with married-couple households (828 | 63.8%) accounting for the largest median household size of 3.42 persons per household. non-family households (277 | 21.3%) represent the smallest median household size with 1.21 persons per household.
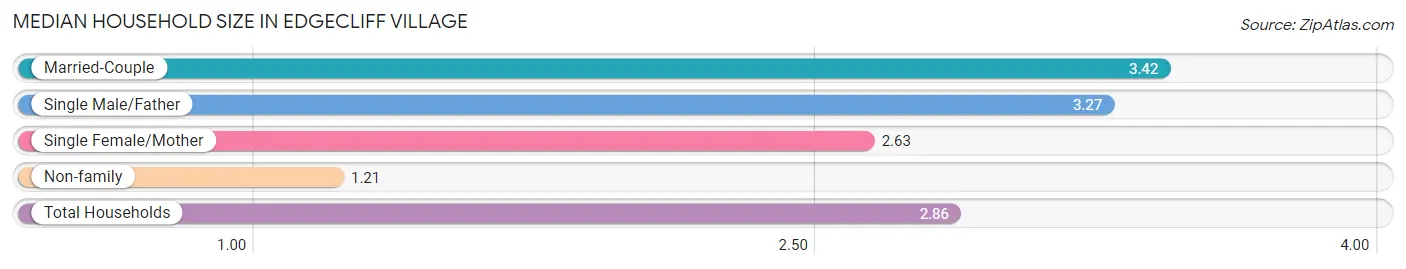
| Household Type | # Households | Household Size |
| Married-Couple | 828 (63.8%) | 3.42 |
| Single Male/Father | 66 (5.1%) | 3.27 |
| Single Female/Mother | 127 (9.8%) | 2.63 |
| Non-family | 277 (21.3%) | 1.21 |
| Total Households | 1,298 (100.0%) | 2.86 |
Household Size by Marriage Status in Edgecliff Village
Out of a total of 1,298 households in Edgecliff Village, 1,021 (78.7%) are family households, while 277 (21.3%) are nonfamily households. The most numerous type of family households are 2-person households, comprising 445, and the most common type of nonfamily households are 1-person households, comprising 236.
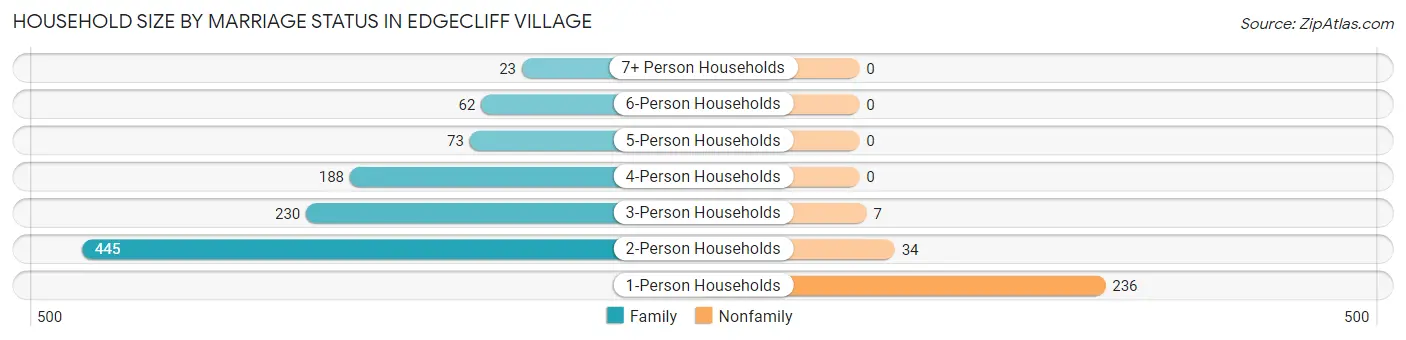
| Household Size | Family Households | Nonfamily Households |
| 1-Person Households | - | 236 (18.2%) |
| 2-Person Households | 445 (34.3%) | 34 (2.6%) |
| 3-Person Households | 230 (17.7%) | 7 (0.5%) |
| 4-Person Households | 188 (14.5%) | 0 (0.0%) |
| 5-Person Households | 73 (5.6%) | 0 (0.0%) |
| 6-Person Households | 62 (4.8%) | 0 (0.0%) |
| 7+ Person Households | 23 (1.8%) | 0 (0.0%) |
| Total | 1,021 (78.7%) | 277 (21.3%) |
Female Fertility in Edgecliff Village
Fertility by Age in Edgecliff Village
Average fertility rate in Edgecliff Village is 109.0 births per 1,000 women. Women in the age bracket of 20 to 34 years have the highest fertility rate with 220.0 births per 1,000 women. Women in the age bracket of 20 to 34 years acount for 95.1% of all women with births.
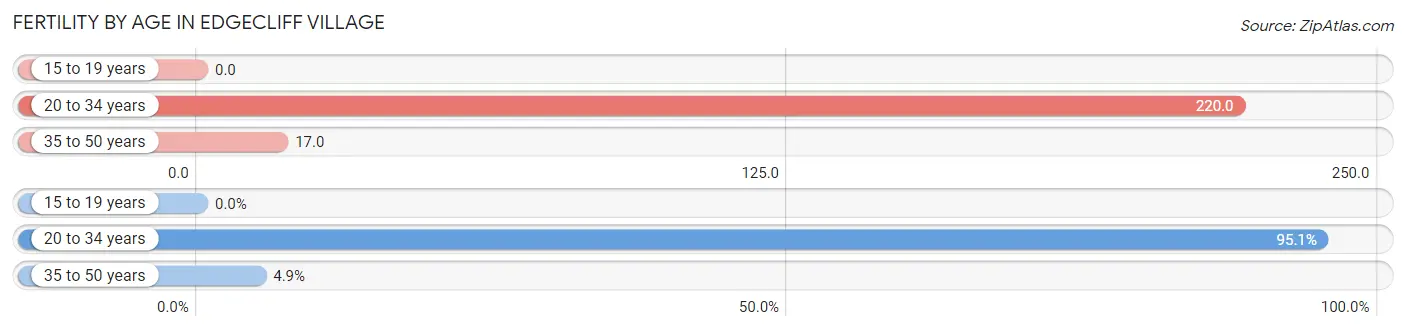
| Age Bracket | Women with Births | Births / 1,000 Women |
| 15 to 19 years | 0 (0.0%) | 0.0 |
| 20 to 34 years | 77 (95.1%) | 220.0 |
| 35 to 50 years | 4 (4.9%) | 17.0 |
| Total | 81 (100.0%) | 109.0 |
Fertility by Age by Marriage Status in Edgecliff Village
95.1% of women with births (81) in Edgecliff Village are married. The highest percentage of unmarried women with births falls into 35 to 50 years age bracket with 100.0% of them unmarried at the time of birth, while the lowest percentage of unmarried women with births belong to 20 to 34 years age bracket with 0.0% of them unmarried.
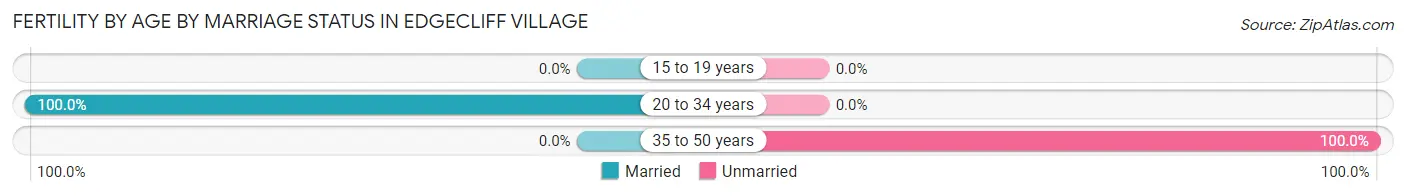
| Age Bracket | Married | Unmarried |
| 15 to 19 years | 0 (0.0%) | 0 (0.0%) |
| 20 to 34 years | 77 (100.0%) | 0 (0.0%) |
| 35 to 50 years | 0 (0.0%) | 4 (100.0%) |
| Total | 77 (95.1%) | 4 (4.9%) |
Fertility by Education in Edgecliff Village
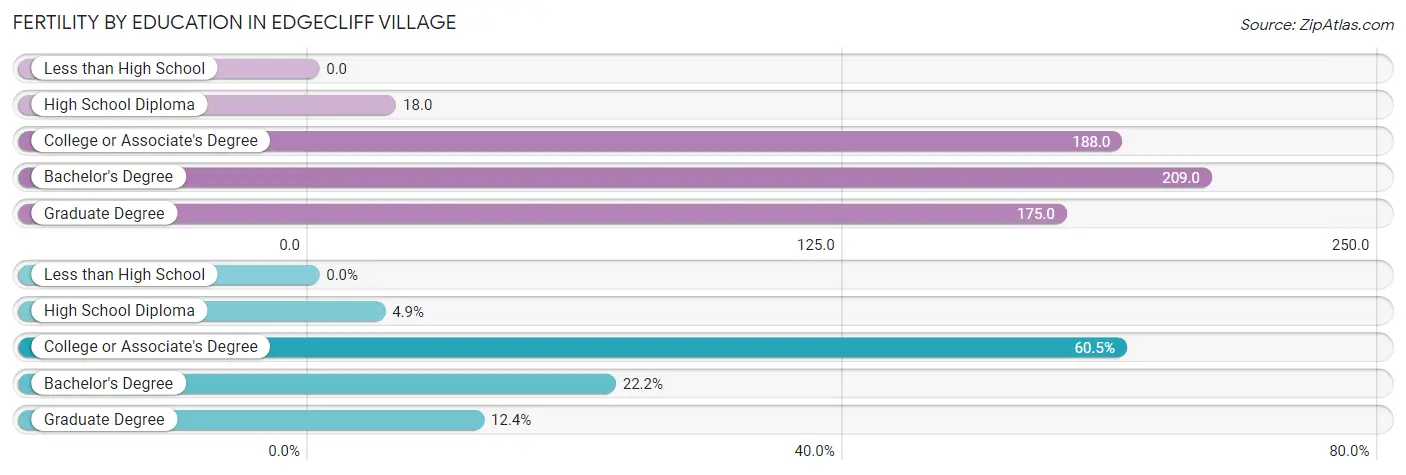
| Educational Attainment | Women with Births | Births / 1,000 Women |
| Less than High School | 0 (0.0%) | 0.0 |
| High School Diploma | 4 (4.9%) | 18.0 |
| College or Associate's Degree | 49 (60.5%) | 188.0 |
| Bachelor's Degree | 18 (22.2%) | 209.0 |
| Graduate Degree | 10 (12.3%) | 175.0 |
| Total | 81 (100.0%) | 109.0 |
Fertility by Education by Marriage Status in Edgecliff Village
4.9% of women with births in Edgecliff Village are unmarried. Women with the educational attainment of college or associate's degree are most likely to be married with 100.0% of them married at childbirth, while women with the educational attainment of high school diploma are least likely to be married with 100.0% of them unmarried at childbirth.
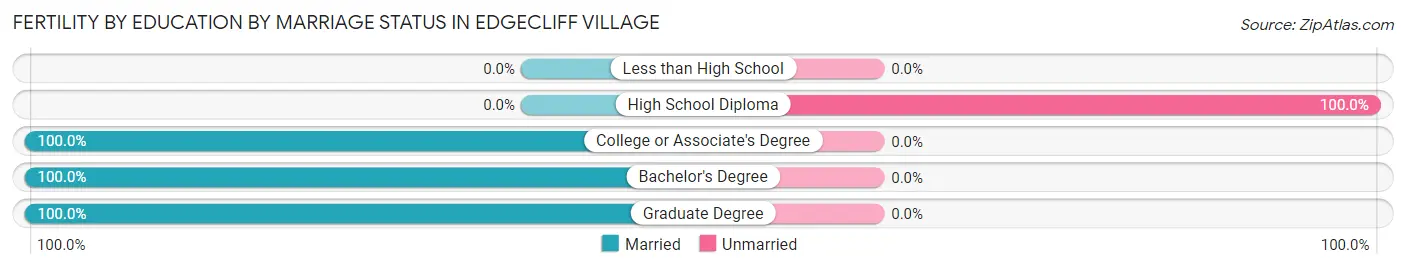
| Educational Attainment | Married | Unmarried |
| Less than High School | 0 (0.0%) | 0 (0.0%) |
| High School Diploma | 0 (0.0%) | 4 (100.0%) |
| College or Associate's Degree | 49 (100.0%) | 0 (0.0%) |
| Bachelor's Degree | 18 (100.0%) | 0 (0.0%) |
| Graduate Degree | 10 (100.0%) | 0 (0.0%) |
| Total | 77 (95.1%) | 4 (4.9%) |
Employment Characteristics in Edgecliff Village
Employment by Class of Employer in Edgecliff Village
Among the 1,664 employed individuals in Edgecliff Village, private company employees (1,158 | 69.6%), self-employed (not incorporated) (154 | 9.2%), and local government employees (100 | 6.0%) make up the most common classes of employment.
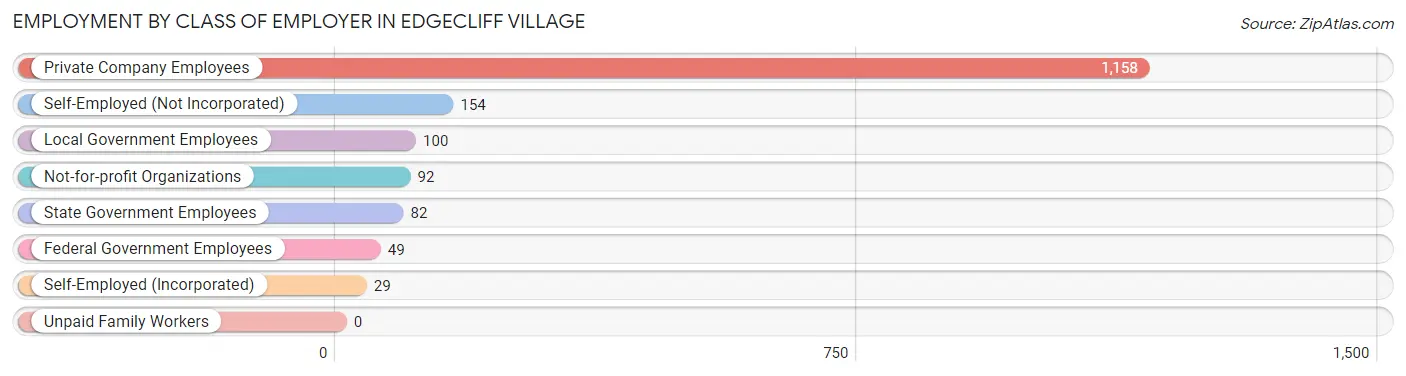
| Employer Class | # Employees | % Employees |
| Private Company Employees | 1,158 | 69.6% |
| Self-Employed (Incorporated) | 29 | 1.7% |
| Self-Employed (Not Incorporated) | 154 | 9.2% |
| Not-for-profit Organizations | 92 | 5.5% |
| Local Government Employees | 100 | 6.0% |
| State Government Employees | 82 | 4.9% |
| Federal Government Employees | 49 | 2.9% |
| Unpaid Family Workers | 0 | 0.0% |
| Total | 1,664 | 100.0% |
Employment Status by Age in Edgecliff Village
According to the labor force statistics for Edgecliff Village, out of the total population over 16 years of age (2,927), 63.5% or 1,859 individuals are in the labor force, with 8.7% or 162 of them unemployed. The age group with the highest labor force participation rate is 20 to 24 years, with 90.7% or 195 individuals in the labor force. Within the labor force, the 65 to 74 years age range has the highest percentage of unemployed individuals, with 19.6% or 20 of them being unemployed.
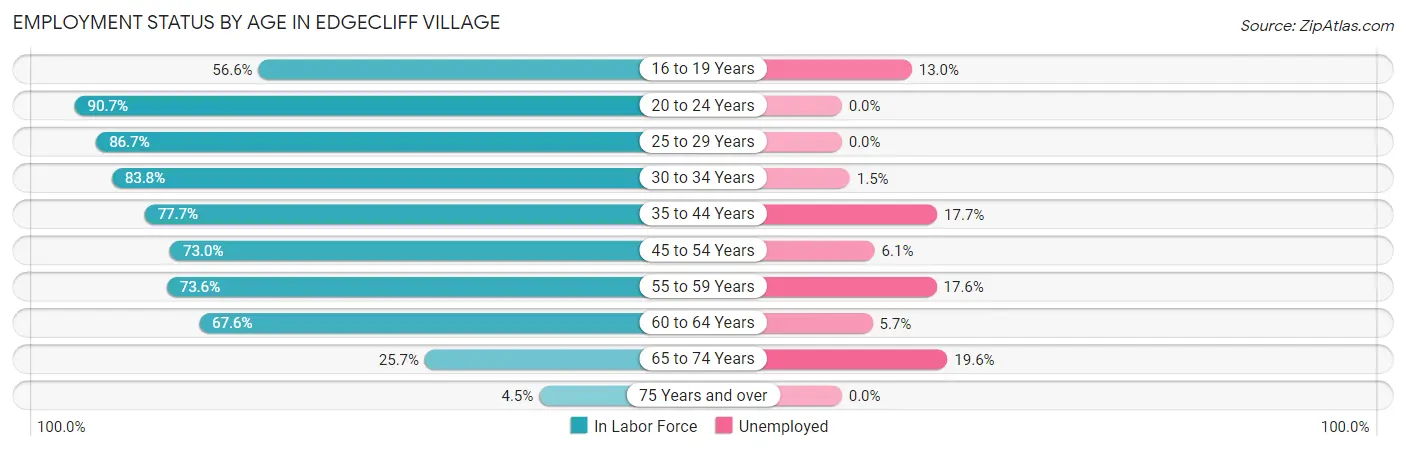
| Age Bracket | In Labor Force | Unemployed |
| 16 to 19 Years | 77 (56.6%) | 10 (13.0%) |
| 20 to 24 Years | 195 (90.7%) | 0 (0.0%) |
| 25 to 29 Years | 255 (86.7%) | 0 (0.0%) |
| 30 to 34 Years | 196 (83.8%) | 3 (1.5%) |
| 35 to 44 Years | 283 (77.7%) | 50 (17.7%) |
| 45 to 54 Years | 297 (73.0%) | 18 (6.1%) |
| 55 to 59 Years | 301 (73.6%) | 53 (17.6%) |
| 60 to 64 Years | 140 (67.6%) | 8 (5.7%) |
| 65 to 74 Years | 102 (25.7%) | 20 (19.6%) |
| 75 Years and over | 12 (4.5%) | 0 (0.0%) |
| Total | 1,859 (63.5%) | 162 (8.7%) |
Employment Status by Educational Attainment in Edgecliff Village
According to labor force statistics for Edgecliff Village, 76.9% of individuals (1,473) out of the total population between 25 and 64 years of age (1,915) are in the labor force, with 9.0% or 133 of them being unemployed. The group with the highest labor force participation rate are those with the educational attainment of bachelor's degree or higher, with 87.6% or 473 individuals in the labor force. Within the labor force, individuals with bachelor's degree or higher education have the highest percentage of unemployment, with 16.9% or 80 of them being unemployed.
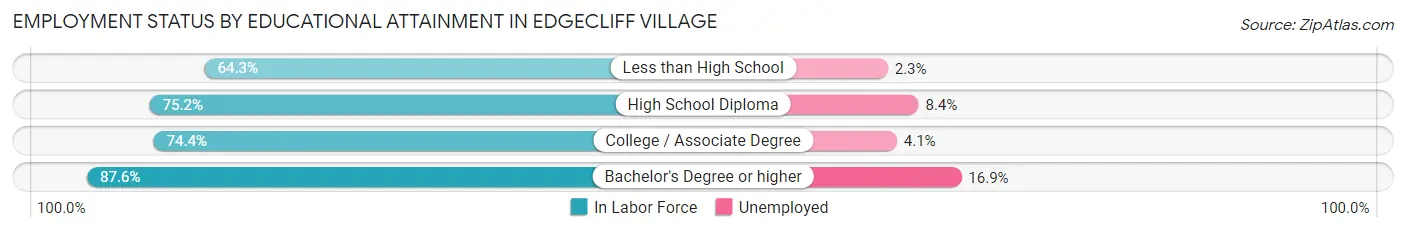
| Educational Attainment | In Labor Force | Unemployed |
| Less than High School | 173 (64.3%) | 6 (2.3%) |
| High School Diploma | 333 (75.2%) | 37 (8.4%) |
| College / Associate Degree | 493 (74.4%) | 27 (4.1%) |
| Bachelor's Degree or higher | 473 (87.6%) | 91 (16.9%) |
| Total | 1,473 (76.9%) | 172 (9.0%) |
Employment Occupations by Sex in Edgecliff Village
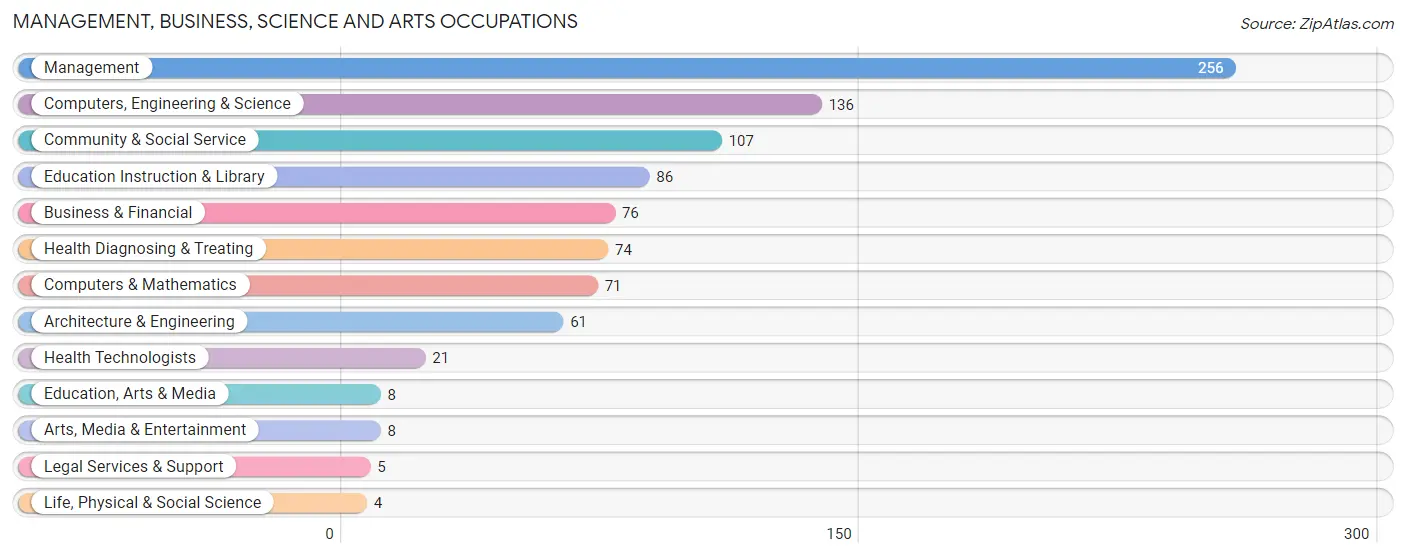
Management, Business, Science and Arts Occupations
The most common Management, Business, Science and Arts occupations in Edgecliff Village are Management (256 | 15.1%), Computers, Engineering & Science (136 | 8.0%), Community & Social Service (107 | 6.3%), Education Instruction & Library (86 | 5.1%), and Business & Financial (76 | 4.5%).
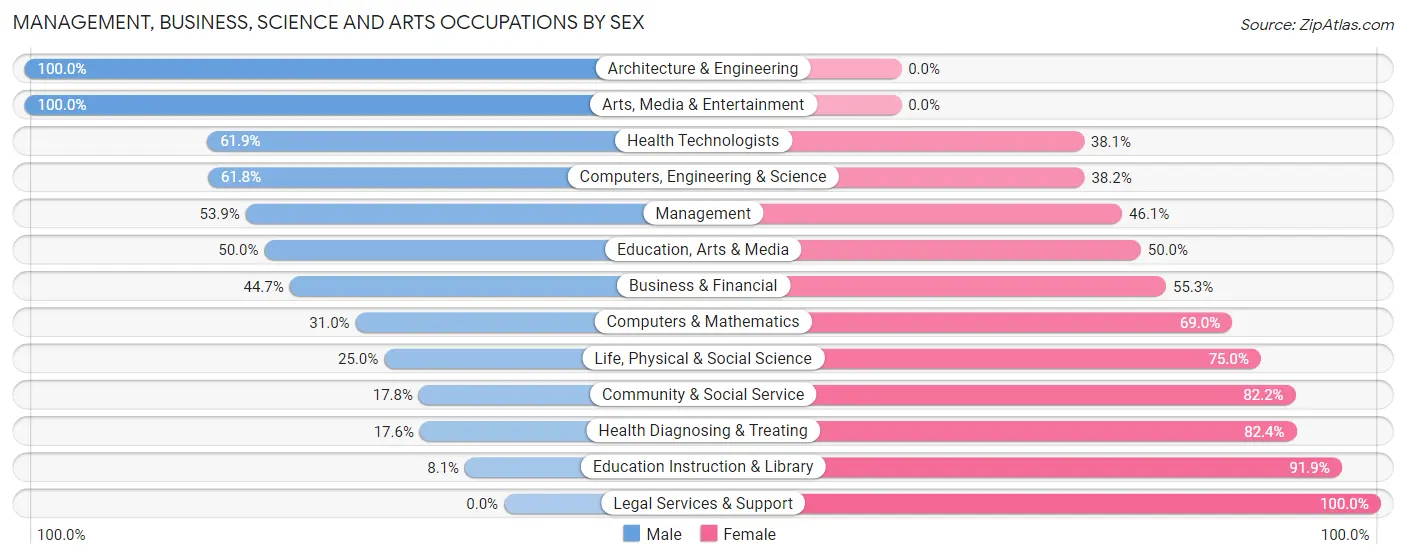
Management, Business, Science and Arts Occupations by Sex
Within the Management, Business, Science and Arts occupations in Edgecliff Village, the most male-oriented occupations are Architecture & Engineering (100.0%), Arts, Media & Entertainment (100.0%), and Health Technologists (61.9%), while the most female-oriented occupations are Legal Services & Support (100.0%), Education Instruction & Library (91.9%), and Health Diagnosing & Treating (82.4%).
| Occupation | Male | Female |
| Management | 138 (53.9%) | 118 (46.1%) |
| Business & Financial | 34 (44.7%) | 42 (55.3%) |
| Computers, Engineering & Science | 84 (61.8%) | 52 (38.2%) |
| Computers & Mathematics | 22 (31.0%) | 49 (69.0%) |
| Architecture & Engineering | 61 (100.0%) | 0 (0.0%) |
| Life, Physical & Social Science | 1 (25.0%) | 3 (75.0%) |
| Community & Social Service | 19 (17.8%) | 88 (82.2%) |
| Education, Arts & Media | 4 (50.0%) | 4 (50.0%) |
| Legal Services & Support | 0 (0.0%) | 5 (100.0%) |
| Education Instruction & Library | 7 (8.1%) | 79 (91.9%) |
| Arts, Media & Entertainment | 8 (100.0%) | 0 (0.0%) |
| Health Diagnosing & Treating | 13 (17.6%) | 61 (82.4%) |
| Health Technologists | 13 (61.9%) | 8 (38.1%) |
| Total (Category) | 288 (44.4%) | 361 (55.6%) |
| Total (Overall) | 1,033 (60.9%) | 663 (39.1%) |
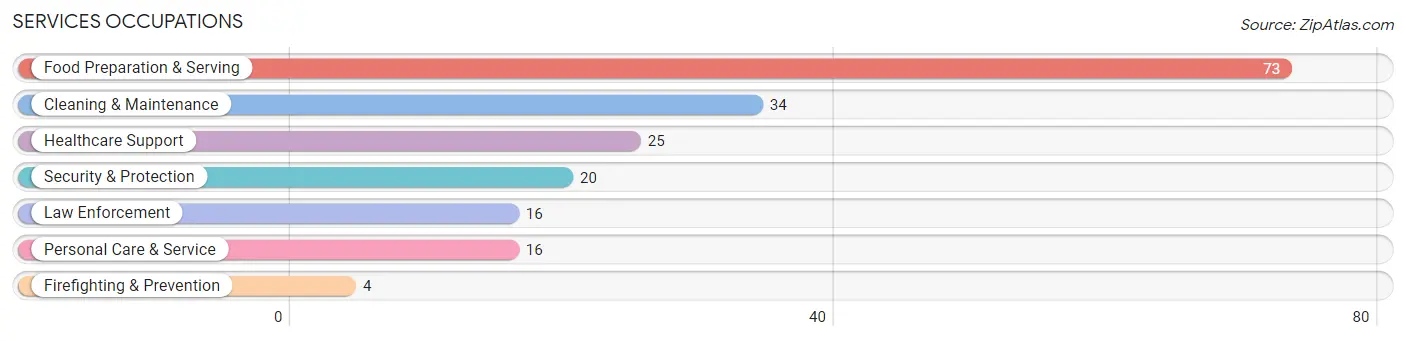
Services Occupations
The most common Services occupations in Edgecliff Village are Food Preparation & Serving (73 | 4.3%), Cleaning & Maintenance (34 | 2.0%), Healthcare Support (25 | 1.5%), Security & Protection (20 | 1.2%), and Law Enforcement (16 | 0.9%).
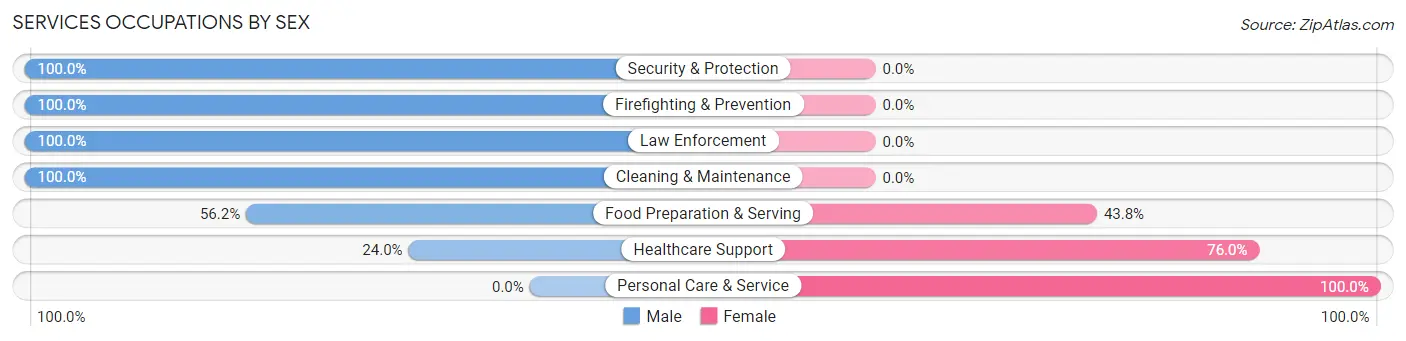
Services Occupations by Sex
Within the Services occupations in Edgecliff Village, the most male-oriented occupations are Security & Protection (100.0%), Firefighting & Prevention (100.0%), and Law Enforcement (100.0%), while the most female-oriented occupations are Personal Care & Service (100.0%), Healthcare Support (76.0%), and Food Preparation & Serving (43.8%).
| Occupation | Male | Female |
| Healthcare Support | 6 (24.0%) | 19 (76.0%) |
| Security & Protection | 20 (100.0%) | 0 (0.0%) |
| Firefighting & Prevention | 4 (100.0%) | 0 (0.0%) |
| Law Enforcement | 16 (100.0%) | 0 (0.0%) |
| Food Preparation & Serving | 41 (56.2%) | 32 (43.8%) |
| Cleaning & Maintenance | 34 (100.0%) | 0 (0.0%) |
| Personal Care & Service | 0 (0.0%) | 16 (100.0%) |
| Total (Category) | 101 (60.1%) | 67 (39.9%) |
| Total (Overall) | 1,033 (60.9%) | 663 (39.1%) |
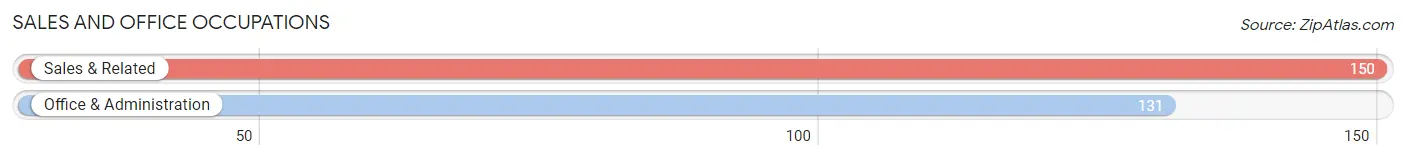
Sales and Office Occupations
The most common Sales and Office occupations in Edgecliff Village are Sales & Related (150 | 8.8%), and Office & Administration (131 | 7.7%).
Sales and Office Occupations by Sex
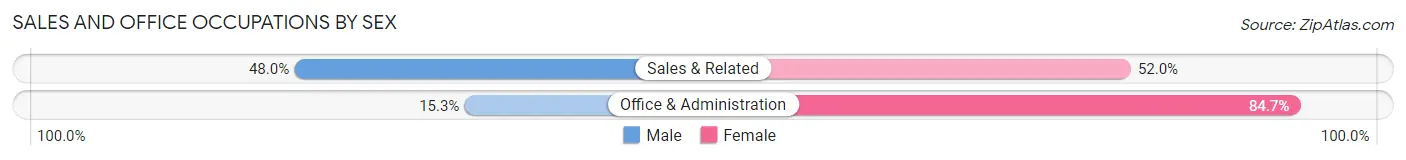
| Occupation | Male | Female |
| Sales & Related | 72 (48.0%) | 78 (52.0%) |
| Office & Administration | 20 (15.3%) | 111 (84.7%) |
| Total (Category) | 92 (32.7%) | 189 (67.3%) |
| Total (Overall) | 1,033 (60.9%) | 663 (39.1%) |
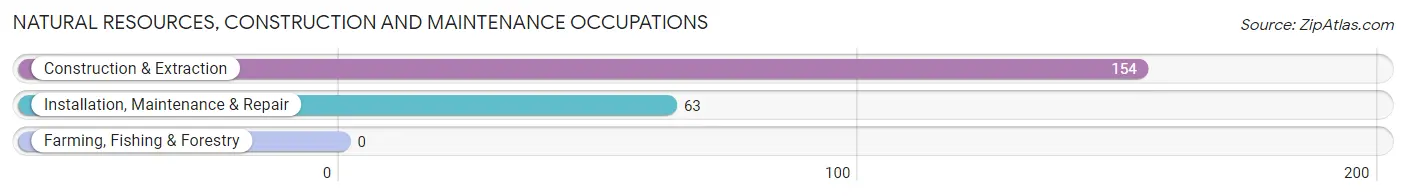
Natural Resources, Construction and Maintenance Occupations
The most common Natural Resources, Construction and Maintenance occupations in Edgecliff Village are Construction & Extraction (154 | 9.1%), and Installation, Maintenance & Repair (63 | 3.7%).
Natural Resources, Construction and Maintenance Occupations by Sex
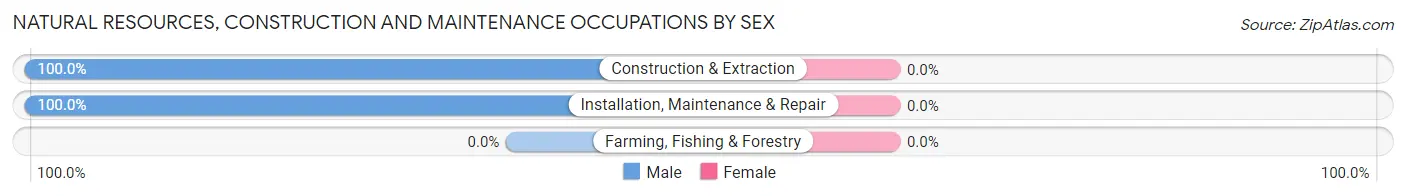
| Occupation | Male | Female |
| Farming, Fishing & Forestry | 0 (0.0%) | 0 (0.0%) |
| Construction & Extraction | 154 (100.0%) | 0 (0.0%) |
| Installation, Maintenance & Repair | 63 (100.0%) | 0 (0.0%) |
| Total (Category) | 217 (100.0%) | 0 (0.0%) |
| Total (Overall) | 1,033 (60.9%) | 663 (39.1%) |
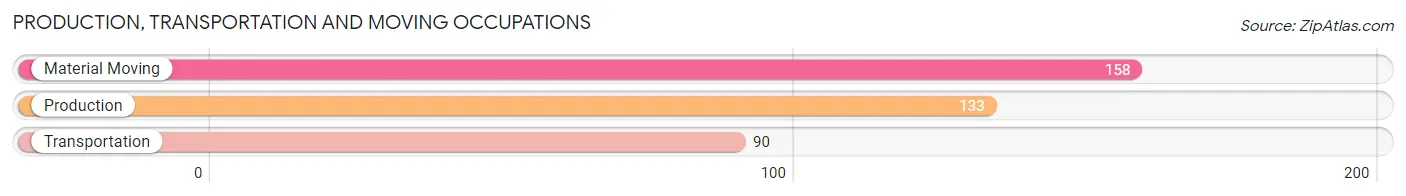
Production, Transportation and Moving Occupations
The most common Production, Transportation and Moving occupations in Edgecliff Village are Material Moving (158 | 9.3%), Production (133 | 7.8%), and Transportation (90 | 5.3%).
Production, Transportation and Moving Occupations by Sex
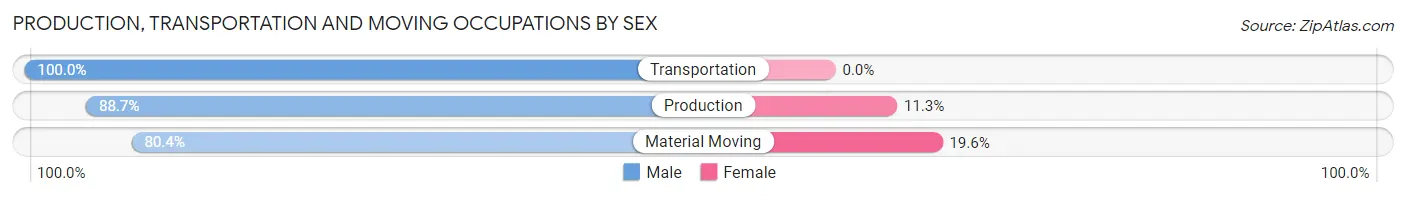
| Occupation | Male | Female |
| Production | 118 (88.7%) | 15 (11.3%) |
| Transportation | 90 (100.0%) | 0 (0.0%) |
| Material Moving | 127 (80.4%) | 31 (19.6%) |
| Total (Category) | 335 (87.9%) | 46 (12.1%) |
| Total (Overall) | 1,033 (60.9%) | 663 (39.1%) |
Employment Industries by Sex in Edgecliff Village
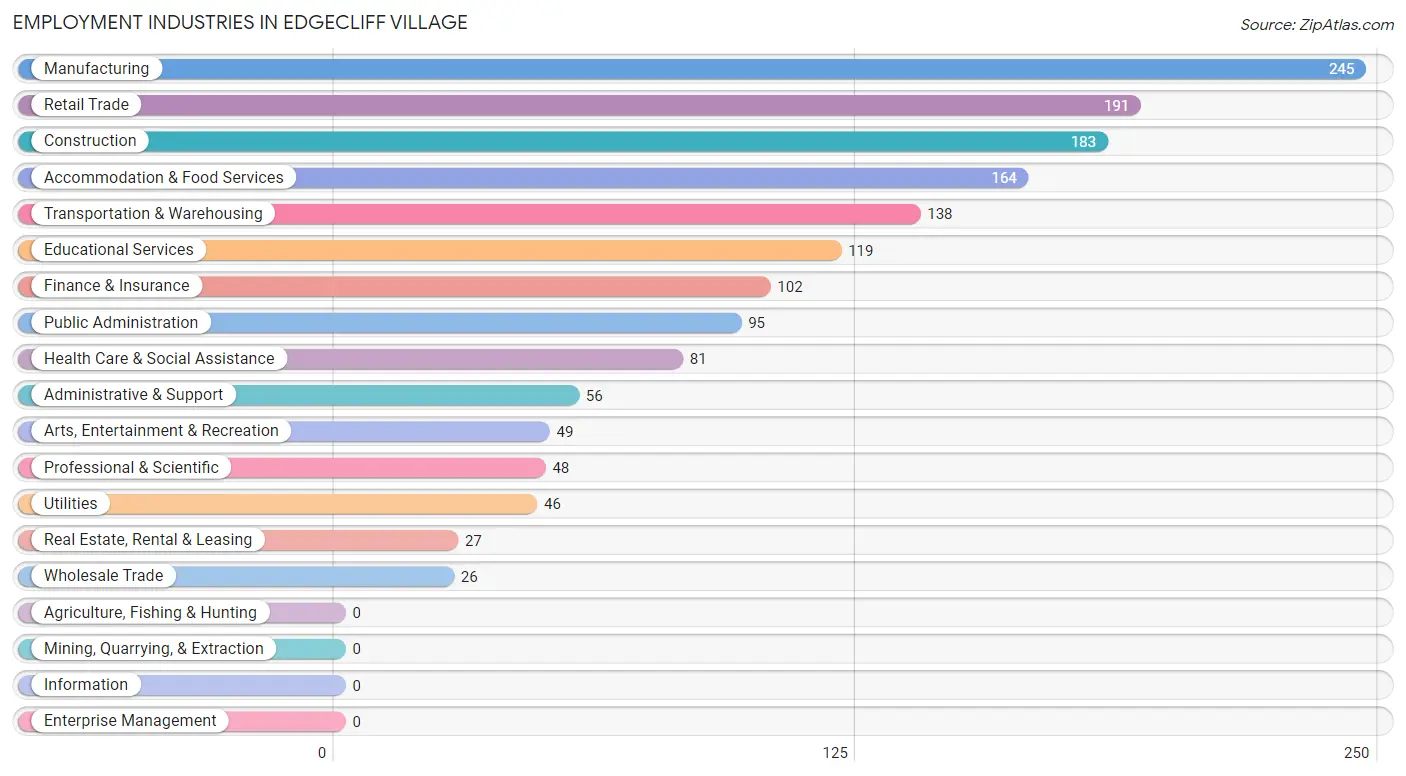
Employment Industries in Edgecliff Village
The major employment industries in Edgecliff Village include Manufacturing (245 | 14.4%), Retail Trade (191 | 11.3%), Construction (183 | 10.8%), Accommodation & Food Services (164 | 9.7%), and Transportation & Warehousing (138 | 8.1%).
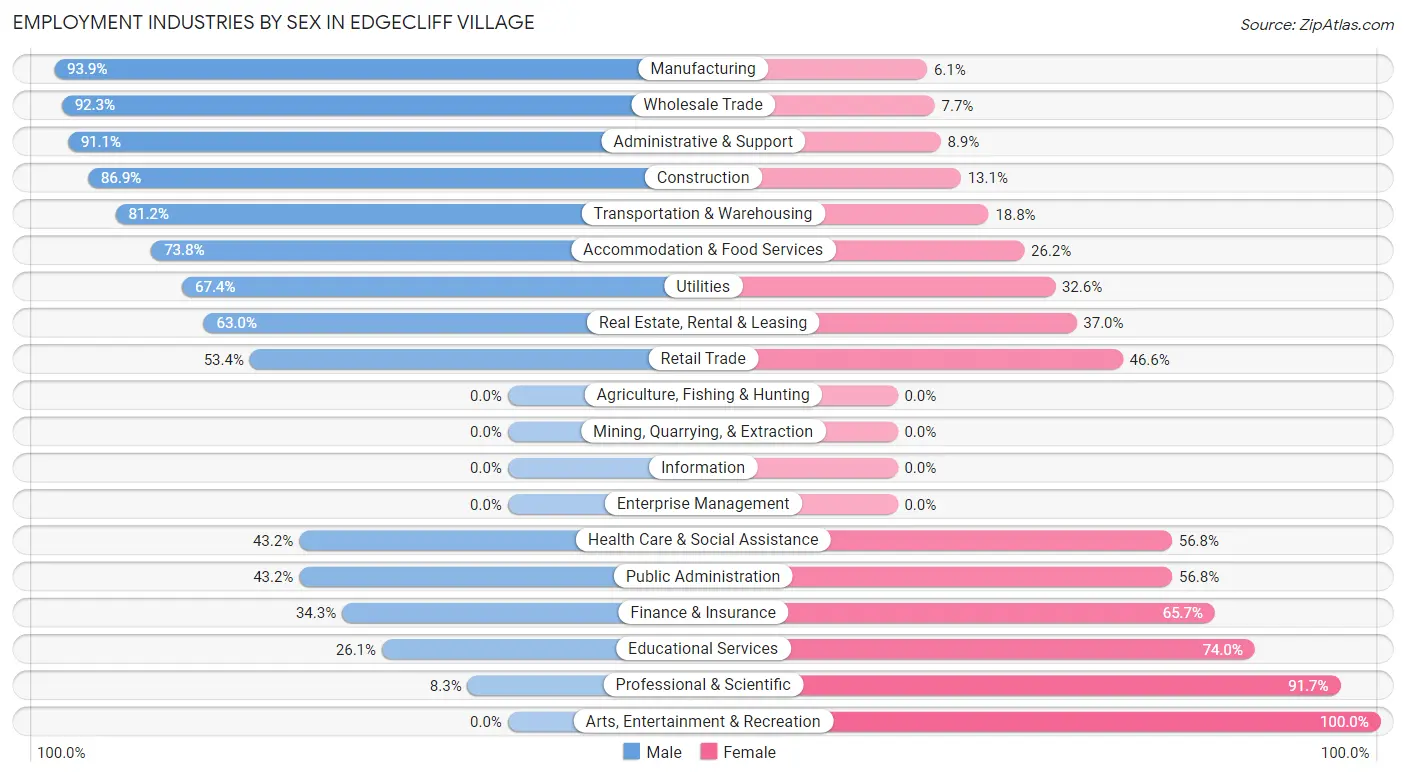
Employment Industries by Sex in Edgecliff Village
The Edgecliff Village industries that see more men than women are Manufacturing (93.9%), Wholesale Trade (92.3%), and Administrative & Support (91.1%), whereas the industries that tend to have a higher number of women are Arts, Entertainment & Recreation (100.0%), Professional & Scientific (91.7%), and Educational Services (74.0%).
| Industry | Male | Female |
| Agriculture, Fishing & Hunting | 0 (0.0%) | 0 (0.0%) |
| Mining, Quarrying, & Extraction | 0 (0.0%) | 0 (0.0%) |
| Construction | 159 (86.9%) | 24 (13.1%) |
| Manufacturing | 230 (93.9%) | 15 (6.1%) |
| Wholesale Trade | 24 (92.3%) | 2 (7.7%) |
| Retail Trade | 102 (53.4%) | 89 (46.6%) |
| Transportation & Warehousing | 112 (81.2%) | 26 (18.8%) |
| Utilities | 31 (67.4%) | 15 (32.6%) |
| Information | 0 (0.0%) | 0 (0.0%) |
| Finance & Insurance | 35 (34.3%) | 67 (65.7%) |
| Real Estate, Rental & Leasing | 17 (63.0%) | 10 (37.0%) |
| Professional & Scientific | 4 (8.3%) | 44 (91.7%) |
| Enterprise Management | 0 (0.0%) | 0 (0.0%) |
| Administrative & Support | 51 (91.1%) | 5 (8.9%) |
| Educational Services | 31 (26.1%) | 88 (74.0%) |
| Health Care & Social Assistance | 35 (43.2%) | 46 (56.8%) |
| Arts, Entertainment & Recreation | 0 (0.0%) | 49 (100.0%) |
| Accommodation & Food Services | 121 (73.8%) | 43 (26.2%) |
| Public Administration | 41 (43.2%) | 54 (56.8%) |
| Total | 1,033 (60.9%) | 663 (39.1%) |
Education in Edgecliff Village
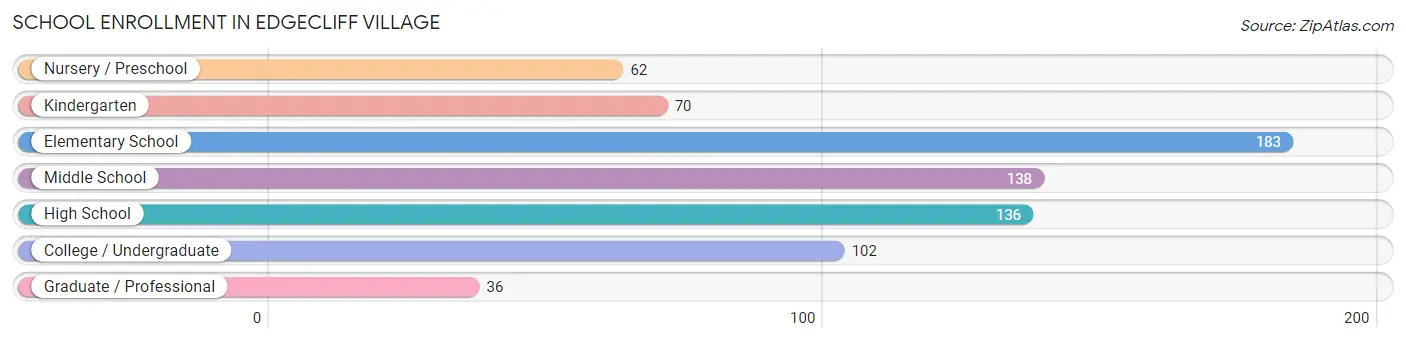
School Enrollment in Edgecliff Village
The most common levels of schooling among the 727 students in Edgecliff Village are elementary school (183 | 25.2%), middle school (138 | 19.0%), and high school (136 | 18.7%).
| School Level | # Students | % Students |
| Nursery / Preschool | 62 | 8.5% |
| Kindergarten | 70 | 9.6% |
| Elementary School | 183 | 25.2% |
| Middle School | 138 | 19.0% |
| High School | 136 | 18.7% |
| College / Undergraduate | 102 | 14.0% |
| Graduate / Professional | 36 | 5.0% |
| Total | 727 | 100.0% |
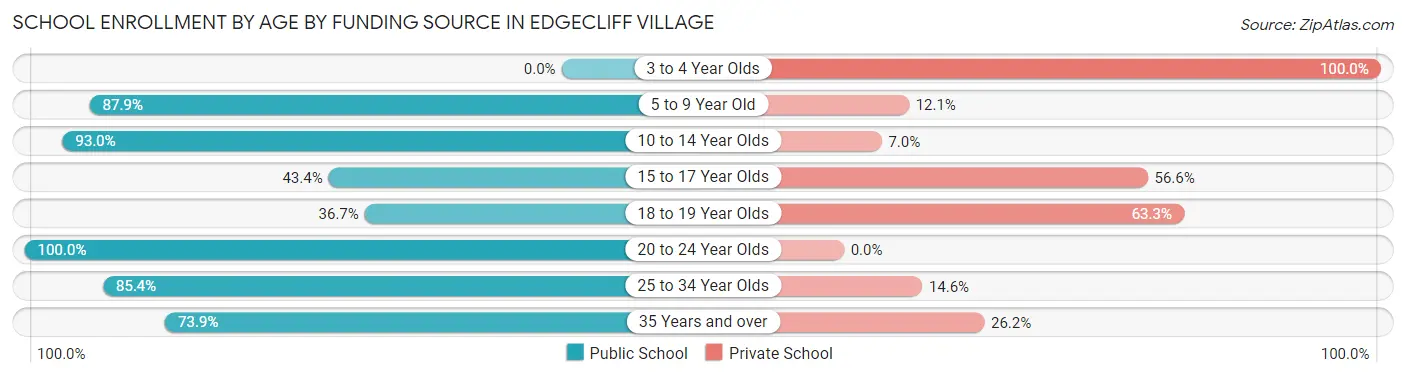
School Enrollment by Age by Funding Source in Edgecliff Village
Out of a total of 727 students who are enrolled in schools in Edgecliff Village, 199 (27.4%) attend a private institution, while the remaining 528 (72.6%) are enrolled in public schools. The age group of 3 to 4 year olds has the highest likelihood of being enrolled in private schools, with 55 (100.0% in the age bracket) enrolled. Conversely, the age group of 20 to 24 year olds has the lowest likelihood of being enrolled in a private school, with 25 (100.0% in the age bracket) attending a public institution.
| Age Bracket | Public School | Private School |
| 3 to 4 Year Olds | 0 (0.0%) | 55 (100.0%) |
| 5 to 9 Year Old | 225 (87.9%) | 31 (12.1%) |
| 10 to 14 Year Olds | 132 (93.0%) | 10 (7.0%) |
| 15 to 17 Year Olds | 46 (43.4%) | 60 (56.6%) |
| 18 to 19 Year Olds | 11 (36.7%) | 19 (63.3%) |
| 20 to 24 Year Olds | 25 (100.0%) | 0 (0.0%) |
| 25 to 34 Year Olds | 41 (85.4%) | 7 (14.6%) |
| 35 Years and over | 48 (73.9%) | 17 (26.2%) |
| Total | 528 (72.6%) | 199 (27.4%) |
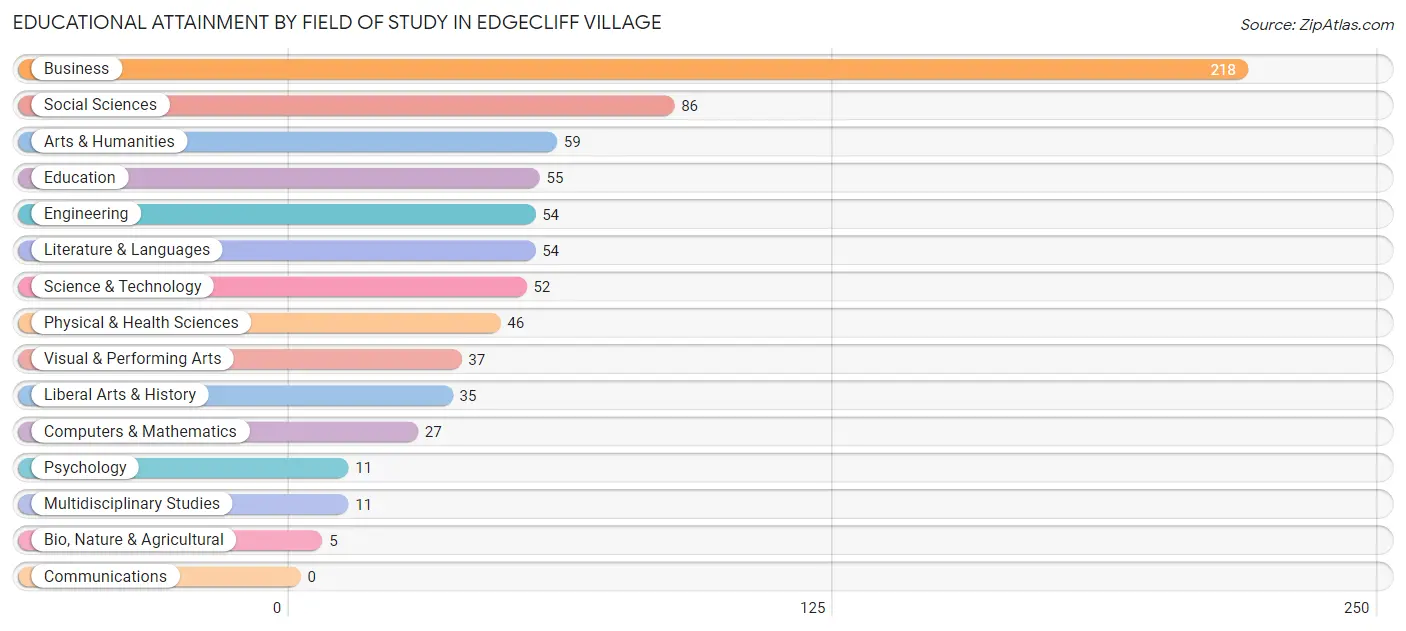
Educational Attainment by Field of Study in Edgecliff Village
Business (218 | 29.1%), social sciences (86 | 11.5%), arts & humanities (59 | 7.9%), education (55 | 7.3%), and engineering (54 | 7.2%) are the most common fields of study among 750 individuals in Edgecliff Village who have obtained a bachelor's degree or higher.
| Field of Study | # Graduates | % Graduates |
| Computers & Mathematics | 27 | 3.6% |
| Bio, Nature & Agricultural | 5 | 0.7% |
| Physical & Health Sciences | 46 | 6.1% |
| Psychology | 11 | 1.5% |
| Social Sciences | 86 | 11.5% |
| Engineering | 54 | 7.2% |
| Multidisciplinary Studies | 11 | 1.5% |
| Science & Technology | 52 | 6.9% |
| Business | 218 | 29.1% |
| Education | 55 | 7.3% |
| Literature & Languages | 54 | 7.2% |
| Liberal Arts & History | 35 | 4.7% |
| Visual & Performing Arts | 37 | 4.9% |
| Communications | 0 | 0.0% |
| Arts & Humanities | 59 | 7.9% |
| Total | 750 | 100.0% |
Transportation & Commute in Edgecliff Village
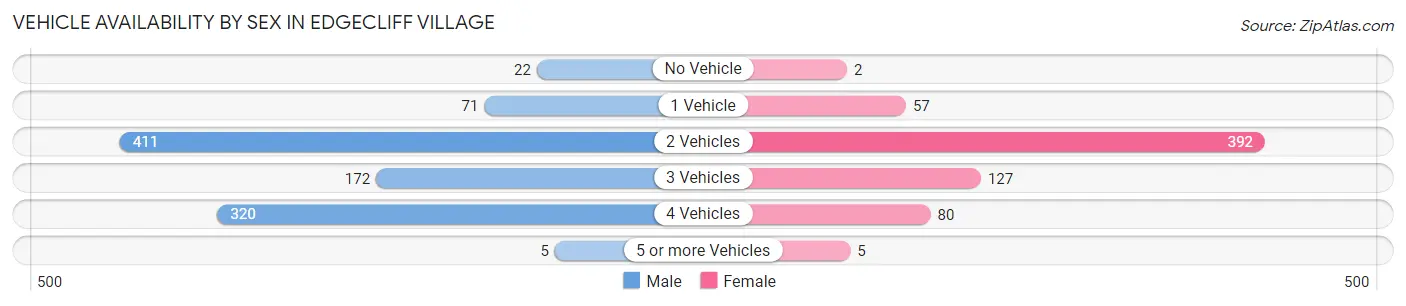
Vehicle Availability by Sex in Edgecliff Village
The most prevalent vehicle ownership categories in Edgecliff Village are males with 2 vehicles (411, accounting for 41.1%) and females with 2 vehicles (392, making up 62.0%).
| Vehicles Available | Male | Female |
| No Vehicle | 22 (2.2%) | 2 (0.3%) |
| 1 Vehicle | 71 (7.1%) | 57 (8.6%) |
| 2 Vehicles | 411 (41.1%) | 392 (59.1%) |
| 3 Vehicles | 172 (17.2%) | 127 (19.2%) |
| 4 Vehicles | 320 (32.0%) | 80 (12.1%) |
| 5 or more Vehicles | 5 (0.5%) | 5 (0.7%) |
| Total | 1,001 (100.0%) | 663 (100.0%) |
Commute Time in Edgecliff Village
The most frequently occuring commute durations in Edgecliff Village are 15 to 19 minutes (326 commuters, 21.4%), 10 to 14 minutes (232 commuters, 15.2%), and 30 to 34 minutes (196 commuters, 12.9%).
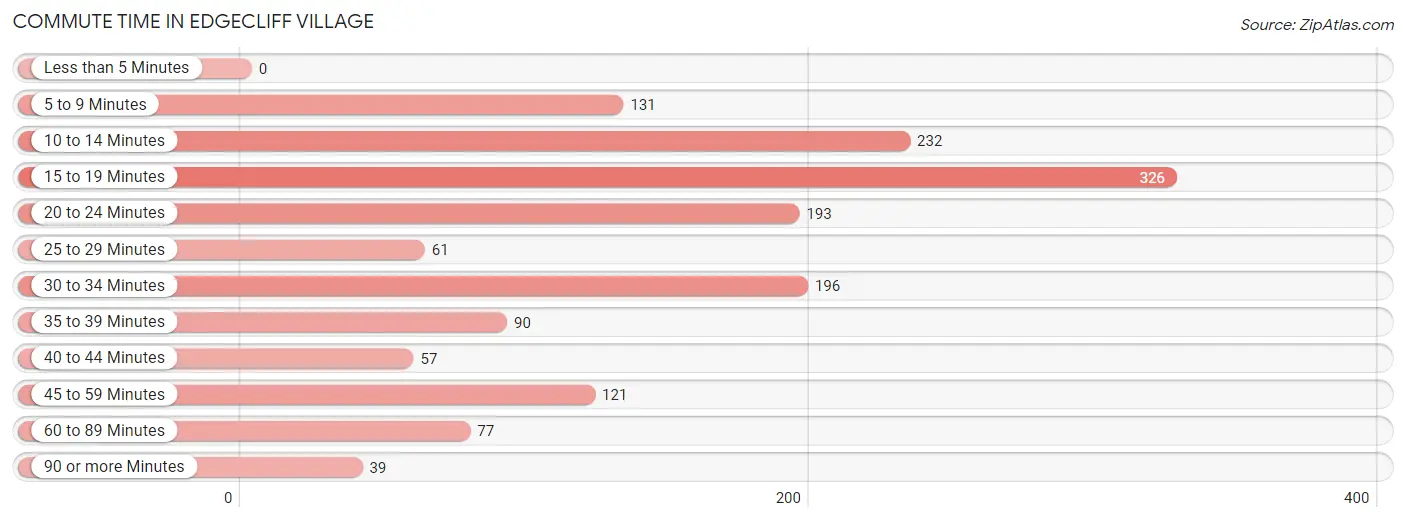
| Commute Time | # Commuters | % Commuters |
| Less than 5 Minutes | 0 | 0.0% |
| 5 to 9 Minutes | 131 | 8.6% |
| 10 to 14 Minutes | 232 | 15.2% |
| 15 to 19 Minutes | 326 | 21.4% |
| 20 to 24 Minutes | 193 | 12.7% |
| 25 to 29 Minutes | 61 | 4.0% |
| 30 to 34 Minutes | 196 | 12.9% |
| 35 to 39 Minutes | 90 | 5.9% |
| 40 to 44 Minutes | 57 | 3.7% |
| 45 to 59 Minutes | 121 | 7.9% |
| 60 to 89 Minutes | 77 | 5.1% |
| 90 or more Minutes | 39 | 2.6% |
Commute Time by Sex in Edgecliff Village
The most common commute times in Edgecliff Village are 15 to 19 minutes (196 commuters, 21.2%) for males and 15 to 19 minutes (130 commuters, 21.7%) for females.
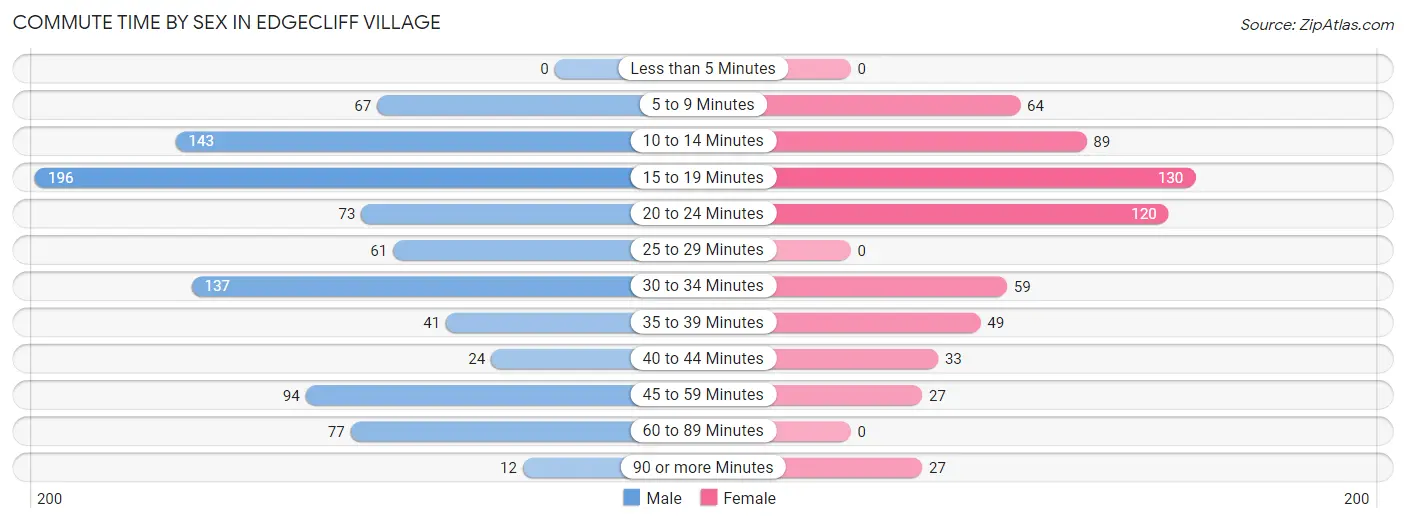
| Commute Time | Male | Female |
| Less than 5 Minutes | 0 (0.0%) | 0 (0.0%) |
| 5 to 9 Minutes | 67 (7.2%) | 64 (10.7%) |
| 10 to 14 Minutes | 143 (15.5%) | 89 (14.9%) |
| 15 to 19 Minutes | 196 (21.2%) | 130 (21.7%) |
| 20 to 24 Minutes | 73 (7.9%) | 120 (20.1%) |
| 25 to 29 Minutes | 61 (6.6%) | 0 (0.0%) |
| 30 to 34 Minutes | 137 (14.8%) | 59 (9.9%) |
| 35 to 39 Minutes | 41 (4.4%) | 49 (8.2%) |
| 40 to 44 Minutes | 24 (2.6%) | 33 (5.5%) |
| 45 to 59 Minutes | 94 (10.2%) | 27 (4.5%) |
| 60 to 89 Minutes | 77 (8.3%) | 0 (0.0%) |
| 90 or more Minutes | 12 (1.3%) | 27 (4.5%) |
Time of Departure to Work by Sex in Edgecliff Village
The most frequent times of departure to work in Edgecliff Village are 12:00 AM to 4:59 AM (155, 16.8%) for males and 7:00 AM to 7:29 AM (156, 26.1%) for females.
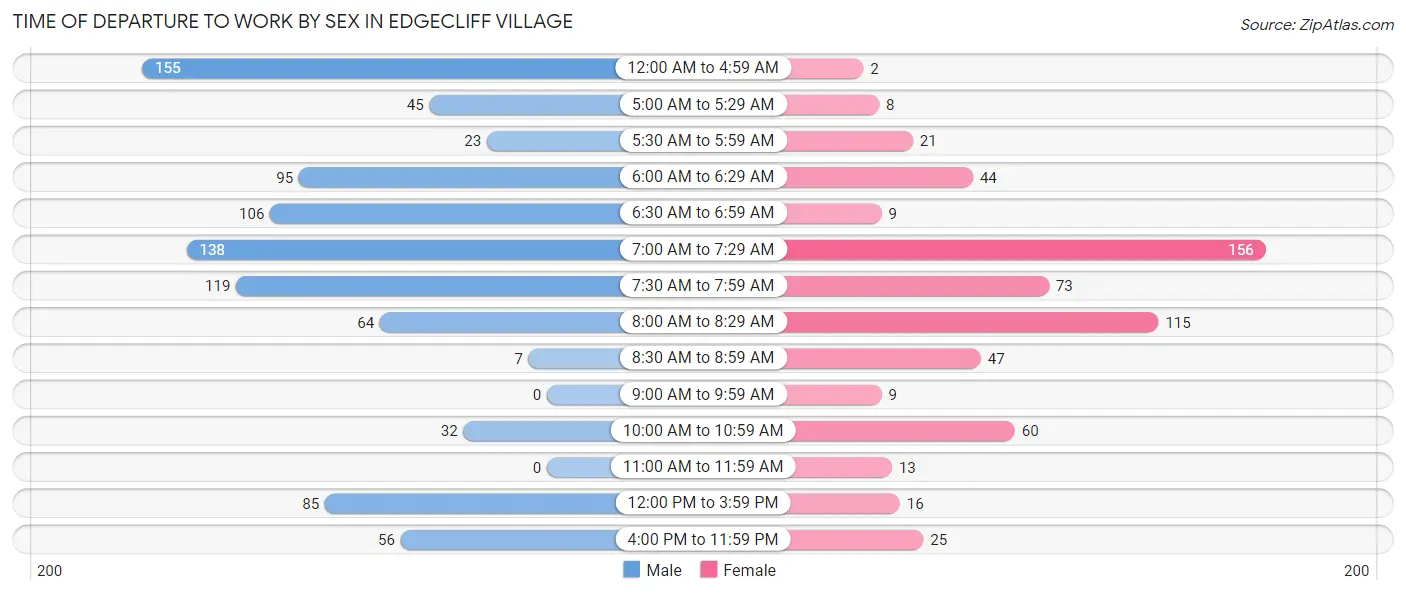
| Time of Departure | Male | Female |
| 12:00 AM to 4:59 AM | 155 (16.8%) | 2 (0.3%) |
| 5:00 AM to 5:29 AM | 45 (4.9%) | 8 (1.3%) |
| 5:30 AM to 5:59 AM | 23 (2.5%) | 21 (3.5%) |
| 6:00 AM to 6:29 AM | 95 (10.3%) | 44 (7.4%) |
| 6:30 AM to 6:59 AM | 106 (11.5%) | 9 (1.5%) |
| 7:00 AM to 7:29 AM | 138 (14.9%) | 156 (26.1%) |
| 7:30 AM to 7:59 AM | 119 (12.9%) | 73 (12.2%) |
| 8:00 AM to 8:29 AM | 64 (6.9%) | 115 (19.2%) |
| 8:30 AM to 8:59 AM | 7 (0.8%) | 47 (7.9%) |
| 9:00 AM to 9:59 AM | 0 (0.0%) | 9 (1.5%) |
| 10:00 AM to 10:59 AM | 32 (3.5%) | 60 (10.0%) |
| 11:00 AM to 11:59 AM | 0 (0.0%) | 13 (2.2%) |
| 12:00 PM to 3:59 PM | 85 (9.2%) | 16 (2.7%) |
| 4:00 PM to 11:59 PM | 56 (6.0%) | 25 (4.2%) |
| Total | 925 (100.0%) | 598 (100.0%) |
Housing Occupancy in Edgecliff Village
Occupancy by Ownership in Edgecliff Village
Of the total 1,298 dwellings in Edgecliff Village, owner-occupied units account for 1,170 (90.1%), while renter-occupied units make up 128 (9.9%).
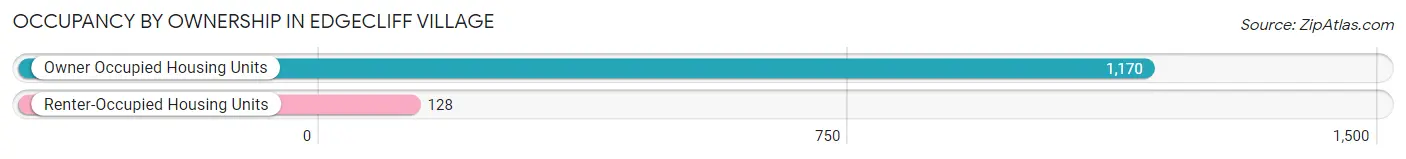
| Occupancy | # Housing Units | % Housing Units |
| Owner Occupied Housing Units | 1,170 | 90.1% |
| Renter-Occupied Housing Units | 128 | 9.9% |
| Total Occupied Housing Units | 1,298 | 100.0% |
Occupancy by Household Size in Edgecliff Village
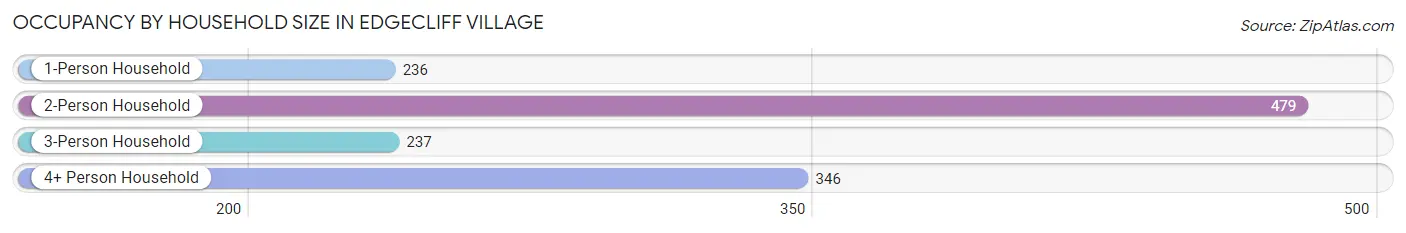
| Household Size | # Housing Units | % Housing Units |
| 1-Person Household | 236 | 18.2% |
| 2-Person Household | 479 | 36.9% |
| 3-Person Household | 237 | 18.3% |
| 4+ Person Household | 346 | 26.7% |
| Total Housing Units | 1,298 | 100.0% |
Occupancy by Ownership by Household Size in Edgecliff Village
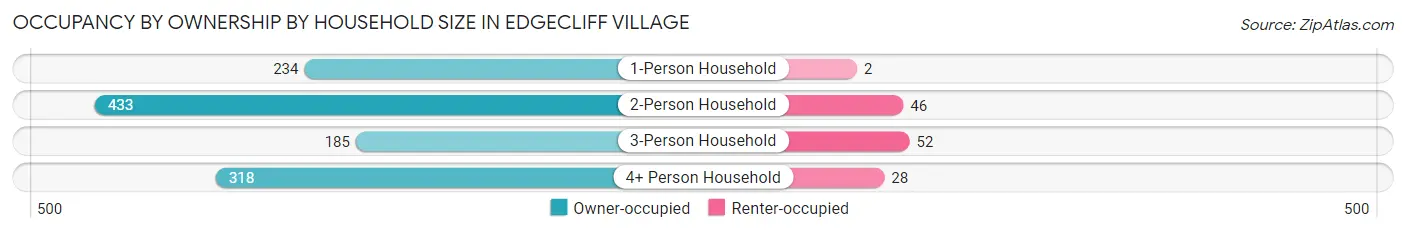
| Household Size | Owner-occupied | Renter-occupied |
| 1-Person Household | 234 (99.2%) | 2 (0.9%) |
| 2-Person Household | 433 (90.4%) | 46 (9.6%) |
| 3-Person Household | 185 (78.1%) | 52 (21.9%) |
| 4+ Person Household | 318 (91.9%) | 28 (8.1%) |
| Total Housing Units | 1,170 (90.1%) | 128 (9.9%) |
Occupancy by Educational Attainment in Edgecliff Village
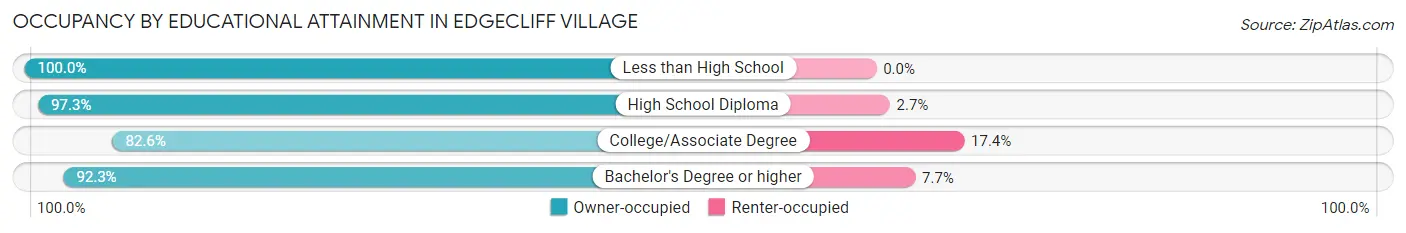
| Household Size | Owner-occupied | Renter-occupied |
| Less than High School | 124 (100.0%) | 0 (0.0%) |
| High School Diploma | 256 (97.3%) | 7 (2.7%) |
| College/Associate Degree | 431 (82.6%) | 91 (17.4%) |
| Bachelor's Degree or higher | 359 (92.3%) | 30 (7.7%) |
Occupancy by Age of Householder in Edgecliff Village
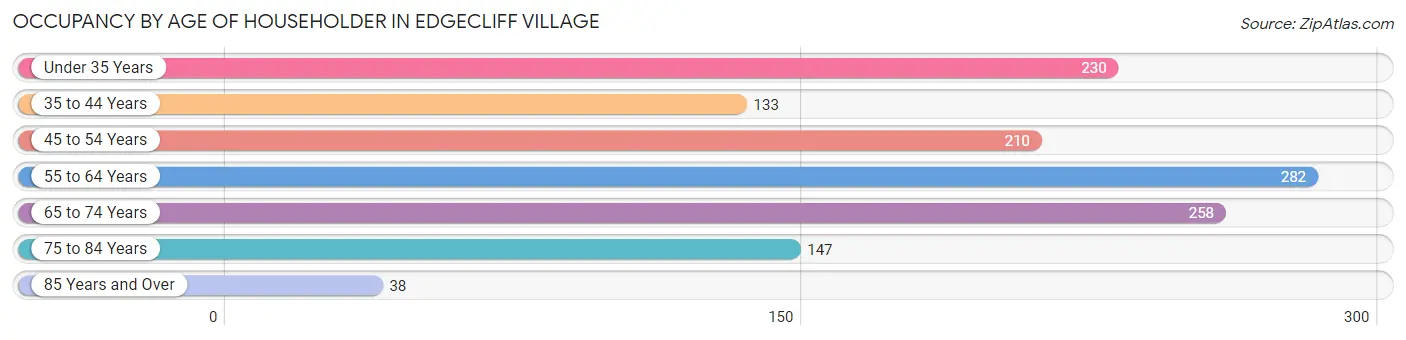
| Age Bracket | # Households | % Households |
| Under 35 Years | 230 | 17.7% |
| 35 to 44 Years | 133 | 10.2% |
| 45 to 54 Years | 210 | 16.2% |
| 55 to 64 Years | 282 | 21.7% |
| 65 to 74 Years | 258 | 19.9% |
| 75 to 84 Years | 147 | 11.3% |
| 85 Years and Over | 38 | 2.9% |
| Total | 1,298 | 100.0% |
Housing Finances in Edgecliff Village
Median Income by Occupancy in Edgecliff Village
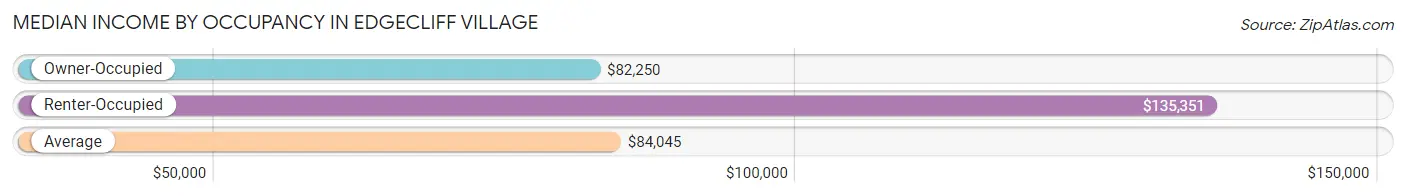
| Occupancy Type | # Households | Median Income |
| Owner-Occupied | 1,170 (90.1%) | $82,250 |
| Renter-Occupied | 128 (9.9%) | $135,351 |
| Average | 1,298 (100.0%) | $84,045 |
Occupancy by Householder Income Bracket in Edgecliff Village
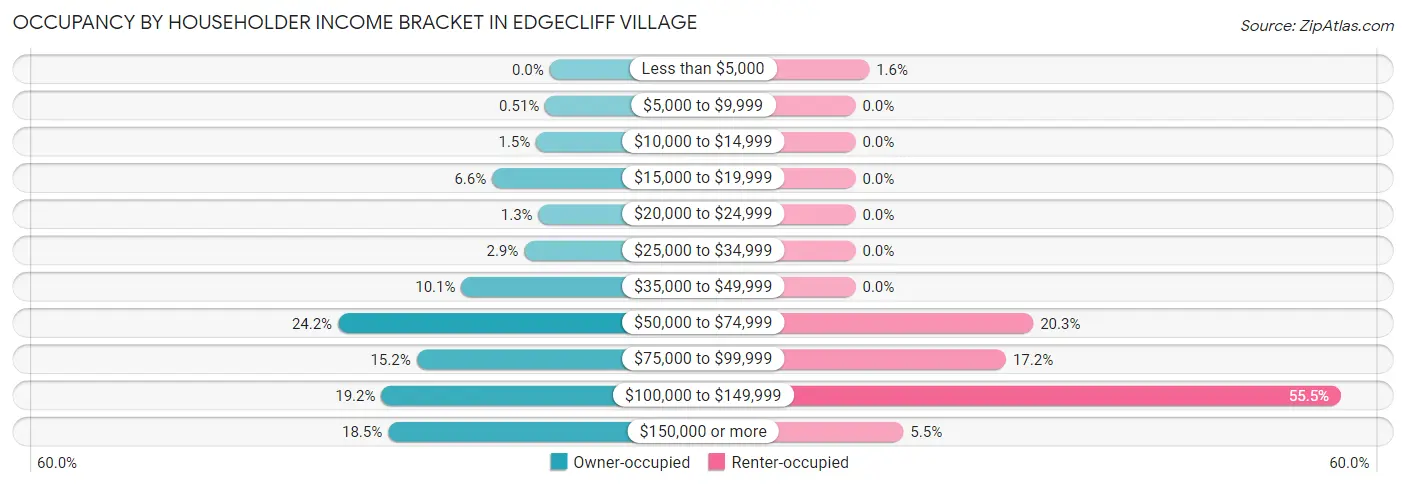
| Income Bracket | Owner-occupied | Renter-occupied |
| Less than $5,000 | 0 (0.0%) | 2 (1.6%) |
| $5,000 to $9,999 | 6 (0.5%) | 0 (0.0%) |
| $10,000 to $14,999 | 18 (1.5%) | 0 (0.0%) |
| $15,000 to $19,999 | 77 (6.6%) | 0 (0.0%) |
| $20,000 to $24,999 | 15 (1.3%) | 0 (0.0%) |
| $25,000 to $34,999 | 34 (2.9%) | 0 (0.0%) |
| $35,000 to $49,999 | 118 (10.1%) | 0 (0.0%) |
| $50,000 to $74,999 | 283 (24.2%) | 26 (20.3%) |
| $75,000 to $99,999 | 178 (15.2%) | 22 (17.2%) |
| $100,000 to $149,999 | 225 (19.2%) | 71 (55.5%) |
| $150,000 or more | 216 (18.5%) | 7 (5.5%) |
| Total | 1,170 (100.0%) | 128 (100.0%) |
Monthly Housing Cost Tiers in Edgecliff Village
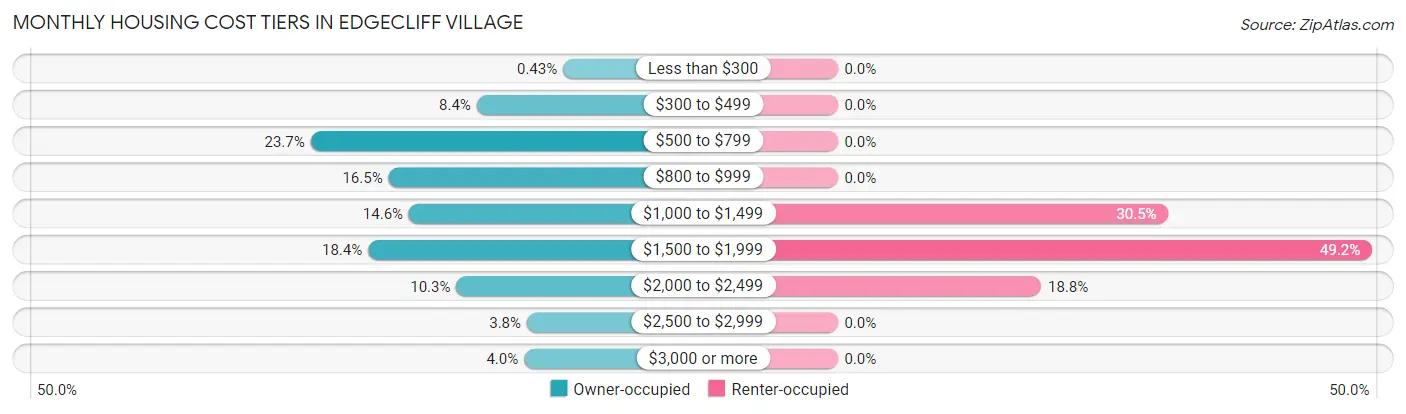
| Monthly Cost | Owner-occupied | Renter-occupied |
| Less than $300 | 5 (0.4%) | 0 (0.0%) |
| $300 to $499 | 98 (8.4%) | 0 (0.0%) |
| $500 to $799 | 277 (23.7%) | 0 (0.0%) |
| $800 to $999 | 193 (16.5%) | 0 (0.0%) |
| $1,000 to $1,499 | 171 (14.6%) | 39 (30.5%) |
| $1,500 to $1,999 | 215 (18.4%) | 63 (49.2%) |
| $2,000 to $2,499 | 120 (10.3%) | 24 (18.8%) |
| $2,500 to $2,999 | 44 (3.8%) | 0 (0.0%) |
| $3,000 or more | 47 (4.0%) | 0 (0.0%) |
| Total | 1,170 (100.0%) | 128 (100.0%) |
Physical Housing Characteristics in Edgecliff Village
Housing Structures in Edgecliff Village
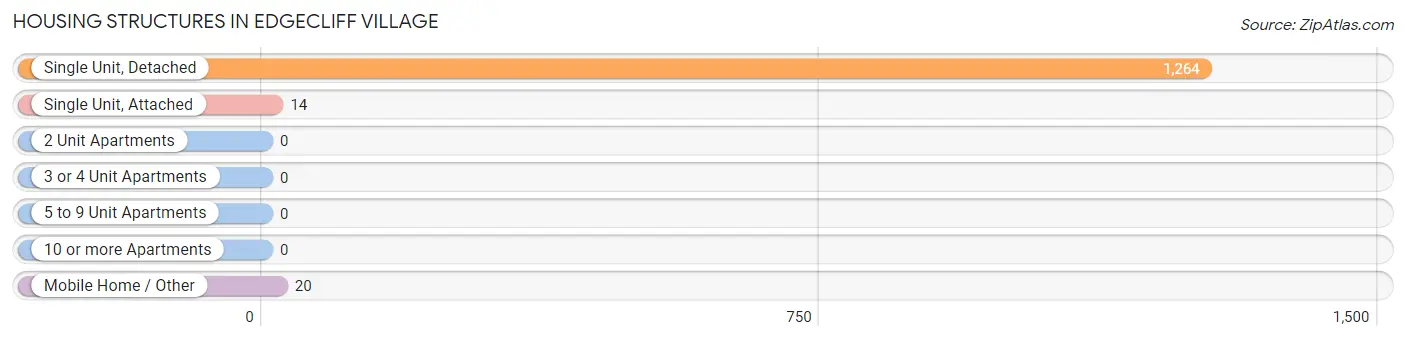
| Structure Type | # Housing Units | % Housing Units |
| Single Unit, Detached | 1,264 | 97.4% |
| Single Unit, Attached | 14 | 1.1% |
| 2 Unit Apartments | 0 | 0.0% |
| 3 or 4 Unit Apartments | 0 | 0.0% |
| 5 to 9 Unit Apartments | 0 | 0.0% |
| 10 or more Apartments | 0 | 0.0% |
| Mobile Home / Other | 20 | 1.5% |
| Total | 1,298 | 100.0% |
Housing Structures by Occupancy in Edgecliff Village
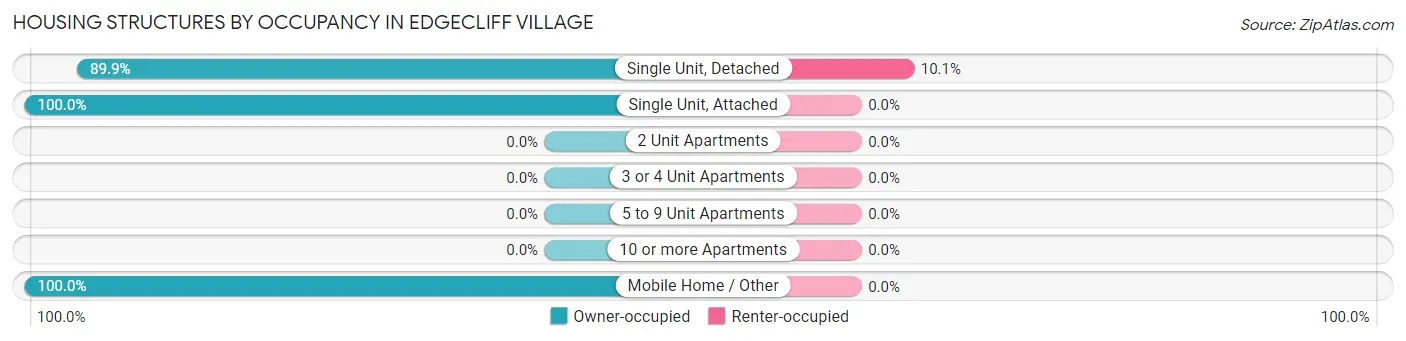
| Structure Type | Owner-occupied | Renter-occupied |
| Single Unit, Detached | 1,136 (89.9%) | 128 (10.1%) |
| Single Unit, Attached | 14 (100.0%) | 0 (0.0%) |
| 2 Unit Apartments | 0 (0.0%) | 0 (0.0%) |
| 3 or 4 Unit Apartments | 0 (0.0%) | 0 (0.0%) |
| 5 to 9 Unit Apartments | 0 (0.0%) | 0 (0.0%) |
| 10 or more Apartments | 0 (0.0%) | 0 (0.0%) |
| Mobile Home / Other | 20 (100.0%) | 0 (0.0%) |
| Total | 1,170 (90.1%) | 128 (9.9%) |
Housing Structures by Number of Rooms in Edgecliff Village
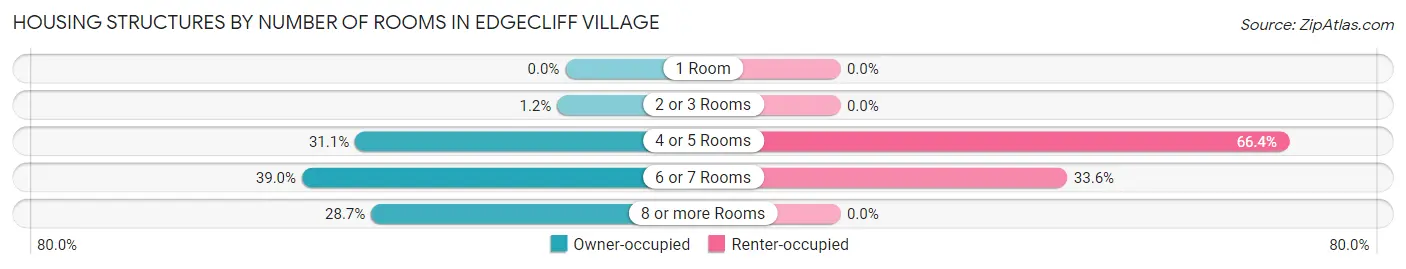
| Number of Rooms | Owner-occupied | Renter-occupied |
| 1 Room | 0 (0.0%) | 0 (0.0%) |
| 2 or 3 Rooms | 14 (1.2%) | 0 (0.0%) |
| 4 or 5 Rooms | 364 (31.1%) | 85 (66.4%) |
| 6 or 7 Rooms | 456 (39.0%) | 43 (33.6%) |
| 8 or more Rooms | 336 (28.7%) | 0 (0.0%) |
| Total | 1,170 (100.0%) | 128 (100.0%) |
Housing Structure by Heating Type in Edgecliff Village
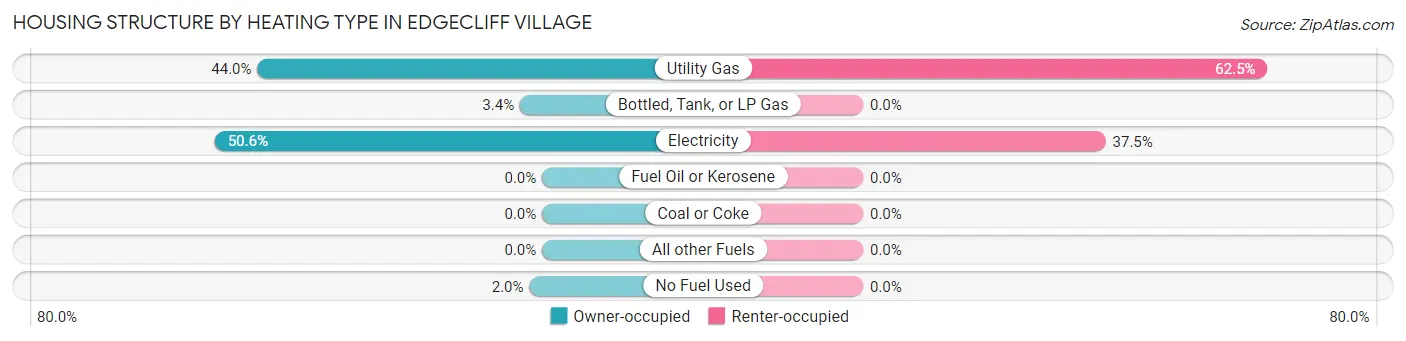
| Heating Type | Owner-occupied | Renter-occupied |
| Utility Gas | 515 (44.0%) | 80 (62.5%) |
| Bottled, Tank, or LP Gas | 40 (3.4%) | 0 (0.0%) |
| Electricity | 592 (50.6%) | 48 (37.5%) |
| Fuel Oil or Kerosene | 0 (0.0%) | 0 (0.0%) |
| Coal or Coke | 0 (0.0%) | 0 (0.0%) |
| All other Fuels | 0 (0.0%) | 0 (0.0%) |
| No Fuel Used | 23 (2.0%) | 0 (0.0%) |
| Total | 1,170 (100.0%) | 128 (100.0%) |
Household Vehicle Usage in Edgecliff Village
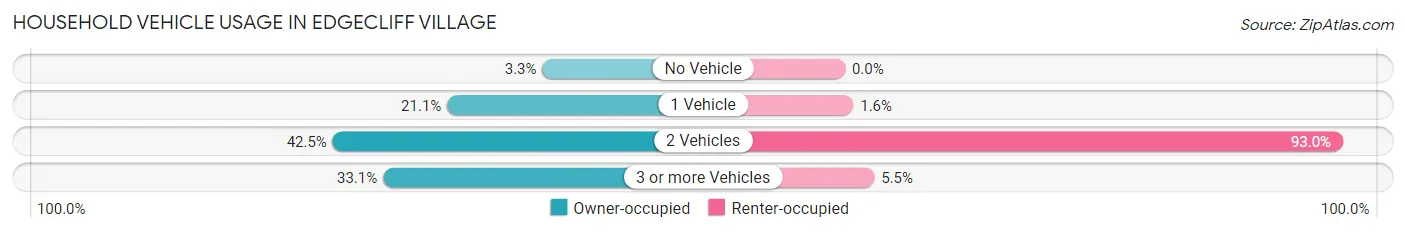
| Vehicles per Household | Owner-occupied | Renter-occupied |
| No Vehicle | 39 (3.3%) | 0 (0.0%) |
| 1 Vehicle | 247 (21.1%) | 2 (1.6%) |
| 2 Vehicles | 497 (42.5%) | 119 (93.0%) |
| 3 or more Vehicles | 387 (33.1%) | 7 (5.5%) |
| Total | 1,170 (100.0%) | 128 (100.0%) |
Real Estate & Mortgages in Edgecliff Village
Real Estate and Mortgage Overview in Edgecliff Village
| Characteristic | Without Mortgage | With Mortgage |
| Housing Units | 514 | 656 |
| Median Property Value | $205,000 | $237,100 |
| Median Household Income | $66,354 | $174 |
| Monthly Housing Costs | $694 | $47 |
| Real Estate Taxes | $1,957 | $40 |
Property Value by Mortgage Status in Edgecliff Village
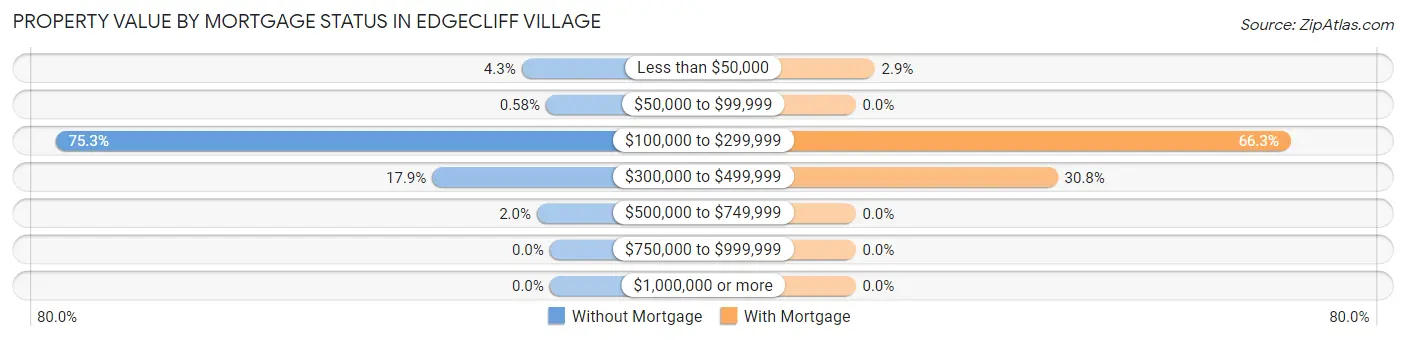
| Property Value | Without Mortgage | With Mortgage |
| Less than $50,000 | 22 (4.3%) | 19 (2.9%) |
| $50,000 to $99,999 | 3 (0.6%) | 0 (0.0%) |
| $100,000 to $299,999 | 387 (75.3%) | 435 (66.3%) |
| $300,000 to $499,999 | 92 (17.9%) | 202 (30.8%) |
| $500,000 to $749,999 | 10 (1.9%) | 0 (0.0%) |
| $750,000 to $999,999 | 0 (0.0%) | 0 (0.0%) |
| $1,000,000 or more | 0 (0.0%) | 0 (0.0%) |
| Total | 514 (100.0%) | 656 (100.0%) |
Household Income by Mortgage Status in Edgecliff Village
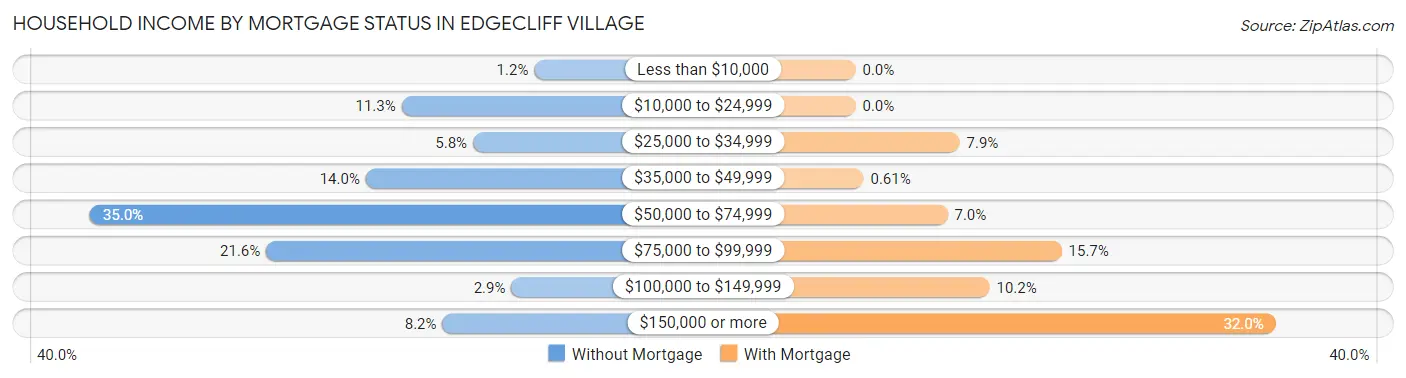
| Household Income | Without Mortgage | With Mortgage |
| Less than $10,000 | 6 (1.2%) | 0 (0.0%) |
| $10,000 to $24,999 | 58 (11.3%) | 0 (0.0%) |
| $25,000 to $34,999 | 30 (5.8%) | 52 (7.9%) |
| $35,000 to $49,999 | 72 (14.0%) | 4 (0.6%) |
| $50,000 to $74,999 | 180 (35.0%) | 46 (7.0%) |
| $75,000 to $99,999 | 111 (21.6%) | 103 (15.7%) |
| $100,000 to $149,999 | 15 (2.9%) | 67 (10.2%) |
| $150,000 or more | 42 (8.2%) | 210 (32.0%) |
| Total | 514 (100.0%) | 656 (100.0%) |
Property Value to Household Income Ratio in Edgecliff Village
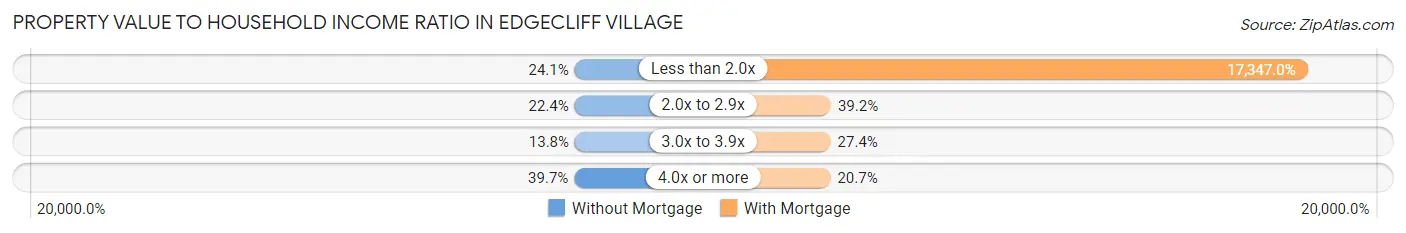
| Value-to-Income Ratio | Without Mortgage | With Mortgage |
| Less than 2.0x | 124 (24.1%) | 113,796 (17,347.0%) |
| 2.0x to 2.9x | 115 (22.4%) | 257 (39.2%) |
| 3.0x to 3.9x | 71 (13.8%) | 180 (27.4%) |
| 4.0x or more | 204 (39.7%) | 136 (20.7%) |
| Total | 514 (100.0%) | 656 (100.0%) |
Real Estate Taxes by Mortgage Status in Edgecliff Village
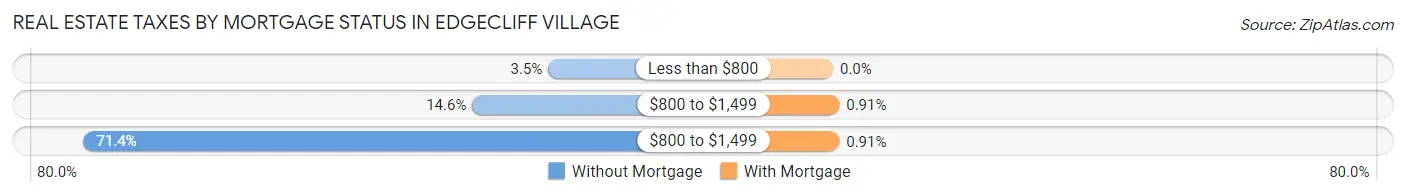
| Property Taxes | Without Mortgage | With Mortgage |
| Less than $800 | 18 (3.5%) | 0 (0.0%) |
| $800 to $1,499 | 75 (14.6%) | 6 (0.9%) |
| $800 to $1,499 | 367 (71.4%) | 6 (0.9%) |
| Total | 514 (100.0%) | 656 (100.0%) |
Health & Disability in Edgecliff Village
Health Insurance Coverage by Age in Edgecliff Village
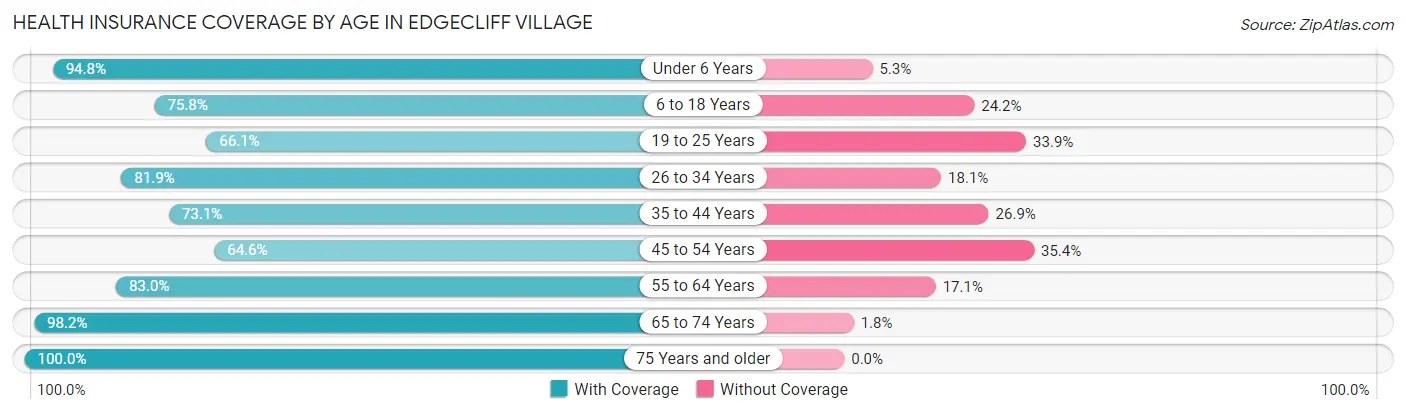
| Age Bracket | With Coverage | Without Coverage |
| Under 6 Years | 379 (94.8%) | 21 (5.2%) |
| 6 to 18 Years | 397 (75.8%) | 127 (24.2%) |
| 19 to 25 Years | 191 (66.1%) | 98 (33.9%) |
| 26 to 34 Years | 372 (81.9%) | 82 (18.1%) |
| 35 to 44 Years | 266 (73.1%) | 98 (26.9%) |
| 45 to 54 Years | 263 (64.6%) | 144 (35.4%) |
| 55 to 64 Years | 511 (83.0%) | 105 (17.1%) |
| 65 to 74 Years | 390 (98.2%) | 7 (1.8%) |
| 75 Years and older | 264 (100.0%) | 0 (0.0%) |
| Total | 3,033 (81.6%) | 682 (18.4%) |
Health Insurance Coverage by Citizenship Status in Edgecliff Village
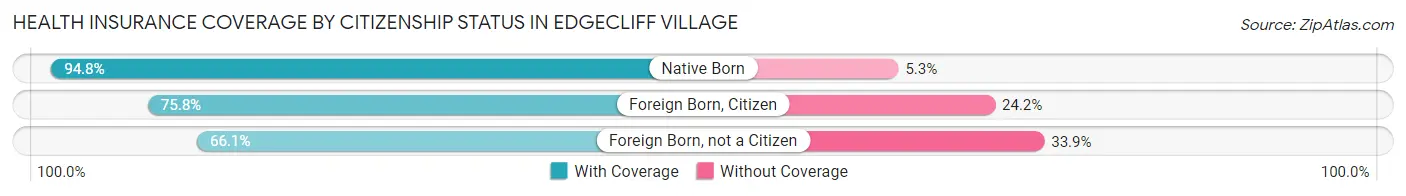
| Citizenship Status | With Coverage | Without Coverage |
| Native Born | 379 (94.8%) | 21 (5.2%) |
| Foreign Born, Citizen | 397 (75.8%) | 127 (24.2%) |
| Foreign Born, not a Citizen | 191 (66.1%) | 98 (33.9%) |
Health Insurance Coverage by Household Income in Edgecliff Village
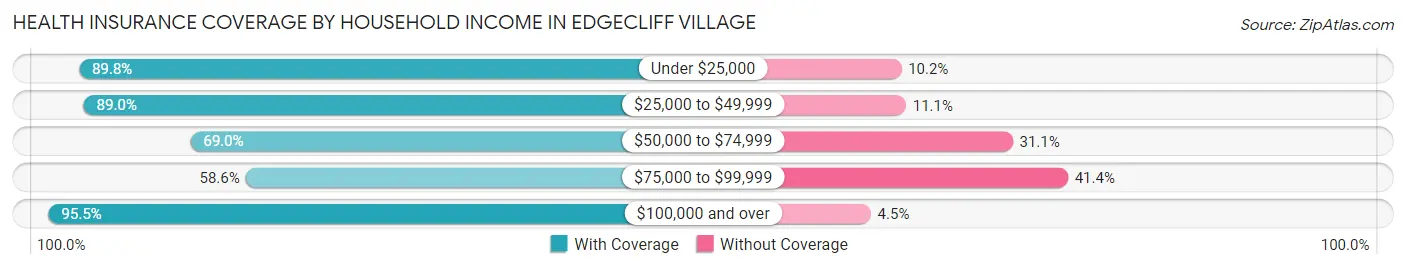
| Household Income | With Coverage | Without Coverage |
| Under $25,000 | 185 (89.8%) | 21 (10.2%) |
| $25,000 to $49,999 | 306 (88.9%) | 38 (11.1%) |
| $50,000 to $74,999 | 615 (69.0%) | 277 (31.0%) |
| $75,000 to $99,999 | 388 (58.6%) | 274 (41.4%) |
| $100,000 and over | 1,539 (95.5%) | 72 (4.5%) |
Public vs Private Health Insurance Coverage by Age in Edgecliff Village
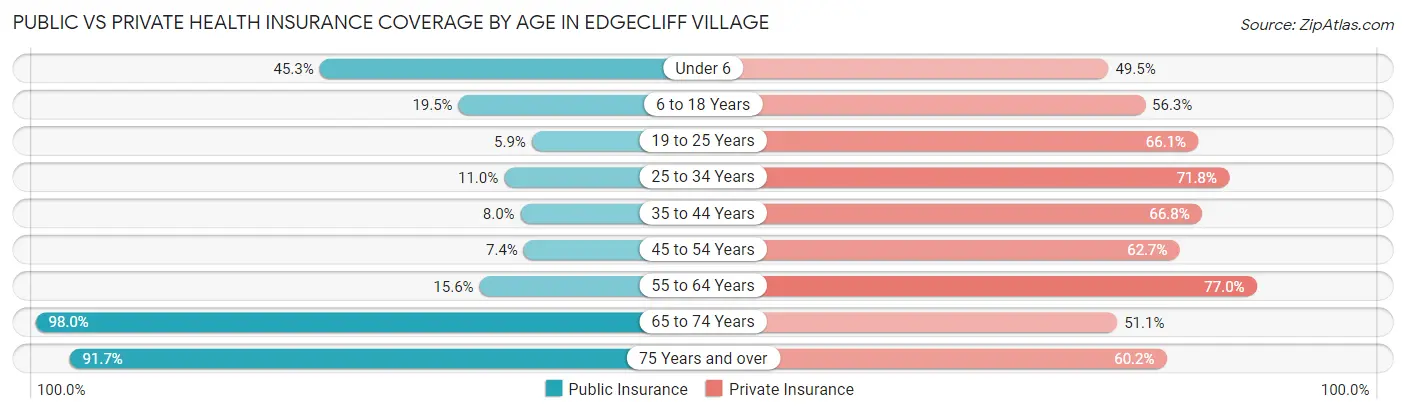
| Age Bracket | Public Insurance | Private Insurance |
| Under 6 | 181 (45.3%) | 198 (49.5%) |
| 6 to 18 Years | 102 (19.5%) | 295 (56.3%) |
| 19 to 25 Years | 17 (5.9%) | 191 (66.1%) |
| 25 to 34 Years | 50 (11.0%) | 326 (71.8%) |
| 35 to 44 Years | 29 (8.0%) | 243 (66.8%) |
| 45 to 54 Years | 30 (7.4%) | 255 (62.6%) |
| 55 to 64 Years | 96 (15.6%) | 474 (76.9%) |
| 65 to 74 Years | 389 (98.0%) | 203 (51.1%) |
| 75 Years and over | 242 (91.7%) | 159 (60.2%) |
| Total | 1,136 (30.6%) | 2,344 (63.1%) |
Disability Status by Sex by Age in Edgecliff Village
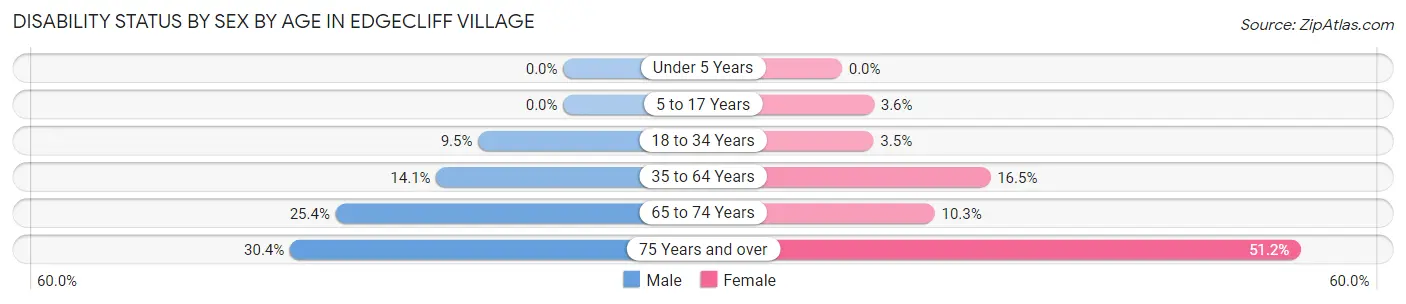
| Age Bracket | Male | Female |
| Under 5 Years | 0 (0.0%) | 0 (0.0%) |
| 5 to 17 Years | 0 (0.0%) | 9 (3.6%) |
| 18 to 34 Years | 39 (9.5%) | 14 (3.5%) |
| 35 to 64 Years | 108 (14.1%) | 103 (16.5%) |
| 65 to 74 Years | 54 (25.4%) | 19 (10.3%) |
| 75 Years and over | 28 (30.4%) | 88 (51.2%) |
Disability Class by Sex by Age in Edgecliff Village
Disability Class: Hearing Difficulty
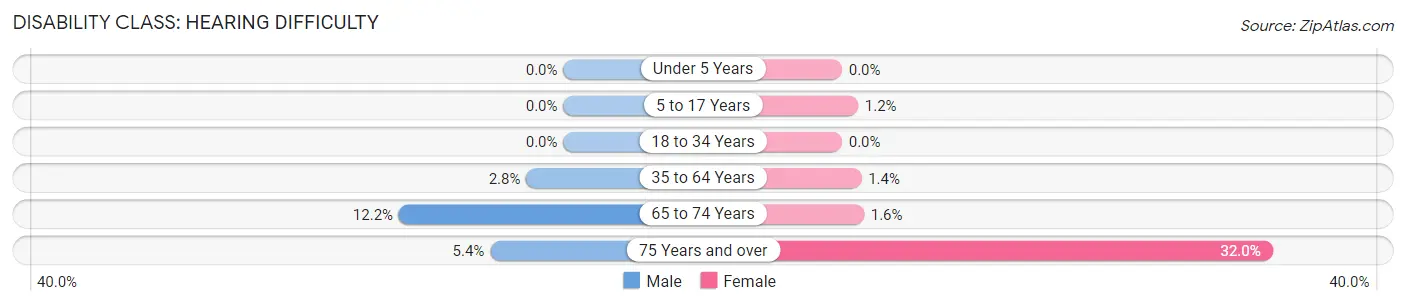
| Age Bracket | Male | Female |
| Under 5 Years | 0 (0.0%) | 0 (0.0%) |
| 5 to 17 Years | 0 (0.0%) | 3 (1.2%) |
| 18 to 34 Years | 0 (0.0%) | 0 (0.0%) |
| 35 to 64 Years | 21 (2.8%) | 9 (1.4%) |
| 65 to 74 Years | 26 (12.2%) | 3 (1.6%) |
| 75 Years and over | 5 (5.4%) | 55 (32.0%) |
Disability Class: Vision Difficulty
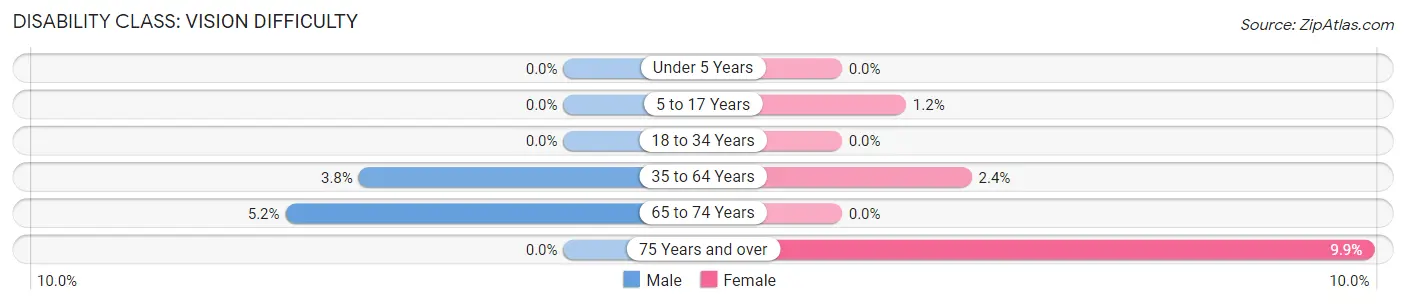
| Age Bracket | Male | Female |
| Under 5 Years | 0 (0.0%) | 0 (0.0%) |
| 5 to 17 Years | 0 (0.0%) | 3 (1.2%) |
| 18 to 34 Years | 0 (0.0%) | 0 (0.0%) |
| 35 to 64 Years | 29 (3.8%) | 15 (2.4%) |
| 65 to 74 Years | 11 (5.2%) | 0 (0.0%) |
| 75 Years and over | 0 (0.0%) | 17 (9.9%) |
Disability Class: Cognitive Difficulty
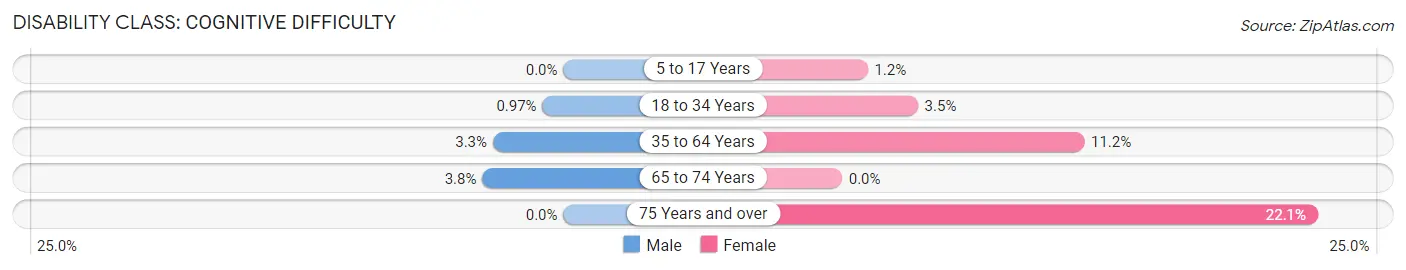
| Age Bracket | Male | Female |
| 5 to 17 Years | 0 (0.0%) | 3 (1.2%) |
| 18 to 34 Years | 4 (1.0%) | 14 (3.5%) |
| 35 to 64 Years | 25 (3.3%) | 70 (11.2%) |
| 65 to 74 Years | 8 (3.8%) | 0 (0.0%) |
| 75 Years and over | 0 (0.0%) | 38 (22.1%) |
Disability Class: Ambulatory Difficulty
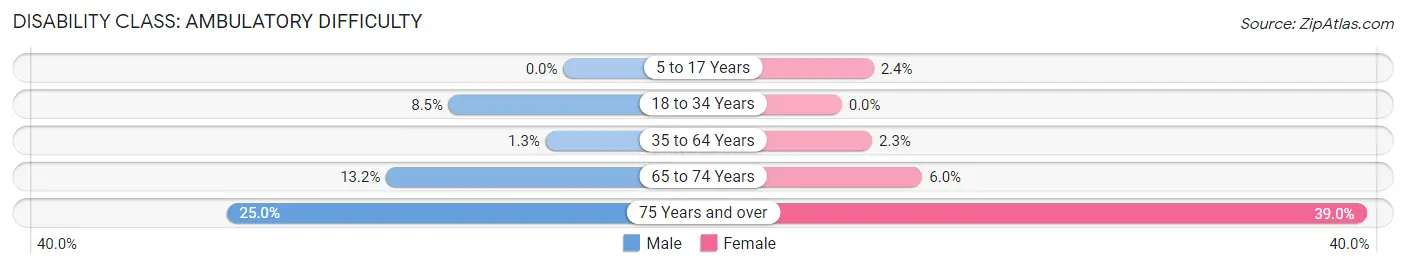
| Age Bracket | Male | Female |
| 5 to 17 Years | 0 (0.0%) | 6 (2.4%) |
| 18 to 34 Years | 35 (8.5%) | 0 (0.0%) |
| 35 to 64 Years | 10 (1.3%) | 14 (2.2%) |
| 65 to 74 Years | 28 (13.2%) | 11 (6.0%) |
| 75 Years and over | 23 (25.0%) | 67 (39.0%) |
Disability Class: Self-Care Difficulty
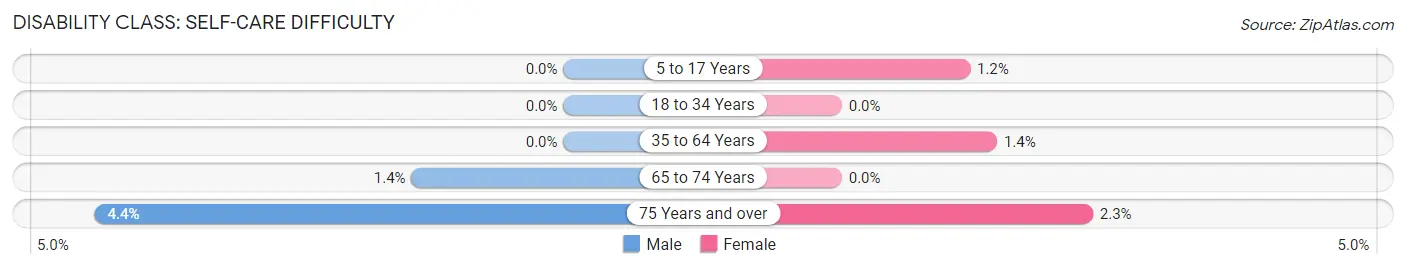
| Age Bracket | Male | Female |
| 5 to 17 Years | 0 (0.0%) | 3 (1.2%) |
| 18 to 34 Years | 0 (0.0%) | 0 (0.0%) |
| 35 to 64 Years | 0 (0.0%) | 9 (1.4%) |
| 65 to 74 Years | 3 (1.4%) | 0 (0.0%) |
| 75 Years and over | 4 (4.3%) | 4 (2.3%) |
Technology Access in Edgecliff Village
Computing Device Access in Edgecliff Village
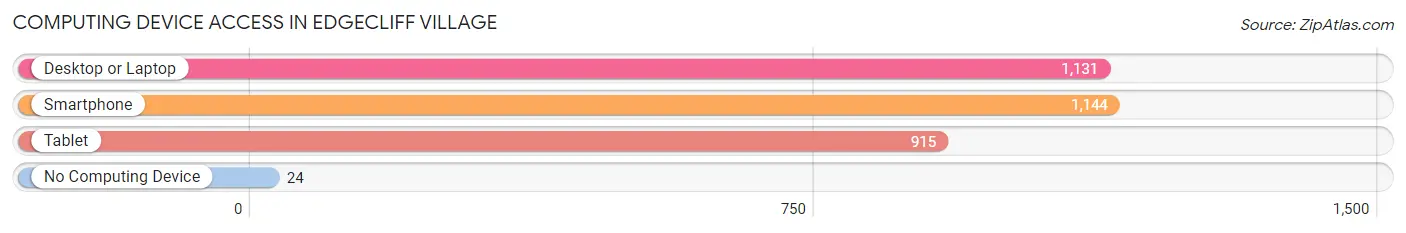
| Device Type | # Households | % Households |
| Desktop or Laptop | 1,131 | 87.1% |
| Smartphone | 1,144 | 88.1% |
| Tablet | 915 | 70.5% |
| No Computing Device | 24 | 1.8% |
| Total | 1,298 | 100.0% |
Internet Access in Edgecliff Village
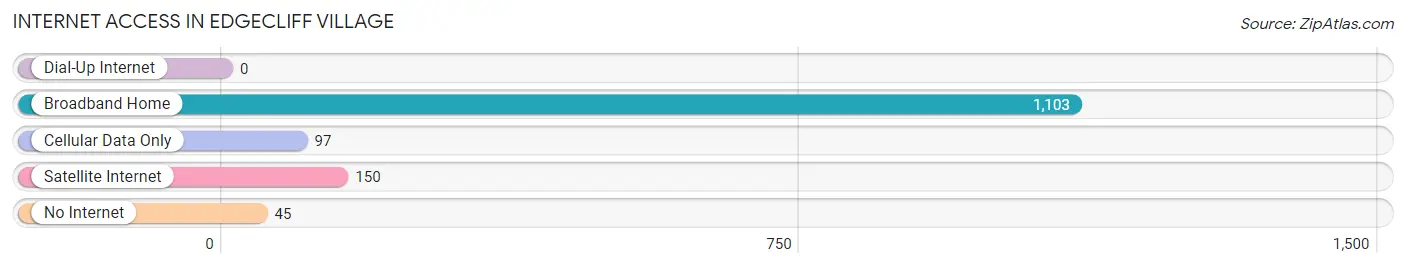
| Internet Type | # Households | % Households |
| Dial-Up Internet | 0 | 0.0% |
| Broadband Home | 1,103 | 85.0% |
| Cellular Data Only | 97 | 7.5% |
| Satellite Internet | 150 | 11.6% |
| No Internet | 45 | 3.5% |
| Total | 1,298 | 100.0% |
Edgecliff Village Summary
Edgecliff Village is a small city located in Tarrant County, Texas. It is part of the Dallas-Fort Worth-Arlington metropolitan area and is situated just south of the city of Fort Worth. The city has a population of just over 1,000 people and is known for its small-town charm and friendly atmosphere.
Geography
Edgecliff Village is located in the eastern part of Tarrant County, Texas. It is situated just south of the city of Fort Worth and is part of the Dallas-Fort Worth-Arlington metropolitan area. The city is bordered by the cities of Arlington, Grand Prairie, and Mansfield. The city is located in the Central Time Zone and has an elevation of 645 feet.
The city is situated on the edge of the Trinity River, which provides a natural border between Edgecliff Village and the cities of Arlington and Grand Prairie. The city is also located near the intersection of Interstate 20 and State Highway 360, providing easy access to the rest of the Dallas-Fort Worth area.
Climate
Edgecliff Village has a humid subtropical climate, with hot summers and mild winters. The average high temperature in the summer months is around 95 degrees Fahrenheit, while the average low temperature in the winter months is around 40 degrees Fahrenheit. The city receives an average of 37 inches of precipitation per year, with most of it falling in the spring and summer months.
Demographics
As of the 2010 census, Edgecliff Village had a population of 1,072 people. The racial makeup of the city was 79.3% White, 11.2% African American, 0.3% Native American, 0.7% Asian, and 8.5% from other races. Hispanic or Latino of any race were 16.2% of the population.
The median household income in Edgecliff Village was $45,938, and the median family income was $50,938. The per capita income for the city was $20,938. About 11.2% of families and 13.2% of the population were below the poverty line, including 17.2% of those under age 18 and 8.2% of those age 65 or over.
Economy
Edgecliff Village is a small city with a limited economy. The city is home to a few small businesses, including a grocery store, a gas station, and a few restaurants. The city is also home to a few manufacturing companies, including a plastics manufacturer and a metal fabrication company.
The city is also home to a few educational institutions, including a community college and a technical school. The city is also home to a few churches and a library.
Conclusion
Edgecliff Village is a small city located in Tarrant County, Texas. It is part of the Dallas-Fort Worth-Arlington metropolitan area and is situated just south of the city of Fort Worth. The city has a population of just over 1,000 people and is known for its small-town charm and friendly atmosphere. The city has a humid subtropical climate, with hot summers and mild winters. The city is home to a few small businesses, manufacturing companies, educational institutions, churches, and a library. The median household income in Edgecliff Village was $45,938, and the median family income was $50,938. The city is a great place to live and work, and is a great example of a small Texas town.
Common Questions
What is Per Capita Income in Edgecliff Village?
Per Capita income in Edgecliff Village is $35,939.
What is the Median Family Income in Edgecliff Village?
Median Family Income in Edgecliff Village is $92,534.
What is the Median Household income in Edgecliff Village?
Median Household Income in Edgecliff Village is $84,045.
What is Income or Wage Gap in Edgecliff Village?
Income or Wage Gap in Edgecliff Village is 37.1%.
Women in Edgecliff Village earn 62.9 cents for every dollar earned by a man.
What is Inequality or Gini Index in Edgecliff Village?
Inequality or Gini Index in Edgecliff Village is 0.35.
What is the Total Population of Edgecliff Village?
Total Population of Edgecliff Village is 3,715.
What is the Total Male Population of Edgecliff Village?
Total Male Population of Edgecliff Village is 1,870.
What is the Total Female Population of Edgecliff Village?
Total Female Population of Edgecliff Village is 1,845.
What is the Ratio of Males per 100 Females in Edgecliff Village?
There are 101.36 Males per 100 Females in Edgecliff Village.
What is the Ratio of Females per 100 Males in Edgecliff Village?
There are 98.66 Females per 100 Males in Edgecliff Village.
What is the Median Population Age in Edgecliff Village?
Median Population Age in Edgecliff Village is 39.8 Years.
What is the Average Family Size in Edgecliff Village
Average Family Size in Edgecliff Village is 3.2 People.
What is the Average Household Size in Edgecliff Village
Average Household Size in Edgecliff Village is 2.9 People.
How Large is the Labor Force in Edgecliff Village?
There are 1,859 People in the Labor Forcein in Edgecliff Village.
What is the Percentage of People in the Labor Force in Edgecliff Village?
63.5% of People are in the Labor Force in Edgecliff Village.
What is the Unemployment Rate in Edgecliff Village?
Unemployment Rate in Edgecliff Village is 8.7%.