Noonday, TX Map & Demographics
Noonday Map
Noonday Overview
$48,236
PER CAPITA INCOME
$95,833
AVG FAMILY INCOME
$59,500
AVG HOUSEHOLD INCOME
21.0%
WAGE / INCOME GAP [ % ]
79.0¢/ $1
WAGE / INCOME GAP [ $ ]
0.41
INEQUALITY / GINI INDEX
510
TOTAL POPULATION
220
MALE POPULATION
290
FEMALE POPULATION
75.86
MALES / 100 FEMALES
131.82
FEMALES / 100 MALES
53.6
MEDIAN AGE
2.5
AVG FAMILY SIZE
1.9
AVG HOUSEHOLD SIZE
328
LABOR FORCE [ PEOPLE ]
67.5%
PERCENT IN LABOR FORCE
3.0%
UNEMPLOYMENT RATE
Income in Noonday
Income Overview in Noonday
Per Capita Income in Noonday is $48,236, while median incomes of families and households are $95,833 and $59,500 respectively.
| Characteristic | Number | Measure |
| Per Capita Income | 510 | $48,236 |
| Median Family Income | 134 | $95,833 |
| Mean Family Income | 134 | $111,391 |
| Median Household Income | 272 | $59,500 |
| Mean Household Income | 272 | $90,203 |
| Income Deficit | 134 | $0 |
| Wage / Income Gap (%) | 510 | 21.05% |
| Wage / Income Gap ($) | 510 | 78.95¢ per $1 |
| Gini / Inequality Index | 510 | 0.41 |
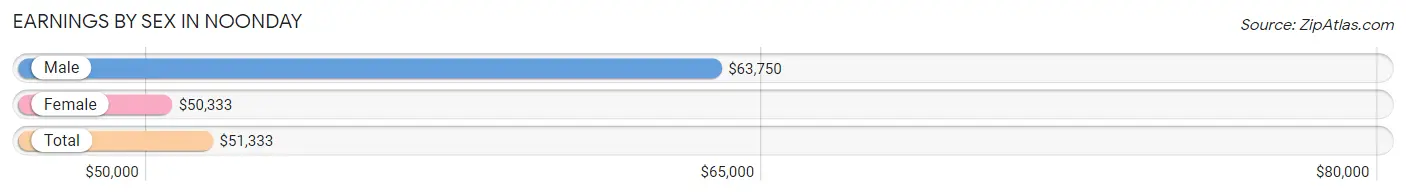
Earnings by Sex in Noonday
Average Earnings in Noonday are $51,333, $63,750 for men and $50,333 for women, a difference of 21.0%.
| Sex | Number | Average Earnings |
| Male | 148 (44.1%) | $63,750 |
| Female | 188 (55.9%) | $50,333 |
| Total | 336 (100.0%) | $51,333 |
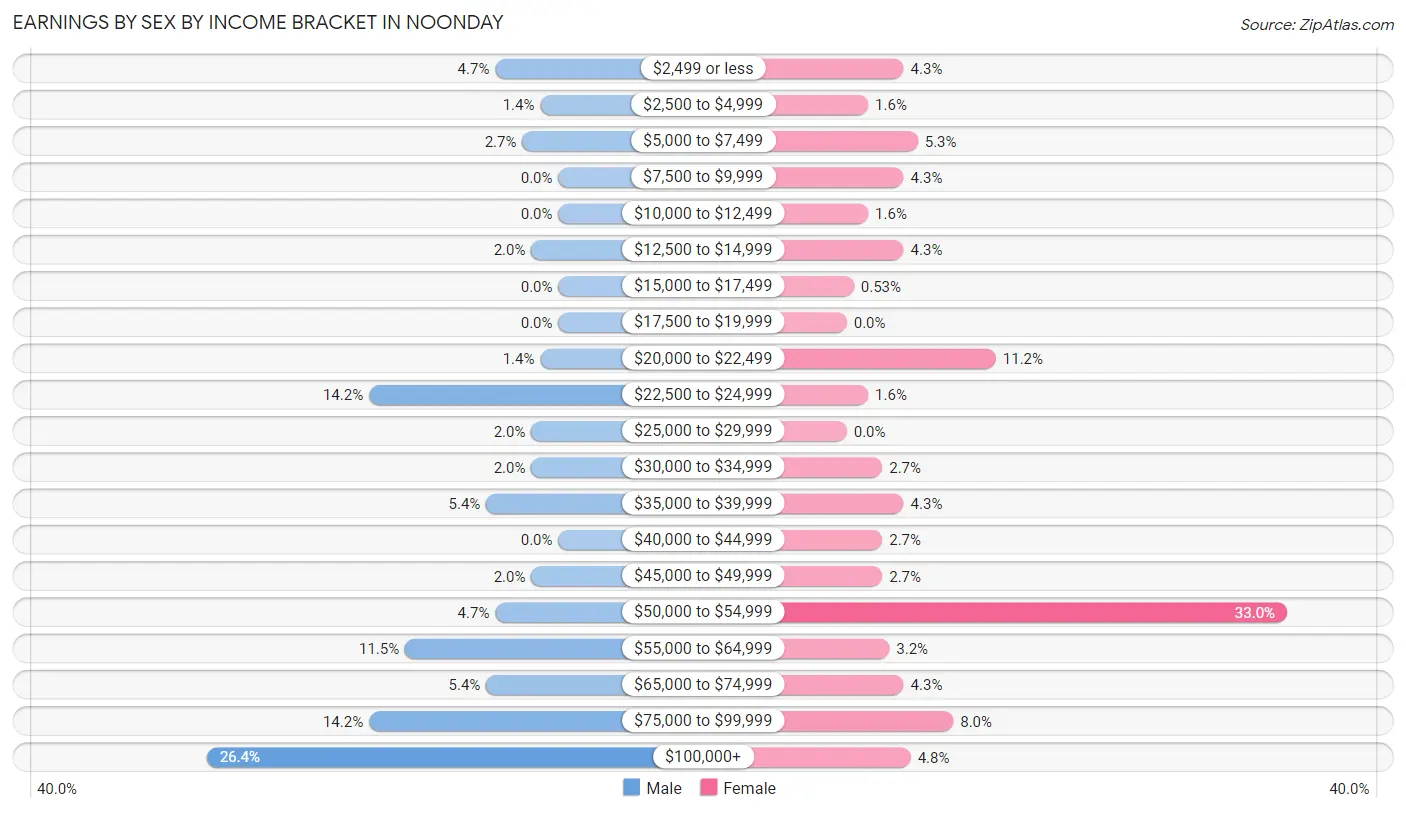
Earnings by Sex by Income Bracket in Noonday
The most common earnings brackets in Noonday are $100,000+ for men (39 | 26.4%) and $50,000 to $54,999 for women (62 | 33.0%).
| Income | Male | Female |
| $2,499 or less | 7 (4.7%) | 8 (4.3%) |
| $2,500 to $4,999 | 2 (1.3%) | 3 (1.6%) |
| $5,000 to $7,499 | 4 (2.7%) | 10 (5.3%) |
| $7,500 to $9,999 | 0 (0.0%) | 8 (4.3%) |
| $10,000 to $12,499 | 0 (0.0%) | 3 (1.6%) |
| $12,500 to $14,999 | 3 (2.0%) | 8 (4.3%) |
| $15,000 to $17,499 | 0 (0.0%) | 1 (0.5%) |
| $17,500 to $19,999 | 0 (0.0%) | 0 (0.0%) |
| $20,000 to $22,499 | 2 (1.3%) | 21 (11.2%) |
| $22,500 to $24,999 | 21 (14.2%) | 3 (1.6%) |
| $25,000 to $29,999 | 3 (2.0%) | 0 (0.0%) |
| $30,000 to $34,999 | 3 (2.0%) | 5 (2.7%) |
| $35,000 to $39,999 | 8 (5.4%) | 8 (4.3%) |
| $40,000 to $44,999 | 0 (0.0%) | 5 (2.7%) |
| $45,000 to $49,999 | 3 (2.0%) | 5 (2.7%) |
| $50,000 to $54,999 | 7 (4.7%) | 62 (33.0%) |
| $55,000 to $64,999 | 17 (11.5%) | 6 (3.2%) |
| $65,000 to $74,999 | 8 (5.4%) | 8 (4.3%) |
| $75,000 to $99,999 | 21 (14.2%) | 15 (8.0%) |
| $100,000+ | 39 (26.4%) | 9 (4.8%) |
| Total | 148 (100.0%) | 188 (100.0%) |
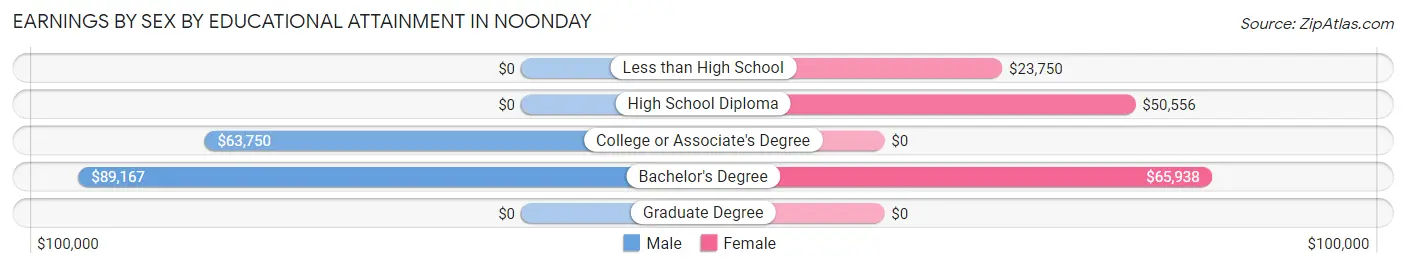
Earnings by Sex by Educational Attainment in Noonday
Average earnings in Noonday are $65,000 for men and $50,556 for women, a difference of 22.2%. Men with an educational attainment of bachelor's degree enjoy the highest average annual earnings of $89,167, while those with college or associate's degree education earn the least with $63,750. Women with an educational attainment of bachelor's degree earn the most with the average annual earnings of $65,938, while those with less than high school education have the smallest earnings of $23,750.
| Educational Attainment | Male Income | Female Income |
| Less than High School | - | - |
| High School Diploma | - | - |
| College or Associate's Degree | $63,750 | $0 |
| Bachelor's Degree | $89,167 | $65,938 |
| Graduate Degree | - | - |
| Total | $65,000 | $50,556 |
Family Income in Noonday
Family Income Brackets in Noonday
According to the Noonday family income data, there are 38 families falling into the $100,000 to $149,999 income range, which is the most common income bracket and makes up 28.4% of all families.
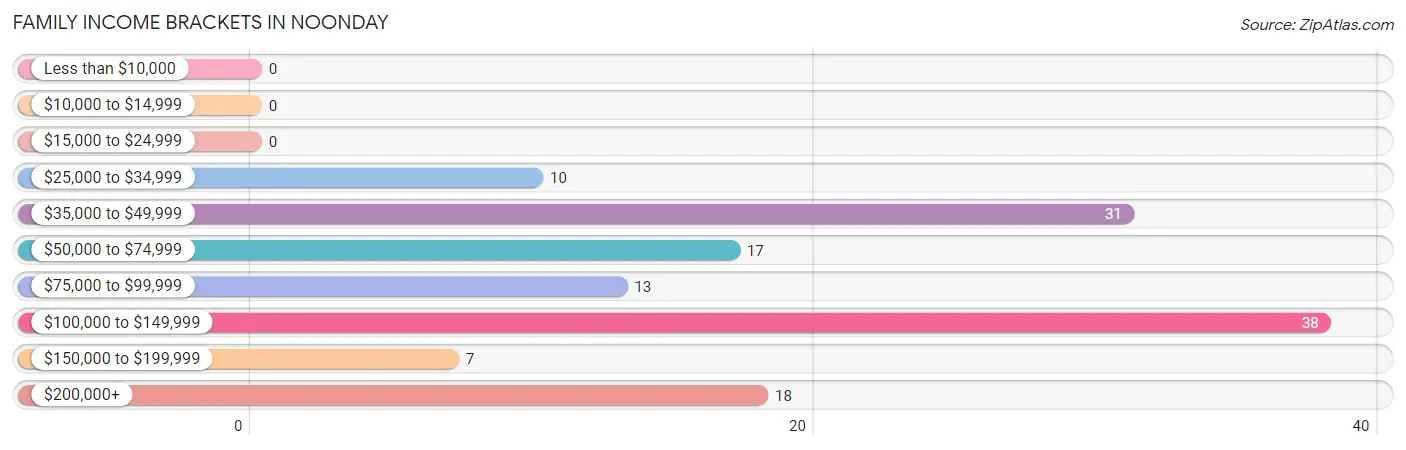
| Income Bracket | # Families | % Families |
| Less than $10,000 | 0 | 0.0% |
| $10,000 to $14,999 | 0 | 0.0% |
| $15,000 to $24,999 | 0 | 0.0% |
| $25,000 to $34,999 | 10 | 7.5% |
| $35,000 to $49,999 | 31 | 23.1% |
| $50,000 to $74,999 | 17 | 12.7% |
| $75,000 to $99,999 | 13 | 9.7% |
| $100,000 to $149,999 | 38 | 28.4% |
| $150,000 to $199,999 | 7 | 5.2% |
| $200,000+ | 18 | 13.4% |
Family Income by Famaliy Size in Noonday
4-person families (5 | 3.7%) account for the highest median family income in Noonday with $250,001 per family, while 4-person families (5 | 3.7%) have the highest median income of $62,500 per family member.
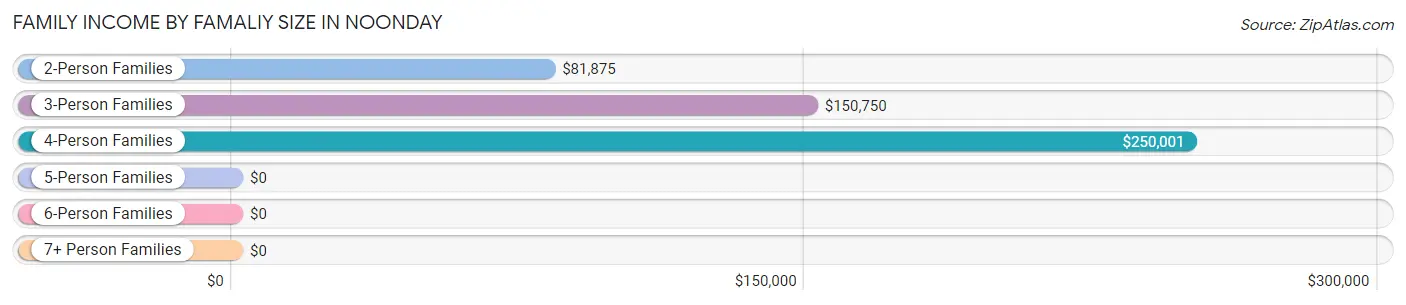
| Income Bracket | # Families | Median Income |
| 2-Person Families | 95 (70.9%) | $81,875 |
| 3-Person Families | 29 (21.6%) | $150,750 |
| 4-Person Families | 5 (3.7%) | $250,001 |
| 5-Person Families | 5 (3.7%) | $0 |
| 6-Person Families | 0 (0.0%) | $0 |
| 7+ Person Families | 0 (0.0%) | $0 |
| Total | 134 (100.0%) | $95,833 |
Family Income by Number of Earners in Noonday
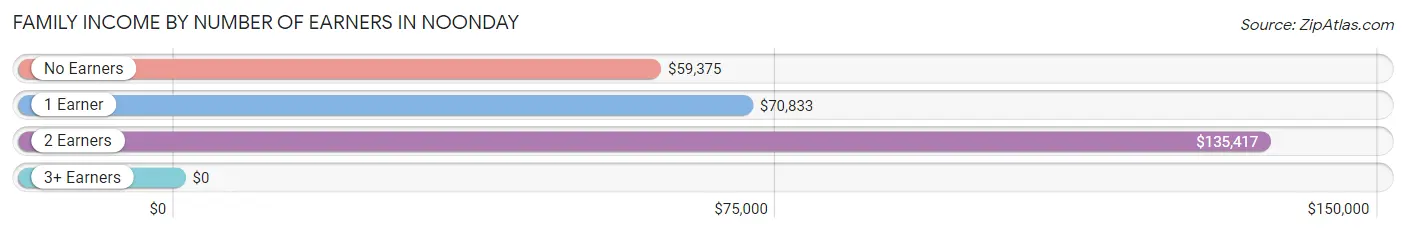
| Number of Earners | # Families | Median Income |
| No Earners | 29 (21.6%) | $59,375 |
| 1 Earner | 54 (40.3%) | $70,833 |
| 2 Earners | 37 (27.6%) | $135,417 |
| 3+ Earners | 14 (10.4%) | $0 |
| Total | 134 (100.0%) | $95,833 |
Household Income in Noonday
Household Income Brackets in Noonday
With 80 households falling in the category, the $50,000 to $74,999 income range is the most frequent in Noonday, accounting for 29.4% of all households. In contrast, only 6 households (2.2%) fall into the less than $10,000 income bracket, making it the least populous group.
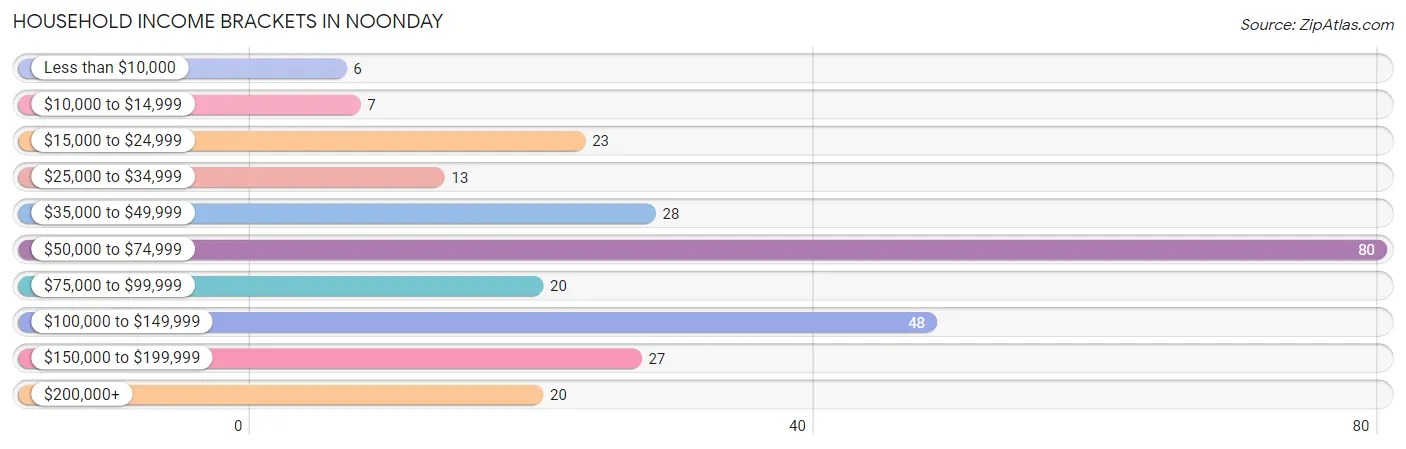
| Income Bracket | # Households | % Households |
| Less than $10,000 | 6 | 2.2% |
| $10,000 to $14,999 | 7 | 2.6% |
| $15,000 to $24,999 | 23 | 8.5% |
| $25,000 to $34,999 | 13 | 4.8% |
| $35,000 to $49,999 | 28 | 10.3% |
| $50,000 to $74,999 | 80 | 29.4% |
| $75,000 to $99,999 | 20 | 7.4% |
| $100,000 to $149,999 | 48 | 17.6% |
| $150,000 to $199,999 | 27 | 9.9% |
| $200,000+ | 20 | 7.4% |
Household Income by Householder Age in Noonday
The median household income in Noonday is $59,500, with the highest median household income of $96,250 found in the 45 to 64 years age bracket for the primary householder. A total of 73 households (26.8%) fall into this category. Meanwhile, the 15 to 24 years age bracket for the primary householder has the lowest median household income of $0, with 3 households (1.1%) in this group.
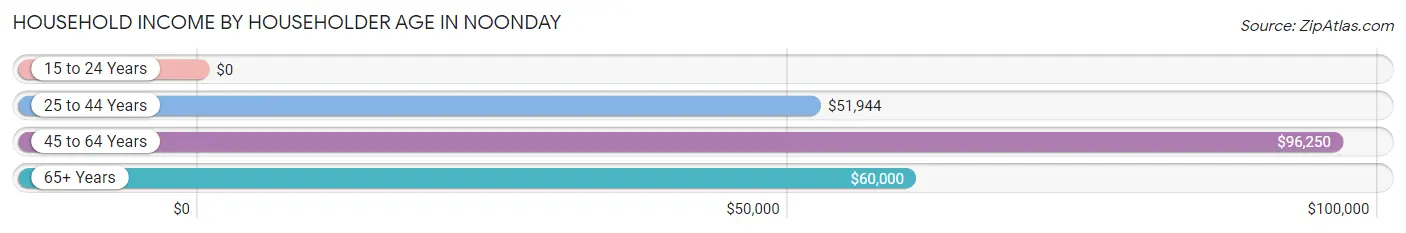
| Income Bracket | # Households | Median Income |
| 15 to 24 Years | 3 (1.1%) | $0 |
| 25 to 44 Years | 114 (41.9%) | $51,944 |
| 45 to 64 Years | 73 (26.8%) | $96,250 |
| 65+ Years | 82 (30.1%) | $60,000 |
| Total | 272 (100.0%) | $59,500 |
Poverty in Noonday
Income Below Poverty by Sex and Age in Noonday
With 1.4% poverty level for males and 4.5% for females among the residents of Noonday, 75 year old and over males and 18 to 24 year old females are the most vulnerable to poverty, with 2 males (7.4%) and 3 females (30.0%) in their respective age groups living below the poverty level.
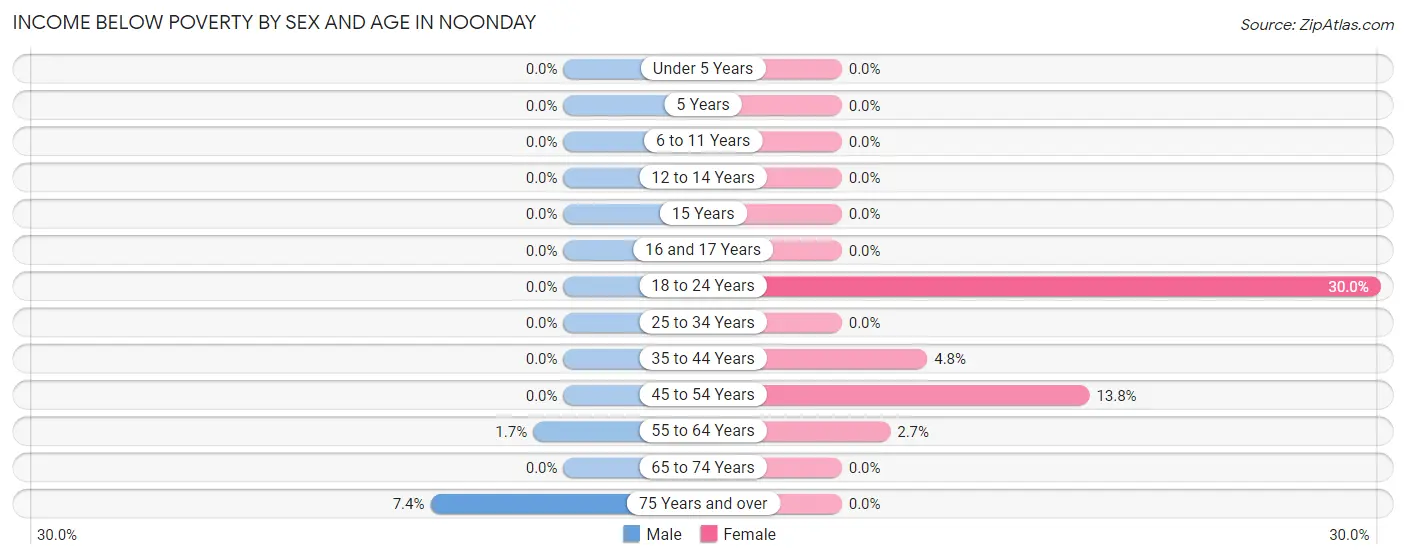
| Age Bracket | Male | Female |
| Under 5 Years | 0 (0.0%) | 0 (0.0%) |
| 5 Years | 0 (0.0%) | 0 (0.0%) |
| 6 to 11 Years | 0 (0.0%) | 0 (0.0%) |
| 12 to 14 Years | 0 (0.0%) | 0 (0.0%) |
| 15 Years | 0 (0.0%) | 0 (0.0%) |
| 16 and 17 Years | 0 (0.0%) | 0 (0.0%) |
| 18 to 24 Years | 0 (0.0%) | 3 (30.0%) |
| 25 to 34 Years | 0 (0.0%) | 0 (0.0%) |
| 35 to 44 Years | 0 (0.0%) | 4 (4.8%) |
| 45 to 54 Years | 0 (0.0%) | 4 (13.8%) |
| 55 to 64 Years | 1 (1.7%) | 2 (2.7%) |
| 65 to 74 Years | 0 (0.0%) | 0 (0.0%) |
| 75 Years and over | 2 (7.4%) | 0 (0.0%) |
| Total | 3 (1.4%) | 13 (4.5%) |
Income Above Poverty by Sex and Age in Noonday
According to the poverty statistics in Noonday, males aged under 5 years and females aged under 5 years are the age groups that are most secure financially, with 100.0% of males and 100.0% of females in these age groups living above the poverty line.
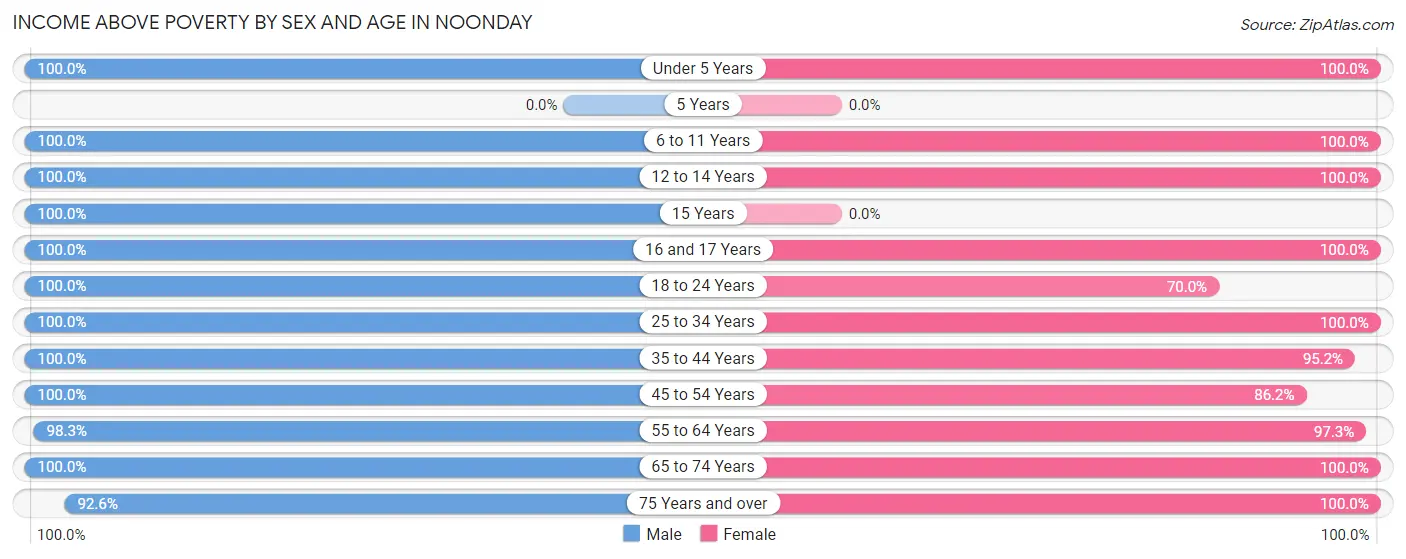
| Age Bracket | Male | Female |
| Under 5 Years | 2 (100.0%) | 7 (100.0%) |
| 5 Years | 0 (0.0%) | 0 (0.0%) |
| 6 to 11 Years | 2 (100.0%) | 1 (100.0%) |
| 12 to 14 Years | 1 (100.0%) | 8 (100.0%) |
| 15 Years | 3 (100.0%) | 0 (0.0%) |
| 16 and 17 Years | 2 (100.0%) | 2 (100.0%) |
| 18 to 24 Years | 12 (100.0%) | 7 (70.0%) |
| 25 to 34 Years | 14 (100.0%) | 28 (100.0%) |
| 35 to 44 Years | 44 (100.0%) | 80 (95.2%) |
| 45 to 54 Years | 10 (100.0%) | 25 (86.2%) |
| 55 to 64 Years | 58 (98.3%) | 72 (97.3%) |
| 65 to 74 Years | 44 (100.0%) | 26 (100.0%) |
| 75 Years and over | 25 (92.6%) | 21 (100.0%) |
| Total | 217 (98.6%) | 277 (95.5%) |
Income Below Poverty Among Married-Couple Families in Noonday
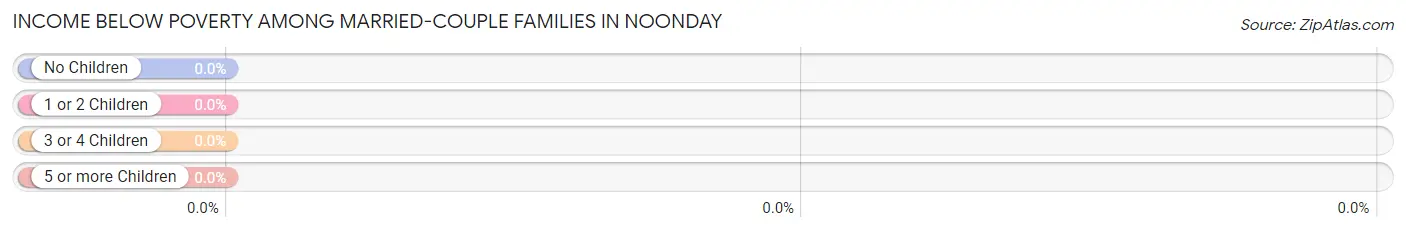
| Children | Above Poverty | Below Poverty |
| No Children | 113 (100.0%) | 0 (0.0%) |
| 1 or 2 Children | 14 (100.0%) | 0 (0.0%) |
| 3 or 4 Children | 2 (100.0%) | 0 (0.0%) |
| 5 or more Children | 0 (0.0%) | 0 (0.0%) |
| Total | 129 (100.0%) | 0 (0.0%) |
Income Below Poverty Among Single-Parent Households in Noonday
| Children | Single Father | Single Mother |
| No Children | 0 (0.0%) | 0 (0.0%) |
| 1 or 2 Children | 0 (0.0%) | 0 (0.0%) |
| 3 or 4 Children | 0 (0.0%) | 0 (0.0%) |
| 5 or more Children | 0 (0.0%) | 0 (0.0%) |
| Total | 0 (0.0%) | 0 (0.0%) |
Income Below Poverty Among Married-Couple vs Single-Parent Households in Noonday
| Children | Married-Couple Families | Single-Parent Households |
| No Children | 0 (0.0%) | 0 (0.0%) |
| 1 or 2 Children | 0 (0.0%) | 0 (0.0%) |
| 3 or 4 Children | 0 (0.0%) | 0 (0.0%) |
| 5 or more Children | 0 (0.0%) | 0 (0.0%) |
| Total | 0 (0.0%) | 0 (0.0%) |
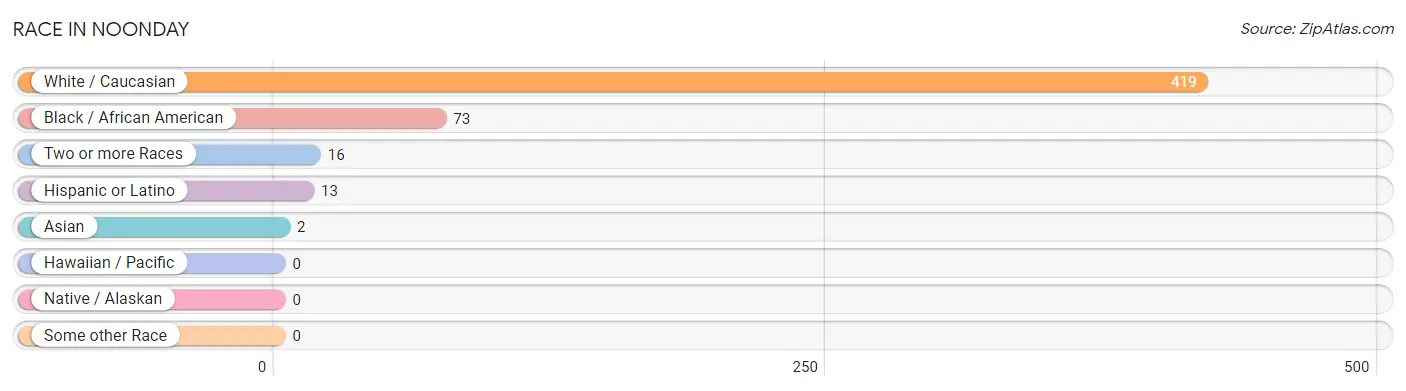
Race in Noonday
The most populous races in Noonday are White / Caucasian (419 | 82.2%), Black / African American (73 | 14.3%), and Two or more Races (16 | 3.1%).
| Race | # Population | % Population |
| Asian | 2 | 0.4% |
| Black / African American | 73 | 14.3% |
| Hawaiian / Pacific | 0 | 0.0% |
| Hispanic or Latino | 13 | 2.5% |
| Native / Alaskan | 0 | 0.0% |
| White / Caucasian | 419 | 82.2% |
| Two or more Races | 16 | 3.1% |
| Some other Race | 0 | 0.0% |
| Total | 510 | 100.0% |
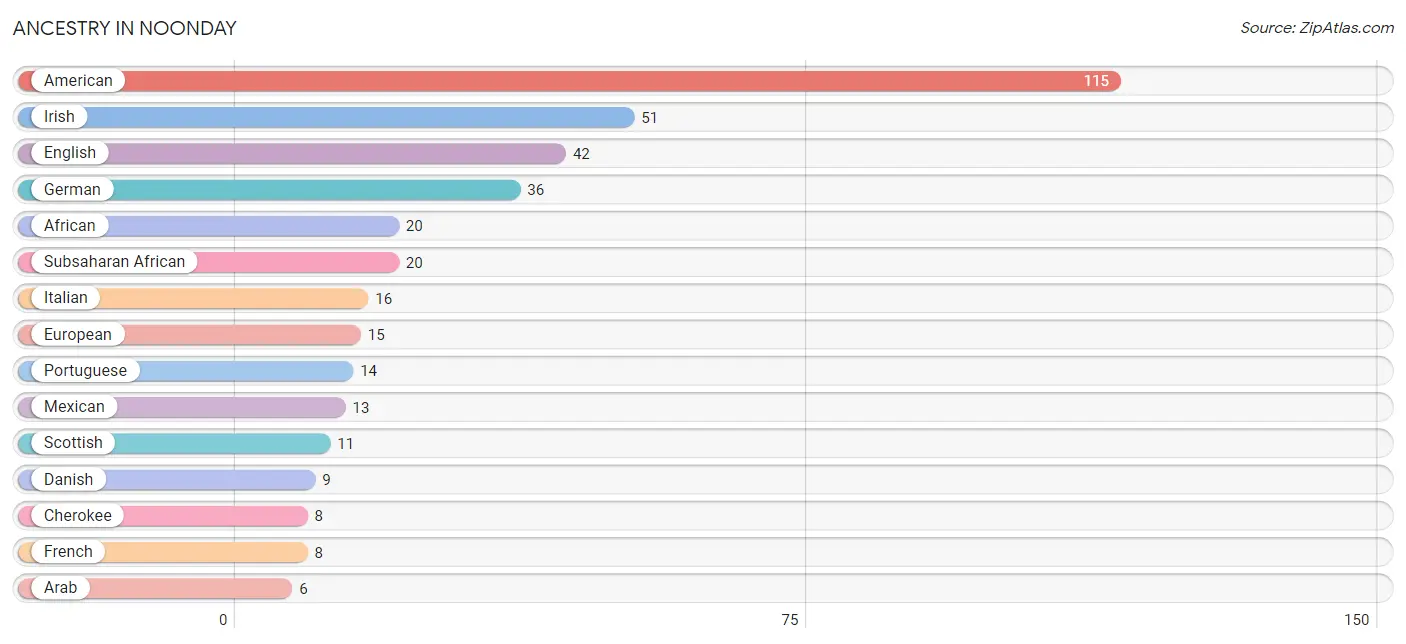
Ancestry in Noonday
The most populous ancestries reported in Noonday are American (115 | 22.6%), Irish (51 | 10.0%), English (42 | 8.2%), German (36 | 7.1%), and African (20 | 3.9%), together accounting for 51.8% of all Noonday residents.
| Ancestry | # Population | % Population |
| African | 20 | 3.9% |
| American | 115 | 22.6% |
| Arab | 6 | 1.2% |
| British | 5 | 1.0% |
| Cherokee | 8 | 1.6% |
| Czech | 2 | 0.4% |
| Danish | 9 | 1.8% |
| Dutch | 3 | 0.6% |
| English | 42 | 8.2% |
| European | 15 | 2.9% |
| French | 8 | 1.6% |
| German | 36 | 7.1% |
| Irish | 51 | 10.0% |
| Italian | 16 | 3.1% |
| Lebanese | 6 | 1.2% |
| Mexican | 13 | 2.5% |
| Norwegian | 5 | 1.0% |
| Polish | 1 | 0.2% |
| Portuguese | 14 | 2.8% |
| Scotch-Irish | 2 | 0.4% |
| Scottish | 11 | 2.2% |
| Sri Lankan | 2 | 0.4% |
| Subsaharan African | 20 | 3.9% |
| Welsh | 4 | 0.8% | View All 24 Rows |
Immigrants in Noonday
The most numerous immigrant groups reported in Noonday came from Canada (14 | 2.8%), Asia (2 | 0.4%), Europe (2 | 0.4%), Germany (2 | 0.4%), and South Eastern Asia (2 | 0.4%), together accounting for 4.3% of all Noonday residents.
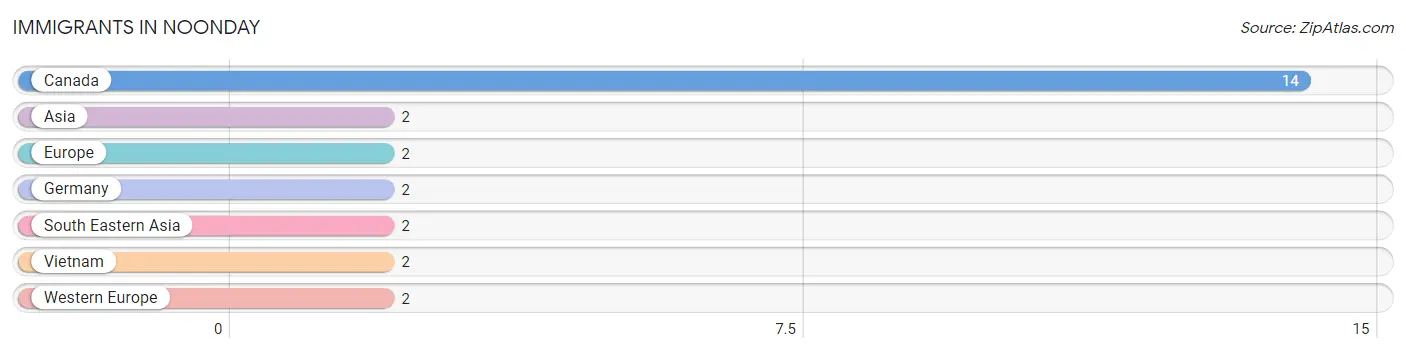
| Immigration Origin | # Population | % Population |
| Asia | 2 | 0.4% |
| Canada | 14 | 2.8% |
| Europe | 2 | 0.4% |
| Germany | 2 | 0.4% |
| South Eastern Asia | 2 | 0.4% |
| Vietnam | 2 | 0.4% |
| Western Europe | 2 | 0.4% | View All 7 Rows |
Sex and Age in Noonday
Sex and Age in Noonday
The most populous age groups in Noonday are 35 to 39 Years (33 | 15.0%) for men and 40 to 44 Years (59 | 20.3%) for women.
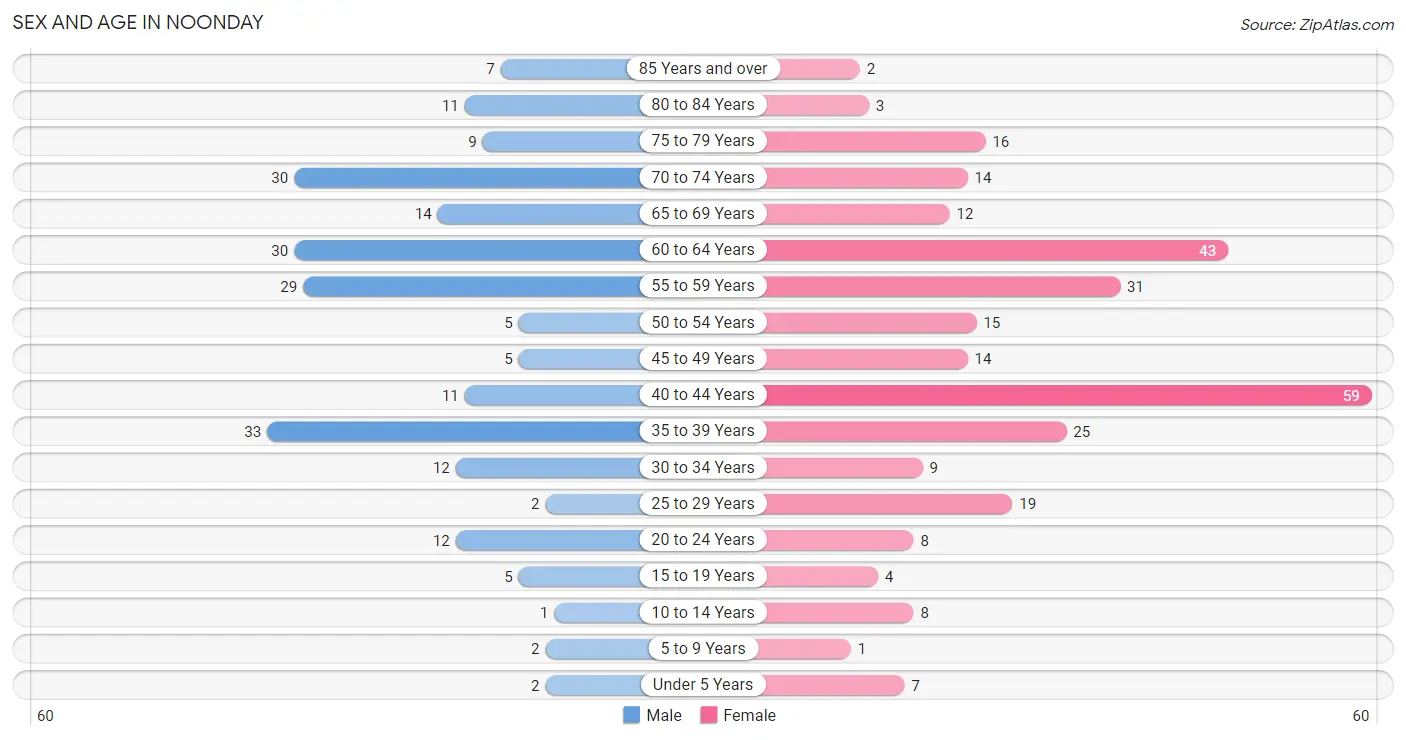
| Age Bracket | Male | Female |
| Under 5 Years | 2 (0.9%) | 7 (2.4%) |
| 5 to 9 Years | 2 (0.9%) | 1 (0.3%) |
| 10 to 14 Years | 1 (0.4%) | 8 (2.8%) |
| 15 to 19 Years | 5 (2.3%) | 4 (1.4%) |
| 20 to 24 Years | 12 (5.4%) | 8 (2.8%) |
| 25 to 29 Years | 2 (0.9%) | 19 (6.6%) |
| 30 to 34 Years | 12 (5.4%) | 9 (3.1%) |
| 35 to 39 Years | 33 (15.0%) | 25 (8.6%) |
| 40 to 44 Years | 11 (5.0%) | 59 (20.3%) |
| 45 to 49 Years | 5 (2.3%) | 14 (4.8%) |
| 50 to 54 Years | 5 (2.3%) | 15 (5.2%) |
| 55 to 59 Years | 29 (13.2%) | 31 (10.7%) |
| 60 to 64 Years | 30 (13.6%) | 43 (14.8%) |
| 65 to 69 Years | 14 (6.4%) | 12 (4.1%) |
| 70 to 74 Years | 30 (13.6%) | 14 (4.8%) |
| 75 to 79 Years | 9 (4.1%) | 16 (5.5%) |
| 80 to 84 Years | 11 (5.0%) | 3 (1.0%) |
| 85 Years and over | 7 (3.2%) | 2 (0.7%) |
| Total | 220 (100.0%) | 290 (100.0%) |
Families and Households in Noonday
Median Family Size in Noonday
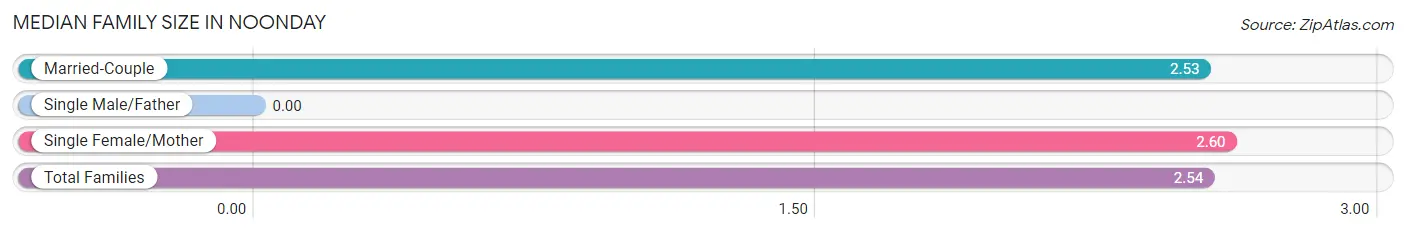
| Family Type | # Families | Family Size |
| Married-Couple | 129 (96.3%) | 2.53 |
| Single Male/Father | 0 (0.0%) | - |
| Single Female/Mother | 5 (3.7%) | 2.60 |
| Total Families | 134 (100.0%) | 2.54 |
Median Household Size in Noonday
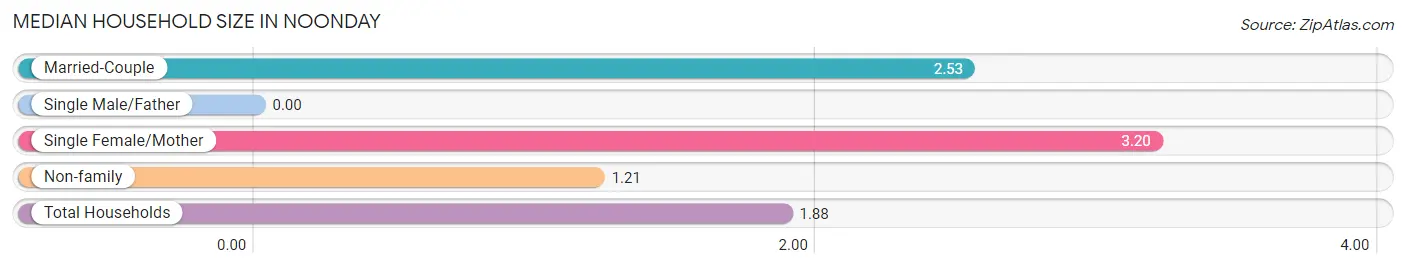
| Household Type | # Households | Household Size |
| Married-Couple | 129 (47.4%) | 2.53 |
| Single Male/Father | 0 (0.0%) | - |
| Single Female/Mother | 5 (1.8%) | 3.20 |
| Non-family | 138 (50.7%) | 1.21 |
| Total Households | 272 (100.0%) | 1.88 |
Household Size by Marriage Status in Noonday
Out of a total of 272 households in Noonday, 134 (49.3%) are family households, while 138 (50.7%) are nonfamily households. The most numerous type of family households are 2-person households, comprising 92, and the most common type of nonfamily households are 1-person households, comprising 105.
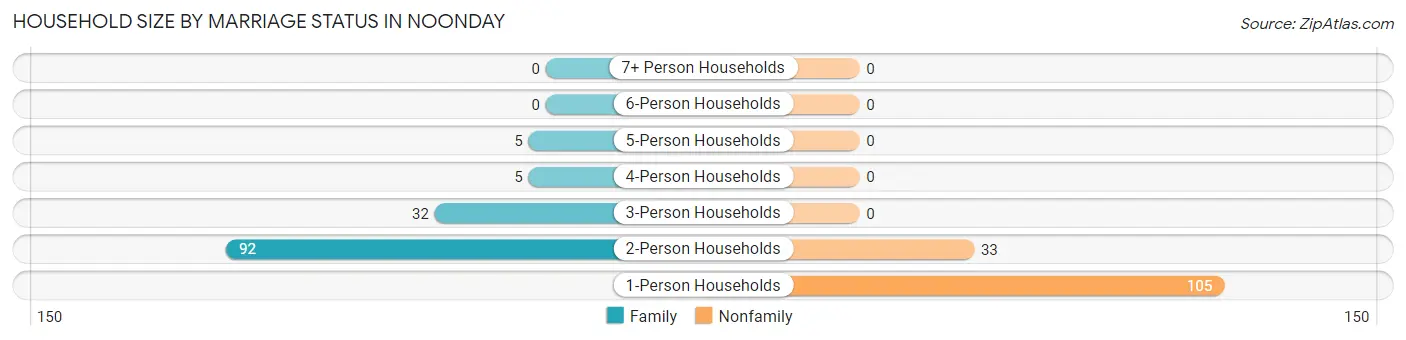
| Household Size | Family Households | Nonfamily Households |
| 1-Person Households | - | 105 (38.6%) |
| 2-Person Households | 92 (33.8%) | 33 (12.1%) |
| 3-Person Households | 32 (11.8%) | 0 (0.0%) |
| 4-Person Households | 5 (1.8%) | 0 (0.0%) |
| 5-Person Households | 5 (1.8%) | 0 (0.0%) |
| 6-Person Households | 0 (0.0%) | 0 (0.0%) |
| 7+ Person Households | 0 (0.0%) | 0 (0.0%) |
| Total | 134 (49.3%) | 138 (50.7%) |
Female Fertility in Noonday
Fertility by Age in Noonday
| Age Bracket | Women with Births | Births / 1,000 Women |
| 15 to 19 years | 0 (0.0%) | 0.0 |
| 20 to 34 years | 0 (0.0%) | 0.0 |
| 35 to 50 years | 0 (0.0%) | 0.0 |
| Total | 0 (0.0%) | 0.0 |
Fertility by Age by Marriage Status in Noonday
| Age Bracket | Married | Unmarried |
| 15 to 19 years | 0 (0.0%) | 0 (0.0%) |
| 20 to 34 years | 0 (0.0%) | 0 (0.0%) |
| 35 to 50 years | 0 (0.0%) | 0 (0.0%) |
| Total | 0 (0.0%) | 0 (0.0%) |
Fertility by Education in Noonday
| Educational Attainment | Women with Births | Births / 1,000 Women |
| Less than High School | 0 (0.0%) | 0.0 |
| High School Diploma | 0 (0.0%) | 0.0 |
| College or Associate's Degree | 0 (0.0%) | 0.0 |
| Bachelor's Degree | 0 (0.0%) | 0.0 |
| Graduate Degree | 0 (0.0%) | 0.0 |
| Total | 0 (0.0%) | 0.0 |
Fertility by Education by Marriage Status in Noonday
| Educational Attainment | Married | Unmarried |
| Less than High School | 0 (0.0%) | 0 (0.0%) |
| High School Diploma | 0 (0.0%) | 0 (0.0%) |
| College or Associate's Degree | 0 (0.0%) | 0 (0.0%) |
| Bachelor's Degree | 0 (0.0%) | 0 (0.0%) |
| Graduate Degree | 0 (0.0%) | 0 (0.0%) |
| Total | 0 (0.0%) | 0 (0.0%) |
Employment Characteristics in Noonday
Employment by Class of Employer in Noonday
Among the 307 employed individuals in Noonday, private company employees (216 | 70.4%), local government employees (26 | 8.5%), and self-employed (not incorporated) (21 | 6.8%) make up the most common classes of employment.
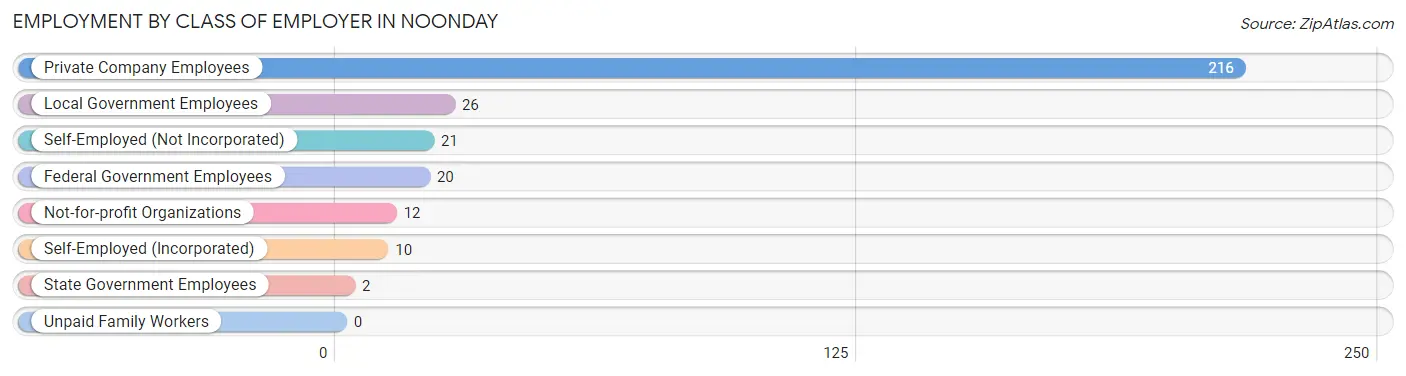
| Employer Class | # Employees | % Employees |
| Private Company Employees | 216 | 70.4% |
| Self-Employed (Incorporated) | 10 | 3.3% |
| Self-Employed (Not Incorporated) | 21 | 6.8% |
| Not-for-profit Organizations | 12 | 3.9% |
| Local Government Employees | 26 | 8.5% |
| State Government Employees | 2 | 0.6% |
| Federal Government Employees | 20 | 6.5% |
| Unpaid Family Workers | 0 | 0.0% |
| Total | 307 | 100.0% |
Employment Status by Age in Noonday
According to the labor force statistics for Noonday, out of the total population over 16 years of age (486), 67.5% or 328 individuals are in the labor force, with 3.0% or 10 of them unemployed. The age group with the highest labor force participation rate is 35 to 44 years, with 96.9% or 124 individuals in the labor force. Within the labor force, the 45 to 54 years age range has the highest percentage of unemployed individuals, with 8.1% or 3 of them being unemployed.
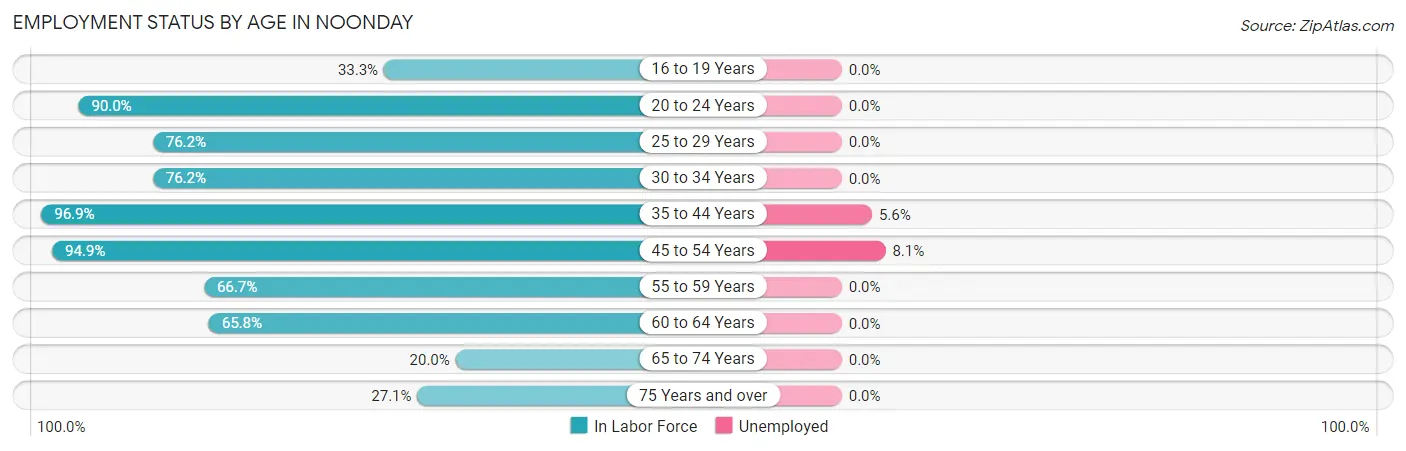
| Age Bracket | In Labor Force | Unemployed |
| 16 to 19 Years | 2 (33.3%) | 0 (0.0%) |
| 20 to 24 Years | 18 (90.0%) | 0 (0.0%) |
| 25 to 29 Years | 16 (76.2%) | 0 (0.0%) |
| 30 to 34 Years | 16 (76.2%) | 0 (0.0%) |
| 35 to 44 Years | 124 (96.9%) | 7 (5.6%) |
| 45 to 54 Years | 37 (94.9%) | 3 (8.1%) |
| 55 to 59 Years | 40 (66.7%) | 0 (0.0%) |
| 60 to 64 Years | 48 (65.8%) | 0 (0.0%) |
| 65 to 74 Years | 14 (20.0%) | 0 (0.0%) |
| 75 Years and over | 13 (27.1%) | 0 (0.0%) |
| Total | 328 (67.5%) | 10 (3.0%) |
Employment Status by Educational Attainment in Noonday
According to labor force statistics for Noonday, 82.2% of individuals (281) out of the total population between 25 and 64 years of age (342) are in the labor force, with 3.6% or 10 of them being unemployed. The group with the highest labor force participation rate are those with the educational attainment of bachelor's degree or higher, with 85.3% or 99 individuals in the labor force. Within the labor force, individuals with high school diploma education have the highest percentage of unemployment, with 10.1% or 10 of them being unemployed.
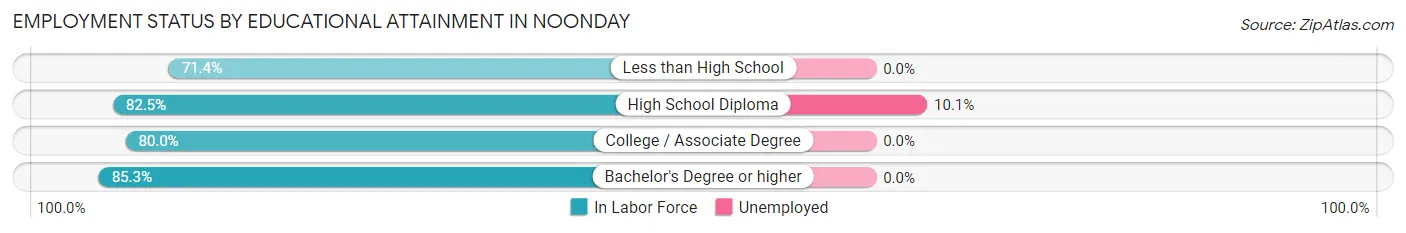
| Educational Attainment | In Labor Force | Unemployed |
| Less than High School | 15 (71.4%) | 0 (0.0%) |
| High School Diploma | 99 (82.5%) | 12 (10.1%) |
| College / Associate Degree | 68 (80.0%) | 0 (0.0%) |
| Bachelor's Degree or higher | 99 (85.3%) | 0 (0.0%) |
| Total | 281 (82.2%) | 12 (3.6%) |
Employment Occupations by Sex in Noonday
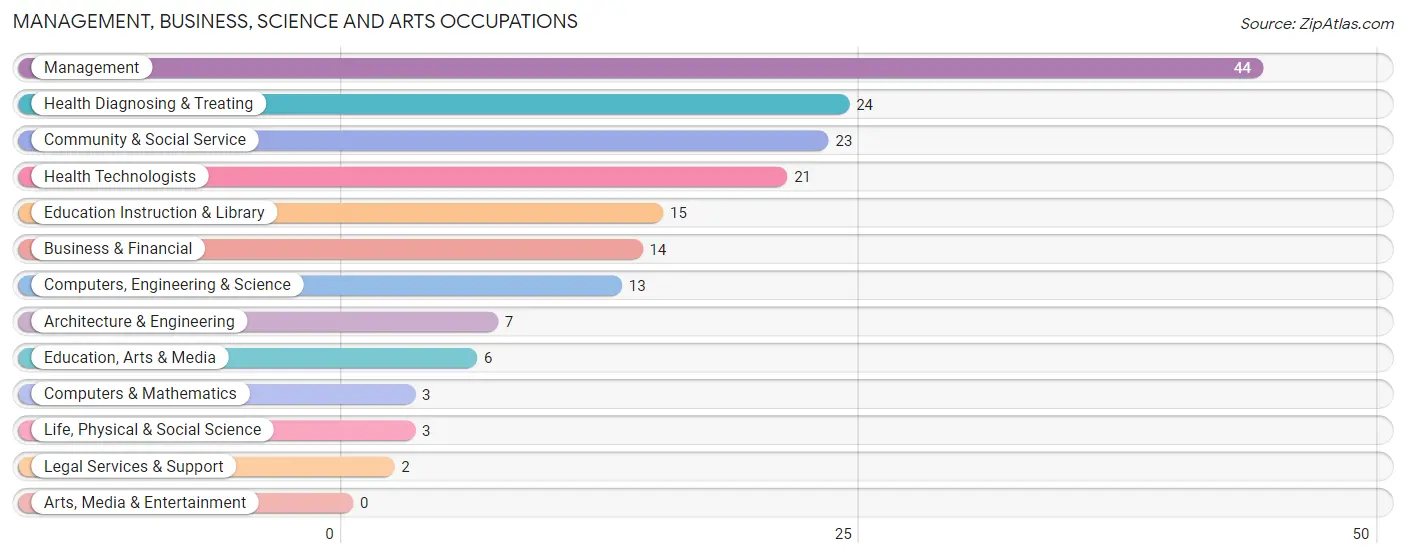
Management, Business, Science and Arts Occupations
The most common Management, Business, Science and Arts occupations in Noonday are Management (44 | 13.8%), Health Diagnosing & Treating (24 | 7.5%), Community & Social Service (23 | 7.2%), Health Technologists (21 | 6.6%), and Education Instruction & Library (15 | 4.7%).
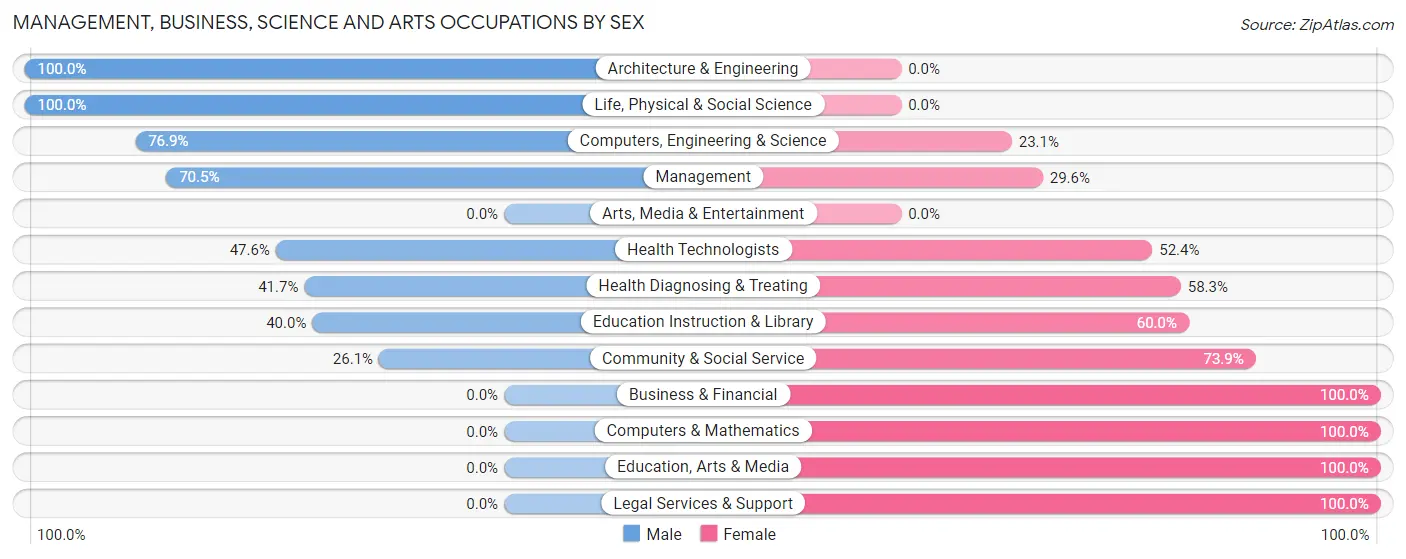
Management, Business, Science and Arts Occupations by Sex
Within the Management, Business, Science and Arts occupations in Noonday, the most male-oriented occupations are Architecture & Engineering (100.0%), Life, Physical & Social Science (100.0%), and Computers, Engineering & Science (76.9%), while the most female-oriented occupations are Business & Financial (100.0%), Computers & Mathematics (100.0%), and Education, Arts & Media (100.0%).
| Occupation | Male | Female |
| Management | 31 (70.5%) | 13 (29.5%) |
| Business & Financial | 0 (0.0%) | 14 (100.0%) |
| Computers, Engineering & Science | 10 (76.9%) | 3 (23.1%) |
| Computers & Mathematics | 0 (0.0%) | 3 (100.0%) |
| Architecture & Engineering | 7 (100.0%) | 0 (0.0%) |
| Life, Physical & Social Science | 3 (100.0%) | 0 (0.0%) |
| Community & Social Service | 6 (26.1%) | 17 (73.9%) |
| Education, Arts & Media | 0 (0.0%) | 6 (100.0%) |
| Legal Services & Support | 0 (0.0%) | 2 (100.0%) |
| Education Instruction & Library | 6 (40.0%) | 9 (60.0%) |
| Arts, Media & Entertainment | 0 (0.0%) | 0 (0.0%) |
| Health Diagnosing & Treating | 10 (41.7%) | 14 (58.3%) |
| Health Technologists | 10 (47.6%) | 11 (52.4%) |
| Total (Category) | 57 (48.3%) | 61 (51.7%) |
| Total (Overall) | 145 (45.6%) | 173 (54.4%) |
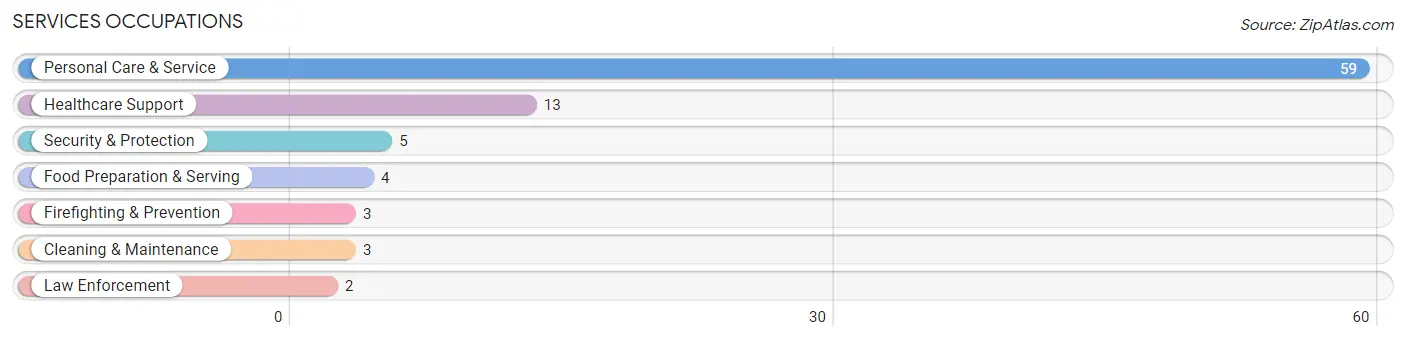
Services Occupations
The most common Services occupations in Noonday are Personal Care & Service (59 | 18.5%), Healthcare Support (13 | 4.1%), Security & Protection (5 | 1.6%), Food Preparation & Serving (4 | 1.3%), and Firefighting & Prevention (3 | 0.9%).
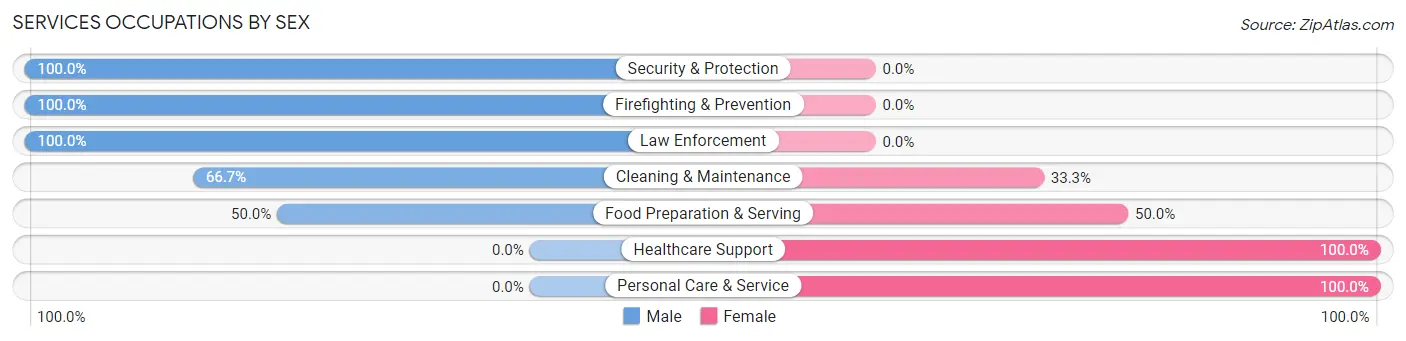
Services Occupations by Sex
Within the Services occupations in Noonday, the most male-oriented occupations are Security & Protection (100.0%), Firefighting & Prevention (100.0%), and Law Enforcement (100.0%), while the most female-oriented occupations are Healthcare Support (100.0%), Personal Care & Service (100.0%), and Food Preparation & Serving (50.0%).
| Occupation | Male | Female |
| Healthcare Support | 0 (0.0%) | 13 (100.0%) |
| Security & Protection | 5 (100.0%) | 0 (0.0%) |
| Firefighting & Prevention | 3 (100.0%) | 0 (0.0%) |
| Law Enforcement | 2 (100.0%) | 0 (0.0%) |
| Food Preparation & Serving | 2 (50.0%) | 2 (50.0%) |
| Cleaning & Maintenance | 2 (66.7%) | 1 (33.3%) |
| Personal Care & Service | 0 (0.0%) | 59 (100.0%) |
| Total (Category) | 9 (10.7%) | 75 (89.3%) |
| Total (Overall) | 145 (45.6%) | 173 (54.4%) |
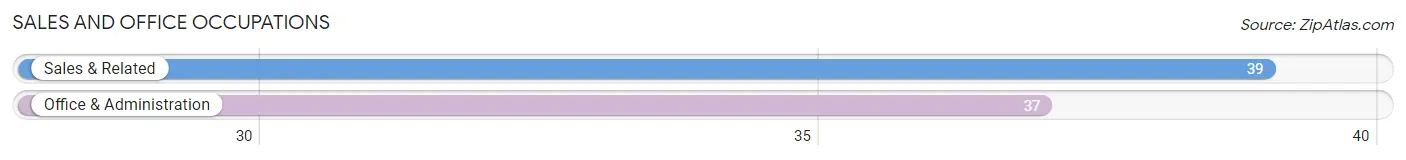
Sales and Office Occupations
The most common Sales and Office occupations in Noonday are Sales & Related (39 | 12.3%), and Office & Administration (37 | 11.6%).
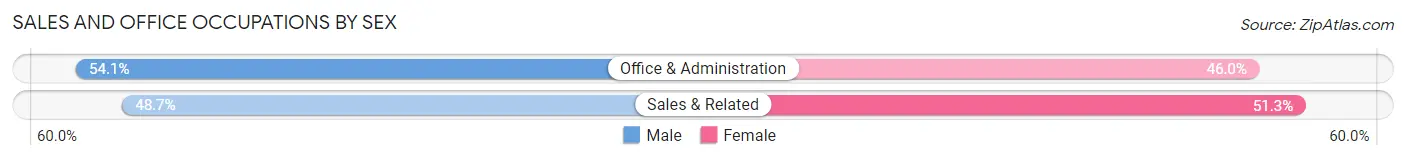
Sales and Office Occupations by Sex
| Occupation | Male | Female |
| Sales & Related | 19 (48.7%) | 20 (51.3%) |
| Office & Administration | 20 (54.0%) | 17 (46.0%) |
| Total (Category) | 39 (51.3%) | 37 (48.7%) |
| Total (Overall) | 145 (45.6%) | 173 (54.4%) |
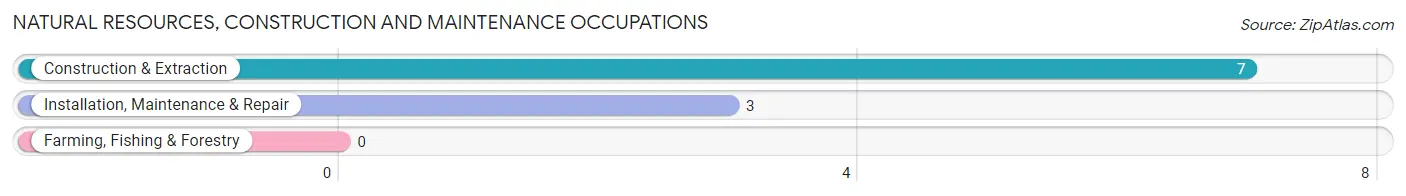
Natural Resources, Construction and Maintenance Occupations
The most common Natural Resources, Construction and Maintenance occupations in Noonday are Construction & Extraction (7 | 2.2%), and Installation, Maintenance & Repair (3 | 0.9%).
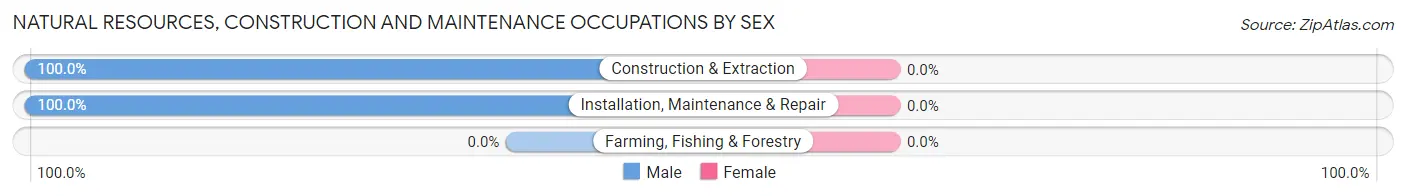
Natural Resources, Construction and Maintenance Occupations by Sex
| Occupation | Male | Female |
| Farming, Fishing & Forestry | 0 (0.0%) | 0 (0.0%) |
| Construction & Extraction | 7 (100.0%) | 0 (0.0%) |
| Installation, Maintenance & Repair | 3 (100.0%) | 0 (0.0%) |
| Total (Category) | 10 (100.0%) | 0 (0.0%) |
| Total (Overall) | 145 (45.6%) | 173 (54.4%) |
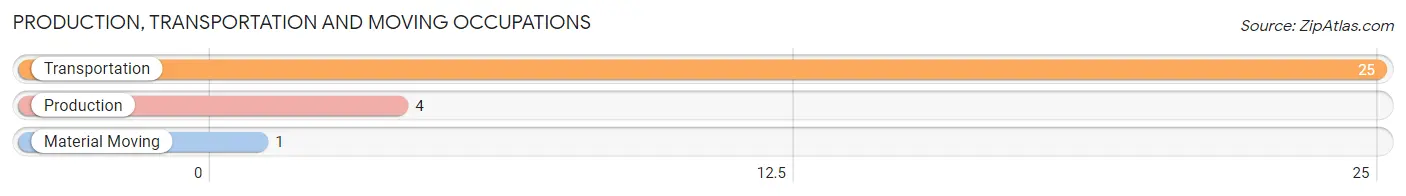
Production, Transportation and Moving Occupations
The most common Production, Transportation and Moving occupations in Noonday are Transportation (25 | 7.9%), Production (4 | 1.3%), and Material Moving (1 | 0.3%).
Production, Transportation and Moving Occupations by Sex
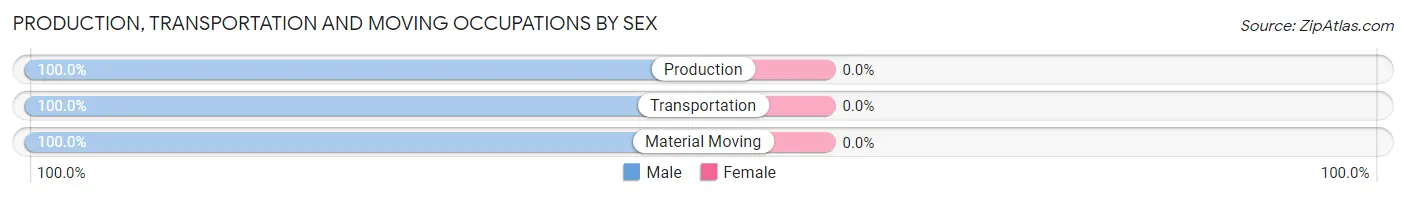
| Occupation | Male | Female |
| Production | 4 (100.0%) | 0 (0.0%) |
| Transportation | 25 (100.0%) | 0 (0.0%) |
| Material Moving | 1 (100.0%) | 0 (0.0%) |
| Total (Category) | 30 (100.0%) | 0 (0.0%) |
| Total (Overall) | 145 (45.6%) | 173 (54.4%) |
Employment Industries by Sex in Noonday
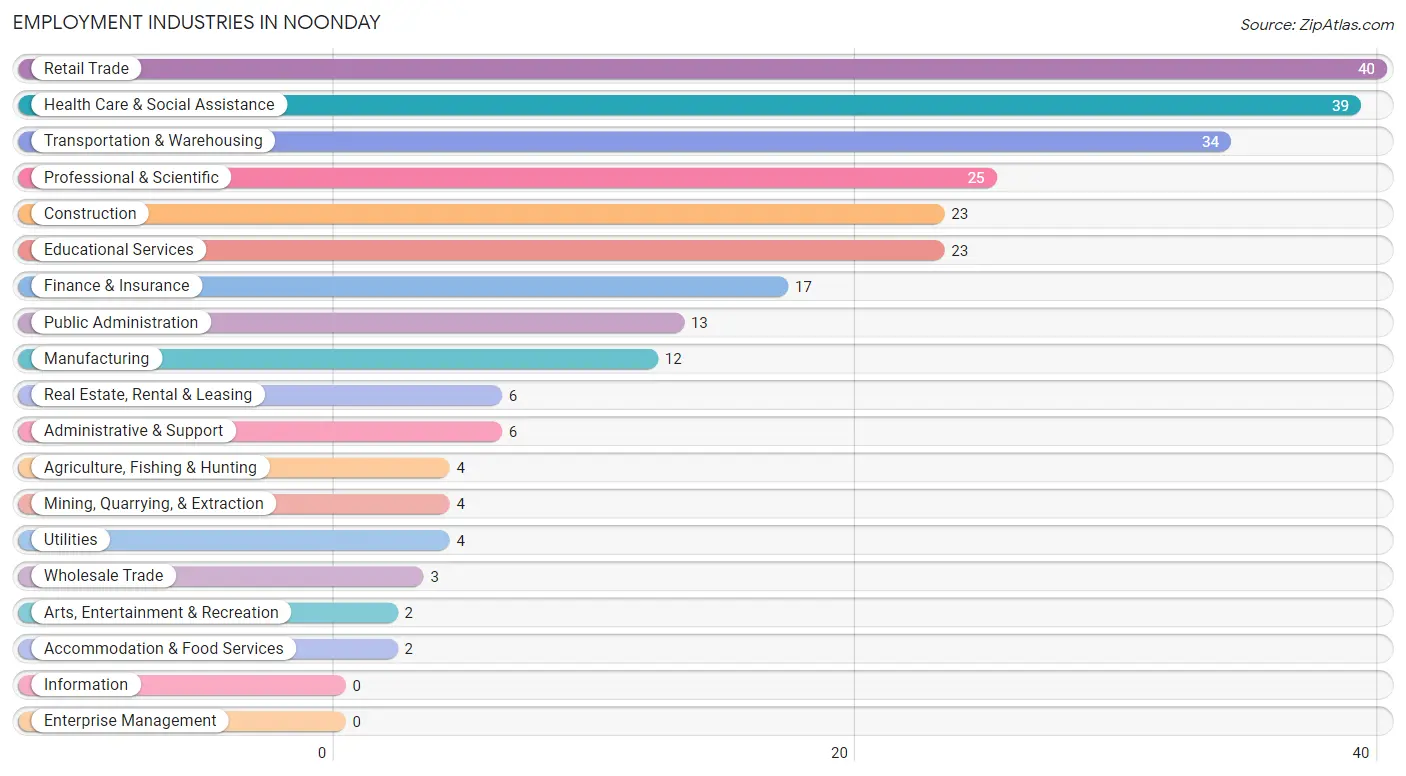
Employment Industries in Noonday
The major employment industries in Noonday include Retail Trade (40 | 12.6%), Health Care & Social Assistance (39 | 12.3%), Transportation & Warehousing (34 | 10.7%), Professional & Scientific (25 | 7.9%), and Construction (23 | 7.2%).
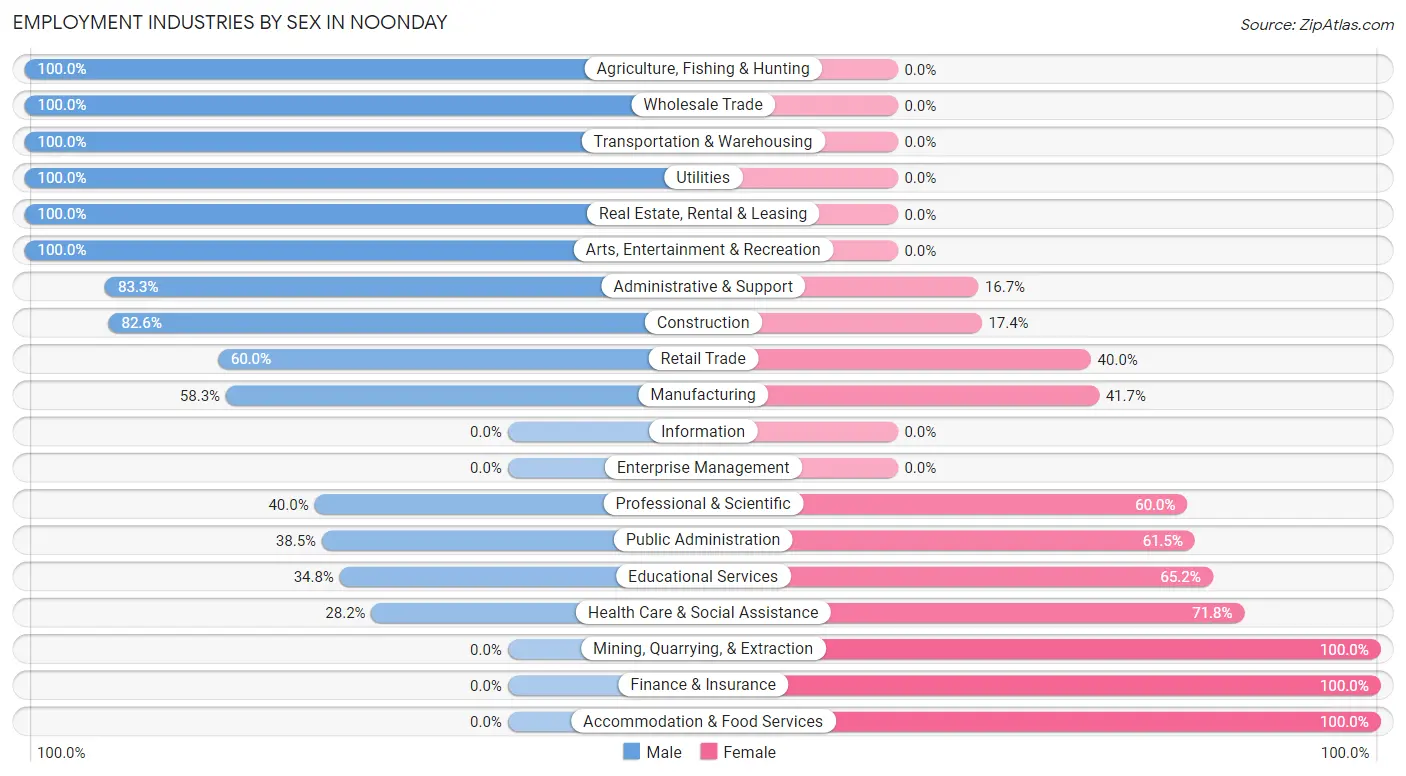
Employment Industries by Sex in Noonday
The Noonday industries that see more men than women are Agriculture, Fishing & Hunting (100.0%), Wholesale Trade (100.0%), and Transportation & Warehousing (100.0%), whereas the industries that tend to have a higher number of women are Mining, Quarrying, & Extraction (100.0%), Finance & Insurance (100.0%), and Accommodation & Food Services (100.0%).
| Industry | Male | Female |
| Agriculture, Fishing & Hunting | 4 (100.0%) | 0 (0.0%) |
| Mining, Quarrying, & Extraction | 0 (0.0%) | 4 (100.0%) |
| Construction | 19 (82.6%) | 4 (17.4%) |
| Manufacturing | 7 (58.3%) | 5 (41.7%) |
| Wholesale Trade | 3 (100.0%) | 0 (0.0%) |
| Retail Trade | 24 (60.0%) | 16 (40.0%) |
| Transportation & Warehousing | 34 (100.0%) | 0 (0.0%) |
| Utilities | 4 (100.0%) | 0 (0.0%) |
| Information | 0 (0.0%) | 0 (0.0%) |
| Finance & Insurance | 0 (0.0%) | 17 (100.0%) |
| Real Estate, Rental & Leasing | 6 (100.0%) | 0 (0.0%) |
| Professional & Scientific | 10 (40.0%) | 15 (60.0%) |
| Enterprise Management | 0 (0.0%) | 0 (0.0%) |
| Administrative & Support | 5 (83.3%) | 1 (16.7%) |
| Educational Services | 8 (34.8%) | 15 (65.2%) |
| Health Care & Social Assistance | 11 (28.2%) | 28 (71.8%) |
| Arts, Entertainment & Recreation | 2 (100.0%) | 0 (0.0%) |
| Accommodation & Food Services | 0 (0.0%) | 2 (100.0%) |
| Public Administration | 5 (38.5%) | 8 (61.5%) |
| Total | 145 (45.6%) | 173 (54.4%) |
Education in Noonday
School Enrollment in Noonday
The most common levels of schooling among the 39 students in Noonday are college / undergraduate (11 | 28.2%), middle school (10 | 25.6%), and high school (8 | 20.5%).
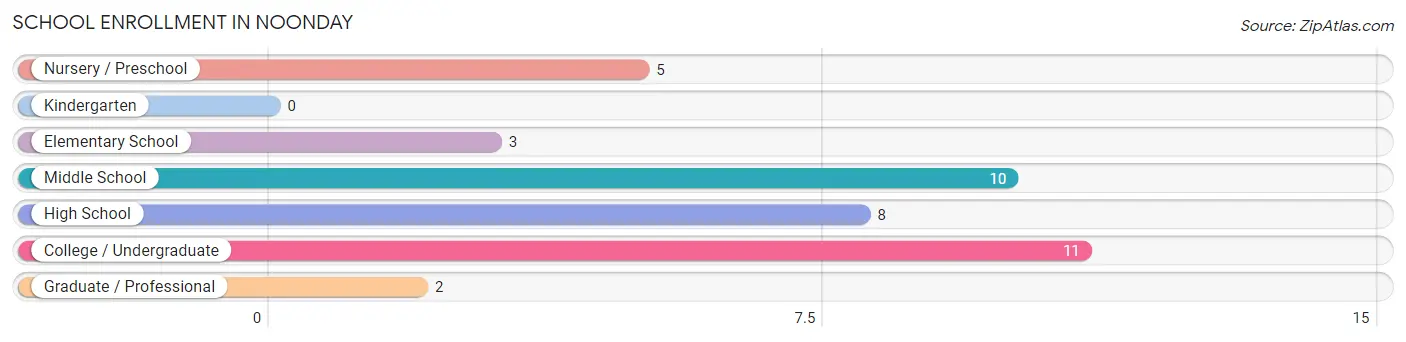
| School Level | # Students | % Students |
| Nursery / Preschool | 5 | 12.8% |
| Kindergarten | 0 | 0.0% |
| Elementary School | 3 | 7.7% |
| Middle School | 10 | 25.6% |
| High School | 8 | 20.5% |
| College / Undergraduate | 11 | 28.2% |
| Graduate / Professional | 2 | 5.1% |
| Total | 39 | 100.0% |
School Enrollment by Age by Funding Source in Noonday
Out of a total of 39 students who are enrolled in schools in Noonday, 7 (17.9%) attend a private institution, while the remaining 32 (82.1%) are enrolled in public schools. The age group of 3 to 4 year olds has the highest likelihood of being enrolled in private schools, with 5 (100.0% in the age bracket) enrolled. Conversely, the age group of 5 to 9 year old has the lowest likelihood of being enrolled in a private school, with 3 (100.0% in the age bracket) attending a public institution.
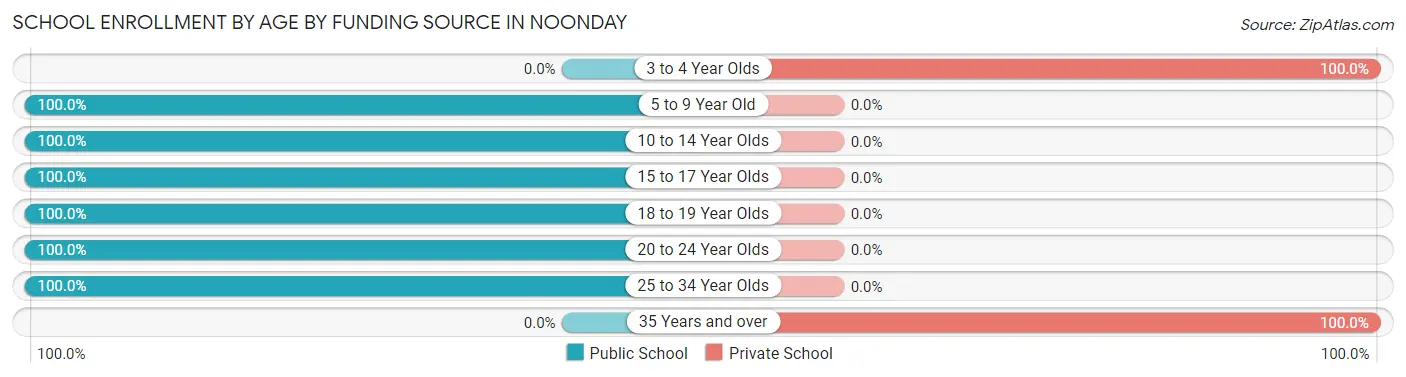
| Age Bracket | Public School | Private School |
| 3 to 4 Year Olds | 0 (0.0%) | 5 (100.0%) |
| 5 to 9 Year Old | 3 (100.0%) | 0 (0.0%) |
| 10 to 14 Year Olds | 9 (100.0%) | 0 (0.0%) |
| 15 to 17 Year Olds | 7 (100.0%) | 0 (0.0%) |
| 18 to 19 Year Olds | 2 (100.0%) | 0 (0.0%) |
| 20 to 24 Year Olds | 8 (100.0%) | 0 (0.0%) |
| 25 to 34 Year Olds | 3 (100.0%) | 0 (0.0%) |
| 35 Years and over | 0 (0.0%) | 2 (100.0%) |
| Total | 32 (82.1%) | 7 (17.9%) |
Educational Attainment by Field of Study in Noonday
Business (39 | 26.7%), education (25 | 17.1%), science & technology (20 | 13.7%), arts & humanities (14 | 9.6%), and bio, nature & agricultural (10 | 6.9%) are the most common fields of study among 146 individuals in Noonday who have obtained a bachelor's degree or higher.
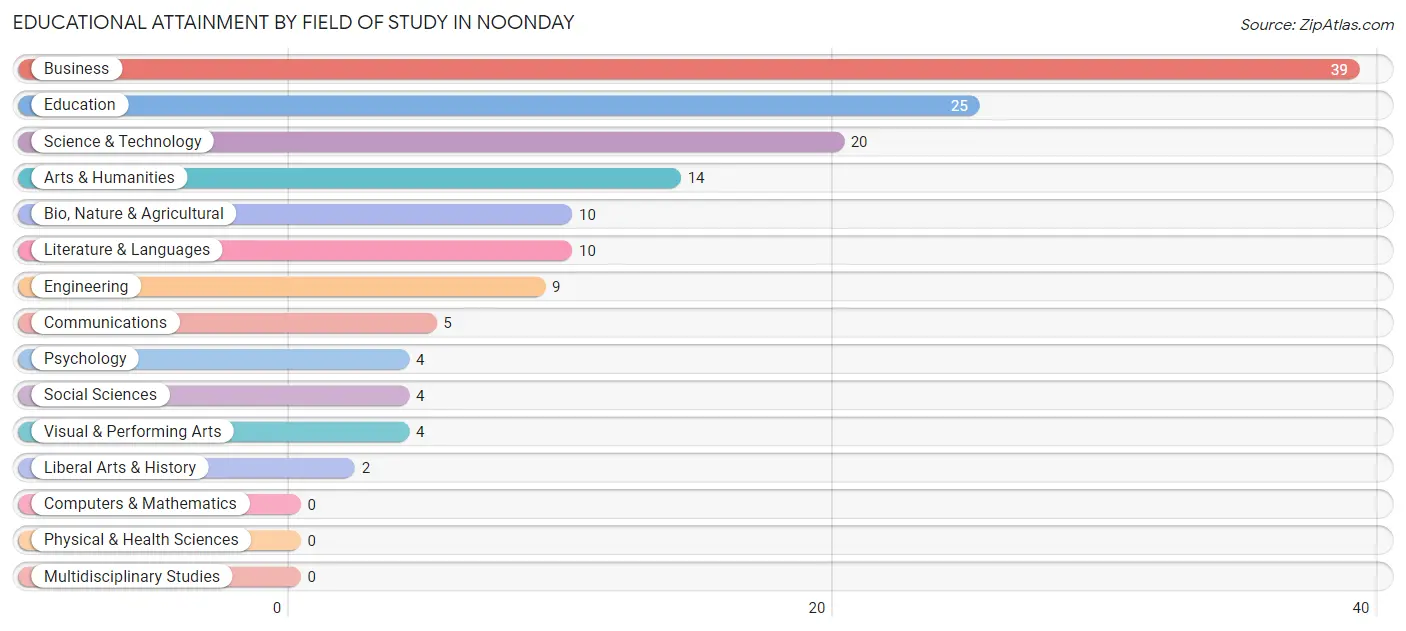
| Field of Study | # Graduates | % Graduates |
| Computers & Mathematics | 0 | 0.0% |
| Bio, Nature & Agricultural | 10 | 6.9% |
| Physical & Health Sciences | 0 | 0.0% |
| Psychology | 4 | 2.7% |
| Social Sciences | 4 | 2.7% |
| Engineering | 9 | 6.2% |
| Multidisciplinary Studies | 0 | 0.0% |
| Science & Technology | 20 | 13.7% |
| Business | 39 | 26.7% |
| Education | 25 | 17.1% |
| Literature & Languages | 10 | 6.9% |
| Liberal Arts & History | 2 | 1.4% |
| Visual & Performing Arts | 4 | 2.7% |
| Communications | 5 | 3.4% |
| Arts & Humanities | 14 | 9.6% |
| Total | 146 | 100.0% |
Transportation & Commute in Noonday
Vehicle Availability by Sex in Noonday
The most prevalent vehicle ownership categories in Noonday are males with 2 vehicles (86, accounting for 59.3%) and females with 2 vehicles (101, making up 53.1%).
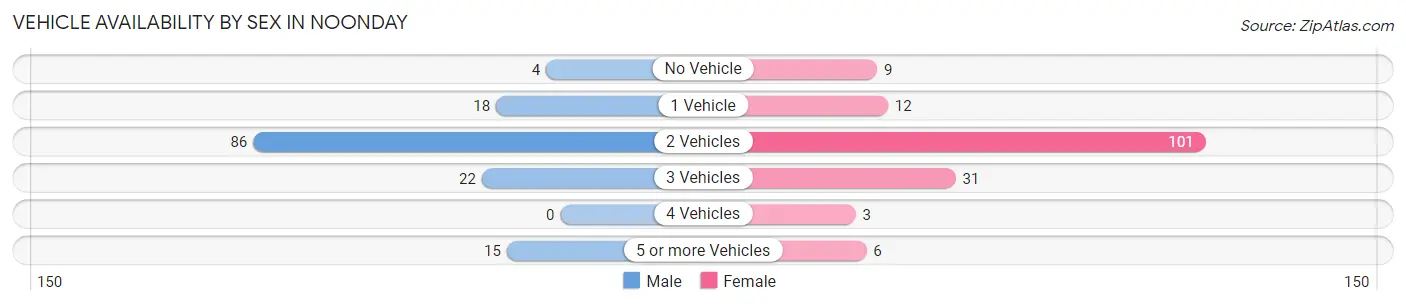
| Vehicles Available | Male | Female |
| No Vehicle | 4 (2.8%) | 9 (5.6%) |
| 1 Vehicle | 18 (12.4%) | 12 (7.4%) |
| 2 Vehicles | 86 (59.3%) | 101 (62.4%) |
| 3 Vehicles | 22 (15.2%) | 31 (19.1%) |
| 4 Vehicles | 0 (0.0%) | 3 (1.8%) |
| 5 or more Vehicles | 15 (10.3%) | 6 (3.7%) |
| Total | 145 (100.0%) | 162 (100.0%) |
Commute Time in Noonday
The most frequently occuring commute durations in Noonday are 30 to 34 minutes (86 commuters, 29.8%), 20 to 24 minutes (55 commuters, 19.0%), and 10 to 14 minutes (51 commuters, 17.6%).
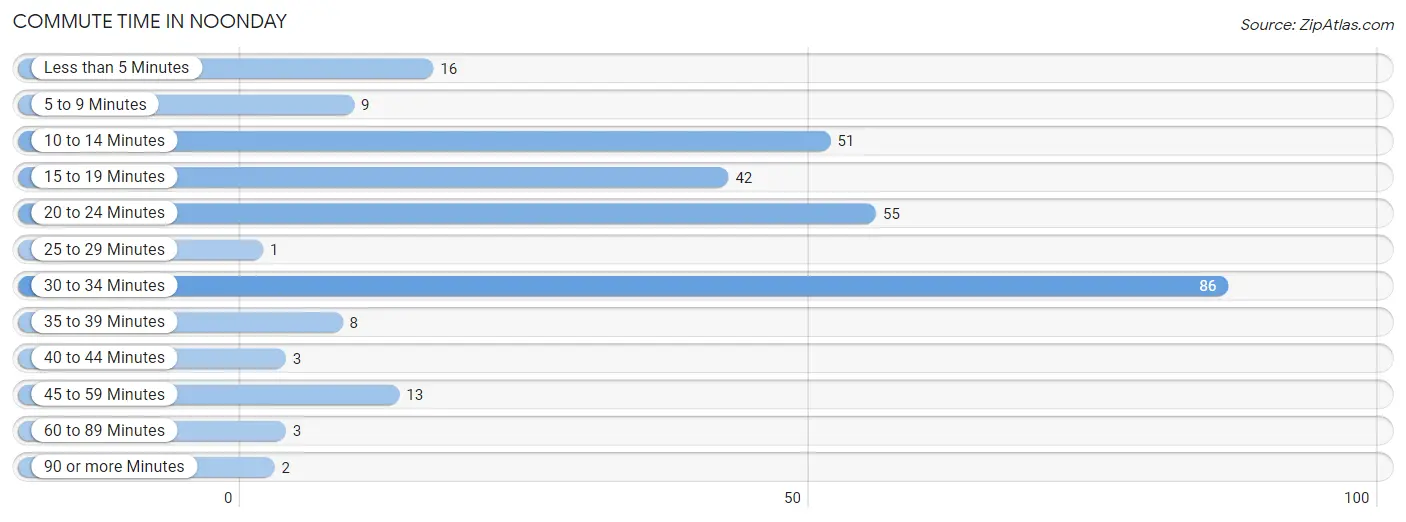
| Commute Time | # Commuters | % Commuters |
| Less than 5 Minutes | 16 | 5.5% |
| 5 to 9 Minutes | 9 | 3.1% |
| 10 to 14 Minutes | 51 | 17.6% |
| 15 to 19 Minutes | 42 | 14.5% |
| 20 to 24 Minutes | 55 | 19.0% |
| 25 to 29 Minutes | 1 | 0.4% |
| 30 to 34 Minutes | 86 | 29.8% |
| 35 to 39 Minutes | 8 | 2.8% |
| 40 to 44 Minutes | 3 | 1.0% |
| 45 to 59 Minutes | 13 | 4.5% |
| 60 to 89 Minutes | 3 | 1.0% |
| 90 or more Minutes | 2 | 0.7% |
Commute Time by Sex in Noonday
The most common commute times in Noonday are 10 to 14 minutes (42 commuters, 29.6%) for males and 30 to 34 minutes (66 commuters, 44.9%) for females.
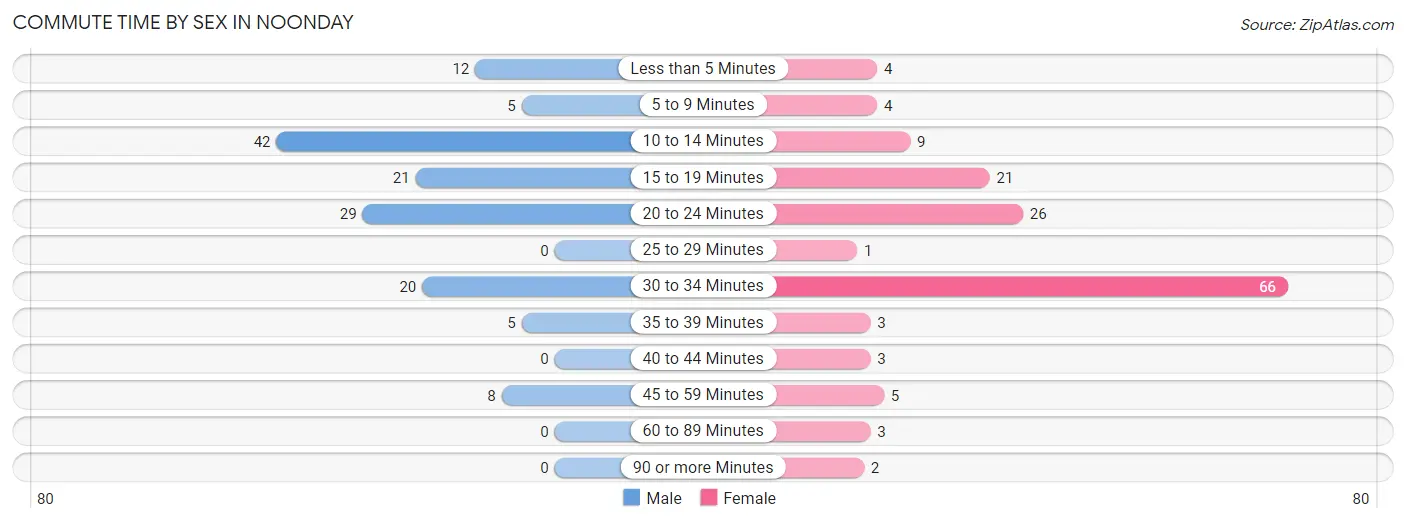
| Commute Time | Male | Female |
| Less than 5 Minutes | 12 (8.5%) | 4 (2.7%) |
| 5 to 9 Minutes | 5 (3.5%) | 4 (2.7%) |
| 10 to 14 Minutes | 42 (29.6%) | 9 (6.1%) |
| 15 to 19 Minutes | 21 (14.8%) | 21 (14.3%) |
| 20 to 24 Minutes | 29 (20.4%) | 26 (17.7%) |
| 25 to 29 Minutes | 0 (0.0%) | 1 (0.7%) |
| 30 to 34 Minutes | 20 (14.1%) | 66 (44.9%) |
| 35 to 39 Minutes | 5 (3.5%) | 3 (2.0%) |
| 40 to 44 Minutes | 0 (0.0%) | 3 (2.0%) |
| 45 to 59 Minutes | 8 (5.6%) | 5 (3.4%) |
| 60 to 89 Minutes | 0 (0.0%) | 3 (2.0%) |
| 90 or more Minutes | 0 (0.0%) | 2 (1.4%) |
Time of Departure to Work by Sex in Noonday
The most frequent times of departure to work in Noonday are 6:30 AM to 6:59 AM (30, 21.1%) for males and 7:30 AM to 7:59 AM (51, 34.7%) for females.
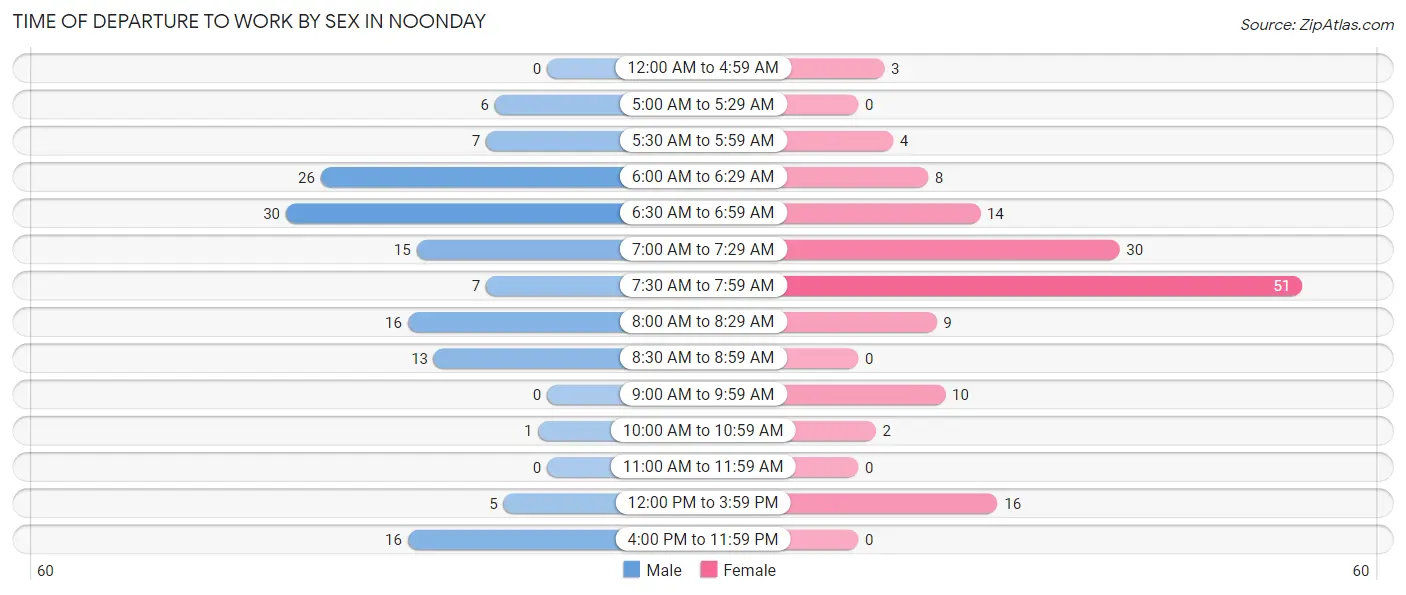
| Time of Departure | Male | Female |
| 12:00 AM to 4:59 AM | 0 (0.0%) | 3 (2.0%) |
| 5:00 AM to 5:29 AM | 6 (4.2%) | 0 (0.0%) |
| 5:30 AM to 5:59 AM | 7 (4.9%) | 4 (2.7%) |
| 6:00 AM to 6:29 AM | 26 (18.3%) | 8 (5.4%) |
| 6:30 AM to 6:59 AM | 30 (21.1%) | 14 (9.5%) |
| 7:00 AM to 7:29 AM | 15 (10.6%) | 30 (20.4%) |
| 7:30 AM to 7:59 AM | 7 (4.9%) | 51 (34.7%) |
| 8:00 AM to 8:29 AM | 16 (11.3%) | 9 (6.1%) |
| 8:30 AM to 8:59 AM | 13 (9.1%) | 0 (0.0%) |
| 9:00 AM to 9:59 AM | 0 (0.0%) | 10 (6.8%) |
| 10:00 AM to 10:59 AM | 1 (0.7%) | 2 (1.4%) |
| 11:00 AM to 11:59 AM | 0 (0.0%) | 0 (0.0%) |
| 12:00 PM to 3:59 PM | 5 (3.5%) | 16 (10.9%) |
| 4:00 PM to 11:59 PM | 16 (11.3%) | 0 (0.0%) |
| Total | 142 (100.0%) | 147 (100.0%) |
Housing Occupancy in Noonday
Occupancy by Ownership in Noonday
Of the total 272 dwellings in Noonday, owner-occupied units account for 186 (68.4%), while renter-occupied units make up 86 (31.6%).
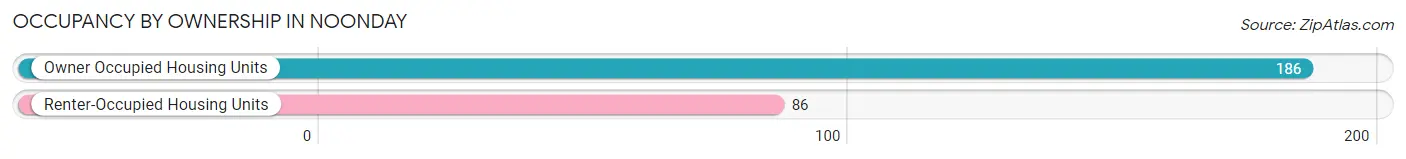
| Occupancy | # Housing Units | % Housing Units |
| Owner Occupied Housing Units | 186 | 68.4% |
| Renter-Occupied Housing Units | 86 | 31.6% |
| Total Occupied Housing Units | 272 | 100.0% |
Occupancy by Household Size in Noonday
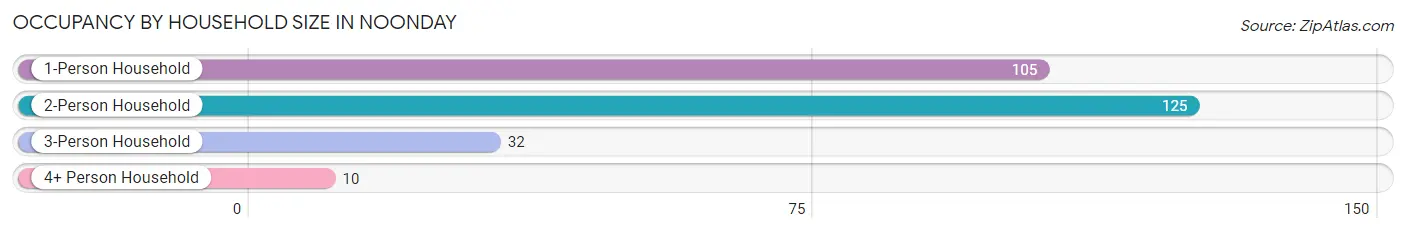
| Household Size | # Housing Units | % Housing Units |
| 1-Person Household | 105 | 38.6% |
| 2-Person Household | 125 | 46.0% |
| 3-Person Household | 32 | 11.8% |
| 4+ Person Household | 10 | 3.7% |
| Total Housing Units | 272 | 100.0% |
Occupancy by Ownership by Household Size in Noonday
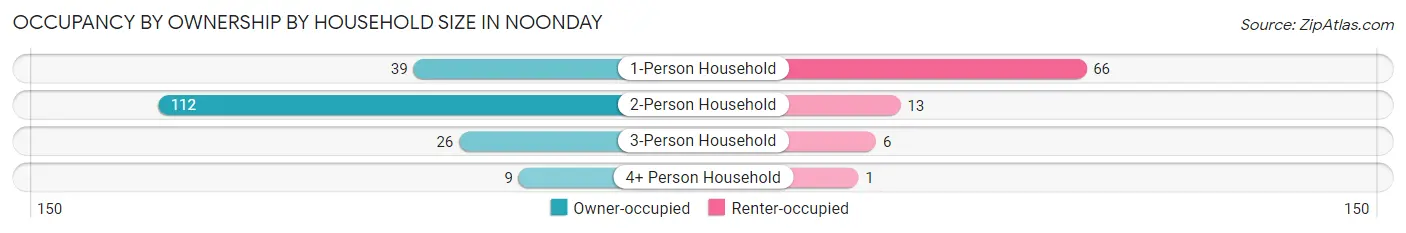
| Household Size | Owner-occupied | Renter-occupied |
| 1-Person Household | 39 (37.1%) | 66 (62.9%) |
| 2-Person Household | 112 (89.6%) | 13 (10.4%) |
| 3-Person Household | 26 (81.2%) | 6 (18.8%) |
| 4+ Person Household | 9 (90.0%) | 1 (10.0%) |
| Total Housing Units | 186 (68.4%) | 86 (31.6%) |
Occupancy by Educational Attainment in Noonday
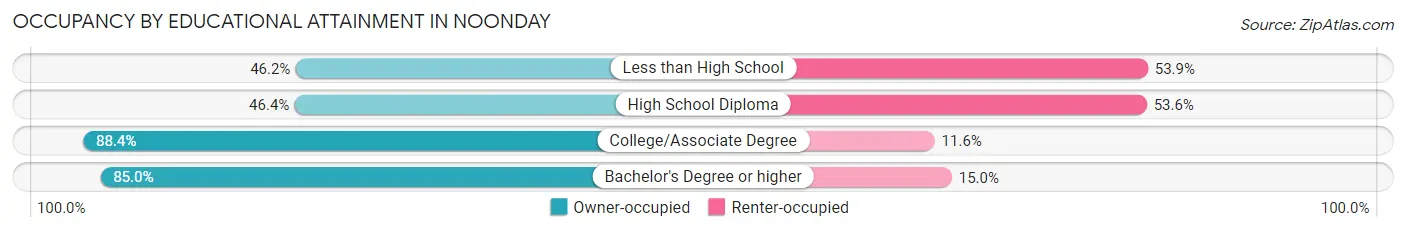
| Household Size | Owner-occupied | Renter-occupied |
| Less than High School | 6 (46.2%) | 7 (53.8%) |
| High School Diploma | 51 (46.4%) | 59 (53.6%) |
| College/Associate Degree | 61 (88.4%) | 8 (11.6%) |
| Bachelor's Degree or higher | 68 (85.0%) | 12 (15.0%) |
Occupancy by Age of Householder in Noonday
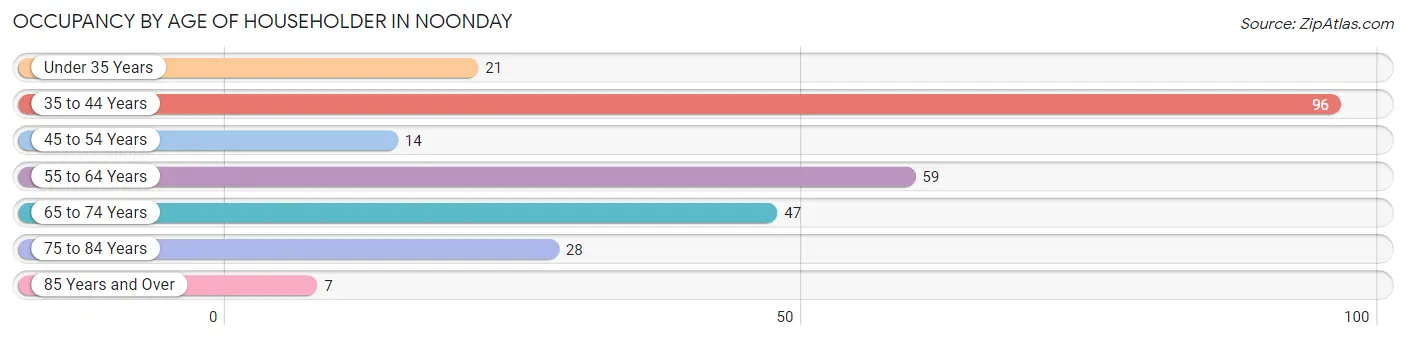
| Age Bracket | # Households | % Households |
| Under 35 Years | 21 | 7.7% |
| 35 to 44 Years | 96 | 35.3% |
| 45 to 54 Years | 14 | 5.1% |
| 55 to 64 Years | 59 | 21.7% |
| 65 to 74 Years | 47 | 17.3% |
| 75 to 84 Years | 28 | 10.3% |
| 85 Years and Over | 7 | 2.6% |
| Total | 272 | 100.0% |
Housing Finances in Noonday
Median Income by Occupancy in Noonday
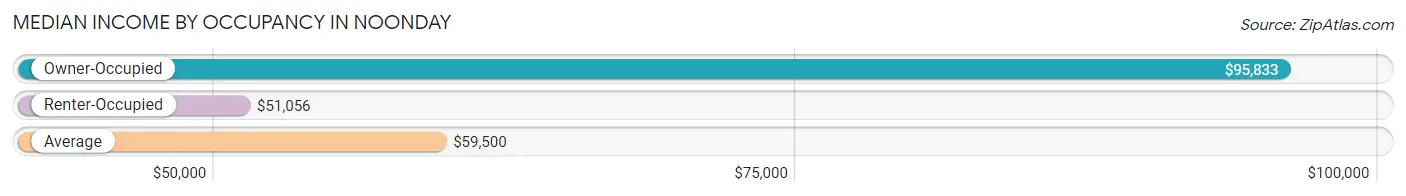
| Occupancy Type | # Households | Median Income |
| Owner-Occupied | 186 (68.4%) | $95,833 |
| Renter-Occupied | 86 (31.6%) | $51,056 |
| Average | 272 (100.0%) | $59,500 |
Occupancy by Householder Income Bracket in Noonday
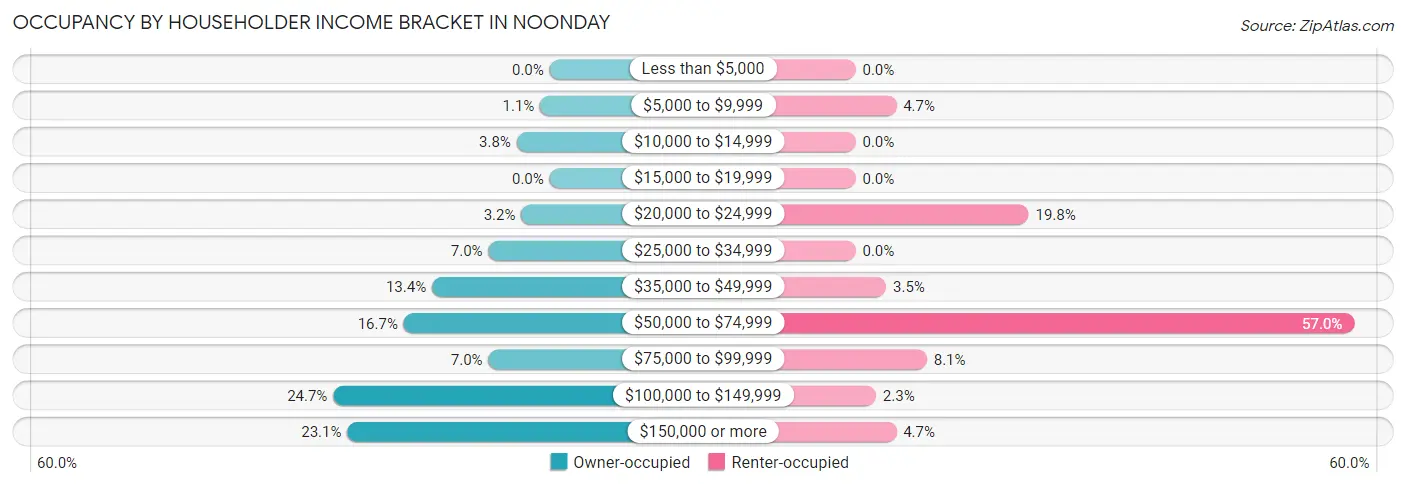
| Income Bracket | Owner-occupied | Renter-occupied |
| Less than $5,000 | 0 (0.0%) | 0 (0.0%) |
| $5,000 to $9,999 | 2 (1.1%) | 4 (4.6%) |
| $10,000 to $14,999 | 7 (3.8%) | 0 (0.0%) |
| $15,000 to $19,999 | 0 (0.0%) | 0 (0.0%) |
| $20,000 to $24,999 | 6 (3.2%) | 17 (19.8%) |
| $25,000 to $34,999 | 13 (7.0%) | 0 (0.0%) |
| $35,000 to $49,999 | 25 (13.4%) | 3 (3.5%) |
| $50,000 to $74,999 | 31 (16.7%) | 49 (57.0%) |
| $75,000 to $99,999 | 13 (7.0%) | 7 (8.1%) |
| $100,000 to $149,999 | 46 (24.7%) | 2 (2.3%) |
| $150,000 or more | 43 (23.1%) | 4 (4.6%) |
| Total | 186 (100.0%) | 86 (100.0%) |
Monthly Housing Cost Tiers in Noonday
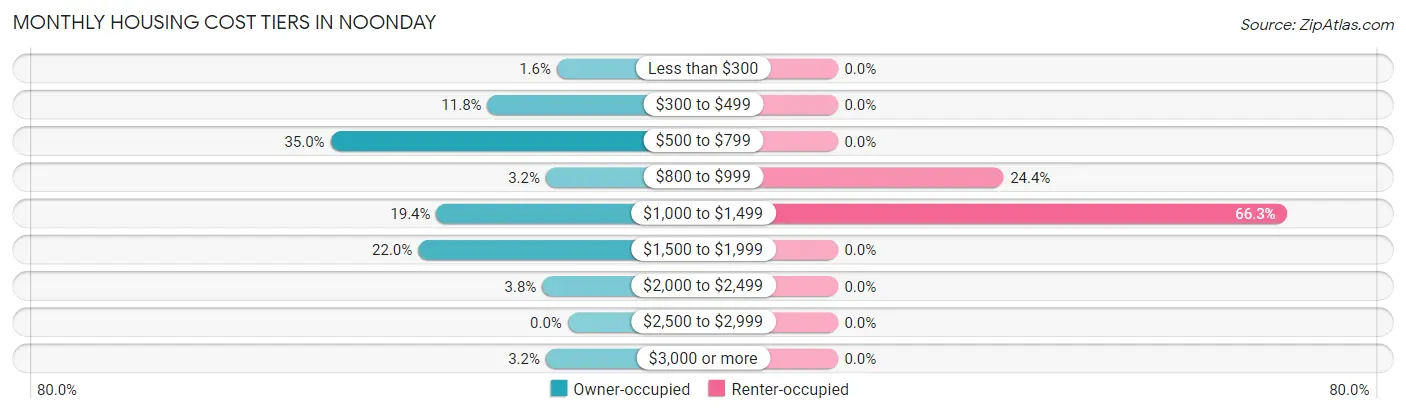
| Monthly Cost | Owner-occupied | Renter-occupied |
| Less than $300 | 3 (1.6%) | 0 (0.0%) |
| $300 to $499 | 22 (11.8%) | 0 (0.0%) |
| $500 to $799 | 65 (34.9%) | 0 (0.0%) |
| $800 to $999 | 6 (3.2%) | 21 (24.4%) |
| $1,000 to $1,499 | 36 (19.4%) | 57 (66.3%) |
| $1,500 to $1,999 | 41 (22.0%) | 0 (0.0%) |
| $2,000 to $2,499 | 7 (3.8%) | 0 (0.0%) |
| $2,500 to $2,999 | 0 (0.0%) | 0 (0.0%) |
| $3,000 or more | 6 (3.2%) | 0 (0.0%) |
| Total | 186 (100.0%) | 86 (100.0%) |
Physical Housing Characteristics in Noonday
Housing Structures in Noonday
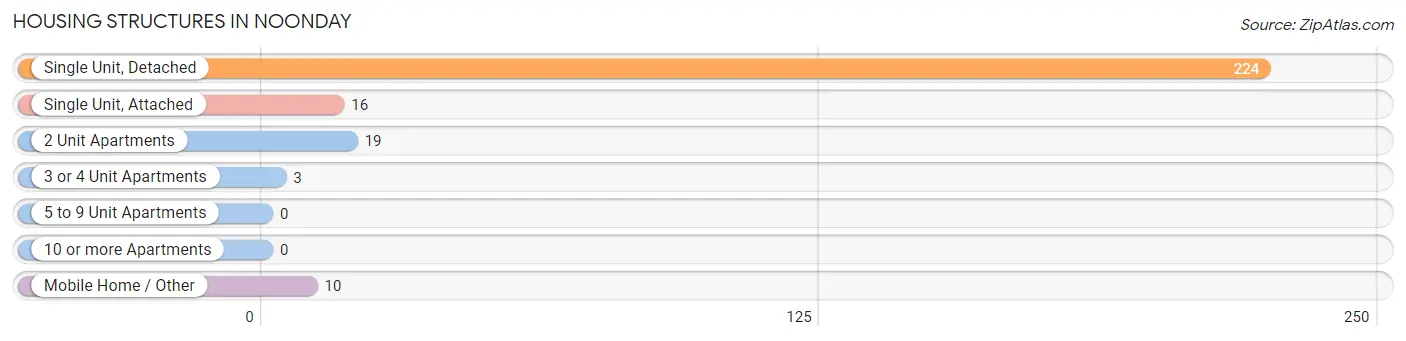
| Structure Type | # Housing Units | % Housing Units |
| Single Unit, Detached | 224 | 82.4% |
| Single Unit, Attached | 16 | 5.9% |
| 2 Unit Apartments | 19 | 7.0% |
| 3 or 4 Unit Apartments | 3 | 1.1% |
| 5 to 9 Unit Apartments | 0 | 0.0% |
| 10 or more Apartments | 0 | 0.0% |
| Mobile Home / Other | 10 | 3.7% |
| Total | 272 | 100.0% |
Housing Structures by Occupancy in Noonday
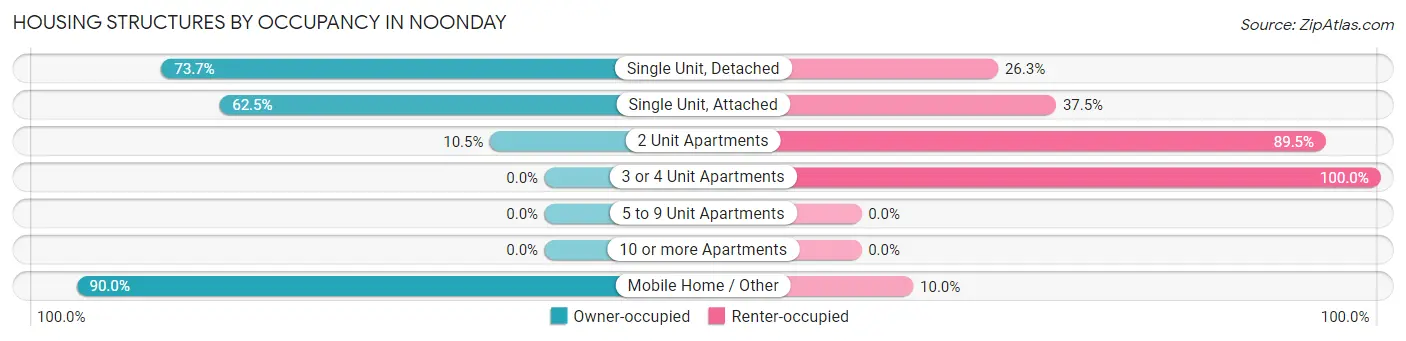
| Structure Type | Owner-occupied | Renter-occupied |
| Single Unit, Detached | 165 (73.7%) | 59 (26.3%) |
| Single Unit, Attached | 10 (62.5%) | 6 (37.5%) |
| 2 Unit Apartments | 2 (10.5%) | 17 (89.5%) |
| 3 or 4 Unit Apartments | 0 (0.0%) | 3 (100.0%) |
| 5 to 9 Unit Apartments | 0 (0.0%) | 0 (0.0%) |
| 10 or more Apartments | 0 (0.0%) | 0 (0.0%) |
| Mobile Home / Other | 9 (90.0%) | 1 (10.0%) |
| Total | 186 (68.4%) | 86 (31.6%) |
Housing Structures by Number of Rooms in Noonday
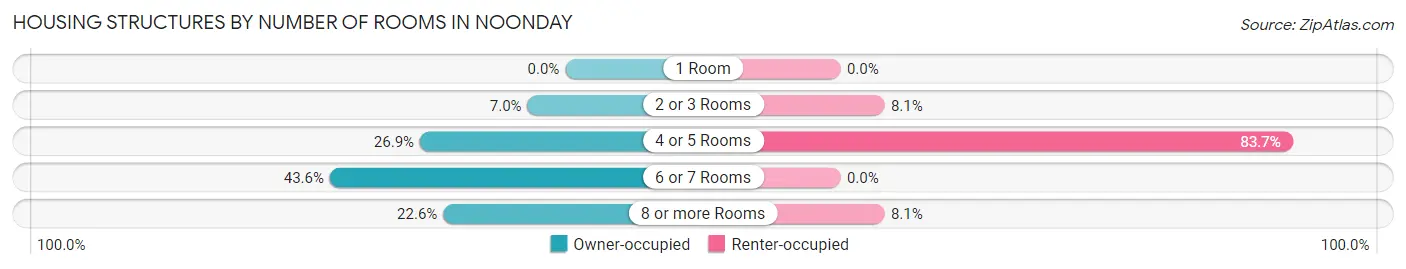
| Number of Rooms | Owner-occupied | Renter-occupied |
| 1 Room | 0 (0.0%) | 0 (0.0%) |
| 2 or 3 Rooms | 13 (7.0%) | 7 (8.1%) |
| 4 or 5 Rooms | 50 (26.9%) | 72 (83.7%) |
| 6 or 7 Rooms | 81 (43.5%) | 0 (0.0%) |
| 8 or more Rooms | 42 (22.6%) | 7 (8.1%) |
| Total | 186 (100.0%) | 86 (100.0%) |
Housing Structure by Heating Type in Noonday
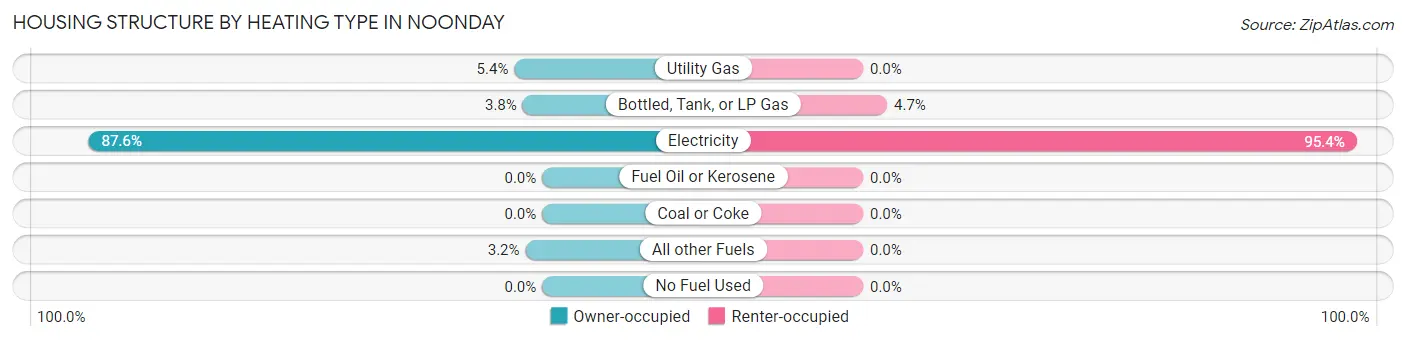
| Heating Type | Owner-occupied | Renter-occupied |
| Utility Gas | 10 (5.4%) | 0 (0.0%) |
| Bottled, Tank, or LP Gas | 7 (3.8%) | 4 (4.6%) |
| Electricity | 163 (87.6%) | 82 (95.4%) |
| Fuel Oil or Kerosene | 0 (0.0%) | 0 (0.0%) |
| Coal or Coke | 0 (0.0%) | 0 (0.0%) |
| All other Fuels | 6 (3.2%) | 0 (0.0%) |
| No Fuel Used | 0 (0.0%) | 0 (0.0%) |
| Total | 186 (100.0%) | 86 (100.0%) |
Household Vehicle Usage in Noonday
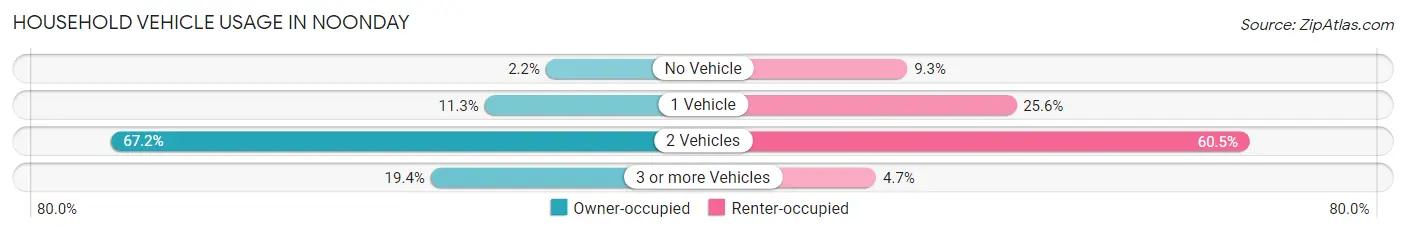
| Vehicles per Household | Owner-occupied | Renter-occupied |
| No Vehicle | 4 (2.1%) | 8 (9.3%) |
| 1 Vehicle | 21 (11.3%) | 22 (25.6%) |
| 2 Vehicles | 125 (67.2%) | 52 (60.5%) |
| 3 or more Vehicles | 36 (19.4%) | 4 (4.6%) |
| Total | 186 (100.0%) | 86 (100.0%) |
Real Estate & Mortgages in Noonday
Real Estate and Mortgage Overview in Noonday
| Characteristic | Without Mortgage | With Mortgage |
| Housing Units | 103 | 83 |
| Median Property Value | $226,300 | $224,000 |
| Median Household Income | $70,417 | $27 |
| Monthly Housing Costs | $629 | $6 |
| Real Estate Taxes | $2,577 | $9 |
Property Value by Mortgage Status in Noonday
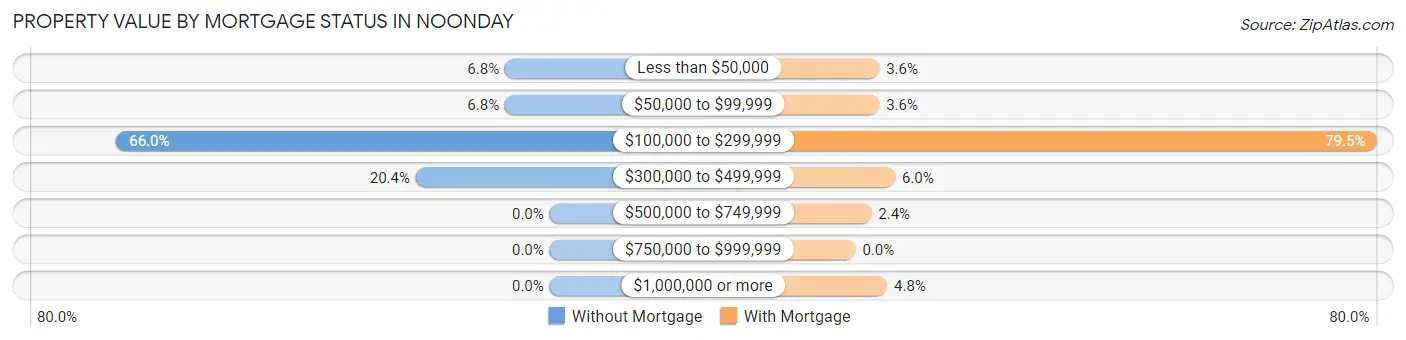
| Property Value | Without Mortgage | With Mortgage |
| Less than $50,000 | 7 (6.8%) | 3 (3.6%) |
| $50,000 to $99,999 | 7 (6.8%) | 3 (3.6%) |
| $100,000 to $299,999 | 68 (66.0%) | 66 (79.5%) |
| $300,000 to $499,999 | 21 (20.4%) | 5 (6.0%) |
| $500,000 to $749,999 | 0 (0.0%) | 2 (2.4%) |
| $750,000 to $999,999 | 0 (0.0%) | 0 (0.0%) |
| $1,000,000 or more | 0 (0.0%) | 4 (4.8%) |
| Total | 103 (100.0%) | 83 (100.0%) |
Household Income by Mortgage Status in Noonday
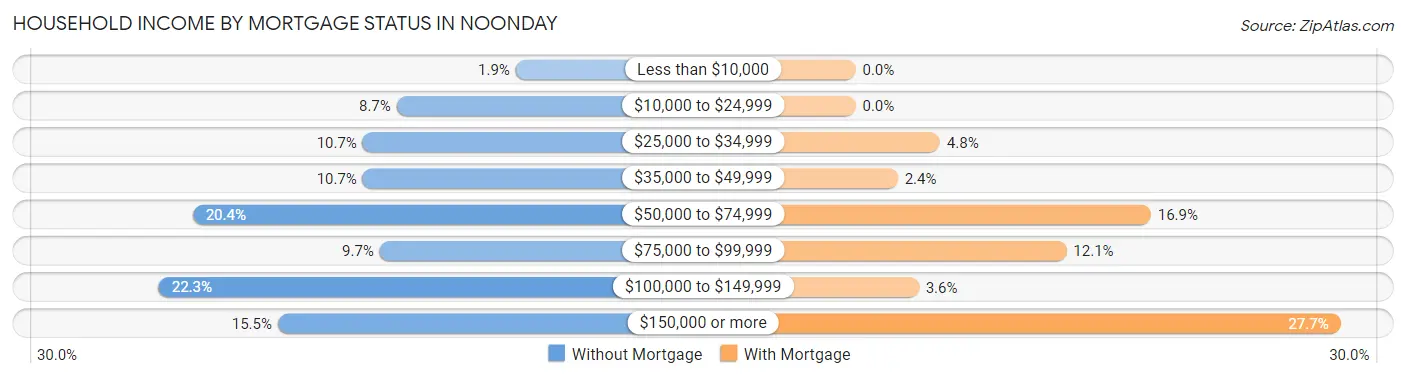
| Household Income | Without Mortgage | With Mortgage |
| Less than $10,000 | 2 (1.9%) | 0 (0.0%) |
| $10,000 to $24,999 | 9 (8.7%) | 0 (0.0%) |
| $25,000 to $34,999 | 11 (10.7%) | 4 (4.8%) |
| $35,000 to $49,999 | 11 (10.7%) | 2 (2.4%) |
| $50,000 to $74,999 | 21 (20.4%) | 14 (16.9%) |
| $75,000 to $99,999 | 10 (9.7%) | 10 (12.0%) |
| $100,000 to $149,999 | 23 (22.3%) | 3 (3.6%) |
| $150,000 or more | 16 (15.5%) | 23 (27.7%) |
| Total | 103 (100.0%) | 83 (100.0%) |
Property Value to Household Income Ratio in Noonday
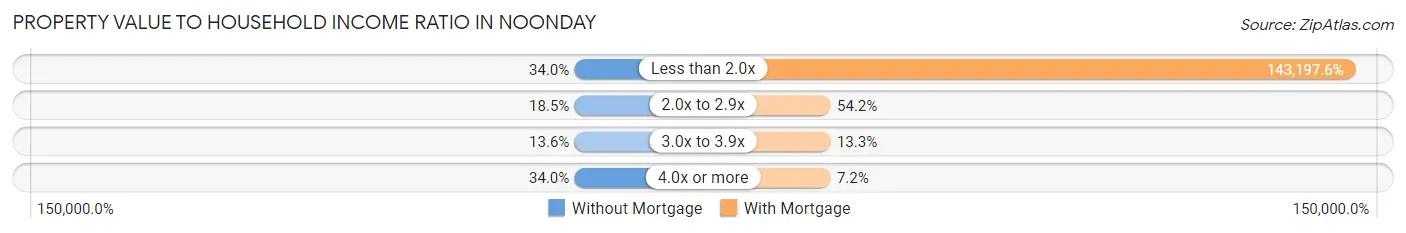
| Value-to-Income Ratio | Without Mortgage | With Mortgage |
| Less than 2.0x | 35 (34.0%) | 118,854 (143,197.6%) |
| 2.0x to 2.9x | 19 (18.4%) | 45 (54.2%) |
| 3.0x to 3.9x | 14 (13.6%) | 11 (13.3%) |
| 4.0x or more | 35 (34.0%) | 6 (7.2%) |
| Total | 103 (100.0%) | 83 (100.0%) |
Real Estate Taxes by Mortgage Status in Noonday
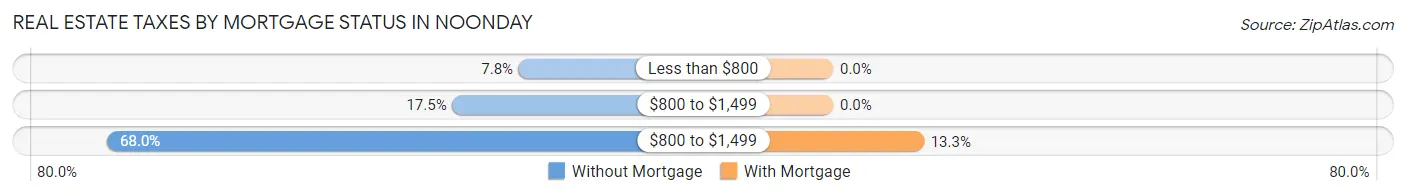
| Property Taxes | Without Mortgage | With Mortgage |
| Less than $800 | 8 (7.8%) | 0 (0.0%) |
| $800 to $1,499 | 18 (17.5%) | 0 (0.0%) |
| $800 to $1,499 | 70 (68.0%) | 11 (13.3%) |
| Total | 103 (100.0%) | 83 (100.0%) |
Health & Disability in Noonday
Health Insurance Coverage by Age in Noonday
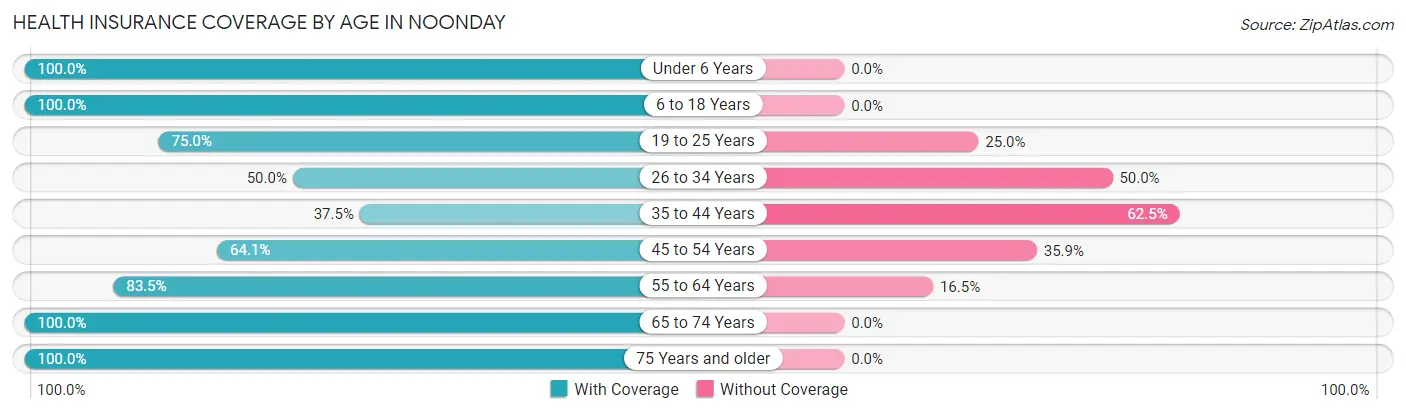
| Age Bracket | With Coverage | Without Coverage |
| Under 6 Years | 9 (100.0%) | 0 (0.0%) |
| 6 to 18 Years | 21 (100.0%) | 0 (0.0%) |
| 19 to 25 Years | 15 (75.0%) | 5 (25.0%) |
| 26 to 34 Years | 21 (50.0%) | 21 (50.0%) |
| 35 to 44 Years | 48 (37.5%) | 80 (62.5%) |
| 45 to 54 Years | 25 (64.1%) | 14 (35.9%) |
| 55 to 64 Years | 111 (83.5%) | 22 (16.5%) |
| 65 to 74 Years | 70 (100.0%) | 0 (0.0%) |
| 75 Years and older | 48 (100.0%) | 0 (0.0%) |
| Total | 368 (72.2%) | 142 (27.8%) |
Health Insurance Coverage by Citizenship Status in Noonday
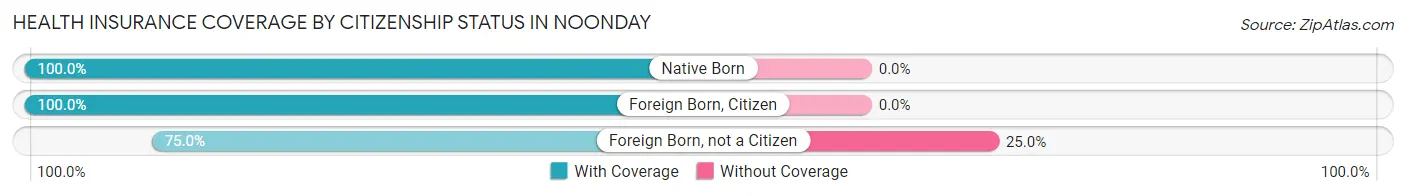
| Citizenship Status | With Coverage | Without Coverage |
| Native Born | 9 (100.0%) | 0 (0.0%) |
| Foreign Born, Citizen | 21 (100.0%) | 0 (0.0%) |
| Foreign Born, not a Citizen | 15 (75.0%) | 5 (25.0%) |
Health Insurance Coverage by Household Income in Noonday
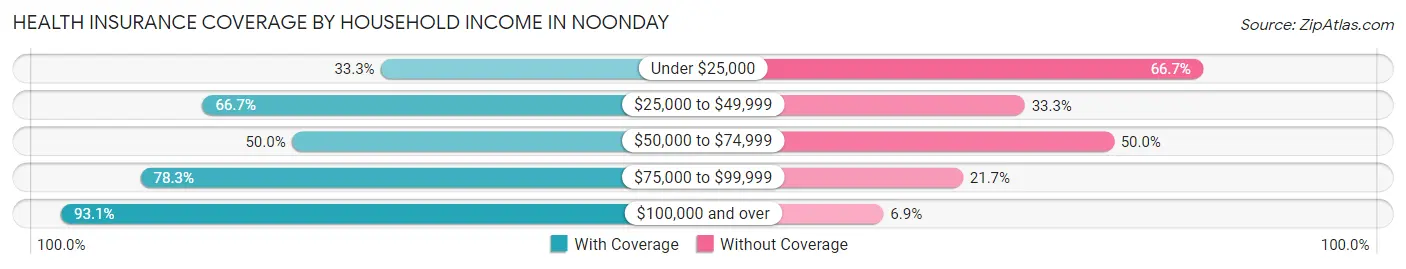
| Household Income | With Coverage | Without Coverage |
| Under $25,000 | 12 (33.3%) | 24 (66.7%) |
| $25,000 to $49,999 | 72 (66.7%) | 36 (33.3%) |
| $50,000 to $74,999 | 58 (50.0%) | 58 (50.0%) |
| $75,000 to $99,999 | 36 (78.3%) | 10 (21.7%) |
| $100,000 and over | 190 (93.1%) | 14 (6.9%) |
Public vs Private Health Insurance Coverage by Age in Noonday
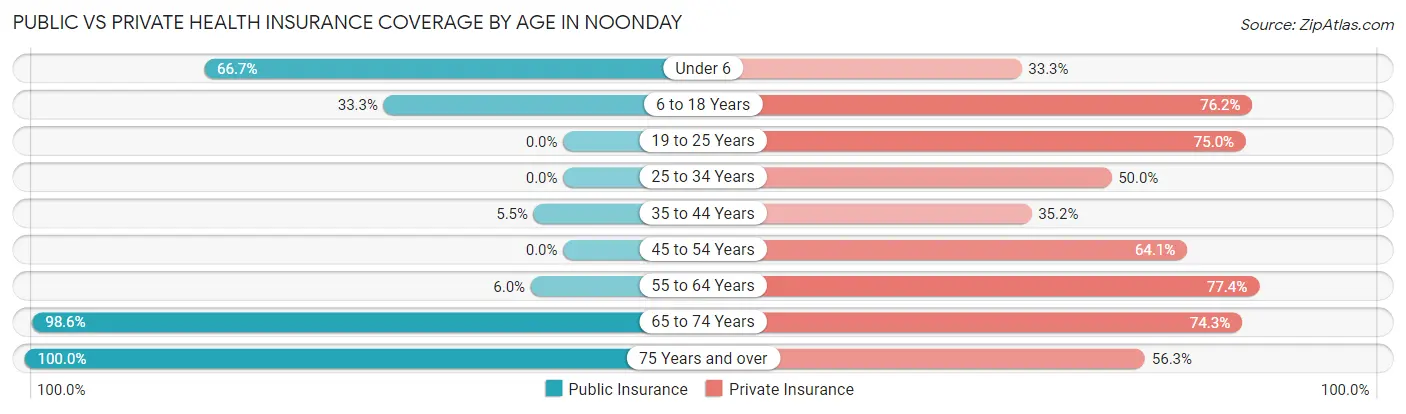
| Age Bracket | Public Insurance | Private Insurance |
| Under 6 | 6 (66.7%) | 3 (33.3%) |
| 6 to 18 Years | 7 (33.3%) | 16 (76.2%) |
| 19 to 25 Years | 0 (0.0%) | 15 (75.0%) |
| 25 to 34 Years | 0 (0.0%) | 21 (50.0%) |
| 35 to 44 Years | 7 (5.5%) | 45 (35.2%) |
| 45 to 54 Years | 0 (0.0%) | 25 (64.1%) |
| 55 to 64 Years | 8 (6.0%) | 103 (77.4%) |
| 65 to 74 Years | 69 (98.6%) | 52 (74.3%) |
| 75 Years and over | 48 (100.0%) | 27 (56.2%) |
| Total | 145 (28.4%) | 307 (60.2%) |
Disability Status by Sex by Age in Noonday
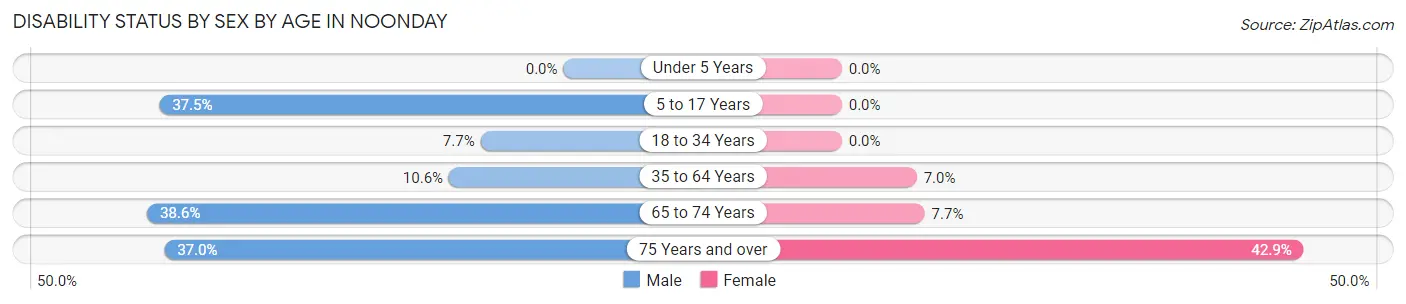
| Age Bracket | Male | Female |
| Under 5 Years | 0 (0.0%) | 0 (0.0%) |
| 5 to 17 Years | 3 (37.5%) | 0 (0.0%) |
| 18 to 34 Years | 2 (7.7%) | 0 (0.0%) |
| 35 to 64 Years | 12 (10.6%) | 13 (7.0%) |
| 65 to 74 Years | 17 (38.6%) | 2 (7.7%) |
| 75 Years and over | 10 (37.0%) | 9 (42.9%) |
Disability Class by Sex by Age in Noonday
Disability Class: Hearing Difficulty
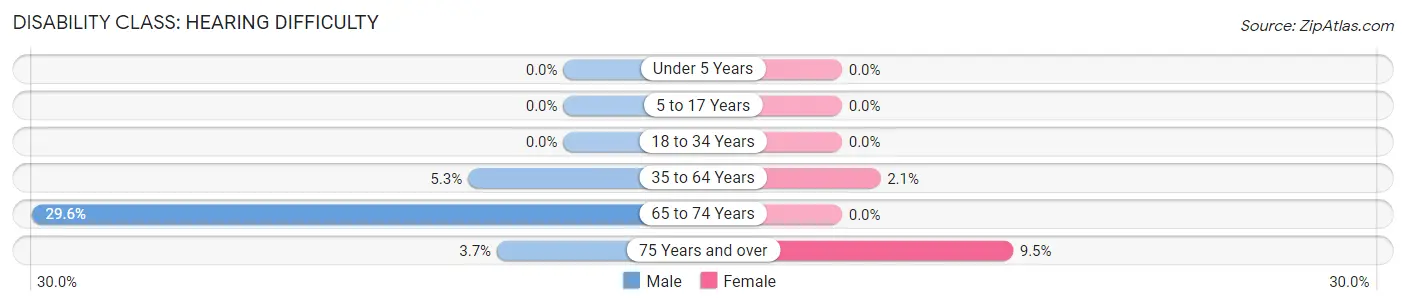
| Age Bracket | Male | Female |
| Under 5 Years | 0 (0.0%) | 0 (0.0%) |
| 5 to 17 Years | 0 (0.0%) | 0 (0.0%) |
| 18 to 34 Years | 0 (0.0%) | 0 (0.0%) |
| 35 to 64 Years | 6 (5.3%) | 4 (2.1%) |
| 65 to 74 Years | 13 (29.5%) | 0 (0.0%) |
| 75 Years and over | 1 (3.7%) | 2 (9.5%) |
Disability Class: Vision Difficulty
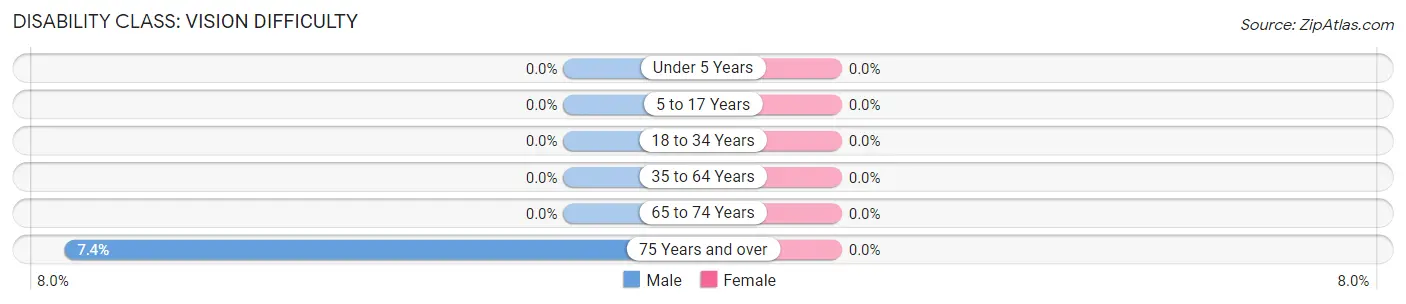
| Age Bracket | Male | Female |
| Under 5 Years | 0 (0.0%) | 0 (0.0%) |
| 5 to 17 Years | 0 (0.0%) | 0 (0.0%) |
| 18 to 34 Years | 0 (0.0%) | 0 (0.0%) |
| 35 to 64 Years | 0 (0.0%) | 0 (0.0%) |
| 65 to 74 Years | 0 (0.0%) | 0 (0.0%) |
| 75 Years and over | 2 (7.4%) | 0 (0.0%) |
Disability Class: Cognitive Difficulty
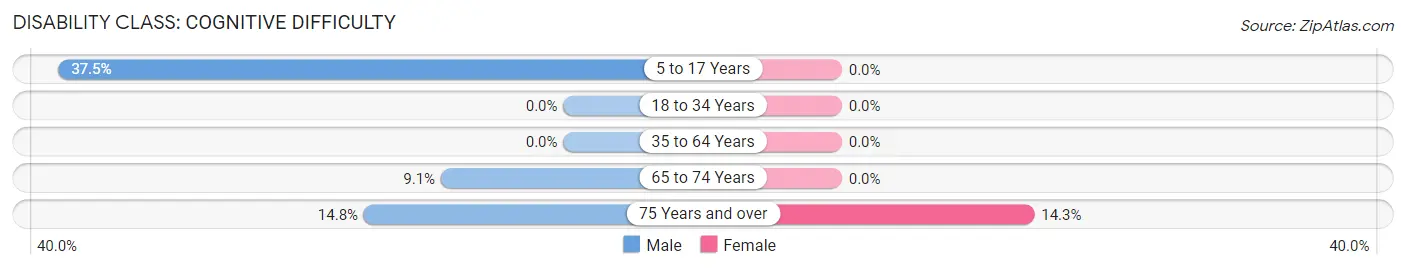
| Age Bracket | Male | Female |
| 5 to 17 Years | 3 (37.5%) | 0 (0.0%) |
| 18 to 34 Years | 0 (0.0%) | 0 (0.0%) |
| 35 to 64 Years | 0 (0.0%) | 0 (0.0%) |
| 65 to 74 Years | 4 (9.1%) | 0 (0.0%) |
| 75 Years and over | 4 (14.8%) | 3 (14.3%) |
Disability Class: Ambulatory Difficulty
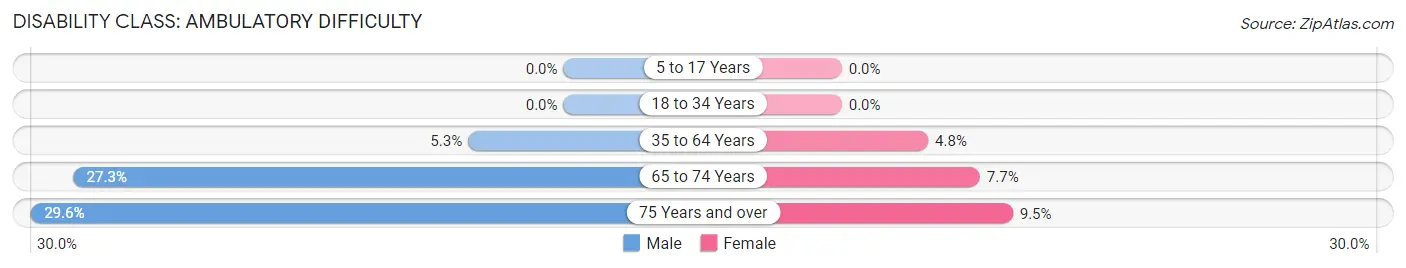
| Age Bracket | Male | Female |
| 5 to 17 Years | 0 (0.0%) | 0 (0.0%) |
| 18 to 34 Years | 0 (0.0%) | 0 (0.0%) |
| 35 to 64 Years | 6 (5.3%) | 9 (4.8%) |
| 65 to 74 Years | 12 (27.3%) | 2 (7.7%) |
| 75 Years and over | 8 (29.6%) | 2 (9.5%) |
Disability Class: Self-Care Difficulty
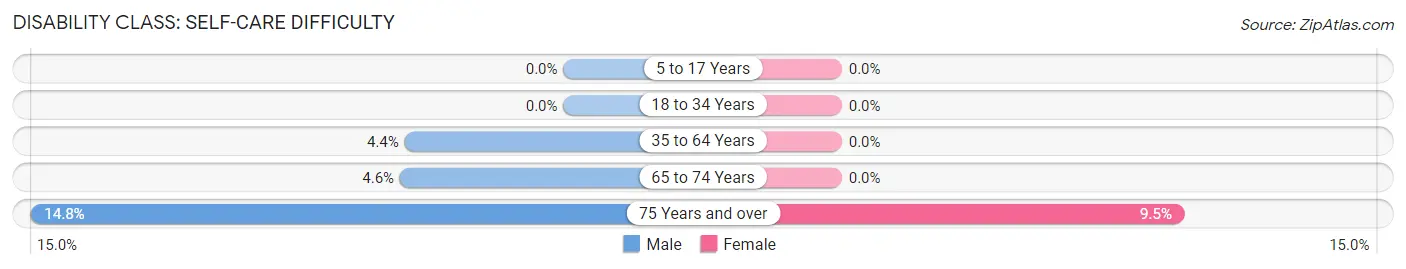
| Age Bracket | Male | Female |
| 5 to 17 Years | 0 (0.0%) | 0 (0.0%) |
| 18 to 34 Years | 0 (0.0%) | 0 (0.0%) |
| 35 to 64 Years | 5 (4.4%) | 0 (0.0%) |
| 65 to 74 Years | 2 (4.5%) | 0 (0.0%) |
| 75 Years and over | 4 (14.8%) | 2 (9.5%) |
Technology Access in Noonday
Computing Device Access in Noonday
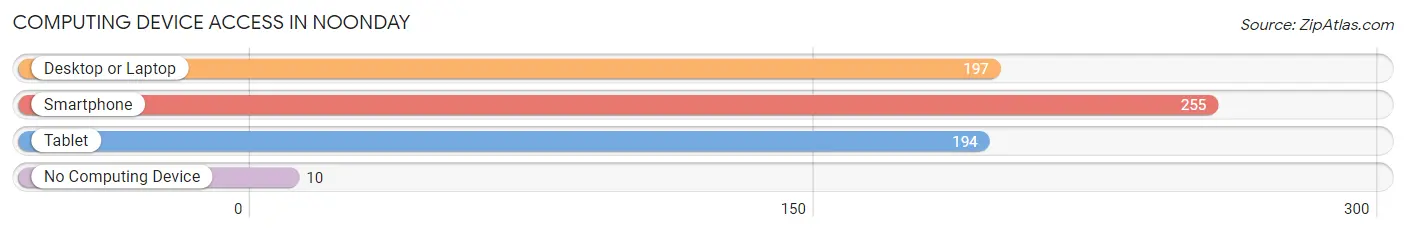
| Device Type | # Households | % Households |
| Desktop or Laptop | 197 | 72.4% |
| Smartphone | 255 | 93.8% |
| Tablet | 194 | 71.3% |
| No Computing Device | 10 | 3.7% |
| Total | 272 | 100.0% |
Internet Access in Noonday
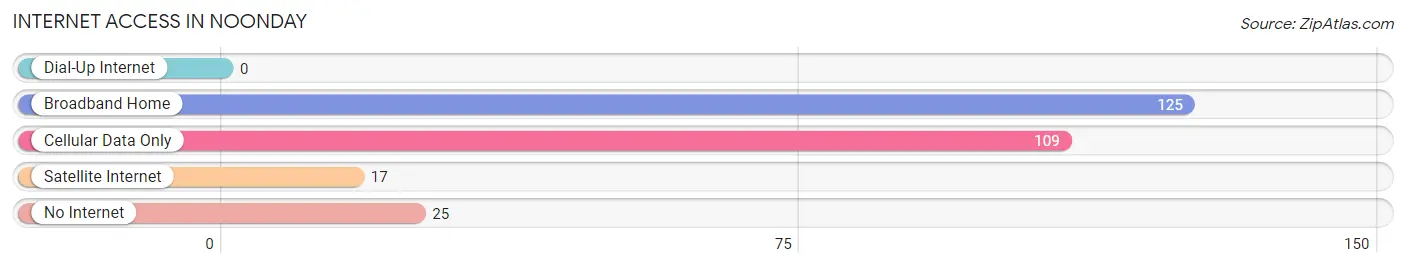
| Internet Type | # Households | % Households |
| Dial-Up Internet | 0 | 0.0% |
| Broadband Home | 125 | 46.0% |
| Cellular Data Only | 109 | 40.1% |
| Satellite Internet | 17 | 6.2% |
| No Internet | 25 | 9.2% |
| Total | 272 | 100.0% |
Noonday Summary
Noonday is a small unincorporated community located in Smith County, Texas. It is situated about 10 miles south of Tyler, the county seat. The population of Noonday was estimated to be 1,845 in 2019.
History
Noonday was first settled in the late 1800s by a group of settlers from the nearby town of Tyler. The town was named after the nearby Noonday Creek, which was named by early settlers who noticed that the sun was directly overhead at noon. The first post office in Noonday was established in 1891.
In the early 1900s, Noonday was a thriving agricultural community. Cotton was the main crop grown in the area, and the town had several cotton gins and a cottonseed oil mill. The town also had a general store, a blacksmith shop, and a school.
In the 1950s, Noonday began to experience a decline in population as many of the town’s residents moved away to larger cities. The town’s population continued to decline until the late 1990s, when it began to experience a resurgence.
Geography
Noonday is located in Smith County, Texas, about 10 miles south of Tyler. The town is situated on the western edge of the East Texas Piney Woods, an area of dense pine forests. The town is located on the banks of Noonday Creek, which flows into the nearby Neches River.
The climate in Noonday is humid subtropical, with hot summers and mild winters. The average annual temperature is around 70 degrees Fahrenheit. The average annual precipitation is around 40 inches.
Economy
Noonday’s economy is largely based on agriculture. Cotton is still the main crop grown in the area, and there are several cotton gins and a cottonseed oil mill in the town. The town also has several small businesses, including a general store, a hardware store, and a restaurant.
The town is also home to several manufacturing companies, including a furniture factory and a plastics factory. The town is also home to a number of small businesses, including a gas station, a grocery store, and a barber shop.
Demographics
Noonday’s population was estimated to be 1,845 in 2019. The town is predominantly white, with around 85% of the population identifying as white. The remaining 15% of the population is made up of African Americans, Hispanics, and other ethnicities.
The median household income in Noonday is around $45,000, and the median home value is around $150,000. The town has a low unemployment rate, and the majority of the population is employed in the agricultural and manufacturing industries.
Noonday is a small, rural town with a rich history and a vibrant economy. The town is home to a diverse population and offers a variety of amenities and services. The town is a great place to live and work, and it is a great place to raise a family.
Common Questions
What is Per Capita Income in Noonday?
Per Capita income in Noonday is $48,236.
What is the Median Family Income in Noonday?
Median Family Income in Noonday is $95,833.
What is the Median Household income in Noonday?
Median Household Income in Noonday is $59,500.
What is Income or Wage Gap in Noonday?
Income or Wage Gap in Noonday is 21.0%.
Women in Noonday earn 79.0 cents for every dollar earned by a man.
What is Inequality or Gini Index in Noonday?
Inequality or Gini Index in Noonday is 0.41.
What is the Total Population of Noonday?
Total Population of Noonday is 510.
What is the Total Male Population of Noonday?
Total Male Population of Noonday is 220.
What is the Total Female Population of Noonday?
Total Female Population of Noonday is 290.
What is the Ratio of Males per 100 Females in Noonday?
There are 75.86 Males per 100 Females in Noonday.
What is the Ratio of Females per 100 Males in Noonday?
There are 131.82 Females per 100 Males in Noonday.
What is the Median Population Age in Noonday?
Median Population Age in Noonday is 53.6 Years.
What is the Average Family Size in Noonday
Average Family Size in Noonday is 2.5 People.
What is the Average Household Size in Noonday
Average Household Size in Noonday is 1.9 People.
How Large is the Labor Force in Noonday?
There are 328 People in the Labor Forcein in Noonday.
What is the Percentage of People in the Labor Force in Noonday?
67.5% of People are in the Labor Force in Noonday.
What is the Unemployment Rate in Noonday?
Unemployment Rate in Noonday is 3.0%.