Zip Codes with the Highest Percentage of Population Employed in Health Diagnosing & Treating in Seneca, SC
RELATED REPORTS & OPTIONS
Health Diagnosing & Treating
Seneca
Compare Zip Codes
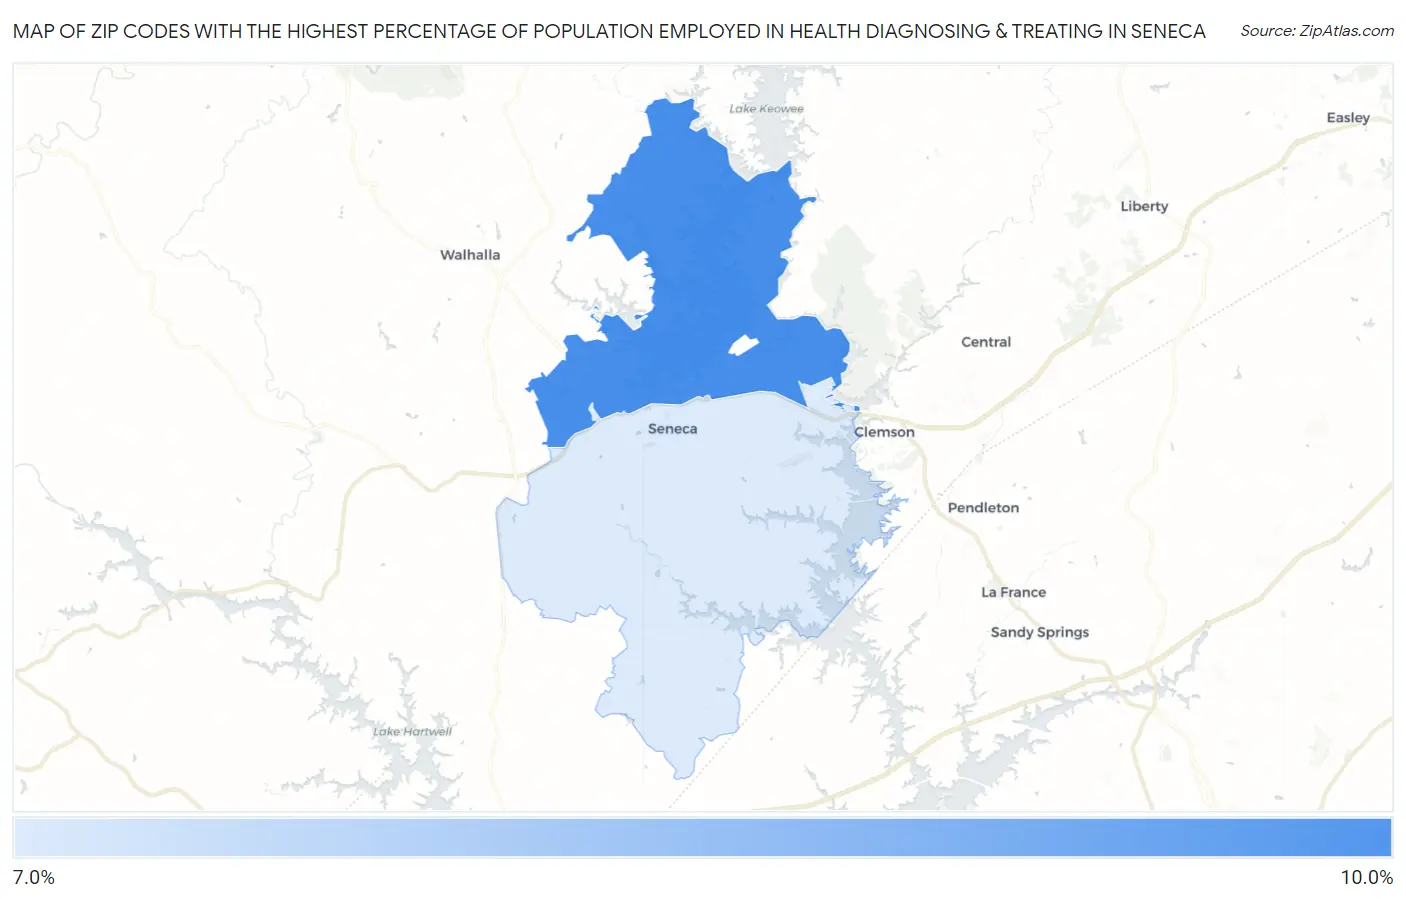
Map of Zip Codes with the Highest Percentage of Population Employed in Health Diagnosing & Treating in Seneca
7.2%
8.0%
Zip Codes with the Highest Percentage of Population Employed in Health Diagnosing & Treating in Seneca, SC
| Zip Code | % Employed | vs State | vs National | |
| 1. | 29672 | 8.0% | 6.7%(+1.31)#97 | 6.2%(+1.79)#7,410 |
| 2. | 29678 | 7.2% | 6.7%(+0.503)#134 | 6.2%(+0.981)#9,638 |
1
Common Questions
What are the Top Zip Codes with the Highest Percentage of Population Employed in Health Diagnosing & Treating in Seneca, SC?
Top Zip Codes with the Highest Percentage of Population Employed in Health Diagnosing & Treating in Seneca, SC are:
What zip code has the Highest Percentage of Population Employed in Health Diagnosing & Treating in Seneca, SC?
29672 has the Highest Percentage of Population Employed in Health Diagnosing & Treating in Seneca, SC with 8.0%.
What is the Percentage of Population Employed in Health Diagnosing & Treating in Seneca, SC?
Percentage of Population Employed in Health Diagnosing & Treating in Seneca is 8.2%.
What is the Percentage of Population Employed in Health Diagnosing & Treating in South Carolina?
Percentage of Population Employed in Health Diagnosing & Treating in South Carolina is 6.7%.
What is the Percentage of Population Employed in Health Diagnosing & Treating in the United States?
Percentage of Population Employed in Health Diagnosing & Treating in the United States is 6.2%.